Article

Design of Flight Attitude Simulator for Plant Protection UAV Based on Simulation of Pesticide Tank Sloshing

College of Mechanical and Electronic Engineering, Northwest A&F University, Yangling 712100, China
*
Author to whom correspondence should be addressed.
Agronomy 2025, 15(4), 822; https://doi.org/10.3390/agronomy15040822
Submission received: 24 February 2025 / Revised: 25 March 2025 / Accepted: 25 March 2025 / Published: 26 March 2025
(This article belongs to the Section Precision and Digital Agriculture)

Abstract

:
Changes in the flight attitude of plant protection unmanned aerial vehicles (UAVs) can lead to oscillations in the liquid level of their medicine tanks, which may affect operational accuracy and stability, and could even pose a threat to flight safety. To address this issue, this article presents the design of a flight attitude simulator for crop protection UAVs, constructed on a six-degree-of-freedom motion platform. This simulator can replicate the various flight attitudes, such as emergency stops, turns, and point rotations, of plant protection UAVs. This article initially outlines the determination and design process for the structural parameters and 3D model of the flight attitude simulator specific to plant protection UAVs. Subsequently, simulations were performed to analyze liquid sloshing in the pesticide tank under various liquid flushing ratios during flight conditions, including emergency stops, climbs, and circling maneuvers. Finally, the influence of liquid sloshing on the flight stability of the plant protection UAVs in different attitudes and with varying liquid flushing ratios is presented. These results serve as a cornerstone for optimizing the flight parameters of plant protection UAVs, analyzing the characteristics of pesticide application, and designing effective pesticide containers.

1. Introduction

Pesticide application by drone represents an innovative approach in plant protection machinery, offering several significant advantages. Firstly, drones exhibit a strong adaptability to various working environments, allowing for precise on-demand spraying based on the distribution of pests and diseases [1,2]. Secondly, the downwash airflow generated during drone flight enhances the targeted delivery of pesticides, ensuring effective deposition within the crop canopy [3,4,5,6]. Additionally, ultra-low volume spray technology can significantly reduce the amount of pesticide applied [7,8], improving the utilization rate of these chemicals while minimizing pesticide residues and non-point source pollution in agricultural areas. However, when the filling ratio of the medicine tank drops below a certain level, changes in the drone’s flight attitude can cause sharp oscillations in the liquid level [9]. These can affect the drone’s flight stability, and the effectiveness and accuracy of its spraying, potentially endangering the drone’s safety [10,11]. Liquid sloshing has emerged as a critical factor limiting the expansion of fuel tank capacity in agricultural drones. However, existing studies still exhibit significant gaps in analyzing the sloshing mechanisms within drone fuel tanks. Most research relies on theoretical derivations or idealized sinusoidal waveforms, failing to adequately simulate the dynamic characteristics of agricultural drones under actual flight postures. Furthermore, there remains a lack of sloshing excitation signal models that closely resemble real-world flight conditions. Therefore, studying the relationship between the drone’s flight attitude and the interference caused by liquid-level fluctuations in the medicine tanks is essential for understanding the flight stability of unmanned aerial vehicles (UAVs) being used for plant protection [12,13,14].
Currently, research on liquid sloshing primarily focuses on largescale aerospace and marine vessels, utilizing experimental studies and numerical simulations. Zhang [15,16] investigated the liquid sloshing phenomenon in wedge-shaped liquid natural gas (LNG) carriers. To address this challenge, they applied the boundary element method (BEM) to analyze the sloshing dynamics induced by multi-directional excitations, including sway, roll, impact, and pitch motions. Li et al. [17] used the computational fluid dynamics (CFD) software Fluent to establish a numerical simulation model that addressed the instability issues caused by liquid sloshing in agricultural drones. Qiu et al. [18] systematically investigated the hydrodynamic characteristics of liquid sloshing dynamics in cryogenic fuel tanks through numerical simulations. Their findings revealed a nonlinear interaction between the free liquid surface and excitation frequency, which underscores the critical importance of quantifying sloshing behavior for spacecraft propulsion system design. The application of numerical simulation methods in liquid sloshing dynamics analysis is continually being extended. The combination of the implicit volume of fluid (VOF) method and large eddy simulation (LES) has significantly improved the accuracy of free surface tracking. However, existing studies predominantly focus on single motion postures or simplified working conditions, lacking the systematic simulation of liquid sloshing under multi-degree-of-freedom (multi-DOF) composite motions of plant protection drones. Furthermore, research on the collaborative optimization between the six-degree-of-freedom flight simulator design and the dynamic response of the liquid tank remains scarce.
To address these issues, this article presents the design of a flight attitude simulator for plant protection UAVs, based on a six-degree-of-freedom motion platform. This simulator can be used to simulate real-time flight parameters—such as attitude, velocity, and acceleration—in complex operating environments. Additionally, it models the oscillation interference and liquid-level fluctuations that occur due to changes in the pesticide tank’s liquid level during flight. The analysis focuses on how these liquid-level fluctuations impact the flight stability of crop protection drones. The findings from this research can be used to optimize the flight parameters of plant protection UAVs, analyze their spraying characteristics, and provide guidelines for the effective structural design of plant protection UAVs and their pesticide tanks.

2. Materials and Methods

2.1. Parametric Analysis of Flight Attitude Simulator for Plant Protection UAV

Currently, electrical plant protection UAVs are gaining immense popularity due to their application as multi-rotor crop protection drones. These drones dominate the market due to their cost-effectiveness and ease of operation. This article focuses on the DJI T30 multi-rotor crop protection UAV as the research object, which has a maximum payload capacity of 40 kg and can carry a pesticide tank weighing up to 30 kg (±5%). The dimensions of the pesticide tank are 560 mm × 435 mm × 320 mm. The flight behavior of plant protection UAVs primarily includes takeoff, emergency stop, landing, simulated ground flight, and point rotation (fruit tree mode). Among these, the three postures of takeoff, emergency stop, and landing essentially correspond to lateral movement in the X direction, longitudinal movement in the Y direction, and vertical movement in the Z direction. The point rotation mode involves applying centripetal acceleration to the pesticide tank, while simulated ground flight results from the horizontal acceleration and pitch motion. Therefore, the designed flight simulator for the drone must simulate a composite motion environment with six degrees of freedom: lateral, longitudinal, elevation, pitch, roll, and yaw. It should also be able to accelerate and decelerate according to specified parameters across all six degrees of freedom while enabling any combination of composite motion. The maximum pitch and roll angles for the DJI T30 crop protection drone are 15°, with a maximum flight speed of 10 m/s. An emergency stop is required within 2 s. When the drone is flying in a circular path, it creates centripetal acceleration for the pesticide tank. The standard operating speed for this circular motion is 4 m/s, with a typical radius of 3 m; thus, the centripetal acceleration is calculated to be (16/3) m/s2, with the maximum centripetal acceleration set at 6 m/s2 (DJI Agriculture https://ag.dji.com/cn).
The performance parameters for the flight attitude simulator of the plant protection UAV are shown in Table 1. Based on this data, an analysis and design of the structural parameters, static parameters, and kinematic parameters of the flight attitude simulator will be conducted, utilizing a six-degree-of-freedom motion platform.
Based on the load, size, flight attitude, and other design requirements for the plant protection UAV flight attitude simulator, a six-degree-of-freedom platform is designed [19,20,21]. Initially, the basic parameters of this platform are established. The upper platform serves as a dynamic platform and is equipped with a pesticide box for the plant protection UAV. The diameter of the upper platform is 600 mm, while the diameter of the lower platform is 780 mm. The initial height of the upper platform, prior to lifting, is set at 600 mm (center-to-center distance). Both the dynamic and static platforms utilize distribution angles of 50° and 70° [22]. When installing the electric cylinder, the short side of the upper platform is aligned with the long side of the lower platform. The specific dimensions and hinge points of the upper and lower platforms are shown in Figure 1.

2.2. Design and Simulation Analysis of Flight Attitude Simulator for Plant Protection UAV

2.2.1. Structural Design of Flight Attitude Simulator for Plant Protection UAV

By utilizing the structural parameters of the plant protection UAV simulator previously mentioned, a three-dimensional model of a six-degree-of-freedom plant protection flight attitude simulator for the UAV was created using SolidWorks 2020 software (Dassault Systèmes Co., Paris, France) on the computer with device name DESKTOP-0G0OBA5, equipped with dual® Xeon® Silver 4215R CPU @ 3.20 GHz base frequency (3.19 GHz nominal operating frequency), as illustrated in Figure 2. To ensure proper simulation functionality, the model simplifies and omits the internal ball screw structure of the electric cylinder, retaining only the external shape (cylinder liner) and the piston rod. During assembly, the cylinder liner and piston rod are configured as threaded connections to accurately replicate the actual motion process. The actual electric cylinder is also equipped with relative displacement sensors, force sensors, and inertial sensors, both internally and externally. Furthermore, the structural interference at the extreme pose (maximum offset ± 15°) of the designed crop protection UAV simulator was assessed, as shown in Figure 2. The analysis indicates that there was no interference, confirming that the structural parameters of the designed 3D model meet the requirements.
The axisymmetric structure of the pesticide tank exhibits high compatibility with the dynamic characteristics of the six-degree-of-freedom (6-DOF) motion platform. From an inertial mechanics perspective, its rotational symmetry results in a diagonalized inertia tensor, which significantly reduces coupling-induced control errors compared to cubic structures. In terms of fluid dynamics, the drag coefficient ( C d ) of cylindrical tanks ranges from 0.4 to 0.5, whereas cubic configurations demonstrate higher values of 0.8 to 1.05, indicating that the cylindrical design reduces aerodynamic resistance by 38–52%. Consequently, the pesticide tank is designed as shown in Component 1 of Figure 2.
Due to the significant load capacity of the designed plant protection UAV simulator, it is crucial to prevent untoward incidents that may arise from stress concentration during its lifting and turning movements. Therefore, the load-bearing performance of the upper and lower platforms was analyzed initially. The materials selected for these platforms are 1023 carbon steel plates, which have a density of 7858 kg/m3, an elastic modulus of 204,999 MPa, and a Poisson’s ratio of 0.29. Stress analysis of the upper and lower platform mechanisms was conducted using ANSYS Workbench 2022 R1 software (ANSYS Co., Pittsburgh, PA, USA). This analysis primarily focuses on the stress conditions of the platform steel plates. A linear static analysis is performed to assess whether the platforms are safe and reliable during movement under various operating conditions as they may experience tensile or compressive states. In the analysis, a 40 kg load was applied, and the model divided into grids. Grid control is used to select the analysis surface, set the grid density, and examine the stress and strain of the upper and lower platforms as well as the hinge points separately. The results indicate that the bearing capacity of the platform satisfies the design requirements.

2.2.2. Kinematic Analysis of Flight Attitude Simulator for Plant Protection UAV

The flight attitude simulator for crop protection UAVs always maintains a horizontal position, although there will be changes in pose on the upper platform. Figure 3 illustrates the definition diagram of the system’s coordinate, where the upper platform is the moving platform and the lower platform is stationary. In this context, the center of mass of the pesticide tank has been assumed as particle A ( x , y , z ) . The line connecting point A to the origin O of the upper platform’s coordinate system represents a vector ( r A ). The angular velocity of point A matches the angular velocity ω at point O as it rotates within the coordinate system. This angular velocity comprises three components: pitch angular velocity (p), roll angular velocity (q), and yaw angular velocity (r).
r A = i x + j y + k z
ω = i p + j q + k r
If the linear velocity at the origin O of the platform is v , then the absolute linear velocity of point A v A can be expressed as follows:
v A = v 0 + ω × r A
The absolute acceleration at point A is as follows:
a = d v A d t = d v 0 d t + d ω d t × r A + d r A d t × ω
Since the modulus of point A relative to point O remains constant and only varies in direction, d r A d t represents the linear velocity vector v 1 = ω × r A generated by the rotation of point A, that is the following:
a = a 0 + d ω d t × r A + ω × ( ω × r A )
The acceleration a of the center of mass A of the pesticide tank in the upper platform coordinate system can be obtained using Equations (1)–(5). The linear acceleration a at the center of mass of the pesticide tank is subsequently transformed into the fixed coordinate system of the lower platform. Let Ω = ( α , β , γ ) be the Euler angle between the coordinate systems of the upper and lower platforms.
a B = T · a
where T = cos β cos γ cos α sin γ + sin α sin β cos γ sin α sin γ + cos α sin β cos γ sin β cos γ cos α cos γ + sin α sin β sin γ sin α cos γ + cos α sin β sin γ sin β sin α cos β cos α cos β ; a B is the linear acceleration of the center of mass of the pesticide tank in the fixed coordinate system of the lower platform.
The relationship between the velocity of each hinge point V D i on the upper platform and the platform velocity X ˙ = ( α ˙ , β ˙ , γ ˙ , x ˙ , y ˙ , z ˙ ) T is as follows:
V D i = J 1 X ˙
where J 1 = T z T y S i T x A 1 T z S j T y T x A 1 S k T z T y T x A 1 I 3 T z T y S i T x A 2 T z S j T y T x A 2 S k T z T y T x A 2 I 3 T z T y S i T x A 3 T z S j T y T x A 3 S k T z T y T x A 3 I 3 T z T y S i T x A 4 T z S j T y T x A 4 S k T z T y T x A 4 I 3 T z T y S i T x A 5 T z S j T y T x A 5 S k T z T y T x A 5 I 3 T z T y S i T x A 6 T z S j T y T x A 6 S k T z T y T x A 6 I 3 18 × 6 ,
T x , T y , T z represent the rotation coordinate transformation matrices around the X, Y, and Z axes, respectively, and T = T x T y T z .
T x = 1 0 0 0 cos α sin α 0 sin α cos α ,
T y = cos β 0 sin β 0 1 0 sin β 0 cos β ,
T z = cos γ sin γ 0 sin γ cos γ 0 0 0 1 ,
S i ,   S j , S k are antisymmetric matrices, that are as follows:
S i = 0 0 0 0 0 1 0 1 0 ,
S j = 0 0 1 0 0 0 1 0 0
S k = 0 1 0 1 0 0 0 0 0 .
The relationship between the expansion and contraction speed L ˙ i of each electric cylinder and the corresponding upper platform hinge point speed V D i is the following:
L ˙ i = L i L i V D i = e i T V D i
where e i T = L i L i = L i l i .
Based on the analysis results of the platform’s motion theory and parameters, the kinematic inverse equation and a Simulink module in MATLAB R2023b software (MathWorks Inc., Natick, MA, USA) were utilized to model and simulate the extension and contraction of the piston rod in the electric cylinder. According to the motion parameters of the crop protection drone incorporated in the flight attitude simulator, as detailed in Table 1, the platform must rotate ±15° around the X-, Y-, and Z-axes. This translates into the minimum pitch angle of the platform as 15°. The motion signal of the upper platform is defined as a cosine signal. The expansion and contraction curves of the six electric cylinders, derived from the Simulink inverse solution, are illustrated in Figure 4. As shown in the figure, the maximum extension of the piston rod of the electric cylinder is 111 mm, while the maximum contraction is −113 mm. Based on the selection manual for electric cylinders, it is determined that an electric cylinder with a stroke of 300 mm would be a viable choice.

2.2.3. Dynamics Analysis of Flight Attitude Simulator for Plant Protection UAV

The forward solution of the upper platform motion was calculated in the ADAMS 2022.4 dynamic simulation software (MSC Software Inc., Los Angeles, CA, USA). The six electric cylinders of the six-degree-of-freedom motion platform were driven to expand and contract using the driving function AKISPL to obtain the platform’s dynamic position. The driving curves of the electric cylinders are exhibited in Figure 5.
In this analysis, the forces acting on the electric cylinder and the hinge points of both the upper and lower platforms will be examined. The upper platform is connected to the electric cylinder through a fixed single ear and a movable double ear. The lower platform is linked to the hydraulic cylinder via bearings and support ears, and it is also anchored to the ground with a fixed pair. A uniformly distributed load of 500 N is applied to the upper platform, and the effects of the gravitational field are taken into account. The force curves for the electric cylinder are displayed in Figure 6, while the force curves for the hinge point between the upper and lower platforms can be found in Figure 7.
The force curves for each electric cylinder shown in Figure 6 reveal the following maximum instantaneous impact loads: cylinder 1: 277.53 N; cylinder 2: 382.25 N; cylinder 3: 285.40 N; cylinder 4: 375.63 N; cylinder 5: 506.48 N; cylinder 6: 253.55 N. To ensure the normal operation of the platform, the electric cylinders must be able to withstand at least 800 N of dynamic load.
A simulation analysis was performed to examine the force distribution of the hinges on the upper and lower platforms, as depicted in Figure 7. The results indicated that the maximum force experienced by the hinge between cylinder 5 and the upper platform during motion was 501.75 N. Meanwhile, the hinge located between cylinder 4 and the lower platform encountered the highest force during movement, measuring 377.75 N. When designing the hinge structure and selecting materials, it is essential to ensure that the stress is limited to one-third of the allowable stress. Thus, the structural design and dynamic simulation analysis of the UAV flight attitude simulator presented in this article have been successfully executed.

2.3. Simulation Analysis of Pesticide Tank Sloshing Based on the Flight Attitude Simulator of Plant Protection UAV

The experimental process was conducted between May 2024 and October 2024. Based on the six-degree-of-freedom flight attitude simulator developed in the preceding section, various degree-of-freedom sloshing excitations are applied to the pesticide tank in three-dimensional space. This simulates the different attitudes of the plant protection UAV under complex operating conditions. During the UAV’s flight operation, as the medicine is sprayed, the filling ratio of the pesticide tank decreases linearly. When the filling ratio is low, the liquid level surges more noticeably. However, if the filling ratio drops too low, the insufficient liquid volume makes it challenging to generate effective sloshing forces. Therefore, three representative liquid-level positions with filling ratios of 0.3, 0.5, and 0.7 were selected for this study [23,24].
This article discusses the use of the Fluent module in ANSYS Workbench 2022 R1 software to simulate and analyze liquid surface movement [25]. The simulation employs the high-precision implicit volume of fluid (VOF) method to track the free liquid surface [26,27,28], with calculations based on a pressure solver. The standard k-epsilon turbulence model is utilized, and the implicit body force approach is selected. At a temperature of 20 °C, the surface tension coefficient of water is 0.072 N/m, which is used in this work.
In examining the movement of medicine within the pesticide tank, air is designated as the first phase and the medicine as the second phase. The pressure–velocity coupling method employs the pressure-implicit with splitting of operators (PISO) algorithm. During the numerical calculations, the pressure term is discretized using the body force weighted scheme, the momentum equation is discretized with the second order upwind scheme, the turbulent kinetic energy is discretized using the first order upwind formula, and transient calculations are performed using the first order implicit scheme. The air domain is set to standard atmospheric pressure.

3. Results

3.1. Simulation Results of Pesticide Tank Sloshing Under Emergency Stop Posture of Plant Protection UAV

When the crop protection drone is in an emergency stop state, it experiences a horizontal acceleration in the opposite direction to the original motion of the pesticide tank. To simulate the drone’s flight attitude during an emergency stop, a horizontal acceleration of 5 m/s
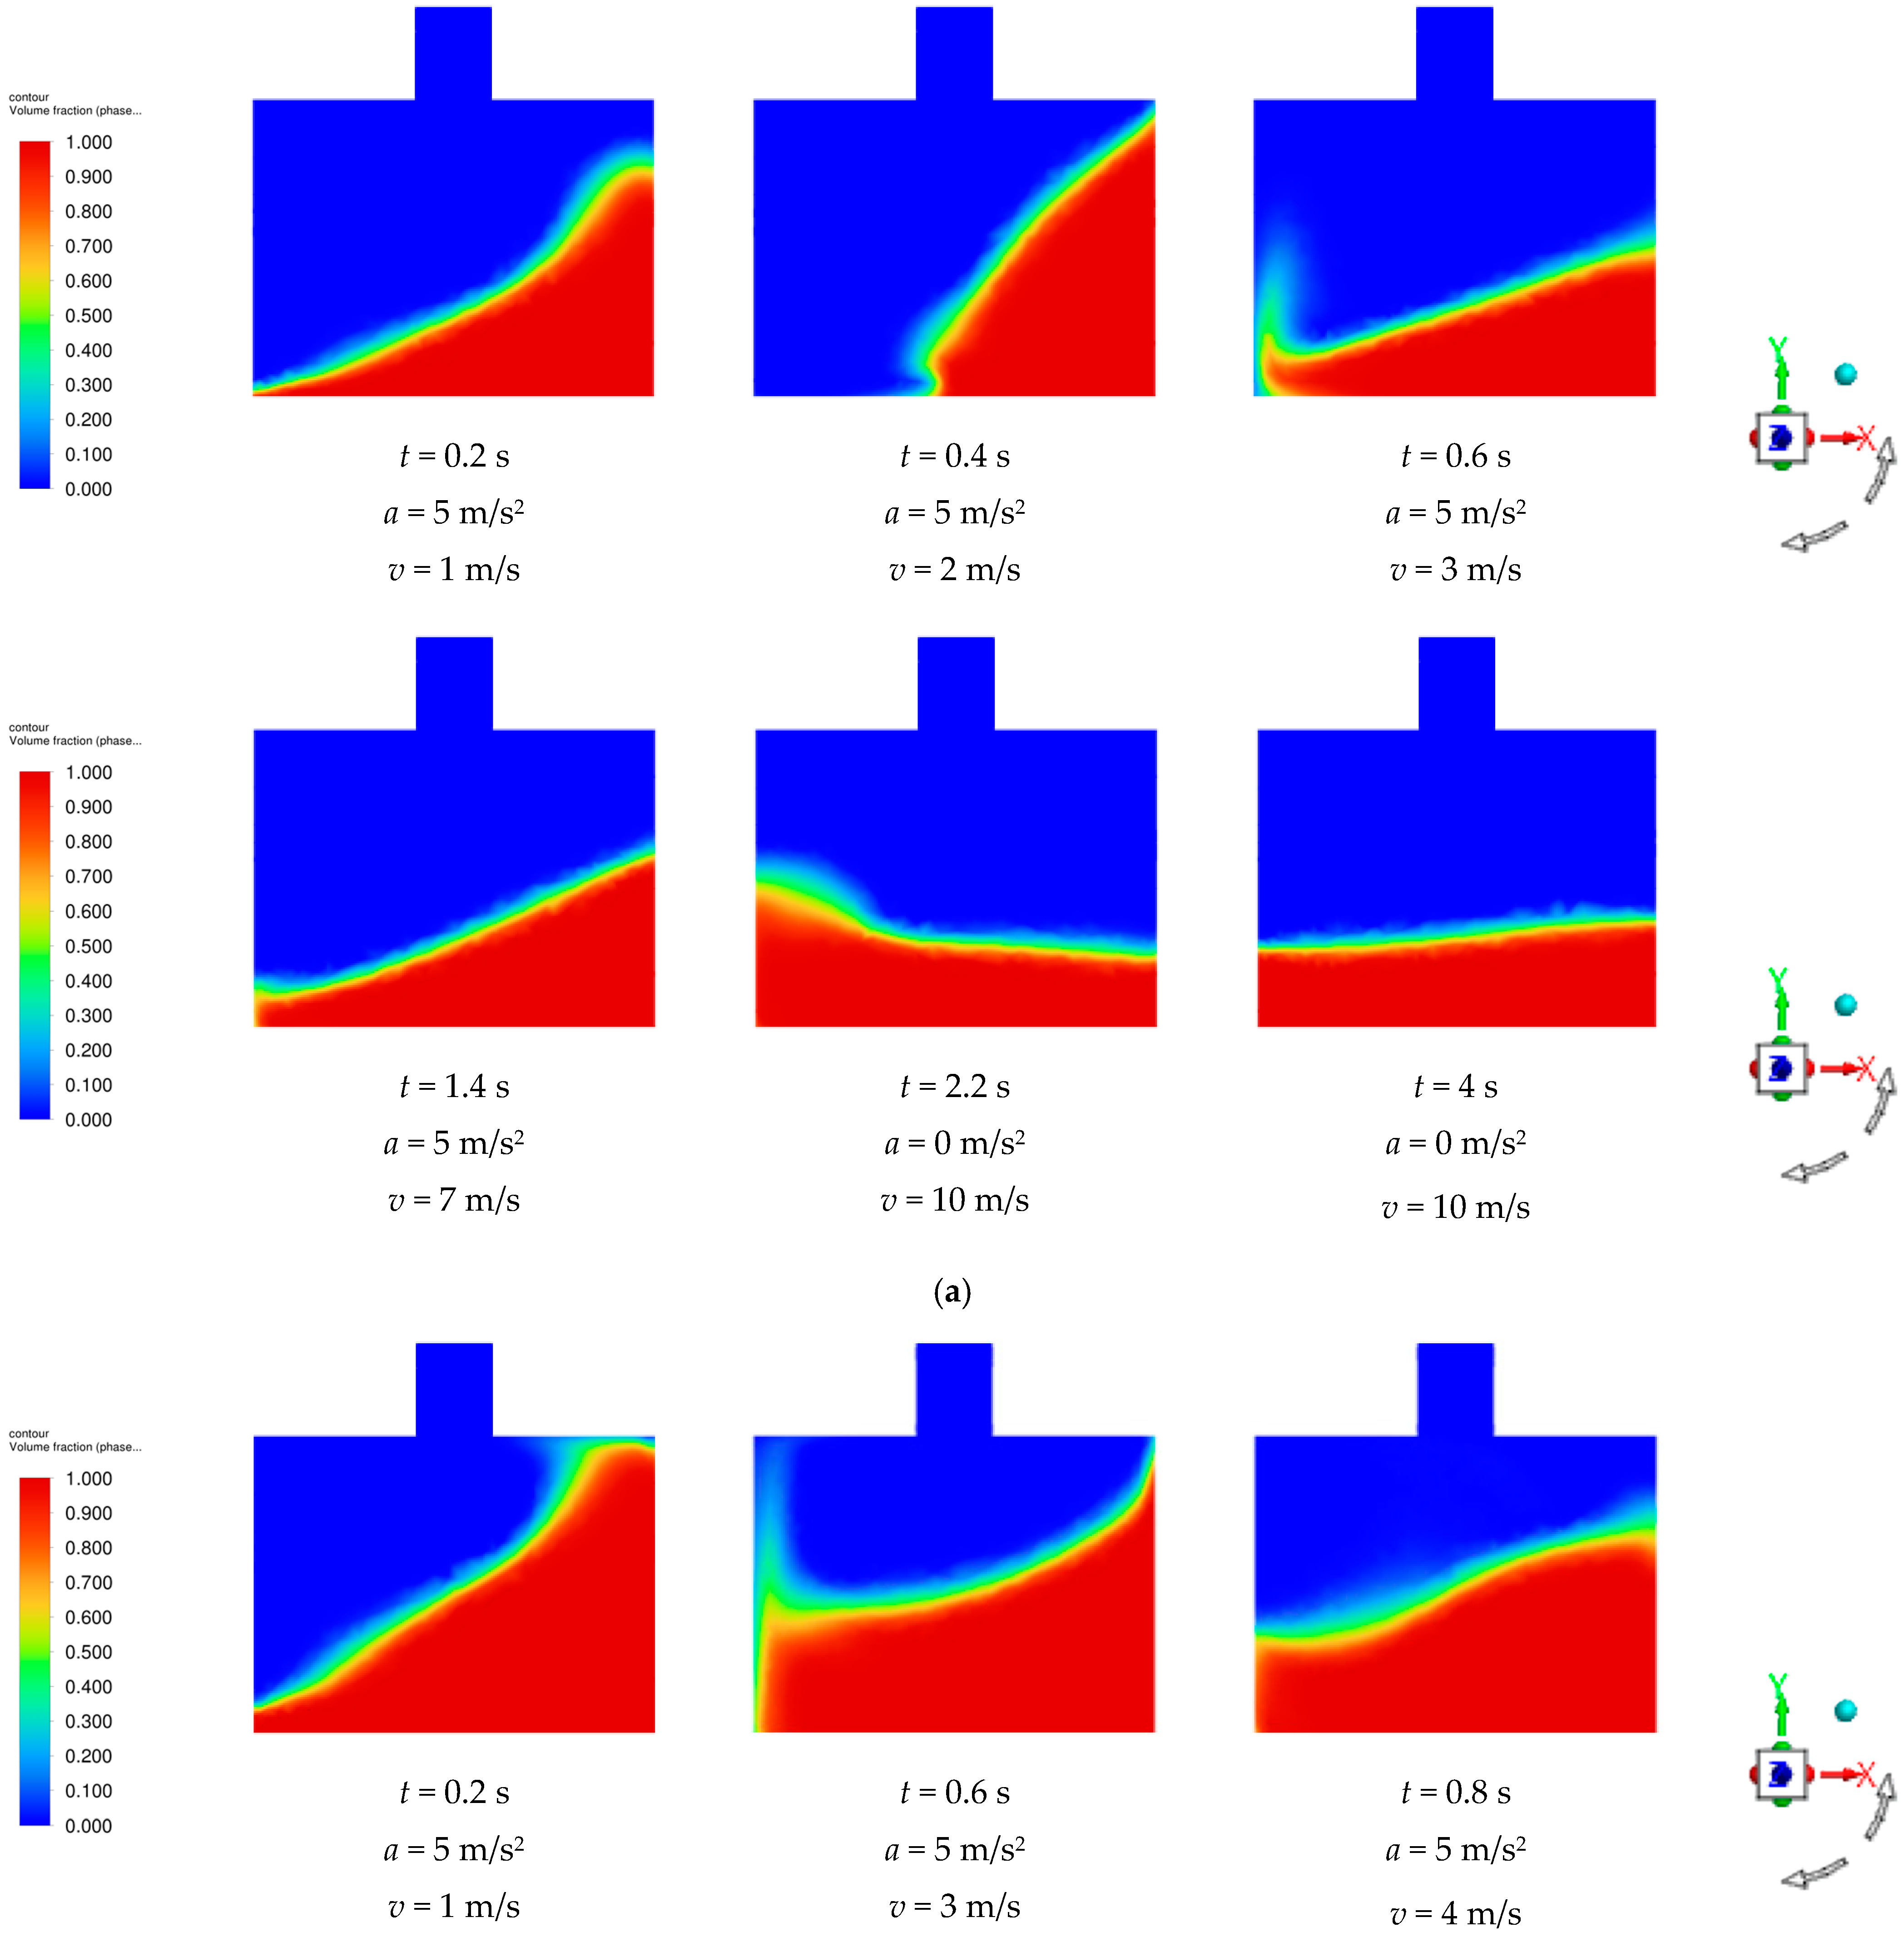
2 was applied for a duration of 2 s to the pesticide tank. A user-defined function (UDF) incorporated this acceleration excitation into the calculation domain. The numerical simulation results, represented in cloud maps for filling ratios of 0.3, 0.5, and 0.7 in the pesticide tank, are shown in Figure 8. As illustrated, during the application of acceleration, the pesticide tank began to decelerate. The inertial force caused the medicine to move in the opposite direction of the acceleration relative to the pesticide tank, resulting in a tilt of the liquid level. The amplitude of this tilt varied continuously over time. Additionally, the impact of liquid droplets on the walls of the pesticide tank created a disturbance due to liquid droplet splashing. This disturbance drew a significant amount of air into the liquid, forming bubbles. Further agitation caused these bubbles to rise to the liquid surface and eventually rupture [29]. Once the pesticide tank came to rest, the acceleration ceased immediately. However, because of the inertia of the medicine and the constraints of the inner wall of the pesticide tank, the liquid began to move back and forth in a chaotic manner until the liquid level stabilized.
The cloud maps derived from the numerical simulation results are shown in Figure 8, depicting the pesticide tank at filling ratios of 0.3, 0.5, and 0.7. A comparison of these results showed that the overall relative motion of the medicine remained nearly the same across the different filling ratios. However, at a filling ratio of 0.7, a noticeable liquid spray was observed in the pesticide tank, leading to more intense liquid splashing and more significant formation and rupture of bubbles. This phenomenon suggested that as the filling ratio increased, the overall fluctuation in the medicine relative to the pesticide tank decreased. Simultaneously, after the termination of acceleration excitation, the pesticide tank with a higher filling ratio demonstrated a smaller range of liquid-level fluctuations and returned to a stable state more quickly.
Monitoring points were set up in this work to quantify the pressure changes on the inner wall of the pesticide tank [30]. Figure 8 indicated that in the emergency stop state, the right inner wall of the pesticide tank was significantly affected by the surge of the drug solution. Consequently, a monitoring point located at 60% of the liquid level on the right inner wall of the pesticide tank was selected for analyzing and calculating the data.
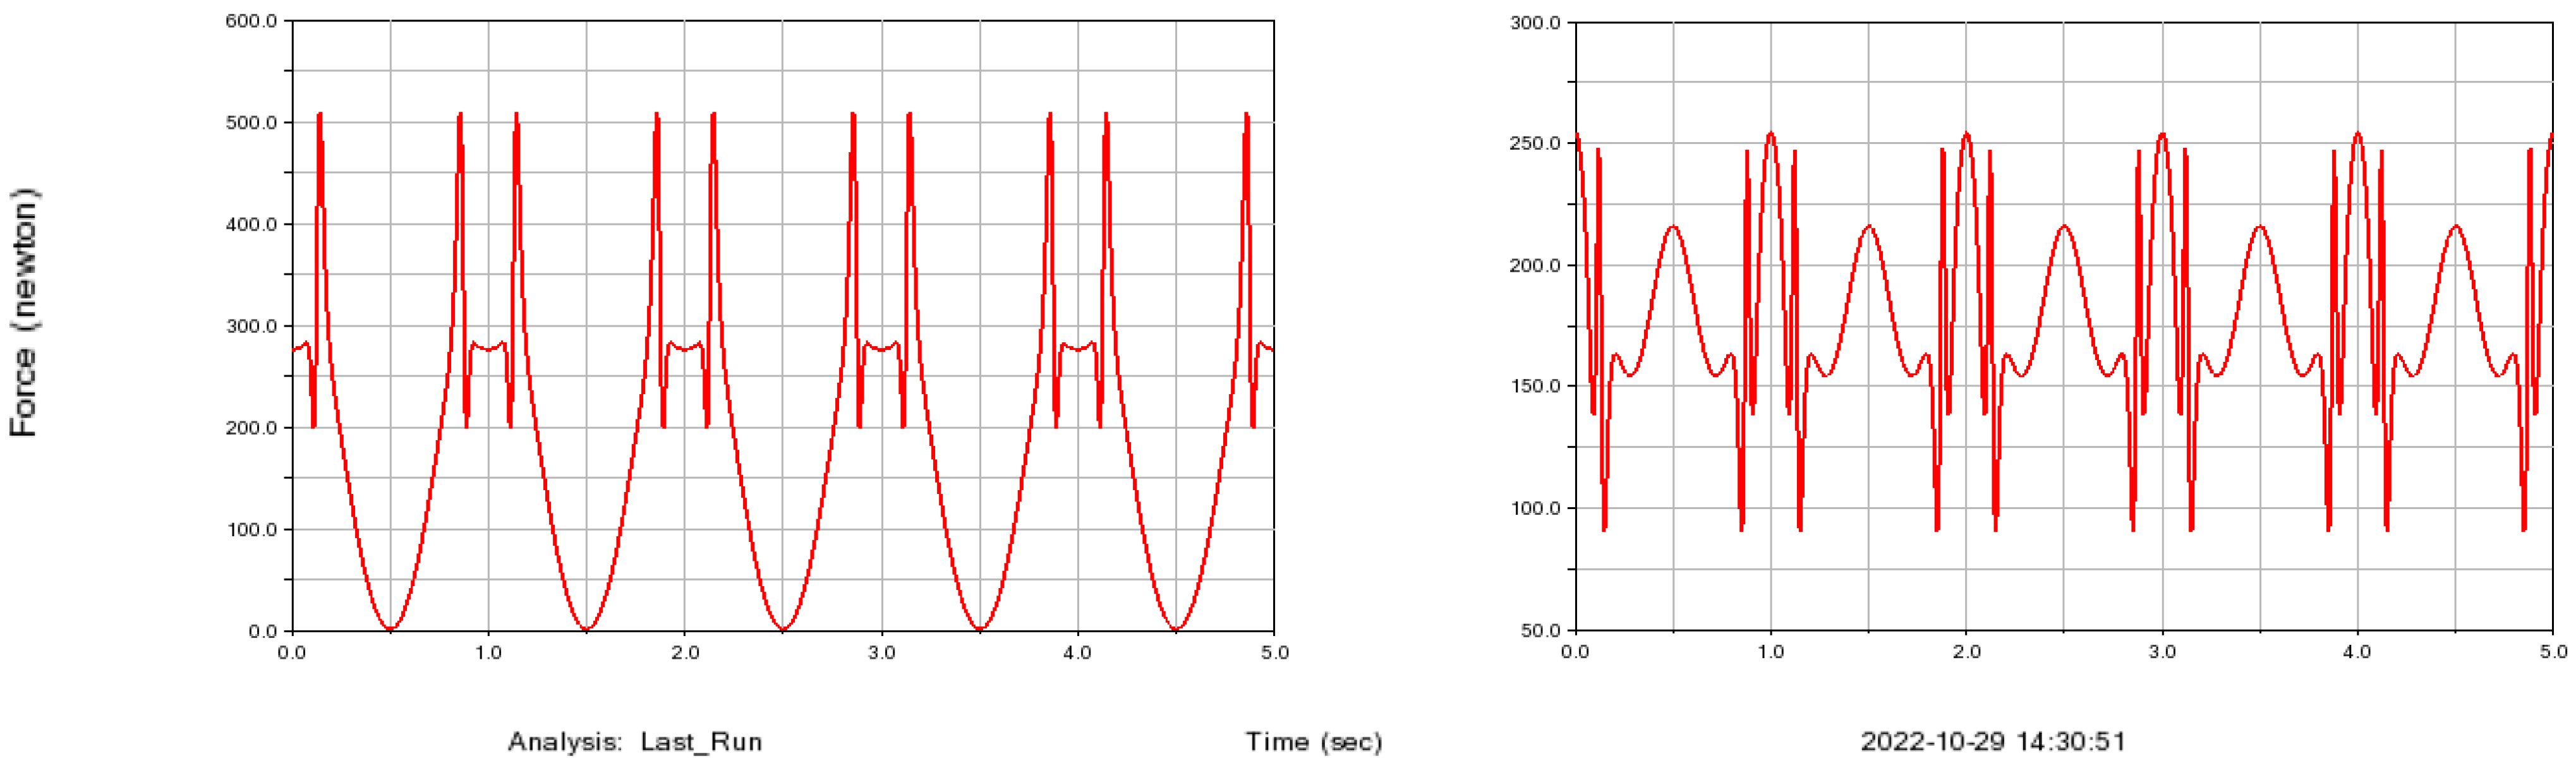
Figure 9 illustrates the pressure variation curve of the pesticide tank under emergency stop conditions for filling ratios of 0.3, 0.5, and 0.7. The pressure at the monitoring point quickly attained a maximum value in a short period before gradually decreasing in a wave-like pattern. Several extreme pressure values occurred within 8 s, with the peak pressure at different filling ratios appearing at the first extreme point. As the filling ratio increased, both the peak pressure at the monitoring point and the time taken to reach that peak increased. The time and pressure peaks at the monitoring points corresponding to filling ratios of 0.3, 0.5, and 0.7 were 1057.49 Pa at t = 0.21 s, 1177.05 Pa at t = 0.19 s, and 1362.08 Pa at t = 0.16 s, respectively. At 2 s, the horizontal movement of the box came to rest, causing it to stop moving across all filling ratios, which resulted in a sharp descent in the monitoring point pressure at that time. The wave-like shape of the pressure variation curve can be attributed to back-and-forth movement of the liquid relative to the pesticide tank under the influence of inertia. Eventually, the liquid level stabilized, causing the pressure on the inner wall to return to its initial static value.
From Figure 9, it is evident that while the three curves generally trend in the same direction, the pressure variation range during the deceleration process differed across filling ratios. Specifically, aside from the first pressure peak, the pressure variation range with a filling ratio of 0.7 was notably smaller when the filling ratios were 0.3 and 0.5. Numerical simulation cloud maps suggest that a higher liquid filling ratio resulted in an intense liquid splashing that generated numerous bursting bubbles, contributing to an increased first pressure peak. However, due to the confines of the pesticide tank and the effect of inertial force, the range of pressure fluctuations exhibited a downward trend after that initial peak was achieved. Once the acceleration excitation subsided, the liquid fluctuations for a filling ratio of 0.7 were less pronounced than those for filling ratios of 0.3 and 0.5. Based on the numerical simulation cloud maps in Figure 8, it can be inferred that within a certain range, a higher filling ratio corresponded to greater liquid volume and, consequently, an increased inertial force. After the pesticide tank came to a halt, the space constraints and inertial forces within the box significantly influenced the liquid fluctuations, leading to a scenario where the pressure fluctuation range became smaller with a higher filling ratio.
During the transportation of the pesticide tank, the liquid inside shakes due to acceleration, creating an overturning moment [31,32]. This can cause the plant protection UAV to lose its balance and potentially overturn. To address this, the variations in the sloshing moment of the liquid medicine were subsequently monitored. This enabled quantification of the effect of the liquid on the platform of the plant protection UAV flight attitude simulator during the sloshing process. In this analysis, the coordinate of (0,0,0) has been chosen as the center of the moment and the y-axis as the moment axis for calculation purposes.
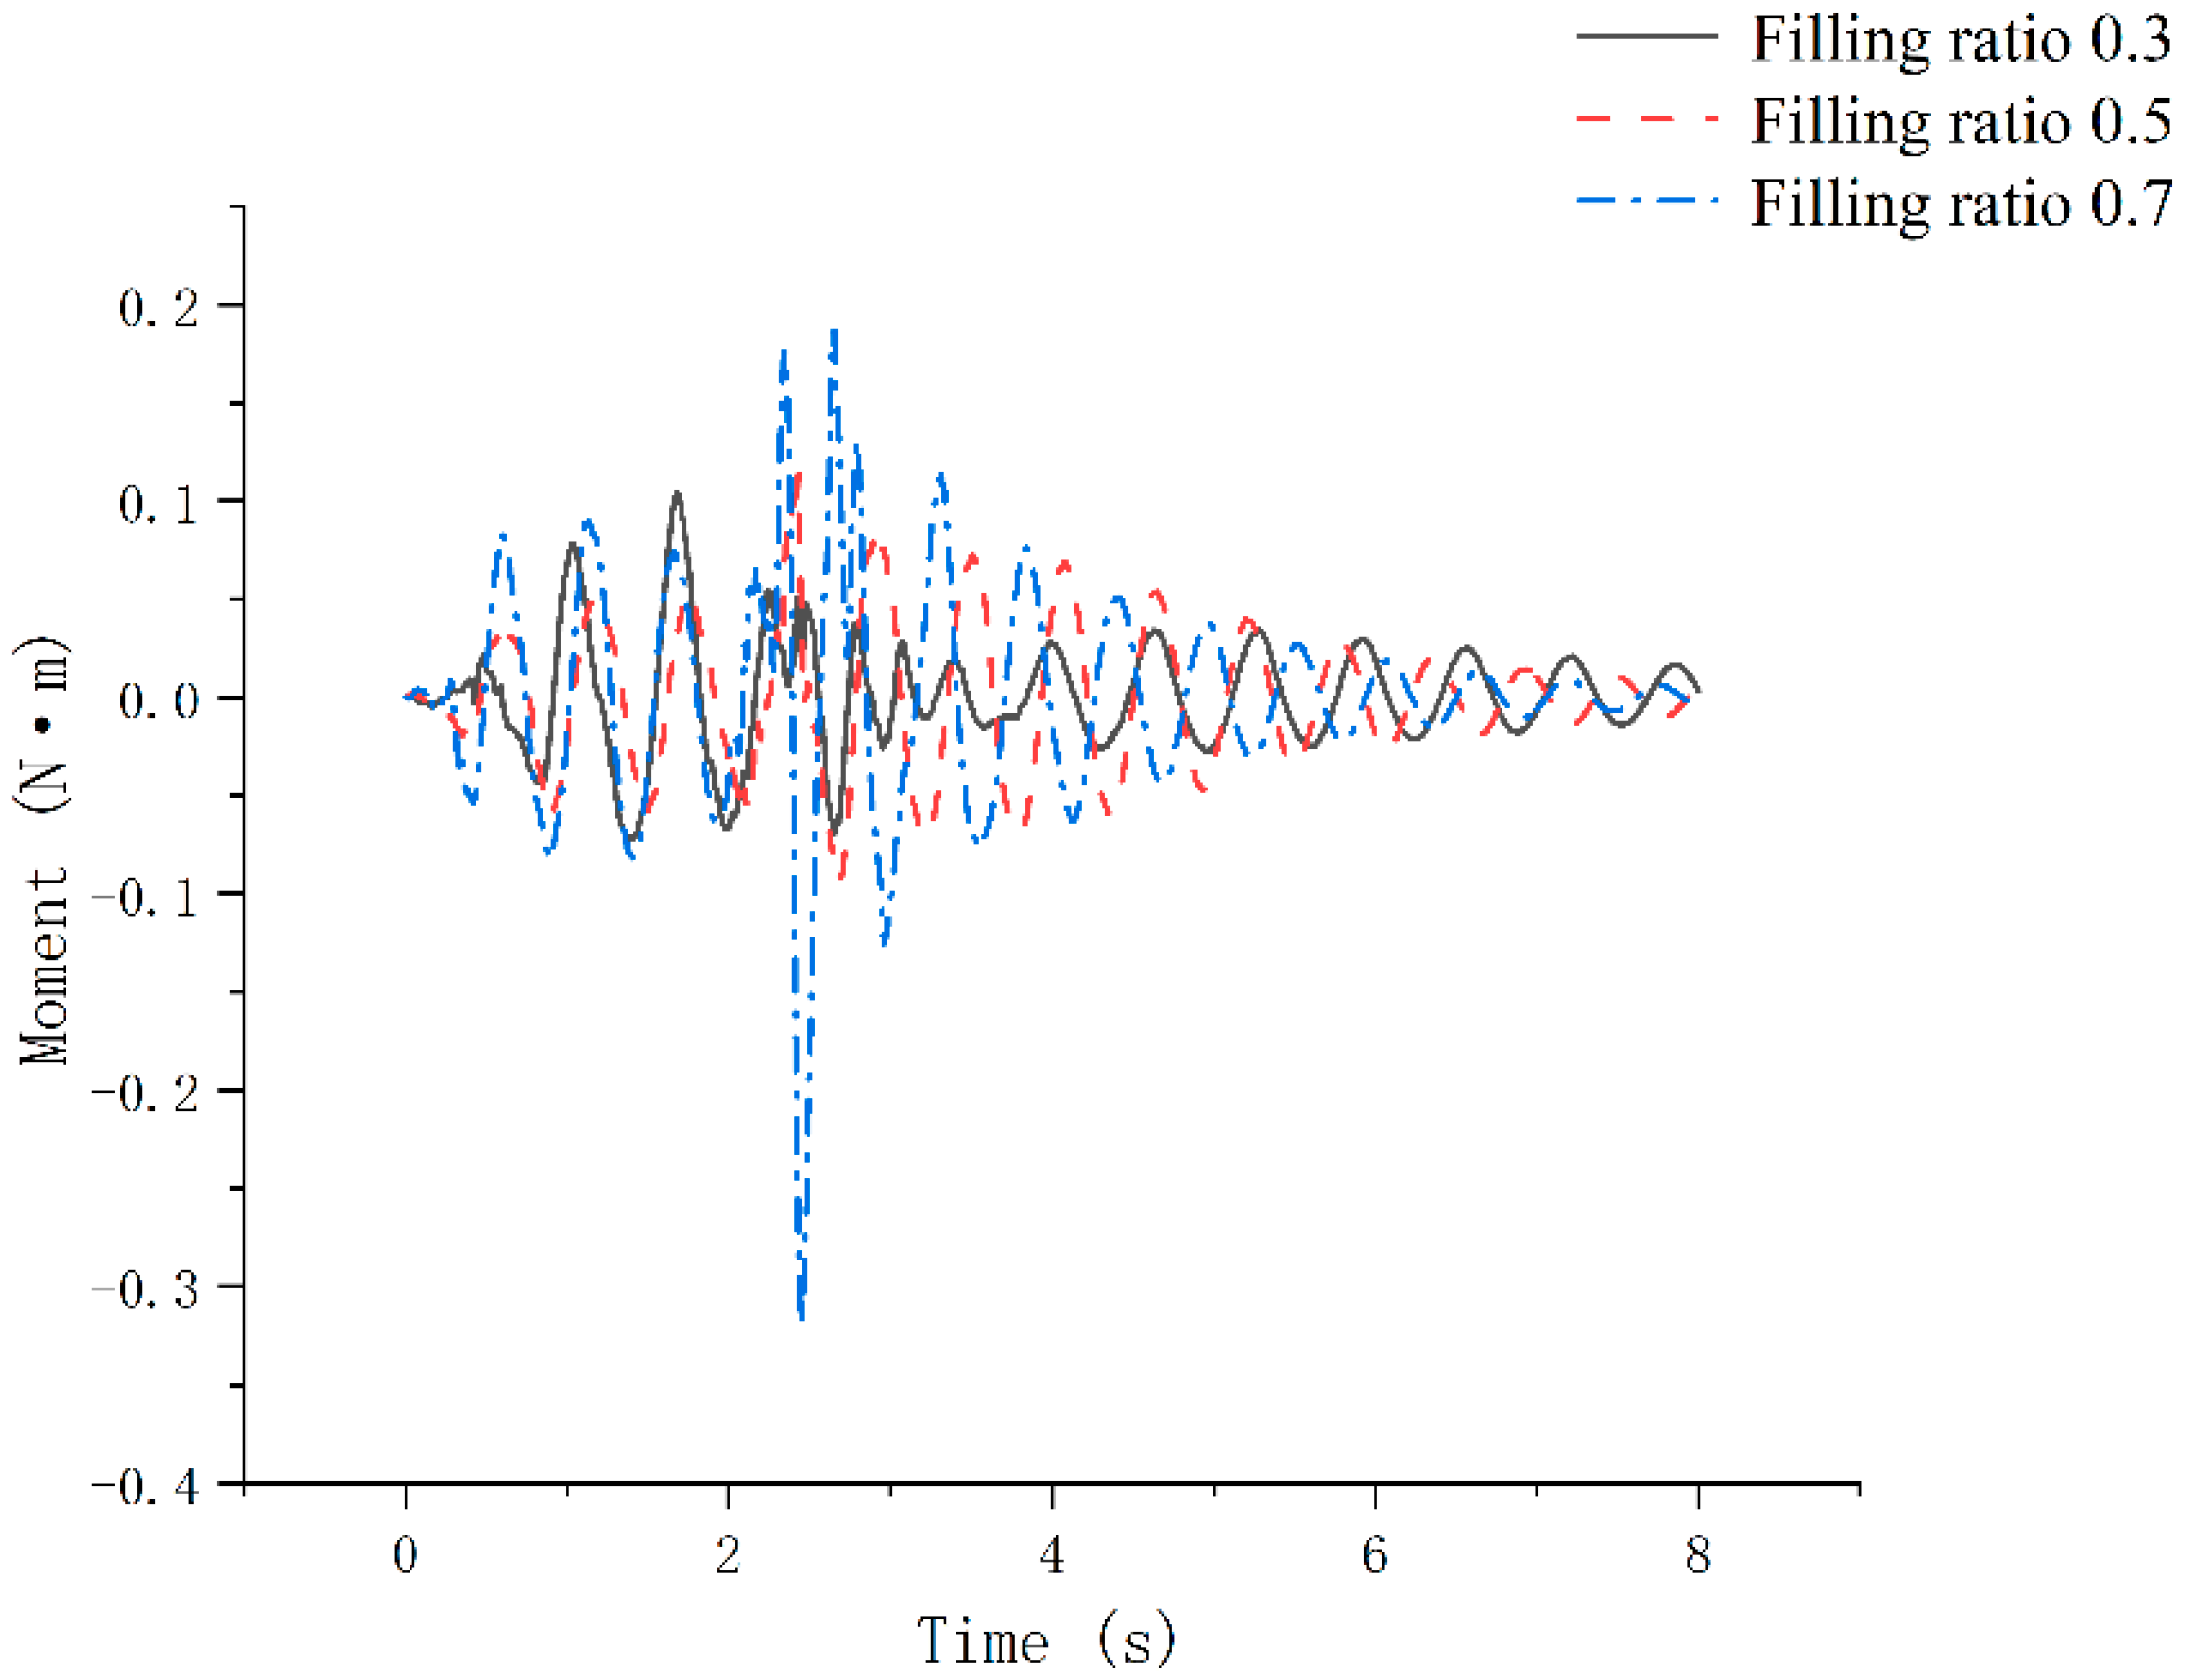
Figure 10 shows the variation curves of the sloshing torque in the pesticide tank at filling ratios of 0.3, 0.5, and 0.7. The sloshing torque of the medicine demonstrated a wave-like pattern, increasing until it reached a peak before decreasing again in a similar manner. The overturning effect on the upper platform first increased, and then diminished until it nearly became negligible. Additionally, within an 8 s timeframe, multiple extreme values of the sloshing torque were observed. The peak values for the sloshing torque of the medicine and times corresponding to the filling ratios of 0.3, 0.5, and 0.7 were measured as follows: 0.1041 N·m at t = 1.68 s, 0.1137 N·m at t = 2.43 s, and 0.3200 N·m at t = 2.45 s, respectively. As the filling ratio increased, the peak value of the liquid sloshing torque also arose, although a delay in the time taken to reach this peak was observed. Even after the acceleration ceased, the medicine in the pesticide tank continued to slosh under various filling ratios; thus, the sloshing torque remained active on the upper platform. However, in the absence of external excitation, the value of the sloshing torque fluctuated and gradually declined. Ultimately, the liquid level stabilized, and the sloshing torque approached zero, nearly eliminating the overturning effect on the upper platform.
The torque curves displayed in Figure 10 exhibited almost similar tendencies with time. When accelerating the box before the attainment of the peak sloshing torque of the liquid medicine, the range of variations in the sloshing torque for the pesticide tank with a filling ratio of 0.7 was found to be significantly larger than that for boxes with filling ratios of 0.3 and 0.5. Based on the numerical simulation cloud maps in Figure 8 and the pressure change curve in Figure 9, it can be inferred that at a filling ratio of 0.7, the liquid content was observed to be higher, and the geometric center of the liquid was farther from the center of the sloshing torque. This resulted in a larger force arm and mass of the liquid, thus generating greater sloshing force during the sloshing process. Higher filling ratios yielded greater sloshing torques in the liquid. Subsequently, the time required for the sloshing torque in the liquid medicine to approach zero was reduced, leading to a quicker reduction in the impact on the overturning of the upper platform.

3.2. Simulation Results of Pesticide Tank Sloshing Under the Climbing Posture of Plant Protection UAV

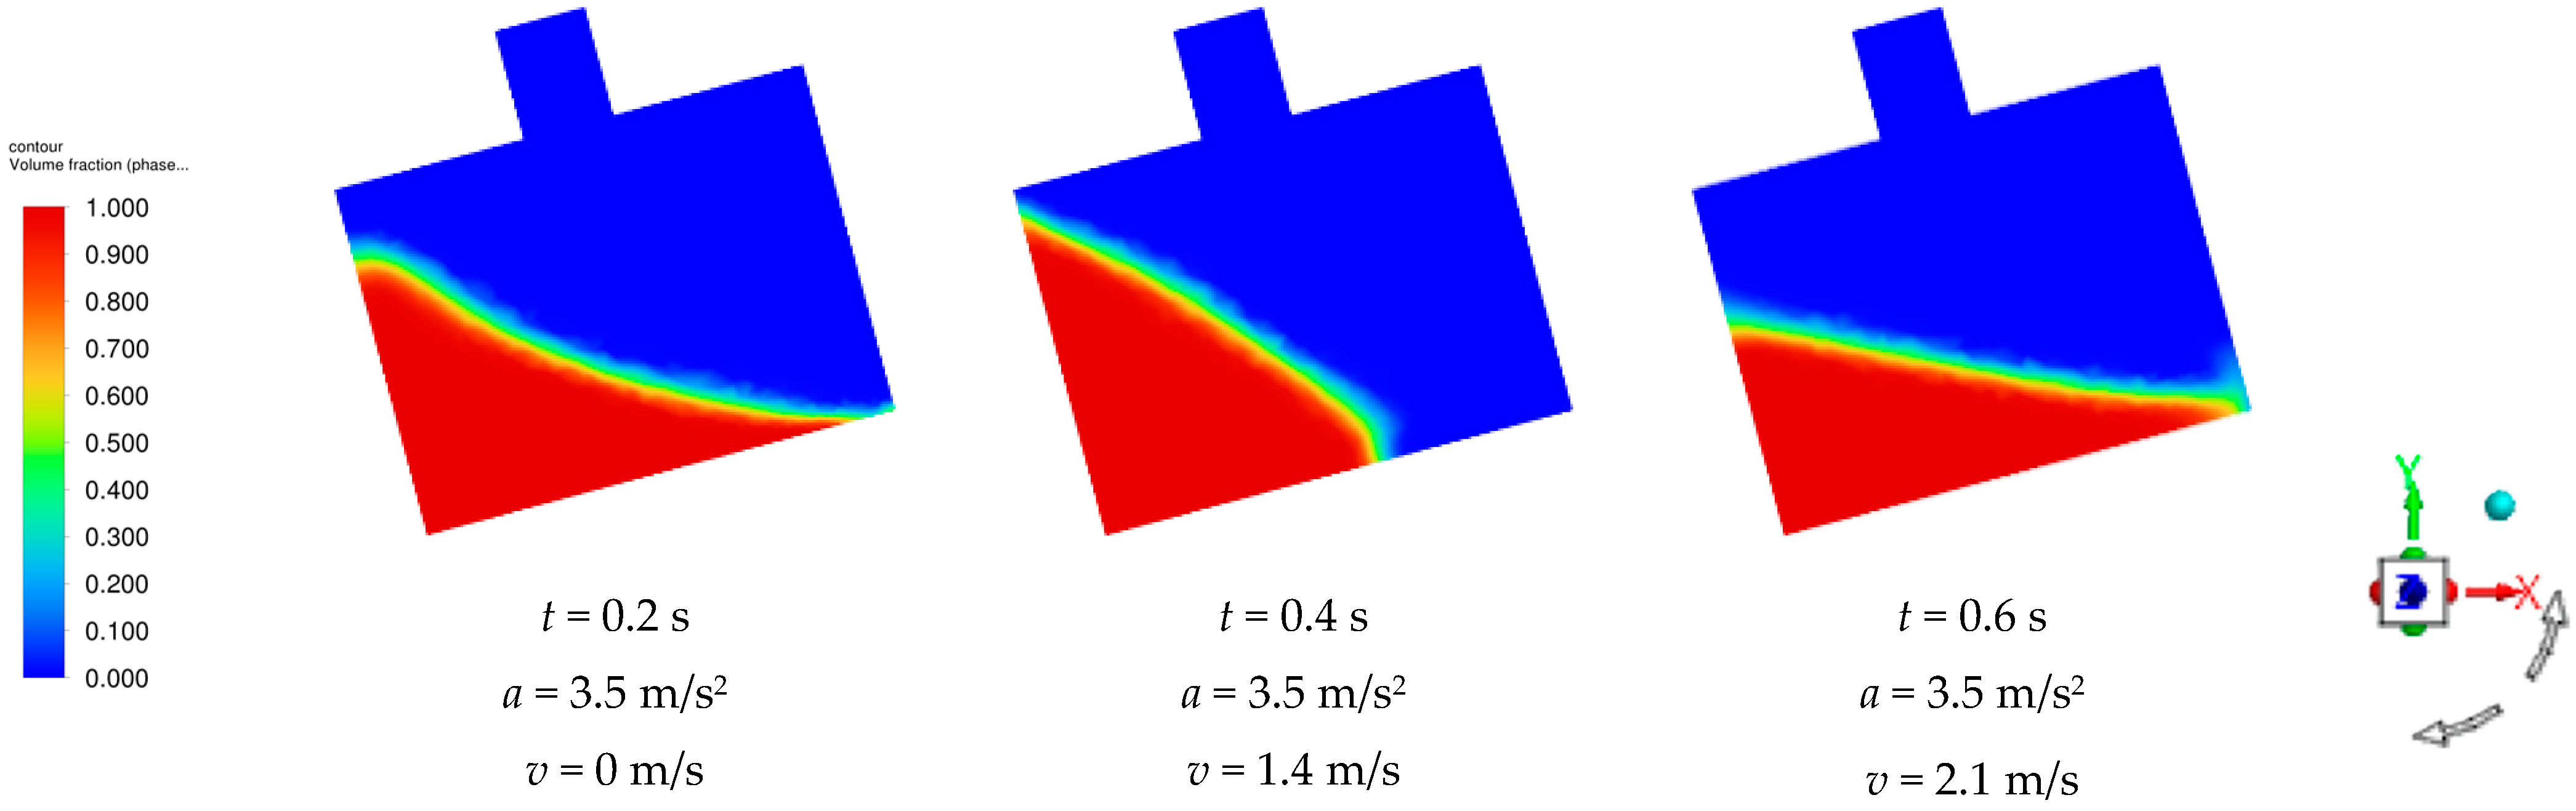
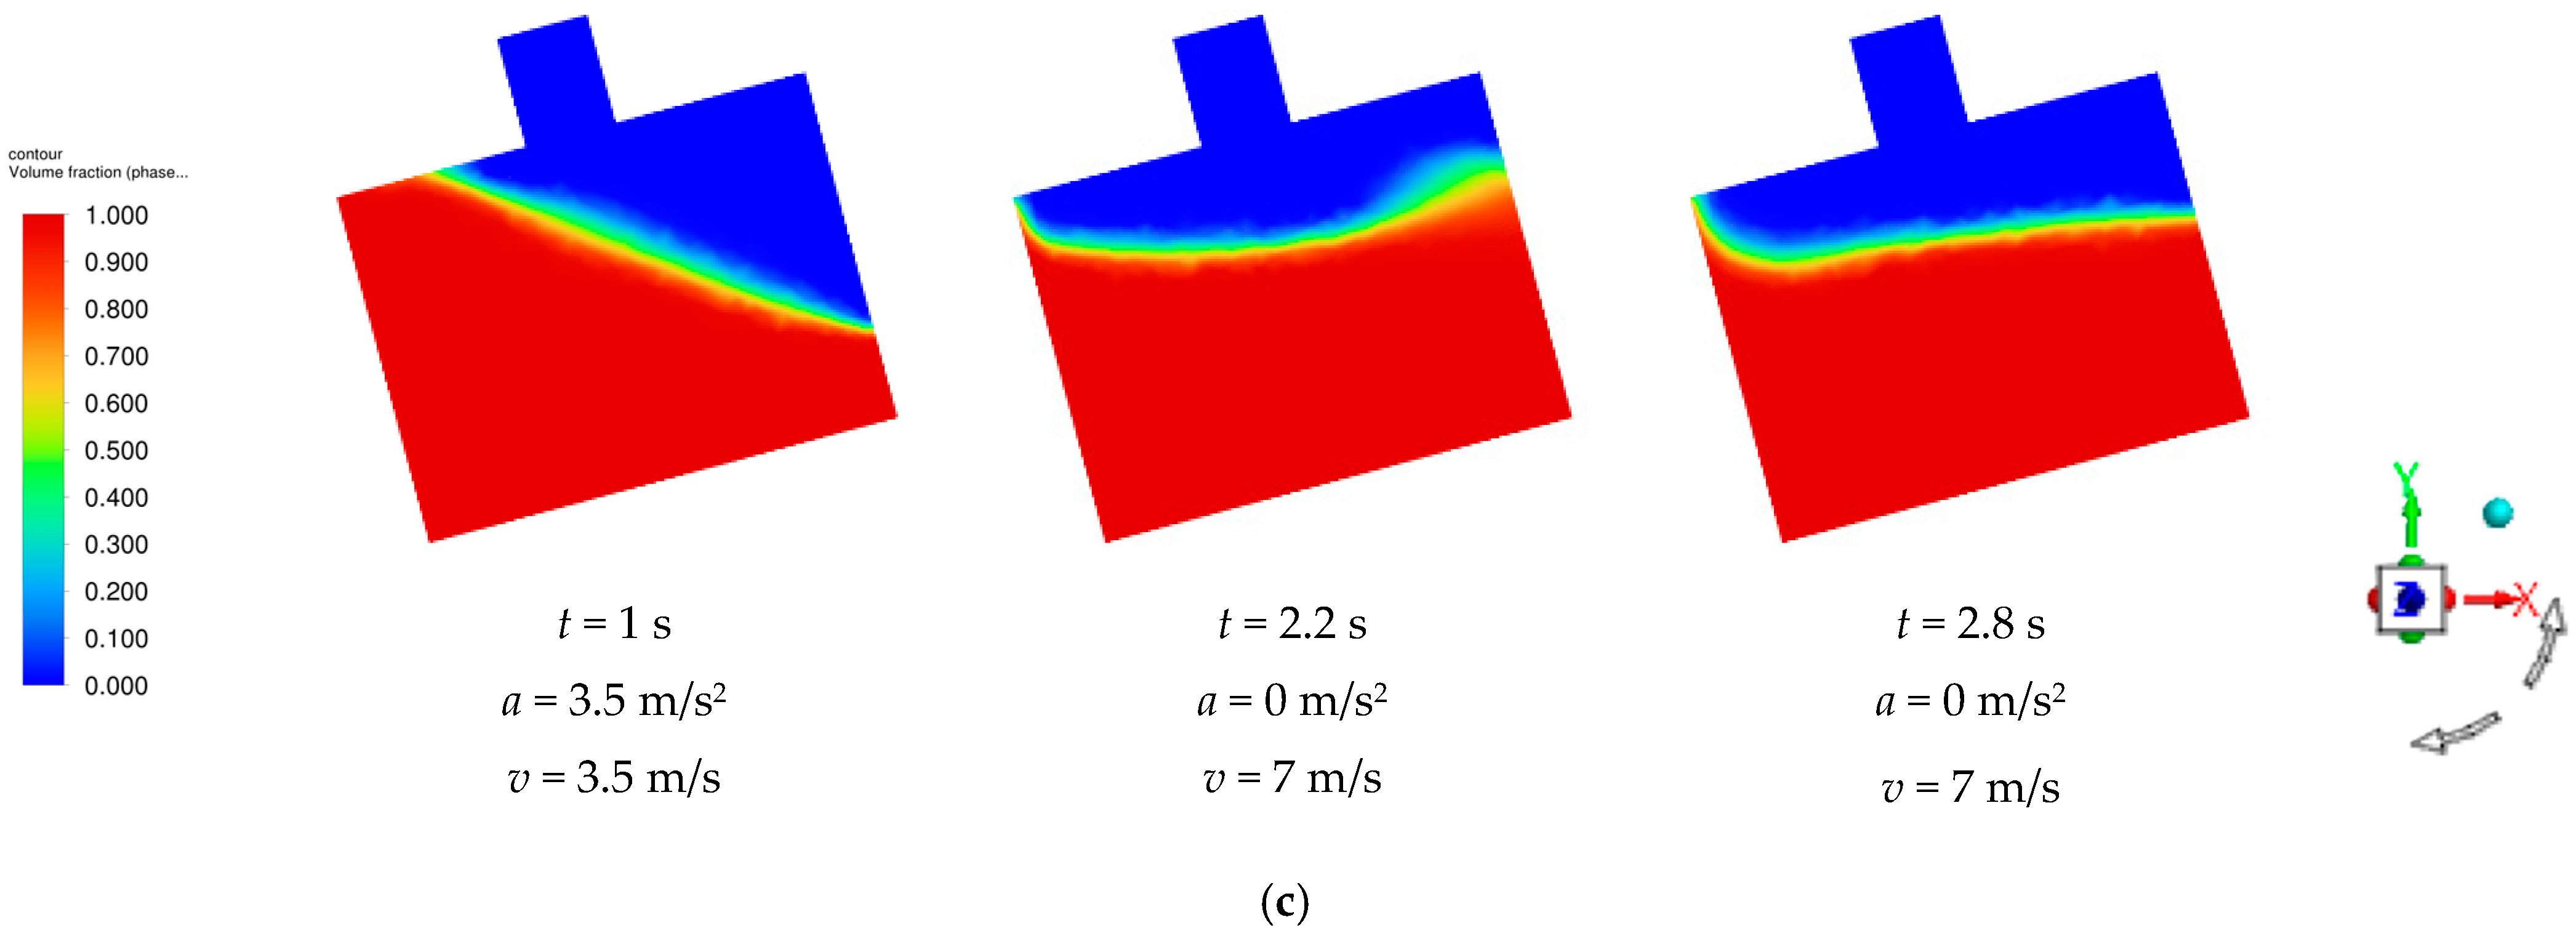
During the ascent of the plant protection UAV, the drone and the pesticide tank were positioned at an angle of 15° relative to the horizontal. In the numerical simulation, an acceleration of 3.5 m/s2 was applied to the pesticide tank in the plant protection UAV for a duration of 2 s at an angle of 15°. This simulated the flight attitude of the plant protection UAV during the climbing posture. The acceleration was introduced into the calculation domain through a UDF file. The cloud maps of the numerical simulation results for the filling ratios of 0.3, 0.5, and 0.7 in the pesticide tank are shown in Figure 11. Under the influence of acceleration, the pesticide tank began to move. Due to the combined effect of gravity and inertia, the liquid level in the medicine tilted towards the left inner wall with continuous variation in the tilt amplitude observed with time. Once the acceleration came to zero, the pesticide tank maintained a speed of 7 m/s. However, due to the effects of gravity and inertia on the medicine solution, combined with the constraints imposed by the inner walls of the pesticide tank, the liquid level began to fluctuate uncontrollably. This fluctuation gradually decreased in amplitude until it eventually returned to its initial horizontal state.
Figure 11 shows the numerical simulation results for a pesticide tank at filling ratios of 0.3, 0.5, and 0.7. A comparison of these results indicated that the overall relative motion of the medicine was largely consistent across all filling ratios. Analyzing the cloud diagrams from the numerical simulations portrayed in Figure 8, it became evident that the fluctuations in the liquid within the pesticide tank decreased with a corresponding increase in the filling ratio. This reduction in fluctuation was particularly important since liquid spray can lead to droplet splashing as well as the formation and rupture of bubbles. Furthermore, a pesticide tank with a higher filling ratio exhibited less fluctuation and returned to its initial state rapidly once the acceleration became zero.
By setting monitoring points to quantify the pressure changes on the inner wall of the pesticide tank, as shown in Figure 11, the left side of the inner wall of a pesticide tank was determined to be significantly affected by the solution surge during the ascent state of the box. Therefore, this work analyzed the monitoring point data from the left inner wall of the pesticide tank situated at 60% of the liquid level height for performing measurements.
Figure 12 shows the pressure changes in the pesticide tank during its ascent at filling ratios of 0.3, 0.5, and 0.7. The pressure at the monitoring point elevated rapidly to its maximum value within a short period and then gradually decreased. Several extreme pressure values appeared within 8 s, with the peak pressure for different filling ratios occurring at the first extreme point. Specifically, the peak pressures recorded at the monitoring points for filling ratios of 0.3, 0.5, and 0.7 were 935.68 Pa at t = 0.28 s, 907.98 Pa at t = 0.22 s, and 1075.07 Pa at t = 0.16 s, respectively. Initially, as the filling ratio increased, the peak pressure decreased and then began to rise again. A comparison of the pressure change curves for different filling ratios in the pesticide tank during an emergency stop state, as shown in Figure 9, indicated that this behavior can be attributed to both the drone and the pesticide tank being oriented at a 15° angle to the horizontal during the ascent. At 2 s into the climb, the pressure at the monitoring point suddenly dropped for all filling ratios, resembling the pressure change patterns observed during an emergency stop, as illustrated in Figure 9, for the same reasons.
From Figure 12, it was evident that the three curves roughly followed the same behavior. However, during the acceleration phase, the fluctuation range of the pressure in the pesticide tank with a filling ratio of 0.7 was significantly smaller than that observed with filling ratios of 0.3 and 0.5. Additionally, as the filling ratio increased, the pesticide tank reached its peak pressure rapidly. The fluctuation range of pressure in the pesticide tank with a higher filling ratio became smaller as the acceleration smoothed out with rapid stabilization of the liquid level.
Figure 13 shows the variation in sloshing torque in the pesticide tank at filling ratios of 0.3, 0.5, and 0.7. The sloshing torque increased in a wave-like pattern until it reached a maximum value, after which it decreased in a similar wave-like manner. The overturning effect on the upper platform was initially found to be arising and began to decline afterwards. As the filling ratio elevated, both the peak value of the sloshing torque of the medicine and the time required to attain this peak subsequently increased. The peak sloshing torque values and their corresponding times for filling ratios of 0.3, 0.5, and 0.7 were measured as follows: 0.0368 N·m at t = 6.96 s, 0.0454 N·m at t = 5.47 s, and 0.1153 N·m at t = 3.99 s, respectively. Due to limitations in ANSYS 2022 R1 Fluent software, which cannot directly monitor the horizontal sloshing torque of the pesticide box during the ascent of the plant protection UAV, the monitored liquid sloshing torque values eventually stabilized at a non-zero value. The final stable sloshing torque values for the solution at filling ratios of 0.3, 0.5, and 0.7 were recorded as −0.0200 N·m, 0.0250 N·m, and −0.0050 N·m, respectively.
A similar tendency in the sloshing torque with respect to time was observed as is evident in Figure 13. When subjected to acceleration excitation, the variation in the sloshing torque of the pesticide tank with a filling ratio of 0.7 was significantly greater than that of the boxes with filling ratios of 0.3 and 0.5, as observed before attaining the peak sloshing torque. Additionally, the time taken to reach this peak was shorter for the 0.7 filling ratio, resulting in a reduction in the time required for the sloshing torque to be stabilized. By combining the numerical simulation results shown in the cloud maps of Figure 11 with the pressure change curves depicted in Figure 12, analysis showed that a filling ratio of 0.7 resulted in a higher liquid content, which in turn enhanced the inertial force. After the acceleration excitation diminished, spatial constraints and inertial forces significantly influenced the liquid’s fluctuation levels. This led to a quicker return of the liquid level to a stable state and a smaller range of pressure fluctuations. Hence, a larger filling ratio corresponded to a shorter duration for the sloshing torque to stabilize and a more rapid reduction in the impact on the overturning of the upper platform.

3.3. Simulation Results of the Sloshing of the Pesticide Tank in the Flying Attitude of the Plant Protection UAV Around the Point

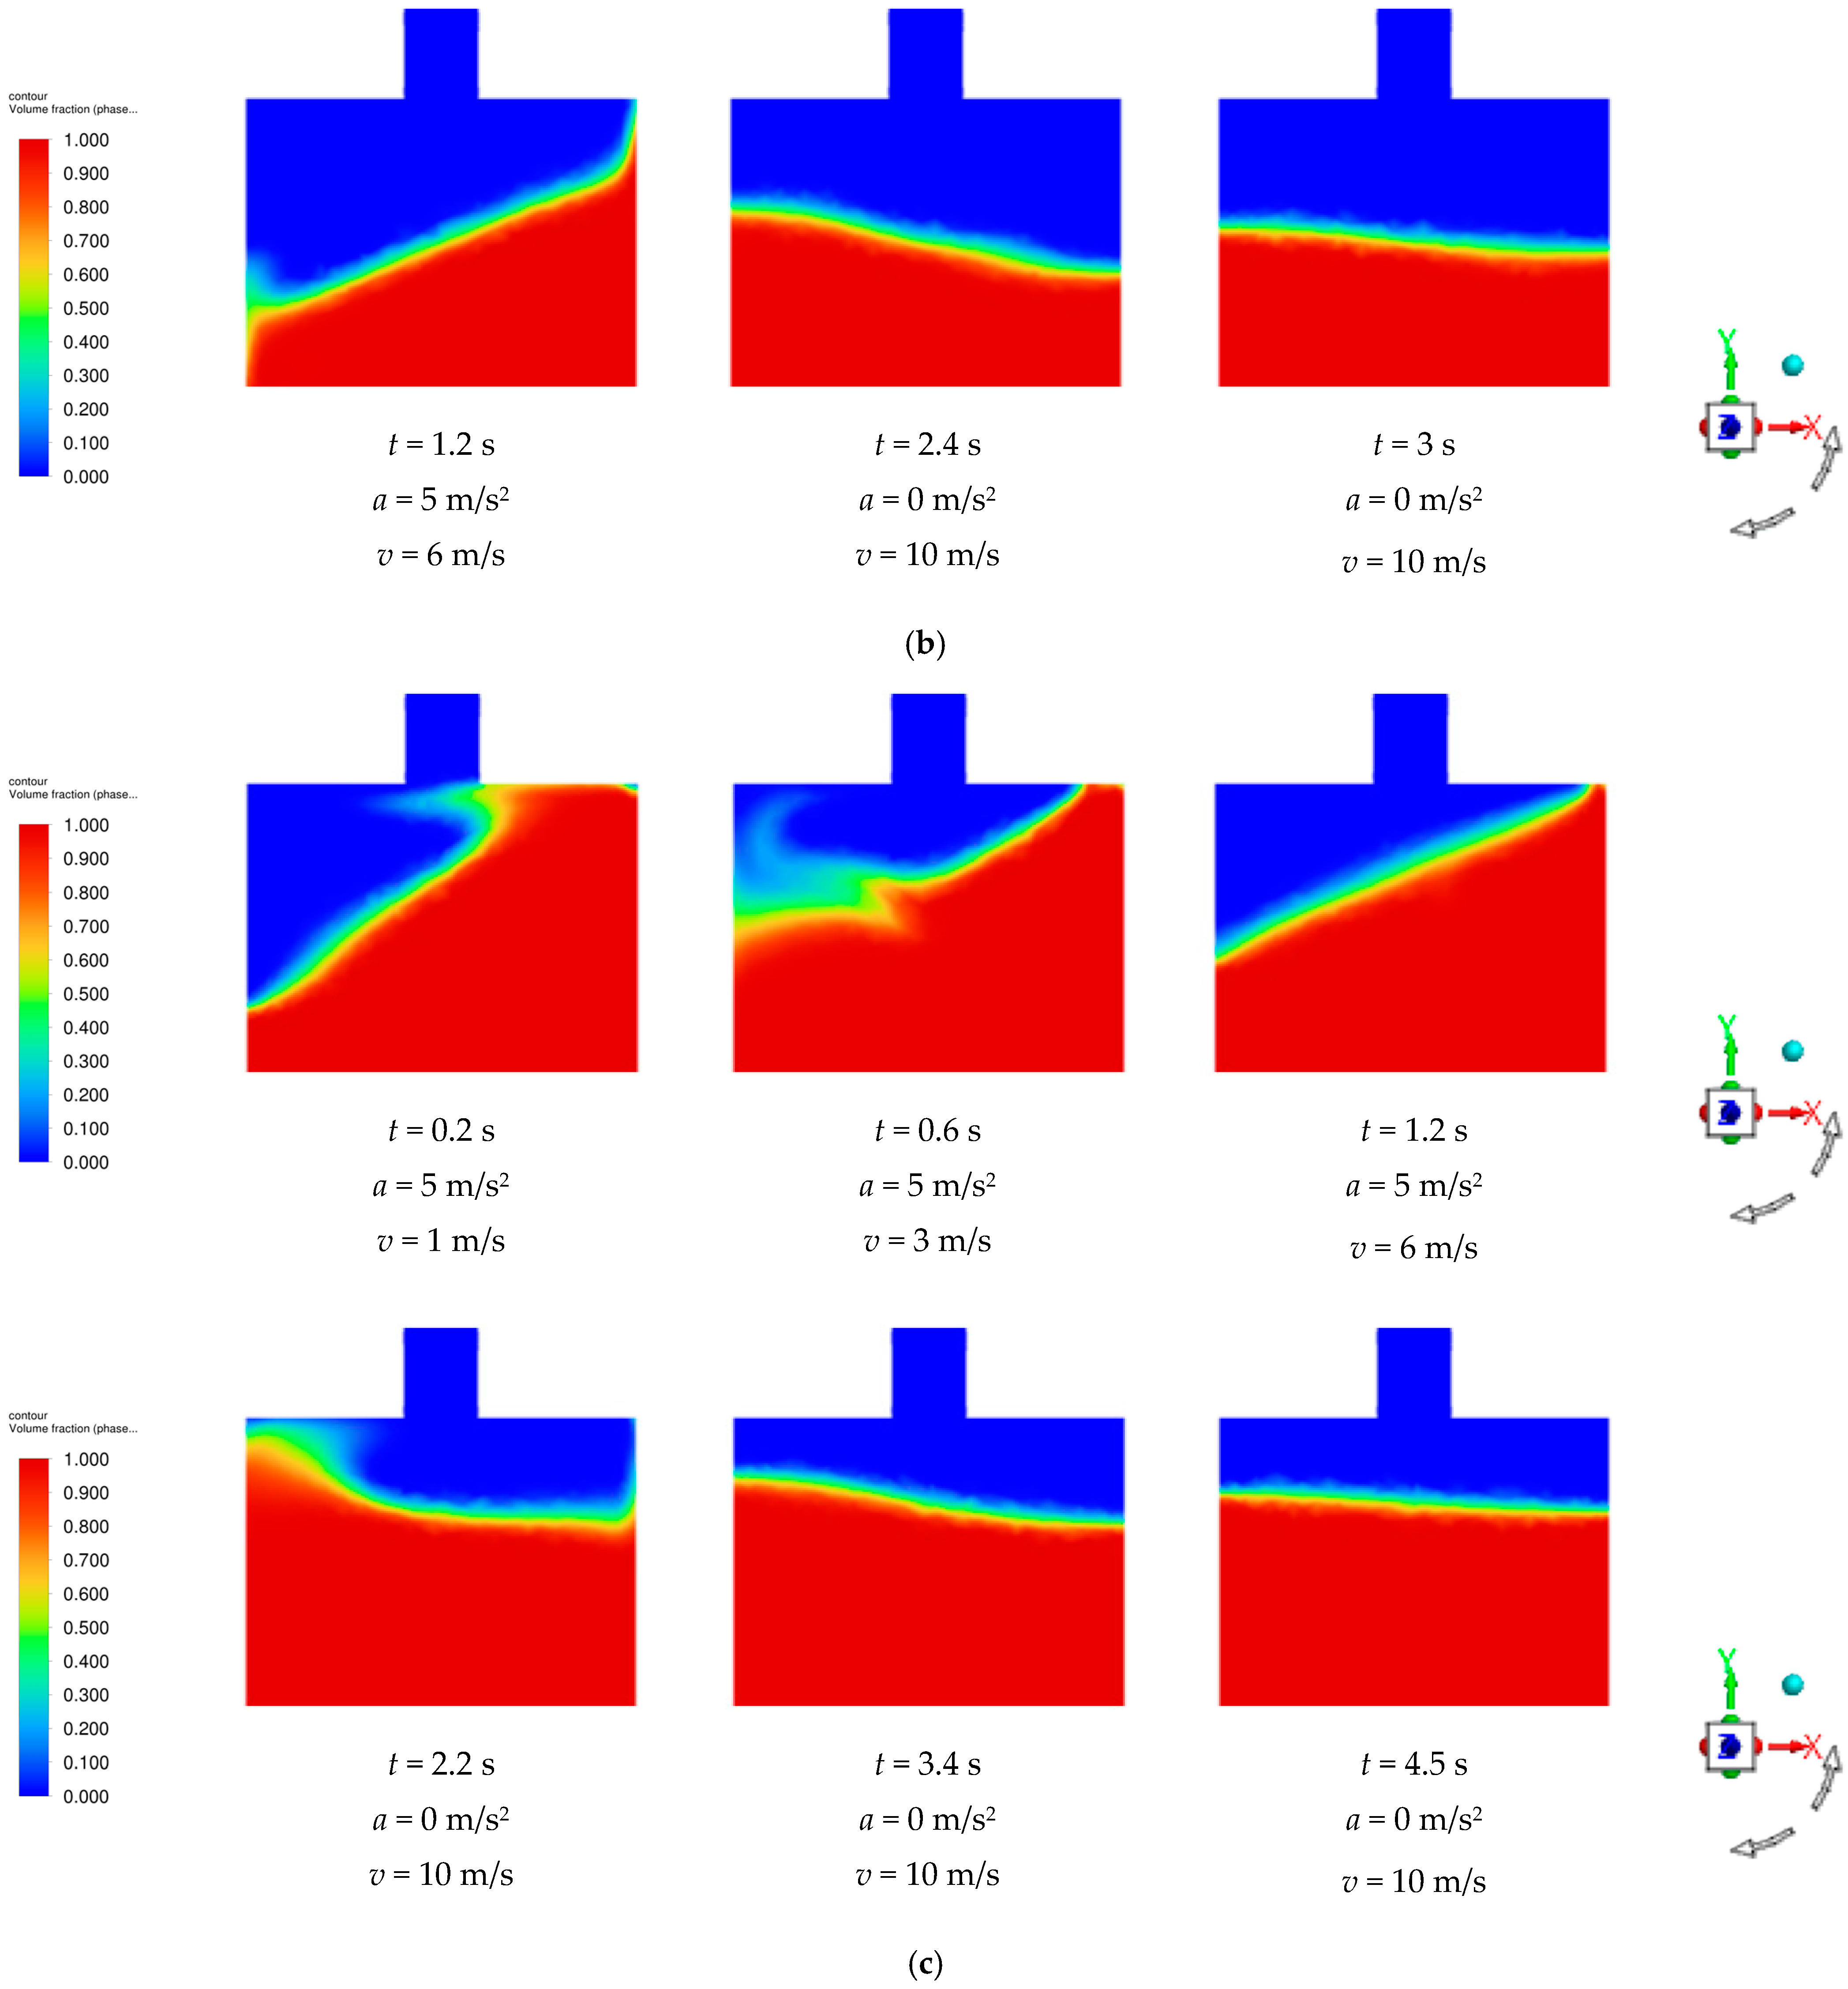
When the plant protection UAV is flying around a designated point, the pesticide box attached to it moves in a circular motion. Since the box does not have a fixed reference plane for describing the numerical simulation results based on a cloud map at any instant in time, this work creates a reference plane for the movement of the pesticide tank while the UAV is in flight. This reference is based on three key points: the coordinate origin, the center of the bottom of the pesticide tank, and the center of the top of the box. During the numerical simulation, a horizontal circumferential angular velocity of 1.5 rad/s was applied to the pesticide box to replicate the UAV’s flight attitude while circling a point. The angular velocity excitation was implemented in the simulation using a UDF file. The cloud maps illustrating the numerical simulation results for filling ratios of 0.3, 0.5, and 0.7 in the pesticide tank are presented in Figure 14. As depicted in the figure, the pesticide tank exhibited a circular motion around a point under the influence of angular velocity. Due to centrifugal force, the liquid level of the medicine inside the box tilted away from the center of rotation. The amplitude of the tilt varied continuously over time until the liquid and the pesticide tank stabilized at a certain tilt angle.
Several cloud maps derived from the numerical simulation results of the pesticide tank at filling ratios of 0.3, 0.5, and 0.7 are shown in Figure 14. A comparison revealed that the overall relative motion of the medicine solution remained similar across these filling ratios. However, substantial generation and rupturing of bubbles were observed with an increasing filling ratio that led to an intense formation of centrifugal force in the medicine with a reduction in the overall fluctuation in the medicine solution relative to the pesticide tank. Meanwhile, over time, both the medicine solution and the pesticide tank quickly achieved relative stability.
To quantify the pressure changes on the inner wall of the pesticide tank, monitoring points were established. As shown in Figure 14, the inner wall of the pesticide tank, particularly on the side away from the rotation center, was significantly affected by the swirling motion of the medicine solution during its flight around a specific point. For this analysis, a monitoring point located at 60% of the liquid level on the inner wall was selected. This point is located opposite the rotation center and aligns with the reference plane of the pesticide tank’s motion in the posture of the fruit tree for measurement purposes.
Figure 15 illustrates the pressure variation curves of the pesticide tank at filling ratios of 0.3, 0.5, and 0.7 during point flight. The pressure at the monitoring point initially rose to a peak quickly and then decreased in a wave-like pattern. Increasing the filling ratio resulted in a corresponding rise in both the peak pressure and the time taken to reach that peak. The peak pressure values at the monitoring points that correspond to the filling ratios of 0.3, 0.5, and 0.7 were recorded as follows: 1148.34 Pa at t = 0.23 s, 1293.71 Pa at t = 0.22 s, and 1463.37 Pa at t = 0.2 s, respectively. In this state, the angular velocity excitation continued to act on the pesticide tank. With a moving pesticide tank, a gradual reduction in the amplitude of the medicine sloshing was observed that subsequently stabilized, leading to a fixed inclination angle between the medicine and the pesticide tank. Consequently, the pressure against the inner wall also stabilized, resulting in stable pressure values of 1017 Pa, 1175 Pa, and 1327 Pa for filling ratios of 0.3, 0.5, and 0.7, respectively.
It is evident from Figure 15 that the three pressure curves generally depicted similar behavior. However, during circular motion, the time needed for the liquid level in the pesticide tank with a filling ratio of 0.7 to stabilize was significantly shorter than for boxes with filling ratios of 0.3 and 0.5. Using the cloud maps in Figure 14, it can be inferred that within a certain range, a higher filling ratio led to elevated levels of liquid content with an increased likelihood of bubble formation and rupture. Nevertheless, the spatial limitations of the pesticide tank and the centrifugal force both exerted significant influence on the fluctuation in the liquid. This may lead to a scenario where a higher filling ratio may shorten the time required for the liquid and the pesticide tank to achieve a relatively stationary state.
The graphs depicting the variation in sloshing torque of the liquid medicine at filling ratios of 0.3, 0.5, and 0.7 are shown in Figure 16. It was noted that the sloshing torque initially reached a peak value relatively quickly and then waned in a wave-like pattern, gradually diminishing the overturning effect on the upper platform. The peak values of the sloshing torque and corresponding times for filling ratios of 0.3, 0.5, and 0.7 were recorded as follows: 8.4364 N·m at t = 0.98 s, 8.2708 N·m at t = 0.24 s, and 7.8108 N·m at t = 0.2 s, respectively. With an increasing filling ratio, the sloshing torque of the medicine exhibited a decline in its peak value while the time needed to attain the peak value increased. The sloshing torque of the medicine solution varied with changes in angular velocity. Notably, the sloshing of the medicine solution gradually became stable with the operating pesticide tank, resulting in consistent pressure on the inner wall. Ultimately, the final sloshing torque of the medicine solution approached zero, leading to almost negligible overturning effects on the upper platform.
The sloshing torque exhibited similar trends concerning filling ratios during flight, as evident from Figure 16. During circular motion, the time required for the sloshing torque of the medicine solution to approach zero with a filling ratio of 0.7 was substantially smaller than for boxes with filling ratios of 0.3 and 0.5. A higher liquid content was associated with a filling ratio of 0.7, as demonstrated by cloud maps in Figure 14 and the pressure variation curves in Figure 15. Consequently, it can be concluded that both the liquid medicine and the pesticide tank can rapidly achieve a relatively stable state when subjected to strong centrifugal force. A higher filling ratio resulted in a decreased time necessary for the sloshing torque of the medicine to reach zero value, facilitating a quick reduction in the impact on the overturning of the upper platform.

4. Discussion

This article presents the design of a six-degree-of-freedom motion platform tailored for a plant protection UAV flight attitude simulator. The simulator was capable of replicating the composite motion environment of the plant protection UAV across six degrees of freedom: lateral, longitudinal, vertical, vertical, pitch, roll, and yaw. It satisfied the flight parameter simulation requirements for the DJI T30 plant protection UAV with a maximum pitch and roll angle of 15°, a maximum flight speed of 10 m/s, a maximum acceleration of 5 m/s2, and a maximum centripetal acceleration of 6 m/s2. Simulations were performed to examine the oscillation interference caused by dynamic changes in the liquid level of the pesticide tank during the maneuvering of the crop protection drone. The analysis explored the effects of liquid-level fluctuations under various flight conditions, specifically during emergency stops, climbing, and circling flight postures, with liquid filling ratios of 0.3, 0.5, and 0.7. The results indicated that the overall movement of the pesticide solution was generally similar across these filling ratios. However, a higher liquid filling ratio resulted in less overall fluctuation in the pesticide solution relative to the pesticide tank. In a stable and continuous state, the time taken by the liquid level was reduced. Additionally, the peak pressure exerted on the inner wall of the pesticide tank was higher, and the time required to reach the peak was shorter. Similarly, it was found that the peak value of the sloshing torque of the medicine liquid enhanced with the filling ratio during emergency stop and climbing states, but decreased correspondingly during circular flight. Moreover, a larger filling ratio accelerated the time required for the sloshing torque of the medicine liquid to approach zero and for the rollover effect on the upper platform to dissipate.

5. Conclusions

This study proposes a design of a six-degree-of-freedom motion platform-based flight attitude simulator for plant protection UAVs, investigating the effects of liquid sloshing on flight stability under varying attitudes and liquid filling ratios. As the liquid filling ratio increases, the overall fluctuation of the liquid becomes smaller, the peak pressure exerted on the inner wall of the pesticide tank is higher, and the rollover effect on the upper platform dissipates more quickly. The findings of this study can provide a theoretical foundation for the operation standards of plant protection UAVs. They may also be beneficial for optimizing flight parameters, analyzing spraying characteristics, and guiding the design of plant protection UAVs and their pesticide tank structures. Changes in drone flight attitude can cause liquid level oscillations, which may impact flight stability, pesticide spraying effectiveness and accuracy, and even pose risks to flight safety. Therefore, it is essential to mitigate the sloshing of the medicine solution. Future research could explore methods for suppressing this sloshing, such as adding baffles at appropriate positions within the pesticide box of plant protection UAV, modifying the box shape, optimizing the internal cavity structure, and experimenting with different cross-sectional shapes.

Author Contributions

Conceptualization, P.C.; methodology, P.C., P.R. and J.R.; software, J.R. and R.Z.; validation, P.R.; formal analysis, P.R.; data curation, P.R., J.R. and R.Z.; writing—original draft preparation, P.R.; writing—review and editing, P.C.; supervision, P.C. All authors have read and agreed to the published version of the manuscript.

Funding

This work was supported by the Key Research and Development Program Project of Shaanxi Province (No. 2023-YBNY-221), Key Innovation China Projects of Shaanxi Province (2023-ZDLNY-58), Fundamental Research Funds for Central Universities (Z1011124001), Youth Project of Shaanxi Province Natural Science Basic Research Program (2024JC-YBQN-0215).

Data Availability Statement

The dataset can be made available upon request from the authors.

Conflicts of Interest

The authors declare no conflicts of interest.

References

  1. Zhang, R.; Lian, S.; Li, L.; Zhang, L.; Zhang, C.; Chen, L. Design and experiment of a binocular vision-based canopy volume extraction system for precision pesticide application by UAVs. Comput. Electron. Agric. 2023, 213, 108197. [Google Scholar] [CrossRef]
  2. Lan, Y.; Chen, S.; Fritz, B. Current status and future trends of precision agricultural aviation technologies. Int. J. Agric. Biol. Eng. 2017, 10, 1–17. [Google Scholar] [CrossRef]
  3. Fan, G.; Liu, Z.; Qin, Y.; Long, B.; Li, H.; Li, J. Airflow characteristics of rotorcraft plant protection UAV operating in rice fields. Biosyst. Eng. 2023, 226, 209–222. [Google Scholar] [CrossRef]
  4. Tang, Y.; Fu, Y.; Guo, Q.; Huang, H.; Tan, Z.; Luo, S. Numerical simulation of the spatial and temporal distributions of the downwash airflow and spray field of a co-axial eight-rotor plant protection UAV in hover. Comput. Electron. Agric. 2023, 206, 107634. [Google Scholar] [CrossRef]
  5. Sánchez-Fernández, L.; Barrera, M.; Martínez-Guanter, J.; Pérez-Ruiz, M. Drift reduction in orchards through the use of an autonomous UAV system. Comput. Electron. Agric. 2023, 211, 107981. [Google Scholar] [CrossRef]
  6. Holterman, H.; van de Zande, J.; Huijsmans, J.; Wenneker, M. An empirical model based on phenological growth stage for predicting pesticide spray drift in pome fruit orchards. Biosyst. Eng. 2016, 154, 46–61. [Google Scholar] [CrossRef]
  7. Li, L.; Zhang, R.; Chen, L.; Deng, W.; Tang, Q.; Duan, D. Wind tunnel test on the effect of PWM duty cycle on droplet drift characteristics. J. Agric. Mech. Res. 2022, 44, 118–125. [Google Scholar] [CrossRef]
  8. Xin, F.; Zhao, J.; Zhou, Y.; Wang, G.; Han, X.; Fu, W.; Deng, J.; Lan, Y. Effects of Dosage and Spraying Volume on Cotton Defoliants Efficacy: A Case Study Based on Application of Unmanned Aerial Vehicles. Agronomy 2018, 8, 85. [Google Scholar] [CrossRef]
  9. Zheng, J.; Han, X.; Guo, H.; Hou, J.; Xue, X. Experimental study on the torque of liquid sloshing in rectangular spray tank under simple harmonic excitation. J. Agric. Mech. Res. China 2022, 44, 143–148. [Google Scholar] [CrossRef]
  10. Zang, Y.; Zang, Y.; Zhou, Z.; Gu, X.; Jiang, R.; Kong, L.; He, X.; Luo, X.; Lan, Y. Design and anti-sway performance testing of pesticide tanks in spraying UAVs. Int. J. Agric. Biol. Eng. 2019, 12, 10–16. [Google Scholar] [CrossRef]
  11. Han, X.; Yu, J.; Lan, Y.; Kong, F.; Yi, L. Determination of application parameters for cotton defoliants in the Yellow River Basin. Int. J. Precis. Agric. Aviat. 2019, 2, 51–55. [Google Scholar] [CrossRef]
  12. Ru, Y.; Xue, J.; Fang, S.; Hu, C.; Zhou, J. Research status and trend of real-time monitoring system for aerial pesticide spray operation. J. For. Eng. China 2023, 8, 21–31. [Google Scholar] [CrossRef]
  13. Ahmed, S.; Qiu, B.; Ahmad, F.; Kong, C.-W.; Xin, H. A state-of-the-art analysis of obstacle avoidance methods from the perspective of an agricultural sprayer UAV’s operation scenario. Agronomy 2021, 11, 1069. [Google Scholar] [CrossRef]
  14. Zhang, K.; Zhang, T.; Liao, Y.; Zhuang, X.; Li, S.; Lan, Y. Remote control unmanned aerial vehicle test system based on Labview. Trans. Chin. Soc. Agric. Eng. 2015, 31 (Suppl. 2), 11–16. [Google Scholar] [CrossRef]
  15. Zhang, C. Analysis of liquid sloshing in LNG carrier with wedge-shaped tanks. Ocean. Eng. 2015, 105, 304–317. [Google Scholar] [CrossRef]
  16. Zhang, C. Application of an improved semi-Lagrangian procedure to fully-nonlinear simulation of sloshing in non-wall-sided tanks. Appl. Ocean. Res. 2015, 51, 74–92. [Google Scholar] [CrossRef]
  17. Li, X.; Zhang, J.; Qu, F.; Zhang, W.; Wang, D.; Li, W. Optimal design of anti sway inner cavity structure of agricultural UAV pesticide tank. Trans. Chin. Soc. Agric. Eng. China 2017, 33, 72–79. [Google Scholar] [CrossRef]
  18. Qiu, Y.; Bai, M.; Liu, Y.; Lei, G.; Liu, Z. Effect of liquid filling level on sloshing hydrodynamic characteristic under the first natural frequency. J. Energy Storage 2022, 55, 105452. [Google Scholar] [CrossRef]
  19. Stewart, D. A platform with six degrees of freedom. Proceedings of the Institution of Mechanical Engineers. Part C. J. Mech. Eng. Sci. 2009, 223, 266–273. [Google Scholar]
  20. Abdelaal, M.; Farag, R.; Saad, M.; Bahgat, A.; Emara, H.; El-Dessouki, A. Uncalibrated stereo vision with deep learning for 6-DOF pose estimation for a robot arm system. Robot. Auton. Syst. 2021, 145, 103847. [Google Scholar] [CrossRef]
  21. Sun, T.; Lian, B. Stiffness and mass optimization of parallel kinematic machine. Mech. Mach. Theory 2017, 120, 73–88. [Google Scholar] [CrossRef]
  22. Gu, Q.; Tian, J.; Yang, B.; Liu, M.; Gu, B.; Yin, Z.; Yin, L.; Zheng, W. A Novel Architecture of a Six Degrees of Freedom Parallel Platform. Electronics 2023, 12, 1774. [Google Scholar] [CrossRef]
  23. Kang, T.-W.; Yang, H.-I.; Jeon, J.-S. Earthquake-induced sloshing effects on the hydrodynamic pressure response of rigid cylindrical liquid storage tanks using CFD simulation. Eng. Struct. 2019, 197, 109376. [Google Scholar] [CrossRef]
  24. Lee, J.-M.; Seo, H.-D. Investigation of design parameters related to sloshing loads using smoothed particle hydrodynamics and rule-based estimations. Phys. Fluids 2023, 35, 077114. [Google Scholar] [CrossRef]
  25. Iranmanesh, A.; Passandideh-Fard, M. A three-dimensional numerical approach on water entry of a horizontal circular cylinder using the volume of fluid technique. Ocean. Eng. 2017, 130, 557–566. [Google Scholar] [CrossRef]
  26. Wen, H.; Yu, C.; Tony, W. On the development of LSassisted VOF method for incompressible interfacial flows. J. Comput. Phys. 2020, 406, 109188. [Google Scholar] [CrossRef]
  27. Liu, S.; Dong, H.; Li, S.; Song, X. Study on the Influence of Working Characteristics of Centripetal Pump Based on VOF/Mixture Model. Processes 1998, 12, 1376. [Google Scholar] [CrossRef]
  28. Meier, H.; Mori, M. Gas-solid flow in cyclones:The EulerianEulerian approach. Comput. Chem. Eng. 1998, 22, 641–644. [Google Scholar] [CrossRef]
  29. Ren, Y.; Xue, M.-A.; Lin, P. Experimental study of sloshing characteristics in a rectangular tank with elastic baffles. J. Fluids Struct. 2023, 122, 103984. [Google Scholar] [CrossRef]
  30. Wu, C.-H.; Hung, T.-K.; Chen, B.-F. Kinematic, dynamic and energy characteristics of swirling sloshing waves. Ocean. Eng. 2023, 272, 113875. [Google Scholar] [CrossRef]
  31. Wang, W.; Peng, Y.; Zhou, Y.; Zhang, Q. Liquid sloshing in partly-filled laterally-excited cylindrical tanks equipped with multi baffles. Appl. Ocean. Res. 2016, 59, 543–563. [Google Scholar] [CrossRef]
  32. Wang, W.; Guo, Z.; Peng, Y.; Zhang, Q. A numerical study of the effects of the T-shaped baffles on liquid sloshing in horizontal elliptical tanks. Ocean. Eng. 2016, 111, 543–568. [Google Scholar] [CrossRef]
Figure 1. Schematic diagram of hinge point positions for dynamic and static platform.
Agronomy 15 00822 g001
Figure 2. Structure diagram of plant protection UAV simulator and schematic diagram of the limit pose of interference: 1, pesticide tank; 2, pesticide tank fixture; 3, on the platform; 4, fixed single ear; 5, rotating double ear support; 6, electric cylinder; 7, lug; 8, bearing housing; 9, lower platform.
Agronomy 15 00822 g002
Figure 3. System coordinate definition diagram and schematic diagram of centroid acceleration of pesticide tank.
Agronomy 15 00822 g003
Figure 4. Expansion and contraction curves of electric cylinder piston rod.
Agronomy 15 00822 g004
Figure 5. Electric cylinder drive curves.
Agronomy 15 00822 g005aAgronomy 15 00822 g005b
Figure 6. Force curves of electric cylinder.
Agronomy 15 00822 g006aAgronomy 15 00822 g006b
Figure 7. Force curves of (a) upper and (b) lower platform hinges: (a) force curves of the upper platform hinge; (b) force curves for the lower platform hinge.
Agronomy 15 00822 g007
Figure 8. Cloud maps obtained via numerical simulation results of pesticide tank with different filling ratios during emergency stop: (a) cloud diagrams of numerical simulation results of the pesticide tank at a filling ratio of 0.3; (b) cloud diagrams of numerical simulation results of the pesticide tank at a filling ratio of 0.5; (c) cloud diagrams of numerical simulation results of the pesticide tank at a filling ratio of 0.7.
Agronomy 15 00822 g008aAgronomy 15 00822 g008b
Figure 9. Pressure variation curve of different filling ratios of the pesticide tank under emergency stop state.
Agronomy 15 00822 g009
Figure 10. The sloshing torque curves of the medicine in the pesticide tank under different filling ratios.
Agronomy 15 00822 g010
Figure 11. Cloud maps extracted using numerical simulation results of pesticide tank with respect to various filling ratios during ascent (climbing state) at 15° angle: (a) Cloud diagrams of numerical simulation results of the pesticide tank at a filling ratio of 0.3; (b) cloud diagrams of numerical simulation results of the pesticide tank at a filling ratio of 0.5; (c) cloud diagrams of numerical simulation results of the pesticide tank at a filling ratio of 0.7.
Agronomy 15 00822 g011aAgronomy 15 00822 g011bAgronomy 15 00822 g011c
Figure 12. Pressure variation curves of different filling ratios of the pesticide tank during the climbing state.
Agronomy 15 00822 g012
Figure 13. The sloshing torque curves for medicine in the pesticide tank under different filling ratios during the climbing posture.
Agronomy 15 00822 g013
Figure 14. Cloud maps derived from numerical simulation results of pesticide tank under different filling ratios with UAV circling around a designated point: (a) cloud diagrams of numerical simulation results of the pesticide tank at a filling ratio of 0.3.; (b) cloud diagrams of numerical simulation results of the pesticide tank at a filling ratio of 0.5; (c) cloud diagrams of numerical simulation results of the pesticide tank at a filling ratio of 0.7.
Agronomy 15 00822 g014
Figure 15. Pressure variation curve of different filling ratios of the pesticide tank during flight state around the point.
Agronomy 15 00822 g015
Figure 16. Sloshing torque curve for the medicine observed under different filling ratios during flight state around the point.
Agronomy 15 00822 g016
Table 1. Motion parameters of flight attitude simulator for plant protection UAV.
AttitudeMaximum OffsetSpeedAcceleration
Pitch±15°±20°/s±100°/s2
Roll±15°±20°/s±100°/s2
Yaw±15°±20°/s±100°/s2
Z vertical lifting±200 mm±10 m/s5 m/s2
Y longitudinal displacement±200 mm±10 mm/s5 m/s2
X lateral displacement±200 mm±10 mm/s5 m/s2
Disclaimer/Publisher’s Note: The statements, opinions and data contained in all publications are solely those of the individual author(s) and contributor(s) and not of MDPI and/or the editor(s). MDPI and/or the editor(s) disclaim responsibility for any injury to people or property resulting from any ideas, methods, instructions or products referred to in the content.

