Article

Relationship Between Dynamics of Plant Biometric Parameters and Leaf Area Index of Hop (Humulus lupulus L.) Plants

1
Department of Agroecology and Crop Production, Faculty of Agrobiology, Food and Natural Resources, Czech University of Life Sciences, 165 00 Prague, Czech Republic
2
Hop Research Institute, 438 01 Žatec, Czech Republic
3
Department of Agricultural Machines Faculty of Engineering, Czech University of Life Sciences, 165 00 Prague, Czech Republic
4
Department of Biotechnology, Faculty of Food and Biochemical Technology, University of Chemistry and Technology, 166 28 Prague, Czech Republic
*
Author to whom correspondence should be addressed.
Agronomy 2025, 15(4), 823; https://doi.org/10.3390/agronomy15040823
Submission received: 4 March 2025 / Revised: 20 March 2025 / Accepted: 24 March 2025 / Published: 26 March 2025
(This article belongs to the Section Horticultural and Floricultural Crops)

Abstract

:
Biometric parameters of hop plants were studied over a three-year period on the Czech variety Premiant grown in the Žatec (Saaz) hop-growing region under an organic farming regime. Initially, only bine leaves developed, with lateral leaves emerging during the third growing month (June). Their leaf area at the time of harvest was larger than the bine leaves. The moment when the area size of both leaf categories was the same, designated as the breaking point (BP), was determined in the interval 181–195 DOY (day of year). The leaf area (LA) measured using infrared imaging and gravimetric methods yielded comparable results, with correlation coefficients of 0.93 and 0.96, respectively. The total leaf area of one hop plant (LA) with four trained bines, which developed dynamically during ontogeny, was 10.45 m2 (2019), 6.65 m2 (2020), and 12.04 m2 (2021) in the harvest period. With a spacing of 3 m × 1 m, the corresponding Leaf Area Index (LAI) values were 3.5, 2.2 and 4.0 in the harvest season. Therefore, they are comparable to other crops such as maize or sorghum. Regression equations were calculated to determine the dry biomass of bine and lateral leaves depending on DOY. Correlations between the dry mass of leaves and the size of the leaf area for both bine and lateral leaves were also evaluated. This work also contains data on the mass proportions of the main plant organs (bine, leaves, cones).

1. Introduction

Hops (Humulus lupulus L.) are perennial dioecious plants with broad industrial applications. Hops are not only used in beer production [1,2,3], but also in the cosmetic and pharmaceutical industry [4,5,6,7].
Leaf area (LA) is a fundamental morphological parameter of hop plants and other crops, as it is directly linked to essential physiological processes such as photosynthesis and transpiration [8,9,10]. The appearance and colour of the leaves is a reliable visual indicator of nutritional deficiencies and pest and disease infestation [11]. Knowledge of leaf area is fundamental for further research in plant physiology, agronomy, pathology and nutrition.
Leaf area (LA) of hop plants changes significantly during ontogeny, i.e., from the sprouting of the shoots in the spring (April) to the harvest in August. Hops produce two types of leaves, which differ significantly in size and shape (Figure 1). Bine leaves grow directly on the bine, with two at each internode (0.25–0.30 m). They are distinctly lobed in most varieties, and their number on a mature bine is only a few dozen. Lateral leaves grow on the side shoots and their number is considerably larger. They are also lobed, but smaller than the bine ones. The lateral leaves at the higher levels of the plant, where hop cones are formed, are heart-shaped. All the leaf types have distinctly serrated edges.
LA can be estimated by many different methods, divided into direct and indirect. Historically, direct methods for LA determination are based on the destructive harvesting of leaves and leaf area determination planimetrically or by weight [12]. Direct methods are considered to be very accurate but time consuming [13,14]. The advantage of the gravimetric method is that it requires little equipment [15]. Another option is to determine the leaf area based on an infrared image of the leaves on a black background [16]. Simple indirect, allometric approach is based on a regression relationship using easily measurable variables such as leaf width and leaf length [17]. Other indirect methods determine LA and leaf area index from measurements of radiation transmission through the canopy [18]. LA and leaf area index may be predicted from thermal infrared data with the help of remote sensing vehicles [19].
Leaf area index (LAI) was first defined by Watson [20] as the one-sided green leaf area per unit of ground surface [20,21]. It is a key variable often used in agricultural studies that manage crop growth and yields. A fundamental benefit of determining the dynamics of leaves’ growth and their leaf area index is their use for modelling the transpiration demands of canopies [22,23], specification of the intensity of plants [24], modelling of the microclimate of the vegetation, and for determining the biochemical cycles of ecosystems [25]. At the same time, the LAI value can be used to specify erosion processes [26] and the effect on soil properties [27,28].
Limited research exists on the hop leaf area, particularly in organic farming systems. Sachl and Kopecký [29] describe the mass distribution of cones and leaves in the height profile of a hop garden. The largest mass proportion of cones in the range of 84–98% of the total yield was found in the height levels between 4 and 7 m (top of the trellis), with the share of leaves being in the range of 61–98%. The spatial distribution of the leaves and cones on the plant also affects the light intensity inside the hop garden [29,30]. Sunlit leaves show an average of 60% higher stomatal conductance than shaded ones. Leaves illuminated by more than 75% are characterized by the highest intensity of photosynthesis [9]. The distribution of the leaves and size of the LA can also affect irrigation efficiency, when sprinklers are placed at the top of the trellis [31,32]. Hniličková [33] studied the development of leaf area of irrigated and non-irrigated plants of the Czech hop variety Saaz. The LA values were in the range of 2.9–4.7 m2. Irrigated plants had 7–37% more leaf area than plants dependent only on rainwater.
Comprehensive data on the hop plant’s leaf area size, spatial distribution, and weight share of its organs in total biomass production over time are still unavailable in the literature. Therefore, the main objectives of the study were (i) to compare the leaf area of a plant using two different approaches: the infrared image method and the gravimetric method; (ii) to determine the dynamics of leaf area development during the ontogenesis of hop plants in the course of crop seasons and leaf area index; (iii) to assess the production of dry aboveground biomass of individual plant organs and the growth of the whole plant over time; (iv) to determine the dependence between the LA of bine and lateral leaves based on their dry weight.

2. Materials and Methods

2.1. Location and Structure of the Hop Plantation

The experiments were conducted at the locality Stekník farm in the Žatec (Saaz) hop-growing region over three consecutive years between 2019 and 2021 (Northwest Bohemia, GPS: 50.3210167° N, 13.6304794° E). Hops of the Premiant variety were grown in an organic farming regime, where the hop garden was established in 2002. A monitoring area of 30 × 12 m was selected for evaluation. The centre of the area was determined by the GPS coordinator. The plants were grown at a spacing of 3 × 1 m. The hop garden was under irrigation throughout the experimental period. Irrigation was applied so that the total amount of water over the hop-growing period (from cutting to harvest) was 450 mm (sum of rainfall and irrigation). The soil type is brown loam, loamy-sandy, with a humus content of 2.5% and a slightly acidic soil reaction. The mean annual temperature at the site is 9.1 °C and the average annual rainfall amounts to 436 mm. The evaluation dates for the biometric parameters of bines, expressed as Day of Year (DOY), BBCH (Biologische Bundesanstalt, Bundessorenamt and Chemical industry) phase, and number of evaluated bines in the years 2019–2021 are summarized in Table 1. The assessment of biometric parameters always occurs in the range of BBCH stages 32–89 [34]. BBCH 32 corresponds to the beginning of vegetation, when the shoots reach 20% of the trellis height, i.e., 1–2 m. BBCH 89 represents the growth stage of fully developed cones.
According to Rossbauer [34], the BBCH numbers correspond to 32–37—plant has reached 20—70% of the height of the structure; 38—plant has reached the ceiling of the constriction; 39—the end of prolonged growth; 62, 64, 68—20, 40, and 80% of the flowers are open; 82, 83—20, 30% of the cones have reached maturity; 89—harvest maturity.

2.2. Determination of Leaf Area Using Infrared Imaging

The plant organs of the harvested bines were analysed in height layers of 1 m in length, measured from the basal part. During the analysis of the individual length sections of the bines, the following plant organs, or their parts, were separated and evaluated: bines, bine leaves without petioles, petioles of bine leaves, laterals with petioles of lateral leaves, lateral leaves and hop cones at harvest time. For each bine height zone, the values of the area of bine leaves (LABL—leaf area of bine leaves, m2) and leaf area of lateral leaves (LALL—leaf area of lateral leaves, m2) were determined. Leaf area was assessed via an infrared image method according to [16]. Fresh leaves separated from the hop plant were photographed on a matte black plastic base. The camera was placed at a height of 1.5 m above the pad. The same resolution (8 Mpx) and focal length were always used. A transparent Plexiglas plate measuring 0.6 × 0.6 m (area for image analysis) was placed on the unfolded leaves, which prevented the leaves from deforming and moving during photography. A Nikon Coolpix 995 digital camera was modified by removing the NIR-blocking filter and assessed with an Infrared R72 (Hoya, Japan) filter mounted in front of the lens. Using analysis software (Adobe Photoshop CS5, Version 12.0, Adobe Systems Software, Dublin, Ireland), the photos were converted to black and white format (the leaves were indicated in white), and the number of white pixels per image was determined for each image. Based on the calibration of the pixel size, the actual area of the leaves on the plate was calculated.

2.3. Determination of Leaf Area Using Gravimetric Method

For each height level, the total weights of bine and lateral leaves (without petioles) were determined with accuracy set to one decimal place. At the same time, specific leaf area (ratio of leaf area to leaf weight, cm2 g−1) was determined planimetrically, separately for bine and lateral leaves [35]. Individual leaves were first weighed to 2 decimal places. Their area was measured using millimetre graph paper. For each type of leaf, the value of the specific area per weight unit (cm2 g−1) was determined. In this way, 3–4 bine leaves were evaluated, and the number of smaller lateral leaves ranged from 15 to 20. The mean values of the specific area for both categories of leaves were expressed as medians. The last LA assessment was carried out shortly before harvest.
The leaf area of bine and lateral leaves (m2) was calculated by multiplying the specific gravity (cm2 g−1) by their total weight (g). Leaf area measurements of hop bines were conducted within 60 min of harvesting to minimize dehydration. In order to prevent natural drying, the basal part of the bine was immersed in water. Gravimetric and infrared imaging methods for leaf area evaluation were conducted simultaneously.
The average value of LAI for the height profiles of the hop plants and the entire growth in the evaluated dates from 2019 to 2021 was determined for the average number of trained bines per plant (4) and the ground area corresponding to one hop plant (3 m2). Day of year (DOY) values were used to express temporal dynamics.

2.4. Determination of Biomass Production

At each leaf area measurement, the plant organs and their parts for the individual height zones of the bines were dried (65 °C, drying time 24 h) and their dry biomass (DB) for individual height zones of the plant was determined. The weights of the following parts of the hop plant were evaluated: bines, lateral stems with petioles, bine leaves, petioles of bine leaves, lateral leaves and hop cones (at harvest time).

2.5. Comparison of Methods and Biometric Correlations

Correlation analysis was used to compare leaf area measurements using infrared imaging (LAIR) and mass (gravimetric) determination (LAM). Subsequently, a regression analysis (linear model) was used to determine the dependence between dry biomass production of bine and lateral leaves and their temporal development during vegetation season (DOY). Regression models were developed to determine the values of dry aboveground biomass of bine and lateral leaves depending on the hop plant’s developmental stage. Plant development was temporally defined as DOY (day of year). By comparing the models, the “breaking point” (BP) was determined, referring to the day when the mass of lateral and bine leaves was the same. The correlation relationships between the total dry weight of the plant and the dry weight of bine and lateral leaves were processed. All mathematical models were processed for all years at the 95% probability level. Based on the knowledge of the dry weight of bine and lateral leaves, calculation algorithms were determined for calculating the leaf area of both leaf types as well as the total leaf area of the plant. Algorithms were compiled for individual years 2019–2021 and for the entire experimental period.

2.6. Statistical Evaluation

Statistical analyses were carried out in Statgraphics®Plus 4.0 (Statgraphics, Warrenton, VA, USA). The simple regression (linear and logarithmic models) were used.

3. Results and Discussion

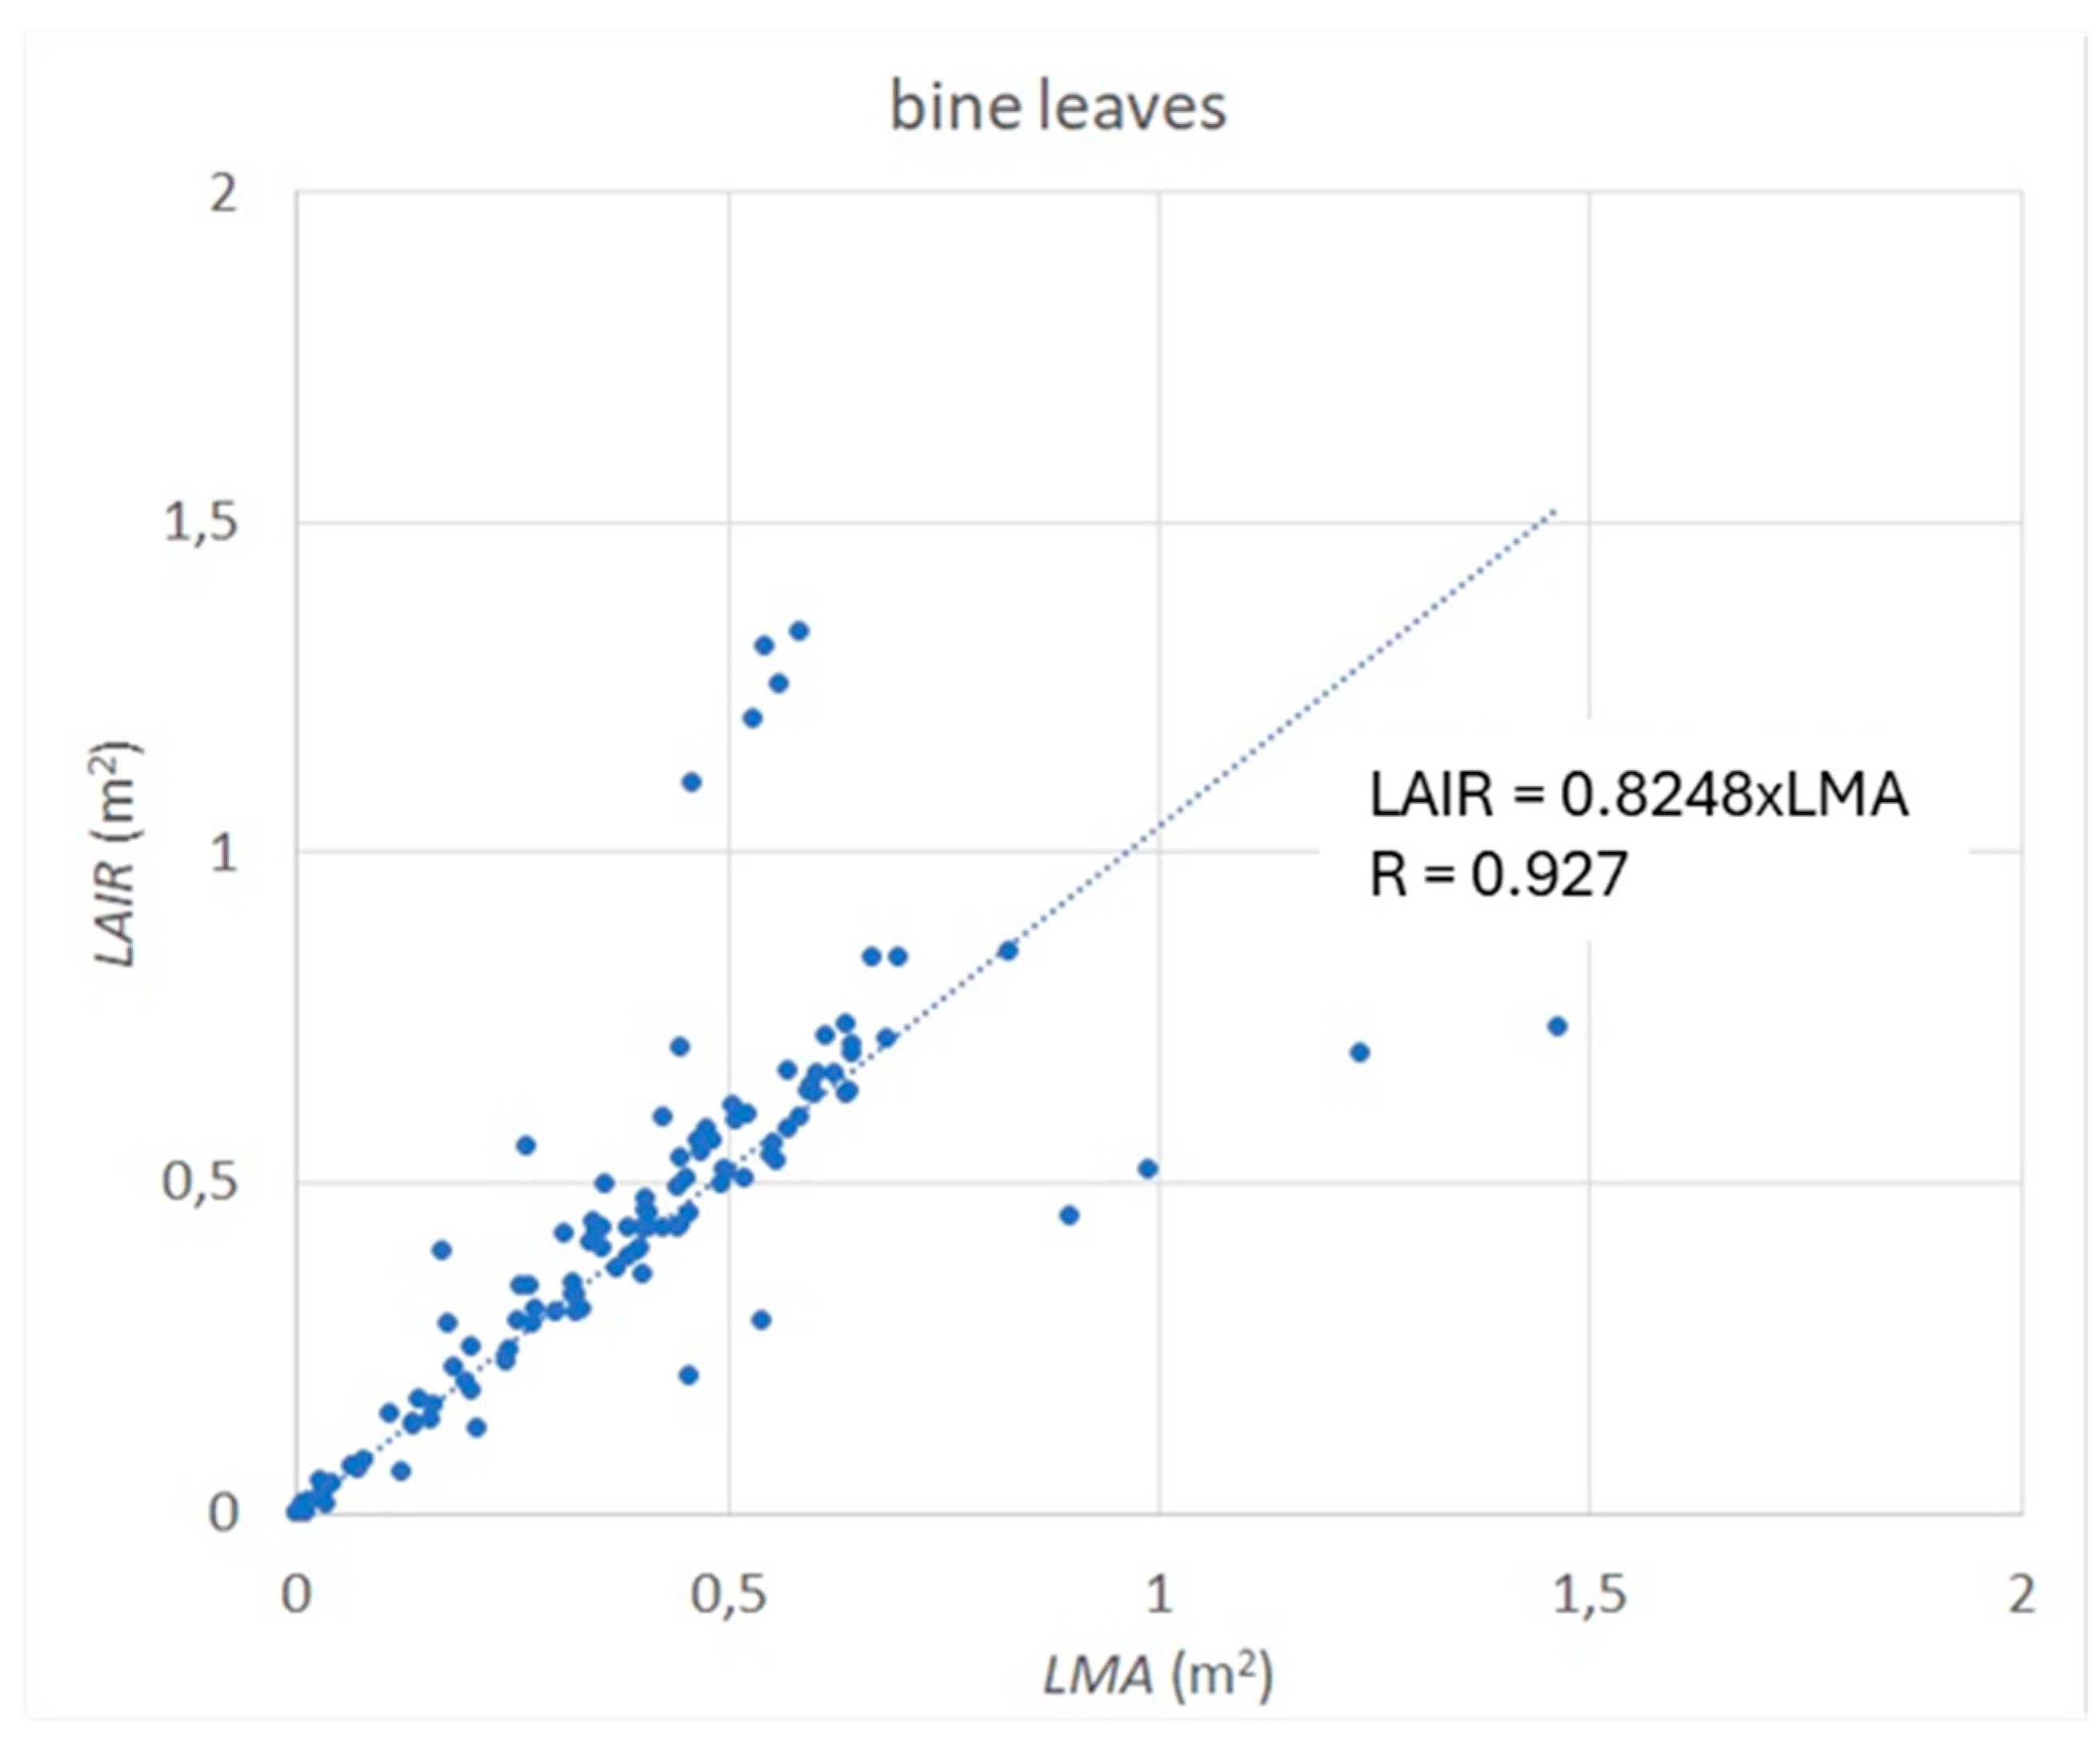
3.1. Comparison of Two Different Approaches for Leaf Area Determination

For the period 2019–2021, Figure 2 and Figure 3 show correlations via infrared imaging (LAIR) and the mass/gravimetric method (LAM) for measuring leaf area on bine and lateral leaves. The high values of the correlation coefficients of 0.96 and 0.93 prove that both methods provide comparable values. The gravimetric method further showed that the specific leaf area of bine and lateral leaves decreases in the course of vegetation. This decrease is significantly more pronounced in lateral leaves (Figure 4). Bine leaves have a lower specific area than lateral ones. It linearly decreases throughout the growing season (May–August). Bine leaves have a specific leaf area of approximately 50 cm2 g−1 at the start of the growing season, which decreases to 40–42 cm2 g−1 by harvest. The range of the specific area of lateral leaves is much wider (40–70 cm2 g−1), probably due to their greater shape and size variability. The most laborious step for both methods is the complete defoliation of the hop bine, followed by the separation of the bine and lateral leaves by height floors. Accurate data obtained by destructive methods can serve as comparative values in the development of non-destructive methods; for example, using unmanned aerial vehicles (UAV) [36]. The advantage of non-destructive methods is the possibility of monitoring leaf area development during the ontogeny of plants in large areas of hop yards [37].

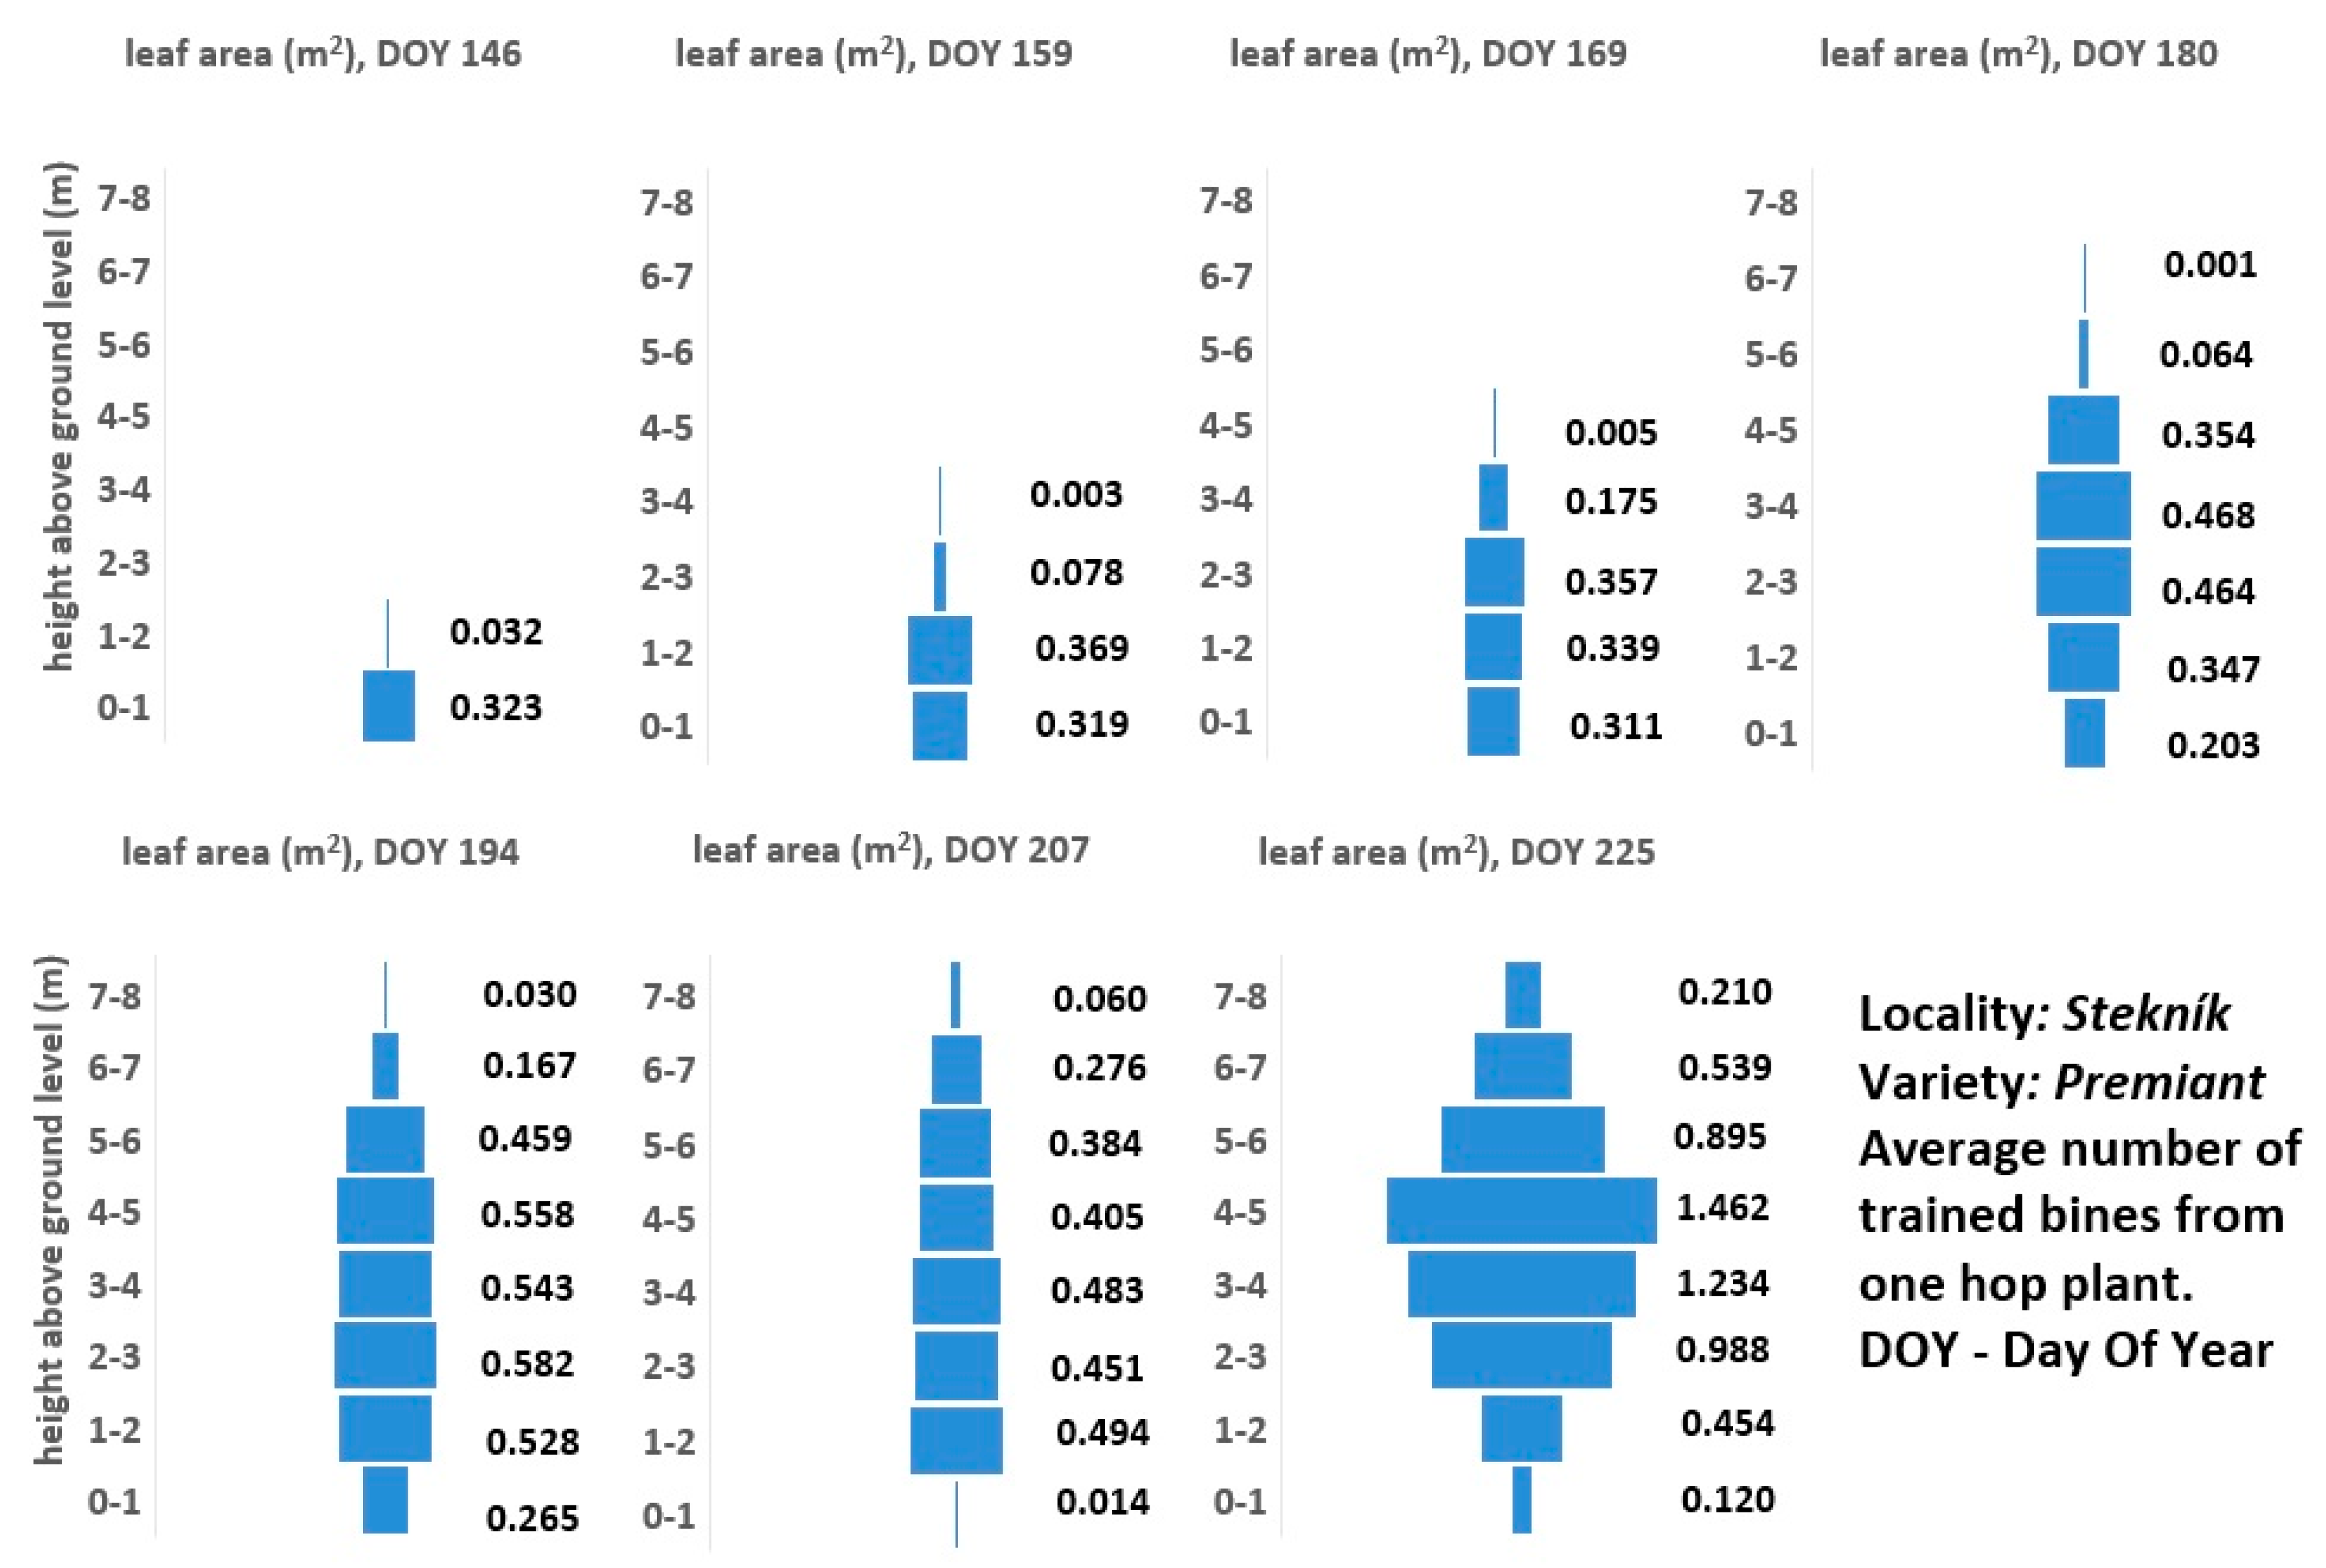
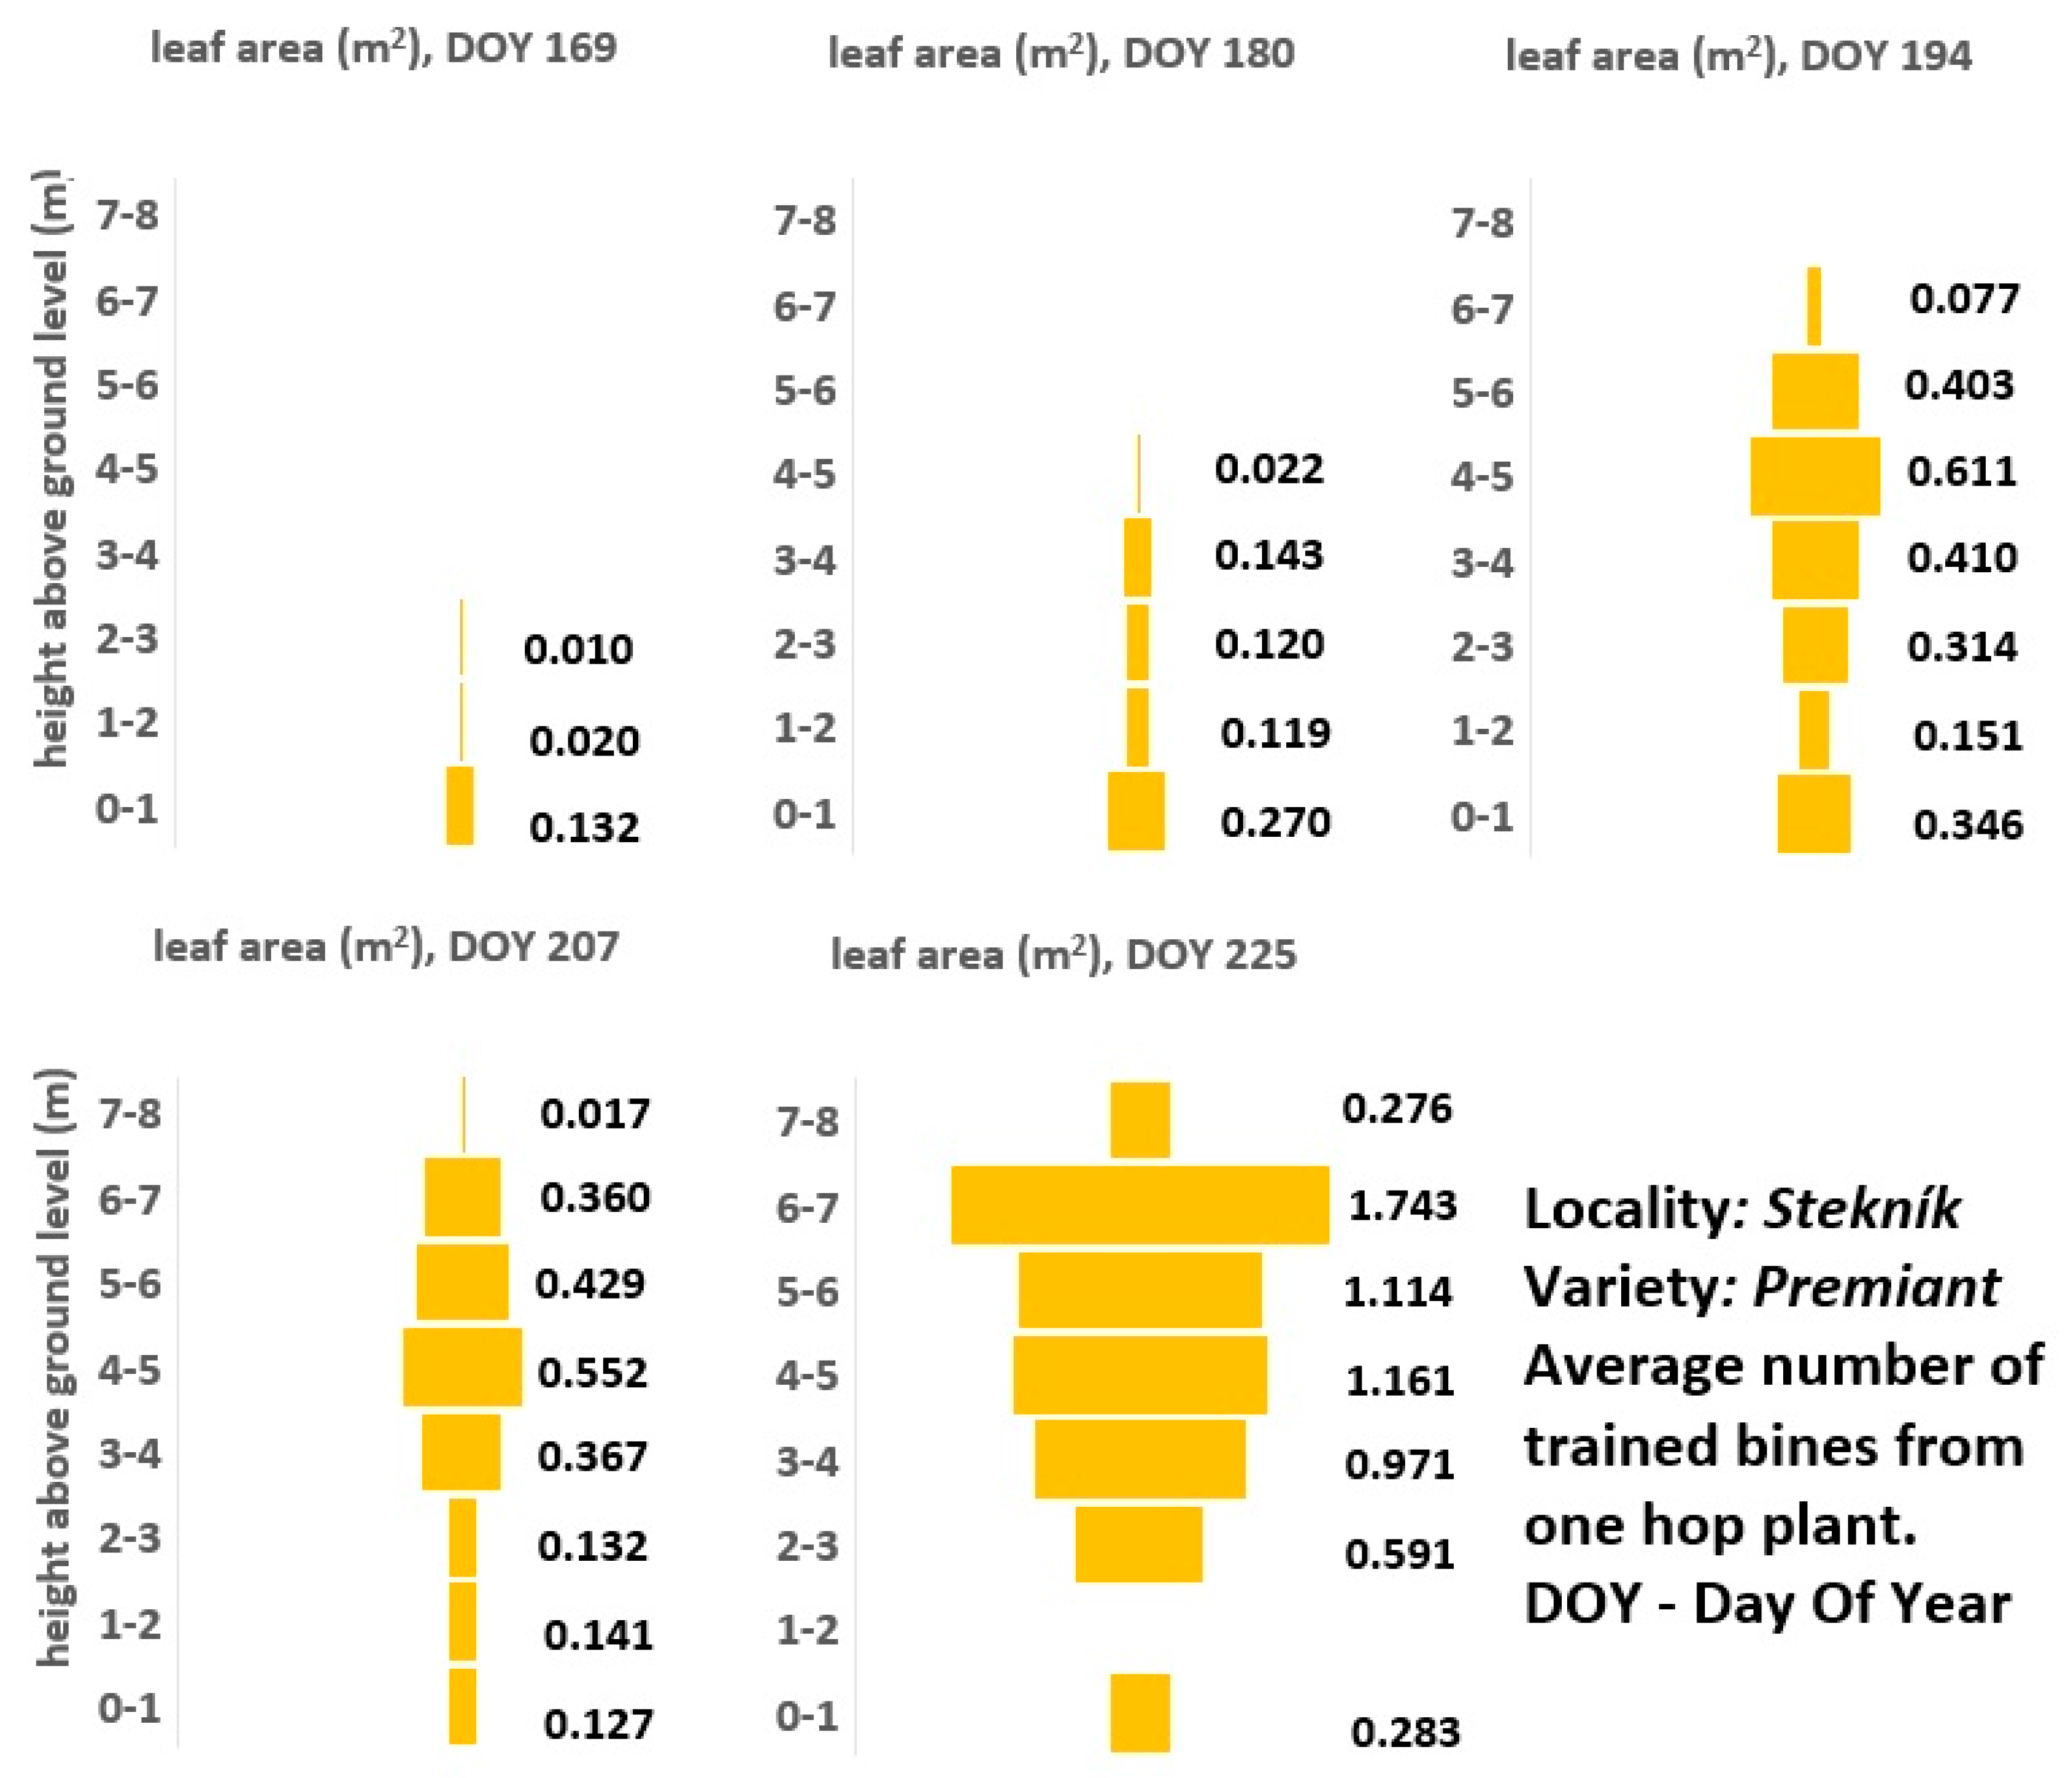
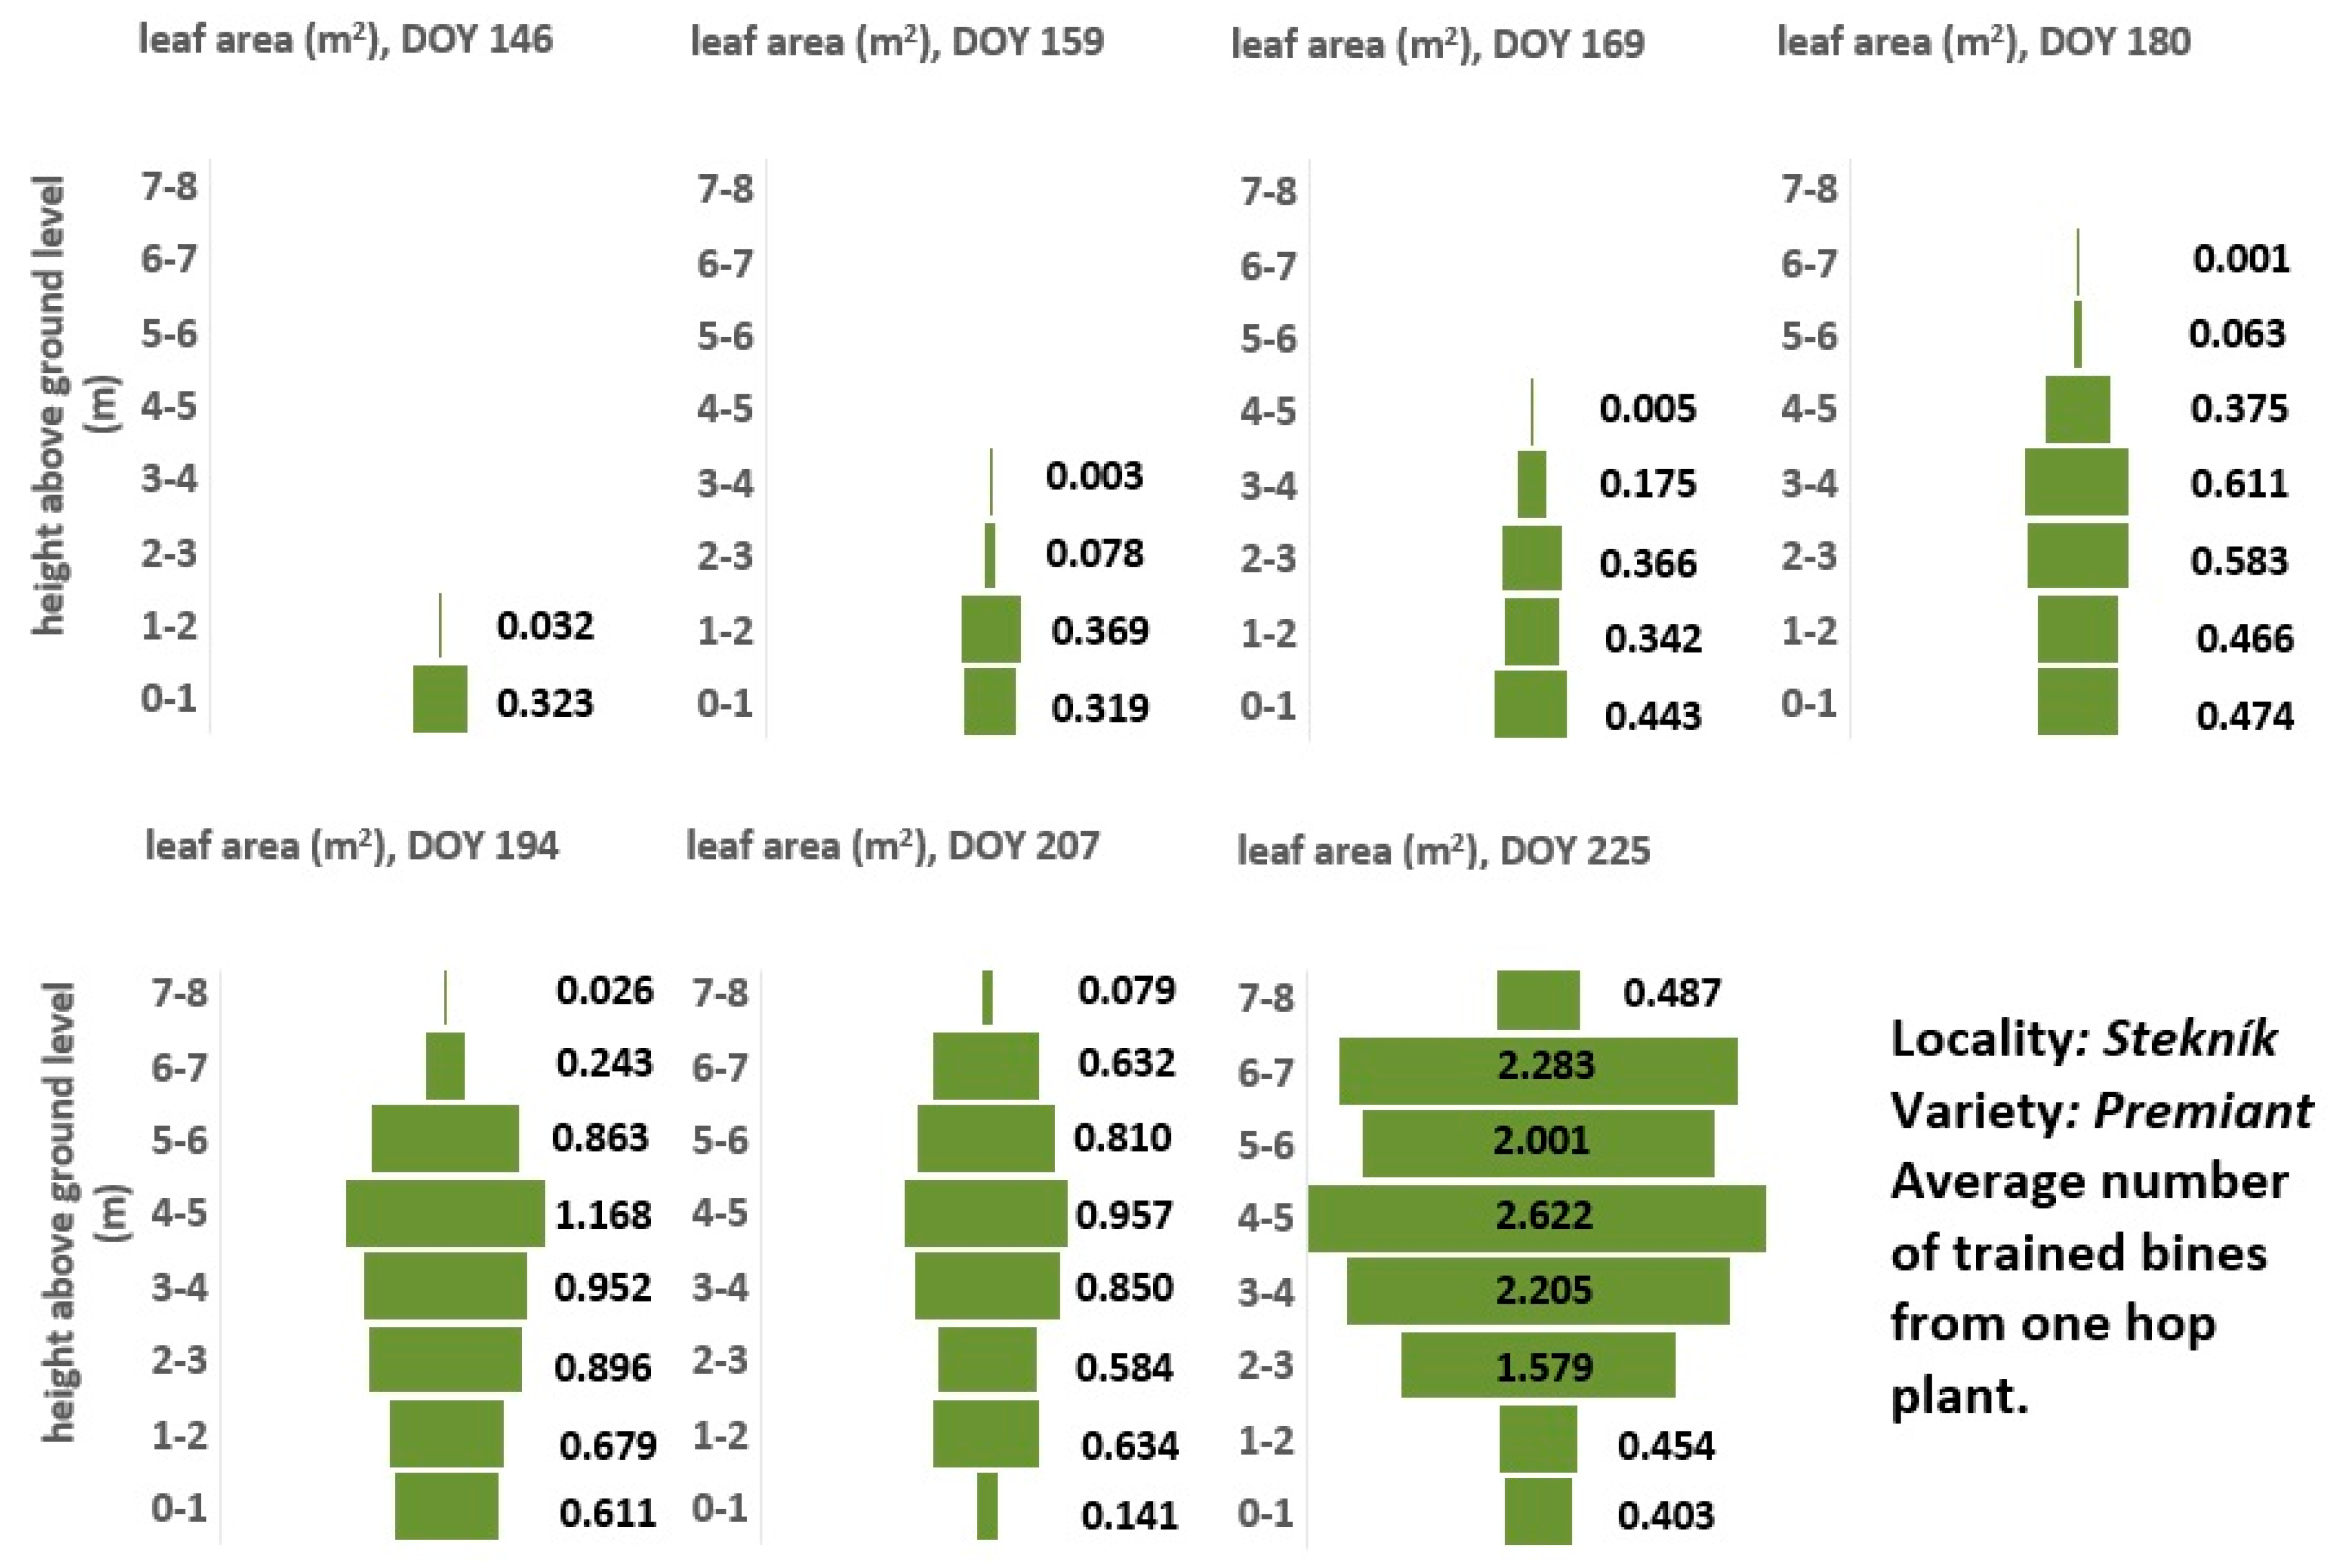
3.2. Spatial Distribution of Leaves and the Dynamics of Leaf Area Development During the Ontogenesis of Hop Plants

Analyses of the spatial distribution of the hop plant’s leaf surface using infrared imaging (LAIR) and mass methods confirmed spatiotemporal changes during vegetation. The dynamics of the development of leaf area on the hop plant in time and space are basically the same every year. A typical course of the increase in leaf area during the 2021 growing season is shown in Figure 5, Figure 6 and Figure 7. Bine leaves (Figure 5) are primarily involved in the formation of the hop plant leaf surface, which is dominant until 160 DOY. Hops’ growth in length is completed when the plant enters the generative phase (blooming and cones formation). With the development of lateral shoots, lateral leaves are gradually formed (Figure 6). The leaf area, especially small lateral leaves, continues to grow. Their total area is larger than that of bine leaves towards the end of the vegetation season, especially when the plant enters the phase of cones formation. Change in the proportion of the area represented by bine and lateral leaves modifies the spatial distribution of the total area of leaves on the plant (Figure 7).
Since they are located on the upper floors of the plant, they are well illuminated. In this way, the plant significantly increases its photosynthetic activity in connection with the intensive formation of secondary metabolites in the lupulin glands of hop cones, especially resins, essential oils and polyphenols [38,39]. In hops, the bracts of hop cones are also photosynthetically active. It ensures a positive carbon balance for the formation of secondary metabolites up to a temperature of 27 °C [40].
Comprehensive data on leaf area development of hop plants during the experimental period of 2019–2021 are summarized in Table 2 and Table 3. With four trained bines from one hop plant, the total LA value (m2) of the plant varied within the measurement period from 0.27 to 10.5 m2 in 2019, from 0.59–6.7 m2 in 2020, and from 0.36–12.0 m2 in 2021. Changes in the LA of bine and lateral leaves are subsequently reflected in the LAI of the canopy, which is shown in Figure 8. The LAI values of the canopy in relation to its structure (the sum of bine and lateral leaves) were 3.5 (2019), 2.2 (2020), and 4.0 (2021) (Figure 8). Based on the course of LAI values of bine (LAIBL) and lateral leaves (LAILL), the intersections of curves determined the breaking point (BPLAI). In 2019, the LAI of lateral leaves exceeded the LAI of bine leaves in the period on 2.7–19.8., in 2020 on 14.7–13.8. and in 2021 in the period of 26.7–13.8. At this time, the lateral leaves, which are mostly found on the upper floors of the hop plant, are of primary importance.
Comparable data for LA in the range of 2.9–4.7 m2 for the traditional Czech aroma hop variety Saaz were published by [33]. These data roughly correspond with our results despite being measured on a different variety and location. Although not clearly stated, the data were probably obtained from a solitary bine. Other LAI values were reported by [41] for annual agricultural crops grown in central Bohemia, such as maize and sorghum. The values of LAI for maize were 4.1 (2010), 4.7 (2011), and 2.6 (2012), whereas LAI values for sorghum were 9.3, 5.6, and 7.7 (2010, 2011, and 2012, respectively). The LAI of cotton during canopy expansion was 2.3–4.6 at 60–90 days after planting [42].
According to [43], mean LAI values distributed among 15 biome classes ranged from 1.3 ± 0.9 for deserts, grasslands, and tundra to 8.7 ± 4.3 for tree plantations, with temperate evergreen forests displaying the highest values. According to [43], the global mean LAI is 4.5. Exceptionally high values have been reported for poplar grown under intensive culture, which could develop LAI values of 16–45 depending on tree spacing [43].
Year-to-year differences in the LAI of hop plants are caused by the influence of weather conditions and the seasonal occurrence of diseases and pests. Biotic attacks by herbivores, fungal diseases and pathogens combined with drought cause substantial reductions in LAI and, consequently, hop cones quality and yield. The reason for the smaller leaf area and LAI values in 2020 was the strong infection pressure of downy mildew (Pseudoperonospora humuli) [44]. Leaf area decreased due to the necrotisation of leaves, especially bine leaves, and their falling, mainly in the lower parts of the plant. Numerous rain showers, high air humidity and temperatures around 25 °C were favourable for its spreading. Although the infection can be suppressed by applying synthetic fungicides in conventional hop cultivation, the possibilities are limited in organic farming.
Water supply becomes a critical limiting factor due to increasing LAI and corresponding water uptake requirements [21]. LAI, which depends on plant spacing, is a good descriptor of canopy structure. For growers, it is important to control LAI when growing varieties with a massive habit. The traditional Czech hop variety Saaz is cultivated at a spacing of 3 × 1 m. New hybrid varieties (Kazbek, Agnus, Saaz Late, Saaz Shine), which are characterised by a more robust habitus, are grown at a wider spacing of 3 × 1.14 m or 3 × 1.33 m [44]. Excessive leaf area can be detrimental, potentially reducing economic yield due to self-shading [45]. Reducing LAI values improves light transmission, largely suppressing light limitation due to the self-shading of leaves and negative carbon balance in lower canopy layers.

3.3. Assessment of the Production of Dry Aboveground Biomass from Individual Plant Organs

The mass proportions of individual parts of the aboveground organs of hop plants in the years 2019 to 2021 are summarized in Table 4. The highest weight share of the plant for most of the growing season falls on the bine. Its diameter at the basal part is up to 10–15 mm. The mass proportion of bine leaves decreases with the vegetation period due to their relatively small number and sometimes as a consequence of necrotisation on the lower floors. The mass proportion of laterals and lateral leaves increases significantly in the second half of vegetation. While the proportion of dry biomass of lateral leaves at harvest season is between 17 and 22% rel., the proportion of bine leaves is much lower at 10–15% rel. For the Saaz aroma variety [30], reported the share of dry biomass of lateral and bine leaves being 17% rel. and 15% rel., respectively.
During the hop ripening period, the proportion of cones has a significant effect on weight ratios, which vary greatly from year to year. With a good harvest (2019), it can make up a third of the weight of the hop plant. For the Saaz variety, ref. [30] provided a comparable weight proportion of cones on the plant at full maturity of less than 30% w/w. In 2021, the hop harvest was negatively affected by strong infection pressure from downy mildew (Pseudoperonospora humuli) [46,47]. This event confirms that the number and size of cones are affected by health conditions and the occurrence of pests and diseases [48]. The total dry weight of biomass for the whole stand ranged from 5.2 to 8.8 t/ha during the study period. This amount, at an average water content of 75%, represents 21–35 t of fresh green matter handled during the harvest season. The majority of hop biomass is currently composted as such or in a mixture with other farm fertilisers (manure, slurry) from livestock farming. After ripening, it returns to the hop gardens as a source of organic matter and nutrients.
Production of aboveground biomass over time is an important parameter for quantifying other parameters, such as the temporary fixation of CO2 in biomass, and for specifying the organic matter cycle [49]. Knowledge of the spatial distribution of leaves in the canopy and its temporal dynamics can represent important information for the zonal application of pesticides, foliar fertilizers and other biologically active substances based on the height of the plants.

3.4. Dependence Between the Leaf Area of Bine and Lateral Leaves in Relation to Their Dry Biomass

The dynamics of the dry biomass production of bine leaves and lateral leaves depending on the time of year (DOY) and the correlation between the total aboveground dry biomass of the plant and the biomass of bine and lateral leaves are summarized in Table 5. They are processed during the period of intensive hop growth (135–241 DOY). The values confirm a significant correlation between the production of dry biomass of bine and lateral leaves in relation to the total dry aboveground biomass of the whole plant. The breaking point (BP) was calculated by comparing bine and lateral leaf growth dynamics during the cultivation season. It specifies the day (DOY) when the dry aboveground biomass of lateral leaves is the same as the value of dry aboveground biomass of bine leaves. Its value was 190 days (2019), 181 days in 2020 and 195 days in 2021, which corresponds to the period from 30 June to 14 July. At this time, the hops begin to flower and form the basis of their generative organs (hop cones).
Knowing the dry biomass of bine and lateral leaves also enabled the calculation of leaf area and, consequently, leaf area index (LAI) values. The relationship between leaf dry weight (g) and leaf area LA (m2, LAIR method) per bine for the growth period of 2019–2021 is shown in Table 6. The positive correlation between LAI and the production of dry leaf biomass and total aboveground biomass in soybean and maize was confirmed by [50]. The relationship between LAI value and aboveground biomass production is currently determined by image analysis methods, which are based on a positive correlation between these parameters [51,52,53].

4. Conclusions

Environmentally friendly pesticide application methods are being sought for permanent crops such as vineyards, hop gardens and orchards. One way to reduce the environmental risk of excessive spray liquid dispersion is to apply an amount that meets the current needs of the crop while maintaining quality treatment. Compared to the flat application concept, parameters based on leaf area size and canopy height are much more suitable for calculating spray liquid volume. The high proportion of lateral leaves in the upper canopy increases the demand for efficient sprayer performance. The ecological system of growing hops in the Czech Republic is currently implemented on 27 hectares. The principles of economical pesticide application based on actual leaf area and canopy height will undoubtedly be applied to conventional hop growing as well. It can be assumed that the results can be used to develop technologies for determining spraying in relation to leaf area. The method of leaf area determination described above provides new and necessary results for further technological development.

Author Contributions

Conceptualization and methodology, V.B.; investigation: K.K., P.P., P.Z., J.D. and V.B.; software and validation, P.H., P.Z. and M.K.; formal analysis, V.B. and M.K.; writing—original draft preparation, V.B., K.K. and P.P.; writing—original draft preparation, V.B. and P.P.; visualization and supervision, P.H. and G.F.; project administration, G.F. and V.B. All authors have read and agreed to the published version of the manuscript.

Funding

This study was supported by Czech Ministry of Agriculture in the framework of the Project NAZV QK1910170.

Data Availability Statement

Data are available on request due to limitations imposed by the contract of the project that supported the research. The data presented in this study are available upon request from the corresponding author to protect the results of the research project.

Conflicts of Interest

The authors declare no conflict of interest.

Abbreviations

The following abbreviations are used in this manuscript:
BPBreaking point
DOYDay of year
LALeaf area
LAILeaf area index
GPSGlobal Positioning System
BBCHBiologische Bundesanstalt, Bundessorenamt and Chemical industry
LABLLeaf area of bine leaves
LALLleaf area of lateral leaves
MpxMegapixel
DBdry biomass
LAIRleaf area using infrared imaging method
LAMLeaf area mass gravimetric determination
UAVunmanned aerial vehicles
SLAspecific leaf area

References

  1. Fărcaş, A.C.; Socaci, S.A.; Mudura, E.; Dulf, F.V.; Vodnar, D.C.; Tofană, M.; Salanță, L.C. Exploitation of Brewing Industry Wastes to Produce Functional Ingredients. In Brewing Technology; IntechOpen: London, UK, 2017. [Google Scholar] [CrossRef]
  2. Kerby, C.; Vriesekoop, F. An Overview of the Utilisation of Brewery By-Products as Generated by British Craft Breweries. Beverages 2017, 3, 24. [Google Scholar] [CrossRef]
  3. Mongelli, A.; Rodolfi, M.; Ganino, T.; Marieschi, M.; Dall’Asta, C.; Bruni, R. Italian hop germplasm: Characterization of wild Humulus lupulus L. genotypes from Northern Italy by means of phytochemical, morphological traits and multivariate data analysis. Ind. Crops Prod. 2015, 70, 16–27. [Google Scholar] [CrossRef]
  4. Abram, V.; Čeh, B.; Vidmar, M.; Hercezi, M.; Lazić, N.; Bucik, V.; Možina, S.S.; Košir, I.J.; Kač, M.; Demšar, L.; et al. A comparison of antioxidant and antimicrobial activity between hop leaves and hop cones. Ind. Crops Prod. 2015, 64, 124–134. [Google Scholar] [CrossRef]
  5. Kong, R.; Yin, J. Efficacy of subcutaneous immunotherapy in a mouse model of Humulus pollen-induced allergic asthma. Am. J. Transl. Res. 2019, 11, 280–289. [Google Scholar]
  6. Rachwał, K.; Waśko, A.; Gustaw, K.; Polak-Berecka, M. Utilization of brewery wastes in food industry. Peer J. 2020, 8, e9427. [Google Scholar] [CrossRef]
  7. Pereira, O.R.; Santos, G.; Sousa, M.J. Hop By-Products: Pharmacological Activities and Potential Application as Cosmetics. Cosmetics 2022, 9, 139. [Google Scholar] [CrossRef]
  8. Hejnák, V.; Hniličková, H.; Hnilička, F. Effect of ontogeny, heterophylly and leaf position on the gas exchange of the hop plant. Plant Soil Environ. 2014, 60, 525–530. [Google Scholar] [CrossRef]
  9. Kenny, S. Photosynthetic measurements in hop (Humulus). Acta Hortic. 2005, 668, 241–248. [Google Scholar] [CrossRef]
  10. Wullschleger, S.D.; Oosterhuis, D.M. Photosynthesis of individual field-grown cotton leaves during ontogeny. Photosynth. Res. 1990, 23, 163–170. [Google Scholar] [CrossRef]
  11. Buttaro, D.; Rouphael, Y.; Rivera, C.M.; Colla, G.; Gonnella, M. Simple and accurate allometric model for leaf area estimation in Vitis vinifera L. genotypes. Photosynthetica 2015, 53, 342–348. [Google Scholar] [CrossRef]
  12. Daughtry, C.S.T. Direct measurements of canopy structure. Remote Sens. Rev. 1990, 5, 45–60. [Google Scholar] [CrossRef]
  13. Gower, S.T.; Kucharik, C.J.; Norman, J.M. Direct and Indirect Estimation of Leaf Area Index, fAPAR, and Net Primary Production of Terrestrial Ecosystems. Remote Sens. Environ. 1990, 70, 29–51. [Google Scholar] [CrossRef]
  14. Küßner, R.; Mosandl, R. Comparison of direct and indirect estimation of leaf area index in mature Norway spruce stands of eastern Germany. Can. J. For. Res. 2000, 30, 440–447. [Google Scholar] [CrossRef]
  15. Le Roux, X.; Sinoquet, H.; Vandame, M. Spatial distribution of leaf dry weight per area and leaf nitrogen concentration in relation to local radiation regime within an isolated tree crown. Tree Physiol. 1999, 19, 181–188. [Google Scholar] [CrossRef] [PubMed]
  16. Brant, V.; Zábranský, P.; Škeříková, M.; Pivec, J.; Kroulík, M.; Procházka, L. Effect of row width on splash erosion and throughfall in silage maize crops. Soil Water Res. 2017, 12, 39–50. [Google Scholar] [CrossRef]
  17. Demirsoy, H.; Demirsoy, L.; Uzun, S.; Ersoy, B. Non-destructive leaf area estimation in peach. Eur. J. Hortic. Sci. 2004, 69, 144–146. [Google Scholar]
  18. Campbell, G.S. Extinction coefficients for radiation in plant canopies calculated using an ellipsoidal inclination angle distribution. Agric. For. Meteorol. 1986, 36, 317–321. [Google Scholar] [CrossRef]
  19. Neinavaz, E.; Skidmore, A.K.; Darvishzadeh, R.; Groen, T.A. Retrieval of leaf area index in different plant species using thermal hyperspectral data. ISPRS J. Photogramm. Remote Sens. 2016, 119, 390–401. [Google Scholar] [CrossRef]
  20. Watson, D.J. Comparative Physiological Studies on the Growth of Field Crops, I. Variation in Net Assimilation Rate and Leaf Area between Species and Varieties, and within and between Years. Ann. Bot. 1947, 11, 41–76. [Google Scholar] [CrossRef]
  21. Bréda, N.J.J. Ground-based measurements of leaf area index: A review of methods, instruments and current controversies. J. Exp. Botany 2003, 54, 2403–2417. [Google Scholar] [CrossRef]
  22. Alam, M.S.; Lamb, D.W.; Warwick, N.W.M. A Canopy Transpiration Model Based on Scaling Up Stomatal Conductance and Radiation Interception as Affected by Leaf Area Index. Water 2021, 13, 252. [Google Scholar] [CrossRef]
  23. Li, X.; Yang, P.; Ren, S.; Li, Y.; Liu, H.; Du, J.; Li, P.; Wang, C.; Ren, L. Modeling cherry orchard evapotranspiration based on an improved dual-source model. Agric. Water Manag. 2010, 98, 12–18. [Google Scholar]
  24. Barclay, H.J. Conversion of total leaf area to projected leaf area in lodgepole pine and Douglas-fir. Tree Physiol. 1998, 18, 185–193. [Google Scholar] [CrossRef] [PubMed]
  25. Bréda, N.J.J.; Index, L.A.; Jørgensen, S.E.; Fath, B.D. (Eds.) Encyclopedia of Ecology; Academic Press: Cambridge, MA, USA, 2008; pp. 2148–2154. [Google Scholar] [CrossRef]
  26. Davie, T.J.A.; Durocher, M.G. A model to consider the spatial variability of rainfall partitioning within deciduous canopy. II. Model parameterisation and testing. Hydrol. Process. 1997, 11, 1525–1540. [Google Scholar] [CrossRef]
  27. Foody, G.M. Status of land cover classification accuracy assessment. Remote Sens. Environ. 2002, 80, 185–201. [Google Scholar] [CrossRef]
  28. Turner, D.P.; Cohen, W.B.; Kennedy, R.E.; Fassnacht, K.S.; Briggs, J.M. Relationships between Leaf Area Index and Landsat TM Spectral Vegetation Indices across Three Temperate Zone Sites. Remote Sens. Environ. 1999, 70, 52–68. [Google Scholar] [CrossRef]
  29. Sachl, J.; Kopecký, J. The height of the hop trellises and the treatment of the growth. Chmelařství 1976, 49, 25–27. (In Czech) [Google Scholar]
  30. Rybáček, V. Hop Production; Elsevier: Amsterdam, The Netherlands, 1991; ISBN 0-444-98770-3. [Google Scholar]
  31. Brant, V.; Krofta, K.; Kroulík, M.; Procházka, P.; Zábranský, P.; Vopravil, J.; Kabelka, D.; Ježek, J. Agrotechnical Measures Respecting the Distribution of the Root System of Hops; Agrární komora ČR: Prague, Czech Republic, 2021. (In Czech) [Google Scholar]
  32. Vopravil, J.; Brant, V.; Kroulík, M.; Krofta, K.; Kabelka, D.; Krofta, K.; Dreksler, J.; Procházka, P.; Kincl, D.; Zábranský, P. Optimization of Soil Tillage in Hop Gardens for the Purpose of Promoting Water Infiltration and Protecting the Soil from Degradation Processes; Kurent: Prague, Czech Republic, 2022. (In Czech) [Google Scholar]
  33. Hniličková, H.; Hnilička, F.; Novák, V. Leaf area development in irrigated and non-irrigated hop plants. Chmelařství 2000, 3, 44–46. (In Czech) [Google Scholar]
  34. Rossbauer, G.; Buhr, L.; Hack, H.; Hauptmann, S.; Klose, R.; Meier, U.; Stauss, R.; Weber, E. Phänologische Entwicklungsstadien von Kultur-Hopfen (Humulus lupulus L.). Nachrichtenblatt Des Dtsch. Pflanzenschutzdienstes 1995, 47, 249–253. [Google Scholar]
  35. Wolf, D.D.; Carson, E.W.; Brown, R.H. Leaf Area Index and Specific Leaf Area Determinations. J. Agric. Educ. 1972, 1, 24–27. [Google Scholar]
  36. Zheng, G.; Moskal, L.M. Retrieving Leaf Area Index (LAI) Using Remote Sensing: Theories, Methods and Sensors. Sensors 2009, 9, 2719–2745. [Google Scholar] [CrossRef] [PubMed]
  37. Viña, A.; Gitelson, A.A.; Nguy-Robertson, A.L.; Peng, Y. Comparison of different vegetation indices for the remote assessment of green leaf area index of crops. Remote Sens. Environ. 2011, 115, 3468–3478. [Google Scholar] [CrossRef]
  38. Clark, S.M.; Vaitheeswaran, V.; Ambrose, S.J.; Purves, R.W.; Page, J.E. Transcriptome analysis of bitter acid biosynthesis and precursor pathways in hop (Humulus lupulus). BMC Plant Biol. 2013, 13, 12. [Google Scholar] [CrossRef] [PubMed]
  39. Wang, G.; Tian, L.; Aziz, N.; Broun, P.; Dai, X.; He, J.; King, A.; Zhao, P.X.; Dixon, R.A. Terpene Biosynthesis in Glandular Trichomes of Hop. Plant Physiol. 2008, 148, 1254–1266. [Google Scholar] [CrossRef]
  40. Bauerle, W.L. Humulus lupulus L. Strobilus Photosynthetic Capacity and Carbon Assimilation. Plants 2023, 12, 1816. [Google Scholar] [CrossRef]
  41. Škeříková, M.; Brant, V.; Kroulík, M.; Pivec, J.; Zábranský, P.; Hakl, J.; Hofbauer, M. Water demands and biomass production of sorghum and maize plants in areas with insufficient precipitation in Central Europe. Plant Soil Environ. 2018, 64, 367–378. [Google Scholar] [CrossRef]
  42. Wullschleger, S.D.; Oosterhuis, D.M. Canopy Leaf Area and Age-Class Dynamics in Cotton. Crop Sci. 1992, 32, 451–456. [Google Scholar]
  43. Asner, G.P.; Scurlock, J.M.O.; Hicke, J.A. Global synthesis of leaf area index observations: Implications for ecological and remote sensing studies. Glob. Ecol. Biogeogr. 2003, 12, 191–205. [Google Scholar] [CrossRef]
  44. Krofta, K.; Pokorný, J. Hop cultivation vs. Weather—An eternal theme: (Evaluation of the crop harvest 2019–2022 of Czech hop varieties at Stekník farm). Kvas. Prum. 2023, 69, 822–830. [Google Scholar] [CrossRef]
  45. Timlin, D.J.; Fleisher, D.H.; Kemanian, A.R.; Reddy, V.R. Plant density and leaf area index effects on the distribution of light transmittance to the soil surface in maize. Agron. J. 2014, 106, 1827–1837. [Google Scholar]
  46. Krofta, K.; Fritschová, G.; Mikyška, A.; Belešová, K.; Vojtěchová, D.; Tichá, J. Alpha acids content in Czech hops from the harvest of 2021—Forecast, reality, trends. Kvas. Prum. 2022, 68, 564–571. [Google Scholar] [CrossRef]
  47. Krofta, K.; Patzak, J.; Sedlák, T.; Mikyška, A.; Štěrba, K.; Jurková, M. Kazbek—The First Czech Aroma “Flavor Hops” Variety: Characteristics and Utilization. Kvas. Prum. 2019, 65, 72–83. [Google Scholar] [CrossRef]
  48. Probasco, E.G.; Murphey, J.M. The effect of hop viruses on brewing and agronomic characteristics in the hop variety Chinook. Tech. Q. Master Brew. Am. 1996, 33, 160–165. [Google Scholar]
  49. Cotton, C.A.; Edlich-Muth, C.; Bar-Even, A. Reinforcing carbon fixation: CO2 reduction replacing and supporting carboxylation. Curr. Opin. Biotechnol. 2018, 49, 49–56. [Google Scholar] [CrossRef] [PubMed]
  50. Kross, A.; McNairn, H.; Lapen, D.; Sunohara, M.; Champagne, C. Assessment of RapidEye vegetation indices for estimation of leaf area index and biomass in corn and soybean crops. Int. J. Appl. Earth Obs. Geoinf. 2015, 34, 235–248. [Google Scholar] [CrossRef]
  51. Oliveira, R.A.; Junior, J.M.; Costa, C.S.; Näsi, R.; Koivumäki, N.; Niemeläinen, O.; Kaivosoja, J.; Nyholm, L.; Pistori, H.; Honkavaara, E. Silage Grass Sward Nitrogen Concentration and Dry Matter Yield Estimation Using Deep Regression and RGB Images Captured by UAV. Agronomy 2022, 12, 1352. [Google Scholar] [CrossRef]
  52. Apolo-Apolo, O.E.; Pérez-Ruiz, M.; Martínez-Guanter, J.; Egea, G. A Mixed Data-Based Deep Neural Network to Estimate Leaf Area Index in Wheat Breeding Trials. Agronomy 2020, 10, 175. [Google Scholar] [CrossRef]
  53. Tang, Z.; Guo, J.; Xiang, Y.; Lu, X.; Wang, Q.; Wang, H.; Cheng, M.; Wang, H.; Wang, X.; An, J.; et al. Estimation of Leaf Area Index and Above-Ground Biomass of Winter Wheat Based on Optimal Spectral Index. Agronomy 2022, 12, 1729. [Google Scholar] [CrossRef]
Figure 1. Bine leaves (A), lateral leaves (B) and cones (C) of a hop plant.
Agronomy 15 00823 g001
Figure 2. Relationships between bine leaf areas determined using infrared imaging (LAIR) and the gravimetric method (LAM) from 2019 to 2021. Statistically significant relationships between LAIR and LAM is at the 95.0% confidence level.
Agronomy 15 00823 g002
Figure 3. Relationships between lateral leaf areas determined using infrared imaging (LAIR) and the gravimetric method (LAM) from 2019 to 2021. Statistically significant relationships between LAIR and LMA is at the 95.0% confidence level.
Agronomy 15 00823 g003
Figure 4. Time courses of specific leaf area (SLA) values of bine and lateral leaves in 2020.
Agronomy 15 00823 g004
Figure 5. Dynamics of the development of bine leaf area (m2) at individual floors of hop plants in 2021.
Agronomy 15 00823 g005
Figure 6. Dynamics of the development of lateral leaf area (m2) at individual floors of hop plants in 2021.
Agronomy 15 00823 g006
Figure 7. Dynamics of the development of total leaf area (m2) at individual floors of hop plants in 2021.
Agronomy 15 00823 g007
Figure 8. Dynamics of LAI in hop crops (2019–2021). LAItotal—bine and lateral leaves; LAIBL—bine leaves; LAILL—lateral leaves; DOY—Day Of Year.
Agronomy 15 00823 g008
Table 1. Dates of evaluation for the biometric parameters of bines (DOY, Day Of Year), BBCH phase and number of evaluated bines in the years 2019–2021.
Evaluation
Date 2019 (DOY)
BBCHThe Number of
Evaluated Bines
Evaluation
Date 2020 (DOY)
BBCHThe Number of
Evaluated Bines
Evaluation
Date 2021 (DOY)
BBCHThe Number of
Evaluated Bines
135325140344146335
144355149364159363
156365161374169373
163373176383180382
172383195683194622
183393224832207682
200643241892225822
225821
Table 2. LA and LAI of hop plants at the start of the vegetation season.
YearDOYBBCHTotal LA per
Bine (m2)
Total LA
per Plant * (m2)
Proportion of Bine Leaves (%)LAI
2019135320.0660.2661000.089
2020140340.1460.5851000.195
2021146330.0890.3551000.118
* 4 trained bines per plant.
Table 3. LA and LAI of hop plants at the end of the vegetation season (harvest time).
YearDOYBBCHTotal LA per
Bine (m2)
Total LA
per Plant * (m2)
Proportion of Bine Leaves (%)LAI
2019225822.61310.45135.03.48
2020241891.6636.65236.92.22
2021225823.00912.03849.04.01
* 4 trained bines per plant.
Table 4. The proportion of the plant’s individual parts to its total dry biomass production based on the day of year (DOY), the total dry biomass of the plant (kg), and the total dry aboveground biomass of the stand (t/ha) in years 2019, 2020, and 2021 (area per plant is 3 m2).
Year 2019 2020 2021
DOY144156163172183200225140149161176195224241146159169180194207225
Plant partsProportion of plant parts to total plant biomass (%)
Bine stem42.040.536.635.840.535.522.844.844.443.843.940.628.831.241.045.841.340.833.940.828.7
Bine leaves47.742.637.429.223.718.210.148.250.237.639.127.114.415.351.748.141.735.825.021.712.8
Lateral leaves009.314.717.221.216.9009.07.914.619.017.9006.59.618.716.422.2
Lateral stems with petioles3.211.112.017.016.123.216.3004.93.914.713.619.3005.810.519.818.928.8
Petioles of bine leaves7.15.74.63.32.51.90.87.15.44.85.33.01.22.17.36.14.73.42.52.11.1
Hop cones00000033.10000023.114.20000006.4
Dry biomass production of plant/stand
Production of aboveground dry biomass of the plant (kg)0.0680.1240.3890.5760.9141.1142.6550.0640.1080.2030.2890.7391.3411.5570.0320.0780.1570.3200.8580.8392.014
Production of aboveground dry biomass of stand (t/ha)0.2270.4121.2961.9203.0463.7148.8500.2150.3580.6780.9642.4624.4705.1890.1080.2600.5251.0672.8592.7986.715
Table 5. The dynamics of the dry biomass production of bine leaves (DBBL, kg/plant) and lateral leaves (DBLL, kg/plant) depending on the time of year (DOY) and the correlation between the total aboveground dry biomass of the plant (DBplant, kg) and the biomass of bine (DBBL, kg/plant) and lateral (DBLL, kg/plant) leaves. BP day (breaking point in DOY). Confidence level 95% for all models.
Year/Period (DOY)
AlgorithmrR2BP Day (DOY)
2019/135–225
DBBL = −0.3786 + 0.0030*DOY0.939190
DBLL = −1.0039 + 0.0063*DOY0.994
DBBL = 0.2025 + 0.0571*ln(DBplant)95.8
DBLL = −0.0127 + 0.1799*DBplant0.988
2020/140–241
DBBL = −0.2467 + 0.0021*DOY0.963181
DBLL = −0.5166 + 0.0033*DOY0.972
DBBL = 0.1971 + 0.0641*ln(DBplant)95.8
DBLL = −0.0277 + 0.2002*DBplant0.997
2021/146–225
DBBL = −0.4634 + 0.0032*DOY0.963195
DBLL = −1.0478 + 0.0062*DOY0.909
DBBL = 0.2028 + 0.0618*ln(DBplant)95.6
DBLL = −0.0347 + 0.2332*DBplant0.996
Table 6. Relationship between leaf dry weight (g) and leaf area (m2, LAIR method) per bine for the growth period of 2019–2021. The models are set for the average bine on the plant. DOY—Day Of Year, n—number of variables. Confidence level 95% for all models.
Year Period (DOY) Linear Modelrn
2019–2021up to 180LABL = 0.0036 + 0.0176*DBBL0.98257
average LALL = −0.0003 + 0.0186*DBLL0.95827
LALtotal = 0.0009 + 0.0184*DBLtotal0.98857
from day 180 onwardsLABL = −0.0278 + 0.0218*DBBL0.89272
LALL = 0.0180 + 0.0127*DBLL0.95270
LALtotal = 0.0115 + 0.0145*DBLtotal0.96572
LABL—Leaf area of bine leaves (BL) on the individual hop bine (m2); LALL—Leaf area of lateral leaves (LL) (m2); LALtotal—Leaf area of bine and lateral leaves (Ltotal) (m2); DBBL—Dry biomass (g) of bine leaves (BL); DBLL—Dry biomass (g) of lateral leaves (LL); DBLtotal—Dry biomass (g) of bine and lateral leaves.
Disclaimer/Publisher’s Note: The statements, opinions and data contained in all publications are solely those of the individual author(s) and contributor(s) and not of MDPI and/or the editor(s). MDPI and/or the editor(s) disclaim responsibility for any injury to people or property resulting from any ideas, methods, instructions or products referred to in the content.

