Article

Distribution Features and Health Risk Assessment of Phthalate Pollutants in Facility Soil and Agricultural Products in Xinjiang, China

1
Turpan Experimental Station, Xinjiang Academy of Agricultural Sciences, Turpan 838000, China
2
Institute of Agricultural Quality Standards and Testing Technology Research, Xinjiang Academy of Agricultural Science, Urumqi 830091, China
*
Author to whom correspondence should be addressed.
These authors contributed equally to this work.
Agronomy 2025, 15(4), 821; https://doi.org/10.3390/agronomy15040821
Submission received: 23 February 2025 / Revised: 8 March 2025 / Accepted: 24 March 2025 / Published: 26 March 2025
(This article belongs to the Section Agroecology Innovation: Achieving System Resilience)

Abstract

:
To determine the phthalic acid ester (PAE) contents within the soil and agricultural products of facility agriculture in Xinjiang Province, we detected 16 kinds of PAE compounds within 249 soil samples and 203 agricultural product samples through gas chromatography–mass spectrometry. Five PAEs, namely DMP, DEP, DBP, DEHP, and DIBP, were identified in the soil. Their detection rates were found to range from 84.7% to 100%, with total concentrations spanning from 7.29 to 1064.1 μg kg−1 and a mean concentration of 111.8 μg kg−1. The primary PAE pollutants obtained in the soil included DBP, DEHP, and DMP, which accounted for 49.2%, 27.0%, and 12.4% of the total content, respectively. In the agricultural products, six PAEs were detected: DEHP, DBP, DIBP, BMPP, DPP, and DNOP, with detection rates from 3.0% to 46.8% and total contents varying from ND to 5140 μg kg−1 (mean of 637.60 μg kg−1). Among them, DBP, DNOP, and BMPP were the major PAE contaminants in the agricultural products. As demonstrated by a human health risk evaluation, dietary intake of PAEs constituted the primary route of exposure to both non-carcinogenic and carcinogenic risks. DBP and DNOP posed the greatest non-carcinogenic risks to both adults and children; however, the non-carcinogenic risk values for the five PAE congeners in the study area were all less than 1. The carcinogenic risk associated with DEHP was lower than the USEPA-recommended level of carcinogenic risk. Based on these findings, the PAE contents in soil and agricultural products within our study area are not harmful to human health.

1. Introduction

Phthalic acid esters (PAEs) are synthetic, environmentally relevant, hormone-like organic compounds. They are commonly utilized as plasticizers or additives in the plastic product industry, including applications in films, pesticides, children’s toys, and packaging bags, enhancing the flexibility and plasticity of plastic materials [1,2]. Due to their association with the plastic matrix through weak hydrogen bonds and van der Waals forces, PAEs exhibit poor stability and can readily migrate into the environment, leading to the contamination of soil, water, and air [3,4,5]. Research has shown that certain PAEs possess carcinogenic, teratogenic, and mutagenic properties, can persist in the environment for extended periods, exhibit a degree of bioaccumulation, and may ultimately accumulate in the human body via the food chain and other pathways, inducing their human health risk [6,7]. Dimethyl phthalate (DMP), dibutyl phthalate (DBP), diethyl phthalate (DEP), di(2-ethylhexyl) phthalate (DEHP), butyl benzyl phthalate (BBP), and n-di-octyl phthalate (DNOP) are recognized to be priority controlled contaminants by the U.S. Environmental Protection Agency (EPA) and the European Union [8,9,10]. Notably, DEHP and BBP are potential human carcinogens [11,12,13]. Additionally, DMP, DBP, and DNOP are identified to be significant contaminants in China [14,15]. Consequently, PAEs have emerged as organic pollutants of global concern.
Facility agriculture is a type of agricultural production mode that provides a suitable growing environment for crops by means of science and technology to obtain greater economic benefits. Different types of greenhouses, such as tertile greenhouses, solar greenhouses, and plastic arch sheds, are used, among which solar greenhouses and plastic arch sheds are widely used in actual production. China is a leading producer of facility agriculture. From 2000 to 2020, the area dedicated to agricultural plastic greenhouses increased by 42.4%, representing 85% of the global total plastic greenhouse area [16,17]. The development of facility agriculture in Xinjiang began in the mid- to late 1980s and has experienced rapid growth over the past decade. By 2023, the area of facility agriculture reached 2 million mu (133,300 hectares), establishing itself as a significant industry, second only to the four major sectors of grain, cotton, forestry, and animal husbandry.
Agricultural film mulch is a main PAE source within agricultural soil [18,19]. However, during facility agriculture production, extensive plastic mulch and shed film are utilized, and the facility environment has high temperature, high humidity, and is a relatively enclosed space. PAEs in the environment are likely to migrate into the soil and agricultural products, resulting in soil and agricultural product pollution. Most studies have shown that the PAE contents within greenhouse soil are generally higher than in open farmland, forestland, grassland, and other soils [8,20,21], and the PAE contents within plastic greenhouse vegetables are higher compared with open-air vegetables [22,23]. In addition, studies have reported that the higher incidence of PAEs is related to temperature, which promotes the transfer of pollutants from plastic mulch to soil [24]. Owing to the high temperature in greenhouses, PAE contents within the air in plastic greenhouses are significantly greater than that in open spaces, which promotes PAE accumulation in vegetables [23].
Currently, soil and agricultural products in plastic greenhouses across the country exhibit varying degrees of pollution by PAEs. The soil total PAE content in a plastic greenhouse in Beijing ranged between 0.14 and 2.13 mg kg−1 (mean of 0.99 mg kg−1). In vegetables, the total PAE content was 0.15–6.94 mg kg−1 (mean of 1.49 mg kg−1) [25]. The average PAE contents in soil and vegetables from facility agriculture in Southwest China were found to be 0.951 and 2.458 mg kg−1, respectively, with DEHP and DnBP being predominant [26]. In the northeast black soil area, the maximum concentration of 15 types of PAEs within the surface soil in facility agriculture reached 4.90 mg kg−1 [24]. Furthermore, the highest PAE content within greenhouse soil in Shandong Peninsula was recorded at 35.4 mg kg−1 [27]. Therefore, increased attention must be given to the PAE contamination of soil and agricultural products in plastic greenhouses.
Phthalate pollution in farmland soil shows marked regional variations. The levels and key components of PAEs in soil can differ based on land use types and local climatic factors. The ecological climates, soil characteristics, and agricultural methods of northern Xinjiang and southern Xinjiang are notably different. The concentrations and health risks related to PAEs in the soil and agricultural products of protected agriculture remain unknown. We gathered 249 agricultural soil samples together with 204 agricultural product samples from 10 prefectures and 35 cities, counties, and townships in Xinjiang. The residual concentrations of 16 PAEs were measured to examine the PAE contamination and distribution patterns within soil and agricultural products. Both non-carcinogenic and carcinogenic risks induced by PAEs to residents were assessed through both non-dietary and dietary exposure pathways, and the main exposure routes related to the health effects of PAEs were identified to lay a scientific foundation for managing and controlling phthalate pollution within this area.

2. Materials and Methods

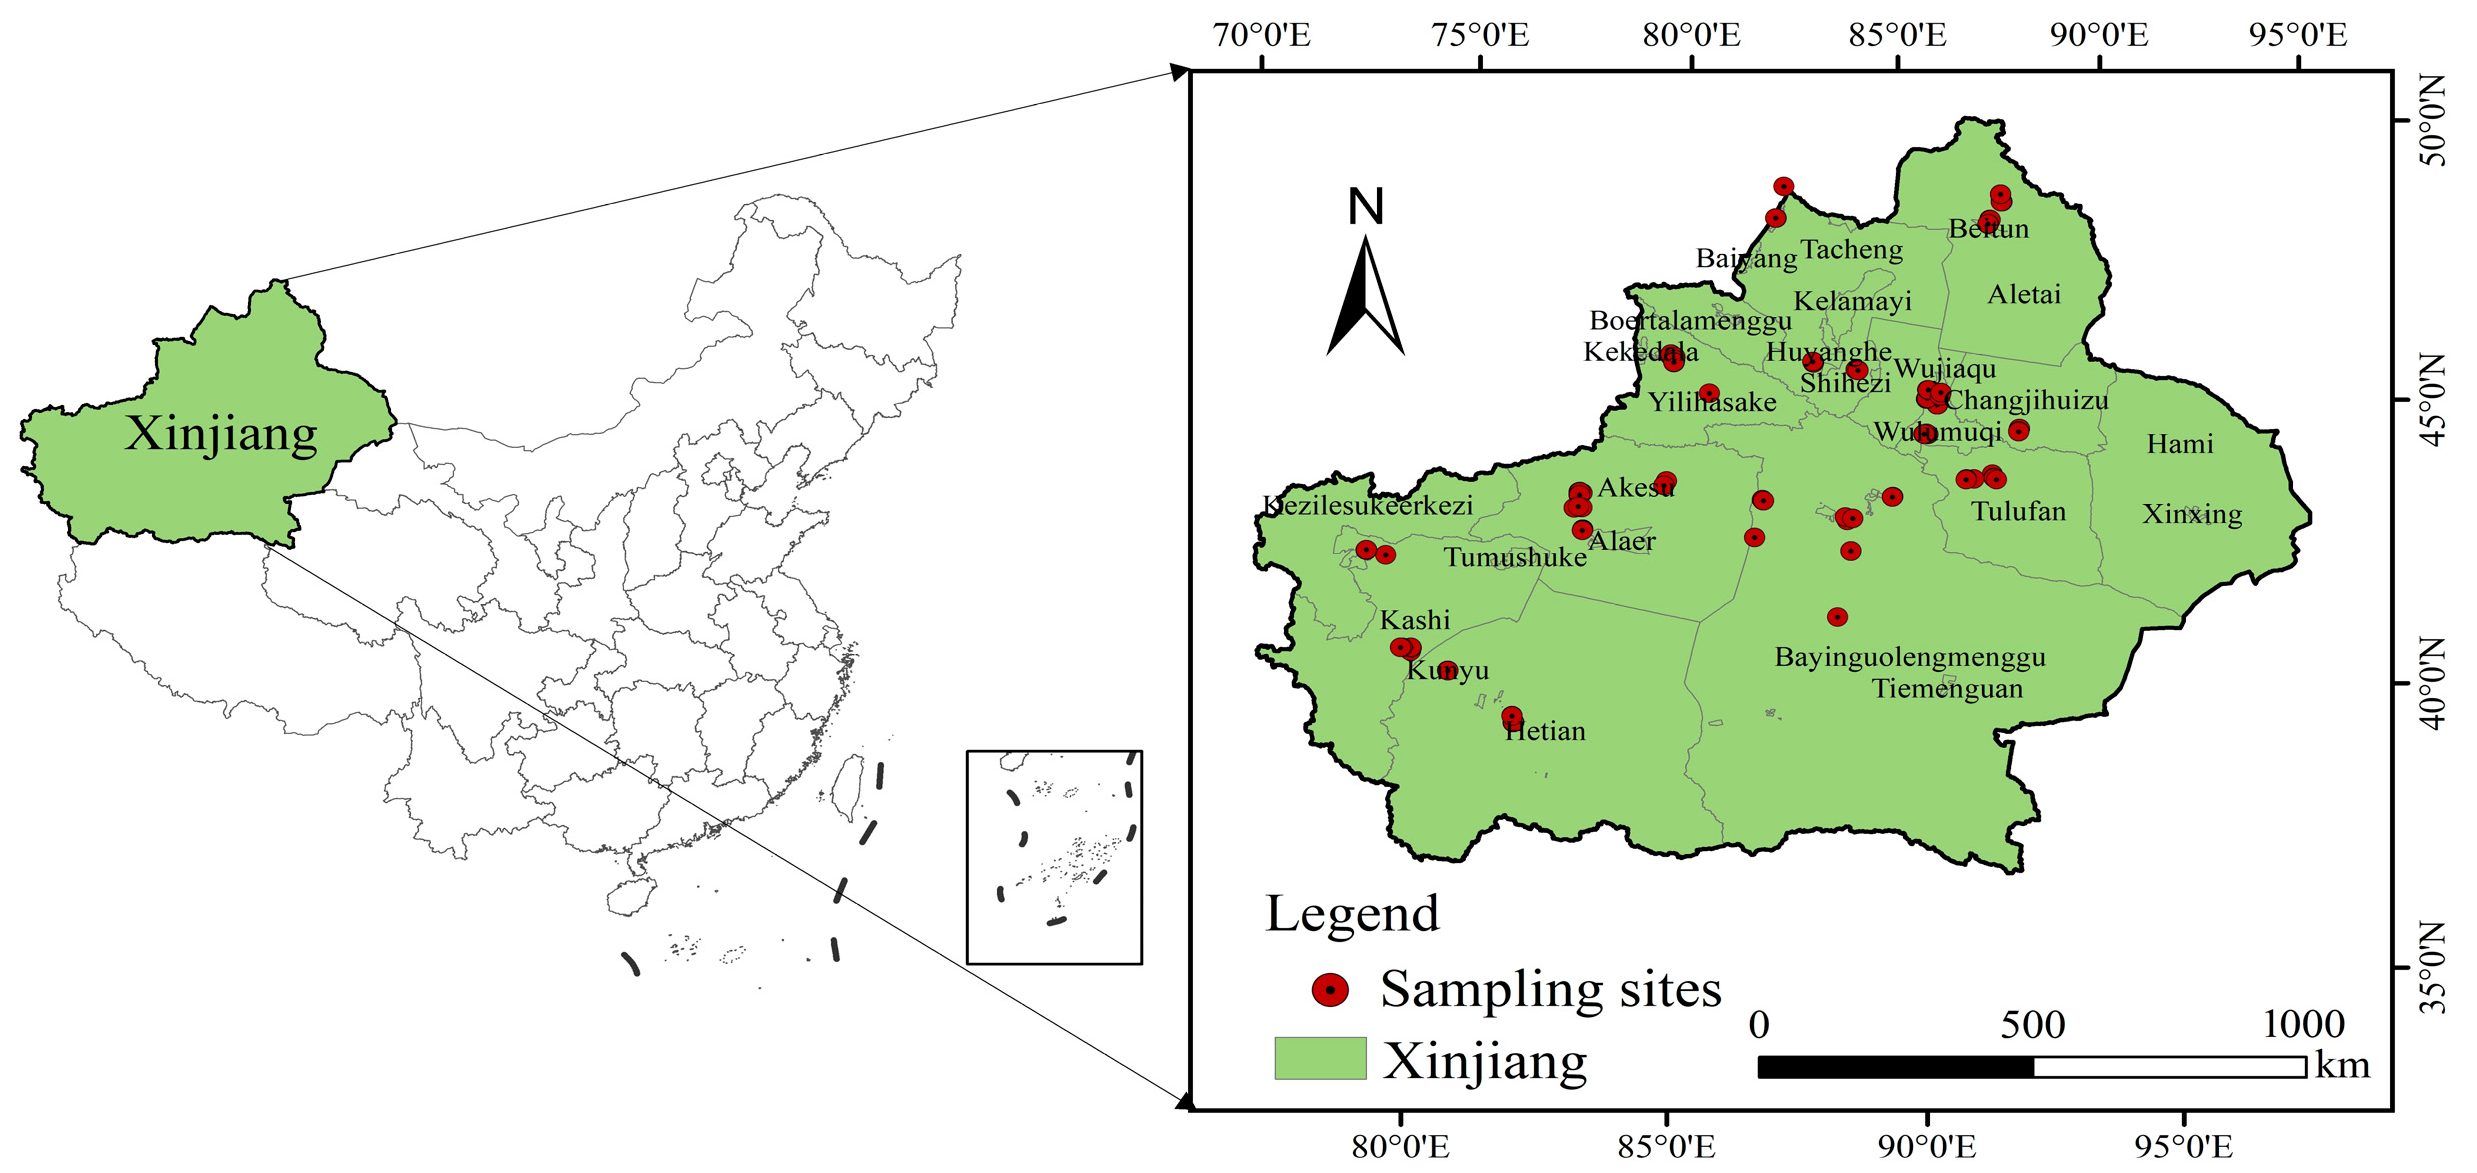
2.1. Sample Collection

During April–June 2023, 249 soil samples and 203 vegetable samples were collected from 10 prefectures and 35 cities, counties, and townships in Xinjiang. Specifically, 113 and 93 soil and agricultural product samples, respectively, were obtained from facilities in southern Xinjiang, while 136 and 110 soil and agricultural product samples, respectively, were gathered from facilities in northern Xinjiang (Figure 1). The collected samples included cucumber, tomato, peppers, cowpea, eggplant, and leafy vegetables. The samples were collected on sunny days, and greenhouses that had just been irrigated and fertilized were not set as sampling points. We obtained soil samples at 0–20 cm depths using the multipoint mixing method. Impurities such as stones, branches, and fallen leaves were removed before the samples were air-dried in the shade and then filtered with a 2 mm nylon screen using the quartering method. An amount of 0.5 kg was retained and stored in a brown wide-mouth bottle under −20 °C to analyze the PAEs. All agricultural product samples were taken from the same sampling locations as the soil. About 2 kg of each product was collected and placed into a cloth bag before delivery to the laboratory, where soil and other surface impurities were washed off by running water and then by distilled water. This was followed by freeze-drying, grinding, and storage under −20 °C.

2.2. Sample Extraction and Clean-Up

PAEs from the soil and agricultural products were separated and purified, using the method established by Wang et al. [28,29]. A soil sample weighing 10.00 g was placed in a triangular bottle containing 40 mL of acetonitrile and 10 mL of water and left to soak for 12 h. The mixture was shaken for 2 h at 200 r min−1 on a shaker, and then transferred to a 100 mL glass centrifuge tube before 5 min of centrifugation at 4 °C and 3500 r min−1. After centrifugation, the supernatants were passed through filter paper in the stoppered cylinder, which contained 5–6 g of sodium chloride, followed by vigorous shaking and 30 min of standing. Following layering, 20 mL of the upper organic phase was added to the 150 mL round-bottom flask before evaporation to nearly dryness through rotary evaporation. Subsequently, after adding 3 mL of hexane, the resultant mixture was purified using a floret glass silica column, eluting with the acetone–n-hexane mixture (10:90). The collected elution was subjected to nitrogen blow-down until nearly dry. The residue was then added to 5 mL of n-hexane and transferred to a 2 mL automatic sample injection bottle for measurement. For the agricultural product samples, 20 g was taken and put into a 100 mL glass centrifuge tube, then homogenized at high speed for 2 min with 40 mL of acetonitrile. After centrifugation, the upper liquid was filtered through filter paper into a measuring cylinder containing 5 to 6 g of sodium chloride. The resultant mixture underwent vigorous shaking for 1 min before 15 min of standing. Of the mixture, 10 mL was transferred into a 150 mL round-bottom flask. The mixture was evaporated until almost dry, followed by the addition of 3 mL of n-hexane. The purification method was identical to that applied for the soil samples.

2.3. Instrumental Analysis

The PAE contents were examined with the Agilent 7890B gas chromatograph (GC) using the Agilent 5977A mass selective detector (Agilent, Santa Clara, CA, USA).
Chromatographic conditions: The chromatographic column (30 m × 0.25 mm, 0.25 µm) was DB~1701MS, and helium was the carrier gas, at a flow rate and injection temperature of 1.2 mL/min and 280 °C. The pulse was not split, the carrier gas was turned off, the transmission line temperature was 300 °C, and the injection volume was 2 µL. The column temperature was maintained under 60 °C for 2 min, which increased to 150 °C for a 2 min duration at 15 °C min−1, and then increased to 290 °C for a 11 min duration at 10 °C min−1.
Mass spectrum conditions: Operated in a multiple reaction monitoring model. The ion source temperature was 250 °C, the quadrupole temperature was 180 °C, the collision gas was argon, and the pressure was 0.133 Pa. The mass spectrum parameters of 16 plasticizers were listed in Table S1.

2.4. Quality Assurance and Quality Control

For minimizing background contamination, we immersed glassware into the potassium dichromate–sulfuric acid solution prior to utilization, and later washed it by deionized water before drying. We utilized the external standard approach for quantitatively analyzing the PAEs within the samples, and the recovery rates of 16 PAEs were 81.5–117.9%, with relative standard deviations of 2.5–11.5%. Three blanks were prepared for different samples, with all blank test results below the detection limit. The correlation coefficients of the standard curves for each phthalate ester (PAE) exceeded 0.99. In this study, the detection limits for the PAEs were 0.01–3.53 μg/kg.

2.5. Health Risk Assessments

DMP, DEP, DBP, and DIBP are non-carcinogenic substances in PAE homologs, whereas DEHP and BBP are carcinogenic ones. The present work evaluated the non-carcinogenic and carcinogenic risks induced by PAEs ingested by residents in the study area through non-dietary routes (soil ingestion, skin contact, and respiratory ingestion) and dietary routes according to the USEPA’s recommended approach. The evaluation model is as follows:
A D D intake = C 1 × I V × E F 1 × E D 1 B W × A T
A D D ingest = C 2 × I S × E F 2 × E D 2 B W × A T × C F
A D D dermal = C 2 × S A × A F × A B S × E F 2 × E D 2 B W × A T × C F
A D D inhale = C 2 × E F 2 × E D 2 × I i P E F × A T × 10 3
C R = ( A D D i × C F S )
H Q = A D D i RfD
where ADDi (mg kg−1 d−1) represents the mean daily PAE intake through dietary and non-dietary routes. ADDintake indicates PAE intake through food (mg kg−1 d−1), ADDingest indicates PAE intake through soil (mg kg−1 d−1), ADDdermal indicates PAE intake through dermal contact (mg kg−1 d−1), and ADDinhale indicates PAE intake through respiration (mg kg−1 d−1). C1 and C2 represent the concentrations of the target compounds in agricultural products and soil (mg kg−1), respectively. HQ represents non-carcinogenic risk, and CR represents carcinogenic risk. The other parameters and detailed values [30,31] can be observed in Table 1. For non-carcinogenic substances, if HQ < 1, there is no non-carcinogenic risk. If HQ is greater than 1, there is a risk. For carcinogens, CR < 10−6, 10−6–10−4, and >10−4 indicate low/negligible, acceptable, and very low cancer risk, respectively.

2.6. Statistical Analysis

This work employed Microsoft Office Excel 2010 for processing the experimental data, and SPSS 19.0 was used for one-way ANOVA, with p < 0.05 indicating significance. Mapping and visualization were performed using ArcGIS 10.8 and OriginPro 9.8.

3. Results and Discussion

3.1. Content and Distribution Characteristics of PAEs in Soil

3.1.1. Content and Composition of PAEs in Soil

The analysis was conducted on 16 PAEs in 249 soil samples collected from the agricultural facility base in Xinjiang, revealing the presence of PAE compounds in all samples, as detailed in Table 2. Five PAEs were identified, with detection rates between 84.7% and 100%. The total PAE concentrations varied from 7.29 to 1064.1 μg kg−1, with the average and median contents being 111.8 and 54.7 μg kg−1, respectively. Four out of the six priority compounds were found: DMP, DEP, DBP, and DEHP, with their total contents being 6.88–1063.5 μg kg−1, and their average contents being 104.70 μg kg−1. Among these individual compounds, DBP exhibited the highest concentration, averaging 68.5 μg kg−1, followed by DEHP, DMP, and DIBP, with average concentrations of 22.1, 11.4, and 7.09 μg kg−1, respectively; DEP presented the lowest concentration, averaging 2.74 μg kg−1. The DBP and DMP contents surpassed the soil PAE control standards formulated by the US Environmental Protection Agency, with exceedance rates of 16.1% and 16.9%, respectively.
The current research on PAE contamination in soil within plastic greenhouses in China is relatively extensive, revealing significant variations in contamination levels and primary PAE components across different regions. Generally, PAEs in the soils from facilities in Xinjiang are relatively low, with concentrations comparable to those found in the Shandong Peninsula (1.94–35.4 mg kg−1) [27], Beijing (0.14–2.13 mg kg−1) [25], Northeast China (1.37–4.90 mg kg−1) [24], and Nanjing (0.40–6.20 mg kg−1) [31]. The primary PAE contaminants identified from the soil in our study area were DBP, DEHP, and DMP, which is consistent with the findings from prior studies [13,32,33]. This prevalence is attributed to these three compounds being significant additives in agricultural films [34,35]. Consequently, exceedances of DEHP, DBP, and DMP in agricultural soils have been documented in various regions. For instance, exceedance rates for DBP and DMP in agricultural soils in Hebei, Shandong, Henan, and Tianjin, within the Huanghuaihai region of China, were reported as 67.6% and 30.1%, respectively [36]. In surface soils of Beijing, the exceedance rates for DMP and DBP were both 100%, while the exceedance rate for DEHP was 4.84% [37]. Some soil samples from facilities in Xinjiang also surpassed the soil PAE control standards formulated by the US Environmental Protection Agency for DBP and DMP. Although these samples did not exceed the remediation standards, they still require attention and consideration.
Compared to agricultural soils in other countries, the contamination level of PAEs in the protected agricultural soils in Xinjiang was relatively low. Studies have reported that the total concentrations of 13 phthalates in greenhouse soil used for tomato cultivation in Antalya, Turkey, ranged from 0.21 to 2.48 mg kg−1, while in open-air tomato field soil, the range was between 0.24 and 1.25 mg kg−1. The contamination level of phthalate esters (PAEs) in greenhouse soil was significantly higher than that in open-air soil [38]. In agricultural soils of Paris, France, the total PAE contents ranged from 103 to 1658 μg kg−1, with an average concentration of 841 μg kg−1. DBP and DEHP were identified as the primary pollutants [39]. DEHP was also the dominant contaminant in agricultural soils in India, exhibiting a relatively high concentration with an average value of 1.0 mg kg−1 [40]. In vegetable greenhouse soils in Tunisia, the total concentrations of DBP, DEHP, DMP, and DPP ranged from 2.40% to 11.05% [41]. These findings indicate that PAE contamination is present in agricultural soils both domestically and internationally, emphasizing the necessity of implementing effective strategies for the prevention, control, and remediation of PAEs.

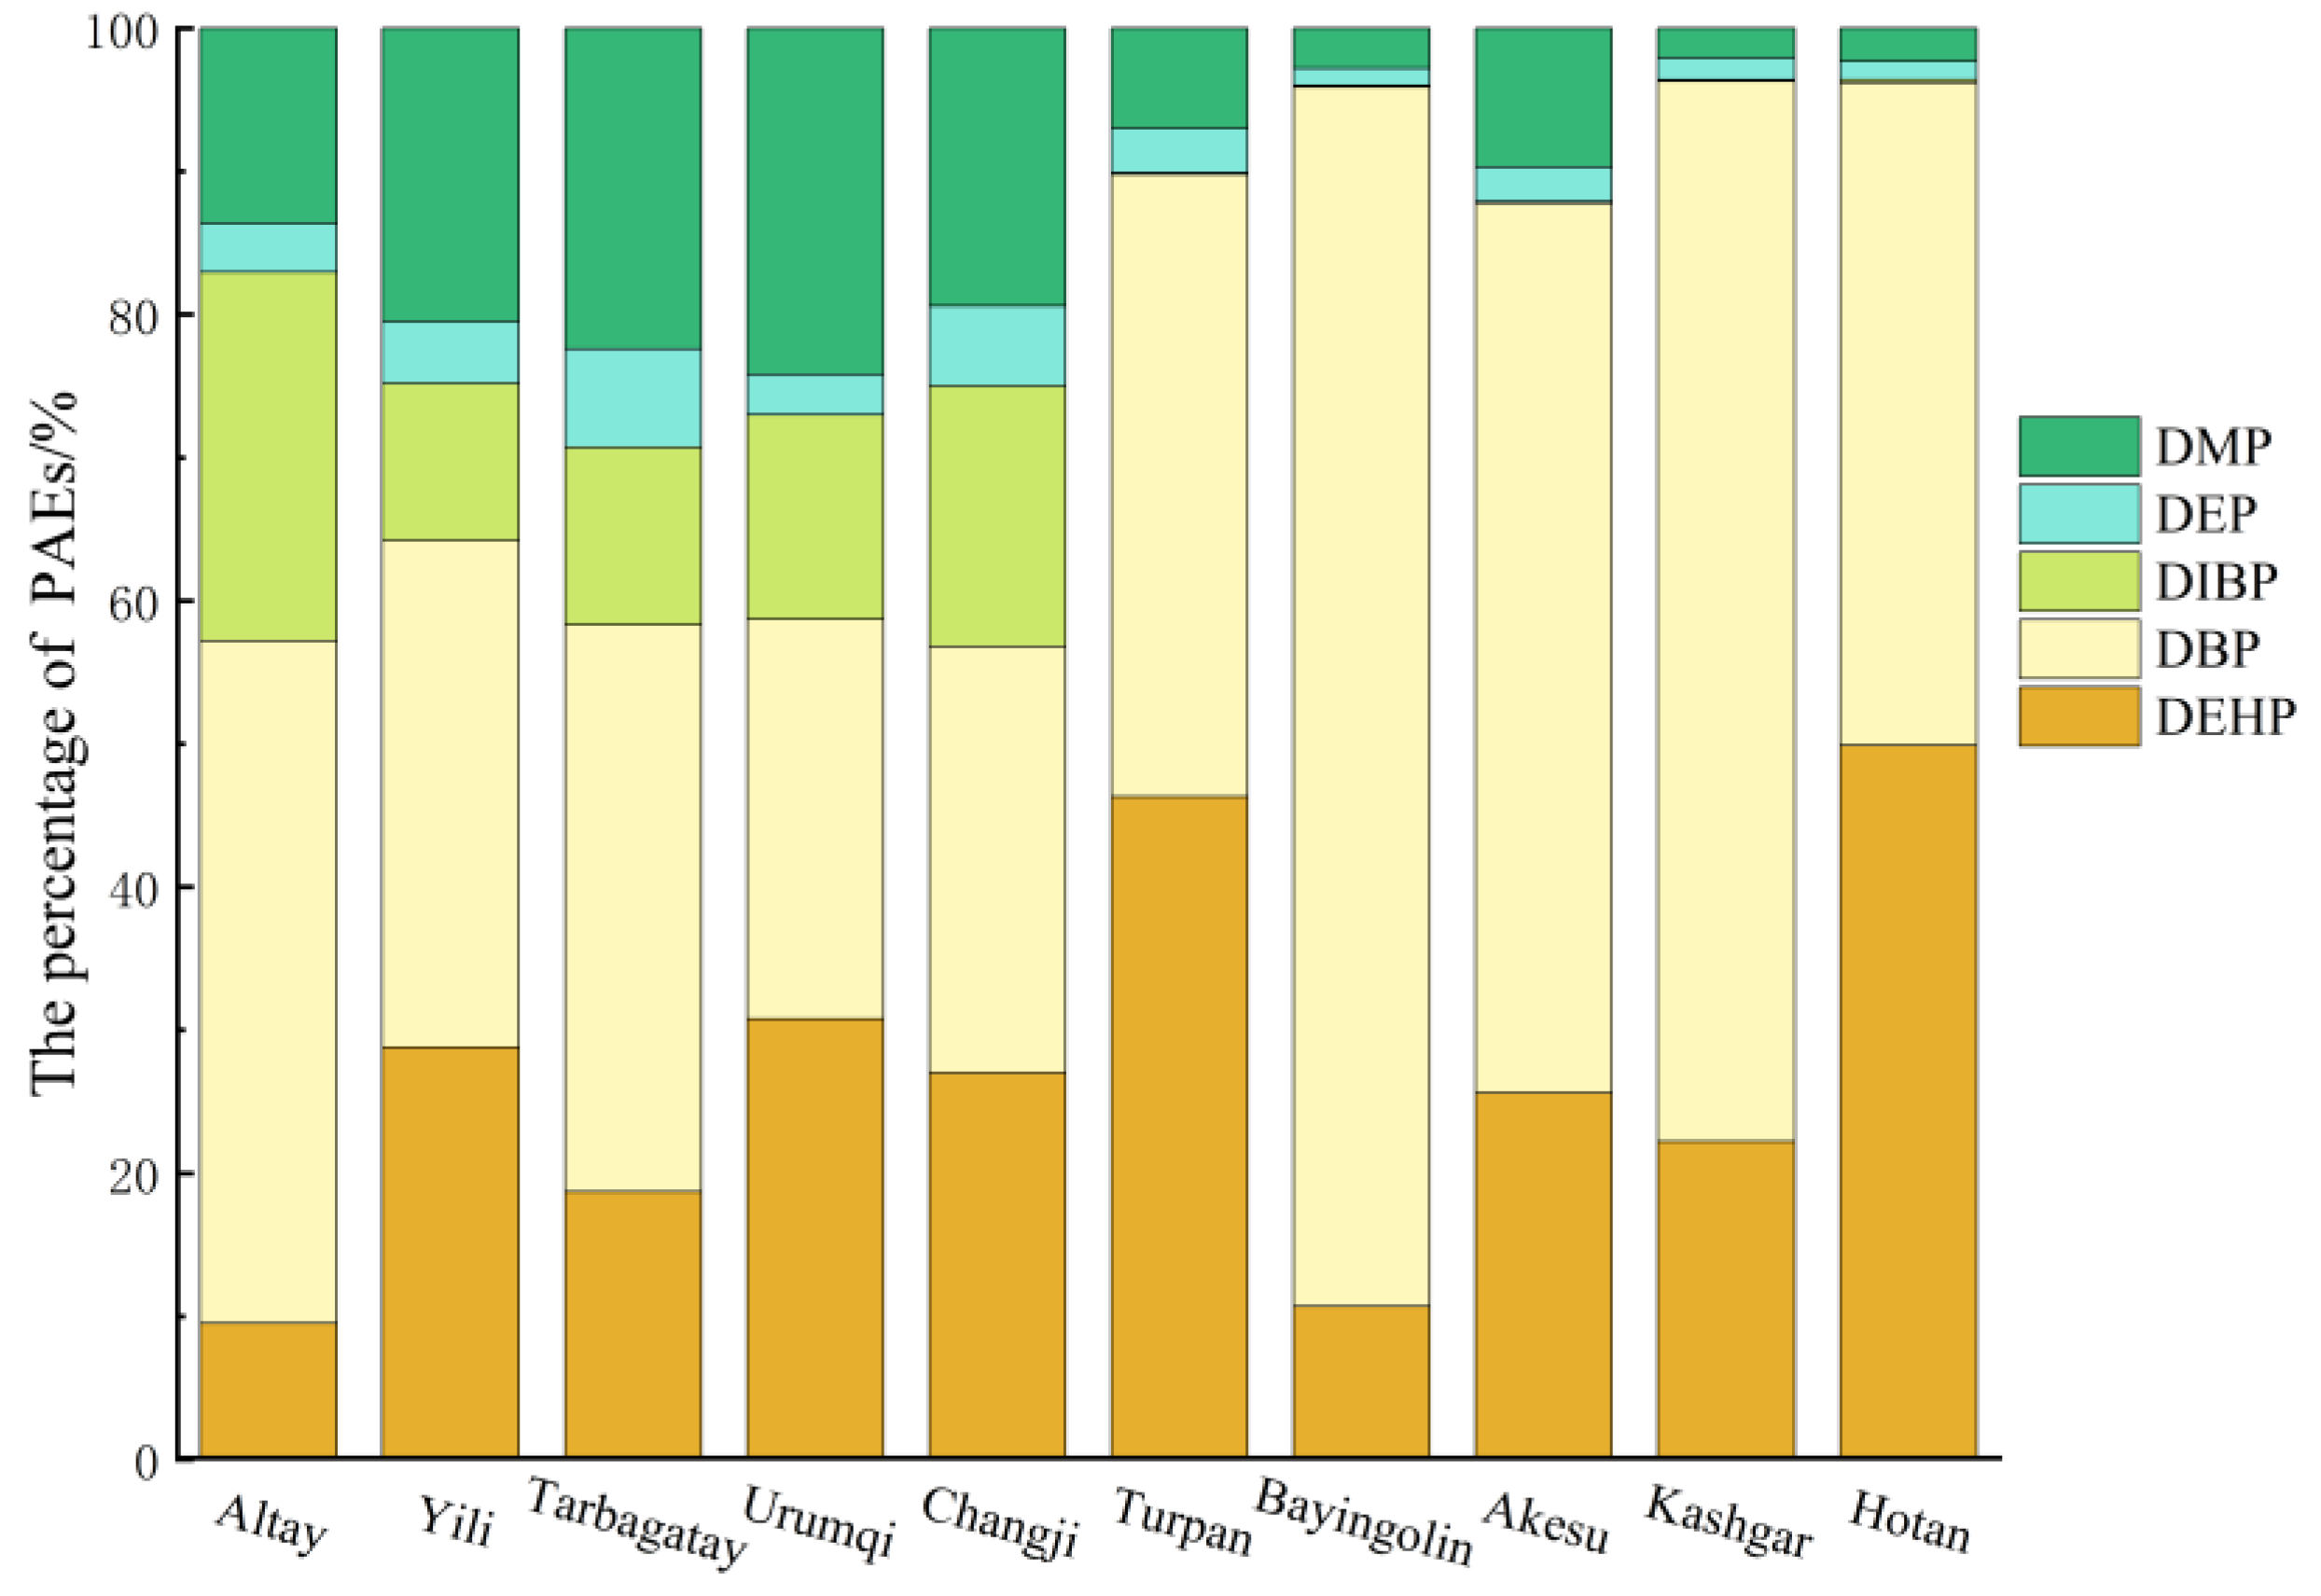
3.1.2. Content and Distribution of PAEs in Soil Across Different Regions

As depicted in Figure 2, significant discrepancies existed in the PAE contents in the soil samples from facility agriculture between northern and southern Tianshan Mountain, as well as among different prefectures. The soil PAE contents from facility agriculture in northern Xinjiang ranged from 7.29 to 327.82 μg kg−1 (mean of 78.97 μg kg−1). In contrast, the contents in southern Xinjiang range from 7.33 to 1056.76 μg kg−1, (mean of 151.27 μg kg−1). Overall, PAE distribution tends to increase in southern Xinjiang and decrease in northern Xinjiang, with an obvious difference noted (p < 0.05). This variation may be linked to climatic conditions. Ambient temperature is positively related to PAE emissions, suggesting that greater temperatures promote pollutant transfer from plastic mulch to soil [24,42]. Xinjiang is divided by the Tianshan Mountains into southern and northern regions. The northern region, situated at a higher latitude, receives less solar radiation and has a lower average temperature. The elevated temperatures in the southern region may have expedited the release of PAEs from the mulch film into soil. Furthermore, the distribution of PAEs in greenhouse soils across various prefectures in Xinjiang displays distinct regional characteristics (Figure 3). The mean levels of ∑PAEs in the soil of greenhouses across different prefectures were as follows: Bayingolin Mongol Autonomous Prefecture (341.24 μg kg−1) > Urumqi (134.48 μg kg−1) > Kashgar (117.43 μg kg−1) > Turpan (111.61 μg kg−1) > Altay (71.96 μg kg−1) > Changji (70.42 μg kg−1) > Ili (64.74 μg kg−1) > Aksu (50.04 μg kg−1) > Tarbagatay (46.02 μg kg−1) > Hotan (33.44 μg kg−1). The soil ∑PAE contents in Bayingolin Mongol Autonomous Prefecture were significantly higher than in the other prefectures (p < 0.05).
Significant regional variations in phthalate congeners were observed (Figure 3). The soil DBP content in Bayingolin Prefecture was significantly higher relative to the other prefectures (p < 0.05), ranging from 31 to 974.72 μg kg−1 (mean of 276.90 μg kg−1), which is three times the mean concentration of 68.50 μg kg−1 noted for the entire Xinjiang region. The Kashi region recorded the second highest average DBP concentration in the soil at 86.97 μg kg−1, while all other regions exhibited concentrations below the Xinjiang average. The average DEHP concentration in Xinjiang soil was found to be 22.10 μg kg−1, with Turpan, Urumqi, Bayingolin, and Kashgar exhibiting levels above this average. Turpan had the highest DEHP content (51.65 μg kg−1), followed by Urumqi (41.35 μg kg−1). The contents in Bayingolin and Kashgar were 34.94 and 26.06 μg kg−1, respectively, while Altai had the lowest concentration at 6.86 μg kg−1. The distribution of DIBP in the soil across various prefectures was primarily centered in Altay, Ili, Tacheng, Urumqi, and Changji in northern Xinjiang. The average DIBP concentration in this region was 12.67 μg kg−1, compared to only 0.11 μg kg−1 in southern Xinjiang, highlighting a notable disparity in its soil contents between the regions. The greatest DMP content was recorded in Urumqi soil (32.61 μg kg−1), significantly differing from other prefectures (p < 0.05). Additionally, the DMP concentrations in soil were generally higher in the northern region and lower in the southern area. In northern Xinjiang, the DMP levels ranged from 9.81 to 32.61 μg kg−1 (mean of 15.94 μg kg−1); the southern Xinjiang levels were 0.77–7.83 μg kg−1, averaging 5.03 μg kg−1. The highest average DEP concentration was observed in the northernmost area of Tarbagatay Prefecture, at 5.91 μg kg−1, while the lowest was in the southernmost area of Hotan region, at 0.42 μg kg−1, exhibiting an obvious difference (p < 0.05), but other prefectures were not significantly different. Figure 4 indicates that DBP was the dominant PAE congener in the soil across all prefectures, with content ratios between 27.9% and 87.2%, averaging 49.2%. DEHP and DMP followed as the next most prevalent PAEs, with content ratios of 9.5% to 46.3% and 2.1% to 24.2%, and average values of 27.0% and 12.4%, respectively. The proportion of DIBP in the soil varied from 0.1% to 25.7%, averaging 8.2%; northern Xinjiang had a DIBP proportion of 16.3%, while southern Xinjiang recorded 0.12%. DEPs constituted the smallest proportion, ranging from 1.2% to 6.9%, with an average of 3.2%. The four compounds—DBP, DMP, DEHP, and DIBP—occupied 97.5% of the ∑PAEs, suggesting their role as the primary PAE pollutants in the soil of Xinjiang facilities.
The observed regional differences in the total PAE contents and concentrations of individual compounds in greenhouse soil across various provinces may be attributed to multiple factors, including variations in regional climate, the types of agricultural films used, soil properties, the characteristics of specific compounds, planting intensity, and agricultural inputs. According to Cui et al. [43], the PAE content in biodegradable mulch films was found to exceed that in polyethylene mulch films, with relatively higher PAE release rates. Soil physicochemical properties, such as the organic matter content, pH, and clay type, substantially affect the adsorption and degradation of PAEs within soil. As hydrophobic organic pollutants, PAEs are adsorbed and concentrated by the soil organic matter [44,45,46]. However, increases in the soil pH lead to enhanced soil organic matter hydrophilicity, which subsequently reduces the soil’s adsorption capacity for PAEs and facilitates their migration within the soil [47]. The PAE concentrations among diverse areas are also associated with soil microbial characteristics and soil enzyme activity. Research has shown that PAEs can be completely mineralized through the action of relevant microbial enzyme systems [48,49]. Compounds that have short alkyl chains (e.g., DEP, DMP) can be more easily biodegraded and mineralized by microorganisms compared to those with long alkyl chains (e.g., DEHP) [50,51]. Additionally, higher planting intensities and agricultural inputs are associated with increased PAE pollution [36,52].

3.2. Contents and Distribution Characteristics of PAEs in Agricultural Products

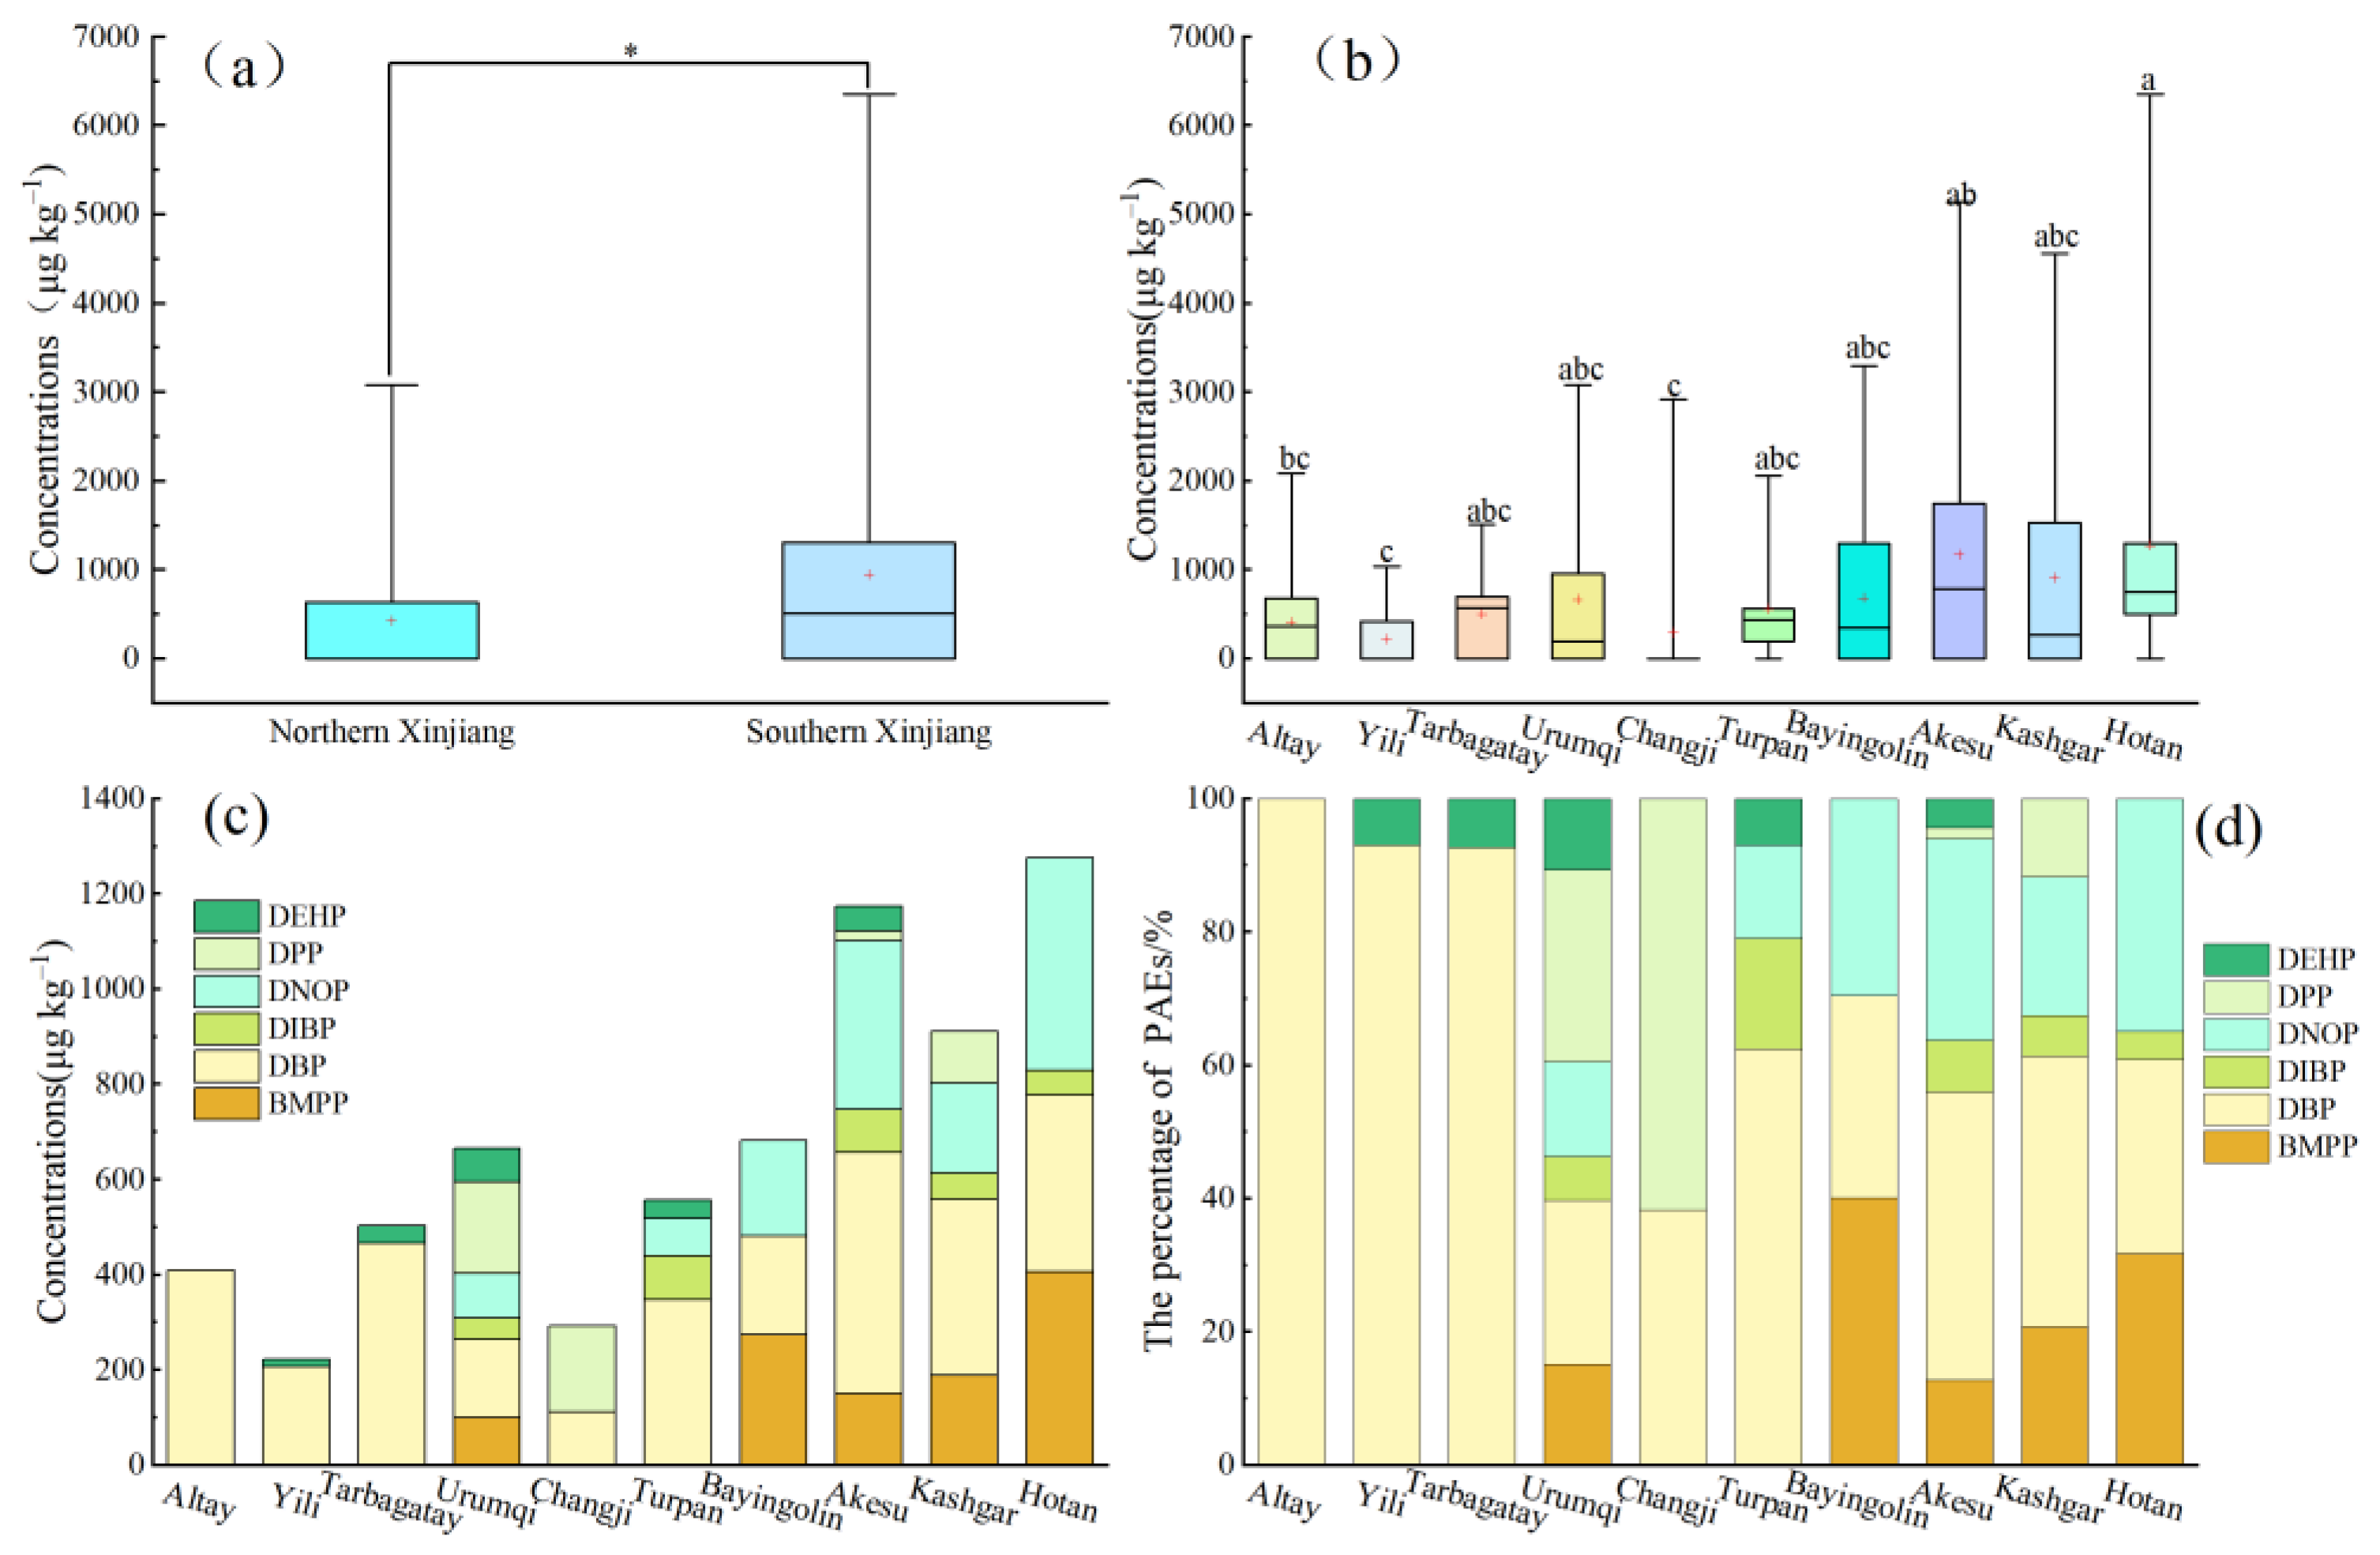
3.2.1. Contents and Compositions of PAEs in Farm Products

As indicated in Table 3, six PAEs were identified in facility agricultural products: DEHP, DBP, DIBP, BMPP, DPP, and DNOP. Their detection rates ranged from 3.0% to 46.8%, while their total contents varied from ND to 5140 μg kg−1 (mean of 637.60 μg kg−1). Among the individual compounds, DBP exhibited the highest average content and detection rate at 314.56 μg kg−1 and 46.8%, respectively, reflecting similar composition characteristics to the soil. DNOP and BMPP showed the second highest levels (mean of 125.44 and 93.24 μg kg−1), and detection rates of 9.4% and 11.8%, respectively. DPP was the fourth highest (mean of 50.25 μg kg−1), but it had the lowest detection rate at 3.0%. The mean contents and detection rates for DEHP and DIBP were relatively low, recorded at 23.63 and 30.94 μg kg−1, respectively, with detection rates ranging from 3.0% to 4.9%.
PAEs are classified as a group of semivolatile, hydrophobic organic pollutants. When found in soil and air, PAHs can be taken up and stored by plants. The main method by which plant leaves acquire volatile and semivolatile organic compounds is through absorption from the atmosphere [53,54,55]. Wang et al. [56] indicated that crops grown in plastic greenhouses absorb more PAEs from the atmosphere compared to the soil, particularly in the edible portions of leafy and nightshade vegetables. The three compounds BMPP, DPP, and DNOP, detected in agricultural products within our study area, were not found in the soil. Similarly, DMP and DEP, identified in the soil, were absent from the agricultural products. The PAE contents in the agricultural products exceeded those found in the soil, likely due to variations in the compositions of greenhouse film and mulch film, in addition to PAEs released from greenhouse film into the air, which are subsequently taken up and accumulated by vegetables and other crops. In addition to DBP, the primary soil components (DEHP and DIBP) were detected at low concentrations in the agricultural products, further supporting the notion that facility crops mainly absorb PAEs from the atmosphere, whereas DBP may serve as the predominant component of mulch films and greenhouse films.

3.2.2. Concentrations of PAEs in Agricultural Products in Different Regions

As illustrated in Figure 5, notable variations were observed in the PAE contents and compositions within the agricultural products in different areas. The PAE concentrations in the agricultural products from northern Xinjiang were 0–3080 μg kg−1, with a mean value of 427.61 μg kg−1. In contrast, the PAE concentrations in the agricultural products from southern Xinjiang varied from 0 to 6350 μg kg−1 (mean of 924.47 μg kg−1). Overall, the concentrations in the southern Tianshan Mountains were significantly higher relative to those in. the northern region (p < 0.05), which corresponds to the soil PAE distribution patterns. Among the prefectures, the greatest PAE contents within the agricultural products were recorded in Hotan Prefecture, reaching a maximum of 6350 μg kg−1 and an average of 1276.0 μg kg−1. Following this, Aksu Prefecture and Kashi Prefecture exhibited average concentrations of 1173.0 μg kg–1 and 910.5 μg kg−1, respectively. Conversely, Yili Prefecture displayed the lowest concentration, with an average of 222.9 μg kg−1.
The compositions of PAE congener compounds in the agricultural products exhibited significant regional variation. In Altay, only one compound, DBP, was detected, while both DBP and DEHP were identified in Ili and Tacheng. In Changji, only DBP and DPP were found, whereas 3 to 6 congeners were detected in the other regions. DBP was present in all prefectures, with concentrations ranging from 112.14 to 507 μg kg−1. The greatest DBP concentration was recorded in agricultural products from the Aksu region, measuring 507 μg kg−1 and occupying 43.2% of the total for that area. This was followed by Tarbagatay and Altay, with contents of 465.79 μg kg−1 and 409.13 μg kg−1, respectively, accounting for 92.7% and 100% of the total in their respective regions. BMPP and DNOP were primarily found in agricultural products from the southern Xinjiang regions of Bayingolin, Aksu, Kashgar, and Hotan, with contents of 150.67–406 μg kg−1 and 189–446 μg kg−1, respectively. The greatest contents were observed in Hotan, at 406 and 446 μg kg−1, representing 31.8% and 35% of the total, respectively.
Significant regional differences were evident in the total contents and compositions of individual PAEs in agricultural products across various areas. The PAE contents within agricultural products exceeded that in soil, while the PAE contents and compositions in agricultural products and soil were not significantly correlated. This observation aligns with the findings of Bai et al. [26]. This is likely because of differing climatic conditions and agricultural film types utilized at various geographical locations, which contribute to variations in PAE accumulation in agricultural commodities. High temperatures and sunlight can enhance PAE volatilization from agricultural films. The volatility of these compounds is influenced by their molecular weight; those with lower molecular weights are more volatile, while those with higher molecular weights exhibit reduced volatility [42,57]. The compositions and quantities of PAEs incorporated into plastic agricultural films from different manufacturers vary, encompassing various materials and thicknesses. Likewise, the concentrations and compositions released into the facility environment also differ, leading to variations in their absorption and accumulation by crops [58].

3.2.3. Concentrations of PAEs in Different Types of Agricultural Products

There are notable genetic variations in the absorption and accumulation of PAEs by various crops, which are influenced by the crop type and variety [59,60]. Figure 6 illustrates the significant differences in the PAE contents among various agricultural products. The average PAE contents within these products, listed from highest to lowest, are as follows: fruits (1548.89 μg kg−1) > root vegetables (1067.5 μg kg−1) > leafy vegetables (890.00 μg kg−1) and fruit vegetables (640.00 μg kg−1), with legume vegetables (612.81 μg kg−1) and nightshade vegetables (533.04 μg kg−1) having the lowest concentrations. The total PAEs in root and leafy vegetables exceeded those in other vegetable types, which may have resulted from their direct contact with soil and air. Additionally, Pan et al. [61] has indicated that the capacity of vegetables to absorb PAEs is closely linked to their variety, with distinct varieties exhibiting varying absorption capabilities. Regarding specific components, the DBP levels and detection rates in different agricultural products were relatively high, ranging from 220.31 to 627.78 μg kg−1 and from 37.5% to 56.7%, respectively. The mean DBP contents within various agricultural products, from highest to lowest, were as follows: fruits (627.78 μg kg−1) > leafy vegetables (473.33 μg kg−1) > nightshade vegetables (314.91 μg kg−1) > root and stem vegetables (297.5 μg kg−1) > pod vegetables (220.31 μg kg−1). BMPP was present in all agricultural products, except root vegetables, with concentrations ranging from 24.67 to 445.56 μg kg−1, and the highest levels detected in fruits. Since BMPP was absent from the soil of our study region, it is probable that the BMPP in agricultural products originates from the air. DNOP and DIBP were predominantly identified in legumes, leafy vegetables, melons, and fruits, but were not detected in roots or tubers. Higher DPP contents were detected in roots, tubers, and fruits; however, the detection rate was low.

3.3. Health Risk Assessments of PAEs

Table 4 shows the carcinogenic and non-carcinogenic risk levels to human health of the five priority compounds. The carcinogenic risk values for adults and children in the study area are 6.74 × 10⁻⁷ and 4.22 × 10⁻⁷, respectively. While the risk values for adults are higher compared to those for children, all risk values (CR) are below the carcinogenic risk level (CR > 10−6) recommended by the EPA. These findings indicate that the carcinogenic risk of DEHP compounds in the study area is very low. The non-carcinogenic indices (HQ) for adults and children are 3.56 × 10⁻² and 1.11 × 10⁻¹, respectively. Both values are less than 1 and within the acceptable standards, indicating that PAEs pose significant non-carcinogenic health hazards to the population. However, the non-carcinogenic risk induced by PAE compounds to children is one order of magnitude higher than that to adults, which is consistent with previous reports [36,62]. The analysis of the exposure pathways indicated that the carcinogenic and non-carcinogenic risks associated with PAEs from dietary intake surpassed those linked to other exposure routes. Additionally, their contribution to the overall carcinogenic and non-carcinogenic risks in both adults and children exceeded 99%. Several studies have shown that the dietary route serves as the primary source of carcinogenic and non-carcinogenic risks related to PAEs, with health hazards primarily arising from dietary intake [63,64,65]. Therefore, the implementation of effective measures to prevent the migration of PAEs into agricultural products is essential for protecting human health and the living environment. Although the health risks from PAEs via non-dietary routes are relatively low, it remains important to consider the long-term cumulative health risks associated with annual exposure in facility greenhouses. The greatest non-carcinogenic risks for both adults and children are attributed to DBP and DNOP, each contributing about 42%. DEHP follows as the next significant contributor, accounting for 15.8% of the risk for adults and children. DMP and DEP could not be measured from agricultural products and exhibited the lowest non-carcinogenic risks.
In real-world scenarios, individuals may be exposed to phthalates at low levels over extended periods, and accurately assessing the health risks of such long-term exposure presents challenges on the basis of current data. Additionally, agricultural environments contain multiple sources of phthalates, necessitating a comprehensive evaluation of human exposure levels that accounts for the contributions of various sources. Accurately tracking and quantifying exposure from all sources remains a difficult task. Nevertheless, life cycle assessment (LCA) methods can serve as a complementary approach for analyzing the content and release of phthalates in different agricultural inputs, thereby providing a focused framework for health risk assessments. Castagnoli et al. provided a comprehensive example of life cycle assessment applied to pollution scenarios, which offers additional insights into the environmental trade-offs associated with remediation strategies [66].
In summary, while the health risk level of phthalates in facility agriculture in Xinjiang is low, the potential for the long-term bioaccumulation of these substances should not be overlooked. Therefore, there is an urgent need for effective prevention and control measures to mitigate pollution levels. First, it is essential to strengthen the supervision of agricultural films, pesticides, fertilizers, and other inputs used in facility agriculture, strictly limiting the use of phthalate substances. Additionally, promoting the development and use of phthalate-free or low-phthalate alternatives by production enterprises is crucial to prevent phthalates from entering the soil and air at their source. Second, it is important to investigate efficient and safe degradation methods, such as identifying microorganisms capable of degrading phthalates and utilizing their metabolic activities to break down phthalates in the soil. In addition, it is also particularly important to explore remediation technologies that couple other advanced remediation methods with conventional strategies [67]. Finally, it is necessary to establish limit standards for phthalates in facility agricultural soil and agricultural products, providing technical support and normative guidance for preventing soil pollution and ensuring the safety of agricultural products. Furthermore, enhancing publicity, education, and training for facility agriculture practitioners is vital to raise awareness of the hazards associated with phthalate pollution and to encourage the adoption of production methods and measures that are beneficial to soil environmental protection.

4. Conclusions

The total contents of five PAE compounds, DMP, DEP, DBP, DEHP, and DIBP, identified in the soil of Xinjiang facility agriculture ranged from 7.29 to 1064.1 μg kg−1 (mean of 111.8 μg kg−1). DBP, DEHP, and DMP were identified as the primary PAE pollutants in the study area’s soil. The DBP and DMP levels were higher than the soil PAE control standards established by the US Environmental Protection Agency, with exceedance rates of 16.1% and 16.9%, respectively; however, these levels did not surpass the remediation standards. The spatial distribution of PAEs exhibited higher concentrations in southern China and lower concentrations in northern China. Distinctive characteristics were observed in the total contents and congener levels of the soil PAEs across various provinces, which may be linked to factors such as the climatic conditions in the northern and southern Tianshan Mountains and the agricultural production methods used in different regions. The total concentration of the six PAEs detected within agricultural products was 5140 μg kg−1 (mean of 637.60 μg kg−1), with detection rates varying from 3.0% to 46.8%. The PAE contents within the agricultural products were higher compared to those in the soil, and the composition of the former also significantly differed from that of the latter. BMPP, DPP and DNOP could not be detected in the soil, while DMP and DEP, which were present in the soil, were not detected in the agricultural products. These findings suggest that the PAE sources within agricultural products was not limited to the soil and that air may also constitute a significant pathway for the adsorption of PAEs by crops. The distribution of PAEs in agricultural products also shows a pattern of slightly greater contents in southern Xinjiang and lower contents in northern Xinjiang, similar to those in the soil. The PAE contents and compositions among various agricultural products significantly differed. The five priority PAEs detected from our study area are mainly absorbed into the human body through the diet, but their overall carcinogenic and non-carcinogenic risks are low, and they pose relatively little harm to human health.

Supplementary Materials

The following supporting information can be downloaded at: https://www.mdpi.com/article/10.3390/agronomy15040821/s1, Table S1: Mass spectrum parameters of 16 plasticizers.

Author Contributions

H.L. (Haifeng Li): conceptualization, methodology, software, investigation, and writing—original draft; H.L. (Hejiang Liu): data curation, investigation, and validation; Z.L.: methodology, validation, and project administration; S.S.: supervision, investigation, and project administration; H.S.: software, data curation, and investigation; G.L.: resources, validation, and project administration. All authors have read and agreed to the published version of the manuscript.

Funding

This research was funded by the Xinjiang Uygur Autonomous Region ‘Tianshan Talents’ training program project, grant number [2022TSYCJC0053], and the National Natural Science Foundation of China through its Regional Science Fund [42267065].

Data Availability Statement

The data presented in this study are available from the corresponding author upon reasonable request.

Acknowledgments

We appreciate and thank the anonymous reviewers for helpful comments that led to an overall improvement of the manuscript.

Conflicts of Interest

The authors declare that they have no conflicts of interest.

References

  1. Hart, L.B.; Beckingham, B.; Wells, R.S.; Alten Flagg, M.; Wischusen, K.; Moors, A.; Kucklick, J.; Pisarski, E.; Wirth, E. Urinary Phthalate Metabolites in Common Bottlenose Dolphins (Tursiops truncatus) From Sarasota Bay, FL, USA. Geohealth 2018, 2, 313–326. [Google Scholar] [CrossRef] [PubMed]
  2. Wang, C.; Zeng, T.; Gu, C.; Zhu, S.; Zhang, Q.; Luo, X. Photodegradation Pathways of Typical Phthalic Acid Esters Under UV, UV/TiO(2), and UV-Vis/Bi(2)WO(6) Systems. Front. Chem. 2019, 7, 852. [Google Scholar] [CrossRef]
  3. Ebenau-Jehle, C.; Soon, C.; Fuchs, J.; Geiger, R.; Boll, M. An Aerobic Hybrid Phthalate Degradation Pathway via Phthaloyl-Coenzyme A in Denitrifying Bacteria. Appl. Environ. Microbiol. 2020, 86, e00498-20. [Google Scholar] [CrossRef] [PubMed]
  4. Nenadov, D.S.; Pogrmic-Majkic, K.; Tesic, B.; Kokai, D.; Fa Nedeljkovic, S.; Stanic, B.; Andric, N. Impact of In Vitro Long-Term Low-Level DEHP Exposure on Gene Expression Profile in Human Granulosa Cells. Cells 2022, 11, 2304. [Google Scholar] [CrossRef] [PubMed]
  5. Ramachandran, V.; Arokia Vijaya Anand, M.; David, E.; Venkatachalam, K.; Vijayakumar, S.; Sankaran, V.; Balupillai, A.; Sangeetha, C.C.; Gothandam, K.M.; Kotakadi, V.S.; et al. Antidiabetic Activity of Gold Nanoparticles Synthesized Using Wedelolactone in RIN-5F Cell Line. Antioxidants 2019, 9, 8. [Google Scholar] [CrossRef]
  6. Benjamin, S.; Pradeep, S.; Sarath Josh, M.; Kumar, S.; Masai, E. A monograph on the remediation of hazardous phthalates. J. Hazard. Mater. 2015, 298, 58–72. [Google Scholar] [CrossRef]
  7. Maqbool, F.; Mostafalou, S.; Bahadar, H.; Abdollahi, M. Review of endocrine disorders associated with environmental toxicants and possible involved mechanisms. Life Sci. 2016, 145, 265–273. [Google Scholar] [CrossRef]
  8. Li, Y.; Yan, H.Q.; Li, X.Q.; Ge, J.; Cheng, J.J.; Yu, X.Y. Presence, distribution and risk assessment of phthalic acid esters (PAEs) in suburban plastic film pepper-growing greenhouses with different service life. Ecotoxicol. Environ. Saf. 2020, 196, 110551. [Google Scholar] [CrossRef]
  9. Wang, Z.M.; Ma, J.C.; Wang, T.T.; Qin, C.; Hu, X.J.; Mosa, A.; Ling, W.T. Environmental health risks induced by interaction between phthalic acid esters (PAEs) and biological macromolecules: A review. Chemosphere 2023, 328, 138578. [Google Scholar] [CrossRef]
  10. Zhang, Q.; Wang, L.; Wu, Q.L. Occurrence and combined exposure of phthalate esters in urban soil, surface dust, atmospheric dustfall, and commercial food in the semi-arid industrial city of Lanzhou, Northwest China. Environ. Pollut. 2024, 354, 124170. [Google Scholar] [CrossRef]
  11. Li, R.L.; Liang, J.; Gong, Z.B.; Zhang, N.N.; Duan, H.L. Occurrence, spatial distribution, historical trend and ecological risk of phthalate esters in the Jiulong River, Southeast China. Sci. Total Environ. 2017, 580, 388–397. [Google Scholar] [CrossRef] [PubMed]
  12. Liu, C.; Deng, Y.L.; Zheng, T.Z.; Yang, P.; Jiang, X.Q.; Liu, E.N.; Miao, X.P.; Wang, L.Q.; Jiang, M.; Zeng, Q. Urinary biomarkers of phthalates exposure and risks of thyroid cancer and benign nodule. J. Hazard. Mater. 2020, 383, 121189. [Google Scholar] [CrossRef] [PubMed]
  13. Lü, H.X.; Mo, C.H.; Zhao, H.M.; Xiang, L.; Katsoyiannis, A.; Li, Y.W.; Cai, Q.Y.; Wong, M.H. Soil contamination and sources of phthalates and its health risk in China: A review. Environ. Res. 2018, 164, 417–429. [Google Scholar] [CrossRef]
  14. Gao, M.; Dong, Y.; Zhang, Z.; Song, W.; Qi, Y. Growth and antioxidant defense responses of wheat seedlings to di-n-butyl phthalate and di (2-ethylhexyl) phthalate stress. Chemosphere 2017, 172, 418–428. [Google Scholar] [CrossRef]
  15. Liu, W.R.; Li, X.X.; Lv, H.J.; Liang, C.L.; Wang, Q.; Yao, X.F.; Dong, C.; Zhang, W.J.; Wang, J.H.; Zhu, L.S.; et al. Occurrence and health risk assessment of phthalates in a typical estuarine soil: A case study of the various functional areas of the Yellow River Delta. Sci. Total Environ. 2023, 904, 166972. [Google Scholar] [CrossRef]
  16. Hu, W.Y.; Zhang, Y.X.; Huang, B.; Teng, Y. Soil environmental quality in greenhouse vegetable production systems in eastern China: Current status and management strategies. Chemosphere 2017, 170, 183–195. [Google Scholar] [CrossRef]
  17. Liu, X.Y.; Xin, L.J. Spatial and temporal evolution and greenhouse gas emissions of China’s agricultural plastic greenhouses. Sci. Total Environ. 2023, 863, 160810. [Google Scholar] [CrossRef]
  18. Wang, J.; Lv, S.; Zhang, M.; Chen, G.; Zhu, T.; Zhang, S.; Teng, Y.; Christie, P.; Luo, Y. Effects of plastic film residues on occurrence of phthalates and microbial activity in soils. Chemosphere 2016, 151, 171–177. [Google Scholar] [CrossRef]
  19. Xu, Y.; Xiong, B.; Huang, Y.-M.M.; Xu, J.; He, Y.; Lu, Z. Exploring additives beyond phthalates: Release from plastic mulching films, biodegradation and occurrence in agricultural soils. Sci. Total Environ. 2024, 918, 170763. [Google Scholar] [CrossRef]
  20. Chen, L.Y.; Yu, L.; Han, B.J.; Li, Y.J.; Zhang, J.D.; Tao, S.; Liu, W.X. Pollution characteristics and affecting factors of phthalate esters in agricultural soils in mainland China. J. Hazard. Mater. 2024, 466, 133625. [Google Scholar] [CrossRef]
  21. Chen, Y.Y.; Zhang, G.Q.; Zhang, Y.; Li, M.K.; Hao, J.X.; Xiong, Y.C.; Li, C.X.; Cao, J. Accumulation Characteristics and Sources of PAEs in Agricultural Soils in Gansu Province. Huanjing Kexue/Environ. Sci. 2022, 43, 4622–4629. [Google Scholar] [CrossRef]
  22. Chen, N.; Shuai, W.J.; Hao, X.M.; Zhang, H.C.; Zhou, D.M.; Gao, J. Contamination of Phthalate Esters in Vegetable Agriculture and Human Cumulative Risk Assessment. Pedosphere 2017, 27, 439–451. [Google Scholar] [CrossRef]
  23. Zeng, L.J.; Huang, Y.H.; Chen, X.T.; Chen, X.H.; Mo, C.H.; Feng, Y.X.; Lü, H.X.; Xiang, L.; Li, Y.W.; Li, H.; et al. Prevalent phthalates in air-soil-vegetable systems of plastic greenhouses in a subtropical city and health risk assessments. Sci. Total Environ. 2020, 743, 140755. [Google Scholar] [CrossRef] [PubMed]
  24. Zhang, Y.; Wang, P.J.; Wang, L.; Sun, G.Q.; Zhao, J.Y.; Zhang, H.; Du, N. The influence of facility agriculture production on phthalate esters distribution in black soils of northeast China. Sci. Total Environ. 2015, 506–507, 118–125. [Google Scholar] [CrossRef]
  25. Li, C.; Chen, J.Y.; Wang, J.H.; Han, P.; Luan, Y.X.; Ma, X.P.; Lu, A.X. Phthalate esters in soil, plastic film, and vegetable from greenhouse vegetable production bases in Beijing, China: Concentrations, sources, and risk assessment. Sci. Total Environ. 2016, 568, 1037–1043. [Google Scholar] [CrossRef]
  26. Bai, X.Y.; Pan, K.W.; Shoaib, N.; Sun, X.M.; Wu, X.G.; Zhang, L. Status of phthalate esters pollution in facility agriculture across China: Spatial distribution, risk assessment, and remediation measures. Sci. Total Environ. 2024, 908, 168416. [Google Scholar] [CrossRef]
  27. Chai, C.; Cheng, H.; Ge, W.; Ma, D.; Shi, Y. Phthalic Acid Esters in Soils from Vegetable Greenhouses in Shandong Peninsula, East China. PLoS ONE 2014, 9, e95701. [Google Scholar] [CrossRef]
  28. Wang, J.; Luo, Y.M.; Teng, Y.; Ma, W.T.; Christie, P.; Li, Z.G. Soil contamination by phthalate esters in Chinese intensive vegetable production systems with different modes of use of plastic film. Environ. Pollut. 2013, 180, 265–273. [Google Scholar] [CrossRef]
  29. Zhou, B.; Zhao, L.X.; Wang, Y.B.; Sun, Y.; Li, X.J.; Xu, H.J.; Weng, L.P.; Pan, Z.; Yang, S.D.; Chang, X.P.; et al. Spatial distribution of phthalate esters and the associated response of enzyme activities and microbial community composition in typical plastic-shed vegetable soils in China. Ecotoxicol. Environ. Saf. 2020, 195, 110495. [Google Scholar] [CrossRef]
  30. Long, F.; Ren, Y.; Ji, Y.; Li, J.; Zhang, H.; Wu, Z.; Gao, R.; Bi, F.; Liu, Z.; Li, H. Pollution Characteristics, Toxicological Properties, and Health Risk Assessment of Phthalic Acid Esters in Water, Soil, and Atmosphere. Atmosphere 2024, 15, 1071. [Google Scholar] [CrossRef]
  31. Wang, J.; Chen, G.C.; Christie, P.; Zhang, M.Y.; Luo, Y.M.; Teng, Y. Occurrence and risk assessment of phthalate esters (PAEs) in vegetables and soils of suburban plastic film greenhouses. Sci. Total Environ. 2015, 523, 129–137. [Google Scholar] [CrossRef] [PubMed]
  32. Li, Y.T.; Wang, J.; Bai, H.C.; Ni, K.; Liu, K.; Lu, P.L. Occurrence, sources, and risk assessments of phthalic acid esters in tea plantations in China. J. Environ. Chem. Eng. 2022, 10, 107636. [Google Scholar] [CrossRef]
  33. Zeng, F.; Cui, K.Y.; Xie, Z.Y.; Wu, L.; Luo, D.L.; Chen, L.X.; Lin, Y.J.; Liu, M.; Sun, G.X. Distribution of phthalate esters in urban soils of subtropical city, Guangzhou, China. J. Hazard. Mater. 2009, 164, 1171–1178. [Google Scholar] [CrossRef]
  34. Li, X.; Wang, X.; Zhang, Y.; Zhao, Q.; Yu, B.; Li, Y.; Zhou, Q. Salinity and Conductivity Amendment of Soil Enhanced the Bioelectrochemical Degradation of Petroleum Hydrocarbons. Sci. Rep. 2016, 6, 32861. [Google Scholar] [CrossRef]
  35. Muchangos, L.D.; Xue, M.Q.; Zhou, L.; Kojima, N.; Machimura, T.; Tokai, A. Flows, stocks, and emissions of DEHP products in Japan. Sci. Total Environ. 2019, 650, 1007–1018. [Google Scholar] [CrossRef]
  36. Zhou, B.; Zhao, L.X.; Sun, Y.; Li, X.J.; Weng, L.P.; Li, Y.T. Contamination and human health risks of phthalate esters in vegetable and crop soils from the Huang-Huai-Hai region of China. Sci. Total Environ. 2021, 778, 146281. [Google Scholar] [CrossRef]
  37. Zhang, Z.; He, G.; Peng, X.; Lu, L. Distribution and sources of phthalate esters in the topsoils of Beijing, China. Environ. Geochem. Health 2014, 36, 505–515. [Google Scholar] [CrossRef]
  38. Yesildagli, B.; Göktaş, R.K.; Ayaz, T.; Olgun, B.; Dokumacı, E.N.; Özkaleli, M.; Erdem, A.; Yurtsever, M.; Doğan, G.; Yurdakul, S.; et al. Phthalate ester levels in agricultural soils of greenhouses, their potential sources, the role of plastic cover material, and dietary exposure calculated from modeled concentrations in tomato. J. Hazard. Mater. 2024, 468, 133710. [Google Scholar] [CrossRef]
  39. Tran, B.C.; Teil, M.-J.; Blanchard, M.; Alliot, F.; Chevreuil, M. Fate of phthalates and BPA in agricultural and non-agricultural soils of the Paris area (France). Environ. Sci. Pollut. Res. 2015, 22, 11118–11126. [Google Scholar] [CrossRef]
  40. Saha, S.; Narayanan, N.; Singh, N.; Gupta, S. Occurrence of endocrine disrupting chemicals (EDCs) in river water, ground water and agricultural soils of India. Int. J. Environ. Sci. Technol. 2022, 19, 11459–11474. [Google Scholar] [CrossRef]
  41. Bouajila, A.; Omar, Z.; Saoud, R.; Rahmani, R. Soil Contamination by Phthalate Esters in Cultivated and Non-Cultivated Soils in North African Arid Regions: A Tunisian Case Study. Environ. Nat. Resour. J. 2022, 20, 553–562. [Google Scholar] [CrossRef]
  42. Chen, W.D.; Chi, C.C.; Zhou, C.; Xia, M.; Ronda, C.; Shen, X.Y. Analysis of the influencing factors of PAEs volatilization from typical plastic products. J. Environ. Sci. 2018, 66, 61–70. [Google Scholar] [CrossRef] [PubMed]
  43. Cui, J.; Bai, R.; Ding, W.; Liu, Q.; Liu, Q.; He, W.; Yan, C.; Li, Z. Potential agricultural contamination and environmental risk of phthalate acid esters arrived from plastic film mulching. J. Environ. Chem. Eng. 2024, 12, 111785. [Google Scholar] [CrossRef]
  44. Wu, W.; Sheng, H.; Gu, C.; Song, Y.; Willbold, S.; Qiao, Y.; Liu, G.; Zhao, W.; Wang, Y.; Jiang, X.; et al. Extraneous dissolved organic matter enhanced adsorption of dibutyl phthalate in soils: Insights from kinetics and isotherms. Sci. Total Environ. 2018, 631–632, 1495–1503. [Google Scholar] [CrossRef]
  45. Yang, F.; Wang, M.; Wang, Z.Y. Sorption behavior of 17 phthalic acid esters on three soils: Effects of pH and dissolved organic matter, sorption coefficient measurement and QSPR study. Chemosphere 2013, 93, 82–89. [Google Scholar] [CrossRef]
  46. Tang, J.; Rong, X.; Jin, D.; Gu, C.; Chen, A.; Luo, S. Biodegradation of phthalate esters in four agricultural soils: Main influencing factors and mechanisms. Int. Biodeterior. Biodegrad. 2020, 147, 104867. [Google Scholar] [CrossRef]
  47. Zeng, W.; Zhang, C.; Wang, Q.; Wang, F. Adsorption Characteristics of Three Precedence-Controlled Phthalate Esters on Purple Soil. J. Southwest Univ. (Nat. Sci. Ed.) 2017, 39, 17–25. [Google Scholar] [CrossRef]
  48. Wang, L.; Gan, D.; Gong, L.; Zhang, Y.; Wang, J.; Guan, R.; Zeng, L.; Qu, J.; Dong, M.; Wang, L. Analysis of the performance of the efficient di-(2-ethylhexyl) phthalate-degrading bacterium Rhodococcus pyridinovorans DNHP-S2 and associated catabolic pathways. Chemosphere 2022, 306, 135610. [Google Scholar] [CrossRef]
  49. Xu, Y.; Liu, X.; Zhao, J.; Huang, H.; Wu, M.; Li, X.; Li, W.; Sun, X.; Sun, B. An efficient phthalate ester-degrading Bacillus subtilis: Degradation kinetics, metabolic pathway, and catalytic mechanism of the key enzyme. Environ. Pollut. 2021, 273, 116461. [Google Scholar] [CrossRef]
  50. Hou, Z.; Pan, H.; Gu, M.; Chen, X.; Ying, T.; Qiao, P.; Cao, J.; Wang, H.; Hu, T.; Zheng, L.; et al. Simultaneously degradation of various phthalate esters by Rhodococcus sp. AH-ZY2: Strain, omics and enzymatic study. J. Hazard. Mater. 2024, 474, 134776. [Google Scholar] [CrossRef]
  51. Zhang, J.; Zhang, C.; Zhu, Y.; Li, J.; Li, X. Biodegradation of seven phthalate esters by Bacillus mojavensis B1811. Int. Biodeterior. Biodegrad. 2018, 132, 200–207. [Google Scholar] [CrossRef]
  52. Tian, J.; Qian, Y.; He, X.; Qi, R.; Lei, J.; Wang, Q.; Feng, C. Influencing factors and risk assessment of phthalate ester pollution in the agricultural soil on a tropical island. Chemosphere 2024, 357, 142041. [Google Scholar] [CrossRef] [PubMed]
  53. Collins, C.; Fryer, M.; Grosso, A. Plant uptake of non-ionic organic chemicals. Environ. Sci. Technol. 2006, 40, 45–52. [Google Scholar] [CrossRef] [PubMed]
  54. Wang, W.-x.; Fan, C.Q. Gas/solid particulate phthalic esters (PAEs) in Masson pine (Pinus massoniana L.) needles and rhizosphere surface soils. J. Hazard. Mater. 2014, 276, 149–156. [Google Scholar] [CrossRef]
  55. Zhu, H.; Wang, F.; Li, B.; Yao, Y.; Wang, L.; Sun, H. Accumulation and translocation of polybrominated diphenyl ethers into plant under multiple exposure scenarios. Environ. Int. 2020, 143, 105947. [Google Scholar] [CrossRef]
  56. Wang, X.; Zhang, Y.; Huang, B.; Chen, Z.; Zhong, M.; Lu, Q.; Liu, X.; Ji, Q. Phthalate pollution and migration in soil-air-vegetable systems in typical plastic agricultural greenhouses in northwestern China. Sci. Total Environ. 2022, 809, 151101. [Google Scholar] [CrossRef]
  57. Teuten, E.L.; Saquing, J.M.; Knappe, D.R.; Barlaz, M.A.; Jonsson, S.; Björn, A.; Rowland, S.J.; Thompson, R.C.; Galloway, T.S.; Yamashita, R. Transport and release of chemicals from plastics to the environment and to wildlife. Philos. Trans. R. Soc. B Biol. Sci. 2009, 364, 2027–2045. [Google Scholar] [CrossRef]
  58. Wang, Y.; Wang, F.; Xiang, L.; Gu, C.G.; Redmile-Gordon, M.; Sheng, H.J.; Wang, Z.Q.; Fu, Y.H.; Bian, Y.R.; Jiang, X. Risk Assessment of Agricultural Plastic Films Based on Release Kinetics of Phthalate Acid Esters. Environ. Sci. Technol. 2021, 55, 3676–3685. [Google Scholar] [CrossRef]
  59. Mo, C.-H.; Cai, Q.-Y.; Tang, S.-R.; Zeng, Q.-Y.; Wu, Q.-T. Polycyclic Aromatic Hydrocarbons and Phthalic Acid Esters in Vegetables from Nine Farms of the Pearl River Delta, South China. Arch. Environ. Contam. Toxicol. 2009, 56, 181–189. [Google Scholar] [CrossRef]
  60. Cai, Q.Y.; Xiao, P.Y.; Chen, T.; Lü, H.; Zhao, H.M.; Zeng, Q.Y.; Li, Y.W.; Li, H.; Xiang, L.; Mo, C.H. Genotypic variation in the uptake, accumulation, and translocation of di-(2-ethylhexyl) phthalate by twenty cultivars of rice (Oryza sativa L.). Ecotoxicol. Environ. Saf. 2015, 116, 50–58. [Google Scholar] [CrossRef]
  61. Pan, B.; Zhu, X.; Huang, L.; Cai, K.; Li, Y.-W.; Cai, Q.-Y.; Feng, N.-X.; Mo, C.-H. Root-zone regulation and longitudinal translocation cause intervarietal differences for phthalates accumulation in vegetables. Chemosphere 2024, 359, 142322. [Google Scholar] [PubMed]
  62. Wei, L.Y.; Li, Z.H.; Sun, J.T.; Zhu, L.Z. Pollution characteristics and health risk assessment of phthalate esters in agricultural soil and vegetables in the Yangtze River Delta of China. Sci. Total Environ. 2020, 726, 137978. [Google Scholar] [CrossRef] [PubMed]
  63. Ma, T.T.; Wu, L.H.; Chen, L.; Zhang, H.B.; Teng, Y.; Luo, Y.M. Phthalate esters contamination in soils and vegetables of plastic film greenhouses of suburb Nanjing, China and the potential human health risk. Environ. Sci. Pollut. Res. 2015, 22, 12018–12028. [Google Scholar] [CrossRef]
  64. Li, Y.; Huang, G.; Gu, H.; Huang, Q.; Lou, C.; Zhang, L.; Liu, H. Assessing the Risk of Phthalate Ester (PAE) Contamination in Soils and Crops Irrigated with Treated Sewage Effluent. Water 2018, 10, 999. [Google Scholar] [CrossRef]
  65. Xu, X.; Wang, Y.; Xu, Y.; Tan, F. Characteristics, prediction, and risk assessment of phthalates, organophosphate esters, and polycyclic aromatic hydrocarbons in vegetables from plastic greenhouses of Northeast China. Chemosphere 2024, 368, 143743. [Google Scholar] [CrossRef]
  66. Castagnoli, A.; Pasciucco, F.; Iannelli, R.; Meoni, C.; Pecorini, I. Keu contamination in Tuscany: The life cycle assessment of remediation project as a decision support tool for local administration. Sustainability 2022, 14, 14828. [Google Scholar] [CrossRef]
  67. Pasciucco, E.; Pasciucco, F.; Castagnoli, A.; Iannelli, R.; Pecorini, I. Removal of heavy metals from dredging marine sediments via electrokinetic hexagonal system: A pilot study in Italy. Heliyon 2024, 10, e27616. [Google Scholar] [CrossRef]
Figure 1. Study area and sampling point locations.
Agronomy 15 00821 g001
Figure 2. Total content of PAEs in the soils of the north and south regions. * Significant differences between northern and southern Xinjiang (p < 0.05). The red square indicates the mean.
Agronomy 15 00821 g002
Figure 3. The soil PAE contents in diverse regions of Xinjiang. (a) ∑PAEs; (b) DBP; (c) DEHP; (d) DIBP; (e) DMP; (f) DEP. The PAE contents in the soils of the corresponding areas significantly differ (p < 0.05), according to the various lowercase letters. The upper and lower boundaries of the box represent the upper and lower quartiles, respectively. The line at the center represents the median, the red hollow square in the box indicates the mean, and the bars at the top and bottom represent the upper and lower limits, respectively.
Agronomy 15 00821 g003
Figure 4. Percentages of PAEs in soils from different regions.
Agronomy 15 00821 g004
Figure 5. PAE concentrations and compositions within agricultural products in diverse regions. (a) ∑PAEs in the northern and southern regions; (b) ∑PAEs by region; (c) PAE congener concentration by region; (d) PAE congener concentration by region. The soil PAE contents of corresponding areas significantly differ (p < 0.05), according to the various lowercase letters. The upper and lower boundaries of the box indicate the upper and lower quartiles, respectively. * Significant differences between northern and southern Xinjiang (p < 0.05). The line at the center represents the median, the red cross symbol represents the mean, and the bars at the top and bottom represent the upper and lower limits, respectively.
Agronomy 15 00821 g005
Figure 6. Concentrations (a) and detection rates (b) of PAEs in different types of agricultural products. (S: solanum; M: melon; B: bean pods; L: leaves; R: roots; F: fruits).
Agronomy 15 00821 g006
Table 1. Parameter values of the health risk assessment model.
Parameters Meaning Unit Adult Child
IR1Daily fruit and vegetable intakekg d−10.3450.231
ISDaily average soil intakemg d−1100200
IiRespiration ratem3 d−1208
EF1Crop exposure frequenciesd a−1350
EF2Soil exposure frequenciesd a−1250
ED1Crop exposure yearsa306
ED2Soil exposure yearsa246
CFConversion factor/1 × 10−6
SAExposed skin areacm2 d−157,00028,000
AFSoil adhesion factormg cm−10.070.2
ABSAbsorption of soil factors by the skin/0.1
PEFParticulate emission factorm3 kg−11.36 × 10⁹
BWBody weightkg7015
RfDReference dosemg kg−1 d−1DMP: 10, DEP: 0.8, DBP: 0.1, BBP: 0.2, DEHP: 0.02, DnBP: 0.1, DIBP: 0.08
CFSCarcinogenic slope factormg kg−1 d−1DEHP: 0.014, BBP: 0.0019
ATAverage lifetimedCarcinogenic risk is 25,550,
Con-carcinogenic risk is 365 × ED
Table 2. Contents and detection rates of PAE compounds in soil (μg kg−1, n = 249).
PAEMinMaxMedianMeanSDDF/%Control StandardRate of Exceedance/%
DEHP1.12180.19.9522.130.0810043500
DBPND974.725.568.513299.68016.1
DIBPND62.00.397.0912.598.4--
DEPND30.00.802.745.1884.7700
DMPND81.45.2011.415.998.42016.9
BBPNDNDNDND-0--
DCHPNDNDNDND-0--
DMEPNDNDNDND-0--
BMPPNDNDNDND-0--
DEEPNDNDNDND-0--
DPPNDNDNDND-0--
DHXPNDNDNDND-0--
DBEPNDNDNDND-0--
DPHPNDNDNDND-0--
DNOPNDNDNDND-01200-
DNPNDNDNDND-0--
∑4PAEs6.881063.548.4104.7----
∑16PAEs7.291064.154.7111.8----
ND: not detected; SD: standard deviation; DF: detection frequency; -: no available data.
Table 3. Contents and detection rates of PAE compounds in agricultural products (μg kg−1, n = 203).
PAEsMinMaxMeanSDDF/%
DEHPND152023.63139.373.9
DBPND2310314.56419.1746.8
DIBPND86030.94139.914.9
DEPNDND--0
DMPNDND--0
BBPNDND--0
DCHPNDND--0
DMEPNDND--0
BMPPND262093.24337.1611.8
DEEPNDNDND-0
DPPND275050.25338.993.0
DHXPNDNDND-0
DBEPNDNDND-0
DPHPNDNDND-0
DNOPND3450125.44463.989.4
DNPNDNDND-0
16PAEsND5140637.60897.06-
ND: not detected; SD: standard deviation; DF: detection frequency; -: no available data.
Table 4. Carcinogenic and non-carcinogenic health risks of PAEs.
CrowdExposure RoutesCRHQ
DEHPDMPDEPDBPDEHPDNOPTotal
AdultDietary intake6.73 × 10−7001.50 × 10−25.63 × 10−31.50 × 10−23.56 × 10⁻²
Soil ingestion1.04 × 10−151.11 × 10−143.35 × 10−146.70 × 10−121.08 × 10−1101.76 × 10−11
Dermal contact4.14 × 10−104.43 × 10−91.34 × 10−82.67 × 10−64.31 × 10−607.01 × 10⁻⁶
Inhalation7.21 × 10−107.72 × 10−92.33 × 10−84.66 × 10−67.51 × 10−601.22 × 10⁻⁵
Sum6.74 × 10−71.22 × 10−93.67 × 10−81.50 × 10−25.65 × 10−31.5 × 10−23.56 × 10−2
ChildDietary intake4.21 × 10−7004.67 × 10−21.75 × 10−24.65 × 10−21.11 × 10⁻¹
Soil ingestion2.42 × 10−151.04 × 10−133.13 × 10−136.26 × 10−111.01 × 10−1001.64 × 10−10
Dermal contact6.78 × 10−102.90 × 10−88.76 × 10−81.75 × 10−52.83 × 10−504.59 × 10⁻⁵
Inhalation1.80 × 10−107.72 × 10−92.33 × 10−84.66 × 10−67.51 × 10−601.22 × 10⁻⁵
Sum4.22 × 10−73.68 × 10−81.11 × 10−74.67 × 10−21.76 × 10−24.6 × 10−21.11 × 10−1
Disclaimer/Publisher’s Note: The statements, opinions and data contained in all publications are solely those of the individual author(s) and contributor(s) and not of MDPI and/or the editor(s). MDPI and/or the editor(s) disclaim responsibility for any injury to people or property resulting from any ideas, methods, instructions or products referred to in the content.

