Article

Exogenous Hydrogen Sulfide Alleviates the Toxicity of Cu2+ Stress on the Growth Physiology and Quality Components in Camellia sinensis L.

College of Horticulture, Nanjing Agricultural University, Nanjing 210095, China
*
Author to whom correspondence should be addressed.
These authors contributed equally to this work.
Agronomy 2025, 15(4), 820; https://doi.org/10.3390/agronomy15040820
Submission received: 20 February 2025 / Revised: 21 March 2025 / Accepted: 25 March 2025 / Published: 26 March 2025
(This article belongs to the Section Horticultural and Floricultural Crops)

Abstract

:
Cu2+ stress impairs the growth and metabolism of tea plants, further reducing the quality of tea leaves. As a gas signaling molecule, H2S participates in various physiological processes and improves the stress resistance of plants. Here, the role of H2S in the response of tea plants to Cu2+ stress was investigated by analyzing the effects of Cu2+ stress on phenotypes, photosynthetic parameters, physiological indicators, and quality component contents with H2S or PAG (H2S synthase inhibitor) pretreatment. It was indicated that exogenous H2S reduced Cu accumulation and alleviated the inhibition of growth physiology mediated by Cu2+ stress in tea plants, mitigated the leaf cell ultrastructure damage, and increased the biomass, root activity, chlorophyll content, and photosynthetic capacity of tea plants under Cu2+ stress. Additionally, exogenous H2S activated the antioxidant system by increasing antioxidant enzyme activities and non-enzymatic antioxidant contents and enhanced the production of endogenous H2S by promoting LCD activity, thereby improving the antioxidant capacity of tea plants under Cu2+ stress. Meanwhile, the application of H2S effectively alleviated the reduction in the quality components of tea leaves under Cu2+ stress. Above all, exogenous H2S can enhanced tea plants’ tolerance to Cu2+ stress, providing a technical reference for the management of tea plants.

1. Introduction

Copper (Cu) is one of the abundant heavy metal elements in nature, and it is an essential micronutrient for plant growth and is involved in a variety of metabolic reactions during plant growth and development [1]. However, the tolerance of plants to Cu is poor, and generally, a content of Cu in plants exceeding 20 mg/kg causes toxicity and stress, which can even lead to serious plant death [2,3]. Zhai et al. [4] found that high concentrations of Cu2+ caused reduced root vigor, increased relative membrane permeability of leaves and roots, and increased malondialdehyde (MDA) contents in wheat seedlings. Xiao et al. [5] found that the root length, seedling length, and biomass of cereal seedlings were inhibited to different degrees under Cu2+ stress.
The damage caused by Cu2+ stress to roots is obvious because the root system is the main organ of the plant that is directly poisoned by heavy metals. Cu2+ stress has been found to cause damage to root tips, the shortening of root crowns, and the inhibition of root growth and elongation [6,7,8]. In addition, both the cell membrane and organelle membrane ultrastructural systems of plants are damaged to some extent under Cu2+ stress. The ultrastructure of the root tip cells of wheat seedling under copper stress showed that the cell wall and cell membrane suffered varying degrees of destruction, which caused an increase in the intercellular space and the disappearance of some organelles [9]. Furthermore, Cu also participates in the synthesis of plant chlorophyll and other pigments, and Cu2+ stress can alter the plant chlorophyll content, mainly manifested in the destruction of chloroplasts and inhibition of chlorophyll synthesis and causing chlorophyll damage [10]. Zhang et al. [11] found that the chlorophyll content of Perennial Ryegrass showed a significant downward trend as the concentration of Cu2+ stress increased. Meanwhile, Cu2+ stress can also cause changes in photosynthetic parameters. The research of Zhang et al. [12] indicated that the transpiration rate (Trmmol, Tr) and stomatal conductance (Conductance, Cond) of navel orange leaves increased under 0.1 μmol/L Cu2+ treatment, while under Cu2+ stress (≥5.0 μmol/L), the photosynthetic efficiency, net photosynthetic rate (photosynthetic rate, Pn), light saturation point, Tr, and Cond of that all decreased.
Plants subjected to Cu2+ stress produce large amounts of reactive oxygen species (ROS), which are mainly scavenged and counteracted by enzymatic antioxidant systems, including superoxide dismutase (SOD), catalase (CAT), peroxidase (POD), and glutathione reductase (GR), ascorbate peroxidase (APX), dehydroascorbate reductase (DHAR), and monodehydroascorbate reductase (MDHAR) in the AsA–GSH cycle, while synergizing with non-enzymatic antioxidant systems in the body, such as soluble phenols, ascorbic acid (AsA), reduced glutathione (GSH), proline (Pro), vitamin E (VE), coenzymes, and sulfhydryl compounds, to maintain normal cellular metabolism [13]. It has been reported that GSH contains special sulfhydryl groups that can complex with Cu2+ to form chelates with lower toxicity to plants and that GSH is also reductive and can be easily reduced to oxidized glutathione (GSSG), which allows for the direct scavenging of ROS [14]. Moreover, the sulfhydryl group of GSH can be coupled with the electrophilic groups of endogenous or exogenous harmful substances under the catalysis of glutathione transferase, GST, increasing its hydrophobicity, making it easier to pass through the cell membrane and be excreted from the body, thereby achieving detoxification [15]. Similarly, it has been shown that under Cu2+ stress, Pro can act as a cellular osmoregulator, reacting with hydroxyl radicals to reduce the cellular accumulation of hydroxyl radicals and maintain the cellular structure and protein stabilization, resulting in undamaged subcellular structures [16].
In recent years, due to the improvement of tea economic benefits, tea farmers have extensively used chemical fertilizers, pesticides, organic fertilizers, etc., to increase tea production. These agricultural materials contain a certain amount of the Cu element, which leads to an increase in the Cu content in the soil and an increase in Cu accumulation within the tea plant [Camellia sinensis (L.) O. Kuntze] [17]. Therefore, research on the impact of Cu on tea plants has received more attention. The Cu element in tea plants generally originates from the soil, water, and atmosphere, and the tea plant mainly absorbs Cu through the roots, which is further transported, distributed, and accumulated in different tissues [18]. Cu2+ stress endangers the growth and development of tea plants and causes a series of toxic symptoms [19]. It has previously been observed that the activities of SOD, POD, and CAT in the roots and leaves of tea plants show a tendency to increase first and then decrease with an increase of the concentration of Cu2+ stress [20]; the photosynthetic rate, Tr, and chlorophyll content of tea plant leaves first increases and then decreases when affected by Cu2+ stress [17]; the content of tea polyphenols, catechins, theanine, and caffeine and other quality indicators of tea plant leaves also showed a tendency to increase and then decrease under different concentrations of Cu2+ stress [17]. In addition, studies on two cultivars of tea plants [Camellia sinensis (L.) O. Kuntze cvs. Chinary and Assamica] in response to 100 mΜ CuSO4 stress found that chlorophyll and protein contents were reduced and that the activities of glutathione biosynthesis enzyme (γ-ECS) and glutathione synthase (GSHS) were elevated in both cultivars, whereas the production of ROS under Cu2+ stress was more apparent in Assamica than in Chinary, and the Pro content was higher in Chinary than in Assamica [21].
As an important signaling molecule, hydrogen sulfide (H2S) is involved in a variety of physiological processes of plants, such as seed germination, seedling biomass, morphogenesis, and photosynthesis [22]. It can also enhance plant responses to biotic and abiotic stresses, improve stress resistance, and reduce the harm of stress [23]. A certain physiological concentration of H2S promotes root development, and it was found that H2S promoted the number of growing lateral roots, total root length, and total root surface area in the root system of peach seedlings, which were significantly inhibited by treatment with an H2S scavenger [24]. Che, et al. [25] investigated the regulation of photosynthesis in Spinacia oleracea seedlings and found that H2S could increase the chlorophyll content of Spinacia oleracea. However, high concentrations of H2S destroyed the structure of chloroplasts and thus had an inhibitory effect on photosynthesis in plants [25]. In addition, H2S can be involved in the plant stress response to heavy metals, including Al, Cu, Cd, Cr, As, Zn, Pb, Ni, etc., and mitigate the effects of heavy metal stress on plant growth [26]. Zhu et al. [27] showed that exogenous H2S pretreatment could reduce Al3+ uptake in rice roots by decreasing the expression of the Al3+ transporter protein gene OsNramp5 and reduced pectin methyl esterase activity and pectin and hemicellulose contents in the rice roots, which in turn lowered the negative charge and reduced the binding of Al3+ in the cell wall. At the same time, exogenous H2S pretreatment significantly increased the expression of citric-acid-synthesis genes in rice, which contributed to the increase in the release of citric acid, thus mitigating the Al3+ toxicity on root elongation; H2S pretreatment also increased the activities of antioxidant enzymes, such as SOD, APX, CAT, and POD, in the rice root system, and significantly reduced the contents of MDA and H2O2, thus alleviating the disruption of Al3+ to the membranes in rice.
Plants can produce endogenous H2S, and the enzymatic degradation of cysteine (Cys) to produce H2S is considered the main pathway [28]. Cysteine desulphydrases (CDes) comprise L- and D-cysteine desulphydrases (L/D-CDes), which disintegrate L/D-cysteine (L/D-Cys) to H2S, ammonia (NH3), and pyruvate, respectively. While L-Cys is the main form of Cys present in plants, it was also found that the activity of L-cysteine desulphydrase (L-CDes, LCD) in Arabidopsis thaliana was about 2–3 times higher than the activity of D-cysteine desulphydrase (D-CDes, DCD) [29]. Therefore, LCD is important for endogenous hydrogen sulfide synthesis in plants. However, the low level of H2S in plants does not allow them to perform their functions more efficiently, and the problem of the H2S supply can be solved by exogenous H2S donors. Currently, H2S donors are generally two kinds of inorganic sulfides, sodium hydrosulfide (NaHS) and sodium sulfide (Na2S), which can release H2S in an aqueous solution within a few seconds [30]. H2S in the body exists in the form of gaseous H2S molecules (1/3) and in the form of HS (2/3). H2S and HS produced by H2S donors can be synthesized and decomposed in solution in a dynamic equilibrium state, which ensures the content of H2S molecules in the body and serves to stabilize the pH value [23,31]. And a reverse physiological function analysis of H2S function can use H2S scavengers and inhibitors: scavenger hypotaurine (HT), inhibitor DL-propargylglycine (PAG), carboxymethoxylamine hemihydrochloride, hydroxylammonia, and CDes catabolism products C3H3KO3 and NH3, etc. [32].
The tea plant is one of the three major beverage crops. With the improvement in the consumption level and the development of the tea industry, the quality and safety of tea products are receiving more and more attention. It is also worth noting that industrial pollution emissions, improper agricultural fertilization, pesticide residues, and soil acidification can lead to increased soil Cu contents in tea gardens, thus subjecting the tea plant to Cu2+ stress. Cu2+ stress can inhibit the growth and metabolism of tea plants, thereby affecting the quality and yield of tea. In addition, tea plants may excessively absorb and accumulate Cu in Cu-contaminated tea gardens, leading to excessive Cu contents in tea leaves. The long-term intake of tea with a high Cu content causes Cu poisoning in the human body, damaging the liver, kidney, and nervous system functions [33]. However, Cu is also an essential trace nutrient element for plant growth and development [1]. Therefore, analyzing the protective mechanism of tea plants in excessive Cu environments is of great significance for balancing the advantages and disadvantages of Cu, ensuring the normal growth of tea plants, and ensuring the safe production of tea. Currently, research on tea plants and the Cu element has mainly focused on the dissolution rate of Cu2+ after tea processing, the absorption and accumulation characteristics of Cu2+ by tea plants, and the impact of Cu2+ on tea plant growth [34,35,36]. However, the physiological characteristics of tea plants under Cu2+ stress and the pathways of Cu2+ stress alleviation still need to be studied. In addition, H2S can enhance the resistance of plants to heavy metal stress, but there are few studies on H2S gas signal molecules in tea plants and whether exogenous H2S can alleviate Cu2+ stress in tea plants. In this study, we explored the mitigating effect of H2S on the response of tea plants to Cu2+ stress and its impact on the main quality components of tea leaves, so as to provide a scientific basis and theoretical support for the daily cultivation and management of tea plantations and the protection of tea plants against Cu2+ stress.

2. Materials and Methods

2.1. Plant Materials

The annual seedlings of C. sinensis cv. ‘Zhongcha 108’ (Nanjing Ya Run Tea Co., Ltd., Nanjing, China) with a height of 15–20 cm and good health were used in this study. Tea seedlings with the same growth were selected and hydroponically cultured using culture solution (pH 5.5) prepared according to the method of Ghanati et al. [37] and replaced every five days. After 30 d of hydroponics, seedlings were pretreated with 100 μM Na2S·9H2O (H2S)/1.0 mM PAG (PAG)/untreated culture solution (0) for 15 d and then treated with 0.5 mM CuSO4·5H2O (0.5 Cu)/1.0 mM CuSO4·5H2O (1.0 Cu)/untreated culture solution (0) for 15 d. The specific treatment programs are listed in Table 1. The whole hydroponics and treatment processes were carried out with a light cycle of 12 h/12 h, relative humidity of 75–80%, temperature of 25 °C/22 °C, and light intensity of 30,000 lx. After the treatment, the tea seedlings were washed clean with deionized water and photographed to record their phenotypes.

2.2. Cu Content Determination

The young leaves (one bud and two leaves), mature leaves (three to six leaves), stems, and roots after treatment were dried to a constant weight, ground into a powder, and passed through a 0.5 mm sieve. According to the method of dry ashing [38], the dried samples were digested with HNO3-HClO4 (v:v = 4:1) mixed acid, and then, the Cu content in each part was determined via ICP-OES (iCAP 7400, Thermo Fisher Scientific Inc., Waltham, MA, USA).

2.3. Biomass and Root Activity Determination

The treated tea seedlings were washed and drained of surface water and weighed in units of 4 seedlings for the fresh weight and then immediately baked to a constant weight and weighed for the dry weight. Finally, the fresh weight (FW) and dry weight (DW) of individual tea seedlings were calculated. The root tips (about 1.0 cm) of tea seedlings after each treatment were randomly taken, mixed, and then quickly used to determine root activity using the triphenyltetrazolium chloride (TTC) method [39].

2.4. Ultrastructural Observation of Leaf Cells

On the second and third mature leaves of the tea seedlings, leaf pieces (approximately 2.0 mm × 2.0 mm in size) were quickly cut in the middle of the leaf (3.0 mm from the veins) with a clean blade. The leaf pieces were quickly placed in 2.5% glutaraldehyde fixative, vacuum pumped, and fixed at 0–4 °C for 24 h. Then, the samples were rinsed with phosphate buffer (pH 7.2) 3 times, fixed in 1.0% osmic acid for 1 h, washed in distilled water 3 times, treated in 50%, 70%, 80%, and 100% acetic acid for 10 min, respectively, and replaced with acetone for 24 h. The ultrathin slices (thickness ≤ 100 nm) of the samples were prepared longitudinally using an ultrathin cryosectioner (EM UC7, Leica Microsystems Inc., Wetzlar, Germany), and the samples were observed and images were collected under a transmission electron microscope (HT7700, Hitachi, Ltd., Tokyo, Japan).

2.5. Chlorophyll Content and Photosynthetic Index Determination

The contents of chlorophyll a, chlorophyll b, and total chlorophyll were determined and calculated according to the methods of Xiang et al. [40]. The photosynthetic indexes of the second and third mature leaves were measured using a portable photosynthesizer (Li-6400, LI-COR Inc., Lincoln, NE, USA). The photosynthetic indexes included Pn, Cond, Tr, and the intercellular CO2 concentration (Ci). The light source in the leaf chamber was LED red and blue light, the temperature of the leaf chamber was 25 ± 2 °C, the lamp was set at 1000.0 μmol/(m2·s), the flow was set at 500.0 μmol/s, and the air flow was kept relatively stable.

2.6. Antioxidant-System-Associated Indicator Determination

The leaves and roots of tea seedlings from each treatment were collected and immediately stored at −80 °C. The malondialdehyde (MDA) content was measured using the TBA method [41]. The content of Pro was determined using the 2.5% acid ninhydrin method [42]. The activity of SOD was determined using a superoxide dismutase detection kit (NBT riboflavin microplate method) (NO. R22262; Yuanye Biotechnology Co., Ltd., Shanghai, China). The activity of POD was determined using a peroxidase kit (guaiacol microplate method) (NO. R30311; Yuanye Biotechnology Co., Ltd., Shanghai, China). The activity of CAT was determined using a catalase kit (ammonium molybdate microplate method) (NO. R22072; Yuanye Biotechnology Co., Ltd., Shanghai, China). The GSH content was measured using a reduced glutathione content detection kit (BC1170; Solarbio Technology Co., Ltd., Beijing, China). The GSSG content was measured using an oxidized glutathione content detection kit (BC1180; Solarbio Technology Co., Ltd., Beijing, China). The activity of GST was determined using a glutathione S-transferase activity detection kit (BC0350; Solarbio Technology Co., Ltd., Beijing, China). The GR activity was assayed using a glutathione reductase activity detection kit (BC1160; Solarbio Technology Co., Ltd., Beijing, China).

2.7. LCD Activity Determination

The activity of LCD was measured with the frozen samples of the treated leaves and roots using a cysteine desulfurase kit (MBE21193; Jiancheng Bioengineering Institute, Nanjing, China).

2.8. Component Determination

According to the method of the international standard ISO 1572:1980 [43], all the fresh leaves, after treatment, were collected and made into dry samples of tea leaves for the detection of quality components. The tea polyphenol content was determined using the forintol colorimetric method according to international standard ISO 14502-1:2005 [44]. The catechin content was determined using the High Performance Liquid Chromatography (HPLC) method according to the international standard ISO 14502-2:2005 [45]. The free amino acid content was determined using ninhydrin colorimetric method according to national standard GB/T 8314-2013 [46]. The caffeine content was determined using HPLC method according to the international standard ISO 10727:2002 [47].

2.9. Statistical Analysis

The experimental data were analyzed using Excel 2016 software (version 16.0.4226.1003, Microsoft Corporation, WA, USA), IBM SPSS Statistics (version 25.0, SPSS Inc, Chicago, IL, USA), and GraphPad Prism software (version 8.0, GraphPad Software, San Diego, CA, USA). The significant differences of results were determined based on an analysis of variance (ANOVA) and Duncan’s multiple range test (p < 0.05) and marked with different letters.

3. Results

3.1. The Cu Contents

The accumulation of Cu in different tea plant tissues showed the following: roots > stems > mature leaves > young leaves (Figure 1). Cu accumulation in the young leaves (Figure 1A), mature leaves (Figure 1B), stems (Figure 1C), and roots (Figure 1D) of tea plants under Cu2+ treatment was significantly higher compared to CK. Compared with the 0.5 mM Cu2+ treatment concentration, only Cu in young leaves was significantly increased under the 1 mM Cu2+ treatment (Figure 1A), while Cu in mature leaves, stems, and roots was significantly decreased (Figure 1B–D). In the absence of exogenous Cu2+, H2S pretreatment resulted in a significant increase in Cu accumulation in the leaves (Figure 1A,B) and roots (Figure 1D) but had no significant effect on Cu accumulation in the stems (Figure 1C), whereas PAG pretreatment resulted in a significant increase in the Cu content in young leaves (Figure 1A) and roots (Figure 1D) and no significant change in Cu accumulation in the stems (Figure 1C) and mature leaves (Figure 1B). Under exogenous 0.5 mM Cu2+ treatment, H2S pretreatment resulted in significantly higher Cu accumulation in young leaves (Figure 1A), but the Cu content in mature leaves, roots, and stems all decreased significantly after H2S pretreatment (Figure 1B–D); meanwhile, PAG pretreatment resulted in significantly higher Cu contents in young leaves (Figure 1A) and roots (Figure 1D) and significantly lower Cu contents in mature leaves (Figure 1B) and stems (Figure 1C), whereas the Cu content in stems was still significantly higher than that in the H2S pretreatment group (Figure 1C). Under exogenous 1.0 mM Cu2+ treatment, H2S pretreatment resulted in a significant decrease in the Cu content in young leaves (Figure 1A) and a significant increase in mature leaves (Figure 1B) and roots (Figure 1D); meanwhile, PAG pretreatment resulted in a significant decrease in the Cu content in young leaves (Figure 1A) and a significant increase in the Cu content in mature leaves (Figure 1B), stems (Figure 1C), and roots (Figure 1D).

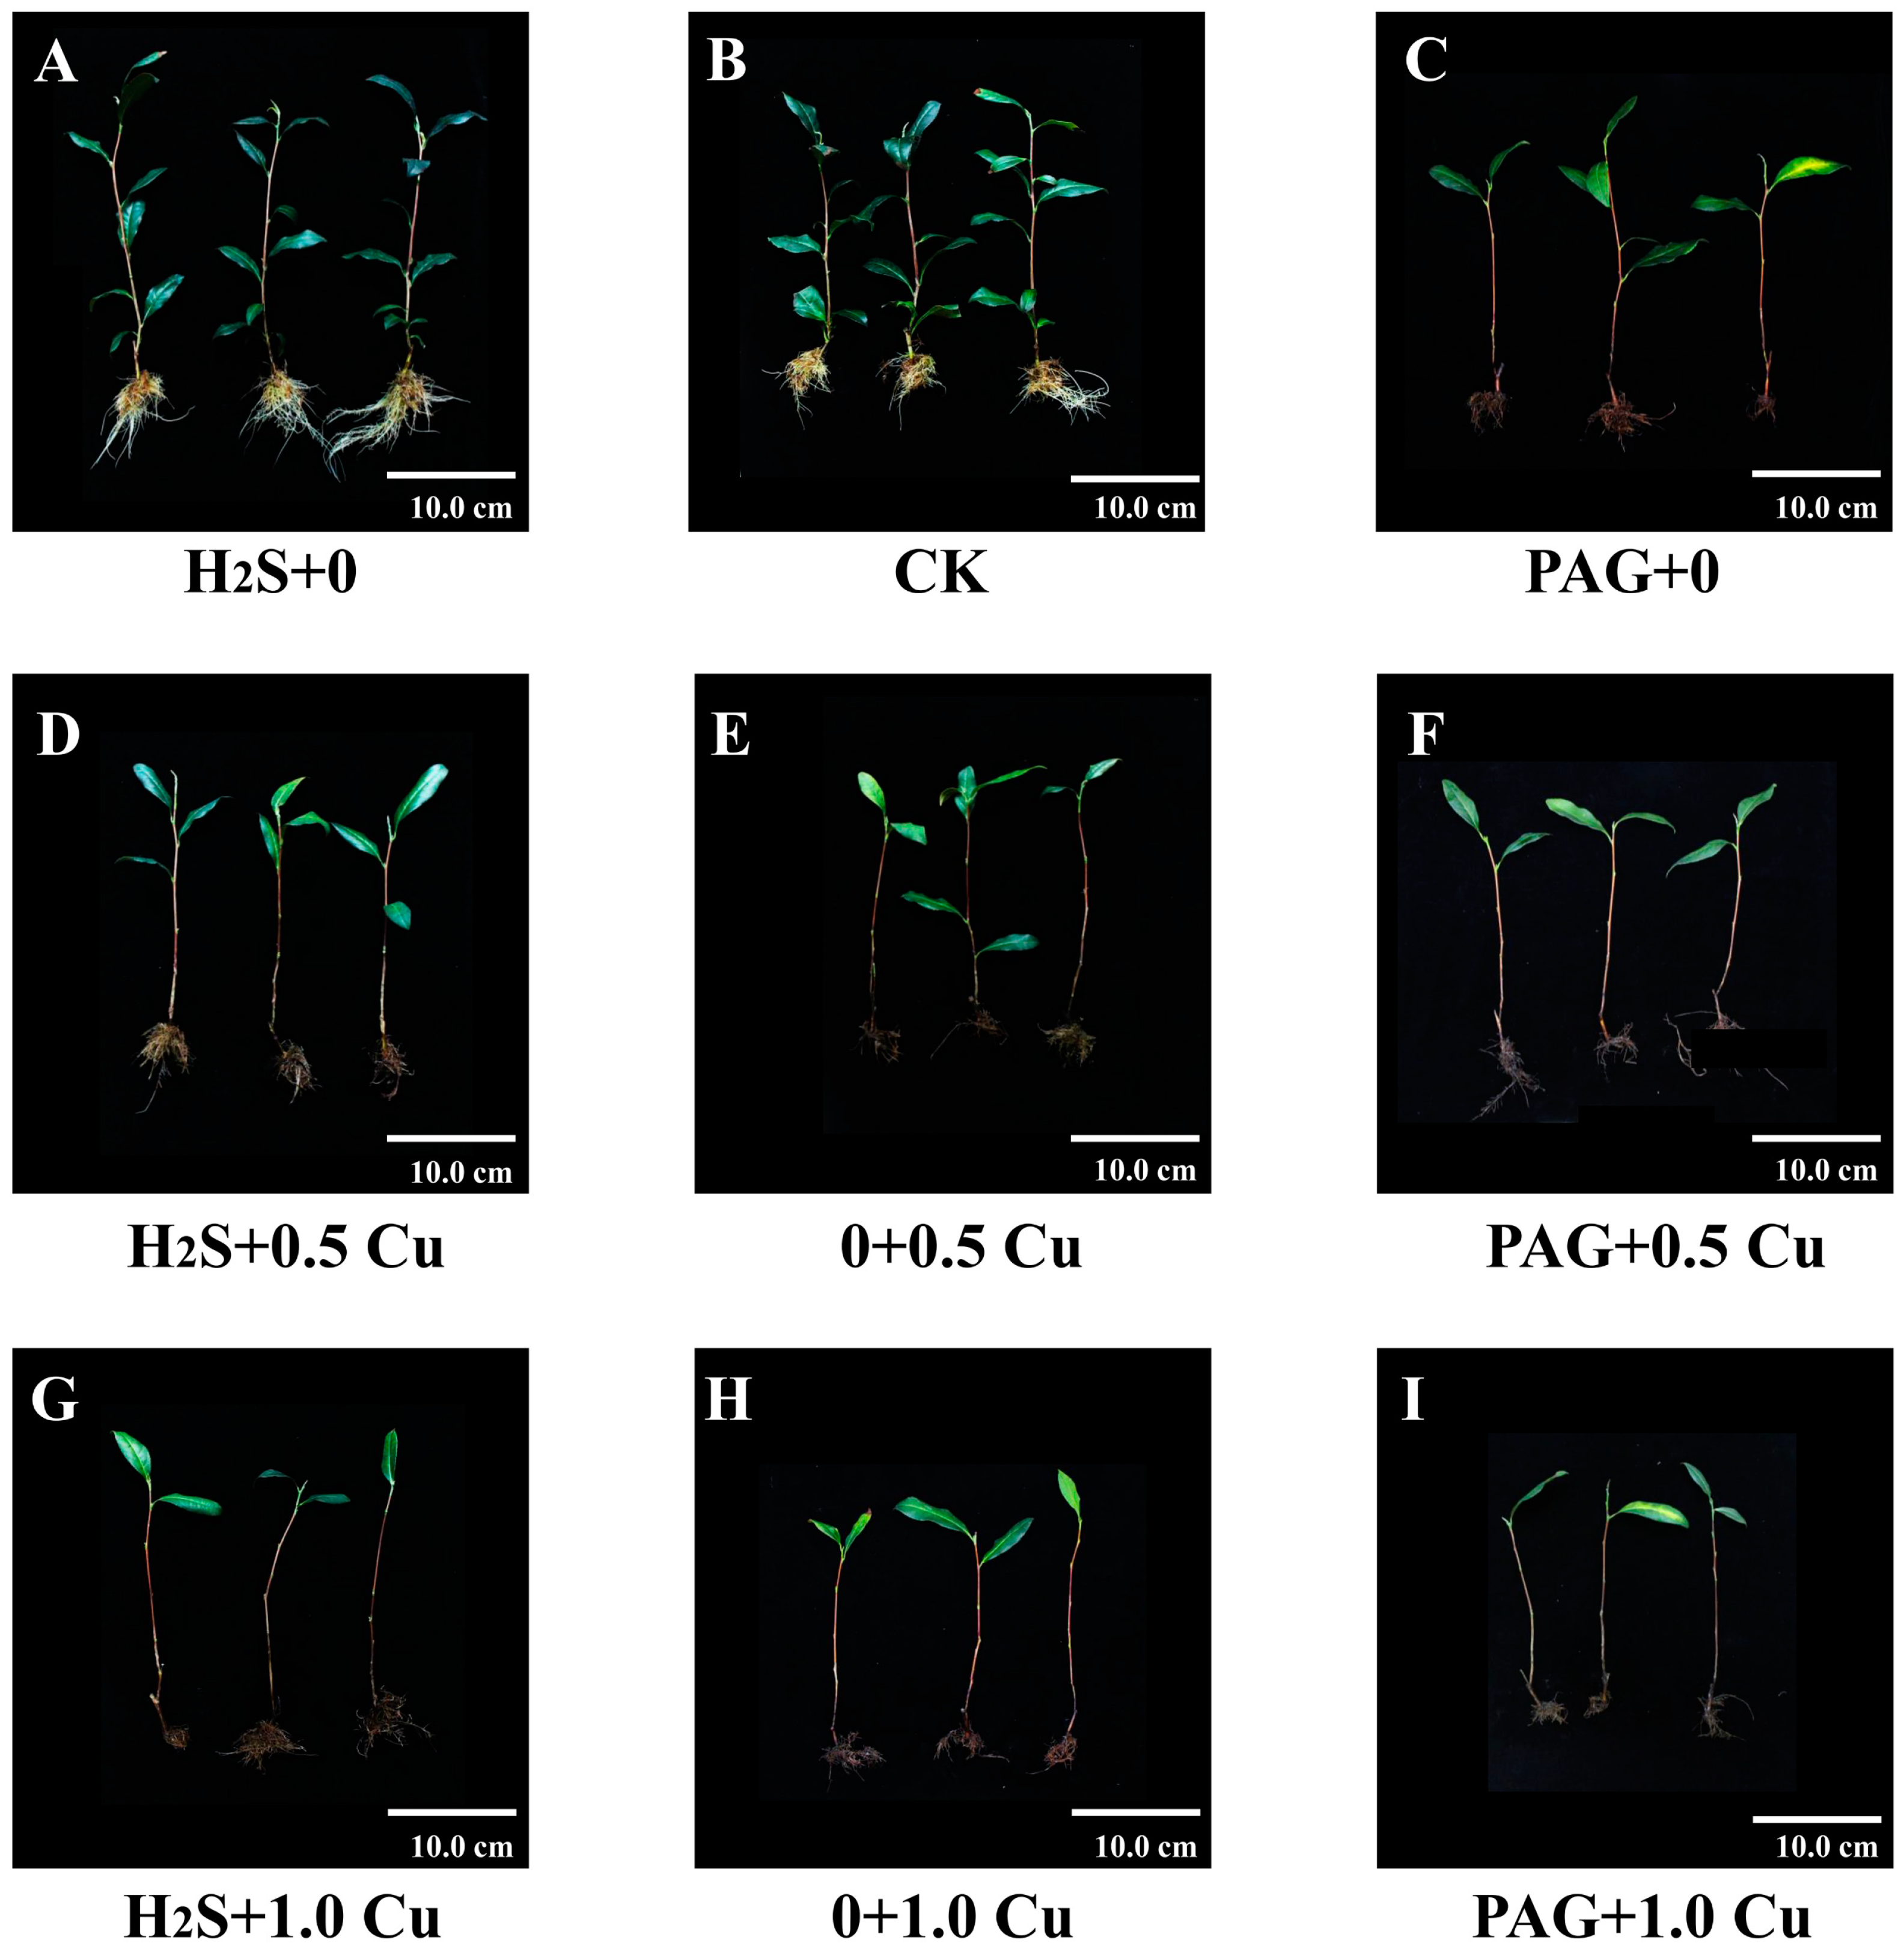
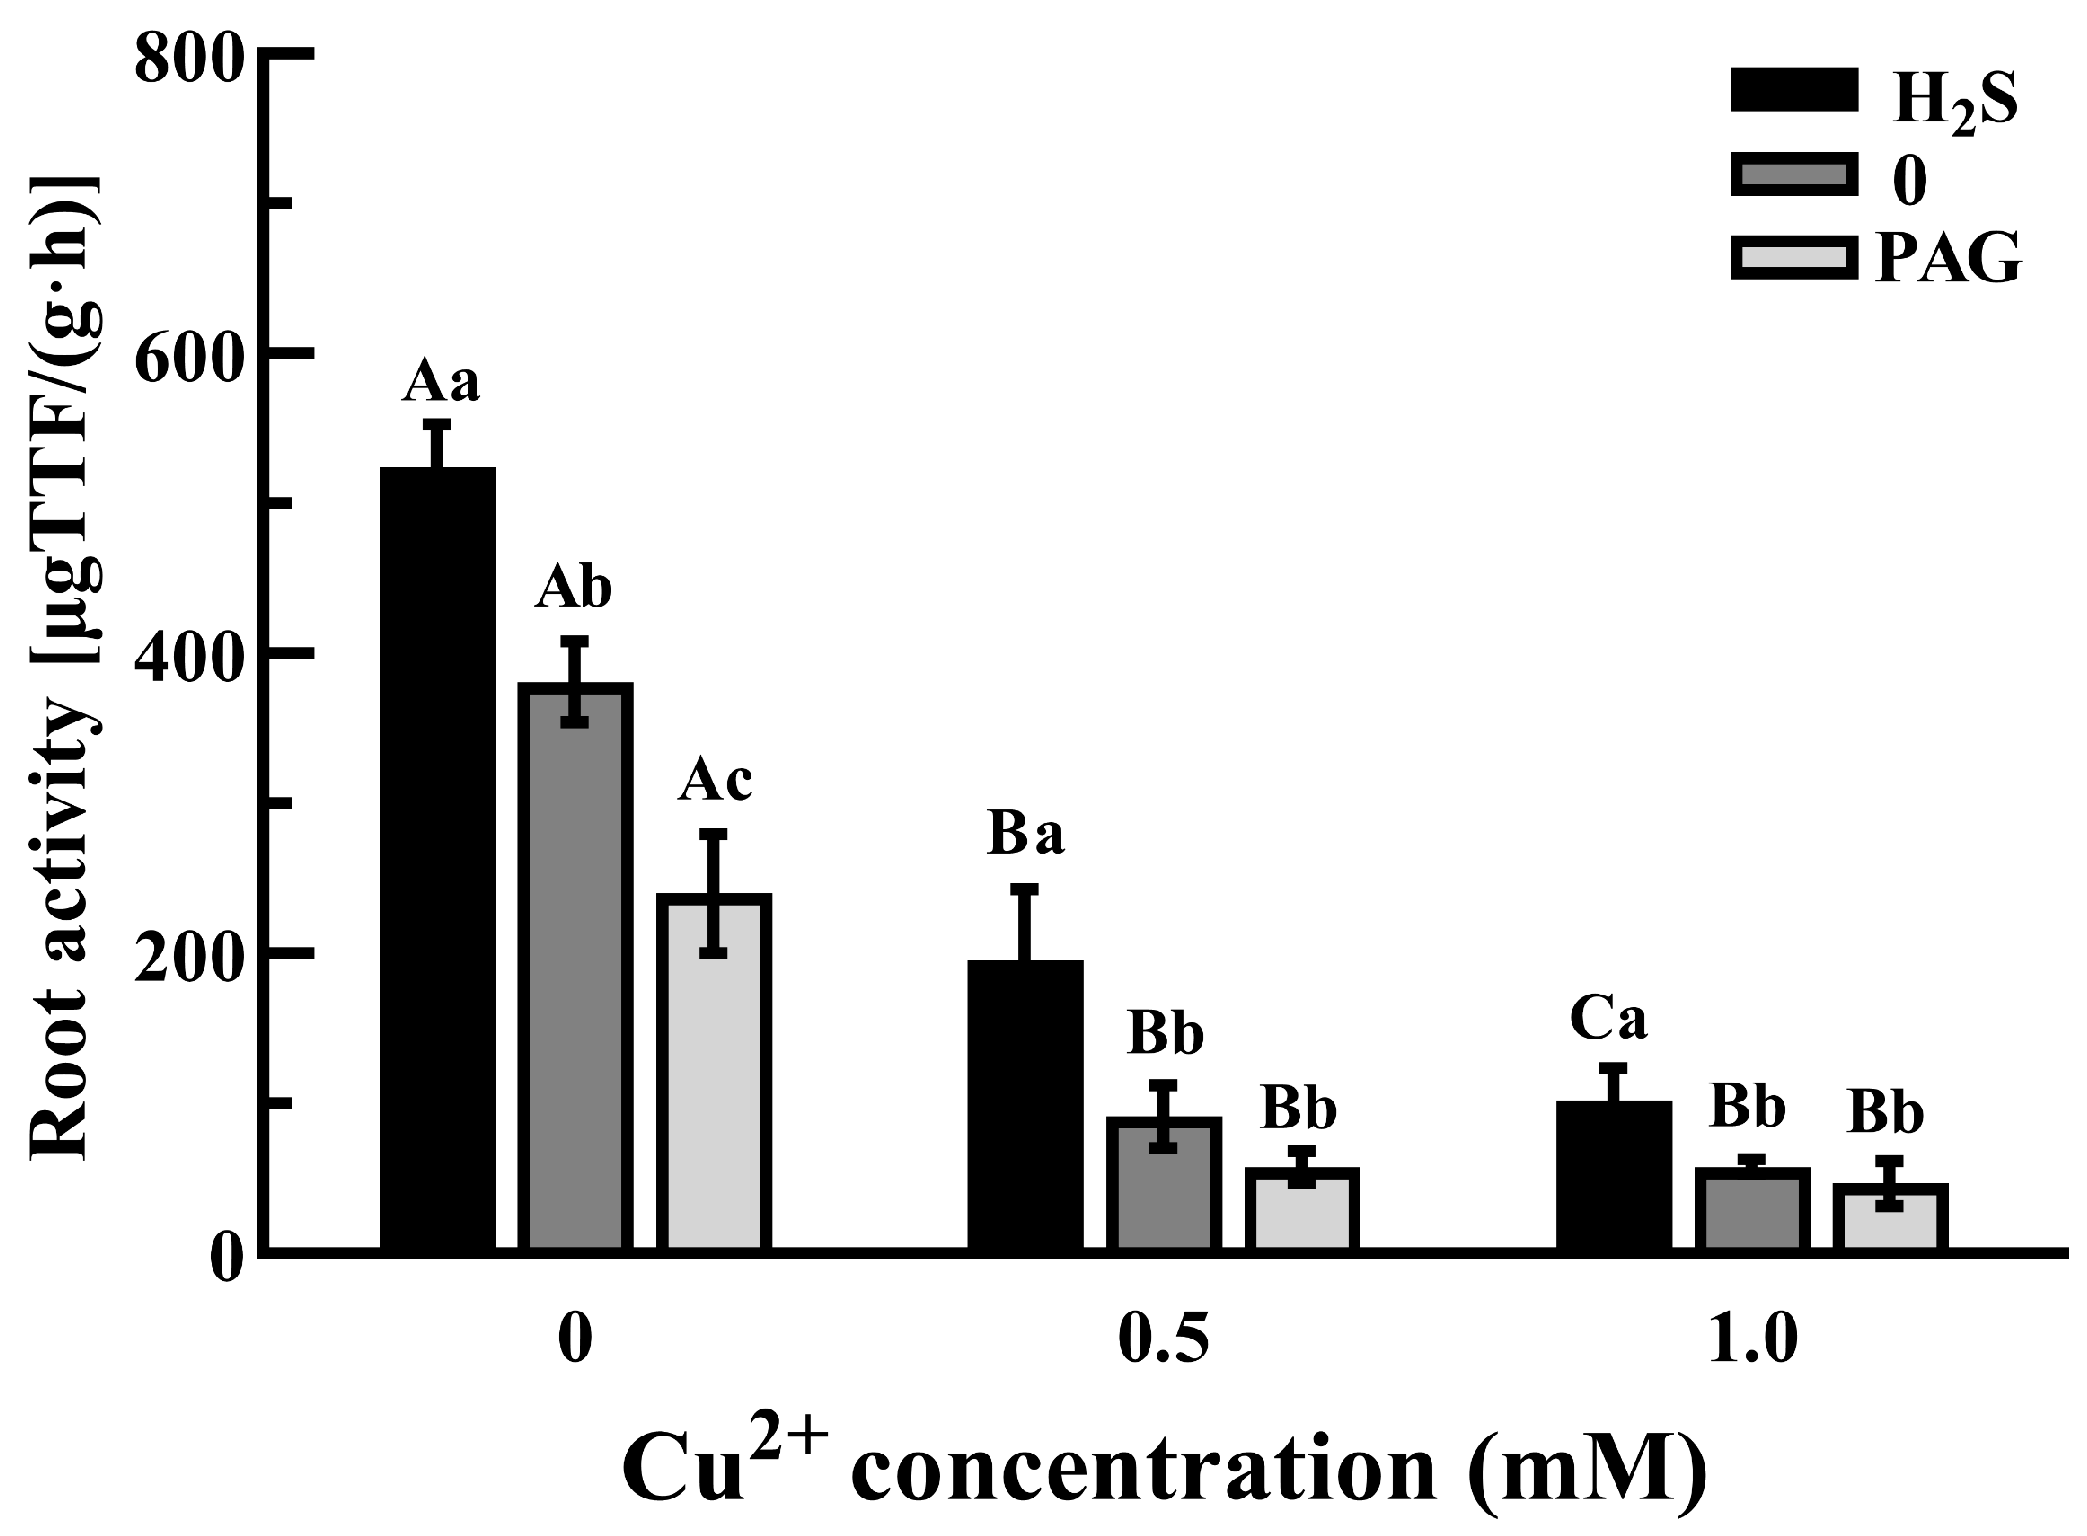
3.2. The Growth and Root Activities of Tea Plants

The phenotypes under each treatment indicated that the growth of the tea plant was significantly inhibited by exogenous Cu2+ stress (Figure 2). Under 0.5 mM Cu2+ treatment, the leaves of tea seedlings were significantly reduced compared with CK, and the roots were dark yellow and brown with a few new roots (Figure 2B,E); under 1 mM Cu2+ treatment, the leaves were more severely shed and turned yellow, the roots were brown and thin, and there was almost no new root growth (Figure 2H). When no exogenous Cu2+ treatment was applied, H2S treatment significantly promoted the growth of tea plants, with more leaves, more root branches, more lateral roots, and significantly longer root lengths (Figure 2A). Under the same concentration of Cu2+ stress, the number of tea seedling roots treated with exogenous H2S was also increased (Figure 2D,G). However, under PAG treatment, the leaves fell off extremely easily, the leaf color lost its green color, and yellow leaves appeared, which were subjected to severe stress damage (Figure 2C,F,I).
From the biomass of tea seedlings under each treatment, it can be seen that exogenous Cu2+ treatment led to a significant decrease in the fresh and dry weights of young and mature leaves, a decrease in the root biomass, but not significant, and no significant change in the stem biomass (Table 2). Without Cu2+ stress, the fresh weight of young leaves and the fresh and dry weight of mature leaves, stems, and roots under H2S pretreatment were significantly higher than those in the CK group (Table 2). Under Cu2+ stress, H2S pretreatment increased the fresh and dry weights of young leaves, mature leaves, stems, and roots to varying degrees, and H2S pretreatment significantly increased the dry weights of roots under 0.5 mM Cu2+ treatment (Table 2). However, without Cu2+ stress, PAG pretreatment significantly reduced the dry weight and fresh weight of young leaves (Table 2); with exogenous Cu2+ treatment, the dry and fresh weights of each tissue of tea plant decreased under PAG pretreatment, but not significantly (Table 2).
The root activities of tea seedlings under each treatment were determined, and the results showed that exogenous Cu2+ significantly inhibited the root activity of the tea plant (Figure 3). H2S pretreatment significantly increased the root activity with or without exogenous Cu2+ application; especially, the root activity in the H2S + 0.5 Cu group was 114.01% higher than that in 0 + 0.5 Cu group, and the root activity in the H2S + 1.0 Cu group was 77.07% higher than that in the 0 + 1.0 Cu group (Figure 3). In the absence of exogenous Cu2+, PAG pretreatment significantly reduced the root activity; with exogenous Cu2+ stress, root activity decreased but not significantly under PAG pretreatment (Figure 3).

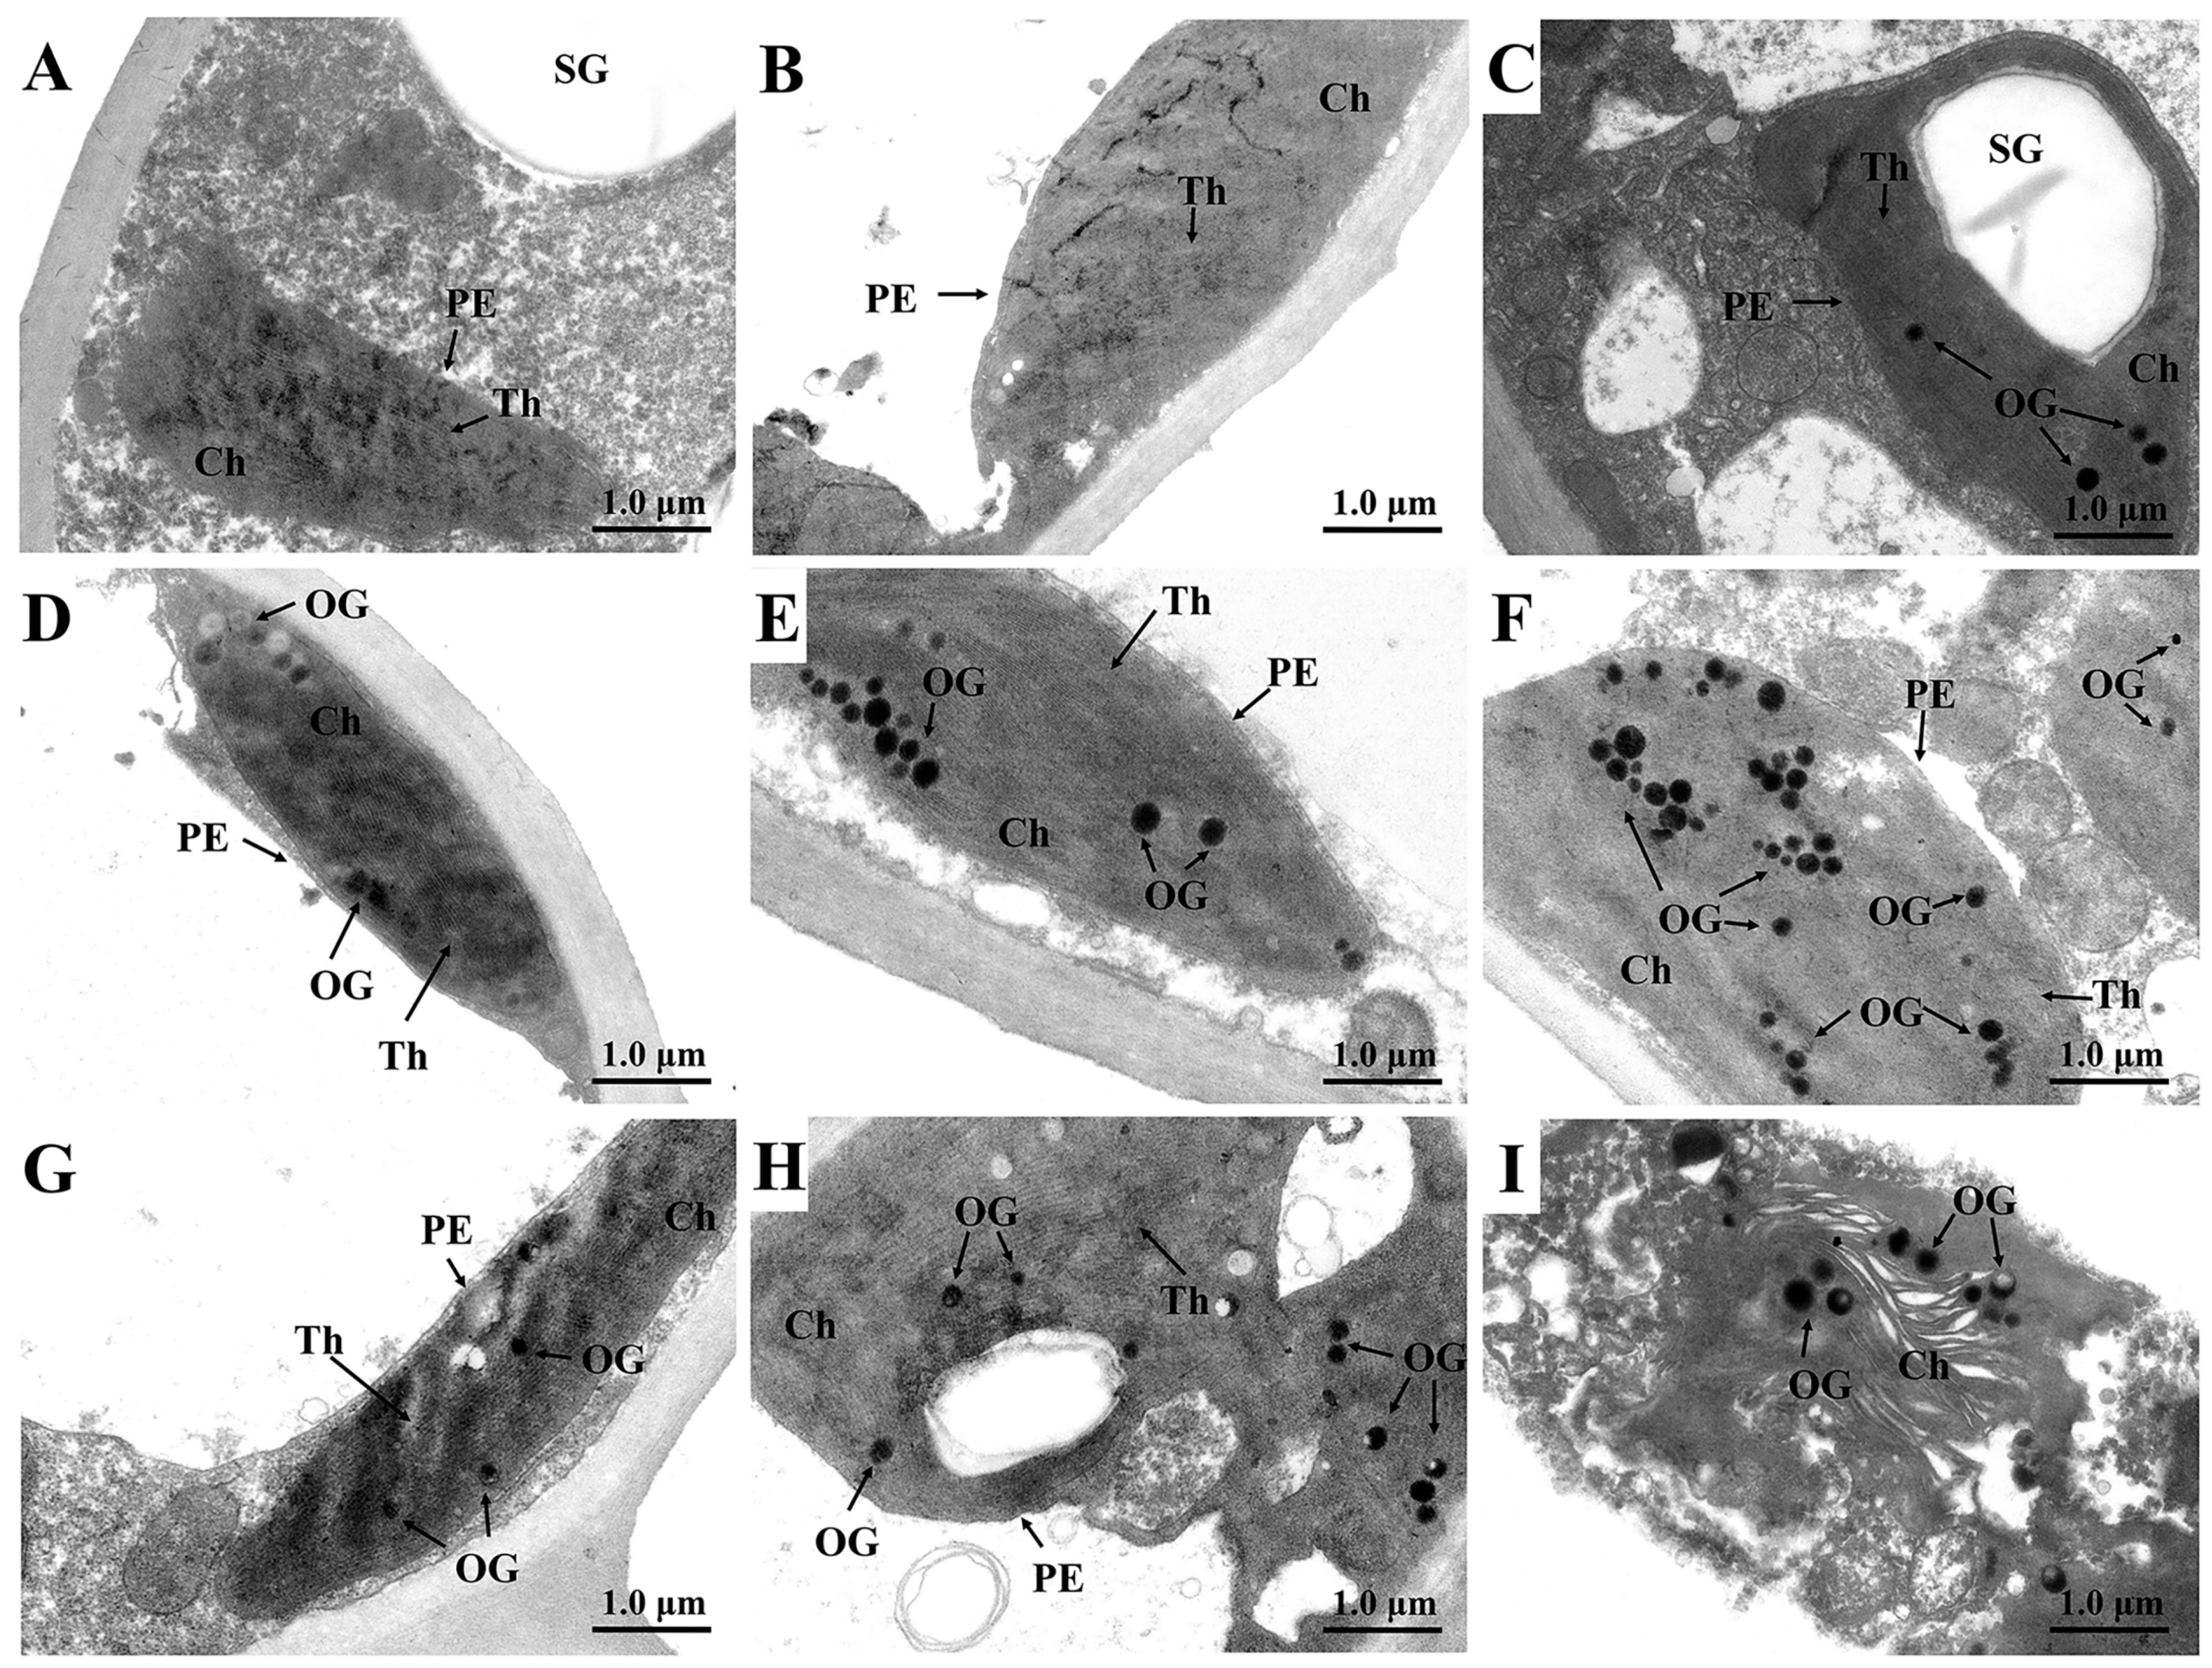
3.3. The Ultrastructural Changes in Leaf Cells

The ultrastructure of tea plant leaf cells under different treatments was investigated (Figure 4). In the absence of exogenous Cu2+, the chloroplast structure in the leaf cells pretreated with H2S was complete and oval, the chloroplast membrane was clearly visible, the matrix lamella was closely arranged along the longitudinal direction of the chloroplast, there were no osmiophilic granules in the chloroplasts, and starch granules were contained in the cells (Figure 4A); a small number of osmiophilic granules appeared in the leaf cells after PAG pretreatment (Figure 4C). In the CK group, the chloroplast membranes and cell membranes were clearly visible, and chloroplasts were oval and close to the inner side of cell membrane, and their matrix lamellae were closely arranged along the longitudinal direction of chloroplasts (Figure 4B). The chloroplast membranes of leaf cells under the stress of exogenous 0.5 mM and 1.0 mM Cu2+ were still clearly visible, chloroplasts were complete, matrix lamellae were tightly arranged, and more osmiophilic granules appeared (Figure 4E,H), whereas chloroplasts were deformed and larger vacuoles appeared after treatment with 1.0 mM Cu2+ (Figure 4H). Under 0.5 mM and 1.0 mM Cu2+ stress, a small number of osmiophilic granules and complete and oval chloroplast structures were observed in leaf cells pretreated with exogenous H2S (Figure 4D,G), but small vacuoles appeared in leaf cells of the H2S + 1.0 Cu treatment group (Figure 4G). In the PAG + 0.5 Cu treatment group, the chloroplast structure of leaf cells was relatively complete and began to dissolve, with a large number of osmiophilic granules in chloroplasts (Figure 4F); in the PAG + 1.0 Cu treatment group, the chloroplast envelope in the leaf cells was destroyed, the chloroplasts were free in the leaf cells, the matrix lamellae structure was disordered and fractured, and there were almost no starch granules, containing a large number of osmiophilic granules (Figure 4I).

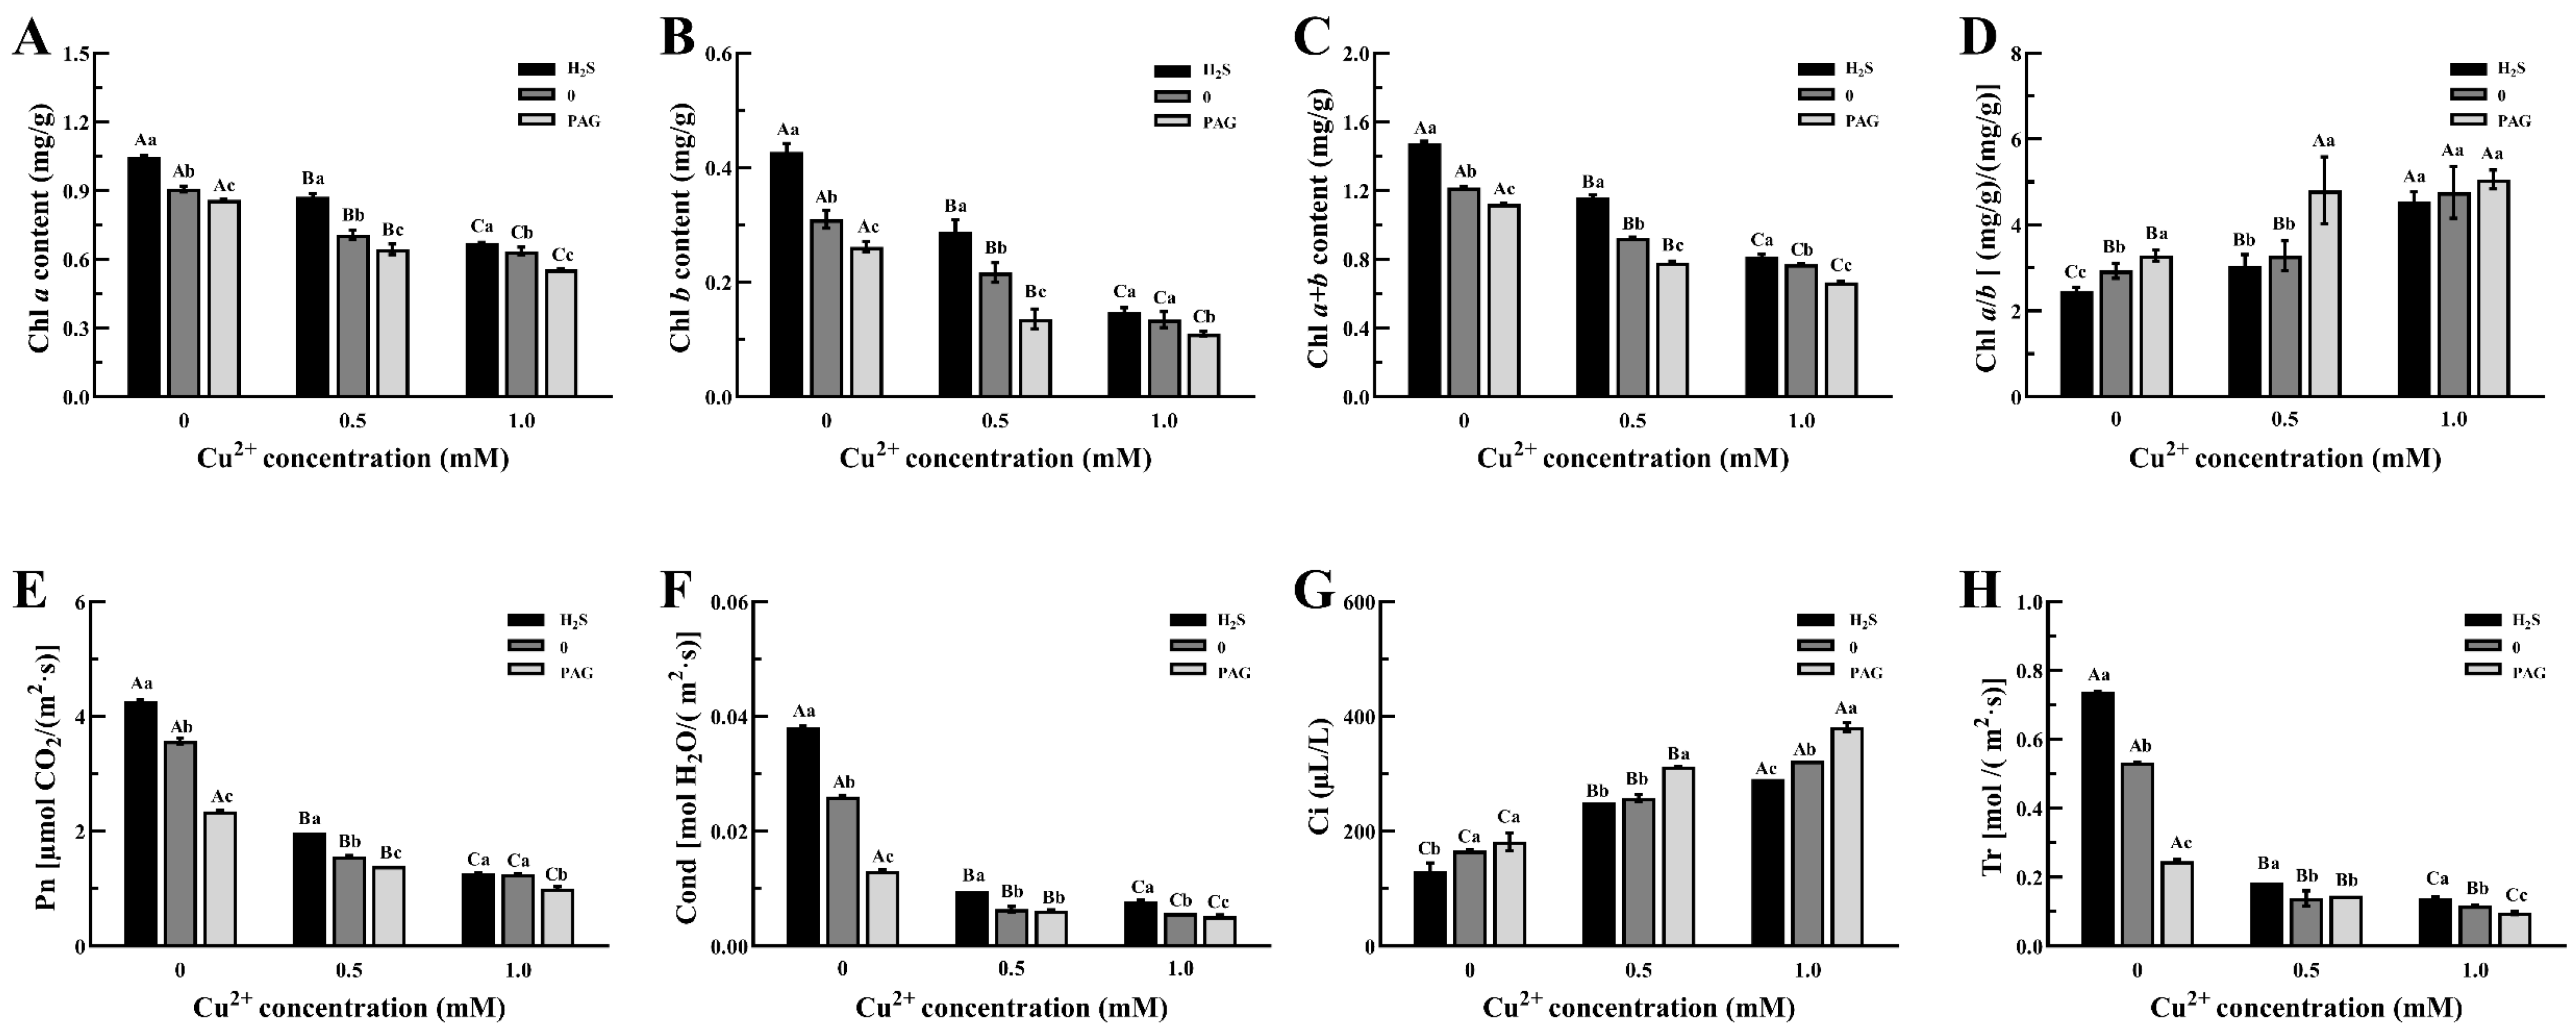
3.4. The Changes in the Photosynthetic System in Tea Plants

The level of the chlorophyll content directly affects the photosynthesis ability of plants and the quality of tea products (Figure 5). It was found that exogenous Cu2+ stress of 0.5 mM or 1.0 mM significantly decreased the contents of chlorophyll a, chlorophyll b, and total chlorophyll (Figure 5A–C), and the higher the concentration of Cu2+ stress, the greater the degree of a decline in these contents (Figure 5). Under 0.5 mM and 1.0 mM Cu2+ stress, the chlorophyll a and total chlorophyll contents in tea leaves pretreated with H2S were significantly increased compared with those in the Cu2+ stress treatment group (Figure 5A,C); under 0.5 mM Cu2+ stress, the chlorophyll b content was significantly increased after H2S pretreatment, but the change in the chlorophyll b content was not significant under H2S + 1.0 Cu treatment (Figure 5B). The contents of chlorophyll a, chlorophyll b, and total chlorophyll in the PAG + 0.5 Cu and PAG + 1.0 Cu treatment groups were significantly lower than those in the same concentration of Cu2+ stress treatment group (Figure 5A–C).
The ratio of chlorophyll a/b in tea plant increased with the increase in the Cu2+ stress concentration. Under the stress of exogenous Cu2+, the ratio of chlorophyll a/b of tea plants had no significant change after H2S pretreatment (Figure 5D). Under treatment with 0.5 mM Cu2+, the ratio of chlorophyll a/b increased significantly after PAG pretreatment compared with the same concentration of Cu2+; under 1.0 mM Cu2+, there was no significant change in the PAG + 1.0 Cu treatment group compared with the 0 + 1.0 Cu treatment group (Figure 5D).
In addition, the photosynthetic indexes were also measured, and the results showed that with the increase in the Cu2+ stress concentration, Pn of leaves significantly decreased (Figure 5E). Under 0.5 mM Cu2+ stress, Pn after H2S pretreatment was significantly higher than that in the 0 + 0.5 Cu group; under 1.0 mM Cu2+ stress, there was no significant difference in Pn between the H2S + 1.0 Cu group and the 0 + 1.0 Cu group (Figure 5E). However, regardless of whether there was exogenous Cu2+ treatment, the Pn of the PAG pretreatment group was significantly lower than that of the group with 0 pretreatment (Figure 5E).
Moreover, the leaf Cond significantly decreased with the increase in the Cu2+ stress concentration (Figure 5F). Under exogenous Cu2+ treatment, the Cond significantly increased under H2S pretreatment (Figure 5F). Compared with the CK or 0 + 1.0 Cu group, the Cond of PAG + 0 or PAG + 1.0 Cu treatment groups significantly decreased, while the difference between the PAG+ 0.5 Cu treatment group and the 0+ 0.5 Cu group was not significant (Figure 5F).
With the increase in the Cu2+ stress concentration, the Ci of leaves significantly increased (Figure 5G). Under no external Cu2+ stress and external 1.0 mM Cu2+ stress, H2S pretreatment resulted in a significant decrease in Ci (Figure 5G). Under the application of exogenous Cu2+ stress, the Ci of the PAG pretreatment group significantly increased compared to that of groups with other pretreatments (Figure 5G).
Compared to the groups without Cu2+ treatment, the Tr of leaves significantly decreased after external Cu2+ treatment (Figure 5H). With or without exogenous Cu2+ treatment, Tr significantly increased under H2S pretreatment (Figure 5H), whereas the Tr was significantly decreased in the PAG + 0 or PAG + 1.0 Cu treatment groups as compared to the CK or 0 + 1.0 Cu group (Figure 5H).

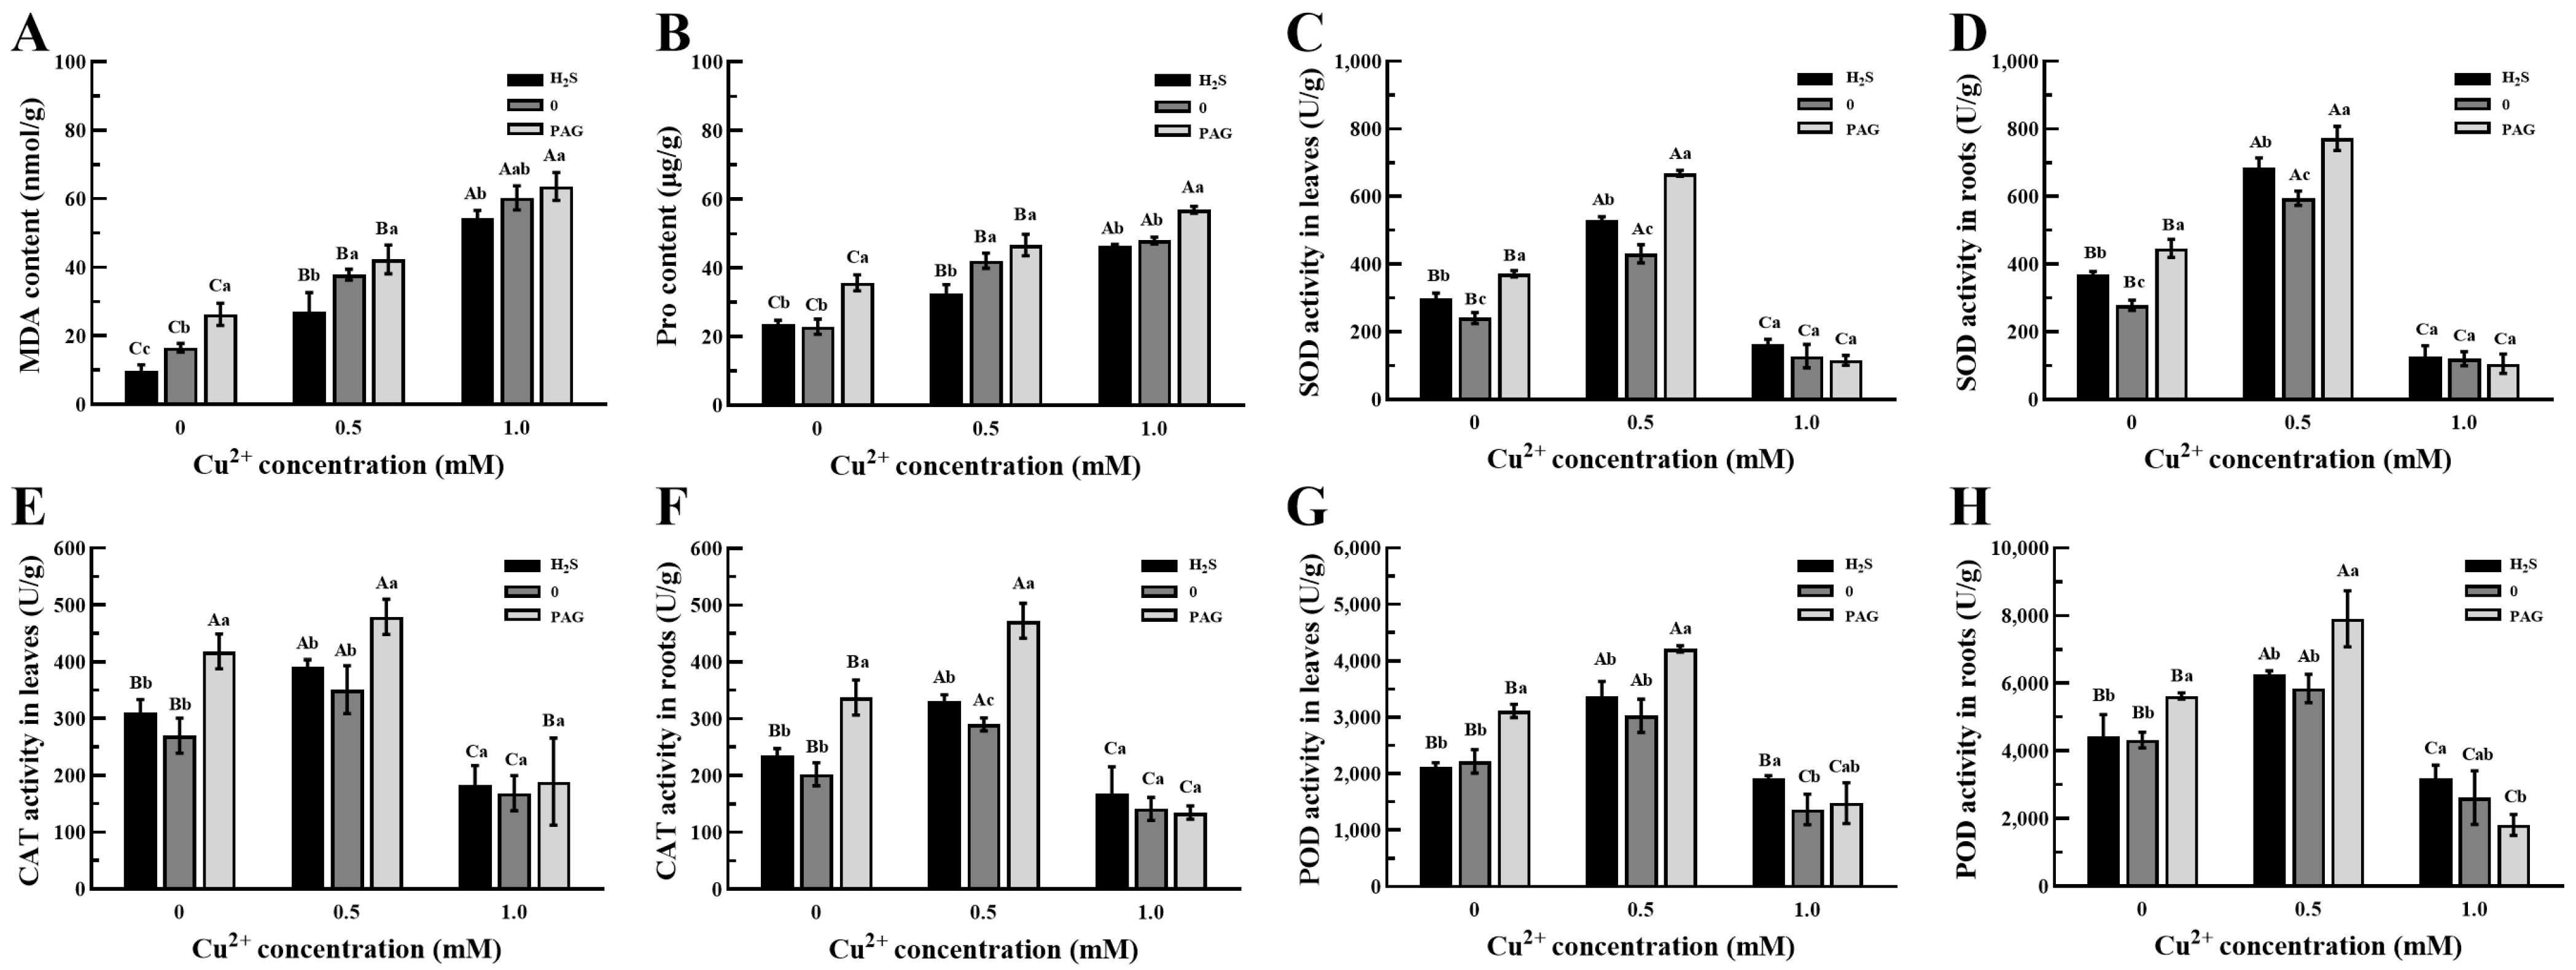
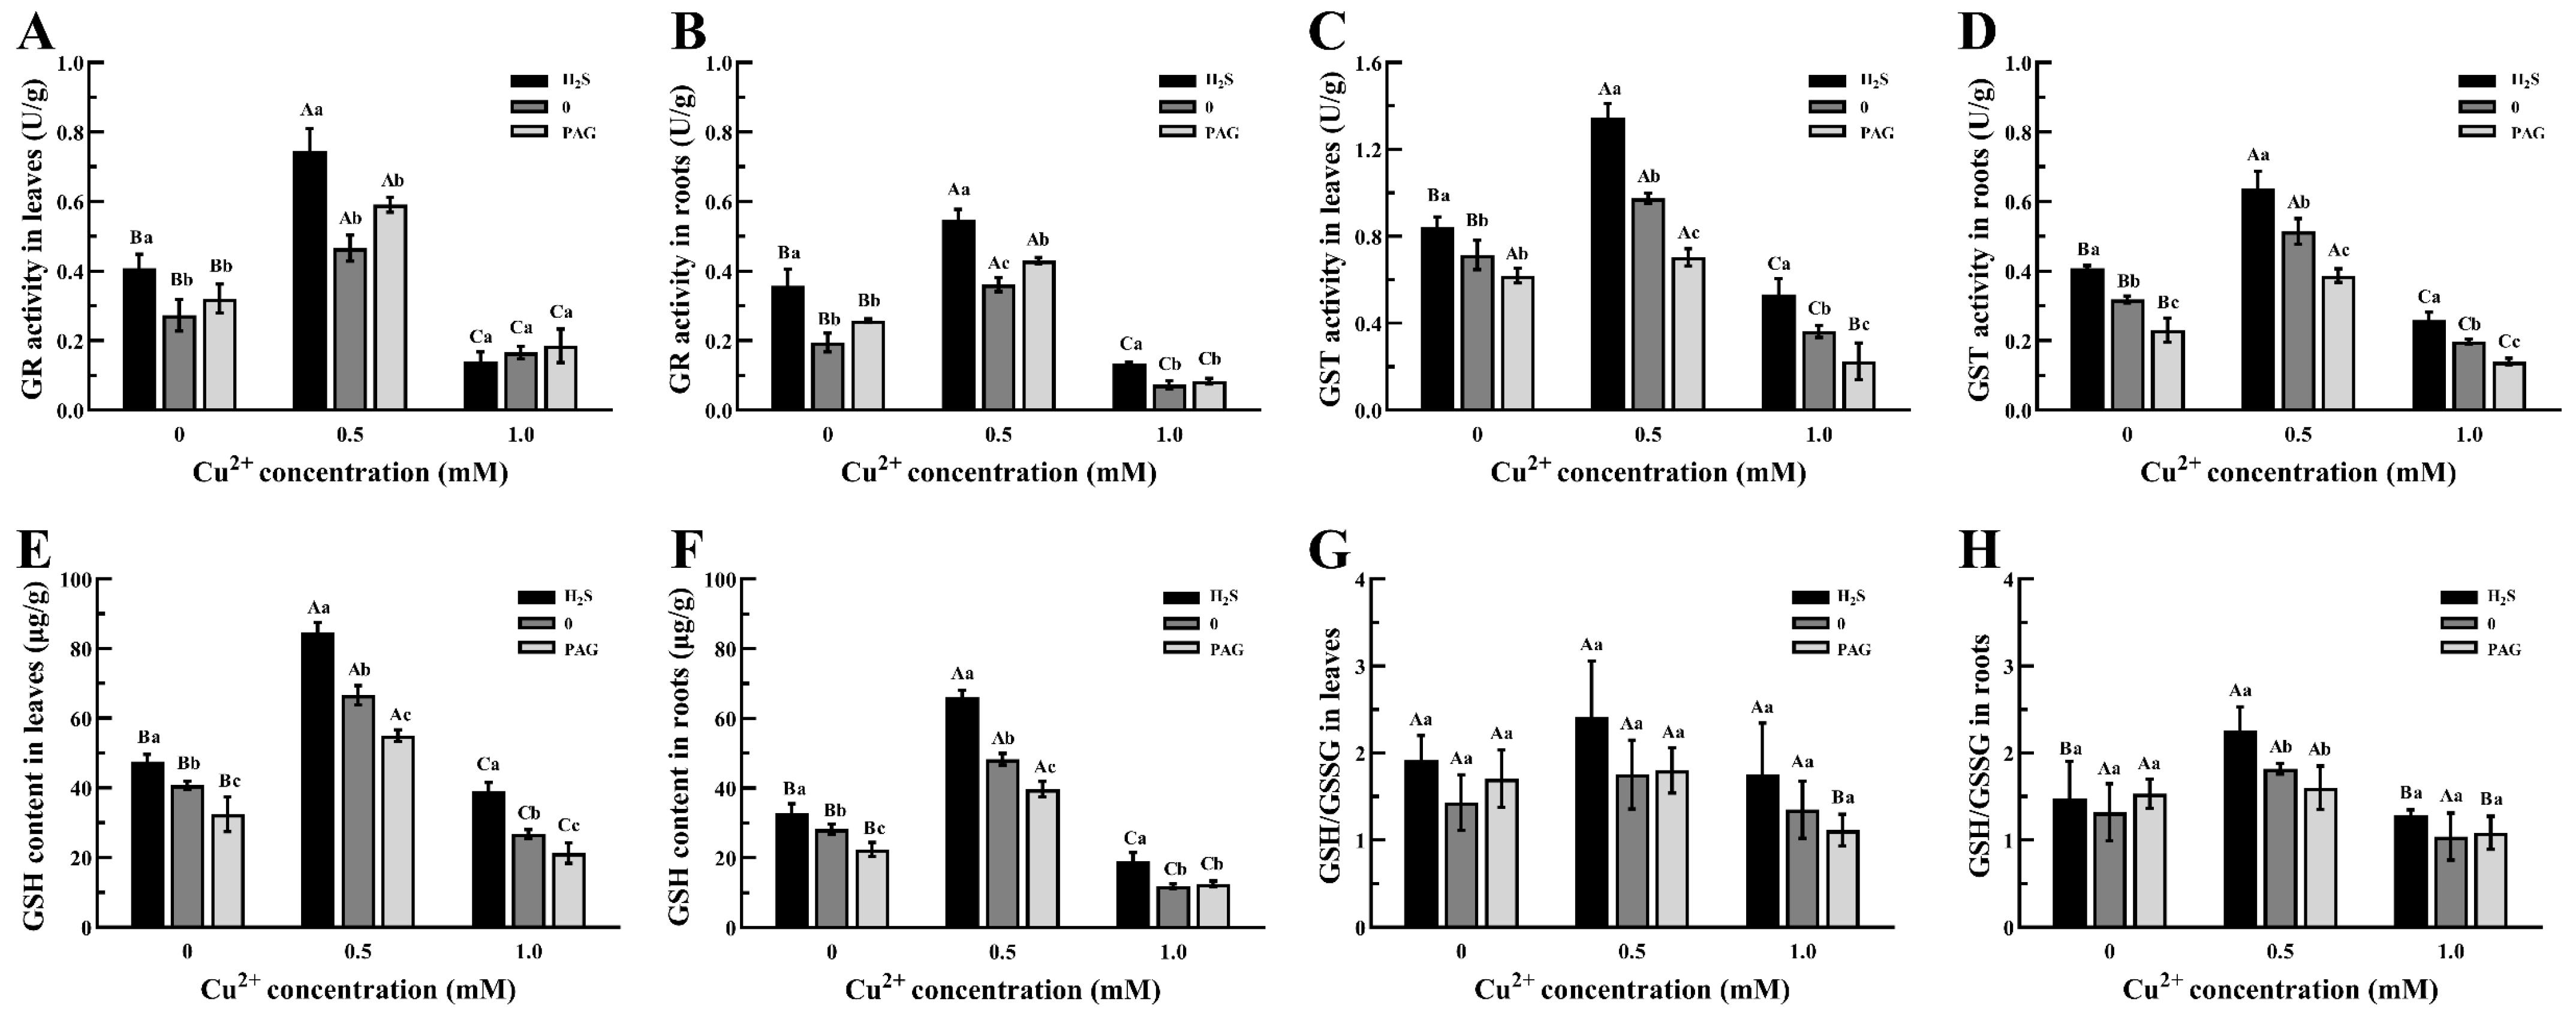
3.5. The Changes in the Antioxidant System in Tea Plants

The effect of H2S on the antioxidant system of tea leaves in response to Cu2+ stress was studied (Figure 6). The MDA content in leaves significantly increased with an increasing Cu2+ stress concentration (Figure 6A). In the absence of exogenous Cu2+ stress, H2S pretreatment significantly reduced the MDA content, while PAG pretreatment resulted in a significant increase in the MDA content (Figure 6A). Under exogenous 0.5 mM Cu2+ stress, H2S pretreatment also significantly reduced the MDA content (Figure 6A). Meanwhile, under exogenous 1.0 mM Cu2+ stress, the MDA content with H2S pretreatment was not significantly different from that of the 0 + 1.0 Cu group but significantly lower than that with PAG pretreatment (Figure 6A).
With the increase in the Cu2+ stress concentration, the content of Pro in leaves significantly increased (Figure 6B). Under 0.5 mM Cu2+ stress, the Pro content in leaves pretreated with H2S significantly decreased compared to the 0 + 0.5 Cu group, while there was no significant difference in Pro content between leaves pretreated with H2S and those with 0 pretreatment under no exogenous Cu2+ treatment or 1.0 mM Cu2+ stress (Figure 6B). The Pro content of leaves pretreated with PAG was significantly higher than that of other pretreatment groups under either no exogenous Cu2+ treatment or 1.0 mM Cu2+ stress, whereas the difference between the PAG + 0.5 Cu group and 0 + 0.5 Cu group was not significant (Figure 6B).
Under exogenous Cu2+ treatment, the SOD activities of leaves and roots was obviously enhanced under 0.5 mM Cu2+ stress and significantly decreased under 1.0 mM Cu2+ stress (Figure 6C,D). Under the stress of 0.5 mM Cu2+, both exogenous H2S pretreatment and PAG pretreatment significantly increased the SOD activity in leaves and roots, and the activity after PAG pretreatment was significantly higher than that with H2S treatment (Figure 6C,D). In contrast, there was no significant effect of H2S pretreatment or PAG pretreatment on the SOD activity in the leaves and roots under 1.0 mM Cu2+ stress (Figure 6C,D).
The CAT activity in leaves and roots was significantly increased under 0.5 mM Cu2+ stress, while it was significantly reduced under 1.0 mM Cu2+ stress (Figure 6E,F). The effect of H2S pretreatment on leaf CAT activity was not significant, but H2S pretreatment significantly increased CAT activity in roots under 0.5 mM Cu2+ stress (Figure 6E,F). Under 1.0 mM Cu2+ stress, PAG pretreatment had no significant effect on CAT activity in both leaves and roots; however, under no external Cu2+ treatment or the exogenous application of 0.5 mM Cu2+ stress, CAT activity in leaves and roots in the PAG pretreatment group was markedly higher than that in 0 pretreatment group and H2S pretreatment group (Figure 6E,F).
Similarly, the activity of POD in leaves and roots significantly increased compared to the CK group under 0.5 mM Cu2+ stress, but it significantly decreased under 1.0 mM Cu2+ stress (Figure 6G,H). H2S pretreatment significantly enhanced POD activity in leaves only under 1.0 mM Cu2+ stress and had no significant effect on leaf POD activity under other concentrations of Cu2+ treatment and POD activity in roots (Figure 6G,H). Under 0.5 mM Cu2+ stress, PAG pretreatment resulted in a significant increase in POD activity in both the leaves and roots; with 1.0 mM Cu2+ stress, PAG pretreatment had no significant effect on POD activity in leaves and roots (Figure 6G,H).
Furthermore, GR activity in leaves and roots was also significantly increased under 0.5 mM Cu2+ stress and significantly suppressed under 1.0 mM Cu2+ stress (Figure 7A,B). With no exogenous Cu2+ treatment or 0.5 mM Cu2+ stress, leaf GR activity was evidently increased by H2S pretreatment (Figure 7A). Meanwhile, PAG pretreatment had no significant effect on GR activity in leaves (Figure 7A). H2S pretreatment significantly enhanced the GR activity in roots with or without exogenous Cu2+ stress (Figure 7B). However, PAG pretreatment significantly elevated GR activity in roots only under 0.5 mM Cu2+ stress, and the extent of the elevation was significantly lower than that in the H2S pretreatment group (Figure 7B).
In addition, the relevant indexes of the non-enzymatic antioxidant system of tea plants under each treatment were also determined. The GST activities in leaves and roots were significantly increased under exogenous 0.5 mM Cu2+ stress and then significantly decreased with the 1.0 mM Cu2+ stress (Figure 7C,D). After exogenously applied Cu2+ stress, H2S pretreatment resulted in a significant elevation in GST activity in leaves and roots, and PAG pretreatment resulted in the obvious inhibition of GST activity in leaves and roots (Figure 7C,D).
The content of GSH in leaves and roots also increased significantly under 0.5 mM Cu2+ stress and decreased significantly under 1.0 mM Cu2+ stress (Figure 7E,F). H2S pretreatment resulted in significantly higher GSH contents in leaves and roots under 0, 0.5, and 1.0 mM Cu2+ treatments (Figure 7E,F). PAG pretreatment resulted in a significant decrease in the GSH content in leaves under all concentrations of Cu2+ treatments, as well as that in roots under 0 and 0.5 mM Cu2+ treatments, whereas it had no significant effect on GSH contents in roots under 1.0 mM Cu2+ stress (Figure 7E,F).
The GSH/GSSG ratio is the main dynamic indicator of the redox state of cells, reflecting the redox state of tea plants under Cu2+ stress. Increasing concentrations of Cu2+ alone did not significantly alter GSH/GSSG in leaves and roots (Figure 7G,H). After H2S pretreatment, the GSH/GSSG of leaves increased but not significantly, while that of roots was sensibly enhanced under 0.5 mM Cu2+ stress (Figure 7G,H). After PAG pretreatment, the changes in the GSH/GSSG in the leaves and roots were not obvious (Figure 7G,H).

3.6. The Changes in LCD Activities in Tea Plants

The activities of LCD in tea seedlings under each treatment were examined, as this is the key synthetic enzyme for endogenous H2S production. The results showed that the LCD activities of leaves and roots were significantly increased under exogenous 0.5 mM Cu2+ stress and significantly decreased under 1.0 mM Cu2+ stress (Figure 8A,B). When treated with exogenous Cu2+, the LCD activities of leaves markedly increased under H2S pretreatment (Figure 8A); the root LCD activities under H2S pretreatment significantly increased under 0.5 mM Cu2+ stress and also ascended but, not significantly, under 1.0 mM Cu2+ stress (Figure 8B). Under PAG pretreatment, the LCD activities in both leaves and roots were significantly inhibited under 0.5 mM Cu2+ stress, while there was no significant change in those with PAG pretreatment under 1.0 mM Cu2+ stress (Figure 8A,B).

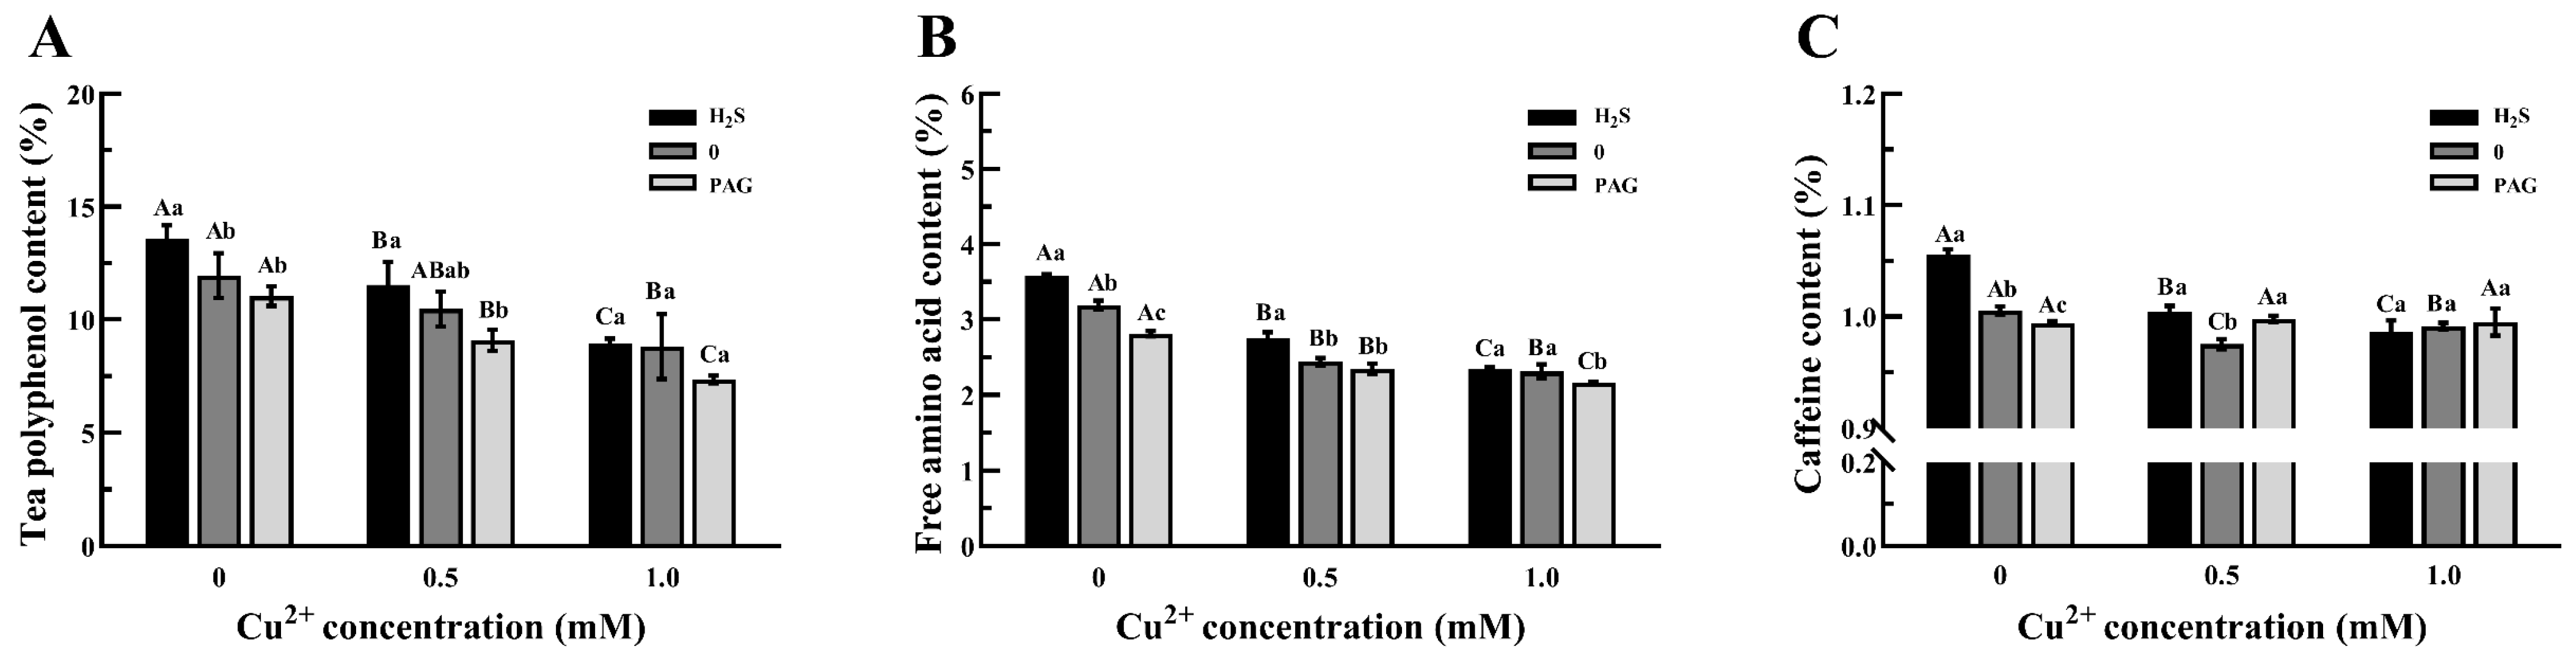
3.7. The Changes in Main Components in Tea Plants

In this study, the change in the main components of tea seedlings under each treatment was monitored. The results revealed that the tea polyphenol content showed a decreasing trend with an increasing Cu2+ treatment concentration and was significantly reduced under 1.0 mM Cu2+ stress (Figure 9A). The content of tea polyphenols in tea plants pretreated with H2S without exogenous Cu2+ treatment was significantly higher than other treatments (Figure 9A). Under Cu2+ stress of 0.5 mM or 1.0 mM, the tea polyphenol content in leaves pretreated with H2S was higher than that in the 0 pretreatment group, but not significantly (Figure 9A). The tea polyphenol contents in PAG pretreatment groups were all not markedly lower than those in the 0 pretreatment groups (Figure 9A).
The total catechins gradually decreased with the increase in the Cu2+ concentration (Table 3). Under each concentration of Cu2+ treatment, the total catechins of tea leaves in the H2S pretreatment group were higher than those in the 0 pretreatment group, but not significantly; the total catechins in the PAG pretreatment group were lower than those in the 0 pretreatment group, which were also not significant (Table 3). Additionally, compared with the CK group, the exogenous application of 0.5 mM Cu2+ stress resulted in a significant increase in the gallocatechin gallate (GCG) content, a significant decrease in the epicatechin gallate (ECG) content, a decrease, but not significant, in gallocatechin (GC), epigallocatechin (EGC), epigallocatechin gallate (EGCG), and ester catechin contents, an increase, but not obvious, in the epicatechin (EC) content, and no change in the catechin (C) content (Table 3). Under 1.0 mM Cu2+ stress, the contents of GC, EGC, and GCG decreased significantly, while the contents of EC, EGCG, and ester catechins decreased, but not significantly, while the contents of C and ECG did not change (Table 3). Furthermore, in the absence of exogenous Cu2+, the contents of C, EC, EGCG, GCG, and ester catechins in tea leaves increased significantly after exogenous H2S pretreatment, while the content of GC decreased significantly, and the changes in EGC and ECG contents were not obvious (Table 3). Under 0.5 mM Cu2+ treatment, the ECG content increased significantly, the C content decreased markedly, and other catechin changes were not obvious in tea leaves pretreated with H2S; under 1.0 mM Cu2+ treatment, the contents of EC and GCG increased significantly, the C content decreased significantly, and other changes were unremarkable in the H2S pretreatment group (Table 3).
Under both 0.5 mM and 1.0 mM Cu2+ stress, the free amino acid contents of tea leaves were significantly lower compared to the groups without exogenous Cu2+ treatment (Figure 9B). The free amino acid contents of leaves pretreated with H2S were significantly enhanced in the absence of exogenous Cu2+ treatment or under 0.5 mM Cu2+ stress; meanwhile, those pretreated with PAG were significantly diminished under no exogenous Cu2+ or exogenous 1.0 mM Cu2+ stress (Figure 9B).
Compared with the CK group, the contents of caffeine of leaves were significantly reduced under 0.5 mM and 1.0 mM Cu2+ stress (Figure 9C). In the absence of exogenous Cu2+ treatment or in the presence of exogenous 0.5 mM Cu2+ stress, the caffeine content in leaves significantly increased after H2S pretreatment (Figure 9C). The caffeine contents in the leaves pretreated with PAG significantly decreased when there was no external Cu2+ treatment and significantly increased under exogenous 0.5 mM Cu2+ stress (Figure 9C). Under exogenously applied 1.0 mM Cu2+ stress, neither H2S nor PAG pretreatment had a significant effect on leaf caffeine contents (Figure 9C).

4. Discussion

An excessive concentration of Cu2+ is detrimental to plant growth and metabolism [48]. H2S, as a gas transmitter, can participate in various physiological and biochemical processes in plants and has a positive impact on alleviating abiotic stress in plants [49]. In this study, the effects of exogenous H2S on the response of tea plants to Cu2+ stress and its impact on the main quality components of tea leaves were investigated.

4.1. H2S Pretreatment Reduces Cu Accumulation in Tea Plants Under Cu2+ Stress

Firstly, Cu2+ stress caused a large amount of Cu to accumulate in tea plants, and the accumulation increased with an increasing Cu2+ concentration (Figure 1). Reducing plant uptake of heavy metals is one of the important mechanisms to mitigate the effects of heavy metal stress on plant growth [26]. It was reported that exogenous H2S could reduce the absorption of cadmium (Cd) by the roots of Malus hupehensis under Cd stress [50]. This study also found that H2S pretreatment reduced the total Cu content in tea plants under 0.5 mM Cu2+ stress, with a significant decrease in Cu accumulation in mature leaves, stems, and roots (Figure 1B,C,D), thereby responding to the inhibitory effect of Cu2+ stress on tea plant growth.

4.2. H2S Pretreatment Alleviates the Toxicities of Cu2+ Stress on the Growth Physiology of Tea Plants

Moreover, it was shown that exogenous H2S played a positive role in alleviating the inhibitory effect of Cu2+ stress on growth in tea plants. Cu2+ stress resulted in a decrease in the number of aboveground leaves, inhibition of root growth, destruction of the leaf ultrastructure, reduction in the leaf chlorophyll content, and a decrease in photosynthesis capacity, and these effects of stress were particularly significant at a concentration of 1.0 mM Cu2+ (Figure 2, Figure 3, Figure 4 and Figure 5). Here, it was found that H2S pretreatment significantly alleviated the inhibitory effect of Cu2+ stress on the growth of tea plants, which was mainly manifested as alleviating the damage to the ultrastructure of leaf cells, increasing the biomass of all parts of the tea seedlings, as well as the root activity, and enhancing the chlorophyll content, net photosynthetic rate, stomatal conductance, and transpiration rate of the leaves (Figure 2, Figure 3, Figure 4 and Figure 5, Table 2). However, exogenous PAG application significantly exacerbated the inhibition of tea plant growth mediated by Cu2+ stress (Figure 2, Figure 3, Figure 4 and Figure 5, Table 2). There are a large number of studies showing that exogenous H2S can effectively alleviate the growth and development of plants under abiotic stress. Zheng et al. [51] pointed out that H2S could improve the root activity of tomato under salt stress; Qian et al. [52] found that exogenous H2S promoted the root length and biomass of oilseed rape (Brassica napus L.) under Al stress, which were consistent with the results of this research (Figure 3, Table 2). Moreover, Chen, Wu, Wang, Zheng, Lin, Dong, He, Pei, and Zheng [25] found that H2S increased the chlorophyll content, light saturation point, and maximum net photosynthetic rate of Spinacia oleracea. Kaya et al. [53] reported that H2S enhanced the chlorophyll content of wheat under Cd stress. The results of this study also demonstrated that exogenous H2S pretreatment could alleviate the inhibitory effect of Cu2+ stress on the chlorophyll content and photosynthetic capacity (Figure 5), suggesting that H2S could respond to Cu2+ stress by regulating changes in the photosynthetic system of tea plant.

4.3. H2S Pretreatment Enhances Antioxidant Stress Activation in Tea Plants Under Cu2+ Stress

Additionally, our study revealed that exogenous H2S pretreatment alleviated the excessive production of MDA and Pro under Cu2+ stress, enhanced the activities of antioxidant enzymes (SOD, CAT, POD), and improved the action of the glutathione antioxidant system, including an increased GSH content, elevated GR and GST activities, and increased GSH/GSSG in tea plants (Figure 6 and Figure 7). Nomani et al. [54] found that exogenous 200 µM H2S restored the physiological and biochemical characteristics of Artemisia annua under Cu2+ stress by reducing plant lipid peroxidation and increasing antioxidant enzyme activities. Shi et al. [55] found that NaHS pretreatment modulated the metabolism of three antioxidant enzymes, CAT, POD, and GR, as well as the redox state of non-enzymatic glutathione in Cynodon dactylon, further alleviating the abiotic-stress-induced ROS burst and cell damage. In addition, Shan et al. [56] also showed that NaHS pretreatment upregulated the GR activity of maize leaves and regulated the redox state of AsA and GSH, improving the antioxidant capacity and alleviating the oxidative damage of maize seedlings under salt stress. Similarly, Guo et al. [57] found that the exogenous application of NaHS improved the tolerance of Salix matsudana Koidz to Cd by increasing the content of the intracellular non-enzymatic antioxidant GSH. In this research, it was suggested that H2S could respond to the damaging effects of Cu2+ stress by alleviating the production of ROS and regulating the activities of antioxidant enzymes and the contents of non-enzymatic antioxidants. However, the 1.0 mM Cu2+ stress might have damaged the tea plants too much and exceeded the resistance threshold of the antioxidant system. Combining our results with previous studies, we suggest that H2S can promote the reduction of GSSG to GSH and increase the GSH content by increasing the GR activity of tea plant under Cu2+ stress and further catalyze the coupling of harmful substances with GSH by increasing the activity of GST in response to the toxic effect of Cu2+ stress on tea plants.
Furthermore, this study showed that the application of exogenous H2S could enhance the LCD activity of tea leaves and roots under Cu2+ stress (Figure 8), suggesting that exogenous H2S may promote the production of endogenous H2S in response to the toxicity of Cu2+ on tea plants. Previous studies have demonstrated that alteration of the endogenous H2S content in plants under heavy metal stress may be related to the mechanism of plants’ responses to stress. Shen et al. [58] showed that H2S induced the thiol group R-SH sulfhydrylation of LCD 1 in guard cells of Arabidopsis thaliana under drought stress, which further activated its activity, resulting in the generation of large amounts of endogenous H2S in a short period of time.

4.4. H2S Pretreatment Compensates for the Quality Loss of Tea Plants Caused by Cu2+ Stress

Finally, it was found that Cu2+ stress caused a significant decrease in the contents of tea polyphenols, free amino acids, caffeine, and various catechin fractions in tea leaves, and H2S pretreatment alleviated the decrease in the contents of these quality components in tea leaves due to Cu2+ stress (Figure 9, Table 3). Liu et al. [59] found that the total phenolic content and flavonoid content of leaves in the seedling stage and the free amino acid content of leaves in the spike stage were significantly increased after exogenous H2S treatment in Avena nuda under saline and alkaline stress, suggesting that H2S could regulate the abiotic stress of Avena nuda by promoting the contents of osmoregulatory substances in vivo. Tea polyphenols, catechins, free amino acids, and caffeine, which are secondary metabolites in tea leaves, can participate in the osmoregulation of tea plants [60]. Moreover, the accumulation of osmoregulatory substances and the improvement of antioxidant capacity are important mechanisms of plant adaptation to abiotic stresses [61]. Therefore, we inferred that exogenous H2S could participate in osmoregulation of the tea plant by increasing the contents of these quality components in tea leaves, in response to the effects of Cu2+ stress. In addition, tea polyphenols, catechins, amino acids, and caffeine are the four important chemical components that form the quality of tea leaves, and their contents in tea leaves directly affect the results of the sensory evaluations, nutritional value, and economic value of tea [60,62].The decrease in the contents of these quality components under Cu2+ stress will lead to a reduction in tea quality, while the application of exogenous H2S effectively reduced the change in and loss of tea quality.

5. Conclusions

In summary, excessive Cu2+ inhibited the growth and development of tea plants, ultimately affecting tea yield and quality. However, 100 μM exogenous H2S alleviated the toxic effects of excessive Cu2+ on tea plants and had a positive impact on their growth metabolism, as well as the quality component formation. In response to Cu2+ stress, exogenous H2S significantly reduced Cu accumulation and activated the antioxidant systems and LCD activities, effectively mitigating the damage of Cu2+ stress on root growth, the leaf ultrastructure, photosynthesis, etc., and alleviating the negative effects of Cu2+ stress on the quality components in tea plants. Thus, we recommend using exogenous H2S as a low-cost and environmentally friendly biological regulator for the soil remediation of Cu-contaminated tea gardens and stress-resistant cultivation management of tea plants in the future, avoiding tea garden abandonment and promoting sustainable development of the tea industry. And through the regulation of exogenous H2S, the accumulation of Cu in tea leaves was effectively reduced, and the quality components were effectively maintained, helping to ensure the safe production of tea and guaranteeing its quality. This study not only has direct guiding significance for cultivation management and the safe production of tea plants but also provides new directions for the breeding of stress-resistant tea plant varieties in the future, which can also provide theoretical references for the physiological regulation of other crops under heavy metal stresses.

Author Contributions

Conceptualization, Z.W., P.H. and Y.W.; Data curation, Z.W.; Formal analysis, Z.W. and P.H.; Funding acquisition, X.L. and Y.W.; Investigation, P.H., J.Z., S.W., A.X. and Y.S.; Methodology, Z.W. and P.H.; Project administration, X.L. and Y.W.; Supervision, Z.Z., S.L., X.C., X.L. and Y.W.; Validation, Z.W., P.H., J.Z., S.W., A.X. and Y.S.; Visualization, Z.W., J.Z., S.W., A.X. and Y.S.; Writing—original draft, Z.W.; Writing—review and editing, Z.W. and Y.W. All authors have read and agreed to the published version of the manuscript.

Funding

This work was supported by Key Research and Development Program of Sichuan Province (2023YFN0010), National Natural Science Foundation of China (32272772), Modern Agriculture Industry Enhancement Project of Cangnan County (2024CNYJY07), Wenxian Science and Technology Plan Project (2024CX001, 2023-X.QKJ-02, 2023-X.QKJ-09), Nanjing Agricultural Major Technology Collaborative Promotion Plan Project (2024NJXTTG 10), Expert Workstation of Yunnan Province (202305AF150198), and Science and Technology Achievement Transformation Project of Gaochun District (2024).

Data Availability Statement

All data and material included in this study are available upon request by contact with the corresponding author.

Conflicts of Interest

The authors declare that they have no known competing financial interests or personal relationships that could have appeared to influence the work reported in this paper.

References

  1. Tang, M.Q.; Huang, J.H.; Chen, J.Y.; Wang, Q.; Xu, Z.R. Research progress on copper homeostasis in plants: A review. Jiangsu Agric. Sci. 2019, 47, 305–311. [Google Scholar] [CrossRef]
  2. Mir, A.R.; Pichtel, J.; Hayat, S. Copper: Uptake, toxicity and tolerance in plants and management of Cu-contaminated soil. BioMetals 2021, 34, 737–759. [Google Scholar] [CrossRef] [PubMed]
  3. Luo, C.L.; Shen, Z.G. The mechanisms of heavy metal uptake and accumulation in plants. Chin. Bull. Bot. 2003, 20, 59–66. [Google Scholar] [CrossRef]
  4. Zhai, F.Q.; Wang, X.L.; Hua, J.M.; Si, J.Y.; Feng, K. Copper toxicity on seedlings of wheat and the detoxification of calcium. J. Agro-Environ. Sci. 2007, 2, 694–698. [Google Scholar] [CrossRef]
  5. Xiao, Z.H.; Zhang, Y.X.; Zhang, X.W.; Li, P. Effects of exogenous Pb and Cu stress on eco-physiological characteristics on foxtail millet seedlings of different genotypes. Acta Ecol. Sin. 2012, 32, 889–897. [Google Scholar] [CrossRef]
  6. Lidon, F.C.; Henriques, F.S. Effects of copper toxicity on growth and the uptake and translocation of metals in rice plants. J. Plant Nutr. 1993, 16, 1449–1464. [Google Scholar] [CrossRef]
  7. Tian, S.K.; Li, T.X.; Peng, H.Y.; Yang, X.E.; Li, T.Q. Influence of Cu toxcity on root morphology and Cu accumulation of Elsholtzia splendens and Elsholtzia argyi. J. Soil Water Conserv. 2005, 19, 97–100+183. [Google Scholar] [CrossRef]
  8. Ni, C.Y.; Chen, Y.X.; Luo, Y.M. Change of superficial shape and cell microstructure of milk-vetch (Astragalus L.) root under simulated Cu pollution in a red soil. Environ. Sci. 2003, 24, 116–121. [Google Scholar] [CrossRef]
  9. Zhang, D.J.; Ma, J.H.; Yang, S.F.; Chen, H.T.; Liu, P.; Wang, W.F.; Li, C.X. Effects of silicon on the ultrastructures of wheat radical cells under copper stress. Chin. J. Appl. Ecol. 2014, 25, 2385–2389. [Google Scholar] [CrossRef]
  10. Zheng, B.J.; Xu, S.C.; Tu, Y.H.; Zhou, F.; Liang, D.D.; Wang, H.; Mo, Y.W. Research progress on crops toxicity of copper. J. Shaoxing Univ. 2022, 42, 58–64. [Google Scholar] [CrossRef]
  11. Zhang, G.; Weng, Y.; Li, D.X.; Sun, N.; Yang, R.Q.; Wang, X.B.; Wang, Z.J.; Wang, D.L. Growth and physiology responses of Perennial Ryegrass to Cu2+ stress. J. Northeast Norm. Univ. (Nat. Sci. Ed.) 2019, 51, 119–124. [Google Scholar] [CrossRef]
  12. Zhang, G.J.; Jiang, H.; Zheng, L.Q.; Chen, J.; Qiu, D.L.; Liu, X.H. Effect of copper stress on photosynthesis of navel orange seedlings. Chin. J. Eco-Agric. 2009, 17, 130–134. [Google Scholar] [CrossRef]
  13. Zheng, Y.X.; Li, G.Z.; Kang, G.Z. Physiological response and expression of genes encoding ascorbate-glutathione synthesis enzymes to Cu2+ stress in wheat. J. Agric. Sci. Technol. 2021, 23, 21–29. [Google Scholar] [CrossRef]
  14. Li, Y.; Huang, F.Y.; Tao, Y.; Zhou, Y.; Bai, A.M.; Yu, Z.H.; Xiao, D.; Zhang, C.W.; Liu, T.K.; Hou, X.L.; et al. BcGR1.1, a cytoplasmic localized glutathione reductase, enhanced tolerance to copper stress in Arabidopsis thaliana. Antioxidants 2022, 11, 389. [Google Scholar] [CrossRef]
  15. Jain, M.; Ghanashyam, C.; Bhattacharjee, A. Comprehensive expression analysis suggests overlapping and specific roles of rice glutathione S-transferase genes during development and stress responses. BMC Genom. 2010, 11, 73. [Google Scholar] [CrossRef]
  16. Al-Khateeb, W.; Al-Qwasemeh, H. Cadmium, copper and zinc toxicity effects on growth, proline content and genetic stability of Solanum nigrum L., a crop wild relative for tomato; comparative study. Physiol. Mol. Biol. Plants 2014, 20, 31–39. [Google Scholar] [CrossRef]
  17. Wang, Y.C. Effect of copper stress on photosynthesis and quality index of tea trees. Mod. Agric. Sci. Technol. 2021, 14, 9–12+14. [Google Scholar] [CrossRef]
  18. Dey, S.; Mazumder, P.B.; Paul, S.B. Accumulation of Cu at different concentration in tea plant (Camellia sinensis (L.) O. Kuntze). IOSR J. Agric. Vet. Sci. 2014, 7, 39–43. [Google Scholar] [CrossRef]
  19. Wang, H.B.; Ye, J.H.; Kong, X.H.; Ding, L.; Qiu, F.Y.; Jia, X.L. Comparative study on biological responses and Cu speciation in tissues of two different tea trees after Cu exposure. Asian J. Ecotoxicol. 2016, 11, 216–225. [Google Scholar] [CrossRef]
  20. Wang, Y.L.; Li, W.F.; Ma, J.Y.; Zhu, C.M. Effects of Cu on the physiological response of large-leaf tea seedling. J. Yunnan Agric. Univ. (Nat. Sci.) 2016, 31, 368–371. [Google Scholar] [CrossRef]
  21. Yadav, S.K.; Mohanpuria, P. Responses of Camellia sinensis cultivars to Cu and Al stress. Biol. Plant. 2009, 53, 737–740. [Google Scholar] [CrossRef]
  22. Jin, Z.P.; Qiao, Z.J.; Zhang, L.P.; Pei, Y.X. Hydrogen sulfide alleviates cadmium toxicity by restricting Cd2+ influx in Arabidopsis. Chin. J. Biochem. Mol. Biol. 2020, 36, 61–70. [Google Scholar] [CrossRef]
  23. Pei, Y.X. Gasotransmitter hydrogen sulfide in plants: Stinking to high heaven, but refreshing to fine life. Chin. J. Biochem. Mol. Biol. 2016, 32, 721–733. [Google Scholar] [CrossRef]
  24. Gao, X.L.; Sun, M.X.; Wu, X.L.; Xiao, Y.S.; Peng, F.T. Effects of exogenous hydrogen sulfide on root growth of mature peach trees. Shandong Agric. Sci. 2022, 54, 76–80. [Google Scholar] [CrossRef]
  25. Chen, J.; Wu, F.H.; Wang, W.H.; Zheng, C.J.; Lin, G.H.; Dong, X.J.; He, J.X.; Pei, Z.M.; Zheng, H.L. Hydrogen sulphide enhances photosynthesis through promoting chloroplast biogenesis, photosynthetic enzyme expression, and thiol redox modification in Spinacia oleracea seedlings. J. Exp. Bot. 2011, 62, 4481–4493. [Google Scholar] [CrossRef]
  26. Luo, S.L.; Calderón-Urrea, A.; Yu, J.H.; Liao, W.B.; Xie, J.M.; Lv, J.; Feng, Z.; Tang, Z.Q. The role of hydrogen sulfide in plant alleviates heavy metal stress. Plant Soil 2020, 449, 1–10. [Google Scholar] [CrossRef]
  27. Zhu, C.Q.; Zhang, J.H.; Sun, L.M.; Zhu, L.F.; Abliz, B.; Hu, W.J.; Zhong, C.; Bai, Z.G.; Sajid, H.; Cao, X.C.; et al. Hydrogen sulfide alleviates aluminum toxicity via decreasing apoplast and symplast Al contents in Rice. Front. Plant Sci. 2018, 9, 294. [Google Scholar] [CrossRef]
  28. Papenbrock, J.; Reimenschneider, A.; Kamp, A.; Schulz-Vogt, H.N.; Schmidt, A. Characterization of cysteine-degrading and H2S-releasing enzymes of higher plants—From the field to the test tube and back. Plant Biol. 2007, 9, 582–588. [Google Scholar] [CrossRef]
  29. Jin, Z.P.; Shen, J.J.; Qiao, Z.J.; Yang, G.D.; Wang, R.; Pei, Y.X. Hydrogen sulfide improves drought resistance in Arabidopsis thaliana. Biochem. Biophys. Res. Commun. 2011, 414, 481–486. [Google Scholar] [CrossRef]
  30. Zhou, Q.Q.; Huo, C.H.; Xie, Y.H. Research progress on hydrogen sulfide donors. Chin. J. Med. Chem. 2020, 30, 107–123. [Google Scholar] [CrossRef]
  31. Shen, X.X.; Zhang, Y.H.; Huang, Z.J. Research advances in hydrogen sulfide donors. J. China Pharm. Univ. 2019, 50, 265–273. [Google Scholar] [CrossRef]
  32. Sun, X.; Jiang, Q.; Tian, S.; Xu, L.; Shen, G. Research progress of a new gas signal molecule H2S in plants. Shandong Agric. Sci. 2016, 48, 151–156+161. [Google Scholar] [CrossRef]
  33. Li, Q.R.; Wang, Y.M. Trace element copper and human health. Stud. Trace Elem. Health 2007, 3, 61–63. [Google Scholar] [CrossRef]
  34. Subbiah, S.; Natarajan, M.; Nair Muraleedharan, N.; Rajagopal, S. Heavy metal content of black teas from south India. Food Control 2008, 19, 746–749. [Google Scholar] [CrossRef]
  35. Wang, H.B.; Ye, J.H.; Kong, X.H.; Ding, L.; Zhang, Q.X.; Ma, X.M.; Jia, X.L. Physiological responses and subcellular copper distribution characteristics of different tea plants under copper stress. Jiangsu Agric. Sci. 2016, 44, 219–223. [Google Scholar] [CrossRef]
  36. Karak, T.; Paul, R.K.; Kutu, F.R.; Mehra, A.; Khare, P.; Dutta, A.K.; Bora, K.; Boruah, R.K. Comparative assessment of copper, iron, and zinc contents in selected Indian (Assam) and South African (Thohoyandou) tea (Camellia sinensis L.) samples and their infusion: A quest for health risks to consumer. Biol. Trace Elem. Res. 2017, 175, 475–487. [Google Scholar] [CrossRef]
  37. Ghanati, F.; Morita, A.; Yokota, H. Effects of aluminum on the growth of tea plant and activation of antioxidant system. Plant Soil 2005, 276, 133–141. [Google Scholar] [CrossRef]
  38. Liu, F.Z. Practical Handbook for Agricultural Environmental Monitoring; China Agriculture Press: Beijing, China, 2001; p. 500. [Google Scholar]
  39. Gao, J.F. Guidance for Plant Physiology Experiments; Higher Education Press: Beijing, China, 2006; pp. 57–59. [Google Scholar]
  40. Xiang, F.; Li, W.; Liu, H.; Zhou, L.; Ding, D.; Zeng, Z. Comparisonon methods of chlorophyll extraction in Camellia sinensis. J. Tea Commun. 2016, 43, 37–40. [Google Scholar] [CrossRef]
  41. Xiong, Q.E. Experimental Course of Plant Physiology; Sichuan Science and Technology Press: Chengdu, China, 2003; pp. 126–127. [Google Scholar]
  42. Bates, L.S.; Walderen, R.P.; Teare, I.D. Rapid determination of free proline for water stress studies. Plant Soil 1975, 39, 205–207. [Google Scholar] [CrossRef]
  43. ISO 1572:1980; Tea-Preparation of Ground Sample of Known Dry Matter Content. Standards Press of China: Beijing, China, 1980.
  44. ISO 14502–1:2005; Determination of Substances Characteristic of Green and Black Tea-Part 1: Content of Total Polyphenols in Tea—Colorimetric Method Using Folin-Ciocalteu Reagent. Standards Press of China: Beijing, China, 2005.
  45. ISO 14502–2:2005; Determination of Substances Characteristic of Green and Black Tea-Part 2: Content of Catechins in Green Tea—Method Using High-Performance Liquid Chromatography. Standards Press of China: Beijing, China, 2005.
  46. GB/T 8314–2013; Tea-Determination of Free Amino Acids Content. Standards Press of China: Beijing, China, 2013.
  47. ISO 10727:2002; Tea and Instant Tea in Solid Form-Determination of Caffeine Content- Method Using High-Performance Liquid Chromatography. Standards Press of China: Beijing, China, 2002.
  48. Chen, G.; Li, J.; Han, H.M.; Du, R.Y.; Wang, X. Physiological and molecular mechanisms of plant responses to copper stress. Int. J. Mol. Sci. 2022, 23, 12950. [Google Scholar] [CrossRef]
  49. Yang, Z.F.; Wang, X.Y.; Feng, J.R.; Zhu, S.H. Biological functions of hydrogen sulfide in plants. Int. J. Mol. Sci. 2022, 23, 15107. [Google Scholar] [CrossRef] [PubMed]
  50. Jiang, Q.; Cao, H.; Yang, Y.; Xie, L. Effects of hydrogen sulfide and nitric oxide on resistance of Malus hupehensis Rehd. seedlings against cadmium stress. J. Northwest A F Univ. (Nat. Sci. Ed.) 2021, 49, 120–128. [Google Scholar] [CrossRef]
  51. Zheng, Z.Y.; Lin, H.R.; Cui, H.M. Effect of exogenous hydrogen sulfide on the physiological and biochemical characteristics of processing tomato seedlings under NaCl stress. Acta Agric. Boreali-Sin. 2017, 32, 208–214. [Google Scholar] [CrossRef]
  52. Qian, P.; Sun, R.; Ali, B.; Gill, R.A.; Xu, L.; Zhou, W.J. Effects of hydrogen sulfide on growth, antioxidative capacity, and ultrastructural changes in Oilseed rape seedlings under aluminum toxicity. J. Plant Growth Regul. 2014, 33, 526–538. [Google Scholar] [CrossRef]
  53. Kaya, C.; Ashraf, M.; Alyemeni, M.N.; Ahmad, P. Responses of nitric oxide and hydrogen sulfide in regulating oxidative defence system in wheat plants grown under cadmium stress. Physiol. Plant. 2020, 168, 345–360. [Google Scholar] [CrossRef]
  54. Nomani, L.; Zehra, A.; Choudhary, S.; Wani, K.I.; Naeem, M.; Siddiqui, M.H.; Khan, M.M.A.; Aftab, T.; Singh, V. Exogenous hydrogen sulphide alleviates copper stress impacts in Artemisia annua L.: Growth, antioxidant metabolism, glandular trichome development and artemisinin biosynthesis. Plant Biol. 2022, 24, 642–651. [Google Scholar] [CrossRef]
  55. Shi, H.T.; Ye, T.T.; Chan, Z.L. Exogenous application of hydrogen sulfide donor sodium hydrosulfide enhanced multiple abiotic stress tolerance in bermudagrass [Cynodon dactylon (L). Pers.]. Plant Physiol. Biochem. 2013, 71, 226–234. [Google Scholar] [CrossRef]
  56. Shan, C.; Liu, H.; Zhao, L.; Wang, X. Effects of exogenous hydrogen sulfide on the redox states of ascorbate and glutathione in maize leaves under salt stress. Biol. Plant. 2014, 58, 169–173. [Google Scholar] [CrossRef]
  57. Guo, L.; Ling, L.; Wang, X.Q.; Cheng, T.; Wang, H.Y.; Ruan, Y.A. Exogenous hydrogen sulfide and methylglyoxal alleviate cadmium-induced oxidative stress in Salix matsudana Koidz by regulating glutathione metabolism. BMC Plant Biol. 2023, 23, 73. [Google Scholar] [CrossRef]
  58. Shen, J.; Zhang, J.; Zhou, M.J.; Zhou, H.; Cui, B.M.; Gotor, C.; Romero, L.C.; Fu, L.; Yang, J.; Foyer, C.H.; et al. Persulfidation-based modification of cysteine desulfhydrase and the NADPH oxidase RBOHD controls guard cell abscisic acid signaling. Plant Cell 2020, 32, 1000–1017. [Google Scholar] [CrossRef]
  59. Liu, J.X.; Liu, R.R.; Liu, X.L.; Jia, H.Y.; Bu, T.; Li, N. Effects of spraving NaHS at different growth stages on osmotic adjustment substance and antioxidant activity in leaves of naked oat under saline-alkali stress. Chin. J. Ecol. 2021, 40, 3620–3632. [Google Scholar] [CrossRef]
  60. Wan, X.C. Tea Biochemistry; China Agriculture Press: Beijing, China, 2003; pp. 68–116, 319. [Google Scholar]
  61. Wang, Q.Z.; Liu, Q.; Gao, Y.N.; Liu, X. Review on the mechanisms of the response to salinity-alkalinity stress in plants. Acta Ecol. Sin. 2017, 37, 5565–5577. [Google Scholar] [CrossRef]
  62. Chen, L.; Zhou, Z.X. Variations of main quality components of tea genetic resources [Camellia sinensis (L.) O. Kuntze] preserved in the China National Germplasm Tea Repository. Plant Foods Hum. Nutr. 2005, 60, 31–35. [Google Scholar] [CrossRef] [PubMed]
Figure 1. Effects of exogenous H2S on the Cu content of tea plants under Cu2+ stress. (AD) Cu content in young leaves (A), mature leaves (B), stems (C), and roots (D). In the figure legends, H2S is 100 μM Na2S·9H2O (H2S) pretreatment for 15 days; 0 is untreated culture solution (0) pretreatment for 15 days; PAG is 1.0 mM PAG (PAG) pretreatment for 15 days. In the X-axes, 0 is untreated culture solution (0) treatment for 15 days; 0.5 is 0.5 mM CuSO4·5H2O (0.5 Cu) treatment for 15 days; 1.0 is 1.0 mM CuSO4·5H2O (1.0 Cu) treatment for 15 days. Each value is the mean of three replicates, and vertical bars are standard errors. Different capital letters indicate significant differences between groups; different lowercase letters indicate significant differences within groups (Duncan’s multiple range test; p < 0.05).
Agronomy 15 00820 g001
Figure 2. Effects of exogenous H2S on the phenotype of tea plants under Cu2+ stress. (A) H2S + 0, 100 μM Na2S·9H2O (H2S) pretreatment for 15 days, followed by untreated culture solution (0) treatment for 15 days; (B) CK, untreated culture solution (0) pretreatment for 15 days, followed by untreated culture solution (0) treatment for 15 days; (C) PAG + 0, 1.0 mM PAG (PAG) pretreatment for 15 days, followed by untreated culture solution (0) treatment for 15 days; (D) H2S + 0.5 Cu, 100 μM Na2S·9H2O (H2S) pretreatment for 15 days, followed by 0.5 mM CuSO4·5H2O (0.5 Cu) treatment for 15 days; (E) 0 + 0.5 Cu, untreated culture solution (0) pretreatment for 15 days, followed by 0.5 mM CuSO4·5H2O (0.5 Cu) treatment for 15 days; (F) PAG + 0.5 Cu, 1.0 mM PAG (PAG) pretreatment for 15 days, followed by 0.5 mM CuSO4·5H2O (0.5 Cu) treatment for 15 days; (G) H2S + 1.0 Cu, 100 μM Na2S·9H2O (H2S) pretreatment for 15 days, followed by 1.0 mM CuSO4·5H2O (1.0 Cu) treatment for 15 days; (H) 0 + 1.0 Cu, untreated culture solution (0) pretreatment for 15 days, followed by 1.0 mM CuSO4·5H2O (1.0 Cu) treatment for 15 days; (I) PAG + 1.0 Cu, 1.0 mM PAG (PAG) pretreatment for 15 days, followed by 1.0 mM CuSO4·5H2O (1.0 Cu) treatment for 15 days.
Agronomy 15 00820 g002
Figure 3. Effects of exogenous H2S on root activity of tea plants under Cu2+ stress. In the figure legends, H2S is 100 μM Na2S·9H2O (H2S) pretreatment for 15 days; 0 is untreated culture solution (0) pretreatment for 15 days; PAG is 1.0 mM PAG (PAG) pretreatment for 15 days. In the X-axes, 0 is untreated culture solution (0) treatment for 15 days; 0.5 is 0.5 mM CuSO4·5H2O (0.5 Cu) treatment for 15 days; 1.0 is 1.0 mM CuSO4·5H2O (1.0 Cu) treatment for 15 days. Each value is the mean of three replicates, and vertical bars are standard errors. Different capital letters indicate significant differences between groups, and different lowercase letters indicate significant differences within groups (Duncan’s multiple range test; p < 0.05).
Agronomy 15 00820 g003
Figure 4. Effects of exogenous H2S on ultrastructure of tea leaf cells under Cu2+ stress. (A) H2S + 0, 100 μM Na2S·9H2O (H2S) pretreatment for 15 days, followed by untreated culture solution (0) treatment for 15 days; (B) CK, untreated culture solution (0) pretreatment for 15 days, followed by untreated culture solution (0) treatment for 15 days; (C) PAG + 0, 1.0 mM PAG (PAG) pretreatment for 15 days, followed by untreated culture solution (0) treatment for 15 days; (D) H2S + 0.5 Cu, 100 μM Na2S·9H2O (H2S) pretreatment for 15 days, followed by 0.5 mM CuSO4·5H2O (0.5 Cu) treatment for 15 days; (E) 0 + 0.5 Cu, untreated culture solution (0) pretreatment for 15 days, followed by 0.5 mM CuSO4·5H2O (0.5 Cu) treatment for 15 days; (F) PAG + 0.5 Cu, 1.0 mM PAG (PAG) pretreatment for 15 days, followed by 0.5 mM CuSO4·5H2O (0.5 Cu) treatment for 15 days; (G) H2S + 1.0 Cu, 100 μM Na2S·9H2O (H2S) pretreatment for 15 days, followed by 1.0 mM CuSO4·5H2O (1.0 Cu) treatment for 15 days; (H) 0 + 1.0 Cu, untreated culture solution (0) pretreatment for 15 days, followed by 1.0 mM CuSO4·5H2O (1.0 Cu) treatment for 15 days; (I) PAG + 1.0 Cu, 1.0 mM PAG (PAG) pretreatment for 15 days, followed by 1.0 mM CuSO4·5H2O (1.0 Cu) treatment for 15 days. PE, chloroplast membrane; Ch, chloroplast; SGs, starch granules; Th, matrix lamellae; OG, osmiophilic granule.
Agronomy 15 00820 g004
Figure 5. Effects of exogenous H2S on photosynthetic system of tea plants under Cu2+ stress. (A) Chlorophyll a content; (B) chlorophyll b content; (C) chlorophyll a + b content; (D) Chlorophylla a/b; (E) Pn; (F) Cond; (G) Ci; (H) Tr. In the figure legends, H2S is 100 μM Na2S·9H2O (H2S) pretreatment for 15 days; 0 is untreated culture solution (0) pretreatment for 15 days; PAG is 1.0 mM PAG (PAG) pretreatment for 15 days. In the X-axes, 0 is untreated culture solution (0) treatment for 15 days; 0.5 is 0.5 mM CuSO4·5H2O (0.5 Cu) treatment for 15 days; 1.0 is 1.0 mM CuSO4·5H2O (1.0 Cu) treatment for 15 days. Each value is the mean of three replicates, and vertical bars are standard errors. Different capital letters indicate significant differences between groups, and different lowercase letters indicate significant differences within groups (Duncan’s multiple range test; p < 0.05).
Agronomy 15 00820 g005
Figure 6. Effects of exogenous H2S on the contents of MDA and Pro and the activities of SOD, CAT, and POD in tea plants under Cu2+ stress. (A) MDA content in leaves; (B) Pro content in leaves; (C) SOD activity in leaves; (D) SOD activity in roots; (E) CAT activity in leaves; (F) CAT activity in roots; (G) POD activity in leaves; (H) POD activity in roots. In the figure legends, H2S is 100 μM Na2S·9H2O (H2S) pretreatment for 15 days; 0 is untreated culture solution (0) pretreatment for 15 days; PAG is 1.0 mM PAG (PAG) pretreatment for 15 days. In the X-axes, 0 is untreated culture solution (0) treatment for 15 days; 0.5 is 0.5 mM CuSO4·5H2O (0.5 Cu) treatment for 15 days; 1.0 is 1.0 mM CuSO4·5H2O (1.0 Cu) treatment for 15 days. Each value is the mean of three replicates, and vertical bars are standard errors. Different capital letters indicate significant differences between groups, and different lowercase letters indicate significant differences within groups (Duncan’s multiple range test; p < 0.05).
Agronomy 15 00820 g006
Figure 7. Effects of exogenous H2S on the activities of GR and GST, GSH contents, and GSH/GSSG of tea plants under Cu2+ stress. (A) GR activity in leaves; (B) GR activity in roots; (C) GST activity in leaves; (D) GST activity in roots; (E) GSH content in leaves; (F) GSH content in roots; (G) GSH/GSSG in leaves; (H) GSH/GSSG in roots. In the figure legends, H2S is 100 μM Na2S·9H2O (H2S) pretreatment for 15 days; 0 is untreated culture solution (0) pretreatment for 15 days; PAG is 1.0 mM PAG (PAG) pretreatment for 15 days. In the X-axes, 0 is untreated culture solution (0) treatment for 15 days; 0.5 is 0.5 mM CuSO4·5H2O (0.5 Cu) treatment for 15 days; 1.0 is 1.0 mM CuSO4·5H2O (1.0 Cu) treatment for 15 days. Each value is the mean of three replicates, and vertical bars are standard errors. Different capital letters indicate significant differences between groups, and different lowercase letters indicate significant differences within groups (Duncan’s multiple range test; p < 0.05).
Agronomy 15 00820 g007
Figure 8. Effects of exogenous H2S on LCD activity of tea plants under Cu2+ stress. (A) LCD activity in leaves; (B) LCD activity in roots. In the figure legends; H2S, 100 μM Na2S·9H2O (H2S) pretreatment for 15 days; 0, untreated culture solution (0) pretreatment for 15 days; PAG, 1.0 mM PAG (PAG) pretreatment for 15 days. In the X-axes, 0 is untreated culture solution (0) treatment for 15 days; 0.5 is 0.5 mM CuSO4·5H2O (0.5 Cu) treatment for 15 days; 1.0 is 1.0 mM CuSO4·5H2O (1.0 Cu) treatment for 15 days. Each value is the mean of three replicates, and vertical bars are standard errors. Different capital letters indicate significant differences between groups, and different lowercase letters indicate significant differences within groups (Duncan’s multiple range test; p < 0.05).
Agronomy 15 00820 g008
Figure 9. Effects of exogenous H2S on quality components of tea plants under Cu2+ stress. (A) Tea polyphenol content; (B) free amino acid content; (C) caffeine content. In the figure legends, H2S is 100 μM Na2S·9H2O (H2S) pretreatment for 15 days; 0 is untreated culture solution (0) pretreatment for 15 days; PAG is 1.0 mM PAG (PAG) pretreatment for 15 days. In the X-axes, 0 is untreated culture solution (0) treatment for 15 days; 0.5 is 0.5 mM CuSO4·5H2O (0.5 Cu) treatment for 15 days; 1.0 is 1.0 mM CuSO4·5H2O (1.0 Cu) treatment for 15 days. Each value is the mean of three replicates, and vertical bars are standard errors. Different capital letters indicate significant differences between groups, and different lowercase letters indicate significant differences within groups (Duncan’s multiple range test; p < 0.05).
Agronomy 15 00820 g009
Table 1. Specific treatment programs of Camellia sinensis.
AbbreviationTreatment
CK (0 + 0)Untreated culture solution (0) pretreatment for 15 days, followed by untreated culture solution (0) treatment for 15 days.
H2S + 0100 μM Na2S·9H2O (H2S) pretreatment for 15 days, followed by untreated culture solution (0) treatment for 15 days.
PAG + 01.0 mM PAG (PAG) pretreatment for 15 days, followed by untreated culture solution (0) treatment for 15 days.
0 + 0.5 CuUntreated culture solution (0) pretreatment for 15 days, followed by 0.5 mM CuSO4·5H2O (0.5 Cu) treatment for 15 days.
H2S + 0.5 Cu100 μM Na2S·9H2O (H2S) pretreatment for 15 days, followed by 0.5 mM CuSO4·5H2O (0.5 Cu) treatment for 15 days.
PAG + 0.5 Cu1.0 mM PAG (PAG) pretreatment for 15 days, followed by 0.5 mM CuSO4·5H2O (0.5 Cu) treatment for 15 days.
0 + 1.0 CuUntreated culture solution (0) pretreatment for 15 days, followed by 1.0 mM CuSO4·5H2O (1.0 Cu) treatment for 15 days.
H2S + 1.0 Cu100 μM Na2S·9H2O (H2S) pretreatment for 15 days, followed by 1.0 mM CuSO4·5H2O (1.0 Cu) treatment for 15 days.
PAG + 1.0 Cu1.0 mM PAG (PAG) pretreatment for 15 days, followed by 1.0 mM CuSO4·5H2O (1.0 Cu) treatment for 15 days.
Table 2. Effects of exogenous H2S on the fresh weight and dry weight in tea plants under Cu2+ stress.
TreatmentYoung LeafMature LeafStemRoot
Fresh Weight
(g)
Dry Weight
(g)
Fresh Weight
(g)
Dry Weight
(g)
Fresh Weight
(g)
Dry Weight
(g)
Fresh Weight
(g)
Dry Weight
(g)
H2S + 00.53 ± 0.10 a0.20 ± 0.05 a1.4 ± 0.13 a0.50 ± 0.07 a1.3 ± 0.10 a0.53 ± 0.03 a1.38 ± 0.15 a0.23 ± 0.01 a
CK0.45 ± 0.07 bc0.19 ± 0.01 a1.04 ± 0.12 b0.39 ± 0.05 b0.99 ± 0.03 cde0.4 ± 0.02 bcd0.88 ± 0.24 b0.09 ± 0.03 bc
PAG + 00.28 ± 0.01 de0.11 ± 0.01 bc0.98 ± 0.21 b0.33 ± 0.06 b0.93 ± 0.11 de0.39 ± 0.03 bcd0.65 ± 0.04 bc0.08 ± 0.01 cd
H2 S + 0.5 Cu0.36 ± 0.07 cd0.13 ± 0.01 b0.54 ± 0.03 c0.2 ± 0.02 c1.14 ± 0.11 bc0.47 ± 0.05 ab0.84 ± 0.03 b0.12 ± 0.00 b
0 + 0.5 Cu0.25 ± 0.05 de0.09 ± 0.02 bc0.44 ± 0.13 cd0.15 ± 0.06 cd1.05 ± 0.06 cd0.42 ± 0.02 bc0.70 ± 0.04 bc0.06 ± 0.00 cd
PAG + 0.5 Cu0.24 ± 0.06 de0.09 ± 0.01 bc0.33 ± 0.06 de0.13 ± 0.03 cde0.92 ± 0.15 de0.38 ± 0.04 cd0.48 ± 0.11 c0.04 ± 0.01 d
H2 S + 1.0 Cu0.27 ± 0.08 de0.09 ± 0.02 bc0.21 ± 0.01 ef0.06 ± 0.00 def1.06 ± 0.15 cd0.44 ± 0.08 bc0.71 ± 0.21 bc0.08 ± 0.03 cd
0 + 1.0 Cu0.20 ± 0.06 e0.07 ± 0.02 c0.19 ± 0.04 ef0.06 ± 0.01 ef1.00 ± 0.08 cde0.41 ± 0.02 bcd0.55 ± 0.10 c0.07 ± 0.02 cd
PAG + 1.0 Cu0.17 ± 0.02 e0.06 ± 0.01 c0.06 ± 0.02 f0.02 ± 0.01 f0.82 ± 0.02 e0.33 ± 0.01 d0.50 ± 0.10 c0.05 ± 0.02 cd
Note: each value represents the mean ± SD (n = 3). Different lowercase letters indicate significant differences among treatments (Duncan’s multiple range test; p < 0.05).
Table 3. Effects of exogenous H2S on catechin components in the leaves of tea plants under Cu2+ stress.
TreatmentGC
(Gallocatechin)
(%)
EGC
(Epigallocatechin)
(%)
C
(Catechin)
(%)
EC
(Epicatechin)
(%)
EGCG
(Epigallocatechin Gallate)
(%)
ECG
(Epicatechin Gallate)
(%)
GCG
(Gallocatechin Gallate)
(%)
Ester Catechin
(%)
Total Catechins
(%)
H2S + 00.8 ± 0.01 abc2.91 ± 0.06 a0.25 ± 0 ab1.11 ± 0.04 a4.3 ± 0.17 a0.39 ± 0 a0.73 ± 0.01 a5.42 ± 0.18 a10.48 ± 0.16 a
CK0.81 ± 0.03 ab2.92 ± 0.41 a0.24 ± 0 cd0.93 ± 0.09 bc3.68 ± 0.42 bc0.38 ± 0.01 a0.62 ± 0.06 b4.68 ± 0.48 bc9.57 ± 1.02 ab
PAG + 00.82 ± 0.01 a2.44 ± 0.22 bc0.25 ± 0 a0.94 ± 0.05 bc3.95 ± 0.13 ab0.37 ± 0.01 ab0.59 ± 0.04 bc4.91 ± 0.13 b9.37 ± 0.23 b
H2 S + 0.5 Cu0.8 ± 0.02 abc2.98 ± 0.23 a0.23 ± 0 e1.09 ± 0.08 a3.04 ± 0.35 de0.39 ± 0.01 a0.68 ± 0.05 a4.11 ± 0.4 d9.22 ± 0.72 bc
0 + 0.5 Cu0.79 ± 0.02 bc2.65 ± 0.18 ab0.24 ± 0 d1.04 ± 0.02 ab3.28 ± 0.14 cde0.36 ± 0.03 b0.7 ± 0.02 a4.34 ± 0.2 cd9.05 ± 0.41 bc
PAG + 0.5 Cu0.76 ± 0.01 c2.45 ± 0.03 bc0.24 ± 0 cd0.99 ± 0.02 abc3.43 ± 0.07 cd0.38 ± 0 ab0.59 ± 0.01 bc4.4 ± 0.08 bcd8.84 ± 0.07 bc
H2 S + 1.0 Cu0.78 ± 0.03 bc2.72 ± 0.06 ab0.23 ± 0 e1.06 ± 0.17 ab2.92 ± 0.12 e0.37 ± 0 ab0.68 ± 0.03 a3.97 ± 0.09 d8.76 ± 0.28 bc
0 + 1.0 Cu0.76 ± 0.01 c2.42 ± 0.18 bc0.24 ± 0 d0.87 ± 0.02 c3.3 ± 0.25 cde0.38 ± 0.01 ab0.55 ± 0.02 c4.22 ± 0.27 cd8.52 ± 0.46 bc
PAG + 1.0 Cu0.77 ± 0.03 bc2.2 ± 0.27 c0.24 ± 0 bc0.88 ± 0.06 c3.26 ± 0.35 cde0.37 ± 0.01 ab0.56 ± 0.05 bc4.2 ± 0.4 cd8.29 ± 0.76 c
Note: ester catechin content (%) is the sum of total EGCG, ECG, and GCG, and the total catechin content (%) is the sum of total GC, EGC, C, EC, EGCG, ECG, and GCG. Each value represents the mean ± SD (n = 3). Different lowercase letters indicate significant differences among treatments (Duncan’s multiple range test; p < 0.05).
Disclaimer/Publisher’s Note: The statements, opinions and data contained in all publications are solely those of the individual author(s) and contributor(s) and not of MDPI and/or the editor(s). MDPI and/or the editor(s) disclaim responsibility for any injury to people or property resulting from any ideas, methods, instructions or products referred to in the content.

