
The Response of Soil Organic Nitrogen to the Application of Green Manure Mixed with Phosphate Fertilizer at Manure Microsite on Acidic Soil


Abstract
1. Introduction
2. Materials and Methods
2.1. Materials
2.1.1. Green Manure
2.1.2. Soil
2.2. Column Incubation Experiment
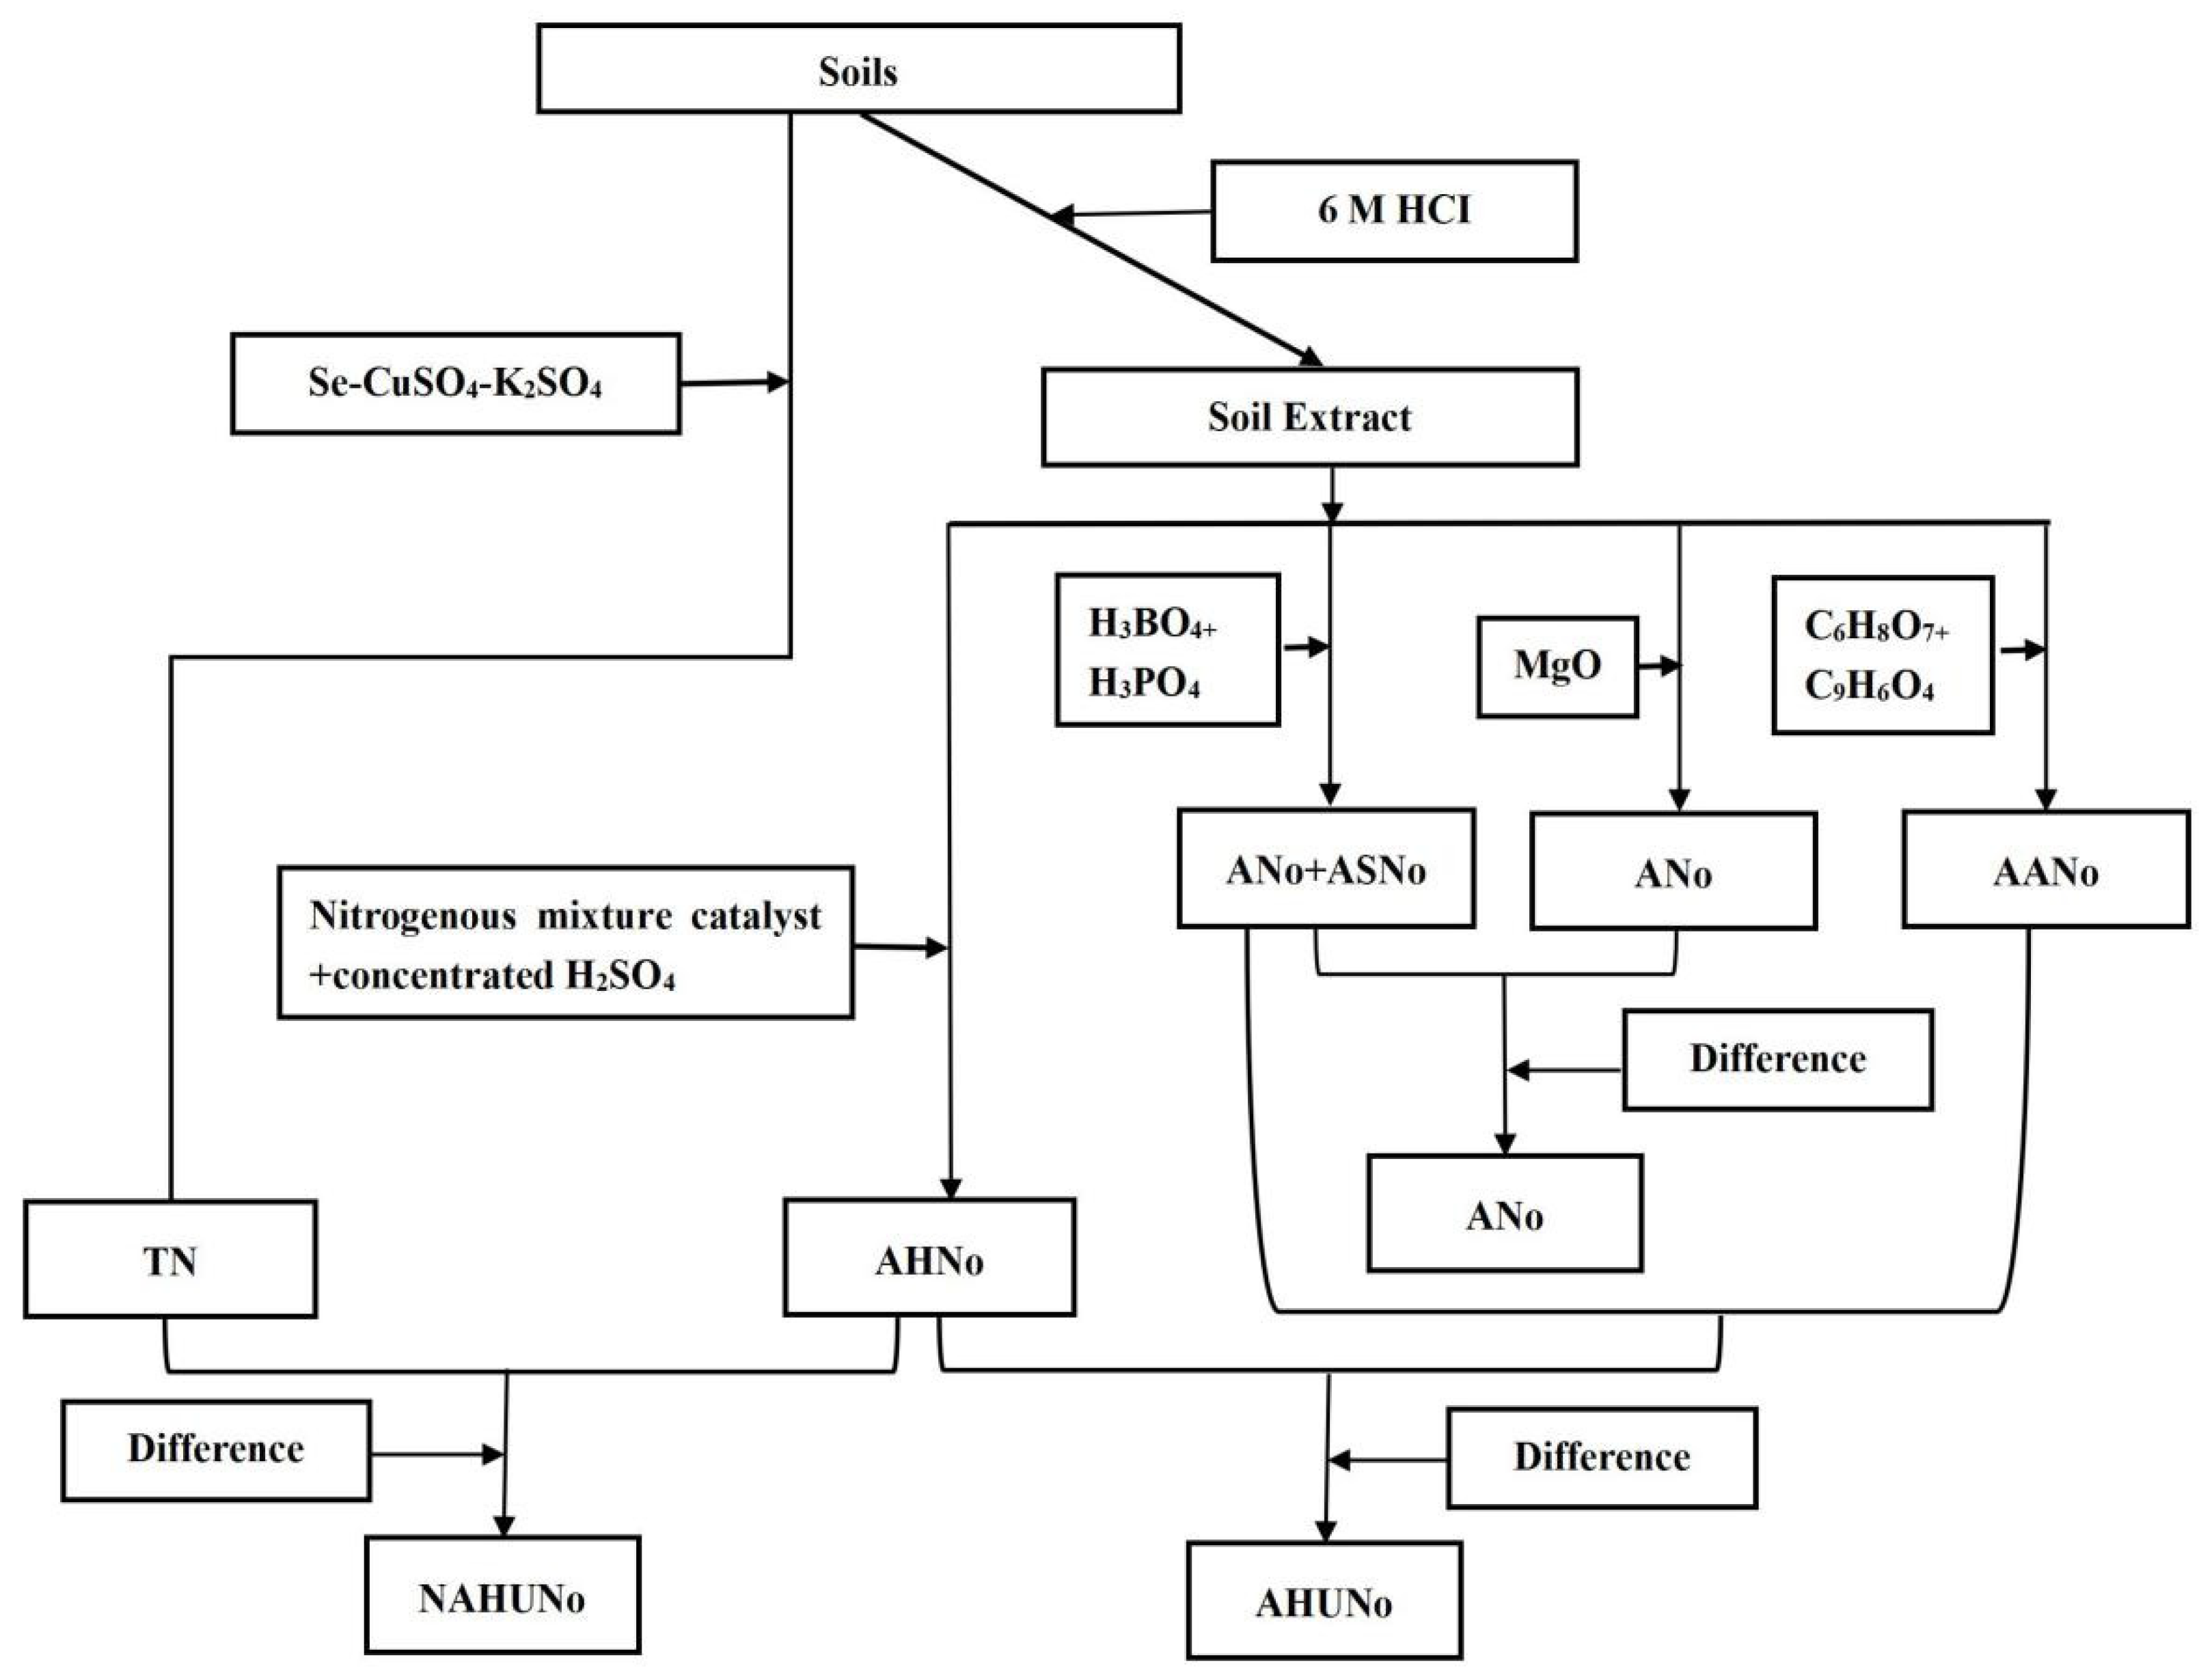
2.3. Analysis of the Samples
2.4. Statistical Analysis
3. Results
3.1. Dynamics of the Nitrogen Release Rate
3.2. Changes in Soil Organic Nitrogen
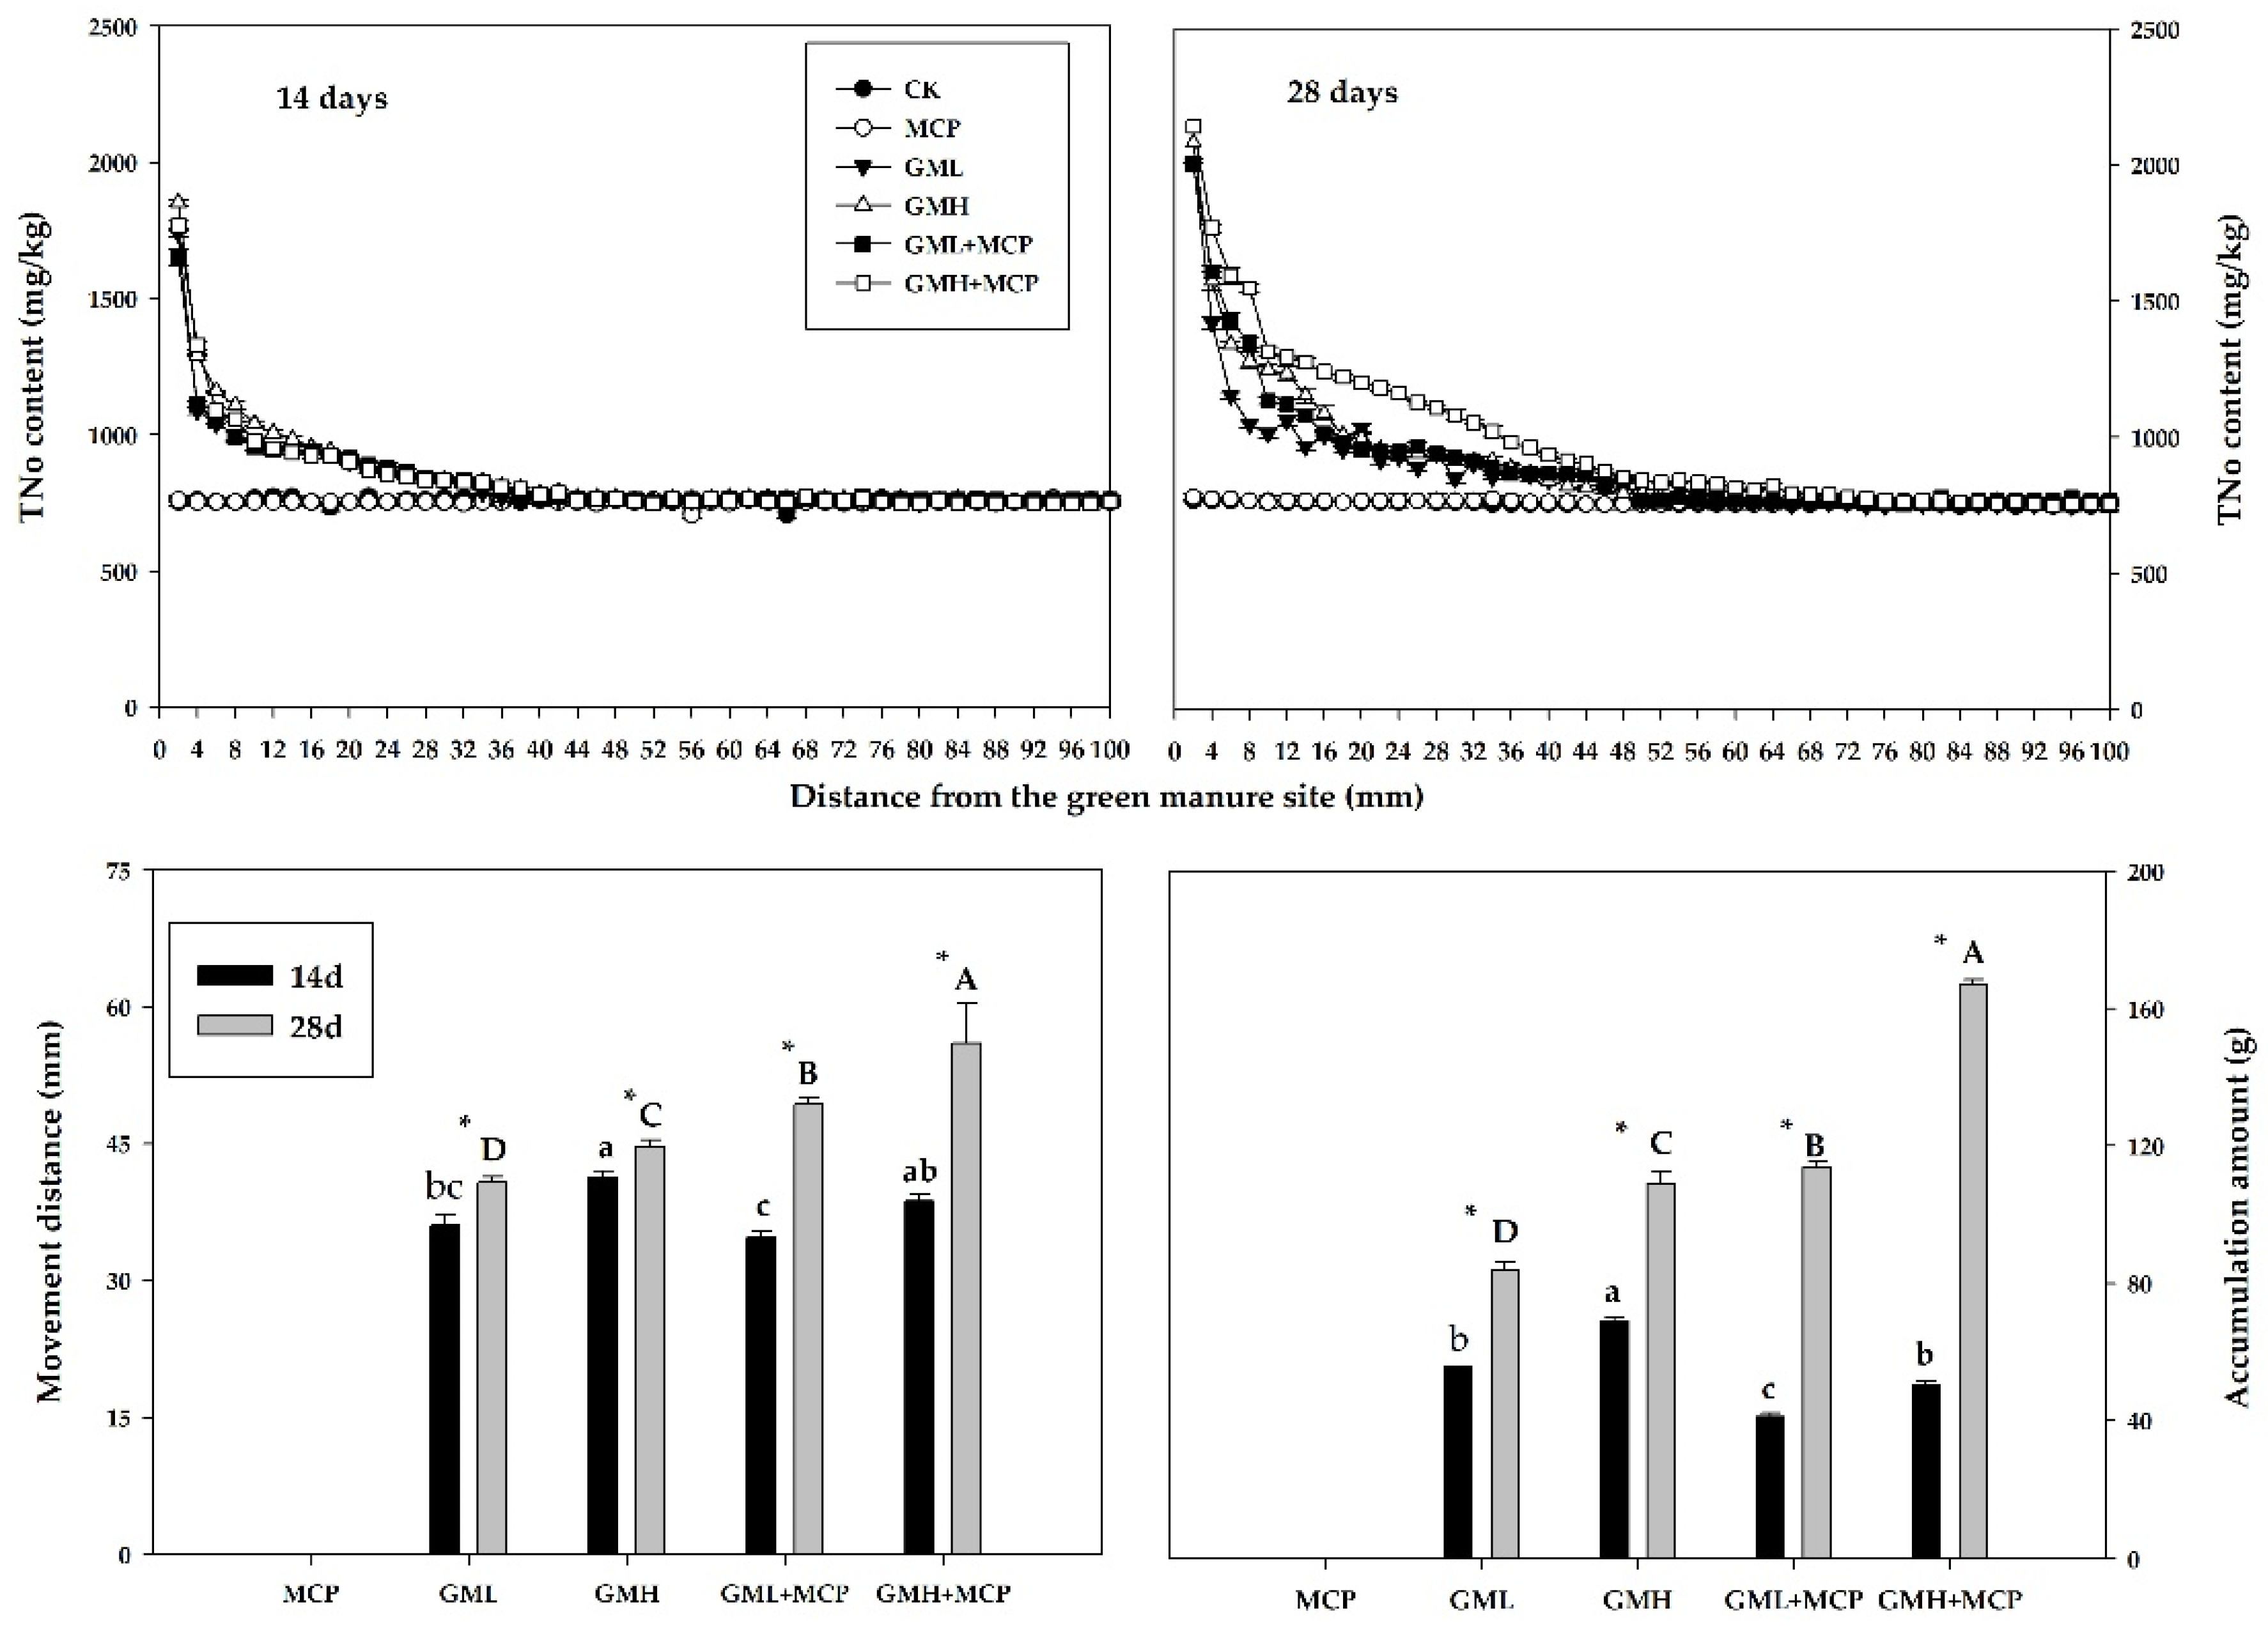
3.2.1. Total Organic Nitrogen
3.2.2. Acid-Hydrolyzable Nitrogen
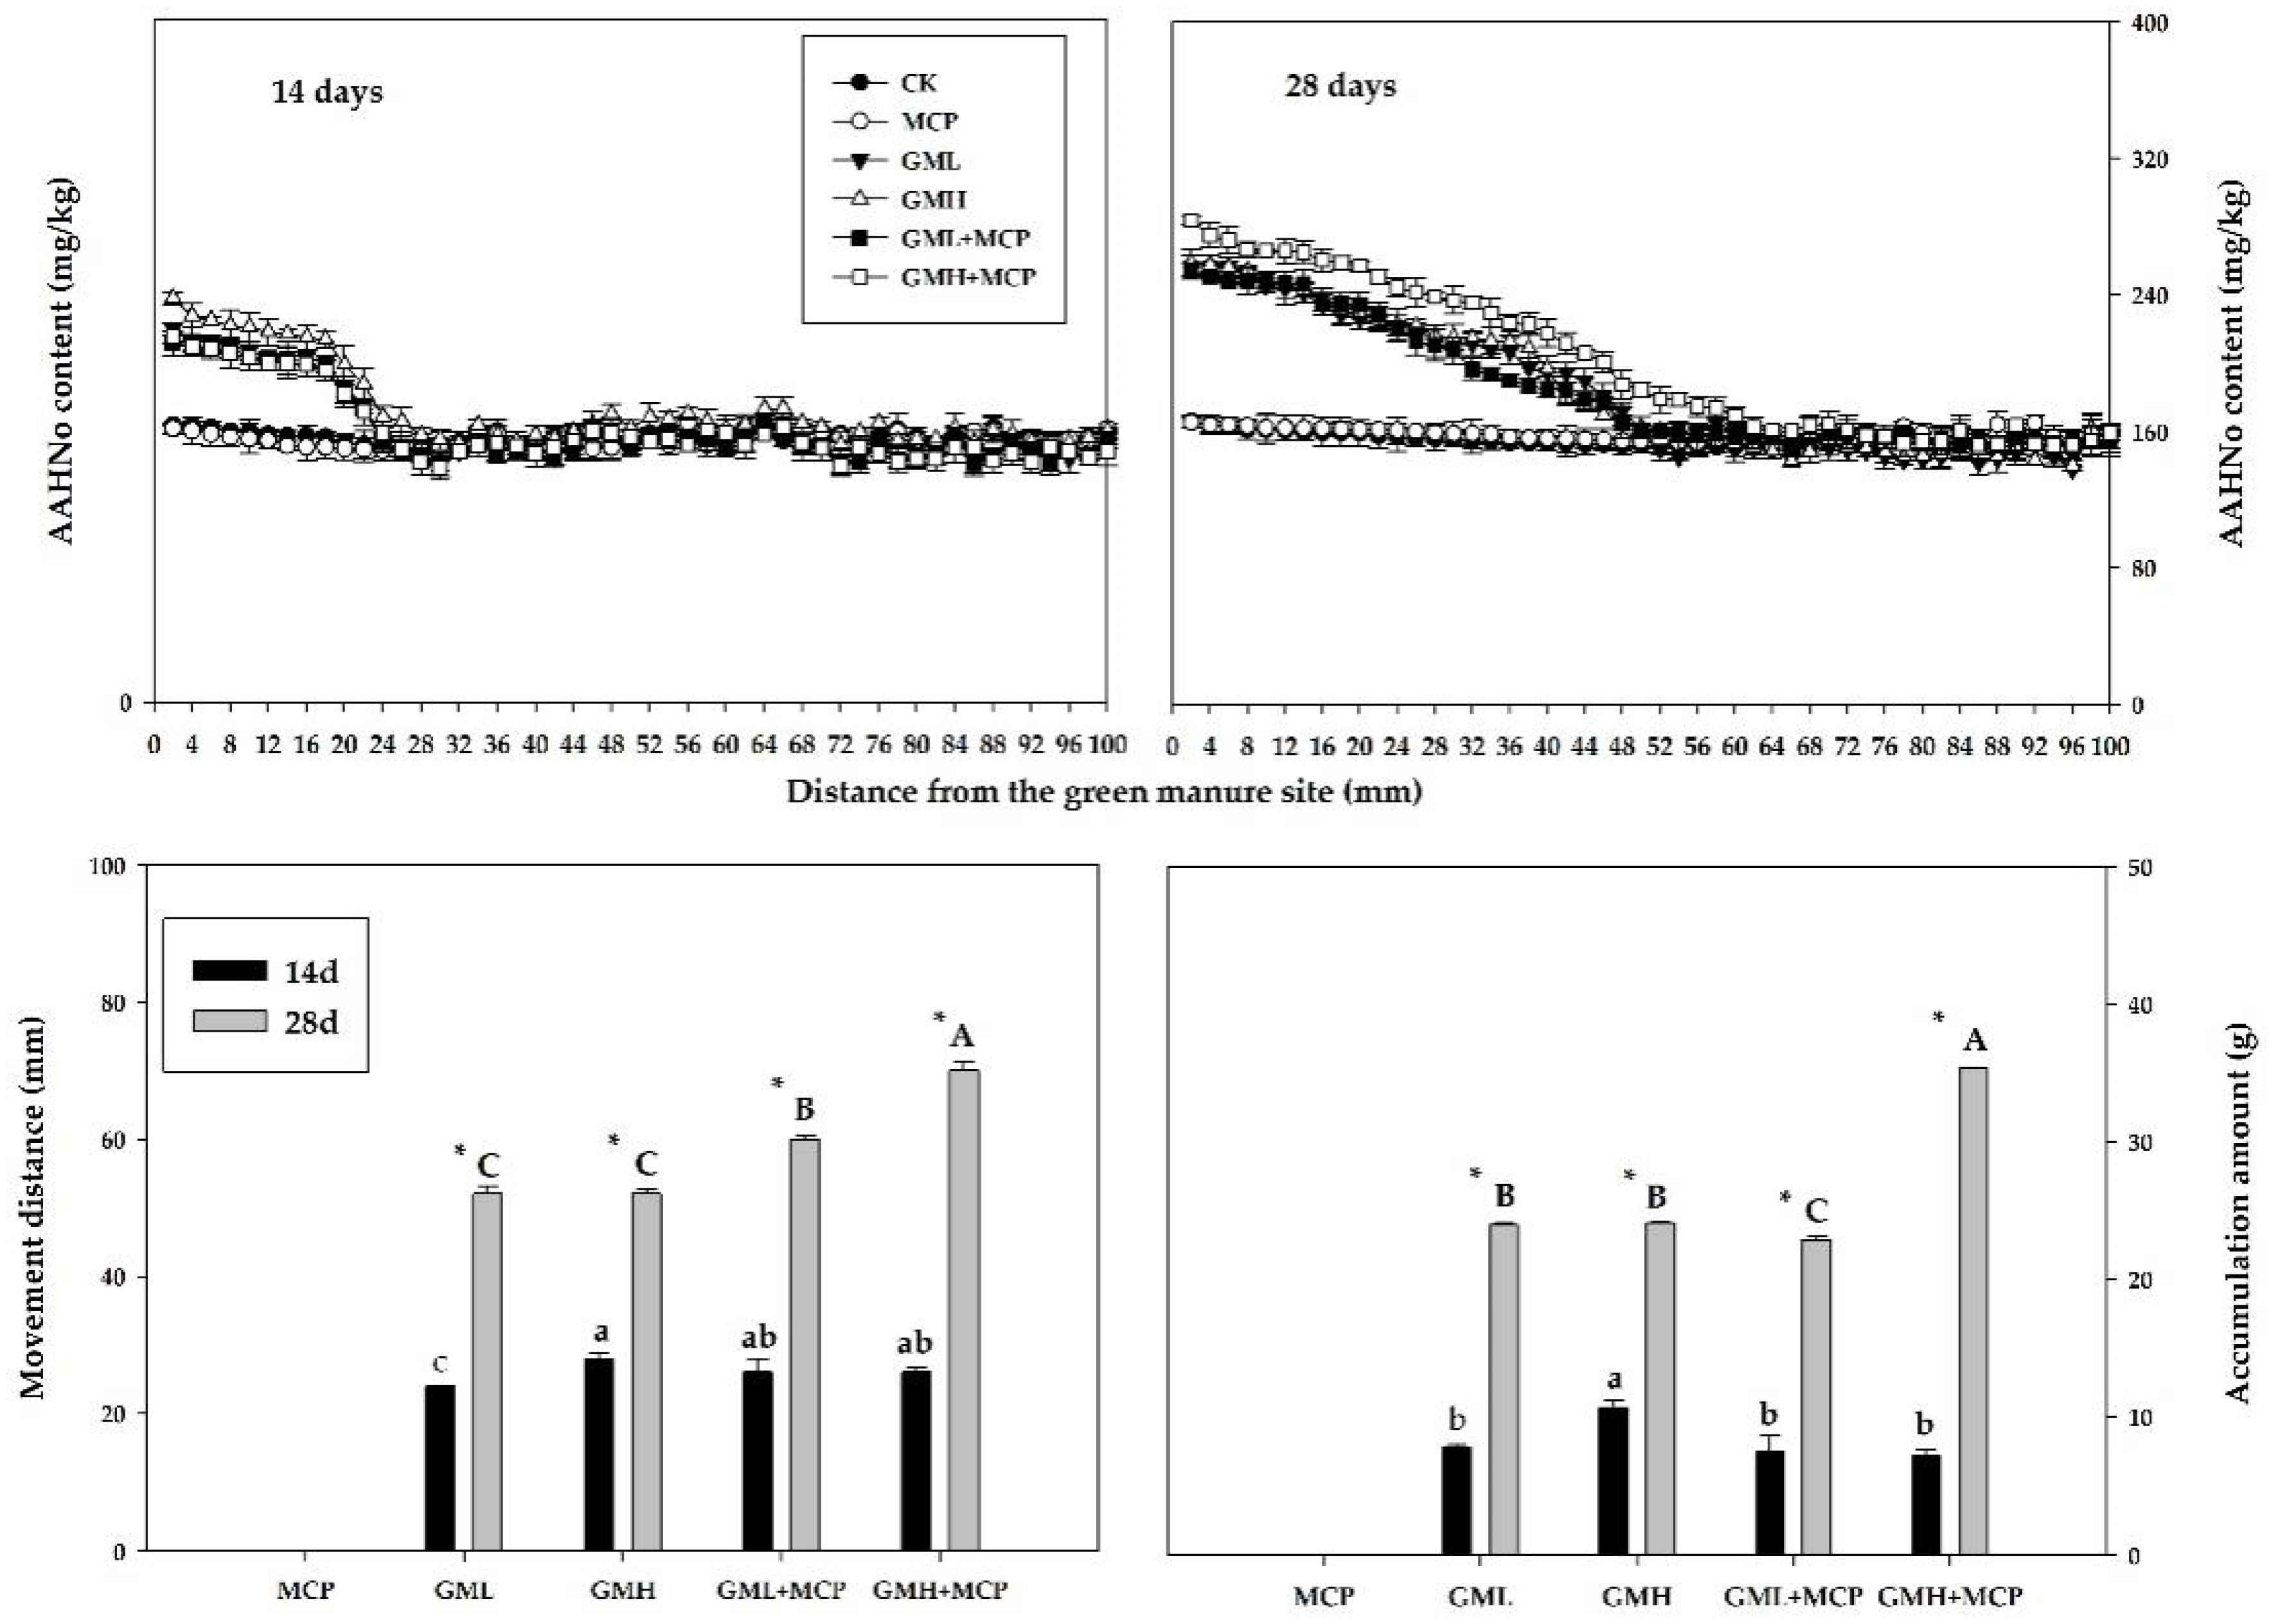
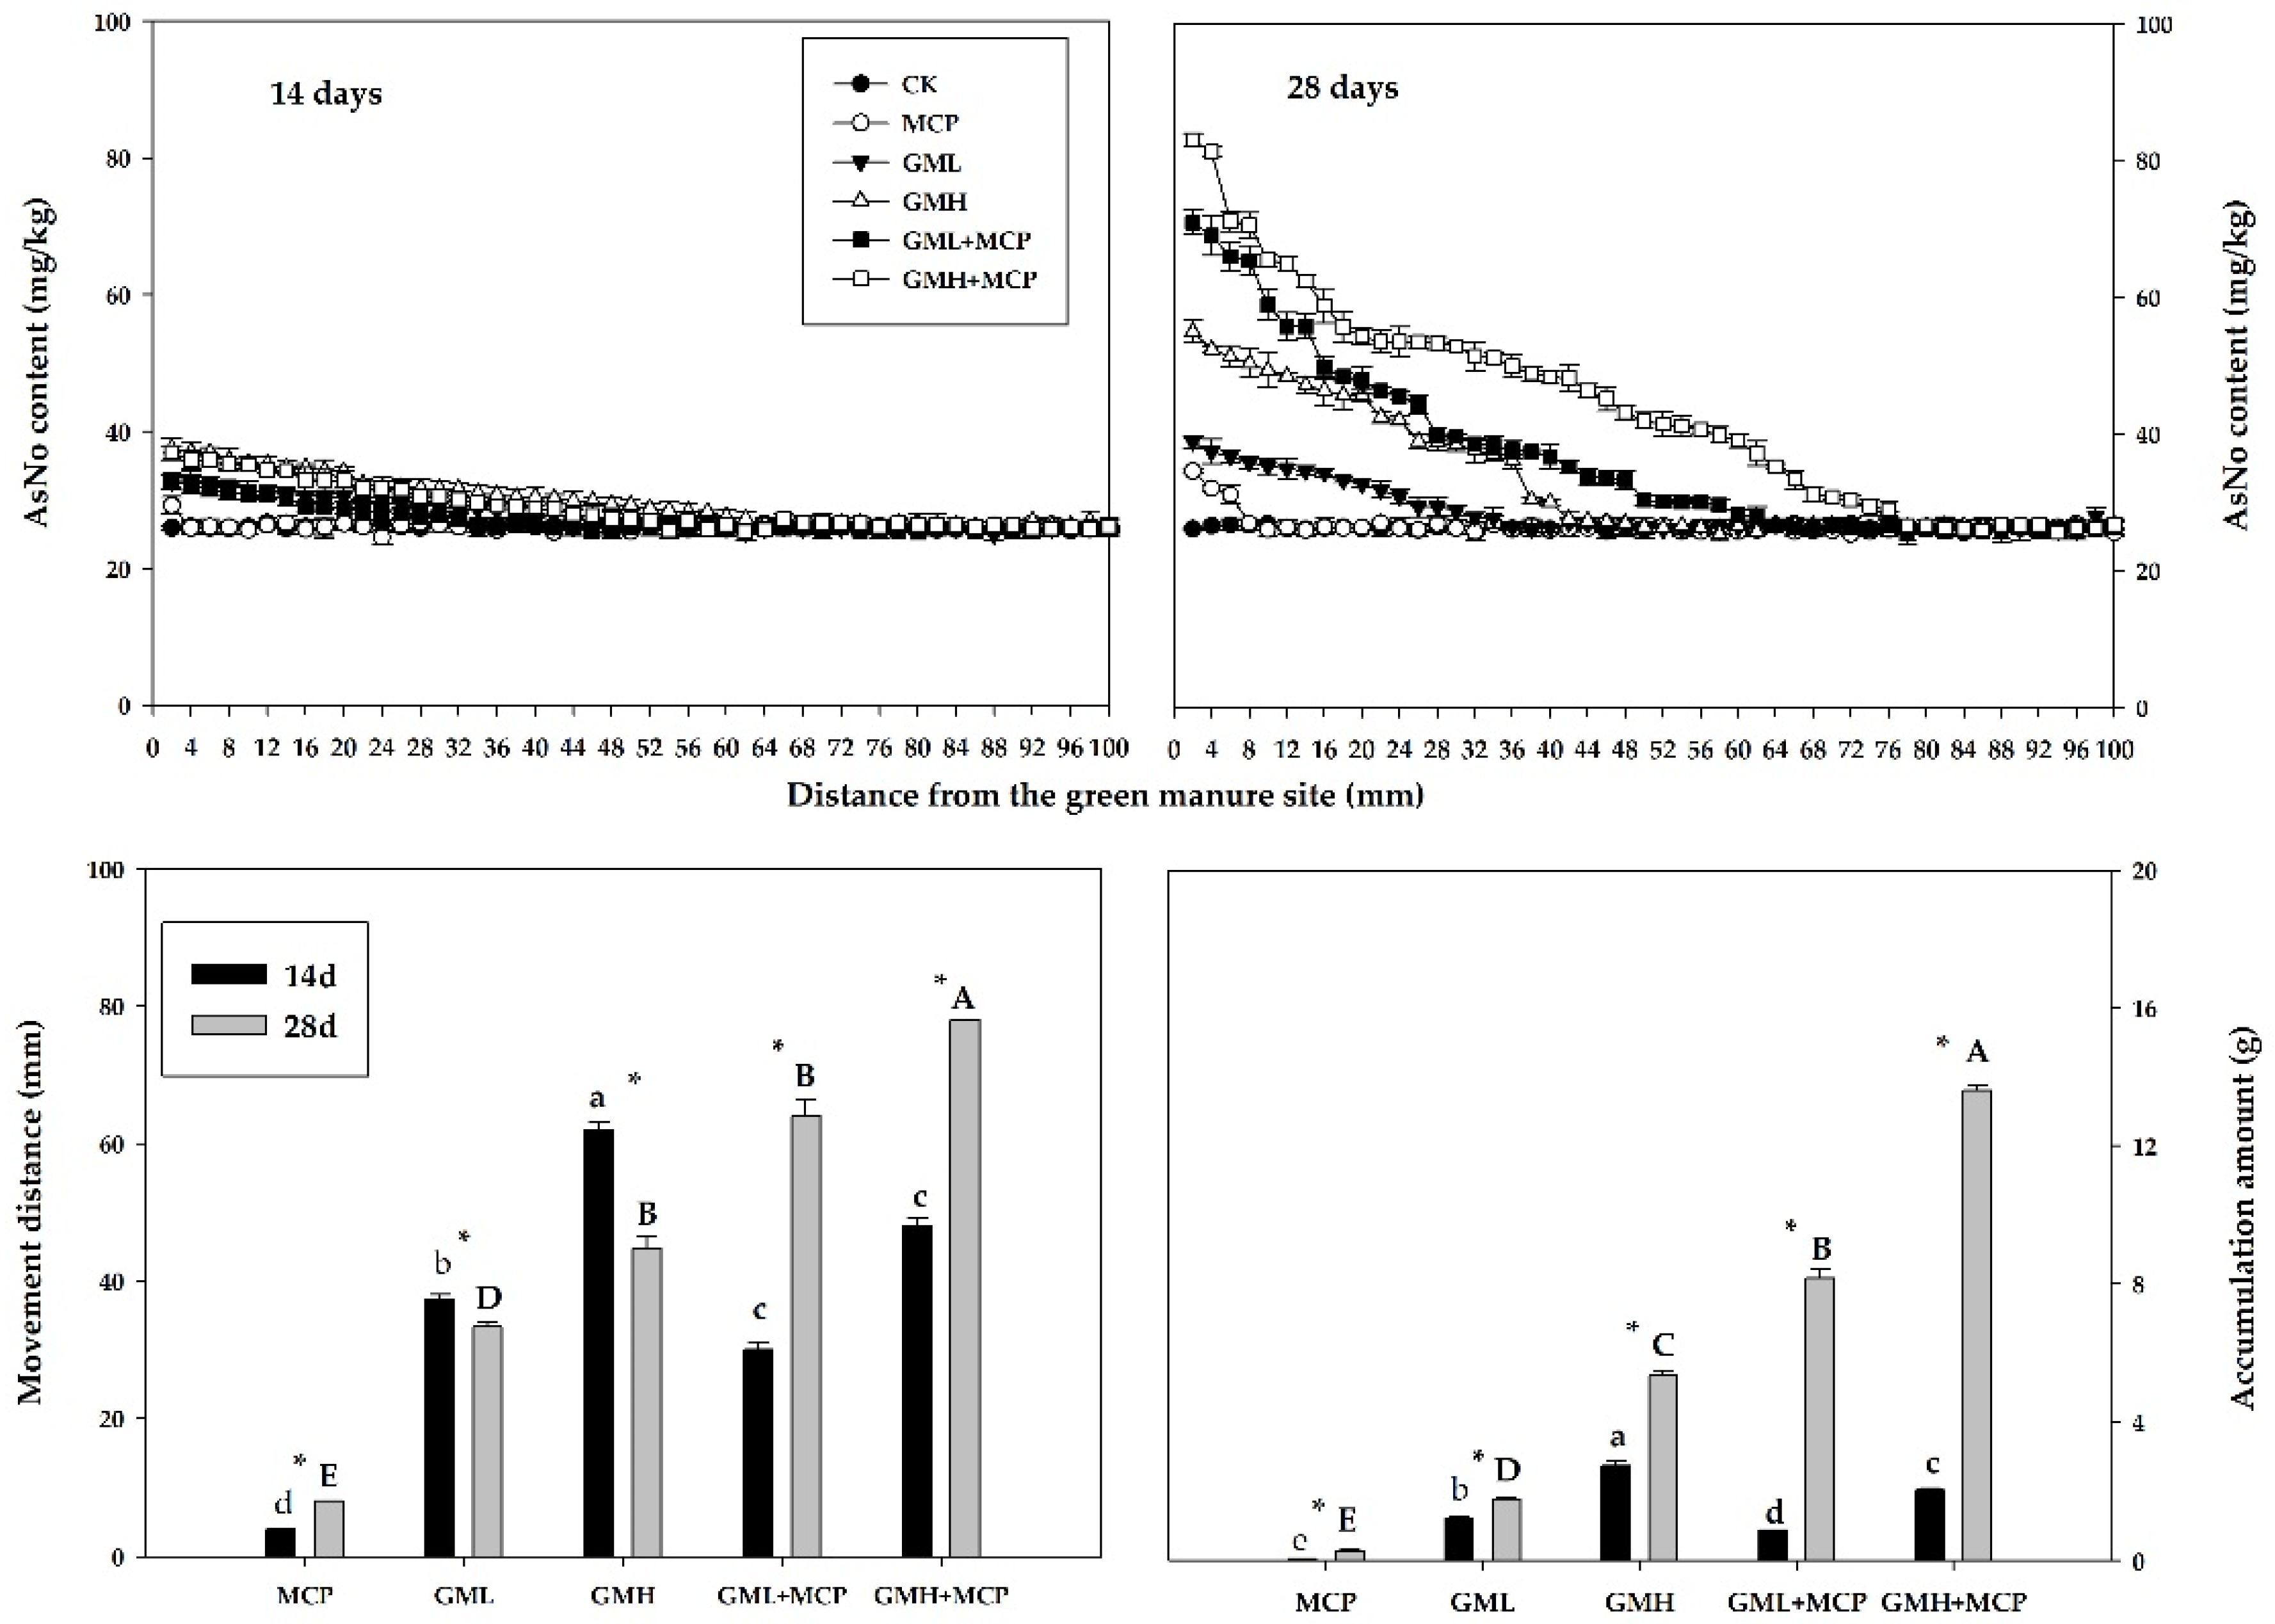
Amino Acid Nitrogen
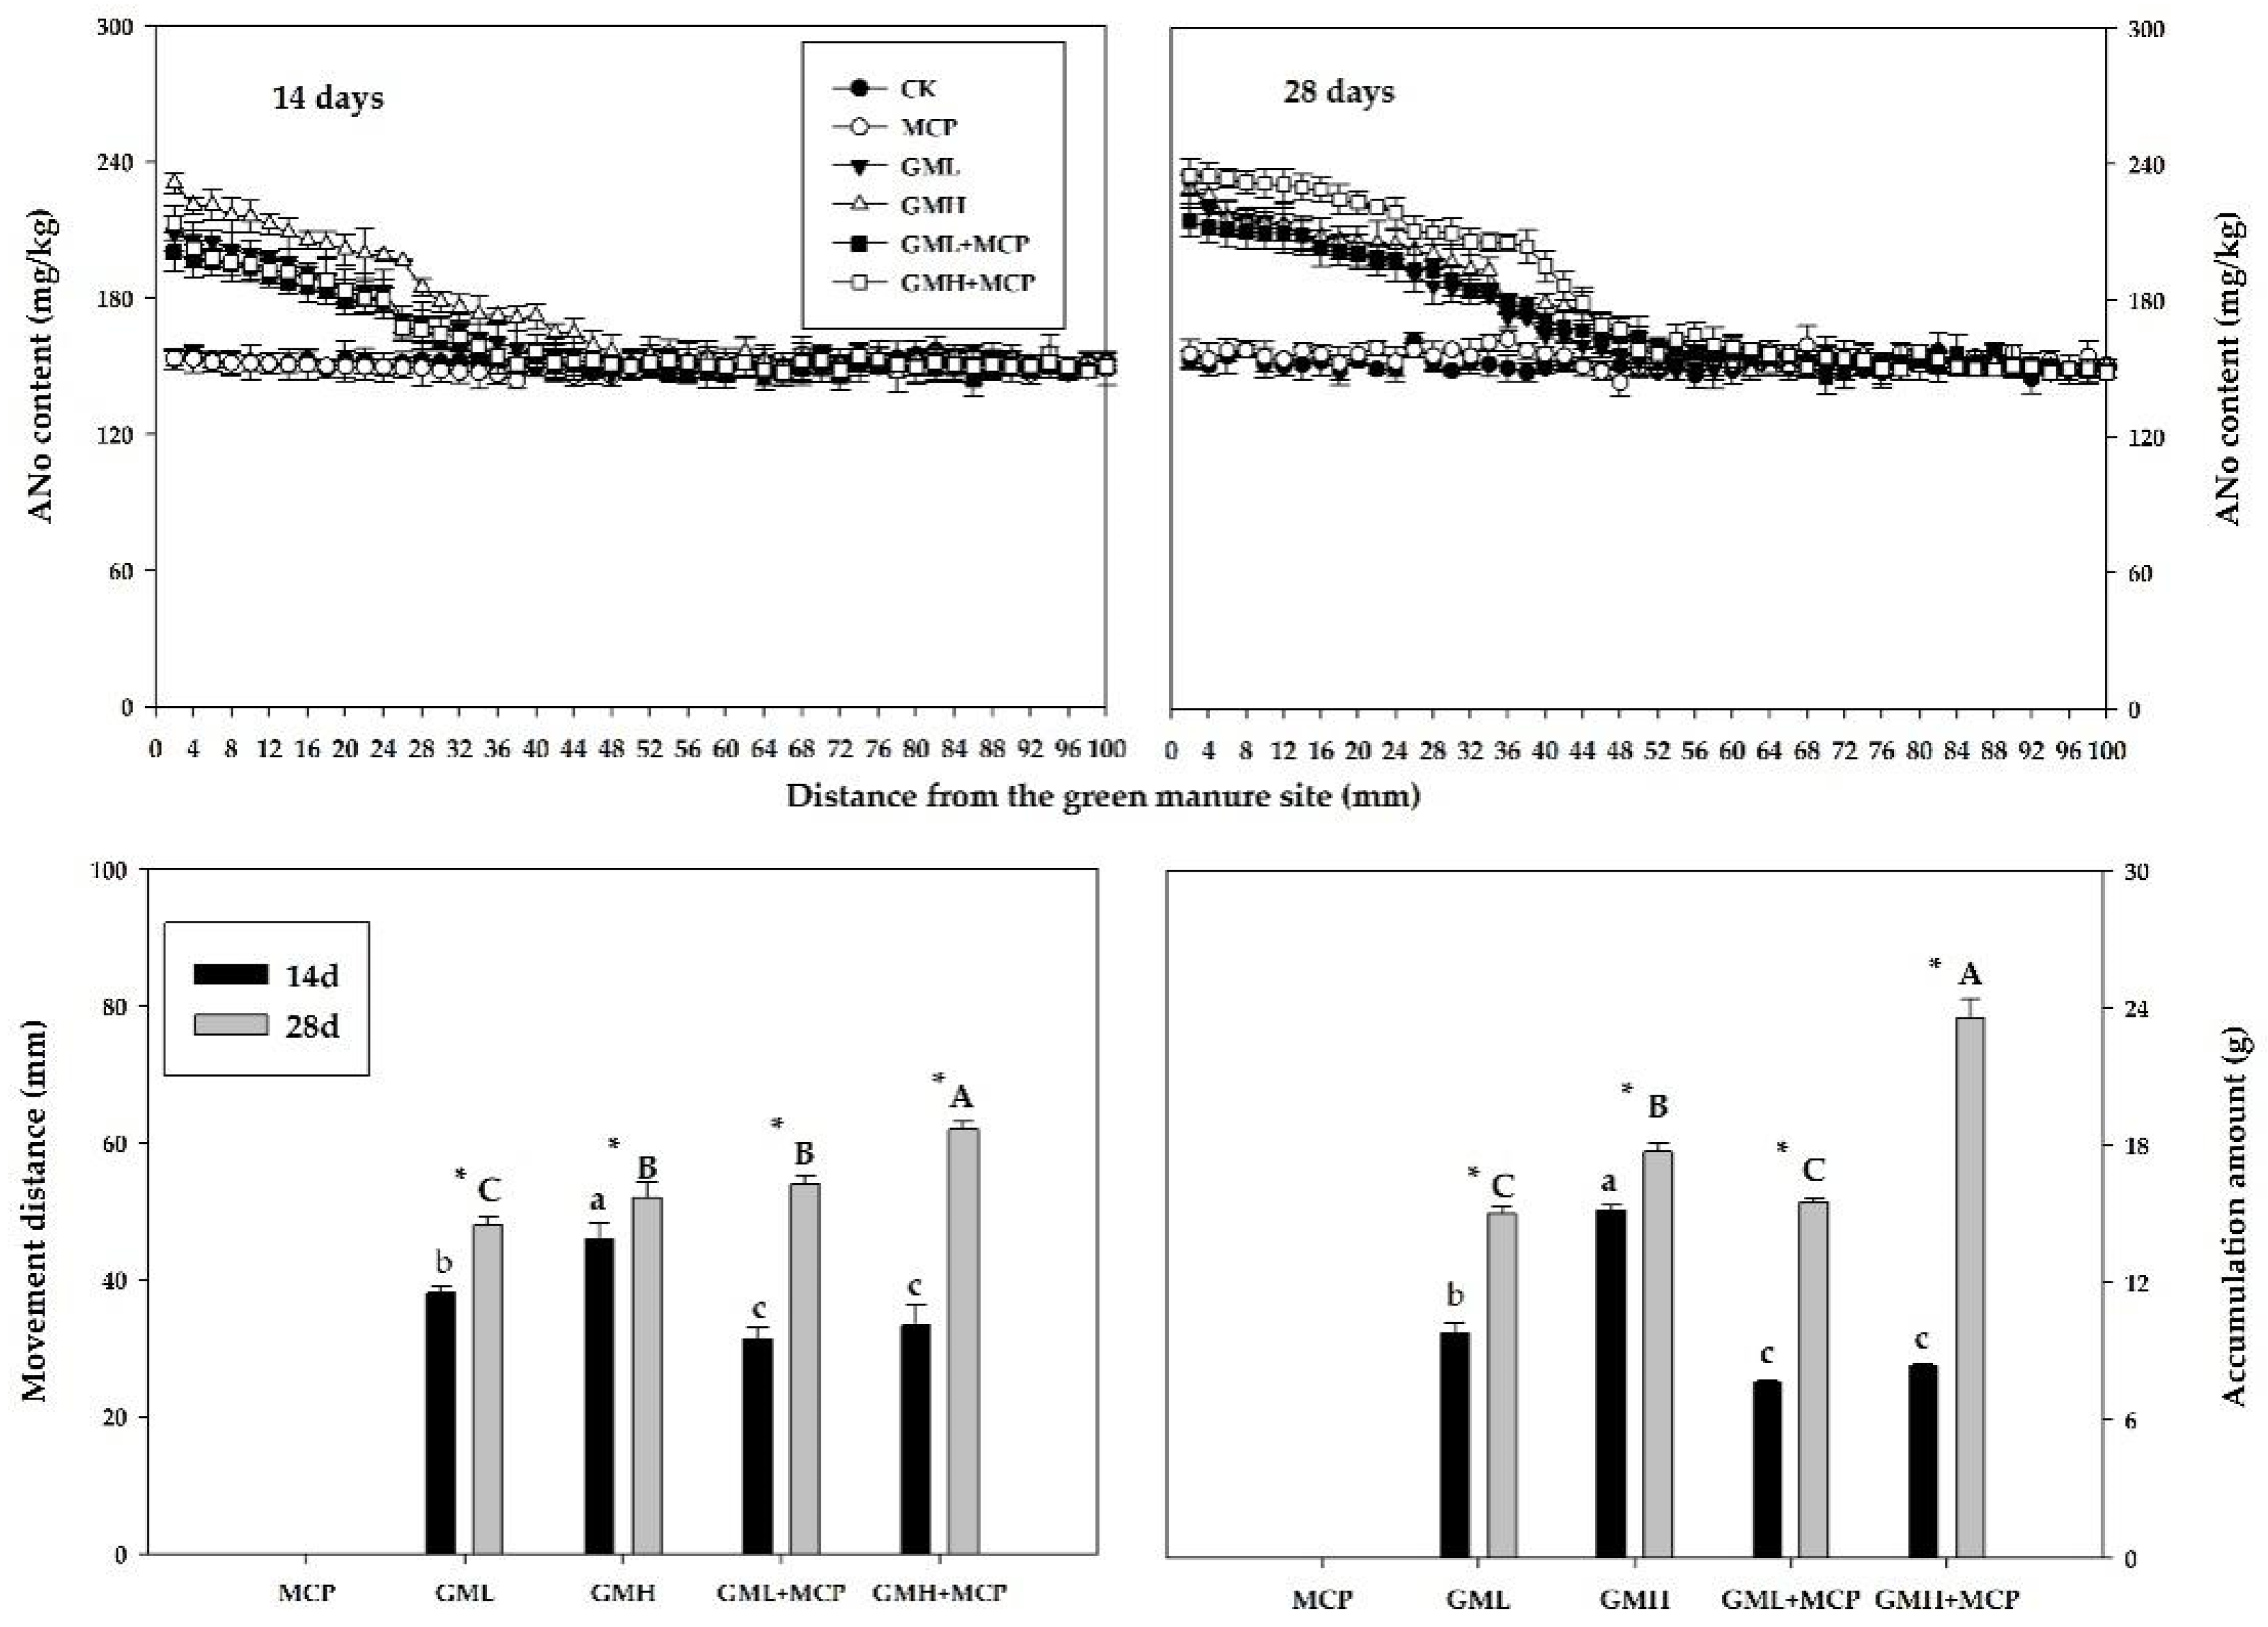
Ammonium Nitrogen
Amino Sugar Nitrogen
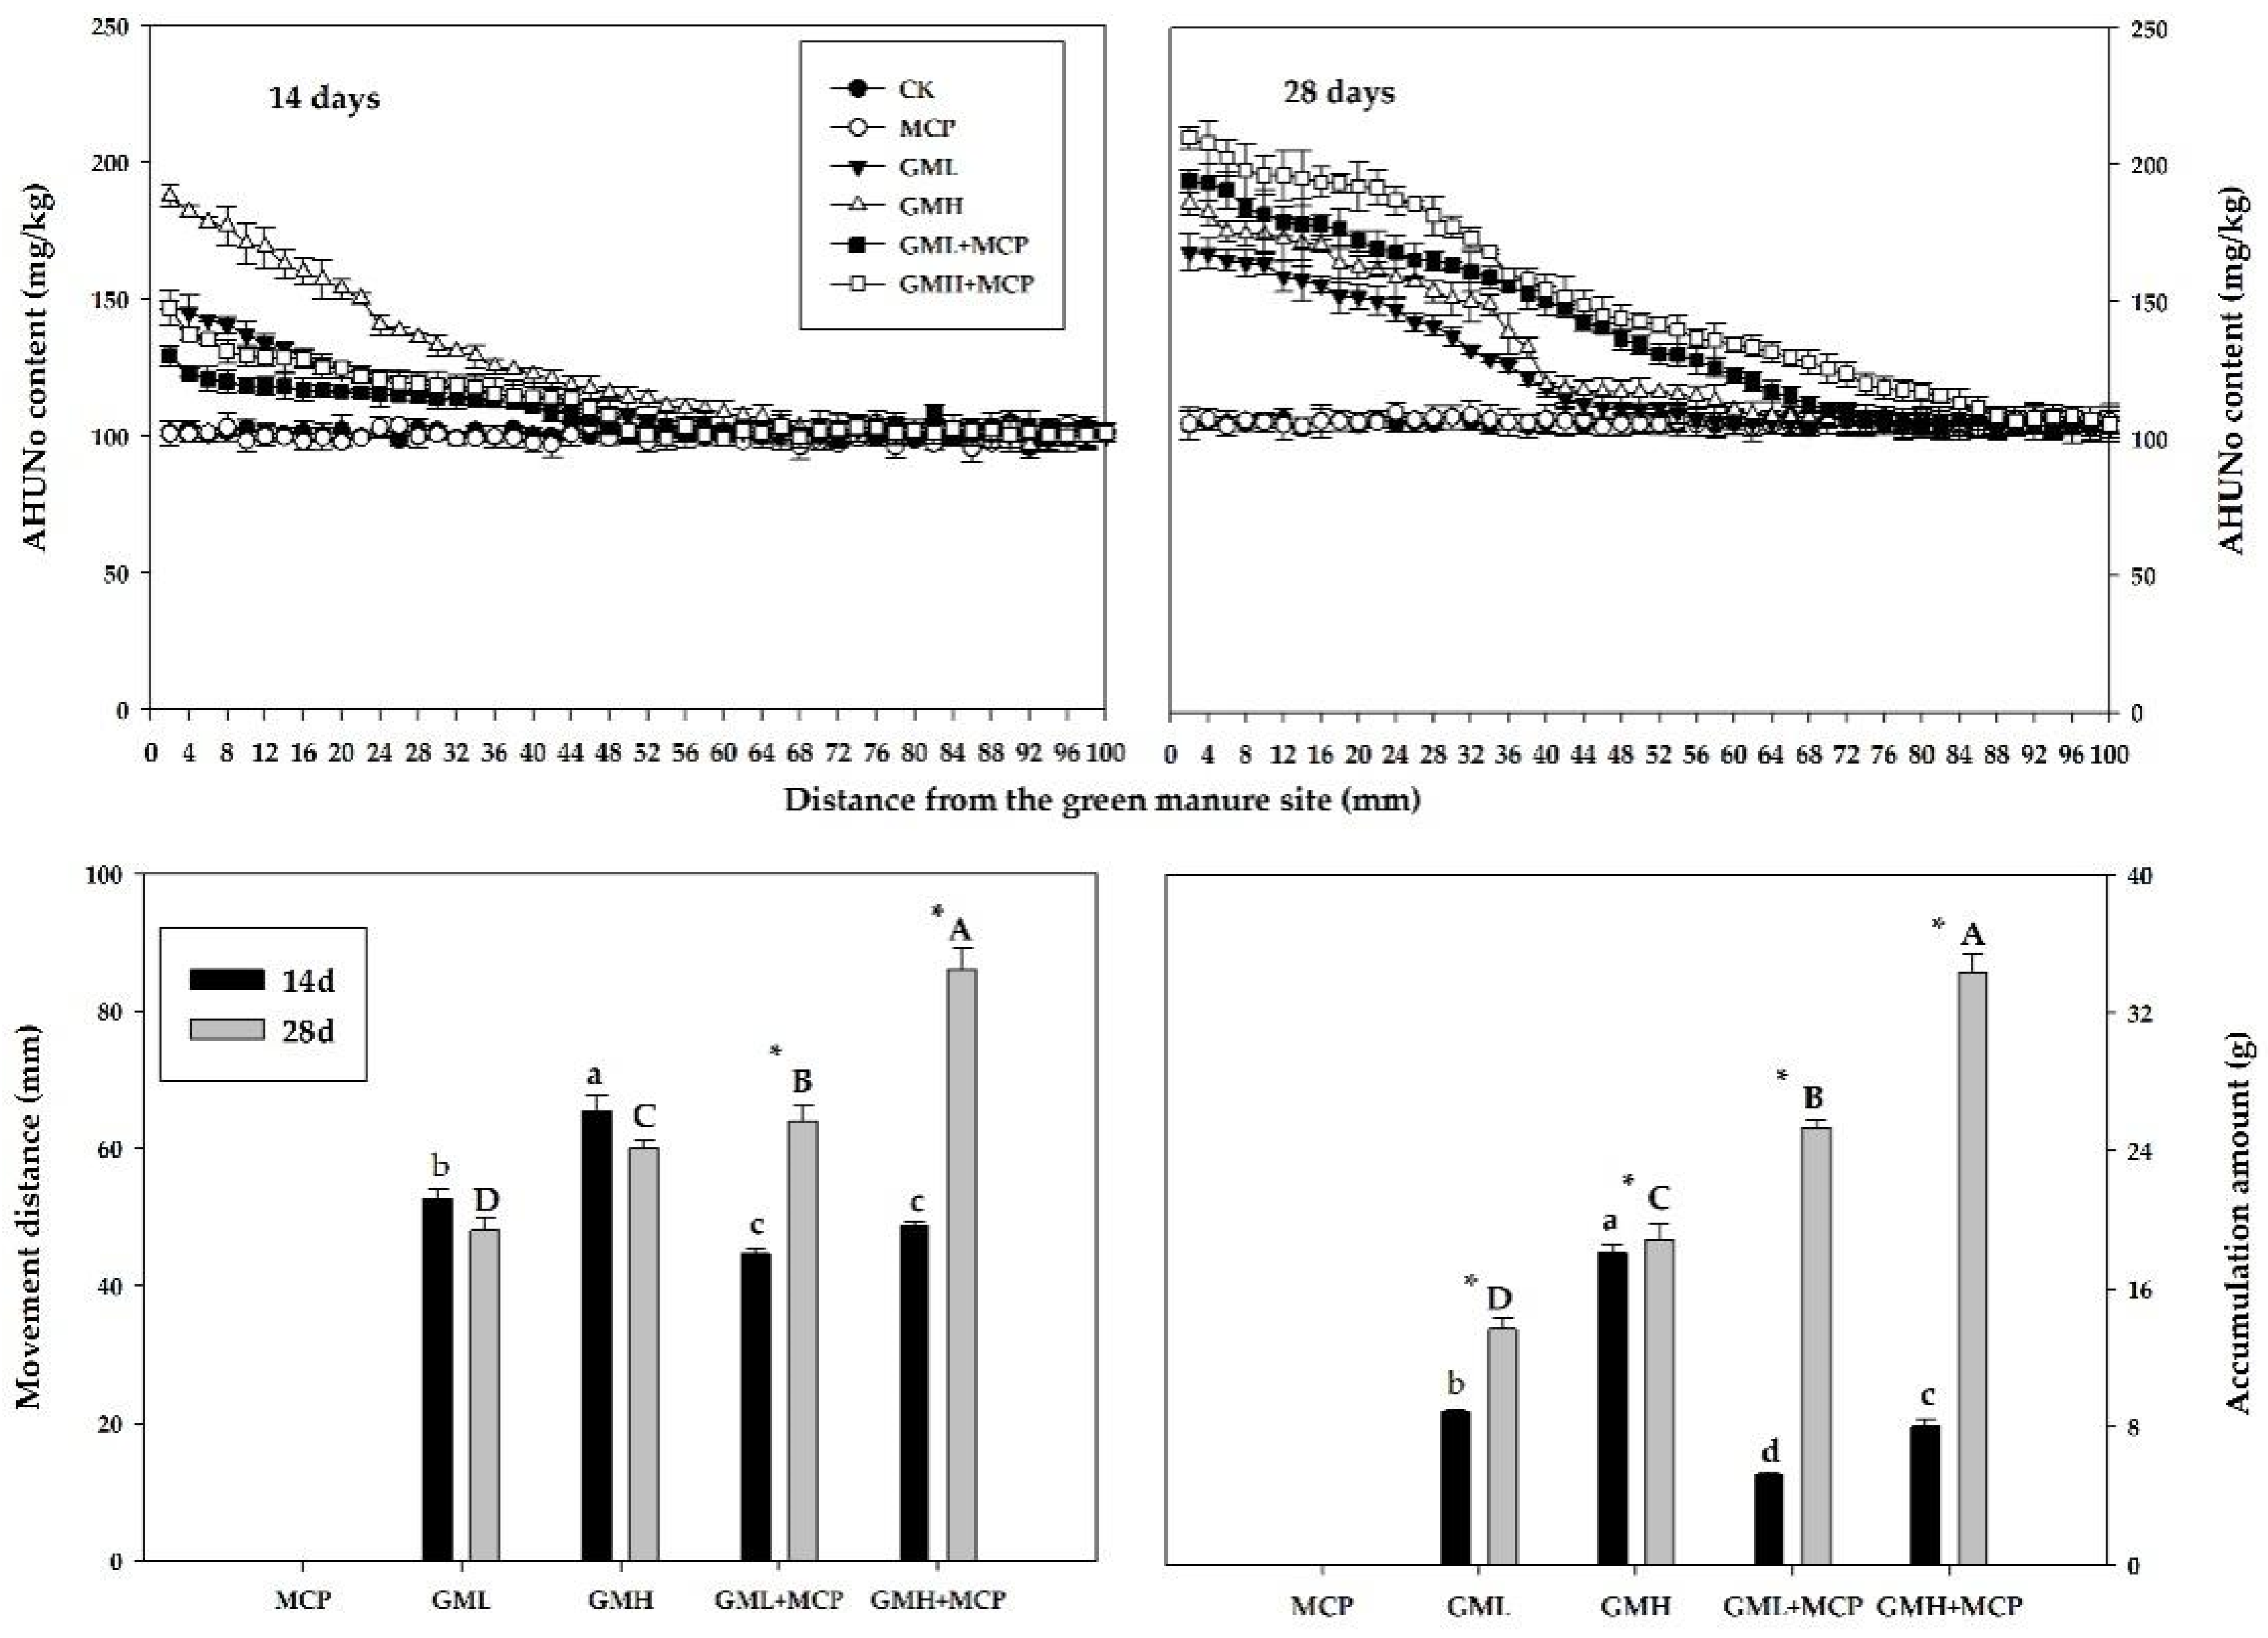
Acid-Hydrolyzable Unknown Nitrogen
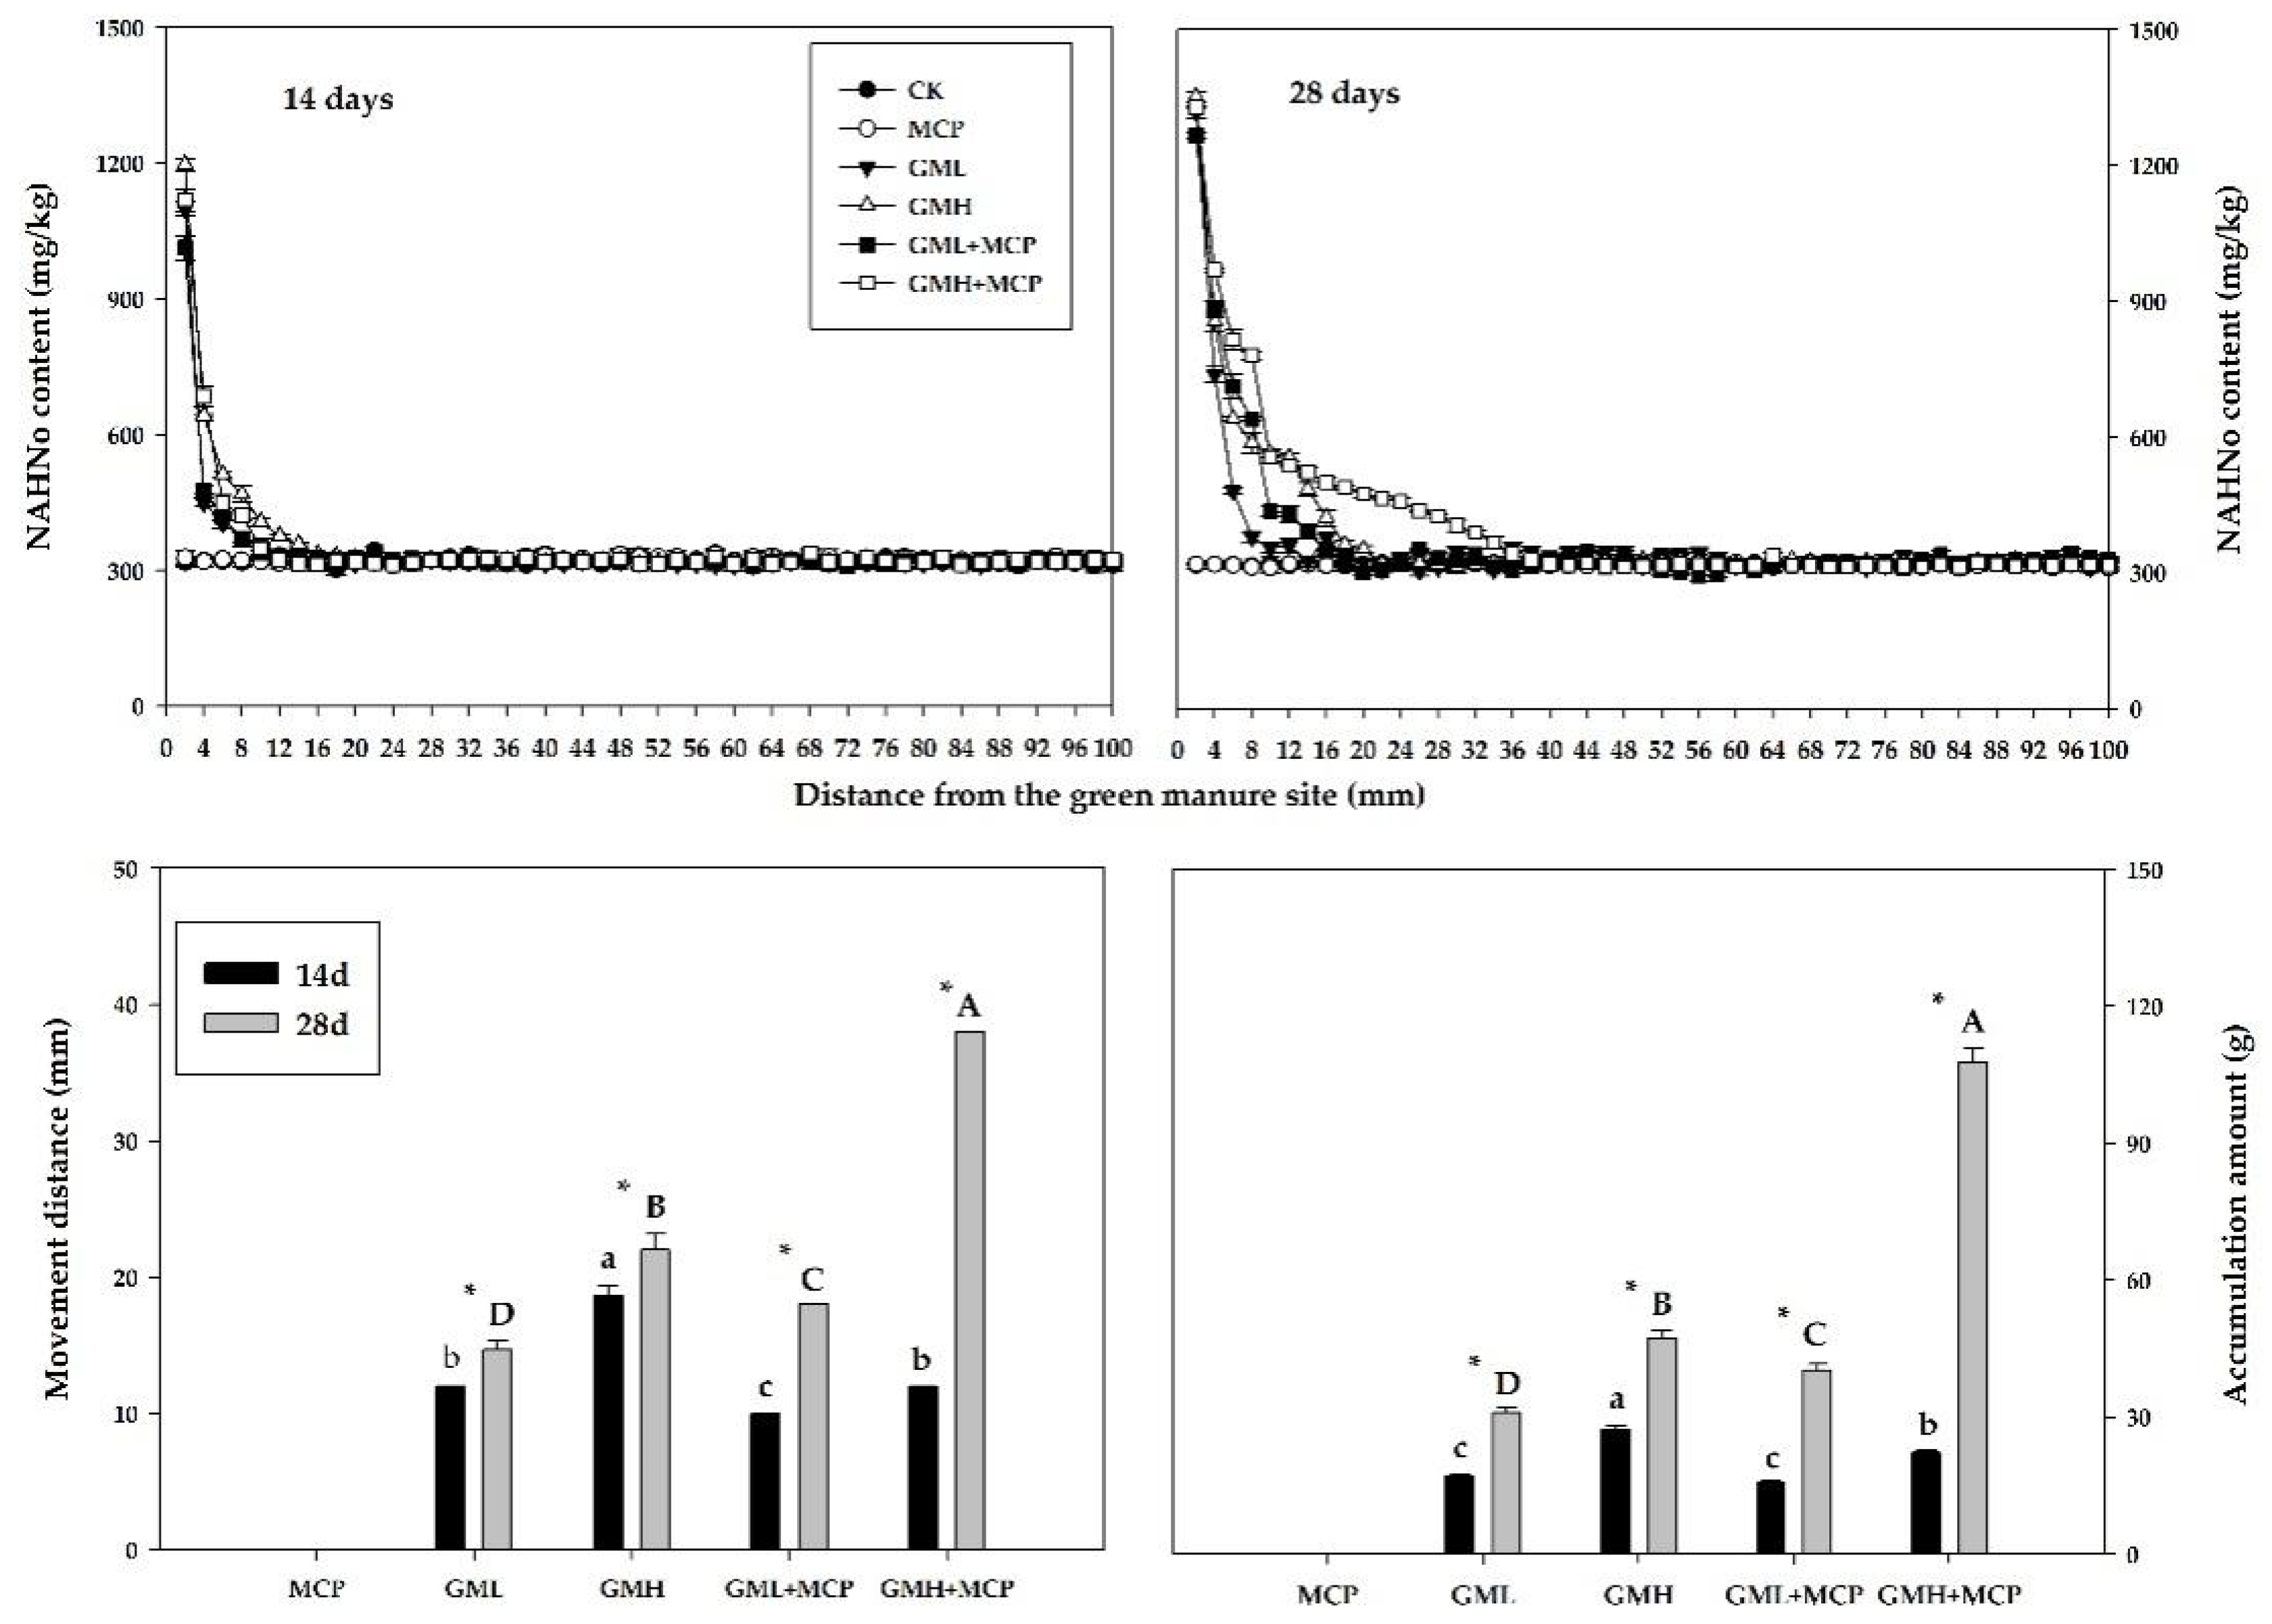
3.2.3. Non-Acid-Hydrolyzable N
4. Discussion
5. Conclusions
Author Contributions
Funding
Data Availability Statement
Acknowledgments
Conflicts of Interest
Abbreviations
| AANo | Amino acid nitrogen |
| AHNo | Acid-hydrolyzable nitrogen |
| AHNo | Acid-hydrolyzable nitrogen |
| AHUNo | Acid-hydrolyzable unknown nitrogen |
| ANo | Ammonium nitrogen |
| GM | Green manure |
| GMH | Stylosanthes GM (40 ton/ha) |
| GMH + MCP | Stylosanthes GM (40 ton/ha) + phosphate fertilizer (monocalcium phosphate, P 44 kg/ha) |
| GML | Stylosanthes GM (10 ton/ha) |
| GML + MCP | Stylosanthes GM (10 ton/ha) + phosphate fertilizer (monocalcium phosphate, P 44 kg/ha) |
| K | Potassium |
| MCP | Phosphate fertilizer (monocalcium phosphate, P 44 kg/ha) |
| N | Nitrogen |
| NAHNo | Non-acid-hydrolyzable nitrogen |
| No | Organic nitrogen |
| P | Phosphorus |
| TNo | Total organic nitrogen |
References
- Drăghici, R.; Nanu, Ș.; Diaconu, A.; Bîrsoghe, C.; Netcu, F.; Paraschiv, A.N.; Dima, M. Effect of green cowpea manure on the quality properties of sandy soils under the specific conditions of the dry climate in romania. Agronomy 2024, 14, 2474. [Google Scholar] [CrossRef]
- Hu, A.; Huang, D.; Duan, Q.; Zhou, Y.; Liu, G.; Huan, H. Cover legumes promote the growth of young rubber trees by increasing organic carbon and organic nitrogen content in the soil. Ind. Crop. Prod. 2023, 197, 116640. [Google Scholar] [CrossRef]
- Kucerik, J.; Brtnicky, M.; Mustafa, A.; Hammerschmiedt, T.; Kintl, A.; Sobotkova, J.; Alamri, S.; Baltazar, T.; Latal, O.; Naveed, M.; et al. Utilization of diversified cover crops as green manure-enhanced soil organic carbon, nutrient transformation, microbial activity, and maize growth. Agronomy 2024, 14, 2001. [Google Scholar] [CrossRef]
- Qi, H.; Li, B.; Fan, J.; Zhao, W.; Ma, Y.; Suo, Y.; Wang, M.; Wang, Y. Hybrid soybean as green manure for improving soil properties and subsequent crop growth. Agronomy 2024, 14, 2936. [Google Scholar] [CrossRef]
- Yao, Z.; Xu, Q.; Chen, Y.; Liu, N.; Li, Y.; Zhang, S.; Cao, W.; Zhai, B.; Wang, Z.; Zhang, D.; et al. Leguminous green manure enhances the soil organic nitrogen pool of cropland via disproportionate increase of nitrogen in particulate organic matter fractions. Catena 2021, 207, 105574. [Google Scholar] [CrossRef]
- Wang, L.; Li, J.; Liu, L.; Dong, R.; Liu, G.; Rao, I.M.; Chen, Z. Phenylalanine ammonia-lyase 2 regulates secondary metabolism and confers manganese tolerance in Stylosanthes guianensis. Plant Physiol. 2025, 197, kiaf005. [Google Scholar] [CrossRef]
- Mohanty, M.; Reddy, K.S.; Probert, M.E.; Dalal, R.C.; Rao, A.S.; Menzies, N.W. Modelling N mineralization from green manure and farmyard manure from a laboratory incubation study. Ecol. Model. 2011, 222, 719–726. [Google Scholar] [CrossRef]
- Bremner, J.M. Organic Forms of Nitrogen; American Society of Agronomy: Madision, WI, USA, 1965; pp. 1238–1255. [Google Scholar]
- Xia, Y.; Gao, P.; Lei, W.; Gao, J.; Luo, Y.; Peng, F.; Mou, T.; Zhao, Z.; Zhang, K.; Guggenberger, G.; et al. Covering green manure increases rice yields via improving nitrogen cycling between soil and crops in paddy fields. Agric. Ecosyst. Environ. 2025, 383, 109517. [Google Scholar] [CrossRef]
- Yu, Q.; Hu, X.; Ma, J.; Ye, J.; Sun, W.; Wang, Q.; Lin, H. Effects of long-term organic material applications on soil carbon and nitrogen fractions in paddy fields. Soil Till. Res. 2020, 196, 104483. [Google Scholar] [CrossRef]
- Xie, Z.; Zhou, C.; Shah, F.; Iqbal, A.; Ni, G.R. The role of Chinese Milk Vetch as cover crop in complex soil nitrogen dynamics in rice rotation system of South China. Sci. Rep. 2018, 8, 12061. [Google Scholar] [CrossRef]
- Du, Z.Y.; Zhou, J.M.; Wang, H.Y.; Du, C.W.; Chen, X.Q. Potassium movement and transformation in an acid soil as affected by phosphorus. Soil Sci. Soc. Am. J. 2006, 70, 2057–2064. [Google Scholar]
- Hu, A.; Huang, R.; Liu, G.; Huang, D.; Huan, H. Effects of green manure combined with phosphate fertilizer on migration characteristics of soil organic carbon fractions in tropical area. Agronomy 2022, 12, 1101. [Google Scholar] [CrossRef]
- Soil Science Society of China. The Analysis Method of Soil Agricultural Chemistry; Agricultural Science and Technology Press: Beijing, China, 2000. (In Chinese) [Google Scholar]
- Amelung, W.; Zhang, X. Determination of amino acid enantiomers in soils. Soil Biol. Biochem. 2001, 33, 553–562. [Google Scholar] [CrossRef]
- García-Fraile, P.; Benada, O.; Cajthaml, T.; Baldrian, P.; Lladó, S. Terracidiphilus gabretensis gen. nov., sp. nov., an abundant and active forest soil acidobacterium important in organic matter transformation. Appl. Environ. Microbiol. 2015, 82, 560–569. [Google Scholar]
- Xiong, W.; Zhao, Q.; Xue, C.; Xun, W.; Zhao, J.; Wu, H.; Li, R.; Shen, Q. Comparison of Fungal Community in Black Pepper-Vanilla and Vanilla Monoculture Systems Associated with Vanilla Fusarium Wilt Disease. Front. Microbiol. 2016, 9, 117. [Google Scholar]
- Zhou, X.; Fornara, D.; Wasson, E.A.; Wang, D.; Ren, G.; Christie, P.; Jia, Z. Effects of 44 years of chronic nitrogen fertilization on the soil nitrifying community of permanent grassland. Soil. Biol. Biochem. 2015, 91, 76–83. [Google Scholar]
- Huang, W.; Jiang, X. Profiling of Sediment Microbial Community in Dongting Lake before and after Impoundment of the Three Gorges Dam. Int. J. Environ. Res. Public Health 2016, 13, 617. [Google Scholar] [CrossRef]
- He, H.B.; Li, W.X.; Zhang, Y.W.; Cheng, J.K.; Jia, X.Y.; Li, S.; Yang, H.R.; Chen, B.M.; Xin, G.R. Effects of Iitalian ryegrass residues as green manure on soil properties and bacterial communities under an Italian ryegrass (Lolium multiflorum L.)-rice (Oryza sativa L.) rotation. Soil Till. Res. 2020, 196, 104487. [Google Scholar]
- Huang, D.; Liu, X.; Huan, H.; Liu, G.; Hu, A. Intercropping of stylosanthes green manure could improve the organic nitrogen fractions in a coconut plantation with acid soil. PLoS ONE 2023, 18, e0277944. [Google Scholar]
- Wu, G.; Chen, Z.; Jiang, N.; Jiang, H.; Chen, L. Effects of long-term no-tillage with different residue application rates on soil nitrogen cycling. Soil Till. Res. 2021, 212, 105044. [Google Scholar] [CrossRef]
- Huang, Q.R.; Hu, F.; Huang, S.; Li, H.X.; Yuan, Y.H.; Pan, G.X.; Zhang, W.J. Effect of long-term fertilization on organic carbon and nitrogen in a subtropical paddy soil. Pedosphere 2009, 19, 727–734. [Google Scholar]
- Wang, Y.; Huang, J.; Huan, H.; Huang, D.; Liu, G.; Leisure, D.; Hong, J.; Dong, R. Phosphate fertilizer addition increases the movement distance and content of the acid soil inorganic phosphorus fractions at green manure microsites. Agrochimica 2020, 64, 397–412. [Google Scholar]
- Marschner, P. Marschner’s Mineral Nutrition of Higher Plants, 3rd ed.; Academic Press: London, UK, 2012. [Google Scholar]
- Kooij, J.; Yang, P.T.; Bruun, S.; Magid, J.; Nielsen, U.G.; Kuhn, L.T.; Müller-Stöver, D. Phosphorus speciation in different sewage sludges and their biochars and its implications for movement of labile phosphate in two soils. J. Environ. Manag. 2024, 370, 122565. [Google Scholar]
- Hou, C.; Chu, M.L.; Botero-acosta, A.; Guzman, J.A. Modeling field scale nitrogen non-point source pollution (NPS) fate and transport: Influences from land management practices and climate. Sci. Total Environ. 2021, 759, 143502. [Google Scholar]
- Liu, D.; Song, C.; Fang, C.; Xin, Z.; Xi, J.; Lu, Y. A recommended nitrogen application strategy for high crop yield and low environmental pollution at a basin scale. Sci. Total Environ. 2021, 792, 148464. [Google Scholar]
- Kumar, R.; Bordoloi, N. Combined impact of reduced N fertilizer and green manure on wheat yield, nitrogen use efficiency and nitrous oxide (N2O) emissions reduction in Jharkhand, eastern India. Field Crop. Res. 2024, 318, 109591. [Google Scholar]
- Daba, N.A.; Huang, J.; Shen, Z.; Han, T.; Alam, M.A.; Li, J.; Tadesse, K.A.; Gilbert, N.; Kebede, E.; Legesse, T.G.; et al. Green manure substitution for chemical nitrogen reduces greenhouse gas emissions and enhances yield and nitrogen uptake in ricerice cropping systems. Field Crop. Res. 2025, 322, 109715. [Google Scholar]


Disclaimer/Publisher’s Note: The statements, opinions and data contained in all publications are solely those of the individual author(s) and contributor(s) and not of MDPI and/or the editor(s). MDPI and/or the editor(s) disclaim responsibility for any injury to people or property resulting from any ideas, methods, instructions or products referred to in the content. |
© 2025 by the authors. Licensee MDPI, Basel, Switzerland. This article is an open access article distributed under the terms and conditions of the Creative Commons Attribution (CC BY) license (https://creativecommons.org/licenses/by/4.0/).
Share and Cite
Huang, J.; Hong, J.; Arango, J.; Huang, D.; Huan, H. The Response of Soil Organic Nitrogen to the Application of Green Manure Mixed with Phosphate Fertilizer at Manure Microsite on Acidic Soil. Agronomy 2025, 15, 813. https://doi.org/10.3390/agronomy15040813
Huang J, Hong J, Arango J, Huang D, Huan H. The Response of Soil Organic Nitrogen to the Application of Green Manure Mixed with Phosphate Fertilizer at Manure Microsite on Acidic Soil. Agronomy. 2025; 15(4):813. https://doi.org/10.3390/agronomy15040813
Chicago/Turabian StyleHuang, Jiapu, Jiwang Hong, Jacobo Arango, Dongfen Huang, and Hengfu Huan. 2025. "The Response of Soil Organic Nitrogen to the Application of Green Manure Mixed with Phosphate Fertilizer at Manure Microsite on Acidic Soil" Agronomy 15, no. 4: 813. https://doi.org/10.3390/agronomy15040813
APA StyleHuang, J., Hong, J., Arango, J., Huang, D., & Huan, H. (2025). The Response of Soil Organic Nitrogen to the Application of Green Manure Mixed with Phosphate Fertilizer at Manure Microsite on Acidic Soil. Agronomy, 15(4), 813. https://doi.org/10.3390/agronomy15040813