Article

Assessing 16 Years of Tillage Dynamics on Soil Physical Properties, Crop Root Growth and Yield in an Endocalcic Chernozem Soil in Hungary

by
Maimela Maxwell Modiba
1,*,
Caleb Melenya Ocansey
2,3,
Hanaa Tharwat Mohamed Ibrahim
3,
Márta Birkás
1,
Igor Dekemati
1 and
Barbara Simon
3
1
Institute of Crop Production Sciences, Hungarian University of Agriculture and Life Sciences, H-2100 Gödöllő, Hungary
2
CSIR—Crops Research Institute, Fumesua, Kumasi P.O. Box 3785, Ghana
3
Institute of Environmental Sciences, Hungarian University of Agriculture and Life Sciences, H-2100 Gödöllő, Hungary
*
Author to whom correspondence should be addressed.
Agronomy 2025, 15(4), 801; https://doi.org/10.3390/agronomy15040801
Submission received: 5 March 2025 / Revised: 17 March 2025 / Accepted: 22 March 2025 / Published: 24 March 2025
(This article belongs to the Section Farming Sustainability)

Abstract

:
The conservation tillage method is a more holistic method introduced in Hungary two decades ago. Its environmental benefits in agriculture were widely studied and documented. The impact of conservation tillage on soil compaction and penetration resistance remains debated, necessitating further research to clarify its long-term effects in different soil types and cropping systems. The present study evaluates the impact on soil penetration resistance following 16 years of implementation of six distinct tillage practices. The study was conducted at Józsefmajor Experimental and Training Farm (JM) of the Hungarian University of Agriculture and Life Sciences near Hatvan. The study employed a randomized complete block design (RCBD) to evaluate six distinct tillage methods. These methods encompassed disking (D) at 12–14 cm depth, shallow cultivation (SC) at 18–20 cm depth, no-tilling (NT), deep cultivation (DC) at 22–25 cm depth, loosening (L) at 40–45 cm depth, and plowing (P) at 28–30 cm depth. In this study, soil compaction was assessed by measuring soil penetration resistance (SPR) at different depths (0–50 cm) and periods of the cropping year. Disking and NT significantly increased SPR between 10 and 20 cm, likely due to increased soil densification and reduced porosity in the absence of deep soil disturbance. While under sunflower cropping season significantly higher SPR was measured. In March 2021, the SPR at D and NT differed significantly from other measurement dates (September, October, November, and April). Regarding the difference between the depths, SPR increased with increasing depths in all treatment plots. The study findings revealed that NT and D tillage methods significantly increased soil penetration resistance in both cropping years, whereas L and P reduced SPR and enhanced the soil moisture storage potential of the soil particularly for the sunflower cropping period. The significance of the Spearman correlations observed suggested that SPR could be a valuable indicator of root growth potential under certain tillage conditions. Based on our results, we recommend the adoption of occasional deep soil loosening for reduced tillage systems (SC, D, DC, and NT) for both wheat and sunflower. This will create a compact-free zone for greater crop root proliferation, nutrient access, and SMC storage.

1. Introduction

The increasing global population will influence food demand, with most food produced on arable land where tillage is integral to production. Classic researchers advocated tillage primarily to provide a good seedbed for crop production [1,2]. However, this rendered soil vulnerable to extreme climate impacts, such as the expansion of existing compact layers and the reduction of crumb fractions, causing physical deterioration in arable soils [3].
Studies have shown that plowed soils become more prone to pore-clogging, reduced loosened layers, crumbs disintegration, and surface siltation [4,5]. In addition, ref. [6] further emphasized the negative impacts of conventional tillage (CT) on soil physical properties, including increased compaction, reduced water infiltration, and decreased aggregates. Nonetheless, according to [7], tillage can be one of the tools to improve and preserve soil quality. Among the available tillage methods, conservation tillage (CA) practices have been found to better improve soil properties. Such management practices in the long term improve soil aggregation [8,9] (crumb-to-dust ratio) and soil organic matter (SOM), thus enhancing the resiliency of soils to projected climate and weather extremities.
The CA practice is a more holistic method introduced in Hungary two decades ago [10]. Its environmental benefits in agriculture were widely studied and documented. However, the discrepancies between the positive and negative effects of CA on soil compaction and soil penetration resistance (SPR) and the lack of comprehensive research in specific regions such as Gödöllő due to soil heterogeneity necessitate further investigation. To address these research gaps and provide a comprehensive understanding of the effects of tillage on soil physical properties in Gödöllő. We conducted a study on a long-term tillage experiment to assess the effect of six tillage practices on soil penetration resistance, crop root growth, and yield. Our hypothesis was that higher SPR would be observed under NT treatments and plowing affecting crop root proliferation, while loosening would be effective in reducing SPR. The objectives were (a) to assess the spatial and temporal response SPR under six tillage practices, disking (D), shallow cultivation (SC), no-till (NT), deep cultivation (DC), plowing (P) and loosening (L), (b) to determine the effect of the six tillage treatments on root growth biomass weight under rainfed agriculture, and (c) to evaluate the relationship of the level of SPR on root biomass and the relationship between root biomass and crop yield.

2. Materials and Methods
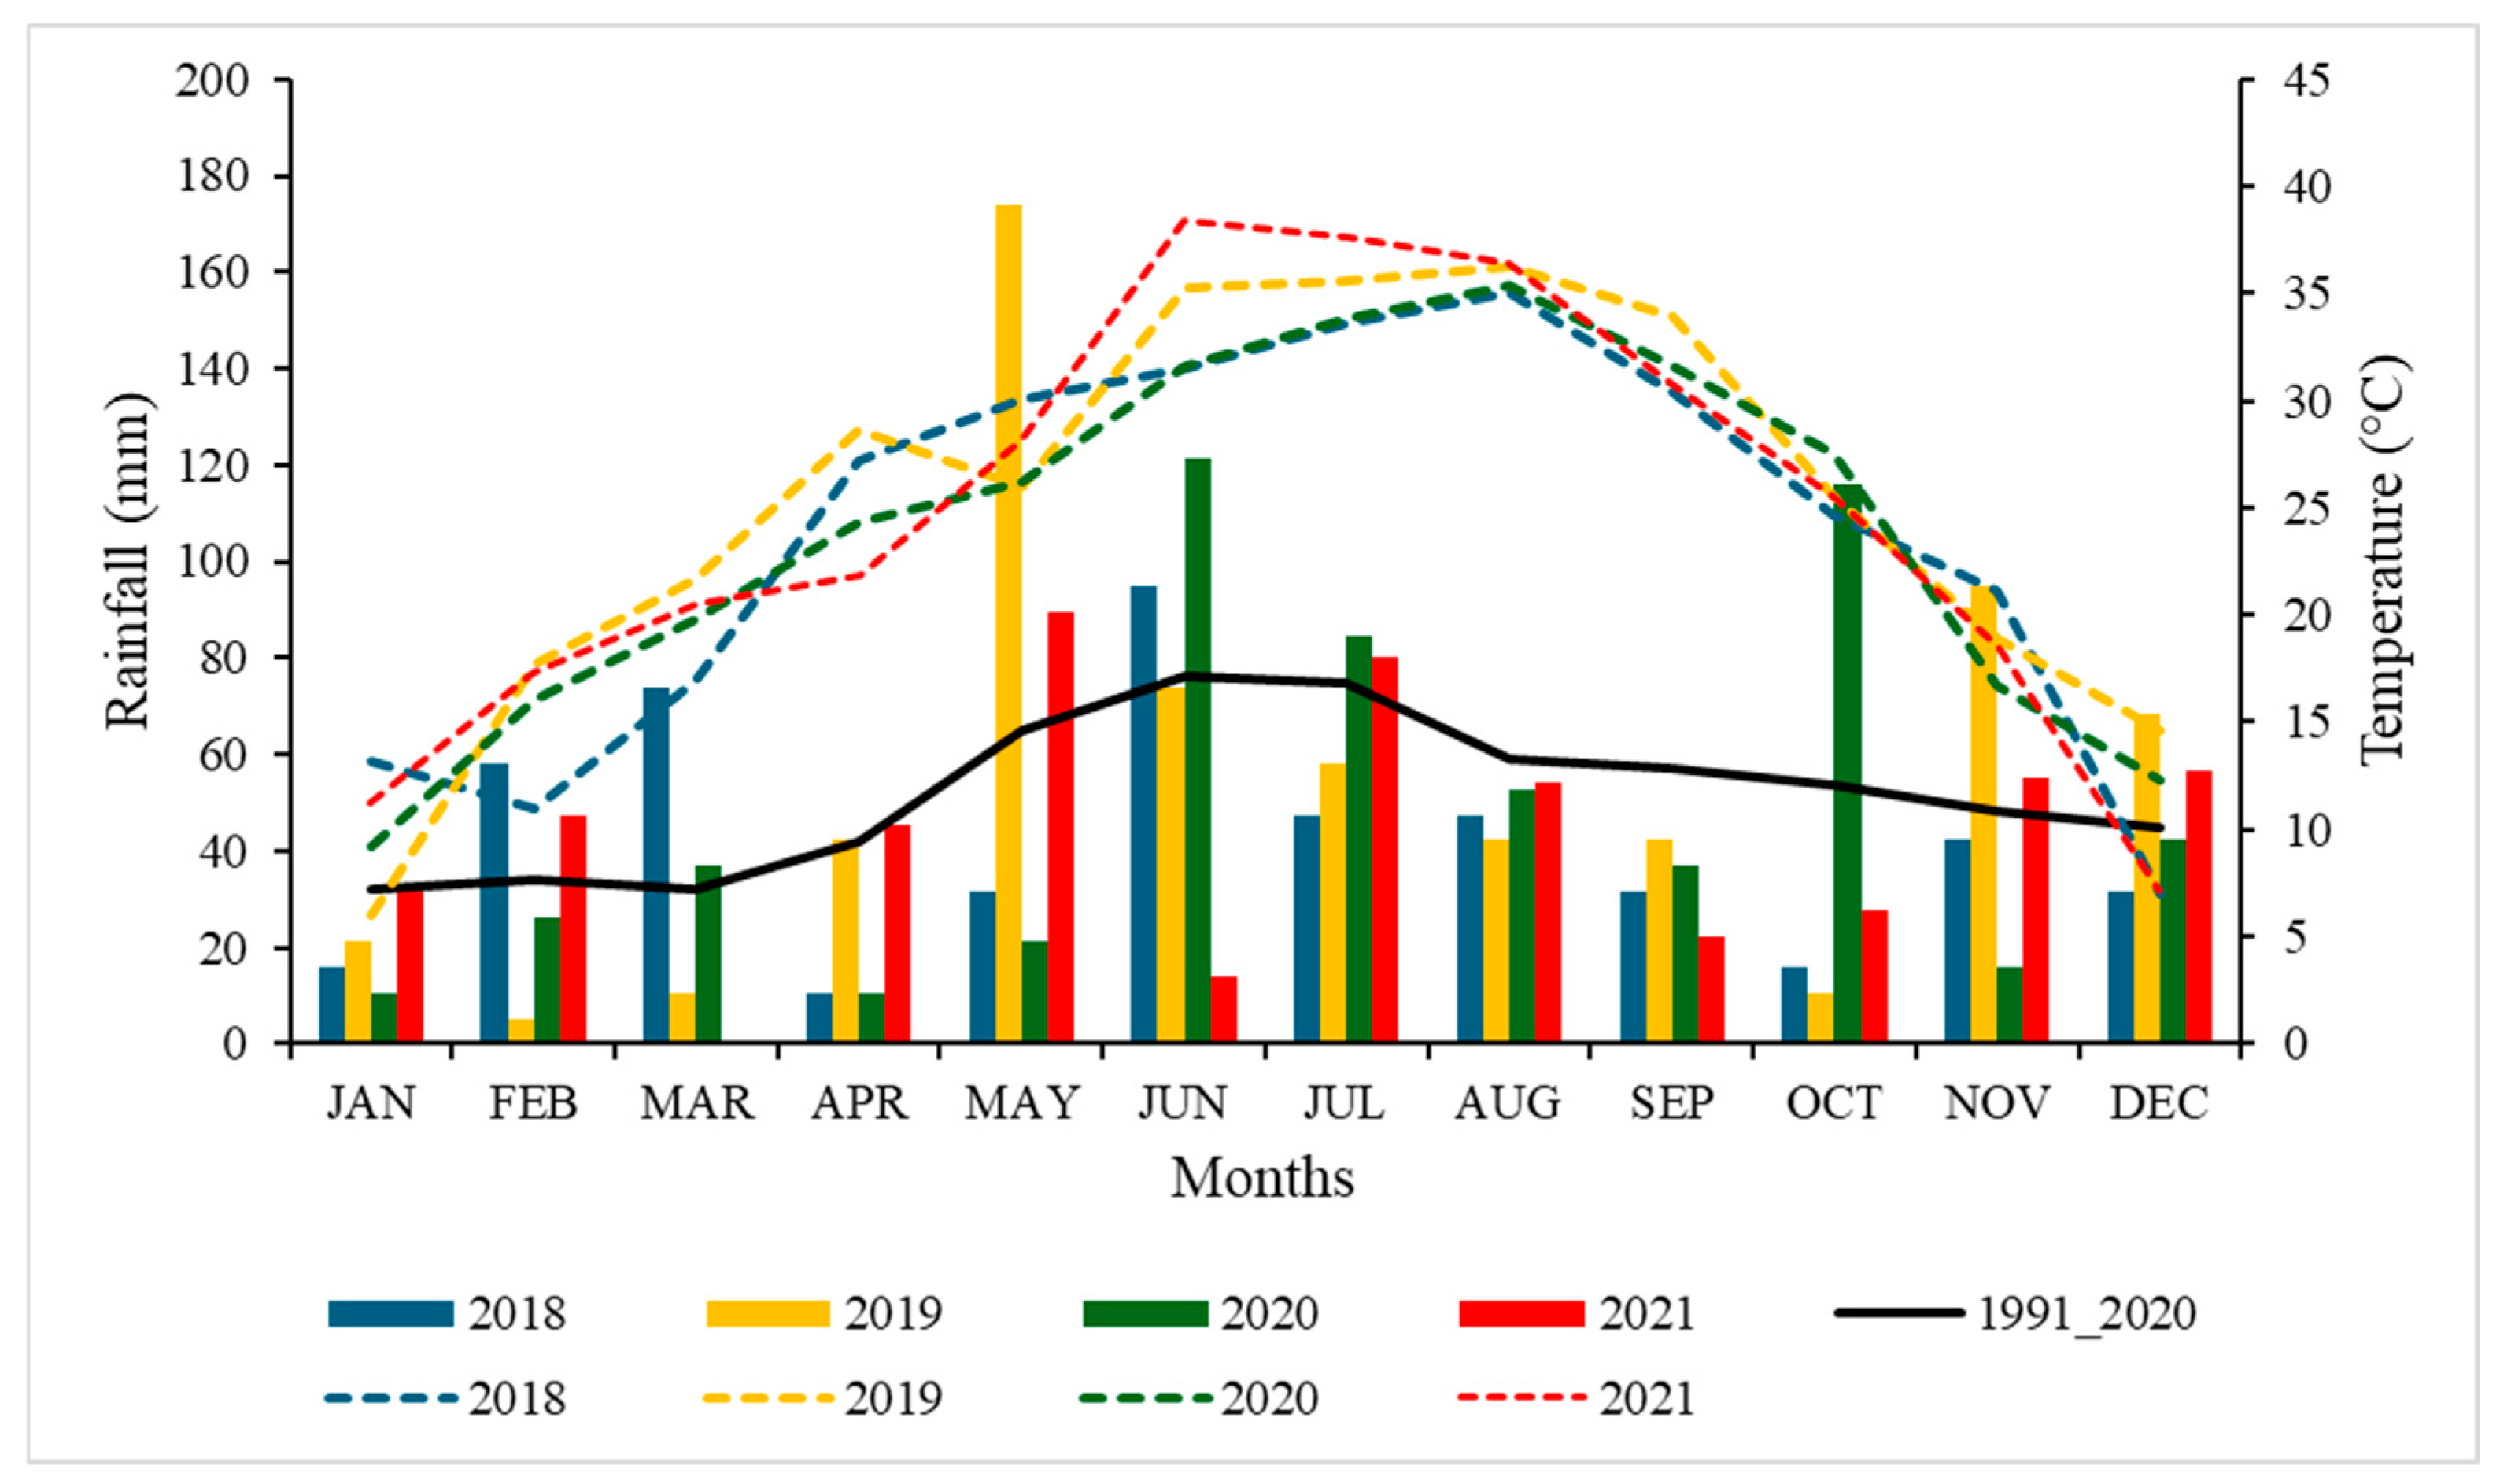
2.1. Study Location

The experiment was setup at Józsefmajor Experimental and Training Farm (JM) of the Hungarian University of Agriculture and Life Sciences near Hatvan (47°41′30.6″ latitude N—19°36′46.1″ longitude E; 110 m above sea level) set up in 2002. The research plot covers 5.5 hectares on a level landscape. The soil type is classified as an Endocalcic Chernozems and has a clay loam texture [11]. The uppermost 20 cm stratum of the soil exhibited a humus content of 3.12% with a soil composition of 10% sand, 54% silt, and 36% clay [12]. According to Ács et al. [13], Hungary experiences a continental climate characterized by warm dry summers and cold wet winters. The yearly temperatures range between 10.3 and 15 °C during plant development stages [14]. The yearly average rainfall period from 2018 to 2021 ranged between 500.98 to 643.36 mm (Figure 1). The research duration received 117.55, 43.72, and 95.24 mm below the long-term annual average (1991–2020) in 2018, 2020, and 2021, respectively, whereas the 2019 average annual rainfall was 24.33 mm higher than the long-term average.

2.2. Cropping Activities for Wheat and Sunflower

Wheat seasonal cropping activities in 2018 commenced with the application of NPK fertilizer, followed by tillage, breaking, and rolling (Table 1). Wheat planting and land cultivation were both performed in the same month. Within October 2018, planted wheat germinated from the second week of November until the fourth week of December. During this period, shallow plowing was performed in all the experimental plots except under NT. In February 2019, head fertilization was performed, and an additional herbicide was applied for weed control. Disease prevention measures were initiated in June 2019 with the application of fungicides and spraying against seed bleaching prior to harvesting in July.
During the sunflower cropping period, the experimental region received 87 mm of rainfall from cultivation to planting and 215 mm from planting to harvest. Notably, there was a presence of winds that contributed to soil drying. Basic cultivation (P, L, DC, SC, and D) was performed in September followed by the fertilizer application (Table 1). Prior to bed preparation, herbicide was applied to control weeds, and this was followed by sunflower sowing.
The experimental design was set up in 2002 on 5.5 hectares. Crops planted since the experiment was first laid down were as follows: white mustard (2002), winter wheat (2002/03), rye (2003/04), pea (2004), winter wheat (2004/05), white mustard (2005), winter wheat (2005/06), phacelia (2006), maize (2007), sunflower (2008), winter wheat (2008/09), white mustard (2009), maize (2010), spring oat (2011), winter wheat (2011/12), spring barley (2013), sunflower (2014), winter wheat (2014/15), maize (2016), winter oat (2016/17), soybean (2018), winter wheat (2018/19), oat (2020), and sunflower (2021). It consisted of six tillage methods, namely disking (D) to a depth of 12–14 cm, shallow cultivation (SC) to 18–20 cm, no-tilling (NT), deep cultivation (DC) to 22–25 cm, loosening (L) to 40–45 cm, and plowing (P) to 28–30 cm (Table 2), arranged in a randomized complete block (RCBD) design. Furthermore, the tillage treatments are replicated four times to account for the effect of soil heterogeneity. Each experimental plot measured 2340 m2 (13 × 180 m), a size chosen to account for soil heterogeneity while ensuring sufficient replication for statistical robustness.

2.3. Soil Sampling and Measurements

Soil penetration resistance (SPR) was evaluated at 5 cm intervals from the surface to a depth of 50 cm with four replicates per treatment. The collected data were subsequently consolidated into depth ranges of 0–10, 10–20, 20–30, 40–50, and 50–60 cm. Measurements were conducted at 30-day intervals between March and November during the wheat and sunflower growing seasons. SPR measurements were conducted using an Eijkelkamp penetrologger (by Royal Eijkelkamp in Giesbeek, The Netherlands) with a conical point (1 cm2, 60° angle). To minimize operator variability, measurements were taken at a controlled penetration speed of 2 cm/s, with three replicates per treatment. The measurement ranged from 0 to 4.68 MPa. Root weight and crop yield were measured after harvest. Crop roots were sampled at a maximum depth of 30 cm from the topsoil in four replicates. Roots were thoroughly cleaned with water to remove all the soil particles and left to air-dry before weighing.

2.4. Statistical Analysis

The SPR data were analyzed using R software version 4.3.1. Following the application of both the Kolmogorov–Smirnov test and the Shapiro–Wilk test to the SPR data, we learned that the data violated the normal distribution assumptions. Therefore, generalized linear mixed models (GLMMs) using the lme4 package in R were employed to investigate the relationship between SPR and tillage treatments while accounting for various random effects, such as depth and temporal variation. All means were differentiated using Tukey’s HSD post hoc test at a 5% level of significance. Spearman correlation was used to assess the relationship between SPR and RW and between SPR and yield.

3. Results

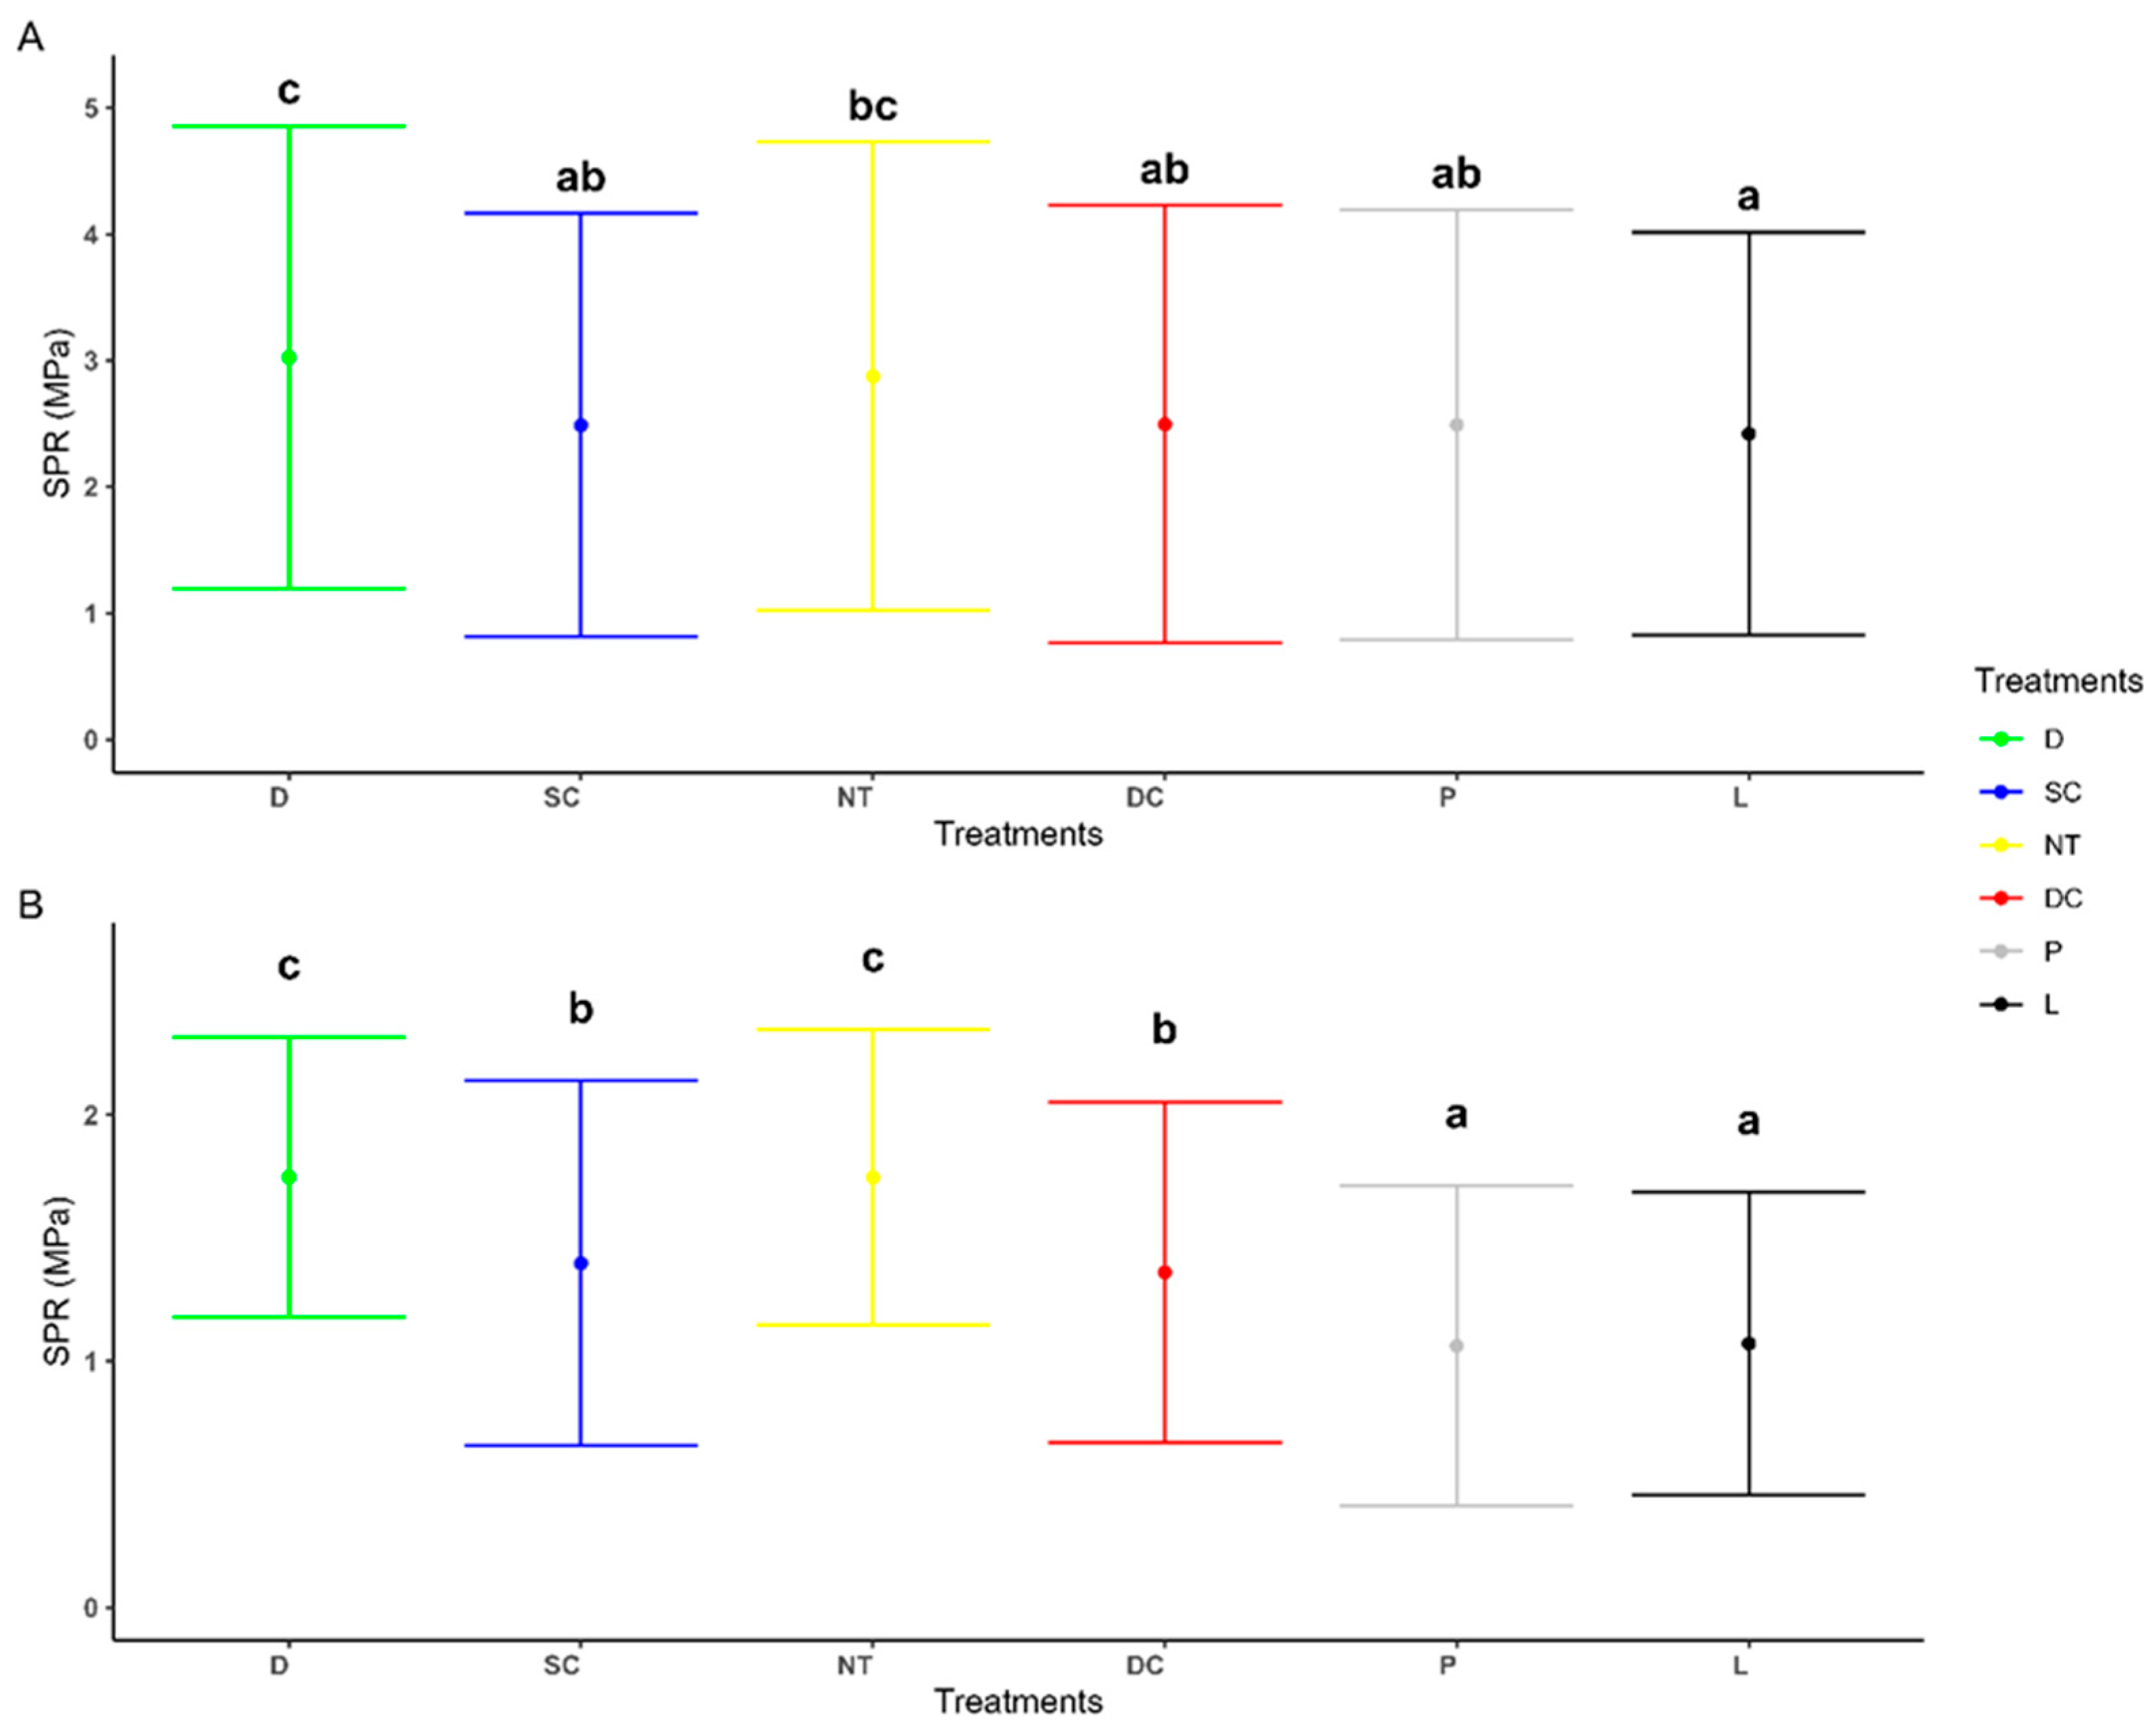
3.1. The Effect of Different Tillage Methods on Soil Penetration Resistance from 0–50 cm Depth

The current study assessed the effect of different tillage methods, sampling periods, and soil depths on SPR. According to the results obtained, tillage significantly affected SPR (p < 0.05) in both wheat and sunflower cropping seasons (Figure 2). The seasonal mean SPR for the wheat cropping season from the 0–50 cm soil depth among tillage methods showed the following trend: D < NT < DC < SC = P < L. Soil penetration resistance decreased from D to L; however, the differences were only significant between D and P, as well as between D and L. In 2021, during the sunflower growing period, SPR at 0–50 cm depth showed the following trend: D = NT < SC = DC < P = L, indicating that SPR decreased with increasing soil tillage potency.

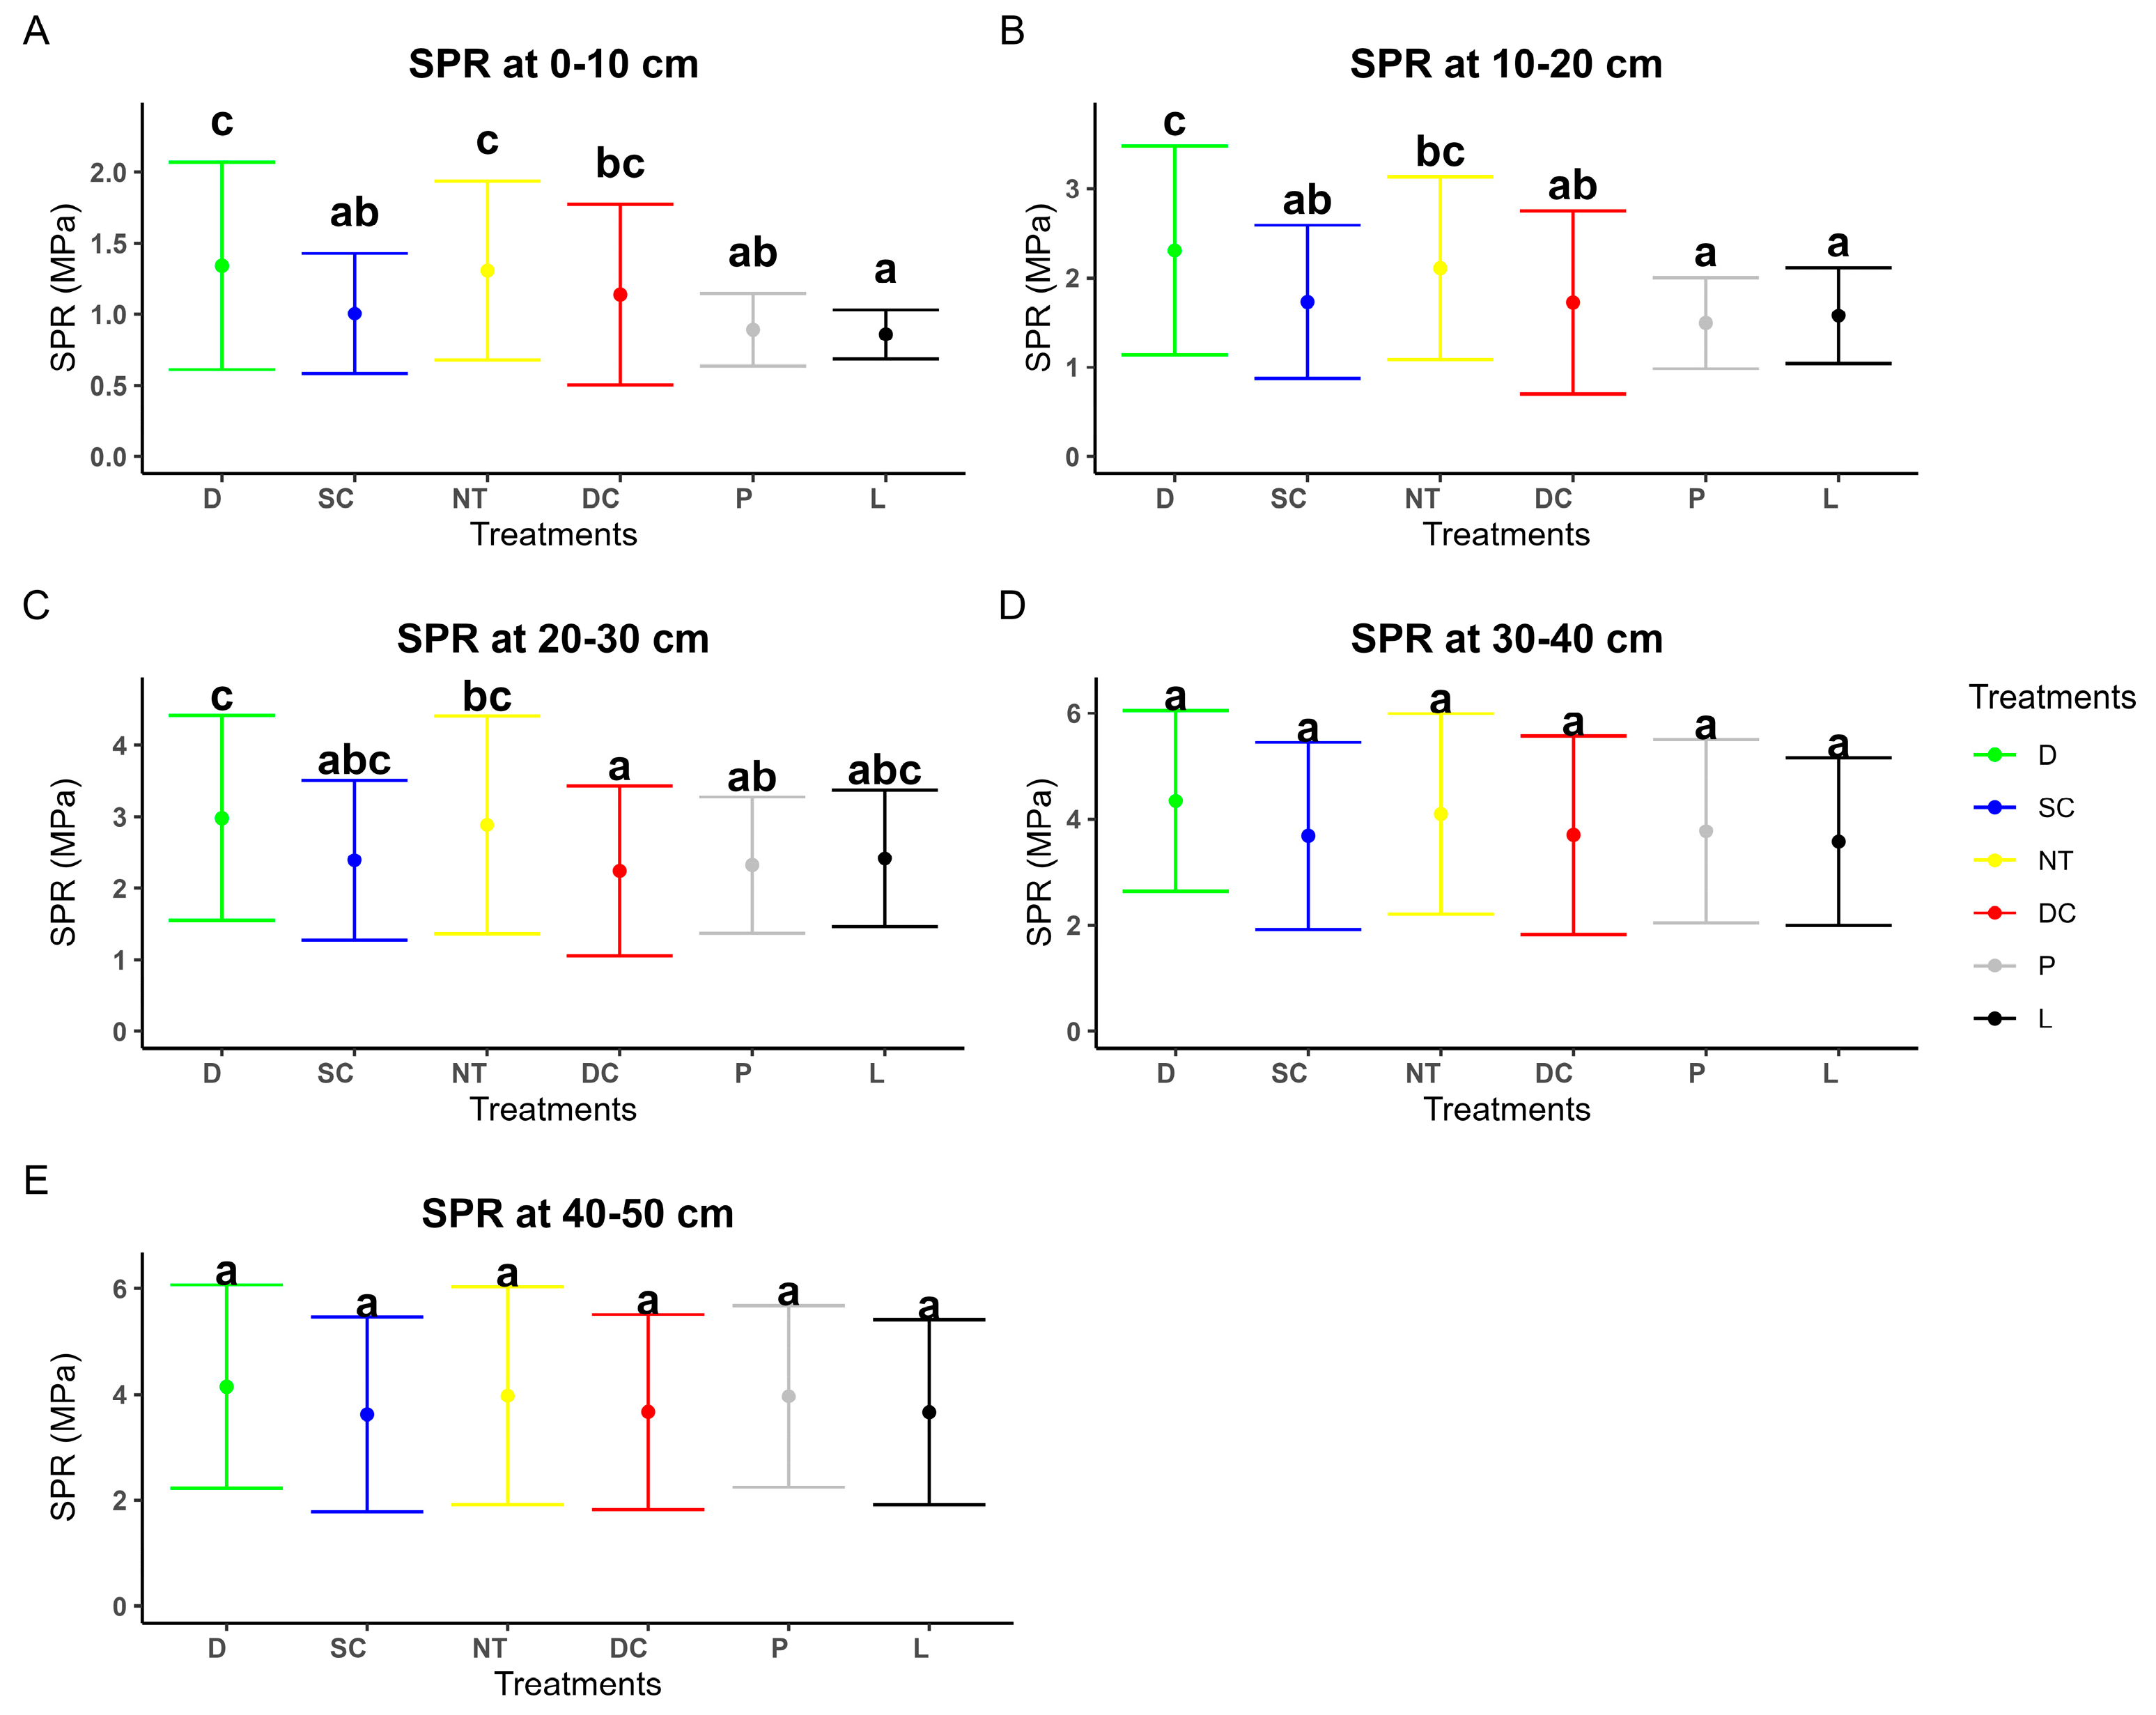
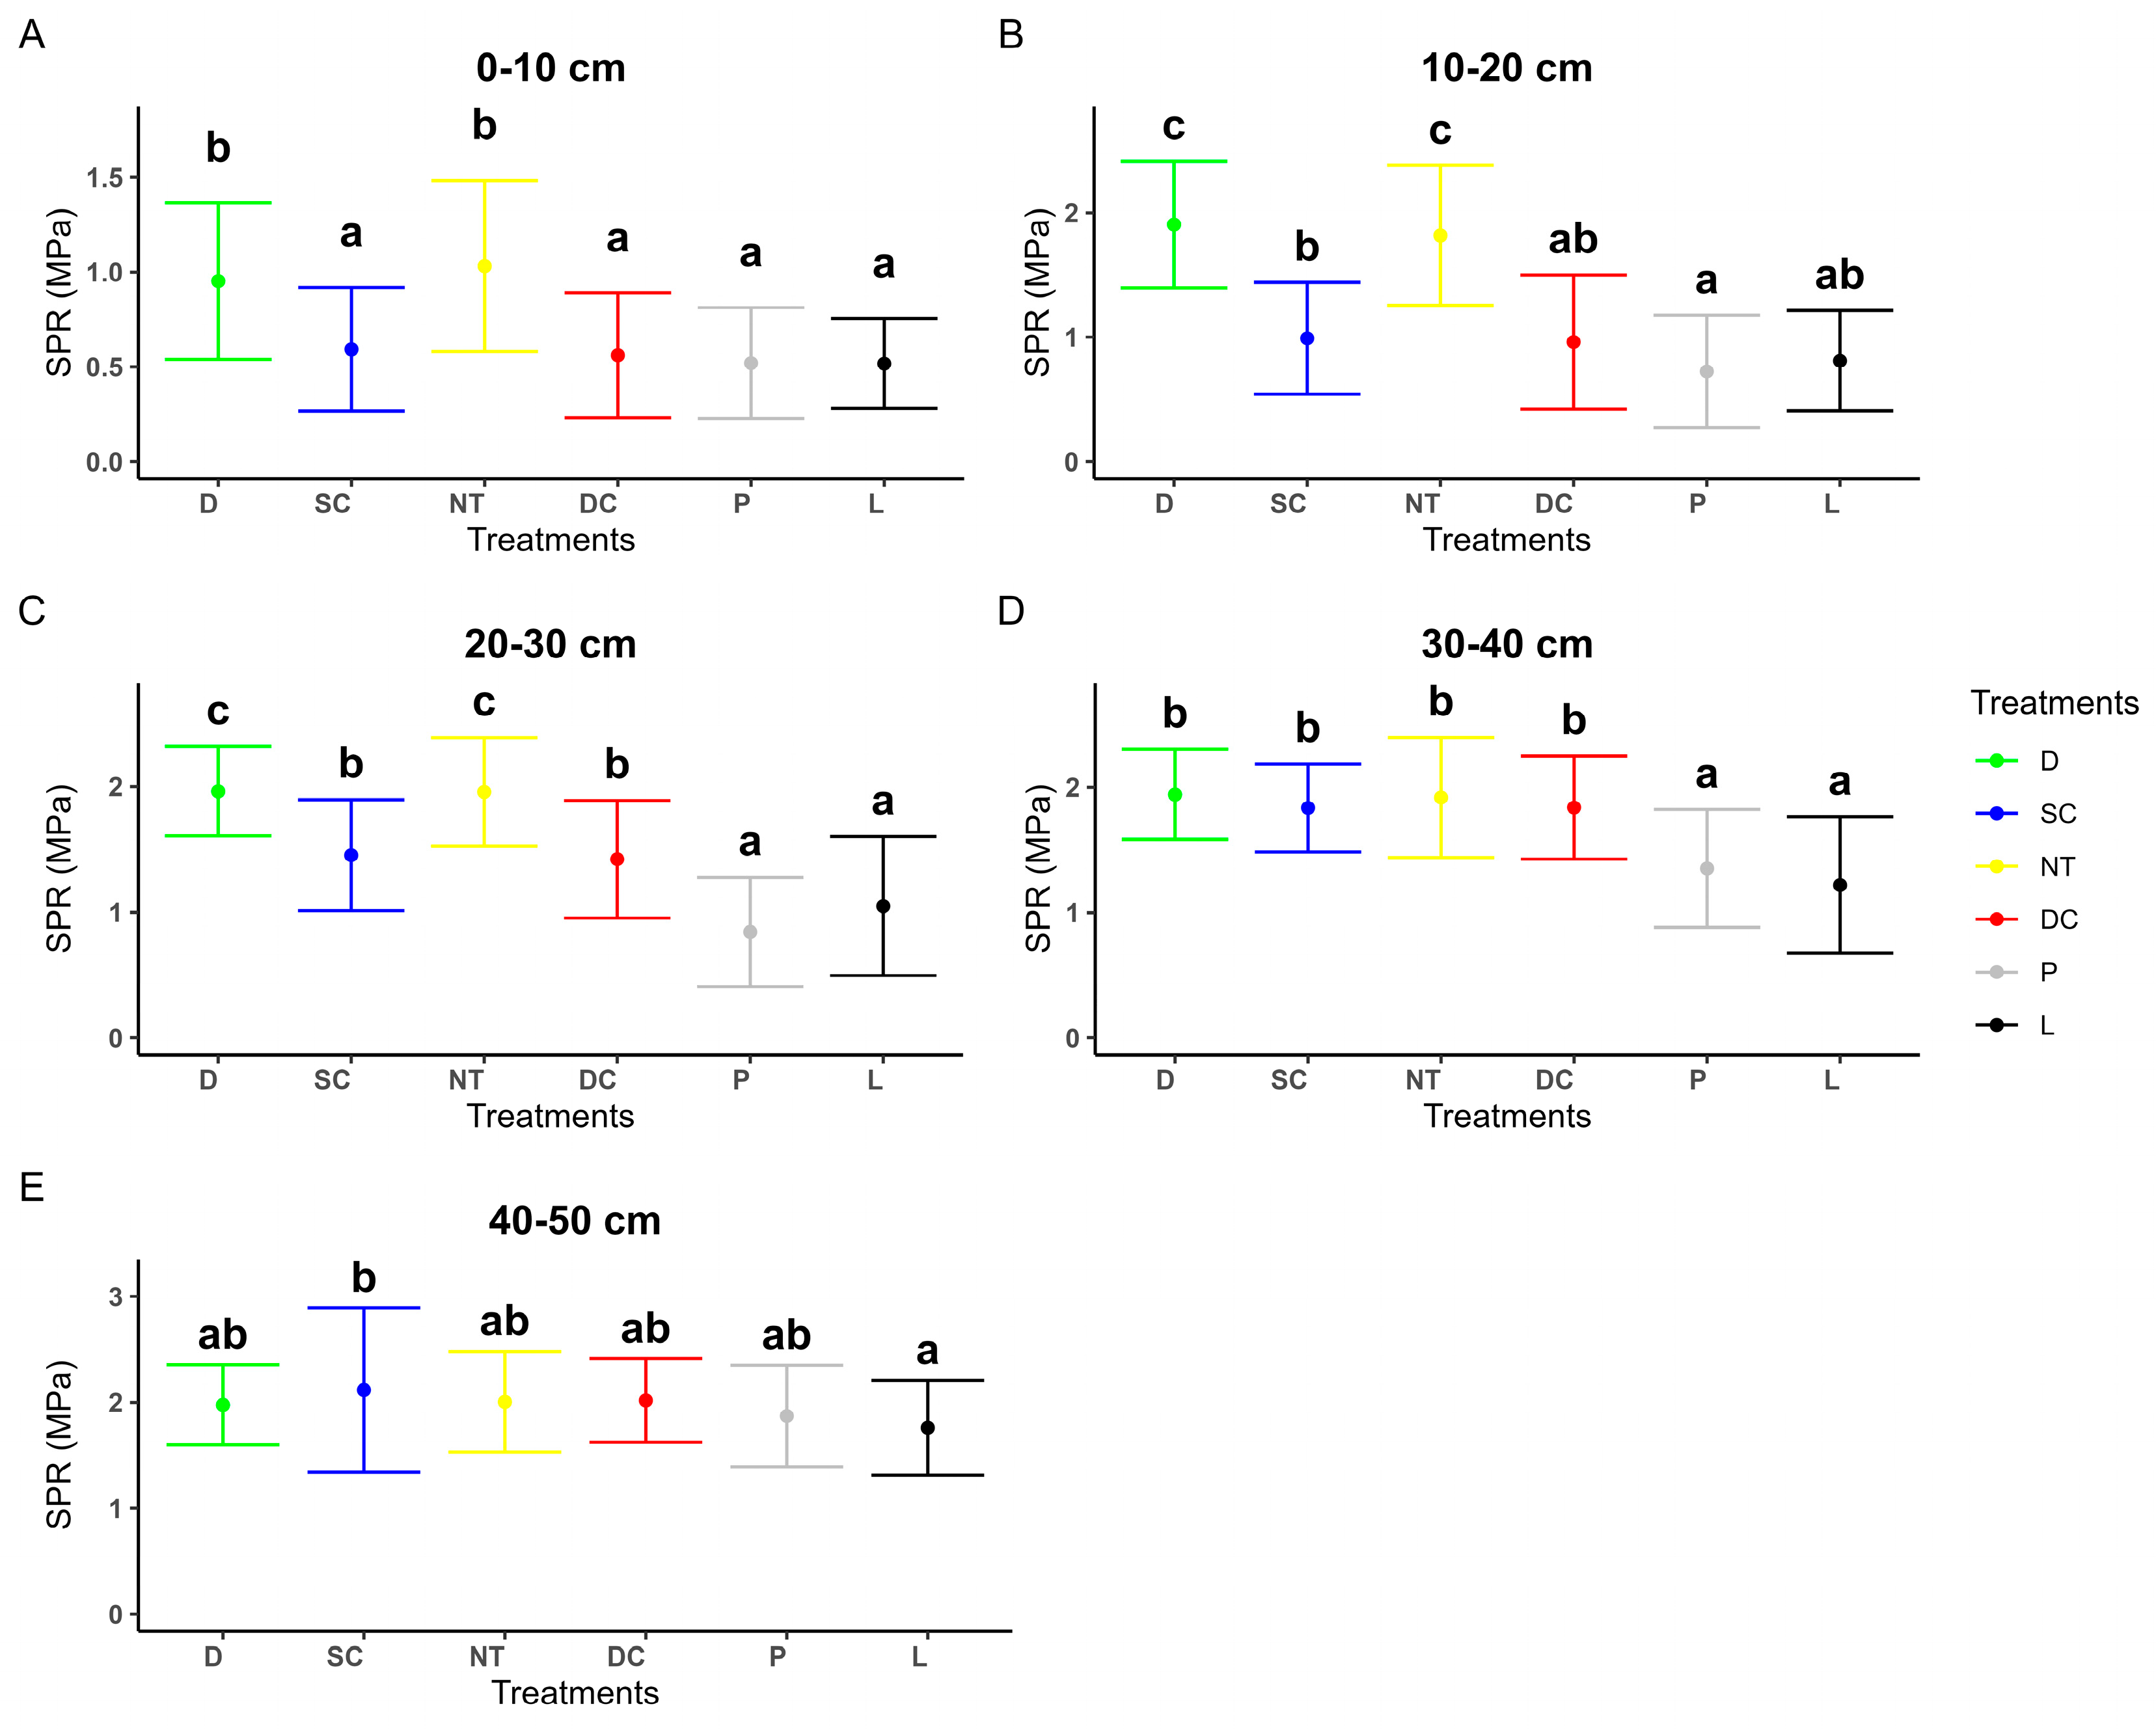
3.2. The Effect of Tillage on SPR at Various Depths

In wheat cropping season at 0–10 cm, tillage significantly increased SPR at D (55% higher) compared to L. This was followed by NT, which was 52% and 47% higher compared to L and P, respectively (Figure 3A). Furthermore, SPR at D and NT were significantly higher than in SC by 34% and 31%, respectively. At 10–20 cm, SPR increased above the 2.00 MPa mark in D and NT treatments (Figure 3B). Moreover, D was significantly higher compared to P and L by 54% and 46%, respectively, while NT was significantly greater than P and L by 41% and 34%. The SPR in DC was also significantly higher relative to D and NT (Figure 3B).
At 20–30 cm, a similar trend to the latter depth was observed, with the exception that both P and L are statistically insignificant to NT (Figure 3C). At 30–40 cm and 40–50 cm, there were no significant differences observed between tillage treatments. However, at 30–40 cm, the highest SPR among all the treatments was observed at D, while the lowest was recorded at L (Figure 3D). Similarly, at the 40–50 cm depth, the highest SPR was observed at D, and the lowest was found at SC. The SPR differences between depths showed an increasing trend with an increase in depth across all investigated tillage treatments.

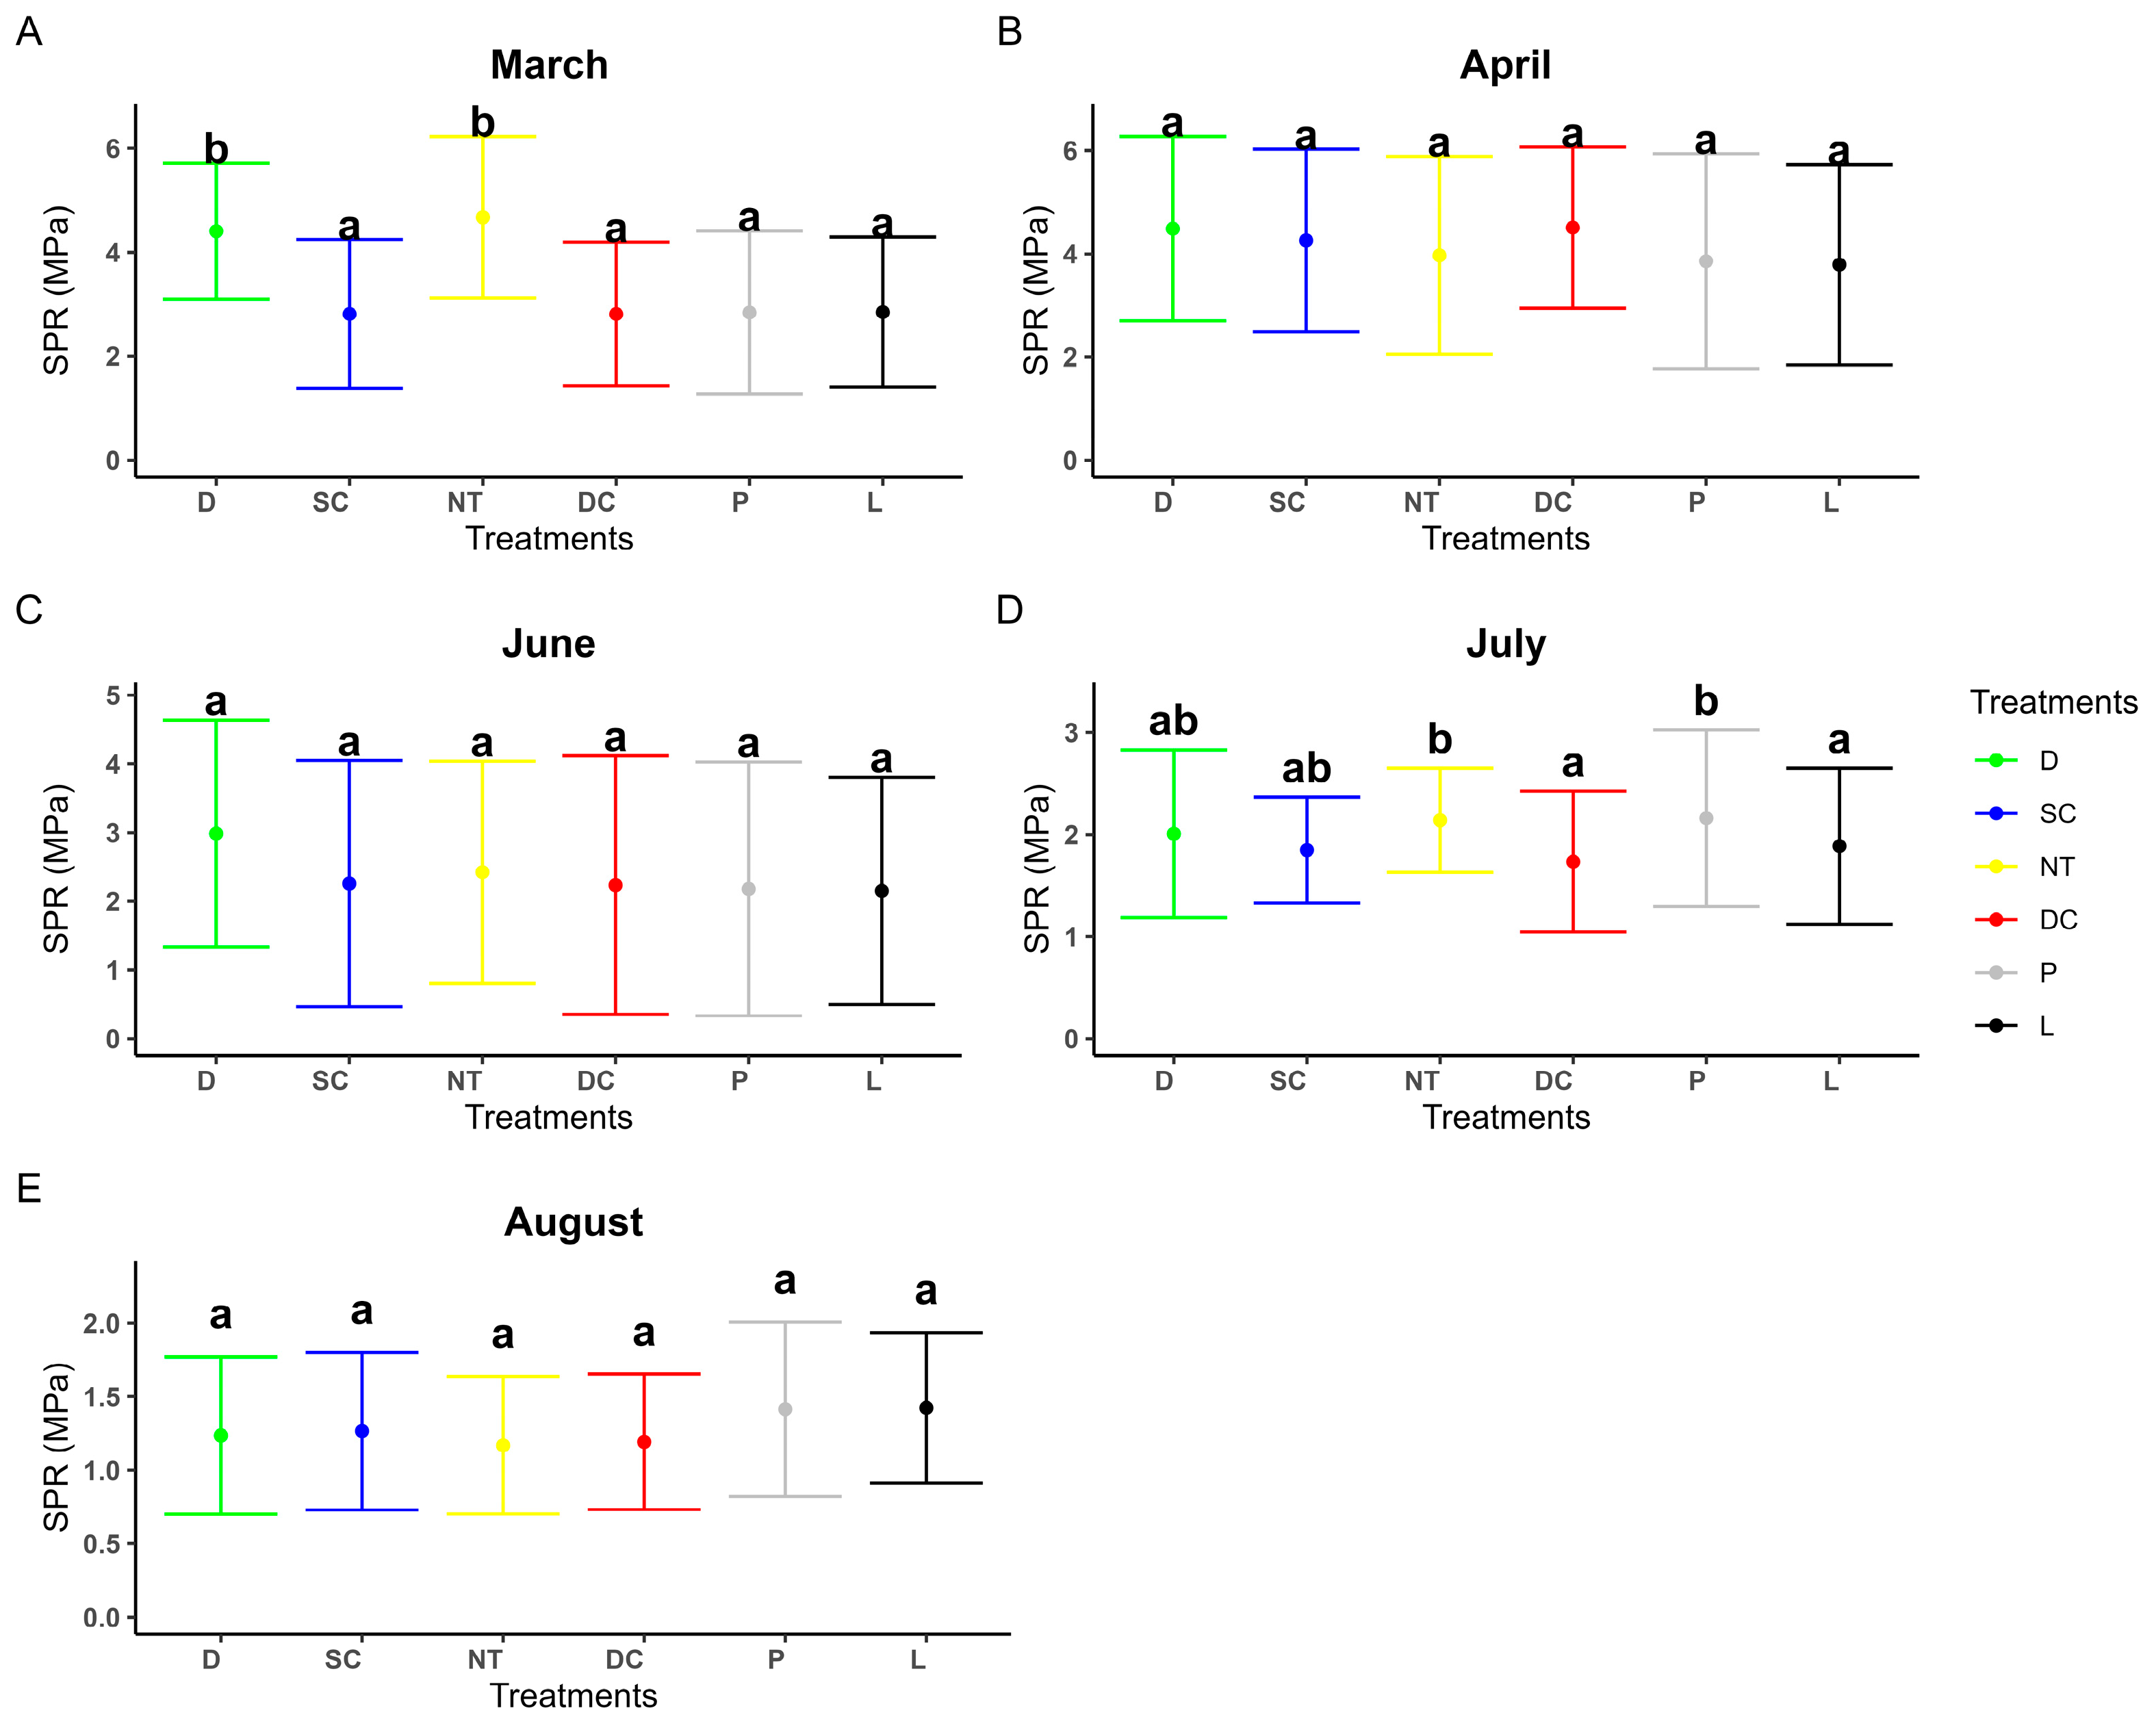
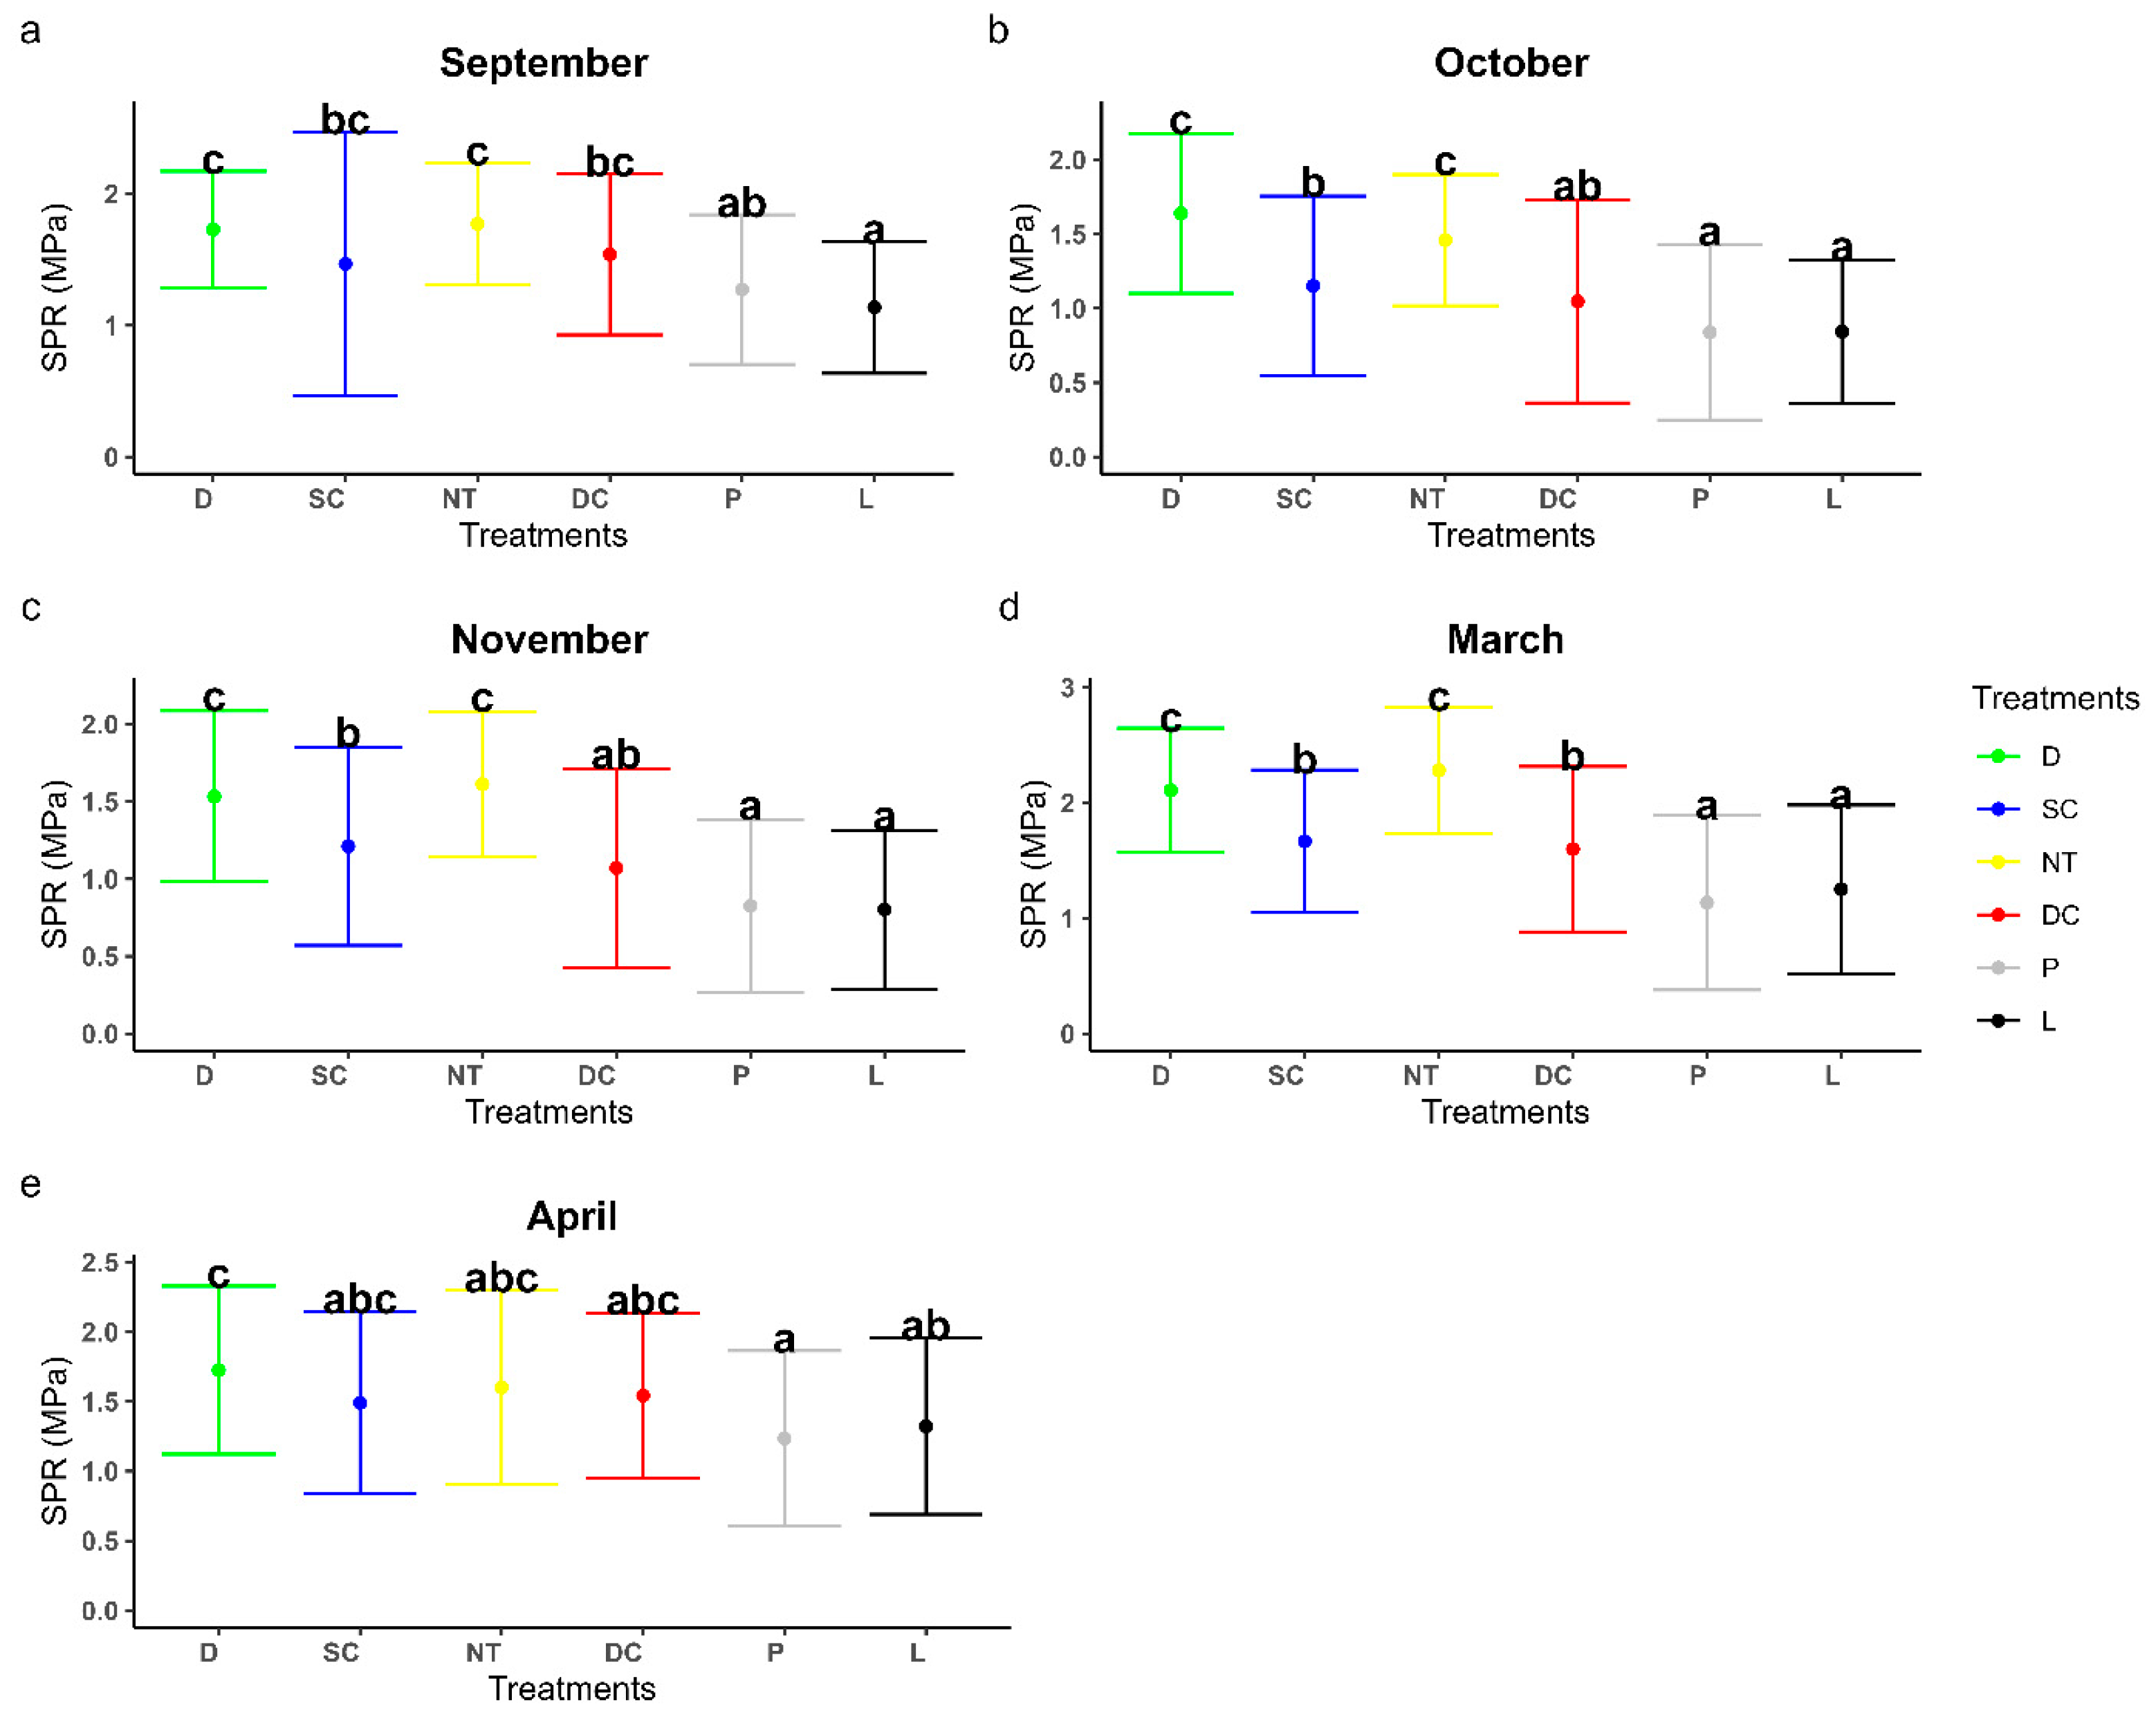
3.3. Monthly Tillage Effect on Soil Penetration Resistance During the Wheat Cropping Season

Figure 4 shows wheat SPR results as affected by treatment and sampling time. In the first measured month (March), tillage treatments significantly affected SPR (p < 0.05). Moreover, at D, SPR was significantly higher compared to SC, DC, P, and L (Figure 4A). Similar significant differences were observed at NT compared to SC, DC, P, and L. In April, June, and August 2019, there were no significant differences observed among tillage treatments. In July 2019, tillage treatments significantly affected SPR, with the greatest SPR observed at P compared to DC (Figure 4D). Differences between the monthly measured SPR revealed that SPR increased significantly with time, except for a few occasions where decreases were observed (Figure 4).

3.4. The Effect of Tillage on Soil Penetration Resistance at Various Depths During the Sunflower Cropping Period

Regarding depth, at 0–10 cm, D and NT tillage methods significantly increased the average SPR (Figure 5). The greatest mean SPR measured at NT was 98% higher compared to P and L. While SPR at D was 82% higher compared to P and L; however, compared to NT, the difference was not significant.
At 10–20 cm, SPR was significantly 163%, 134%, and 91% higher at D, L, and DC, respectively, compared to P. Due to limited soil disturbance, SPR was highest under D, followed by NT and SC, reflecting the accumulation of compacted layers over time. While tillage methods characterized by greater soil disturbance (P and L) showed lower SPR values. The nature of deep cultivation enables deeper soil loosening compared to SC however, there was a lack of significant difference observed between the two tillage methods. At 20–30 cm, the mean SPR values for D and NT were statistically similar. The average SPR values between tillage treatments showed the following trend: D = NT < SC = DC < L < P. The lowest SPR was observed at P, while the highest values were observed at both NT and D. The SPR at D and NT was 133% and 87% higher compared to P and L, respectively. At 30–40 cm, SPR was significantly greater at D (1.94 MPa) and lowest at L (1.22 MPa). The average SPR measured among treatments showed the following trend: D < NT < DC < SC < P < L. At 40–50 cm, significant differences among tillage treatments were observed between SC and L. The SPR under SC was 20% higher compared to L.
Regarding differences between depths, SPR increased with increasing depth in all treatments. Moreover, SPR exceeded 2.00 MPa at 40–50 cm at SC and DC. With respect to the sampling period, SPR in September 2019 was 55% significantly greater at NT compared to L. There were no significant differences at D, SC, and NT. However, overall, SPR values showed the following order: NT < D < SC. In October 2019, D tillage treatment increased SPR by 85%, 85%, 56%, and 43% compared to L, P, DC, and SC, respectively.

3.5. Temporal Effect of Tillage on Soil Penetration Resistance During the Sunflower Cropping Period

In November 2019, a similar trend to October was observed, with the exception that the greatest SPR was measured at NT. Furthermore, between tillage treatments SPR at NT was 5%, 33%, 50%, 94%, and 101% higher compared to D, SC, DC, P, and L. However, the difference between NT and D was not significant. Similarly, in March 2021, SPR was greatest under NT but statistically similar compared to D. Furthermore, DC significantly differed from P and L, while NT and D differed significantly from SC and DC. The overall SPR measured in March showed the following trend: D = NT < SC = DC < P = L.
In April 2021, SPR showed the following trend: D < NT < DC < SC. Notably, pronounced SPR differences were observed when D is compared to P and L. In March 2021, tillage treatment D had significantly higher SPR compared to September 2020, October 2020, and April 2021. Soil penetration resistance under SC was significantly higher in March compared to October and November being about 29% and 35%, respectively. At NT, a significantly higher SPR was measured in March 2021, followed by September 2020 and October 2020 (Figure 6). Under DC treatment, SPR values fluctuated with time, with the highest values measured in March 2021, September 2020, and April 2021, but the differences were not significant. The latter months mentioned differed significantly from October and November 2020 (Figure 6). The SPR at P was significantly 53% and 49% lower in November 2020 compared to September and April 2021. A similar trend to DC was observed at L; however, the highest SPR was observed in April 2021 (65% higher) compared to the lowest observed in November 2020. According to the 95% level of significance, the average SPR between months showed the following trend: April 2021 = March 2021 = September 2021 < October 2020 = November 2021.

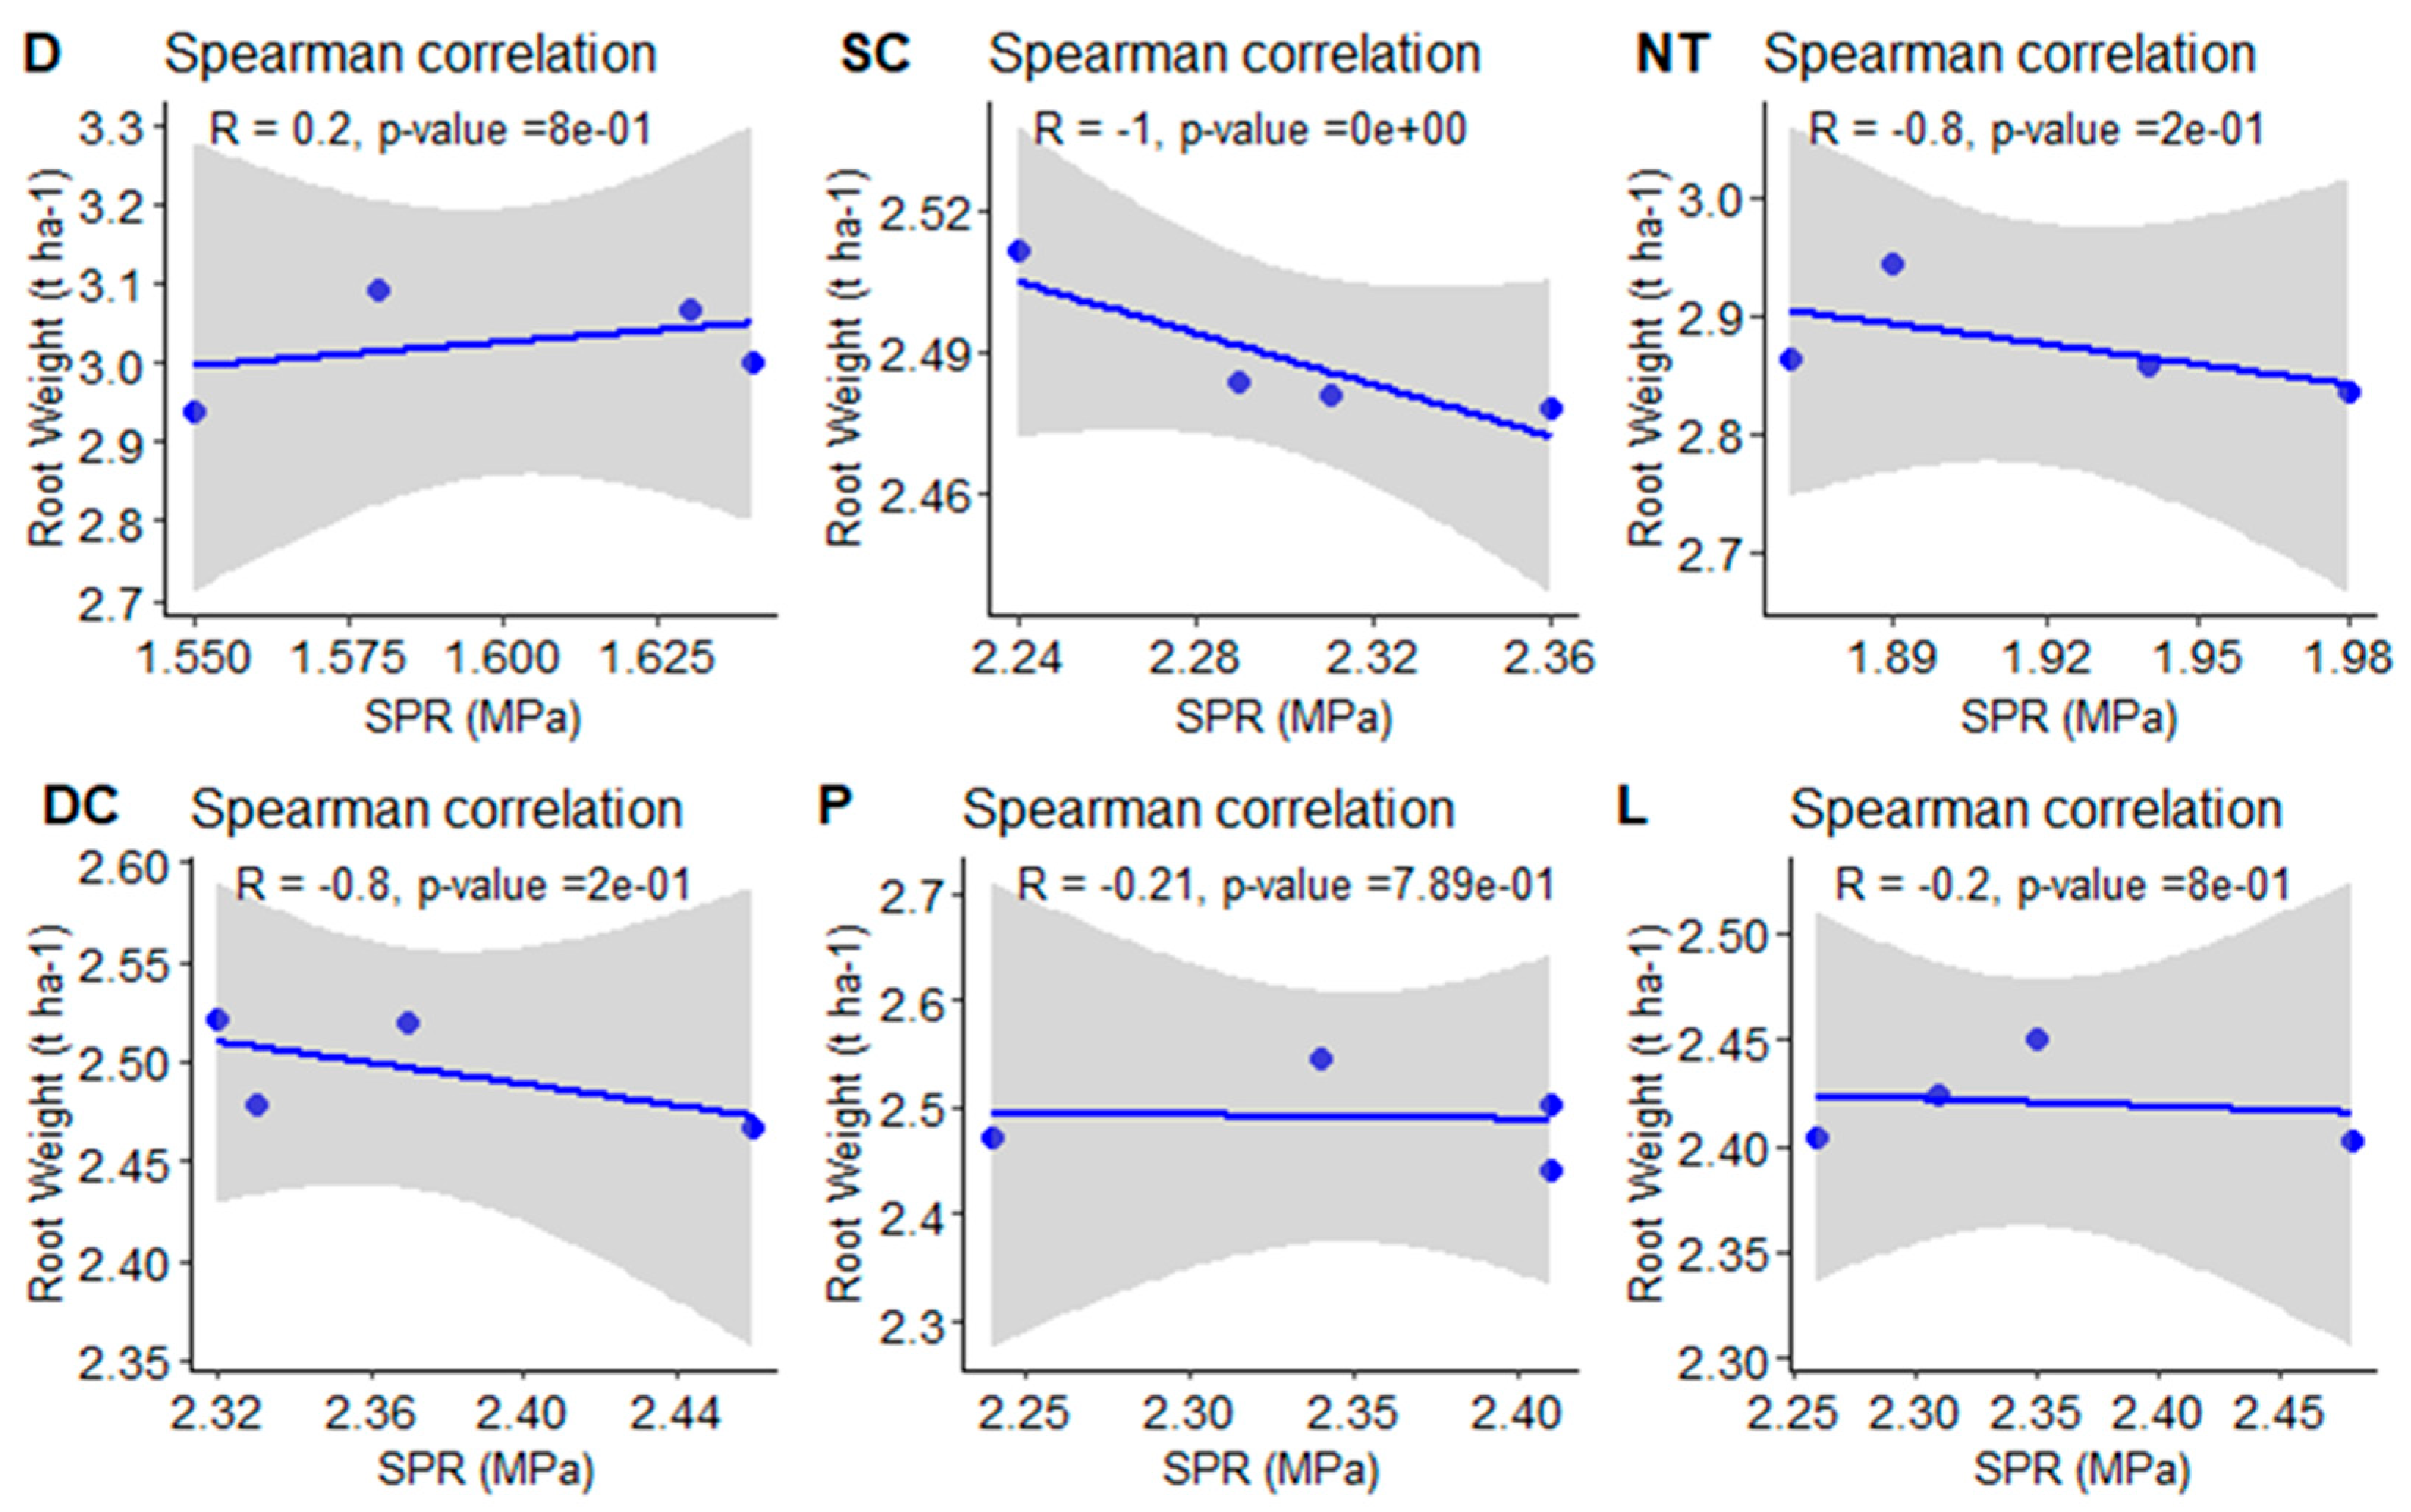
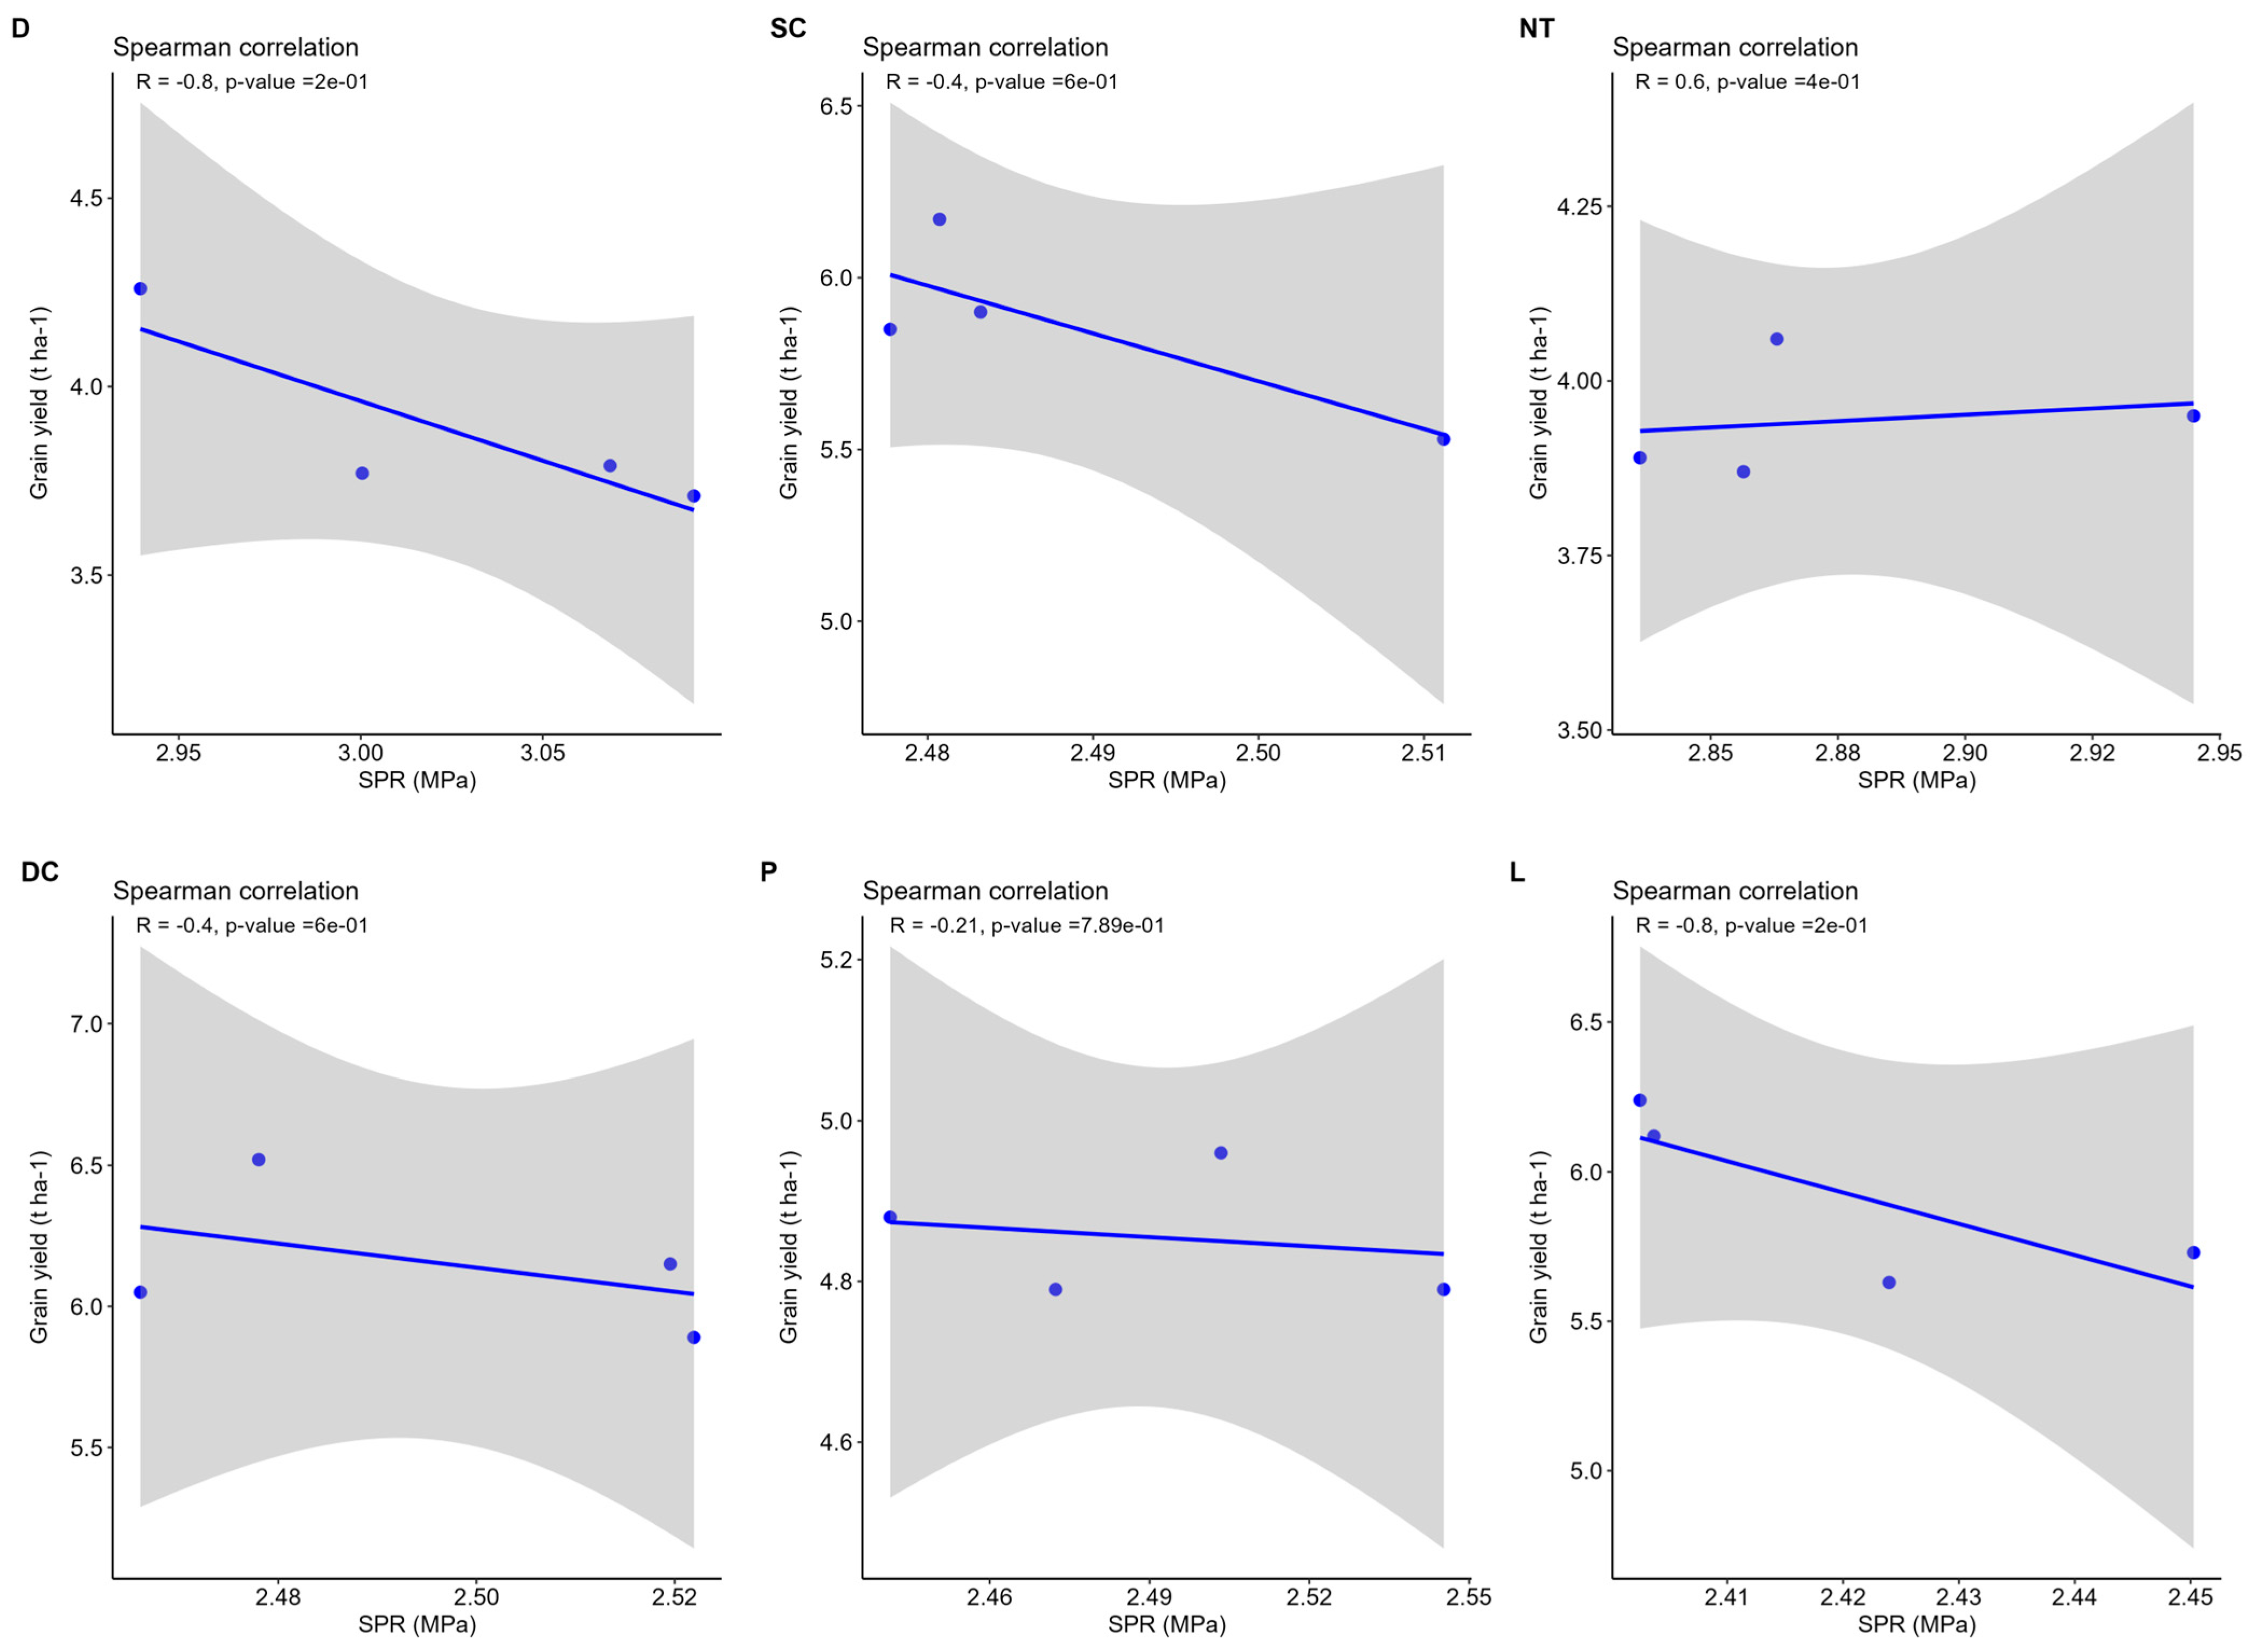
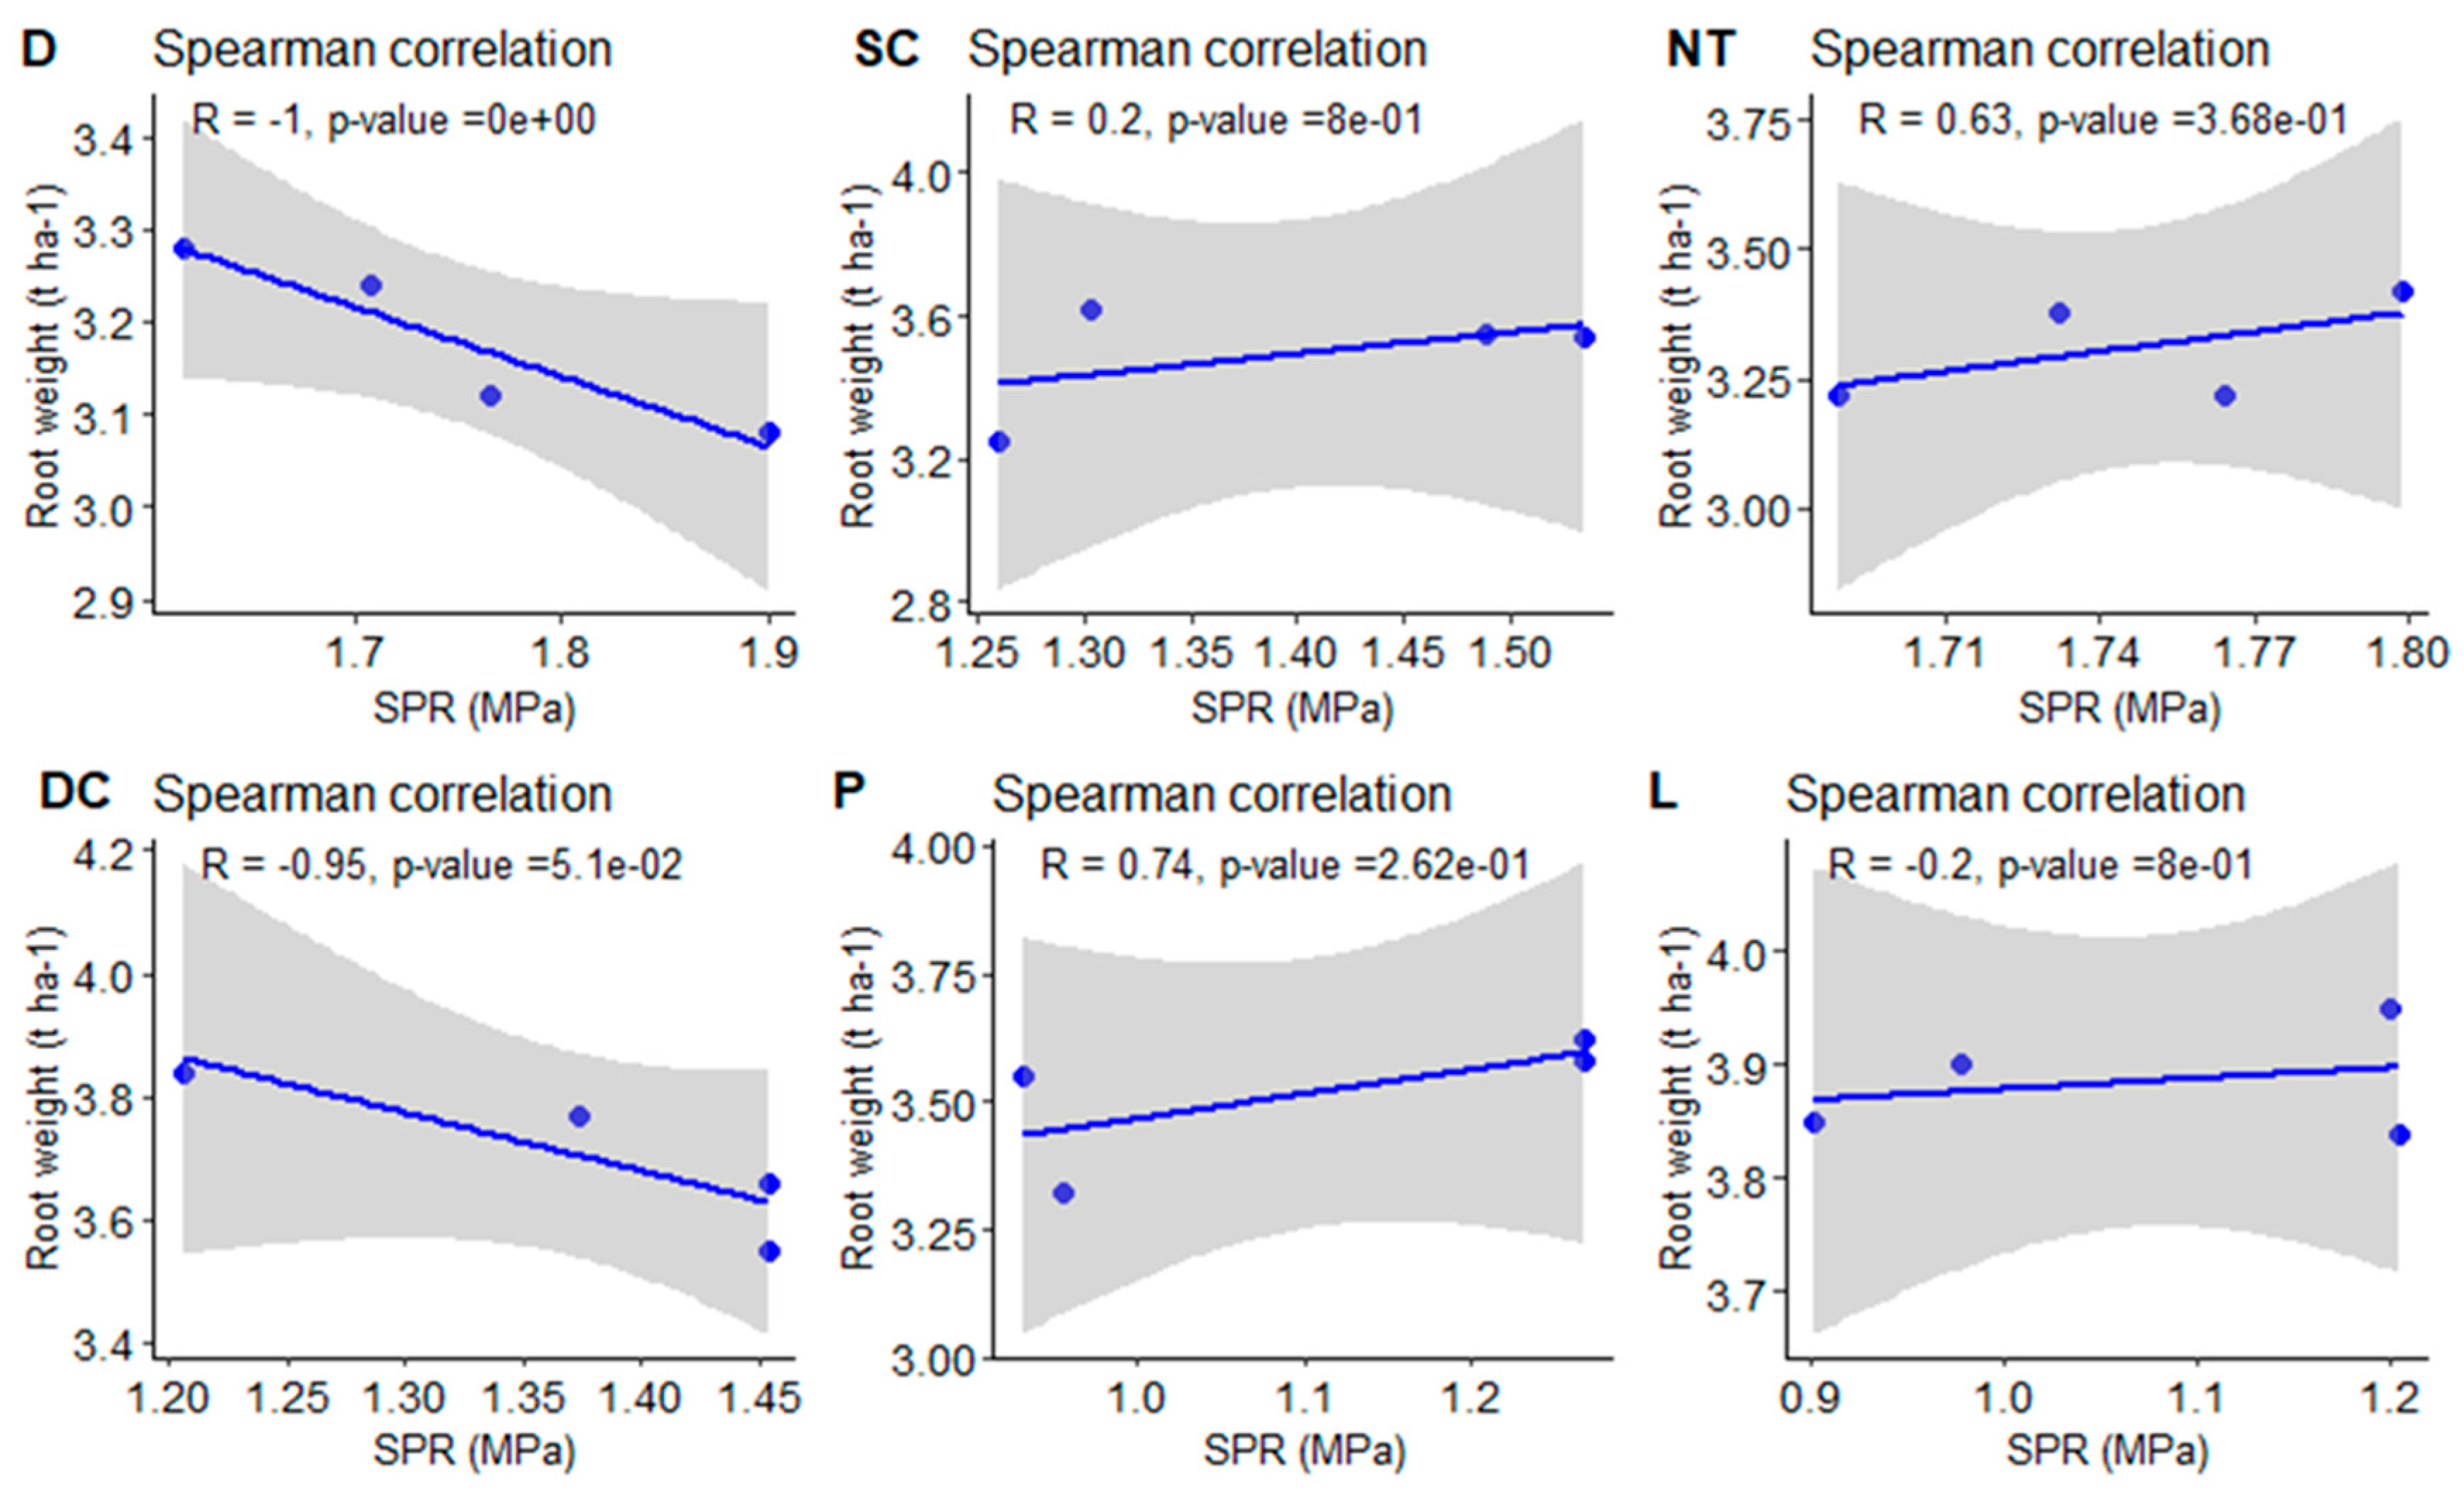
3.6. The Relationship Between Soil Penetration Resistance, Root Weight, and Yield Under Various Tillage Practices

Figure 7, Figure 8 and Figure 9 show the Spearman correlations between SPR, root weight (RW), and yield. The relationship between SPR and wheat RW revealed varied responses under different tillage treatments (Figure 7). A significant difference in the Spearman correlation was only observed at SC and D (Figure 7 and Figure 9, respectively). Another significant aspect of the relationships between the aforementioned parameters was that despite the lack of significance, some parameters did exhibit stronger relationships. Interestingly, the Spearman correlation results suggested that RW under NT increased with increasing SPR (R = 0.63 and R = 0.74, respectively), while under DC, results suggested that RW decreases with increasing SPR (R = −95) (Figure 9). The relationships between SPR and yield under wheat and sunflower cropping seasons showed negative relationships in multiple tillage treatments (D, SC, DC, P, and L) (Figure 8 and Figure 10). Under D and L, strong negative relationships were observed.

4. Discussion

Tillage practices significantly impact soil properties affecting physical, chemical, and biological functions crucial for plant growth, water storage, and material passage [17]. Our hypothesis was partially supported, as NT and D resulted in significantly higher SPR values, limiting root penetration. However, deep tillage methods (L and P) were more effective in alleviating soil compaction. Our findings indicated that after 16 years of tillage, a significant SPR increase was observed under D and NT, particularly at 10–20 cm, during both wheat and sunflower cropping seasons. The highest SPR was observed in D, while L and P significantly reduced SPR.
The higher SPR observed in annually disked plots can be attributed to several factors. Disking, a shallow tillage operation (12–16 cm in our case) can lead to tillage-induced soil compaction below the disked layer due to repeated operations at the same depth. The compressive force exerted by heavy disking implements compresses soil particles and reduces pore space. Additionally, SPR is influenced by soil moisture content (SMC), decreasing as SMC increases [18]. Soil organic matter (SOM) enhances water-holding capacity and improves soil structure. Mechanized soils often have thinner topsoil with low SOM, which results in reduced water-holding capacity, increased nitrate loss, and soil densification [19].
Throughout the wheat cropping season, higher SPR values were observed in D and NT treatments at all depths. These findings align with Dekemati et al. [20], who reported higher SPR under NT and D tillage treatments at 10 and 20 cm depths. Similarly, Bogunovic et al. [21] found greater compaction in NT and shallow tillage systems compared to traditional tillage. Birkás et al. [22] observed a disk-pan formation after three years, with critical SPR values of 3.75 MPa after five years and 4.6 MPa between years 7–10.
The high SPR under D can be explained by the disruption of soil aggregates, decreasing the weighted mean ped diameter and adversely affecting soil stability [23]. This process leads to the formation of dust that seals soil pores during water percolation, gradually forming a pan layer as the practice is repeated. The effect is exacerbated when tillage coincides with higher rainfall. Furthermore, the aforementioned impacts were manifested on crop yields and RW, as reported by Modiba et al. [15]. In their companion study, the authors observed reduced wheat yield and root weight under NT and D compared to L. Research shows that plant species with vigorous root systems, such as peas, lupin, and safflower, exhibit improved growth potential in compacted soil environments. Meanwhile, crops like wheat, barley, and ryegrass, which have finer root structures, struggle to thrive under dense soil conditions [24]. However, it is important to highlight that since RW was measured at harvest, it could slightly affect the results as root growth declines after flowering [25]. In the sunflower cropping season, the lack of soil disturbance was evident at 0–10 cm when comparing treatments. The higher density observed at 0–10 cm under NT can be attributed to farm machinery traffic, consistent with findings from various authors [26,27,28]. Our results align with studies conducted elsewhere, such as Malecka et al. [29], who observed significantly greater SPR under NT on Albic Luvisols at the topsoil layer. A study by De Moraes et al. [30] examined the effects of no-tillage (NT) practices on soil bulk density (BD) in Brazil. They observed that, after 11 and 24 years of NT, the top 10 cm depth of clay soil showed increased BD compared to conventional tillage methods. In agricultural settings, soil compaction is primarily caused by the use of heavy machinery. Cárceles Rodríguez et al. [31] noted that the extent of compaction is influenced by the frequency and intensity of tillage operations, as well as soil moisture conditions during these activities.
In contrast, loosening practices produced lower SPR values in most recorded soil depths. This was particularly beneficial during Hungary’s dry year in 2021, when precipitation was 20% below the long-term average. Loosening to a depth of 45 cm proved advantageous compared to other tillage methods at various soil depths. This can be supported by results from a companion study [15]. They reported higher sunflower yield under the L treatment, proving that loosening provided better growing conditions by extending the depth of root exploration, as well as improving water and nutrient storage. Furthermore, the relationship between sunflower yield and SPR showed that yield decreased with increasing SPR further highlighting the substantial effect of soil loosening on enhancing yield.
Monthly temporal SPR variations play a significant role in soil and plant processes, as evidenced throughout the study. Various studies have shown monthly temporal effects on SPR under different tillage methods [20,32]. Chemura et al. [33] emphasized the importance of noting both short- and long-term tillage effects considering anticipated more intense future weather.
The current study revealed complex relationships between SPR, SMC, and tillage practices. For instance, in March 2019, the highest SPR values (>4 MPa) were observed under NT and D, despite humid soil moisture conditions highlighting the complex interactions between tillage, compaction, and climatic factors. This suggests that below-average rainfall from January to March 2019 was inadequate to mitigate higher SPR in these treatments. Throughout the study period, various factors influenced SPR, including rainfall patterns, SMC, and temperature. For example, despite average rainfall in April 2019, a sudden SPR surge was observed across all treatments, possibly due to lower SMC and elevated temperatures increasing soil drying rates.
The study also highlighted the importance of tillage depth and frequency. Deep cultivation (22–25 cm) did not provide an adequate loosened depth compared to loosening between 40 and 45 cm. This suggests that for extended loosened depth, tillage methods such as plowing or loosening are preferable, as they guarantee deeper loosened depth and alleviation of compaction layers.
In both wheat and sunflower cropping seasons, SPR increased with depth, with higher values observed in deeper soil layers. The effect of soil-disturbing tillage was more pronounced on SPR between 0–10 and 10–20 cm. Interestingly, a positive relationship between SPR and RW was observed, suggesting that increased SPR enhanced root biomass. This is consistent with studies elsewhere. Tracy et al. [34] reported increasing RW with increasing BD on a clay loam soil ten days after tomato (Solanum lycopersicum L.) transplanting. However, Hernandez-Ramirez et al. [35] reported no significant differences in root mass between heavily compacted and loosened soil treatments. Additionally, a positive correlation between sunflower yield and SPR supported the notion that SPR does not consistently result in declining crop yields.
The correlation analysis between SPR, RW, and yield in wheat under various tillage treatments revealed complex relationships. The impact of soil compaction on root growth varied across tillage practices, aligning with previous studies reporting tillage-dependent effects on root development and soil physical properties [36,37]. Significant negative correlations were observed only for shallow cultivation (SC) and disking tillage (D) treatments, indicating that these practices may have a more pronounced effect on the relationship between SPR and RW. The relationships between SPR and yield under wheat and sunflower cropping seasons showed negative relationships in multiple tillage treatments (D, SC, DC, P, and L). Under D and L, strong negative relationships were observed. This suggests that under these tillage treatments for wheat crops, high SPR is an issue because disking as shallow tillage could promote the development of a compact layer below the implement’s working depth. Conversely, under loosening, there is a possibility of re-compaction to the deeper soil layers caused by other management activities carried out post-loosening. In our case, breaking and rolling were done thirteen days after loosening, and this might have enhanced compaction.

5. Conclusions

This study highlights the complex interplay between tillage on SPR and crop production. Our hypothesis was that higher SPR would be observed under NT treatments and plowing affecting crop root proliferation, while loosening would be effective in reducing SPR. Contrary to expectations, D and NT resulted in significantly higher SPR values, limiting root penetration. These findings suggest that periodic deep tillage should be considered to prevent excessive compaction under reduced tillage systems. Deep tillage practices such as L and P proved more beneficial in eradicating soil compaction. This highlighted that tillage depth may be a more significant factor than frequency, as observed in deep tillage (40–45 cm) being more effective in preventing compaction than intermediate-depth tillage methods (18–25 cm). However, it is equally important to note that, although plowing can provide a substantial depth of a loosened layer, there is a possibility of plow pan formation below the working depth of the equipment. Seasonal changes influence SPR trends with variations driven by climate and soil conditions, with notable increases during drier periods. Other studied tillage practices did not show clear impacts on SPR; however, we observed that there is no difference between SC and DC despite the difference in loosening depth (18–20 and 22–25 cm, respectively) in mitigating SPR.
To prevent crop loss due to drought in Mediterranean, arid, and semi-arid regions, the adoption of deep soil loosening or the incorporation of periodic deep tillage into reduced tillage systems (SC, D, DC, and NT) is recommended to prevent excessive compaction. Moreover, future research should explore the synergy between soil physical properties, crop physiology, and climate variability to optimize tillage strategies for sustainable agriculture.

Author Contributions

Conceptualization, M.M.M., C.M.O., I.D., M.B. and B.S.; methodology, I.D., B.S. and M.B.; software, M.M.M. and C.M.O.; validation, I.D., B.S., M.M.M. and M.B.; formal analysis, I.D., B.S., C.M.O. and M.B.; investigation, M.M.M., I.D., M.B., H.T.M.I. and B.S.; resources, B.S., I.D. and M.B.; data curation, M.M.M., I.D. and C.M.O.; writing—original draft preparation, M.M.M., B.S., H.T.M.I. and C.M.O.; writing—review and editing, C.M.O., B.S., I.D. and M.B.; visualization, M.M.M. and C.M.O.; supervision, I.D. and B.S.; project administration, I.D. and B.S. All authors have read and agreed to the published version of the manuscript.

Funding

The authors would like to declare that there was no external funding for the current study.

Data Availability Statement

The data presented in this study are available upon request from the corresponding author.

Acknowledgments

We would like to express our thanks to the Stipendium Hungaricum Scholarship for supporting our research.

Conflicts of Interest

The authors declare no conflict of interest.

References

  1. Cannell, R.Q. Reduced tillage in north-west Europe—A review. Soil Tillage Res. 1985, 5, 129–177. [Google Scholar] [CrossRef]
  2. Birkás, M.; Antal, J.; Dorogi, I. Conventional and reduced tillage in Hungary—A review. Soil Tillage Res. 1989, 13, 233–252. [Google Scholar]
  3. Bottlik, L.; Csorba, S.; Gyuricza, C.; Kende, Z.; Birkás, M. Climate challenges and solutions in soil tillage. Appl. Ecol. Environ. Res. 2014, 12, 13–23. [Google Scholar]
  4. Gallardo-Carrera, A.; Léonard, J.; Duval, Y.; Dürr, C. Effects of seedbed structure and water content at sowing on the development of soil surface crusting under rainfall. Soil Tillage Res. 2007, 95, 207–217. [Google Scholar]
  5. Jug, D.; Jug, I.; Brozovic, B.; Vukadinovic, V.; Stipeševic, B.; Đurđevic, B. The role of conservation agriculture in mitigation and adaptation to climate change. Agriculture 2018, 24, 35–44. [Google Scholar]
  6. Dekemati, I.; Simon, B.; Bogunovic, I.; Vinogradov, S.; Modiba, M.M.; Gyuricza, C.; Birkás, M. Three-year investigation of tillage management on the soil physical environment, earthworm populations and crop yields in Croatia. Agronomy 2021, 11, 825. [Google Scholar] [CrossRef]
  7. Birkás, M.; Kisić, I.; Mesić, M.; Jug, D.; Kende, Z. Climate induced soil deterioration and methods for mitigation. Agric. Conspec. Sci. 2015, 80, 17–24. [Google Scholar]
  8. Paul, B.K.; Vanlauwe, B.; Ayuke, F.; Gassner, A.; Hoogmoed, M.; Hurisso, T.T.; Koala, S.; Lelei, D.; Ndabamenye, T.; Six, J.; et al. Medium-term impact of tillage and residue management on soil aggregate stability, soil carbon and crop productivity. Agric. Ecosyst. Environ. 2013, 164, 14–22. [Google Scholar]
  9. Sithole, N.J.; Magwaza, L.S.; Thibaud, G.R. Long-term impact of no-till conservation agriculture and N-fertilizer on soil aggregate stability, infiltration and distribution of C in different size fractions. Soil Tillage Res. 2019, 190, 147–156. [Google Scholar]
  10. Nugroho, P.A.; Prettl, N.; Kotroczó, Z.; Juhos, K. The effect of molasses application on soil biological indicators and maize growth of different tillage soil: A pot experiment. J. Environ. Geogr. 2023, 16, 119–124. [Google Scholar]
  11. IUSS Working Group WRB. World Reference Base for Soil Resources 2014, Update 2015. In International Soil Classification System for Naming Soils and Creating Legends for Soil Maps; World Soil Resources Reports No. 106; FAO: Rome, Italy, 2015. [Google Scholar]
  12. Tóth, E.; Gelybó, G.; Dencső, M.; Kása, I.; Birkás, M.; Horel, Á. Soil CO2 emissions in a long-term tillage treatment experiment. In Soil Management and Climate Change; Academic Press: Cambridge, MA, USA, 2018; pp. 293–307. [Google Scholar]
  13. Ács, F.; Breuer, H.; Skarbit, N. Climate of Hungary in the twentieth century according to Feddema. Theor. Appl. Climatol. 2015, 119, 161–169. [Google Scholar] [CrossRef]
  14. New, M.; Lister, D.; Hulme, M.; Makin, I. A high-resolution data set of surface climate over global land areas. Clim. Res. 2002, 21, 1–25. [Google Scholar] [CrossRef]
  15. Modiba, M.M.; Ocansey, C.M.; Ibrahim, H.T.M.; Birkás, M.; Dekemati, I.; Simon, B. Assessing the Impact of Tillage Methods on Soil Moisture Content and Crop Yield in Hungary. Agronomy 2024, 14, 1606. [Google Scholar] [CrossRef]
  16. Dekemati, I. Compliance of Climate-Sensitive and Climate-Protective Tillage Systems on Different Soils. Ph.D. Thesis, Hungarian University of Agriculture and Life Sciences (Former Szent Istvan University), Gödöllő, Hungary, 2020. Available online: http://real-phd.mtak.hu/id/eprint/1670 (accessed on 5 February 2025).
  17. Catania, P.; Badalucco, L.; Laudicina, V.A.; Vallone, M. Effects of tilling methods on soil penetration resistance, organic carbon and water stable aggregates in a vineyard of semiarid Mediterranean environment. Environ. Earth Sci. 2018, 77, 348. [Google Scholar] [CrossRef]
  18. Celik, I.; Gunal, H.; Budak, M.; Akpinar, C. Effects of long-term organic and mineral fertilizers on bulk density and penetration resistance in semi-arid Mediterranean soil conditions. Geoderma 2010, 160, 236–243. [Google Scholar] [CrossRef]
  19. Mwiti, F.M.; Gitau, A.N.; Mbuge, D.O. Edaphic response and behavior of agricultural soils to mechanical perturbation in tillage. AgriEngineering 2022, 4, 335–355. [Google Scholar] [CrossRef]
  20. Dekemati, I.; Simon, B.; Vinogradov, S.; Birkás, M. The effects of various tillage treatments on soil physical properties, earthworm abundance and crop yield in Hungary. Soil Tillage Res. 2019, 194, 104334. [Google Scholar] [CrossRef]
  21. Bogunovic, I.; Kisic, I.; Jurisic, J. Soil compaction under different tillage system on Stagnic Luvisol. Agric. Conspec. Sci. 2014, 79, 57–63. [Google Scholar]
  22. Birkás, M.; Jolánkai, M.; Gyuricza, C.; Percze, A. Tillage effects on compaction, earthworms and other soil quality indicators in Hungary. Soil Tillage Res. 2004, 78, 185–196. [Google Scholar] [CrossRef]
  23. Madden, N.M.; Southard, R.J.; Mitchell, J.P. Soil water content and soil disaggregation by disking affects PM10 emissions. J. Environ. Qual. 2009, 38, 36–43. [Google Scholar] [CrossRef]
  24. Materechera, S.A.; Alston, A.M.; Kirby, J.M.; Dexter, A.R. Influence of root diameter on the penetration of seminal roots into a compacted subsoil. Plant Soil 1992, 144, 297–303. [Google Scholar]
  25. Guan, D.; Zhang, Y.; Al-Kaisi, M.M.; Wang, Q.; Zhang, M.; Li, Z. Tillage practices effect on root distribution and water use efficiency of winter wheat under rain-fed condition in the North China Plain. Soil Tillage Res. 2015, 146, 286–295. [Google Scholar]
  26. Ampoorter, E.; Van Nevel, L.; De Vos, B.; Hermy, M.; Verheyen, K. Assessing the effects of initial soil characteristics, machine mass and traffic intensity on forest soil compaction. For. Ecol. Manag. 2010, 260, 1664–1676. [Google Scholar] [CrossRef]
  27. Cambi, M.; Grigolato, S.; Neri, F.; Picchio, R.; Marchi, E. Effects of forwarder operation on soil physical characteristics: A case study in the Italian alps. Croat. J. Forest Eng. J. Theory Appl. For. Eng. 2016, 37, 233–239. [Google Scholar]
  28. Sakai, H.; Nordfjell, T.; Suadicani, K.; Talbot, B.; Bøllehuus, E. Soil compaction on forest soils from different kinds of tires and tracks and possibility of accurate estimation. Croat. J. For. Eng. J. Theory Appl. For. Eng. 2008, 29, 15–27. [Google Scholar]
  29. Małecka, I.; Blecharczyk, A.; Sawinska, Z.; Dobrzeniecki, T. The effect of various long-term tillage systems on soil properties and spring barley yield. Turk. J. Agric. For. 2012, 36, 217–226. [Google Scholar]
  30. De Moraes, M.T.; Debiasi, H.; Carlesso, R.; Franchini, J.C.; da Silva, V.R.; da Luz, F.B. Soil physical quality on tillage and cropping systems after two decades in the subtropical region of Brazil. Soil Tillage Res. 2016, 155, 351–362. [Google Scholar]
  31. Cárceles Rodríguez, B.; Durán-Zuazo, V.H.; Soriano Rodríguez, M.; García-Tejero, I.F.; Gálvez Ruiz, B.; Cuadros Tavira, S. Conservation agriculture as a sustainable system for soil health: A review. Soil Syst. 2022, 6, 87. [Google Scholar] [CrossRef]
  32. Bogunović, I.; Kovács, P.G.; Dekemati, I.; Kisić, I.; Balla, I.; Birkás, M. Long-term effect of soil conservation tillage on soil water content, penetration resistance, crumb ratio and crusted area. Plant Soil Environ. 2019, 65, 442–448. [Google Scholar]
  33. Chemura, A.; Nangombe, S.S.; Gleixner, S.; Chinyoka, S.; Gornott, C. Changes in climate extremes and their effect on maize (Zea mays L.) suitability over Southern Africa. Front. Clim. 2022, 4, 890210. [Google Scholar]
  34. Tracy, S.R.; Black, C.R.; Roberts, J.A.; Mooney, S.J. Exploring the interacting effect of soil texture and bulk density on root system development in tomato (Solanum lycopersicum L.). Environ. Exp. Bot. 2013, 91, 38–47. [Google Scholar]
  35. Hernandez-Ramirez, G.; Lawrence-Smith, E.J.; Sinton, S.M.; Tabley, F.; Schwen, A.; Beare, M.H.; Brown, H.E. Root responses to alterations in macroporosity and penetrability in a silt loam soil. Soil Sci. Soc. Am. J. 2014, 78, 1392–1403. [Google Scholar]
  36. Gao, W.; Whalley, W.R.; Tian, Z.; Liu, J.; Ren, T. A simple model to predict soil penetrometer resistance as a function of density, drying and depth in the field. Soil Tillage Res. 2016, 155, 190–198. [Google Scholar]
  37. Peixoto, D.S.; da Silva, L.D.C.M.; de Melo, L.B.B.; Azevedo, R.P.; Araújo, B.C.L.; de Carvalho, T.S.; Moreira, S.G.; Curi, N.; Silva, B.M. Occasional tillage in no-tillage systems: A global meta-analysis. Sci. Total Environ. 2020, 745, 140887. [Google Scholar]
Figure 1. Average monthly measured rainfall and temperature from 2018 to 2021, and multi-year (1991–2020) average monthly rainfall. The dotted lines in green, red, blue, and orange represent the average monthly temperature, and the clustered bars in similar colors show the monthly average precipitation for the 2018–2021 period. The solid black line is the long-term monthly average precipitation (1991–2020). Modified from Modiba et al. [15].
Agronomy 15 00801 g001
Figure 2. Seasonal total profile SPR for (A) wheat and (B) sunflower for the 2018/19 and 2020/21 growing seasons, respectively, under various tillage treatments. D—disking, SC—shallow cultivation, NT—no-till, DC—deep cultivation, L—loosening, P—plowing. SPR mean values with the same lowercase letter indicate no significant difference at p > 0.05. Error bars show the standard deviation of the mean.
Agronomy 15 00801 g002
Figure 3. Soil penetration resistance (SPR) variations for the 2018/19 wheat cropping season at various depths: (A) 0—10 cm, (B) 10—20 cm, (C) 20—30 cm, (D) 30—40 cm, and (E) 40—50 cm. D—disking, SC—shallow tine cultivation, NT—no-till, DC—deep tine cultivation, L—loosening, P—plowing. SPR mean values with the same lowercase letter indicate no significant difference at p > 0.05. Error bars show the standard deviation of the mean.
Agronomy 15 00801 g003
Figure 4. Plots representing monthly temporal mean SPR variations measured in 2019; wheat cropping season from March to August. (A) March, (B) April, (C) June, (D) July, and (E) August. D—disking, SC—shallow tine cultivation, NT—no-till, DC—deep tine cultivation, L—loosening, P—plowing. SPR mean values with the same lowercase letter indicate no significant difference at p > 0.05. Error bars show the standard deviation of the mean.
Agronomy 15 00801 g004
Figure 5. Average SPR at various soil depths measured in 2020/21 sunflower cropping season at different depths: (A) 0—10 cm, (B) 10—20 cm, (C) 20—30 cm, (D) 30—40 cm, and (E) 40—50 cm. D—disking, SC—shallow cultivation, NT—no-till, DC—deep cultivation, L—loosening, P—plowing. SPR mean values with the same lowercase letter indicate no significant difference at p > 0.05. Error bars show the standard deviation of the mean.
Agronomy 15 00801 g005
Figure 6. Monthly temporal average SPR variations measured in 2020/21 sunflower cropping season between September 2020 and April 2021. (a) September, (b) October, (c) November, (d) March, and (e) April. D—disking, SC—shallow cultivation, NT—no-till, DC—deep tine cultivation, L—loosening, P—plowing. SPR values with the same lowercase letter indicate no significant difference at p > 0.05. Error bars show the standard deviation of the mean.
Agronomy 15 00801 g006
Figure 7. Spearman correlation between root weight and SPR. The following letters represent tillage treatments: D—disking, SC—shallow cultivation, NT—no-tillage, DC—deep cultivation, P—plowing, L—loosening.
Agronomy 15 00801 g007
Figure 8. Spearman correlation between SPR and wheat grain yield. The following letters represent tillage treatments: D—disking, SC—shallow cultivation, NT—no-tillage, DC—deep cultivation, P—plowing, L—loosening.
Agronomy 15 00801 g008
Figure 9. Spearman correlation between SPR and sunflower root weight. The following letters represent tillage treatments: D—disking, SC—shallow cultivation, NT—no-tillage, DC—deep cultivation, P—plowing, L—loosening.
Agronomy 15 00801 g009
Figure 10. Spearman correlation between SPR and sunflower seed yield. The following letters represent tillage treatments: D—disking, SC—shallow cultivation, NT—no-tillage, DC—deep cultivation, P—plowing, L—loosening.
Agronomy 15 00801 g010
Table 1. Summary and dates of the activities done during the sunflower cropping season.
Sunflower Cropping Period Activities
ActivityDescriptionDate
SprayingWeed killer spraying10 September 2020
Tillage P, L, D, DC, and SC16 October 2020
Fertilizer application 120 kg/ha 27% “Pétisó CAN” NH4 + NO3 + dolomite31 March 2021
Weed control Weed control with Fozát 480, 6 L/ha31 March 2021
Bed making Appropriate land preparation with Metalwolf 3.8/4.2 combiner23 April 2021
Sowing56,000 mag/ha, Syngenta SY Onestar CLP Clearfield plus planted with KUHN Maxima 6 sowing machine23 April 2021
SowingAdditional sowing in the border1 June 2021
Weed control Pulsar 40SL, 1.2 L/ha + Silvet Star 0.1 L/ha1 June 2021
DesiccationDessicash20SL (active ingredient = diquat), 1.6 L/ha30 August 2021
Harvest Harvesting with a Claas Lexion 660, combine harvester with 12 lines12 September 2021
Wheat cropping period activities
Fertilizer spreadingNPK (20, 100, 60 kg/ha)10 October 2018
Foundation cultivationPlowing, cultivation with cultivators10 October 2018
CultivationLoosening, discing, plowing, and processing with a disc11 October 2018
Bed preparationBreaking and rolling24 October 2018
Sowing258 kg/ha26 October 2018
Germination and cultivationWheat emergence and shallow plowing10 November–23 December 2018
FertilizationHead fertilization11 February 2019
Weed controlWeed killer spraying9 April 2019
Disease controlFungicide spraying, spraying against seed bleaching3–4 June 2019,
HarvestingHarvesting and straw chopping 18–19 July 2019
Table 2. Tillage treatments at Józsefmajor Experimental Farm, depth of soil disturbance, and tillage equipment employed. Modified from Dekemati Igor [16].
Tillage MethodDepth of Soil DisturbanceImplement
Disking (D)12–14 cmVäderstad Carrier 500(Väderstad AB, located in Östergötland County, Sweden)
Shallow cultivation (SC)18–20 cmKverneland CLC Pro (Kverneland Group, Klepp, Norway)
No-tillage (NT)4–6 (depth of sowing)Väderstad Rapid 300C/Kuhn Maxima 6 (Väderstad AB, Väderstad, Östergötland County, Sweden)
Deep cultivation (DC)22–25 cmKverneland CLC Pro (Kuhn Group, Saverne, France)
Plowing (P)28–30 cmKverneland LM100 + packomat (Kverneland Group, Klepp, Norway)
Loosening (L)40–45 cmVogel and Noot TerraDig XS (Vogel & Noot, Hasbergen, Germany)
Disclaimer/Publisher’s Note: The statements, opinions and data contained in all publications are solely those of the individual author(s) and contributor(s) and not of MDPI and/or the editor(s). MDPI and/or the editor(s) disclaim responsibility for any injury to people or property resulting from any ideas, methods, instructions or products referred to in the content.

