Article

Agriculture Resilient at Three Irrigation Modules of Zacatecas, Mexico: Water Scarcity and Climate Variability

by
Carlos Bautista-Capetillo
1,†,
Hugo Pineda-Martínez
1,†,
Luis Alberto Flores-Chaires
1,* and
Luis Felipe Pineda-Martínez
2
1
Educational Program of Doctorado en Ciencias de la Ingeniería, Universidad Autónoma de Zacatecas “Francisco García Salinas”, Campus UAZ Siglo XXI, Carretera, Zacatecas-Guadalajara Km. 6, La Escondida, Zacatecas 98160, Mexico
2
Educational Program of Doctorado en Ciencias Sociales, Universidad Autónoma de Zacatecas “Francisco García Salinas”, Campus Universitario II, Avenida Preparatoria s/n, Fraccionamiento Progreso, Zacatecas 98065, Mexico
*
Author to whom correspondence should be addressed.
These authors contributed equally to this work.
Agronomy 2025, 15(4), 800; https://doi.org/10.3390/agronomy15040800
Submission received: 1 February 2025 / Revised: 11 March 2025 / Accepted: 14 March 2025 / Published: 24 March 2025

Abstract

:
Agriculture is the largest consumer of freshwater resources, accounting for approximately 70% of total water withdrawals. In semi-arid regions like Zacatecas, Mexico, water scarcity and climate variability pose critical challenges to small-scale farmers. This study evaluates the effectiveness of integrating modern irrigation technologies with traditional water management practices to enhance agricultural resilience. Analysis of climatic data (1961–2020) revealed a statistically significant increase in annual precipitation of 2.01 mm year−1 in the Leobardo Reynoso module (p < 0.05), while the Miguel Alemán module exhibited a decline ranging from −0.54 mm year−1 to −2.22 mm year−1, exacerbating water scarcity. Pressurized irrigation systems in Leobardo Reynoso improved application efficiency to 87.5%, compared to 50% in traditional furrow irrigation. Despite these advancements, conveyance efficiency remains low (60%) due to extensive open canal networks. Climate projections indicate a 6–11% increase in irrigation water demand for staple crops by 2065, driven by rising evapotranspiration rates. Findings underscore the need for policy interventions, infrastructure upgrades, and financial support to sustain agricultural productivity in water-stressed environments.

1. Introduction

Small-scale agriculture underpins global food security, particularly in developing countries where it accounts for over 80% of food production [1]. It sustains rural livelihoods, contributes significantly to local economies, and plays a vital role in managing natural resources [2]. However, water scarcity and climate variability threaten the sustainability of these systems, challenging their ability to alleviate rural poverty [3,4]. Water scarcity, currently affecting 40% of the global population, poses a substantial obstacle to agricultural productivity, especially in water-stressed regions [5]. This challenge is compounded by disrupted rainfall patterns and the increased frequency of extreme weather events [6], which intensify global temperature rises, amplify growing season unpredictability, and raise the risk of crop failures [7]. Smallholder farmers, who rely heavily on rain-fed agriculture, are particularly vulnerable due to limited access to alternative water sources, irrigation infrastructure, and financial resources for implementing adaptive measures [8]. Without effective water management strategies, small-scale agriculture faces declining productivity, heightened vulnerability, and increased risks of food insecurity [9].
Irrigation has long been recognized as a critical adaptation strategy to mitigate the impacts of water scarcity and climate variability. By providing a reliable water supply, irrigation systems stabilize yields, improve water productivity, and reduce smallholder farmers’ dependence on erratic rainfall [10]. However, despite its potential, access to advanced irrigation technologies remains limited for many small-scale farmers due to economic, technical, and social barriers [11]. Additionally, existing irrigation systems often suffer from inefficiencies, with significant water losses through evaporation, runoff, or poor design [12,13]. Enhancing water-use efficiency and adopting innovative irrigation methods are urgently needed to achieve sustainable water use in agriculture.
Traditional water management practices, often low-cost and environmentally sustainable, remain underutilized in modern frameworks. Techniques such as terracing, mulching, infiltration ditches, rainwater harvesting, and crop pattern rotation show promise for enhancing soil moisture retention and optimizing water use in smallholder systems [2,14]. Derived from local knowledge, these practices offer cost-effective solutions for smallholder farmers lacking access to expensive irrigation systems. Integrating modern irrigation technologies with traditional practices may provide the most effective solution for building resilience in water-scarce and climate-vulnerable regions [7]. Community-based water management initiatives, such as shared irrigation schemes and water user associations, have demonstrated potential in improving equitable access to water resources and fostering collective action for water conservation [15].
Despite growing research on irrigation and water management strategies, significant gaps remain in understanding how these solutions can be tailored to the unique needs of smallholder farmers. Most government policies focus on large-scale irrigation systems and fail to adequately address socio-economic and cultural constraints influencing adoption at the small-scale level [16]. Furthermore, limited empirical evidence exists regarding the long-term impacts of combining modern and traditional irrigation practices on agricultural resilience, particularly in regions experiencing acute water stress. For instance, while drip irrigation systems improve water-use efficiency, their high initial costs and maintenance requirements often deter adoption by resource-constrained smallholders [17]. The integration of traditional and modern practices remains poorly explored, leaving opportunities for synergies largely underutilized. These knowledge gaps hinder the development of targeted policies and practices that could promote the widespread adoption of effective water management solutions for small-scale agriculture.
This study analyzes specific water management strategies for irrigation in small-scale agricultural systems of Zacatecas, Mexico. It focuses on three regions affected by water scarcity and climate variability. The research evaluates pressurized irrigation methods’ advantages in terms of rational water use, as well as their capacity to face the complexity of challenges that arise to meet crop water needs in an environment of increasing climatic variability, and how, from a holistic context, technology limitations can be remedied to prolong the productive life of irrigation modules, contributing to agricultural resilience and the viability of small farmers to stay cropping their plots.

2. Materials and Methods
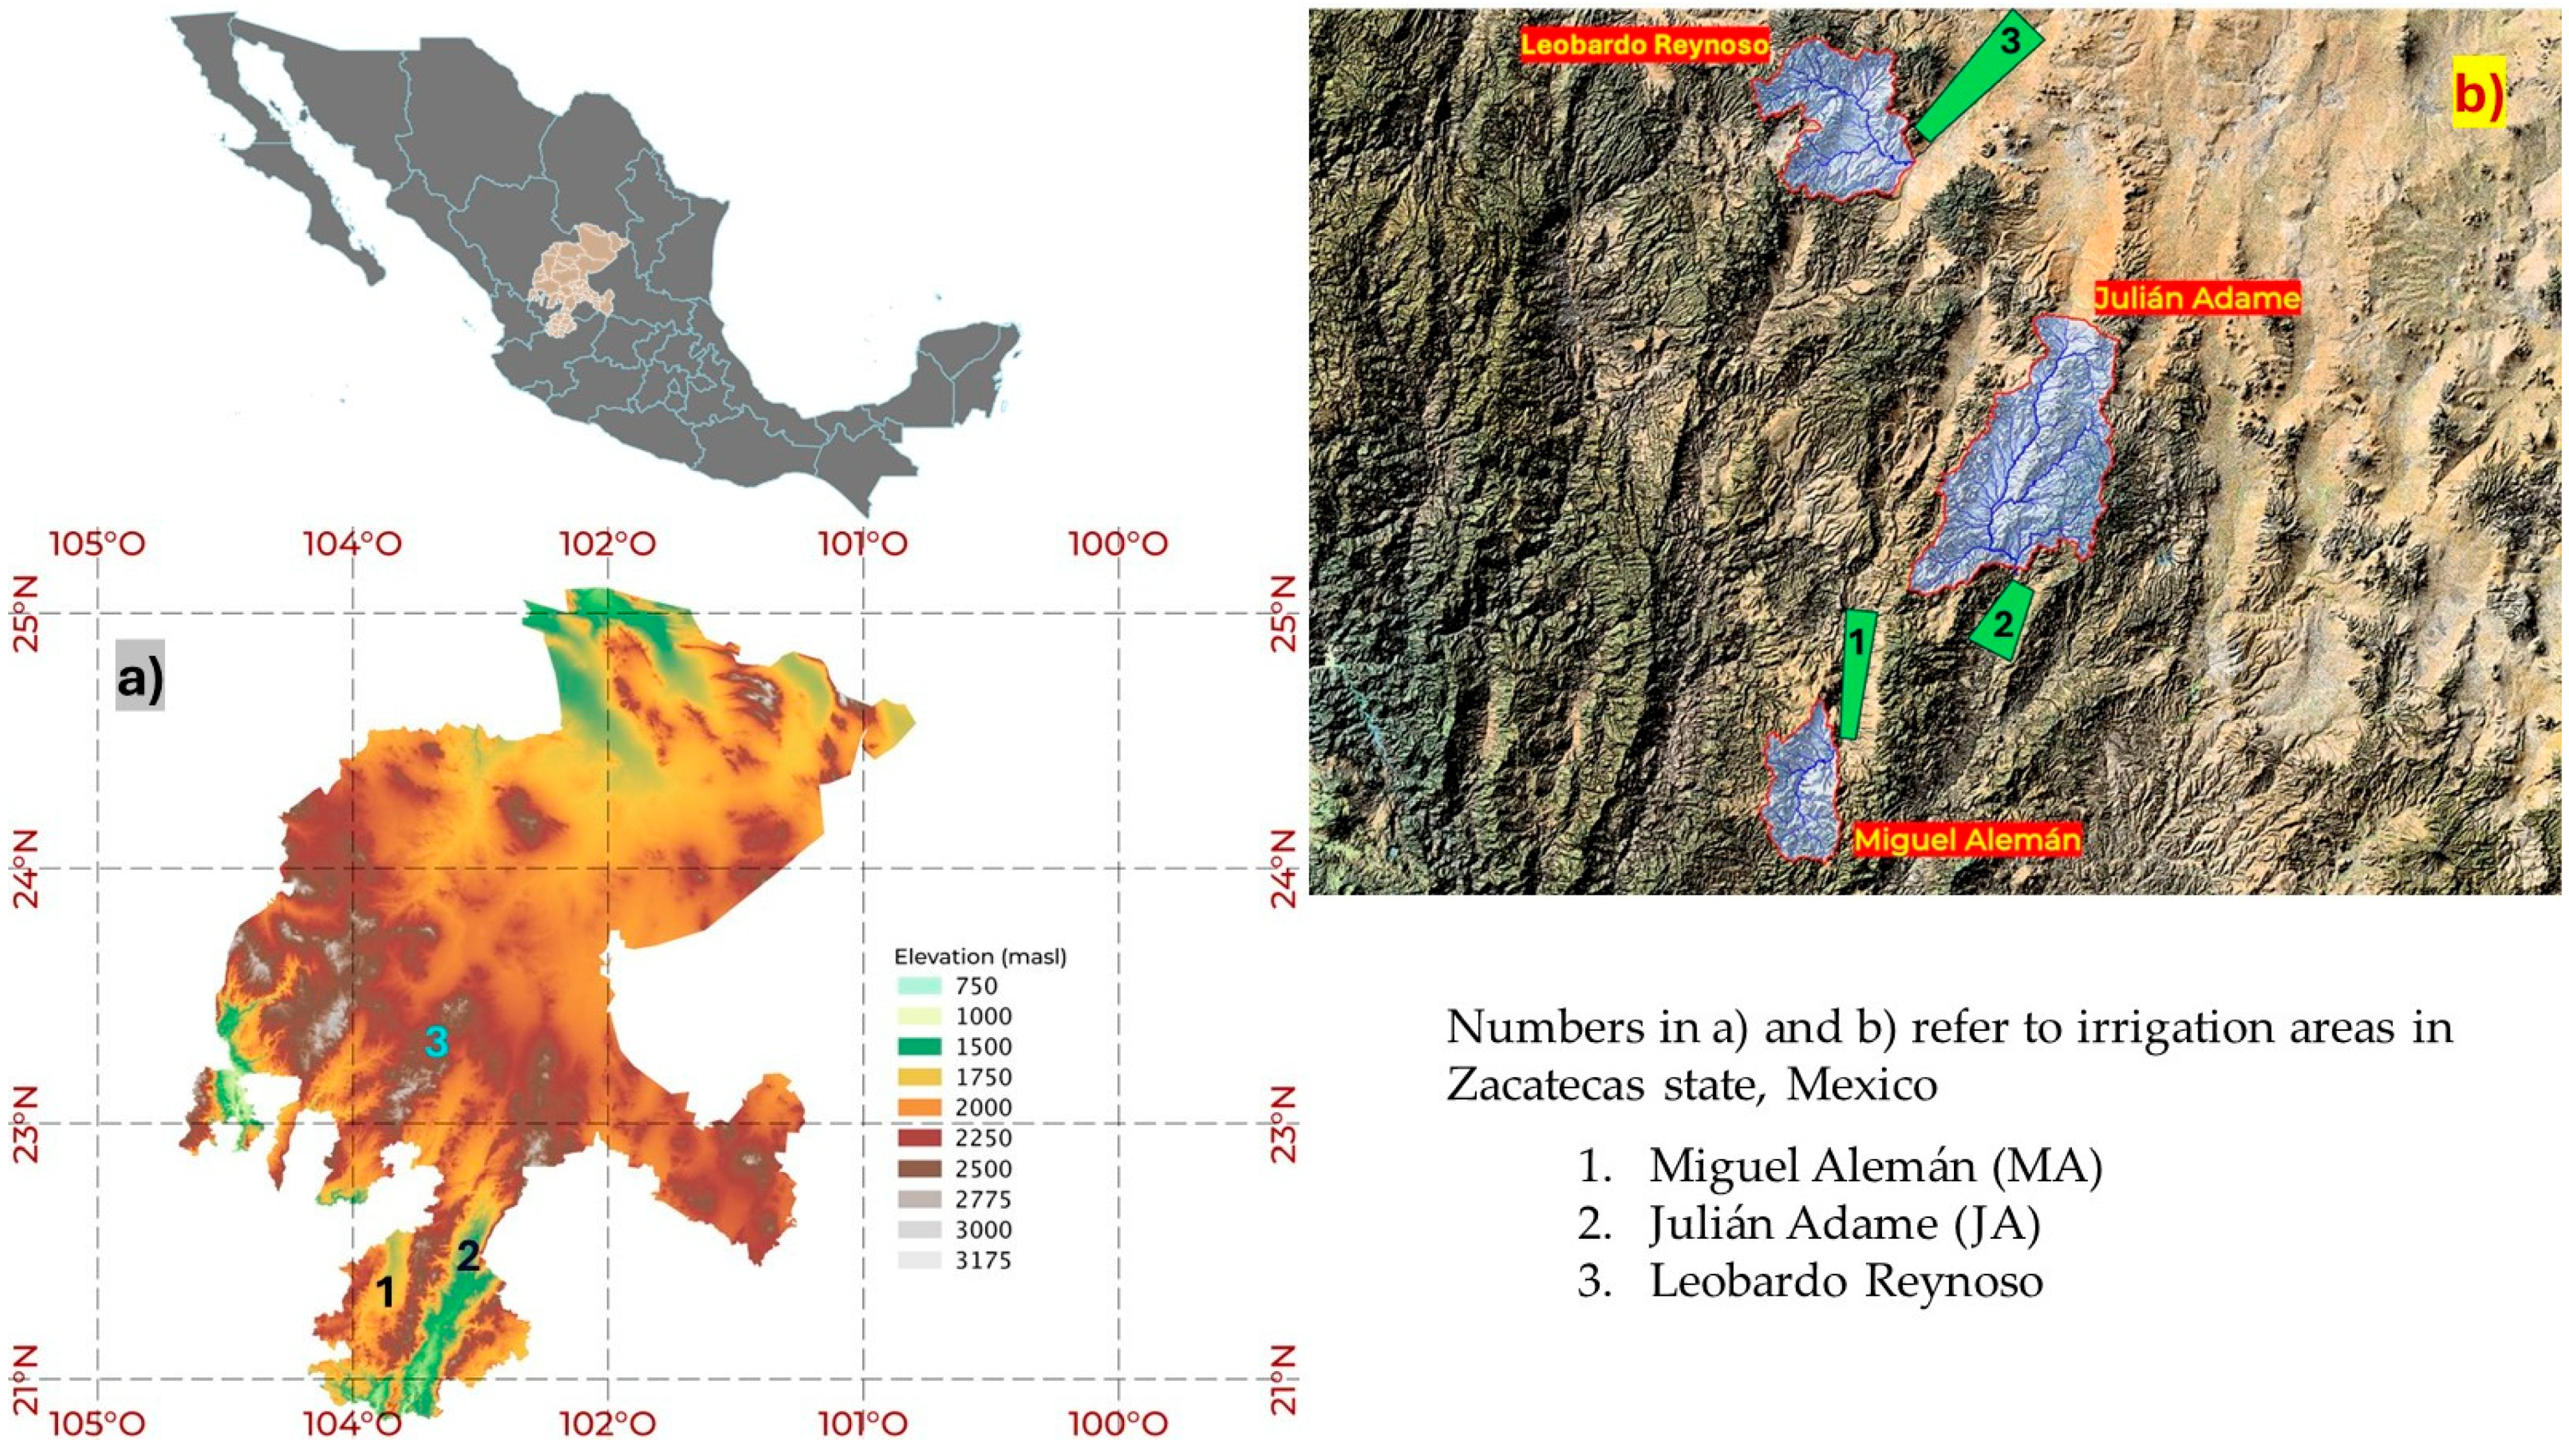
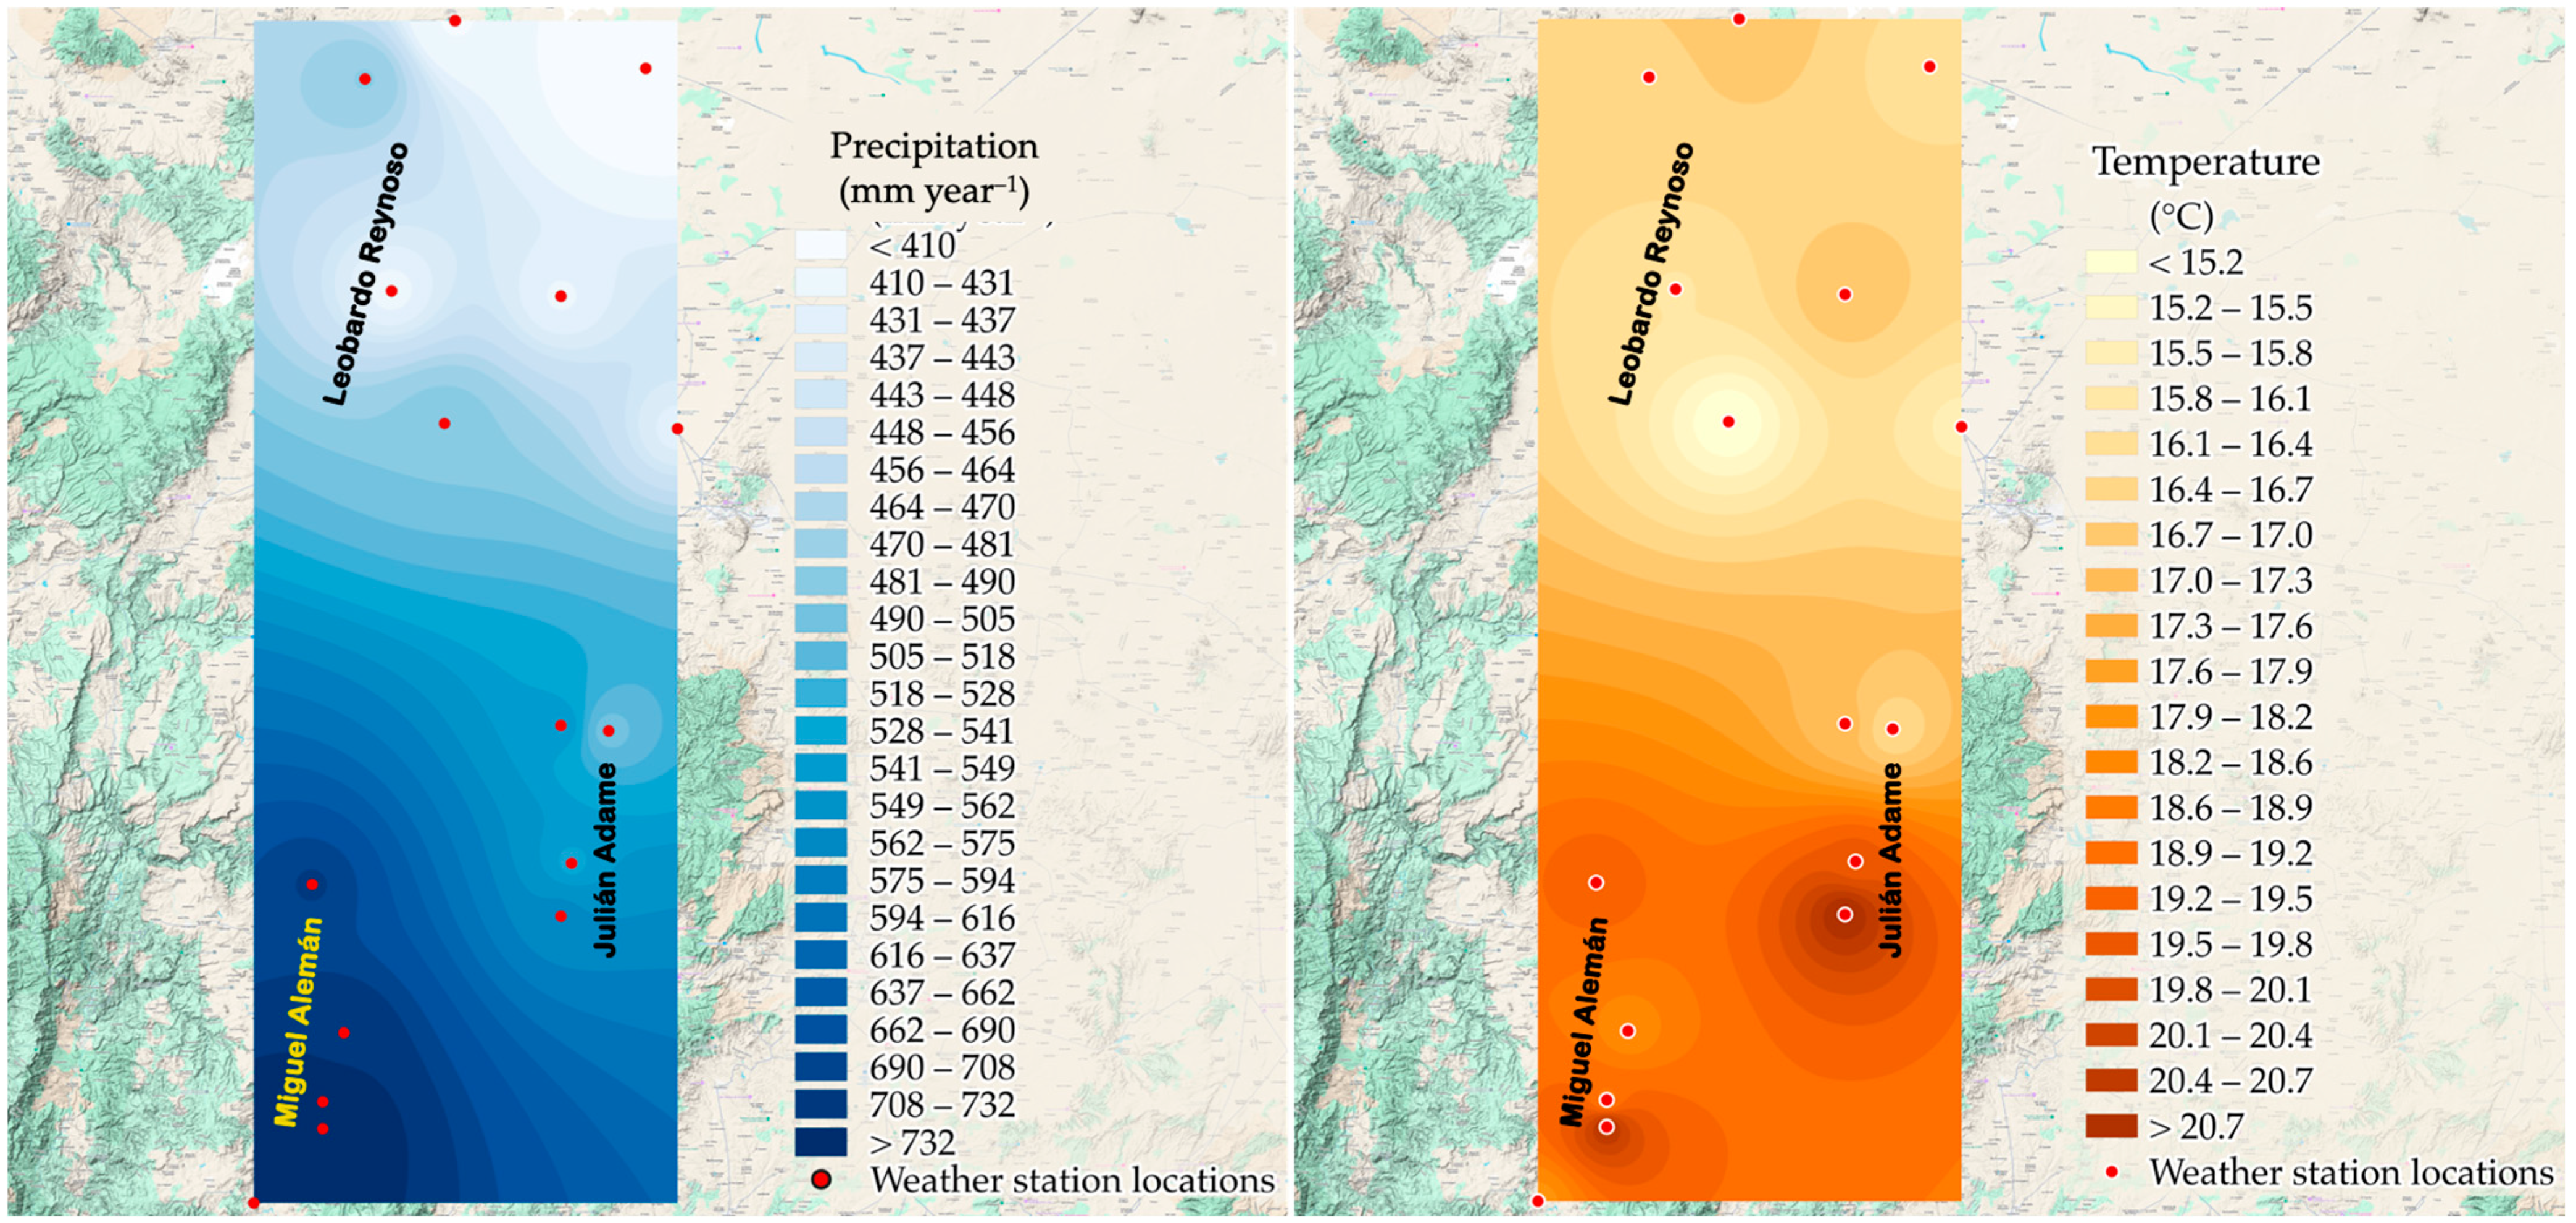
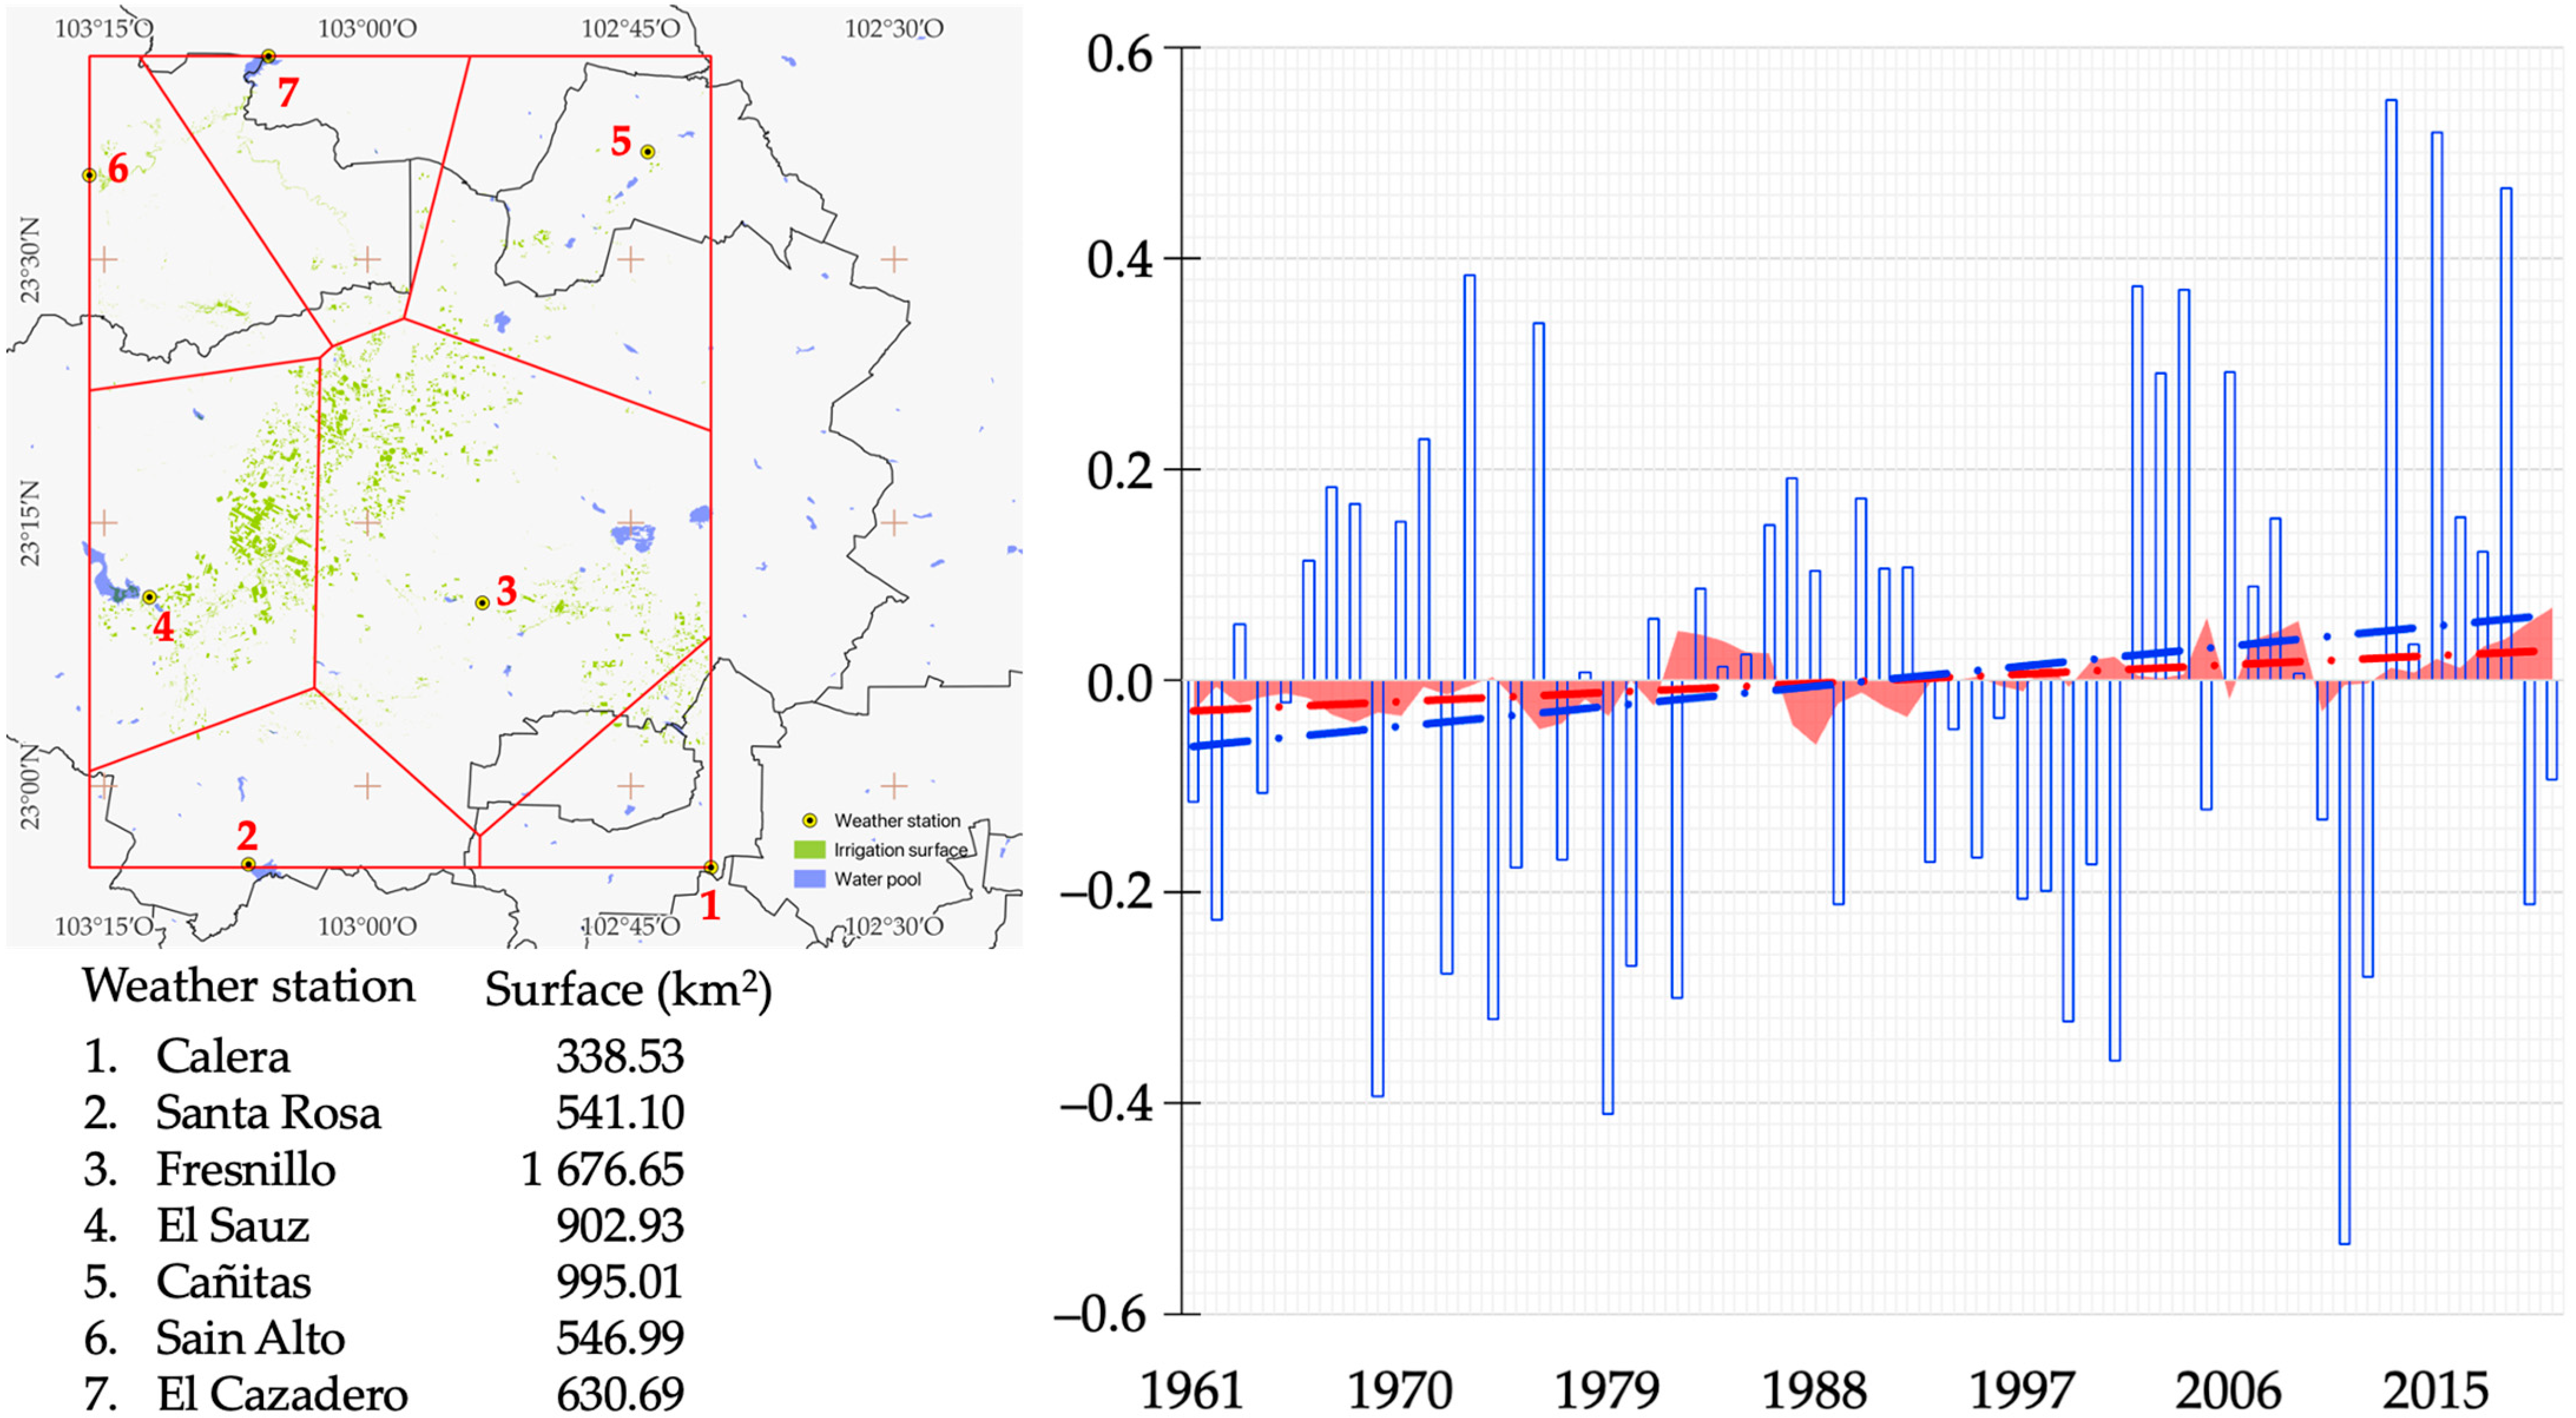
2.1. Study Area

The research was conducted in Zacatecas, a region in northern Mexico characterized by semiarid climatic conditions, where effective water management is crucial for sustaining agricultural productivity. Geographically, Zacatecas lies between latitudes 21°01′45.0″ N and 25°07′21.5″ N, and longitudes 100°43′34.3″ W and 104°43′34.3″ W. The region features diverse physiographic characteristics, including the Sierra Madre Occidental to the west, the Meseta Central Highlands in the central portion, and the Sierra Madre Oriental to the north. Elevations range from 1000 m in the valleys to 3200 m above sea level in mountainous areas. Zacatecas experiences a semi-arid climate, with an annual average precipitation of approximately 350 mm, 80% of which occurs between June and September during the rainy season. Rainfall variability is high, both spatially and temporally, and prolonged droughts are common. Annual temperatures range from an average low of 6.5 °C in January to a high of 29.6 °C in May. These climatic conditions pose significant challenges for water resource management, particularly in irrigated agriculture, where potential evapotranspiration far exceeds precipitation.
Agriculture remains a vital economic activity in Zacatecas, covering approximately 1.7 million hectares, with 13% of this area under irrigation. The primary crops grown in the region include vegetables (such as peppers, garlic, onions, and tomatoes), grains (including maize, beans, oats, wheat, and sorghum), and forage crops such as alfalfa. Among the irrigated areas, Irrigation District No. 034 stands out, covering 18,000 hectares and plays a significant role in the regional economy. Within this district, three irrigation modules —Julián Adame (JA), Miguel Alemán (MA), and Leobardo Reynoso (LR)—were selected for analysis. These modules collectively span 11,971 hectares and rely on a combination of lined and unlined canal networks for water distribution (Figure 1).

2.2. Statistical Analysis of Rainfall and Temperature Trends

Long-term rainfall and temperature time series were analyzed from 16 meteorological stations strategically distributed across Zacatecas, to assess climatic variability and its implications for water resources into three irrigation modules. These stations, monitored by the Servicio Meteorológico Nacional (SMN) of México [18], encompass daily and monthly precipitation and temperature records spanning the period from 1961 to 2020. Prior to statistical evaluation, a robust pre-processing protocol was implemented to rectify data deficiencies and ensure integrity. Stations exhibiting less than 15% missing data were retained for analysis, and minor gaps of up to three days per month were interpolated using the monthly station-specific means. In cases where data gaps exceeded the defined threshold, missing values were reconstructed using either Inverse Distance Weighting (IDW) or linear regression (Lreg), leveraging data from nearby stations [19,20]. IDW was selected due to the observed negative correlation between station distance and the similarity of climatic variables (rainfall and temperature), indicating that closer stations tend to exhibit more similar precipitation trends. This relationship supports the use of IDW, as proximity is a key condition for effective interpolation [21,22,23]. To ensure data reliability, outlier detection and correction followed stringent quality control methodologies [24].
The selection of IDW as the most accurate interpolation method was justified through a quantitative validation process using independent testing data [25]. Specifically, approximately 20% of observed data was excluded from the interpolation process and later used to assess IDW’s accuracy against alternative methods. Mean Absolute Error (MAE) and Root Mean Square Error (RMSE) were used to measure deviations between actual and interpolated values. For precipitation data, IDW achieved an MAE of 49.92 mm and an RMSE of 64.02 mm, performing comparably to Ridge spatial regression (48.59 mm MAE, 63.96 mm RMSE) and simplified Kriging (46.37 mm MAE, 65.45 mm RMSE), while spline performance showed higher errors (60.04 mm MAE, 81.96 mm RMSE). For temperature data, a qualitative assessment confirmed that IDW effectively captured spatial and temporal trends without introducing significant biases or distortions. While alternative methods such as spline yielded slightly lower errors, they required higher computational resources and were more sensitive to data gaps, leading to unrealistic fluctuations in interpolated values.
To explain climatic variability within the region, seasonal and annual precipitation and temperature patterns were examined using comprehensive descriptive statistical measures, involving central tendency, dispersion metrics, and variability coefficients [26]. The characterization of temporal trends in these hydroclimatic variables was performed using the Mann-Kendall (MK) test, a non-parametric method designed to identify monotonic trends in time series data independent of underlying distributional assumptions [27,28,29,30]. Statistical significance of observed trends was evaluated based on a normalized test statistic, applying a 95% confidence threshold to ensure rigor in inference. To mitigate the risk of inflated trend significance attributable to serial correlation, pre-whitening procedures were systematically employed. Furthermore, complementary statistical methodologies [31,32] were incorporated to validate findings and attenuate potential autocorrelation effects, thereby reinforcing the robustness of trend assessments.
To detect discontinuities and structural changes in the mean or variance of precipitation and temperature time series, multiple statistical tests were applied to enhance diagnostic accuracy. The Pettitt test, a rank-based non-parametric technique, was utilized to identify potential change points indicative of abrupt climatic shifts [33]. The Standard Normal Homogeneity Test (SNHT) facilitated comparative assessment of mean values before and after detected change points [34]. The Buishand Range Test [35] was employed to evaluate systematic shifts in the mean of observed records through cumulative deviation analysis, while the Von Neumann Ratio Test [36] provided an independent measure of randomness within the time series.
In order to identify cyclic patterns within precipitation and temperature time series, the Fast Fourier Transform (FFT) was employed. This process entailed FFT application to data set, dominant frequencies identification associated with relevant climatic cycles, spectral filtering implementation to remove high-frequency noise components, and the reconstruction of the series using the Inverse Fourier Transform (IFFT) [37]. Consequently, a smoothed version of the data was obtained, emphasizing recurrent climatic patterns, devoid of random fluctuations. Thereafter, an Autoregressive Integrated Moving Average (ARIMA) model is implemented to capture unaccounted trends as well as residual variability unexplained by the FFT. This implied the series stationarities through differencing, when necessary, the selection of the ARIMA model order (p, d, q) based on Akaike (AIC) and Bayesian (BIC) information criteria [38], and the evaluation of the fit using metrics such as Mean Squared Error (MSE) and Coefficient of Determination (R2) [39]. Finally, the fitted model was used to generate projections of precipitation and temperature for the period 2025–2065.

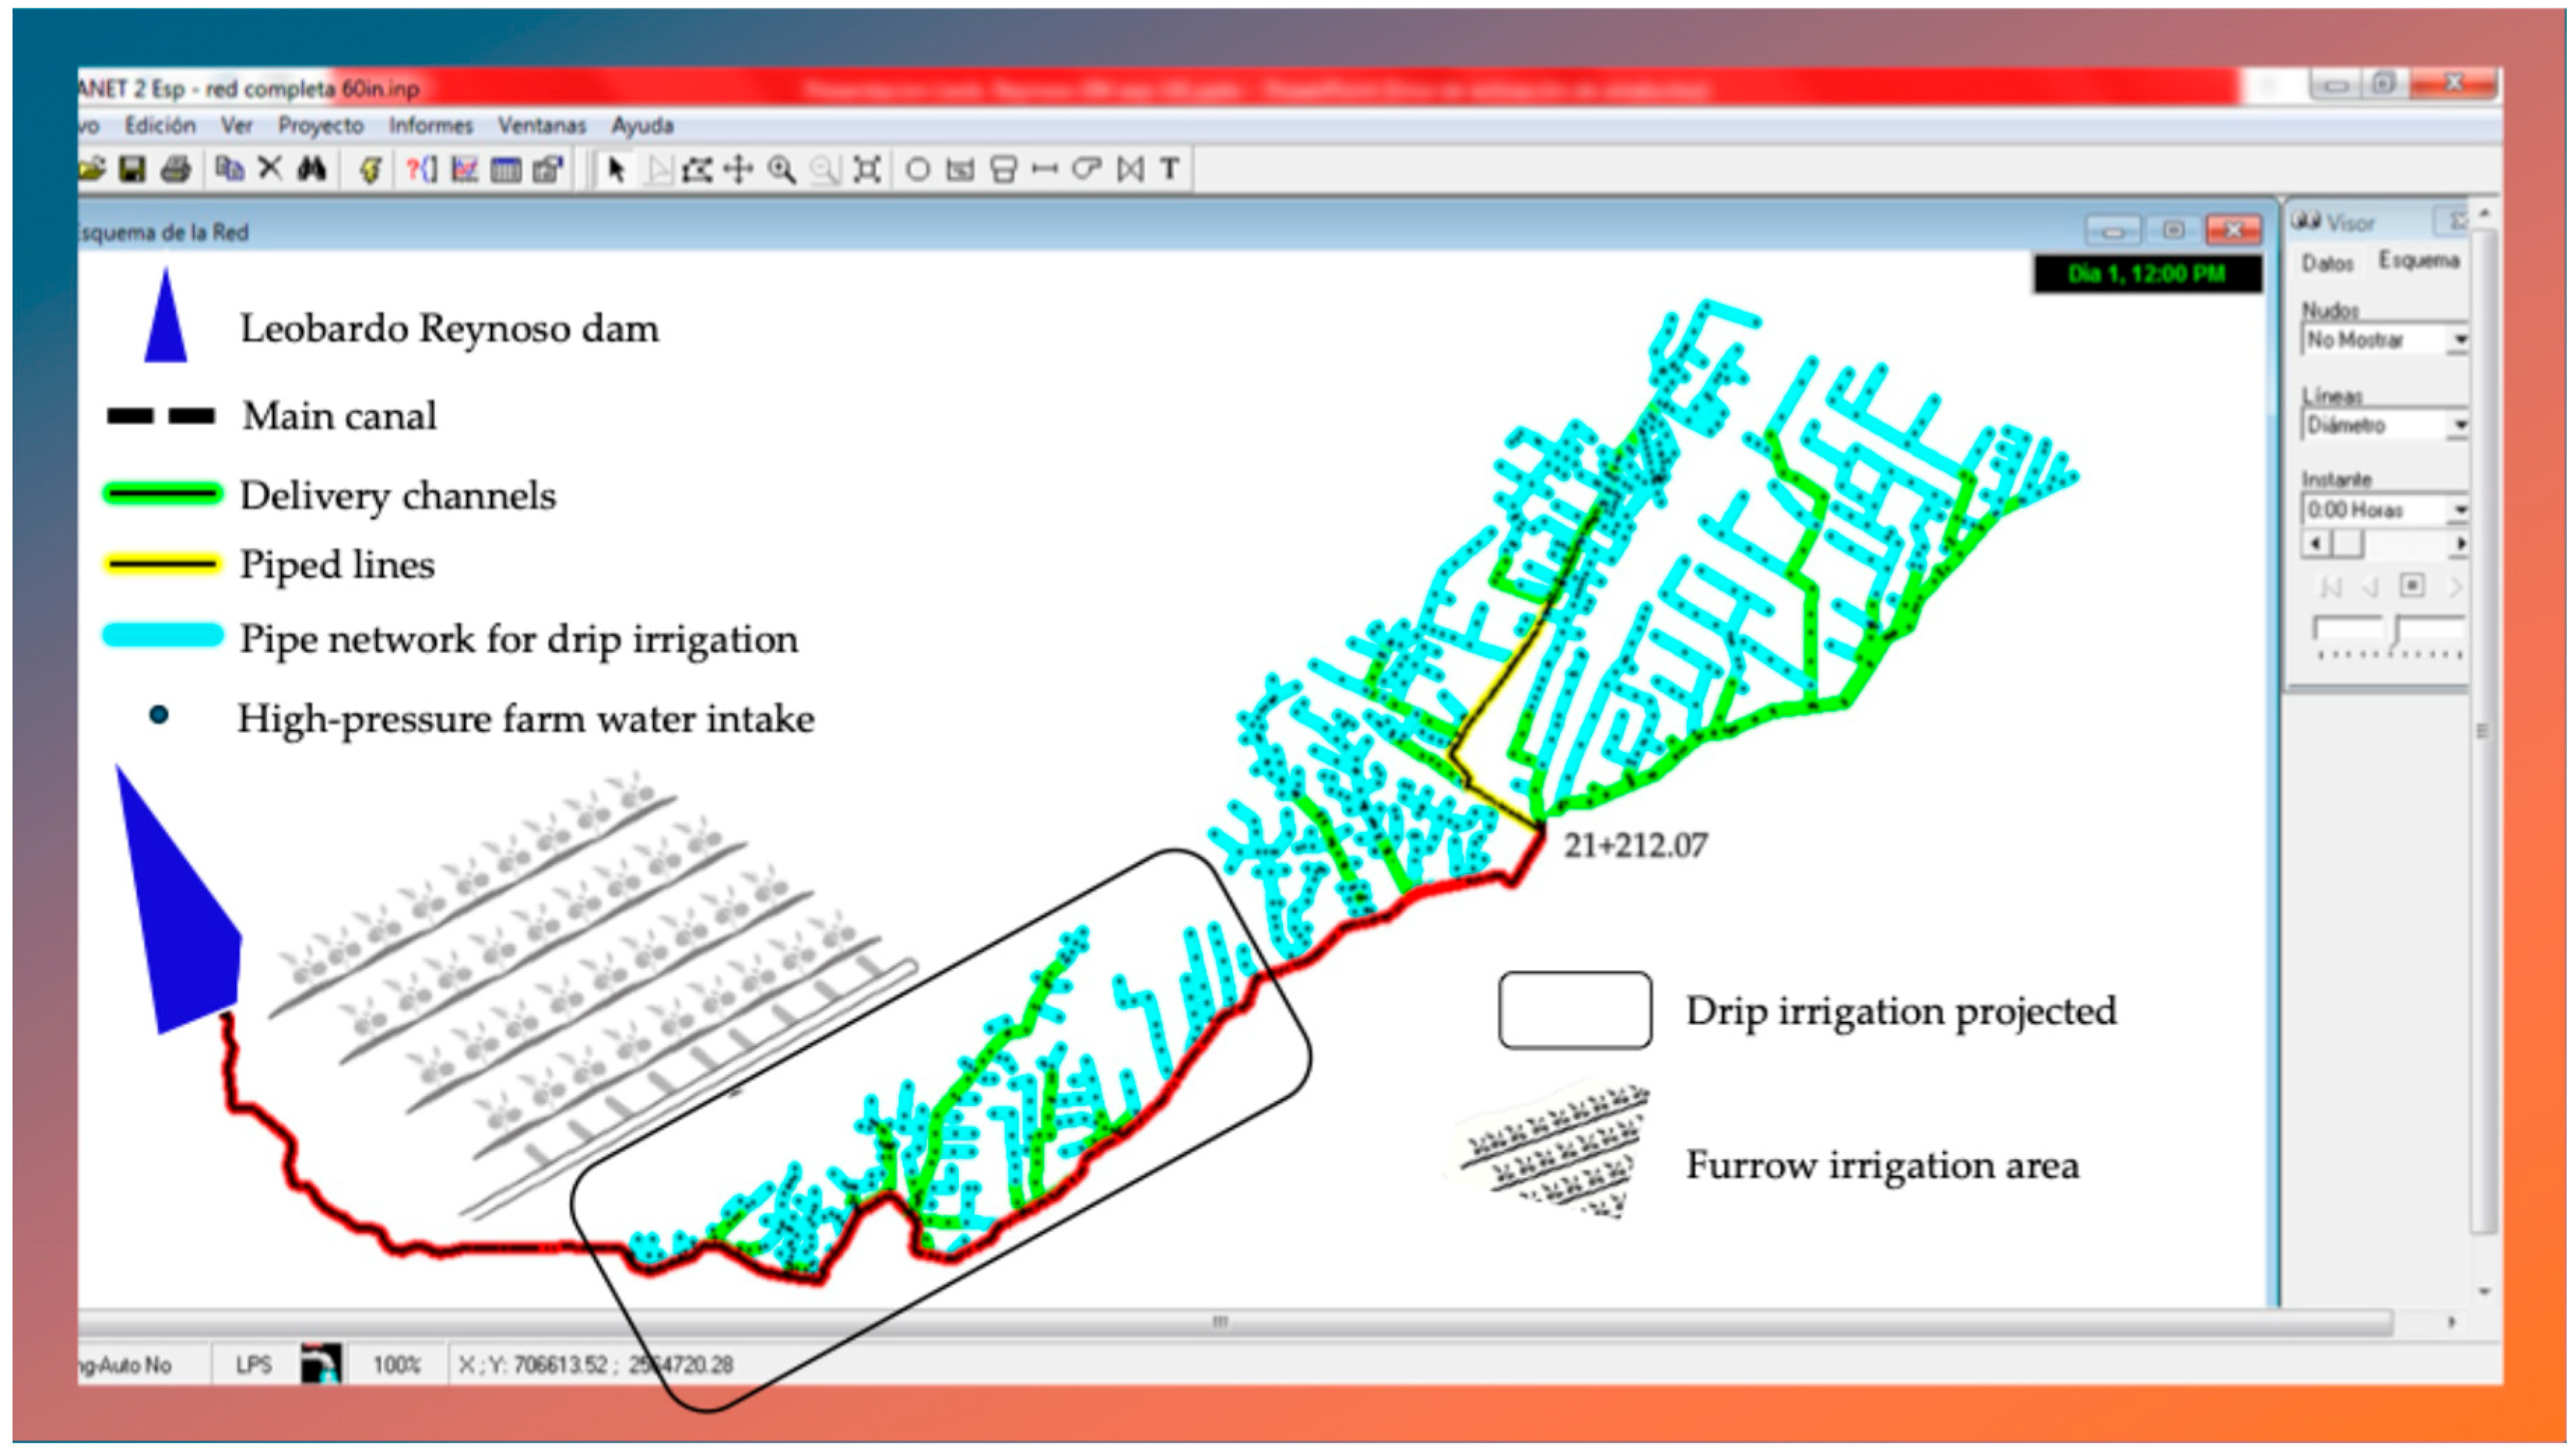
2.3. Crop Water Requirements and Water Use Efficiency

Following climatic trend analysis, crop water requirements (CWR) were calculated to optimize irrigation practices in the region. CWR represents the amount of water needed to compensate for evapotranspiration (ETc) losses, ensuring optimal crop growth under favorable conditions [40]. To estimate reference evapotranspiration (ET0), the Penman-Monteith equation was applied, considering multiple climatic parameters such as net radiation, air temperature, humidity, and wind speed. This equation integrates factors including latent heat of vaporization, energy balance, vapor pressure deficit, air density, specific heat of air, and resistance to water vapor transfer. Once ET0 was determined, it was multiplied by a dimensionless crop coefficient (Kc) to compute ETc, which varies depending on crop and growth stage.
The methodology for determining ET0 and Kc is extensively detailed in FAO Irrigation and Drainage Paper No. 56 [41], which serves as a global reference for calculating evapotranspiration and crop water requirements under different climatic conditions. To determine the actual water requirement for crops in the irrigation modules, the CROPWAT 8.0 software developed by the FAO was employed [42]. This tool processes climatic, crop, and soil data to simulate irrigation needs under different environmental conditions, offering essential insights for water management in semi-arid regions. To improve water conveyance efficiency in the irrigation modules (JA, MA, LR), hydraulic performance was assessed using three established methodologies: the Irrigation Unit Coefficient, Clement’s method, and Clemmens’ technique. These methods evaluate the ability of canals to effectively conduct water, providing a comprehensive understanding of irrigation efficiency. Detailed implementation procedures for these methodologies can be found in the corresponding references [43,44,45,46,47,48].
Water use efficiency was analyzed by estimating losses within the distribution network and agricultural plots through three key indicators: application efficiency, conduction efficiency, and uniformity efficiency, as proposed by Christiansen [49]. Application efficiency measures the proportion of water effectively applied to the crop in relation to the required amount. Conduction efficiency evaluates the volume of water transported through the irrigation network relative to the intended amount, accounting for losses along distribution system. Uniformity efficiency determines how evenly water is distributed across the field by analyzing variations in infiltration at different locations.
To further analyze the hydraulic behavior of the canal networks, EPANET® Version 2.2 software was used to simulate flow conditions. This tool solves flow continuity and head loss equations to assess the pressure, flow rates, and overall performance of water distribution systems under varying operational scenarios. The Darcy-Weisbach equation was applied to estimate friction losses within the canals, enabling the identification of inefficiencies in the irrigation network [50]. These analyses provide crucial insights for optimizing water distribution and improving the overall performance of irrigation systems. With a view to demonstrating that the difference in application efficiency between gravity irrigation and pressurized irrigation decreases when traditional furrow irrigation is carried out under controlled conditions. This paper includes findings from an experiment published in 2020 relating to two experimental plots established in the LR irrigation module [51] and thus evaluating how water volume in the storage source derived from the surface area that must be irrigated with run-off water because its topography makes it unsuitable for pressurized irrigation, evolves.

3. Results

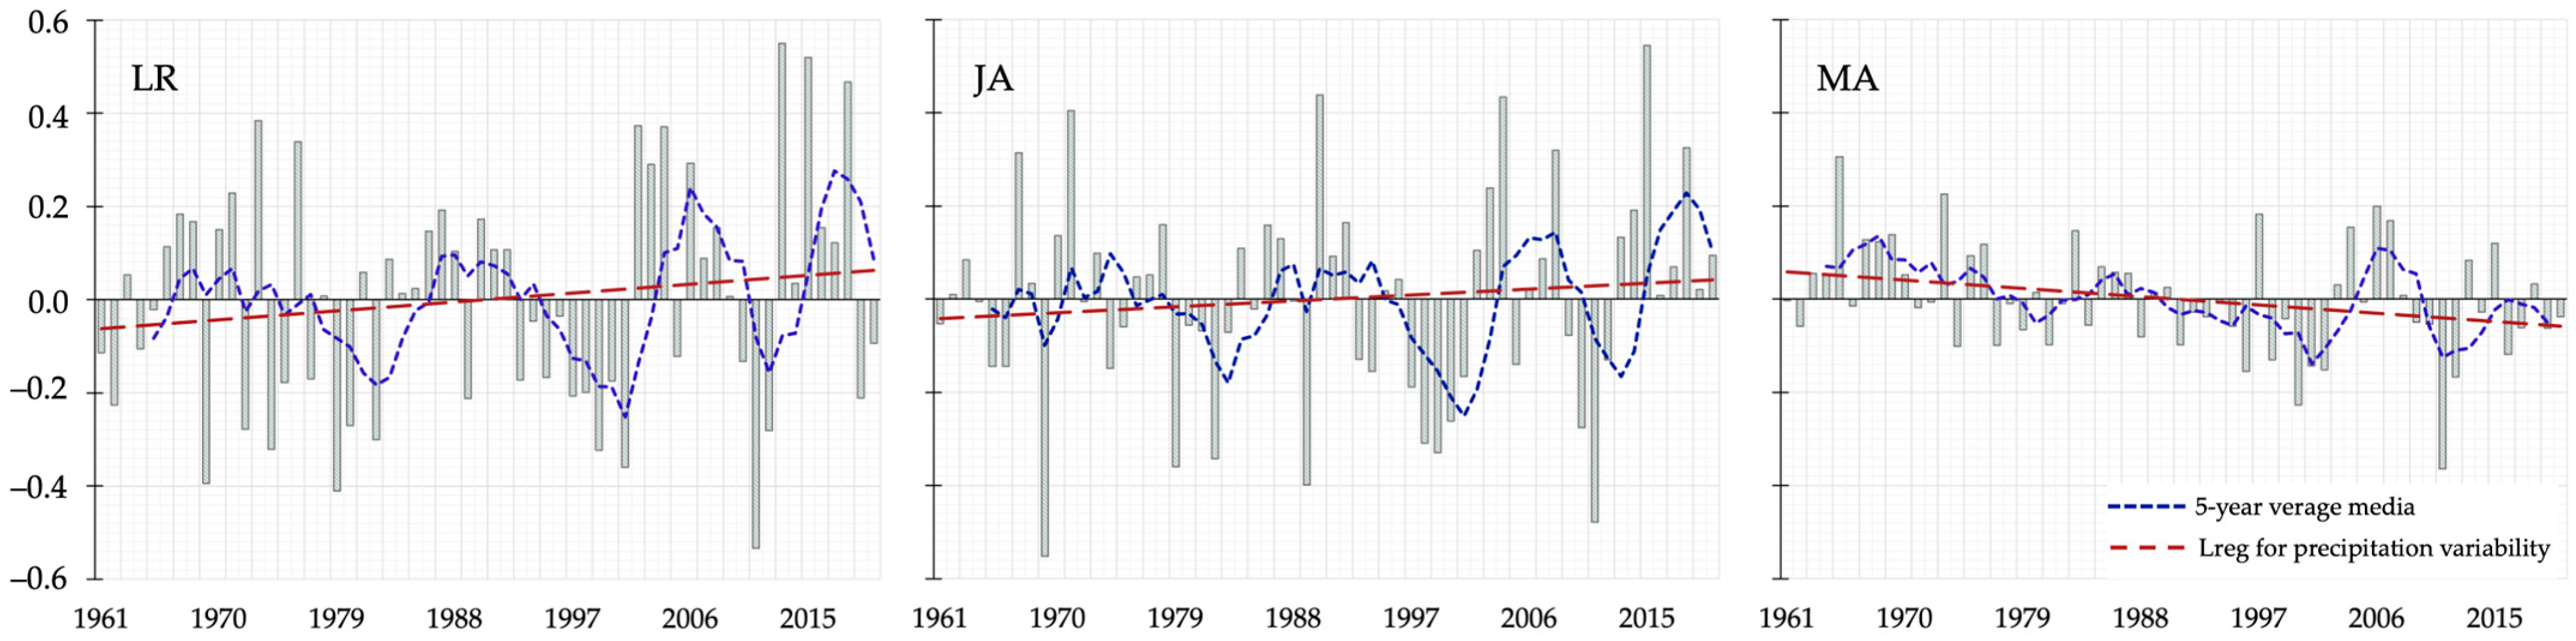
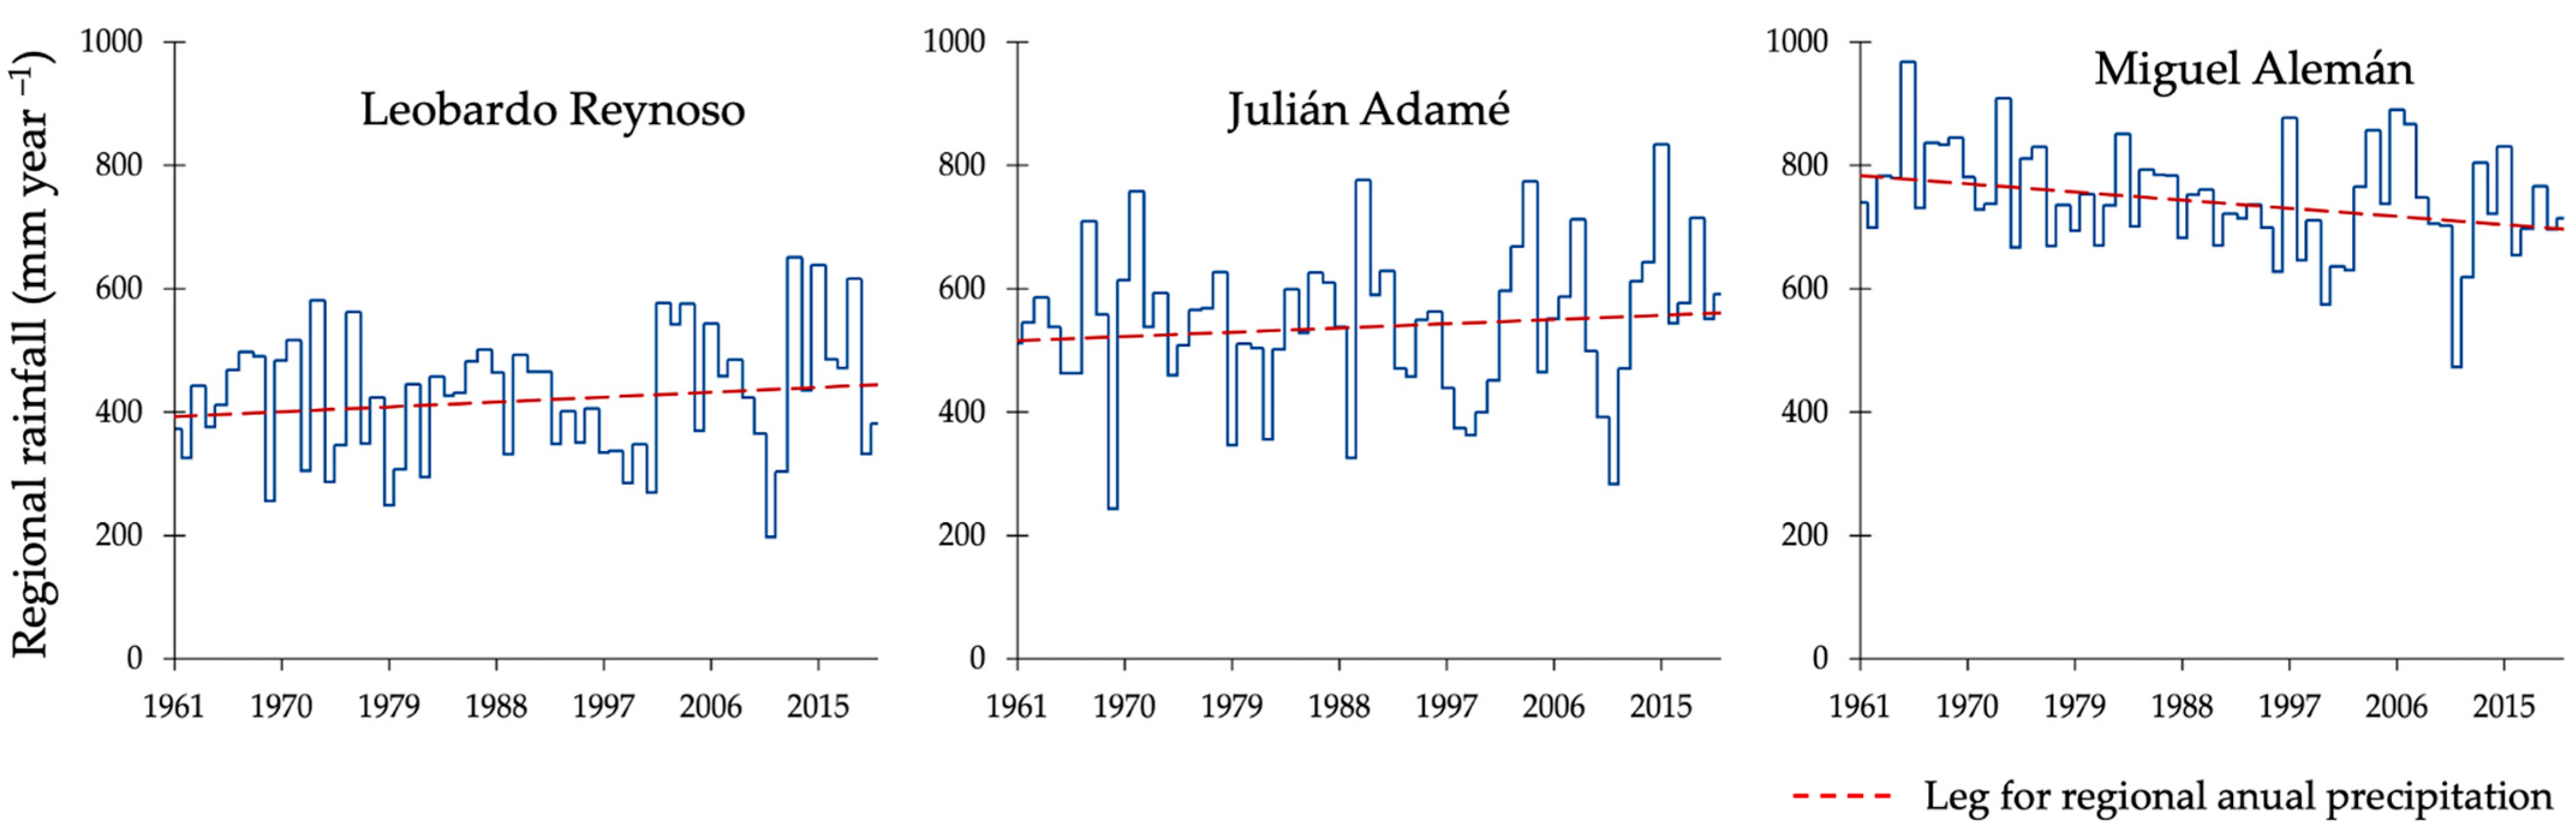
3.1. Rainfall and Temperature Trends at Irrigation Modules Context

An integrated analysis of precipitation and temperature trends from 1961 to 2020 across LR, JA, and MA irrigation modules reveals significant climatic dynamics, illustrating notable changes in rainfall and temperature patterns over time. These variations are influenced by mesoscale atmospheric processes, topographical effects, and broader climatic phenomena. Figure 2 illustrates the spatial distribution of mean rainfall and temperature during the 1961–2020 period, highlighting a clear precipitation gradient that ranges from approximately 410 mm year−1 in the northwest to over 730 mm year−1 in the southeast. The northwest, depicted in pale blue hues, experiences arid to semi-arid conditions, while the southeast, represented by darker blue shades, receives substantially higher precipitation, a pattern likely influenced by orographic lifting, prevailing wind patterns, and regional moisture transport mechanisms. Notable locations such as MA irrigation module exhibit the highest precipitation levels, whereas JA irrigation module experiences moderate rainfall, and LR irrigation module falls within a lower precipitation zone compared to MA irrigation module. This spatial variability underscores the complex geographic and climatic interactions shaping the region’s hydrometeorological patterns.
The temperature distribution exhibits a well-defined gradient, ranging from below 15.2 °C in the cooler northern regions to above 20.7 °C in the warmer southern zones. Cooler temperatures, represented by lighter shades, are predominantly associated with higher altitudes and reduced solar radiation, whereas the darker orange to brown tones in the south correspond to elevated temperatures, likely influenced by subtropical climatic dynamics and lower elevations. A clear inverse correlation is observed between precipitation and temperature, where regions with lower precipitation, such as the northwest, generally exhibit cooler conditions, while areas receiving higher precipitation, particularly in the southeast, tend to display warmer thermal profiles. These spatial climatic patterns have significant implications for agricultural practices, water resource management, and ecological sustainability. Areas with higher precipitation and moderate temperatures, such as those surrounding MA irrigation module, provide favorable conditions for agricultural productivity and human settlement. In contrast, regions like LR irrigation module, where precipitation is lower despite moderate temperatures, are likely to encounter considerable challenges related to water availability and resource management. To further enhance the understanding of these climatic interactions, future research should incorporate additional variables, including wind patterns, atmospheric humidity, and solar radiation.
An analysis of long-term precipitation trends reveals both increasing and declining patterns across the study area (see Table 1). The LR irrigation module exhibited a statistically significant annual increase in rainfall of 2.01 mm per year (p < 0.05) for the Fresnillo weather station and 1.40 mm per year (p < 0.05) for the Santa Rosa weather station, resulting in a cumulative increase ranging from 84.0 to 120.6 mm over the 60-year study period, suggesting a transition toward wetter conditions. The observed upward trends in precipitation are likely attributable to localized orographic effects and mesoscale atmospheric convergence, which have been shown to intensify rainfall patterns in elevated terrains, such as those found in Santa Rosa (2236 masl) and Fresnillo (2201 masl).Conversely, while records at weather stations within the LR irrigation module, which is situated at an elevation below 2100 masl, also demonstrate an increase in annual rainfall, these records do not attain statistical significance. A similar observation can be made for the JA irrigation module, a geographical region with an elevation below 2100 masl, which also exhibited an annual increase in precipitation. However, the statistical significance of this increase is negligible, akin to the observations made in the LR irrigation module.
The LR irrigation module exhibited an increase in precipitation ranging from 0.25 to 0.85 mm year−1, while the JA module demonstrated a range between 0.33 and 0.70 mm per year. The findings indicate that while precipitation levels increase with increasing elevation, they also decrease with increasing latitude (Table 1). Conversely, the MA irrigation module exhibited a negative precipitation trend, characterized by a decline ranging from −0.54 mm year−1 to −2.22 mm year−1, resulting in a cumulative reduction between 34.2 mm and 133.2 mm between 1961 and 2020. This decline points to an elevated vulnerability to water scarcity. The driest periods in MA irrigation module coincided with prolonged droughts lasting up to nine years, as identified through a threshold-based analysis that classified dry years as those with annual precipitation below 595.7 mm. In contrast, wet years, defined by precipitation exceeding 909.3 mm, were relatively less frequent but often associated with intense and irregular rainfall events.
Annual precipitation variability was particularly pronounced in stations such as Calera, Cañitas, and El Sauz, where trends ranged from 0.3 to 0.8 mm per year, although these changes were not statistically significant. Such results align with the high interannual variability characteristic of northern Mexico’s semi-arid regions. For example, JA irrigation module recorded 32 wet years and 28 dry years, whereas MA module experienced 26 wet years and 34 dry years, highlighting the considerable differences in pluviometry regimes across the study area (Figure 3). The cyclical nature of wet and dry periods was evident, with droughts lasting up to nine years in some cases, followed by shorter yet intense wet periods. During dry years, precipitation levels fell significantly below the annual means, often leading to critical water deficits in reservoirs and agricultural systems.
From 1961 to 2020, rainfall patterns in the study modules showed alternating periods of surplus and deficit. Typically, dry spells lasted one to two years, but prolonged droughts could extend up to nine years. In contrast, wet years were shorter, occurring every one to three years. Figure 3 presents these trends, showing annual rainfall anomalies (red bars) alongside a 5-year moving average (blue dash line) for a clearer view of variability over time. JA irrigation module exhibits pronounced interannual oscillations, while LR irrigation module’s moving average indicates a discernible upward trend despite considerable variability. In contrast, MA irrigation module’s trend appears more stable, with notable deviations around 2010, followed by a gradual recovery. Persistent variability in LR irrigation module, particularly during the 1970s and mid-2000s, stabilizes toward the latter years of the study period, reflecting broader-scale climatic influences and localized anomalies.
The post-2010 recovery trend observed across all regions may indicate the re-establishment of stable rainfall regimes. Notably, the 1970s emerge as a period of amplified variability, underscoring the impact of larger climatic phenomena. Superimposed localized anomalies further highlight the intricate interplay between regional and site-specific drivers. By analyzing the persistence and variability of wet and dry periods across LR, JA, and MA irrigation modules, key insights into climatic behaviors and their underlying mechanisms were obtained. Wet and dry periods typically persisted for one to two years, with wet periods exhibiting slightly longer durations, suggesting a regional hydrological regime dominated by surplus precipitation. LR and JA irrigation modules displayed heightened interannual variability, marked by frequent state transitions, indicating sensitivity to macro-atmospheric oscillations.
In contrast, MA irrigation module displayed prolonged persistence, indicative of its dependence on localized hydrological factors like soil moisture dynamics and evapotranspiration. Synchrony and divergence among modules were further explored. LR and JA irrigation modules showed strong alignment during wet periods, driven by common atmospheric dynamics, while MA irrigation module often diverged during dry periods, emphasizing its distinct drivers. Cross-correlation analysis reinforced previous statement, with high synchronization (r = 0.83) between LR and JA irrigation modules, moderate correlation (r = 0.53) between LR and MA, and weak correlation (r = 0.25) between JA and MA irrigation modules, substantiating the hypothesis of independent climatic mechanisms for MA irrigation module. As Figure 4 displays, a reconstruction of cyclic signals reveals predominant patterns. Overlapping wet periods in LR and JA highlight common climatic drivers, while MA irrigation module reveals independent cycles driven by hydrological mechanisms such as soil moisture retention and evaporation. Amplitude analysis reveals significant interannual variability in the JA irrigation module, with cycles oscillating between ±5.0 units, in contrast to the moderate amplitude of around ±3.0 units observed in the LR irrigation module. The frequency of cycles and high amplitude (±4.5 units) of the MA irrigation module are indicative of long-term driver control or tidal influences. In addition, the phase difference observed in MA compared to LR and JA suggests that its cycles are not directly influenced by the same climatic drivers, but rather by internal hydrological processes.
As for rainfall trends in irrigation modules, Figure 5 illustrates tendencies for all agricultural units under examination. As previously stated, LR and JA irrigation modules at a regional scale exhibit an upward rainfall trend from 1961 to 2020. LR module exhibits a consistent upward trend in precipitation from 1961 to 2020, with an approximate increase of +8.8 mm per decade, as indicated by the regression line. JA module similarly demonstrates an increasing trend, with a slope of +7.6 mm per decade. Both modules exhibit moderate interannual variability without abrupt deviations from the trend. In contrast, MA irrigation module shows a clear downward trend, with a linear regression slope of −14.6 mm per decade. This module also exhibits slightly higher variability compared to LR and JA. While the upward trends in LR and JA are not statistically significant according to MK test (p > 0.05), the downward trend in the MA module is statistically significant, with a p-value of 0.03. These modules have upward Sen’s slopes of 8.2 mm per decade and 6.6 mm per decade, respectively. In contrast, the MA irrigation module shows a Sen’s slope of approximately −13.9 mm per decade.
Temperature trends vary by altitude and latitude, directly affecting agriculture. In the LR module, maximum temperatures range from 14.9 °C (Santa Rosa) to 17.0 °C (Fresnillo and El Cazadero), while minimums fall between −13.0 °C (Sain Alto) and 8.3 °C (Table 2). The region’s higher elevation helps stabilize temperatures, benefiting heat-sensitive crops. However, large nighttime temperature swings—often exceeding 10 °C—can disrupt key growth stages like germination and flowering. The JA module exhibited intermediate thermal conditions, with average maximum temperatures ranging from 16.4 °C to 21.0 °C and minimums spanning from −16.0 °C to 23.5 °C. Heatwaves, particularly at stations such as El Chique, contributed to annual maximum temperatures surpassing 40.0 °C in certain years. While the elevated average temperatures facilitate an extended growing season, they also accelerate evapotranspiration rates, intensifying water demand and increasing vulnerability to drought stress. The MA module recorded the highest temperatures, with average maximums reaching 20.8 °C in La Villita and minimums averaging 10.1 °C. Extreme temperatures peaked at 45.0 °C, reflecting the module’s lower altitude and latitude.
The analysis of climatic evolution highlights key patterns in precipitation and temperature over time. In LR and JA irrigation modules, cumulative increases of 52.8 mm and 45.6 mm in annual precipitation, respectively, were observed during the 1961–2020 period. This trend reflects a gradual shift toward wetter conditions, offering opportunities for water resource recharge but also necessitating effective management to mitigate risks cumuli such as soil erosion during wet years. On the other hand, MA irrigation module showed a tie decrease of 25.8 mm over the same period, indicating increasing vulnerability to prolonged droughts. These trends were accompanied by notable interannual variability, with cycles of dry and wet years; in LR irrigation module, dry years recorded precipitation below 310.3 mm, while in JA irrigation module, wet years exceeded 676.9 mm.

3.2. Crop Water Requirements and Agriculture Systems Efficiency

Management of water resources in semi-arid regions presents a complex challenge for resilience and sustainability of agro-ecological systems. As climate conditions become more variable, it is crucial to reassess how water is distributed and applied in agriculture. Improving irrigation methods can help farmers adapt to these changes and maintain productivity. A regional climatological analysis of LR irrigation module (Figure 6), covering the period from 1961 to 2020, reveals statistically significant trends indicative of an evolving climate regime [52]. Dataset exhibits a decadal thermal increase of 0.16 °C, juxtaposed with a marginal upward shift of 8.8 mm in precipitation. However, interannual stability of temperature is markedly greater than that of precipitation, demonstrating around ninefold lower variability. In semi-arid regions, agricultural water management constitutes a significant challenge to sustainability of those communities residing in such areas.
Homogeneity tests (Pettitt’s test, SNHT, Buishand’s test, and von Neumann’s test) showed irregularities in climate trends. A significant temperature shift occurred around 1997 (p < 0.0001), marking a clear warming trend. However, precipitation remained within historical normal without major changes. To further analyze these trends, the Mann-Kendall test and Sen’s slope estimation were used. The results confirmed a strong warming pattern (τ = 0.415, p < 0.0001), with temperatures rising by 0.016 °C per year. While precipitation also showed a significant trend (τ = 0.084, p = 0.005), an increase of 0.819 mm year−1 was too small to impact overall water availability. Climate changes will impact irrigation needs, especially for maize and grasslands. Maize will grow adequately with 6% less water than it currently requires, while pasture will need to consume 11% more water to avoid stress.
However, both crops will have to meet their water needs with more water from irrigation, since the forecast indicates that effective precipitation in dry years will be up to three times lower than currently observed. Although in wet years, rainfall alone would be sufficient for maize to grow without yield loss and pasture would need to be supplied with about 12% irrigation water, the increase in rainfall variability leads to a scenario in which uncertainty plays a major role. These results support stated by Íñiguez-Covarrubias et al. [53], who noted that shorter plant cycles often meet water needs in most years. However, unlike this study, they did not account for projected rainfall declines due to climate anomalies. Then, sustained temperature increases, rising potential evapotranspiration, and growing irrigation demand are expected to challenge the region’s productive capacity within 35 years, as infrastructure struggles to accommodate escalating water requirements.
In furtherance of preceding assertions, attention is directed to LR irrigation module, a subject of particular pertinence in Zacatecas, a state in which drip irrigation is not usually alternative for irrigate plots. In contrast, this irrigation method has been spread in over 3000 hectares at LR irrigation module plus 800 hectares using sprinkler irrigation, resulting in a substantial enhancement in irrigation efficiency, with certain instances exhibiting values approaching 95%. However, on average, the module attains an application efficiency of 87.5%. Despite the significant efforts of farmers to operate a system that, while resulting in improved water application at the plot level, also entails higher production costs, their efforts are ultimately undermined when calculating global efficiency, given that the efficiency corresponding to conduction is despite farmers’ efforts to manage a system that leads to enhanced water application at the plot level, the resulting higher production cost is not conducive to global efficiency. This is primarily due to an extensive network of over 21 km of main canal, facilitate water conveyance from the headworks to a point where it is released into the free surface and the beginning of piped lines (Figure 7).
While it is true that nearly 81.5% percent of the irrigated land is currently covered by pressurized irrigation systems, it is also true that the LR irrigation module has had to go through several stages to reach this level of development. The first years of operation were characterized by furrow irrigation with a conveyance system consisting of lined and unlined canals, which at best allowed about 70% of the current irrigated area to be under irrigation (Figure 8). In the late 1970s and early 1980s, the first pressurized irrigation systems, mainly center pivot and to a lesser extent front-end, began to appear. Undoubtedly, technification has been a fundamental factor in reaching 100% of irrigable land. From the implementation of sprinkler irrigation in conjunction with wet years—in the period 1984–1988, runoff ranged between 28 and 40 Hm3— it allowed, after 38 years, for the first time to have a reservoir at maximum capacity. However, seven years later, the dam only had 50% of its stored volume and two years later it reached its minimum operating level.
Even though a gradual increase in irrigated land had been sufficient for almost 950 farmers irrigating with water from Leobardo Reynoso dam to keep their plots in production. However, climate projections indicate that in addition to bringing a supplementary 500 hectares into modern drip irrigation between 2025 and 2030, users will have to consider a wider crop pattern than is usually established in that irrigation module in order to maximize water productivity. In other words, introducing technology to 4300 hectares with sprinkler and drip irrigation would prolong the LR irrigation module’s production until 2040, with 4660 hectares being cultivated, 50% of which producing corn, and a further 1000 hectares with crops such as alfalfa, grass, chili, garlic, onion and tomato. On the other hand, it is possible to extent, beyond 2040, productive life in this irrigation zone if, in dry years, a decision is made to reduce per-hectare volume according to water deficit. The most critical case would involve extracting 18.5 Hm3 of the stored volume (2400 m3 ha−1), less than half that granted annually per hectare, a sufficient amount to establish beans or tomatoes in cases where producers have application efficiencies of around 95%.
Rising temperatures and increasing evapotranspiration rates are intensifying irrigation demands, putting pressure on existing infrastructure. Without modernization—such as upgrading intake structures, expanding storage, and improving conveyance efficiency—water shortages may significantly impact food security and agricultural productivity [54]. The amount of water that is discharged by each irrigation module depends on the area that is sown as well as the crops that are grown during a particular agricultural season, then projections of water discharge rates through CUR, Clemens, and Clement methods. Critical rates for controlled demand were derived from CUR method as follows: 2.7 m3 s−1 in JA irrigation module, 5.3 m3 s−1 in MA irrigation module, and 4.9 m3 s−1 in LR irrigation module. However, these calculations assume static climate conditions, ignoring projected water demand increases due to climate alterations —prolonged droughts and extreme weather—[55]. Beyond this consideration, the intake structure for each irrigation module does not have the capacity to supply such discharges, even with a hydraulic load at the level of ordinary maximum water levels. This will result in a diversion dam being built with enough capacity to supply any flow in excess of hydraulic capacity of existing headworks.
Pressurized irrigation has been shown to enhance efficiency, with LR benefiting from a 1.5 m diameter pipeline, while JA and MA continue to rely on less efficient canal-based systems. Pressure levels ranged from 103.9 to 455.9 kPa in LR, where 98.5% of the surface is suitable for drip irrigation. However, lower hydraulic pressure values in JA and MA irrigation modules, limit the viability of the pressurized system, with 45% of hydrants below 147.0 kPa. High-pressure zones—98.5% in LR, 54.7% in JA, and 53.7% in MA—are ideal for pressurized irrigation, which improves water use and crop quality [56]. The installation of pressure regulating valves is recommended for pressures above 490.0 kPa [57]. Efficiency comparisons highlight the advantages of pressurized systems, and they are a fundamental piece of data in the hydraulic modeling of the network as a whole. In this regard, the on-site assessments conducted on the irrigation modules that currently operate with diverse irrigation methods have yielded uniformity coefficients of 82.6% and 87.1%, and application efficiencies equivalent to 82.2% and 86.0%, for drip irrigation and sprinkler irrigation, respectively [58,59].
Conversely, furrow irrigation exhibited a markedly lower efficiency, with an average of 50.0%, with only marginal enhancements in MA (58.1%) [54]. Water transport efficiency constitutes a pivotal factor. Open channel systems in MA, LR, and JA demonstrate an average efficiency of 60.0%, resulting in substantial water losses. Conversely, pressurized pipes have been shown to achieve efficiencies exceeding 95.0%, underscoring the limitations of conventional infrastructure [58]. Expanding pressurized systems in high-pressure zones is essential for optimizing water use, nutrient delivery, and resource efficiency [60]. Crop diversification strategies can further improve resilience to climate variability [61,62]. As climate conditions become increasingly unpredictable, upgrading irrigation infrastructure is crucial to sustaining agricultural productivity. Without these measures, water shortages will continue to threaten food security and long-term sustainability.

4. Discussion

The semi-arid climate of Zacatecas exacerbates water scarcity and agricultural vulnerability, particularly due to recurrent droughts and erratic precipitation. Traditional irrigation methods are inefficient, characterized by significant water losses through seepage and evaporation, and limited adaptability to changing climatic conditions [63]. These inefficiencies reduce agricultural productivity and threaten ecosystem sustainability, necessitating the modernization of irrigation systems. Studies such as [64] highlight the potential of improved irrigation practices to reduce water demand in arid regions significantly. Similarly, [65] demonstrated that integrating nutrient-efficient practices with advanced irrigation technologies enhances agricultural outputs [66,67,68,69] further emphasized the role of topographical adjustments and crop diversification in optimizing water and nutrient use efficiency in regions with extreme climatic variability, such as Zacatecas. Government initiatives, particularly those led by the Comisión Nacional del Agua (Conagua) [70], have focused on rehabilitating and modernizing irrigation infrastructure, achieving water conveyance efficiencies as high as 98% in certain districts. These efforts enhance irrigation effectiveness and contribute to community resilience by stabilizing agricultural incomes.
Increased atmospheric evaporative demand is projected to elevate potential evapotranspiration (ET0) while reducing effective precipitation (Pe). In irrigated areas with limited water supply, ETc may be constrained by water availability, increasing competition for resources and potentially compromising agricultural productivity. Additionally, accelerated crop phenological cycles due to elevated temperatures do not necessarily translate into increased biomass production. A shorter growth cycle restricts cumulative photosynthetic activity, limiting carbon assimilation and yield potential. Surpassing physiological thermal thresholds (24–30 °C for maize) may exacerbate photosynthetic inefficiencies, impair reproductive development, and reduce grain filling. These conditions heighten the risk of hydric stress, lower water use efficiency and threaten agronomic sustainability. Findings highlight a fundamental shift in regional climatic dynamics, primarily driven by progressive atmospheric warming. While long-term water availability may remain within historical bounds, rising temperatures necessitate a reassessment of water balance parameters.

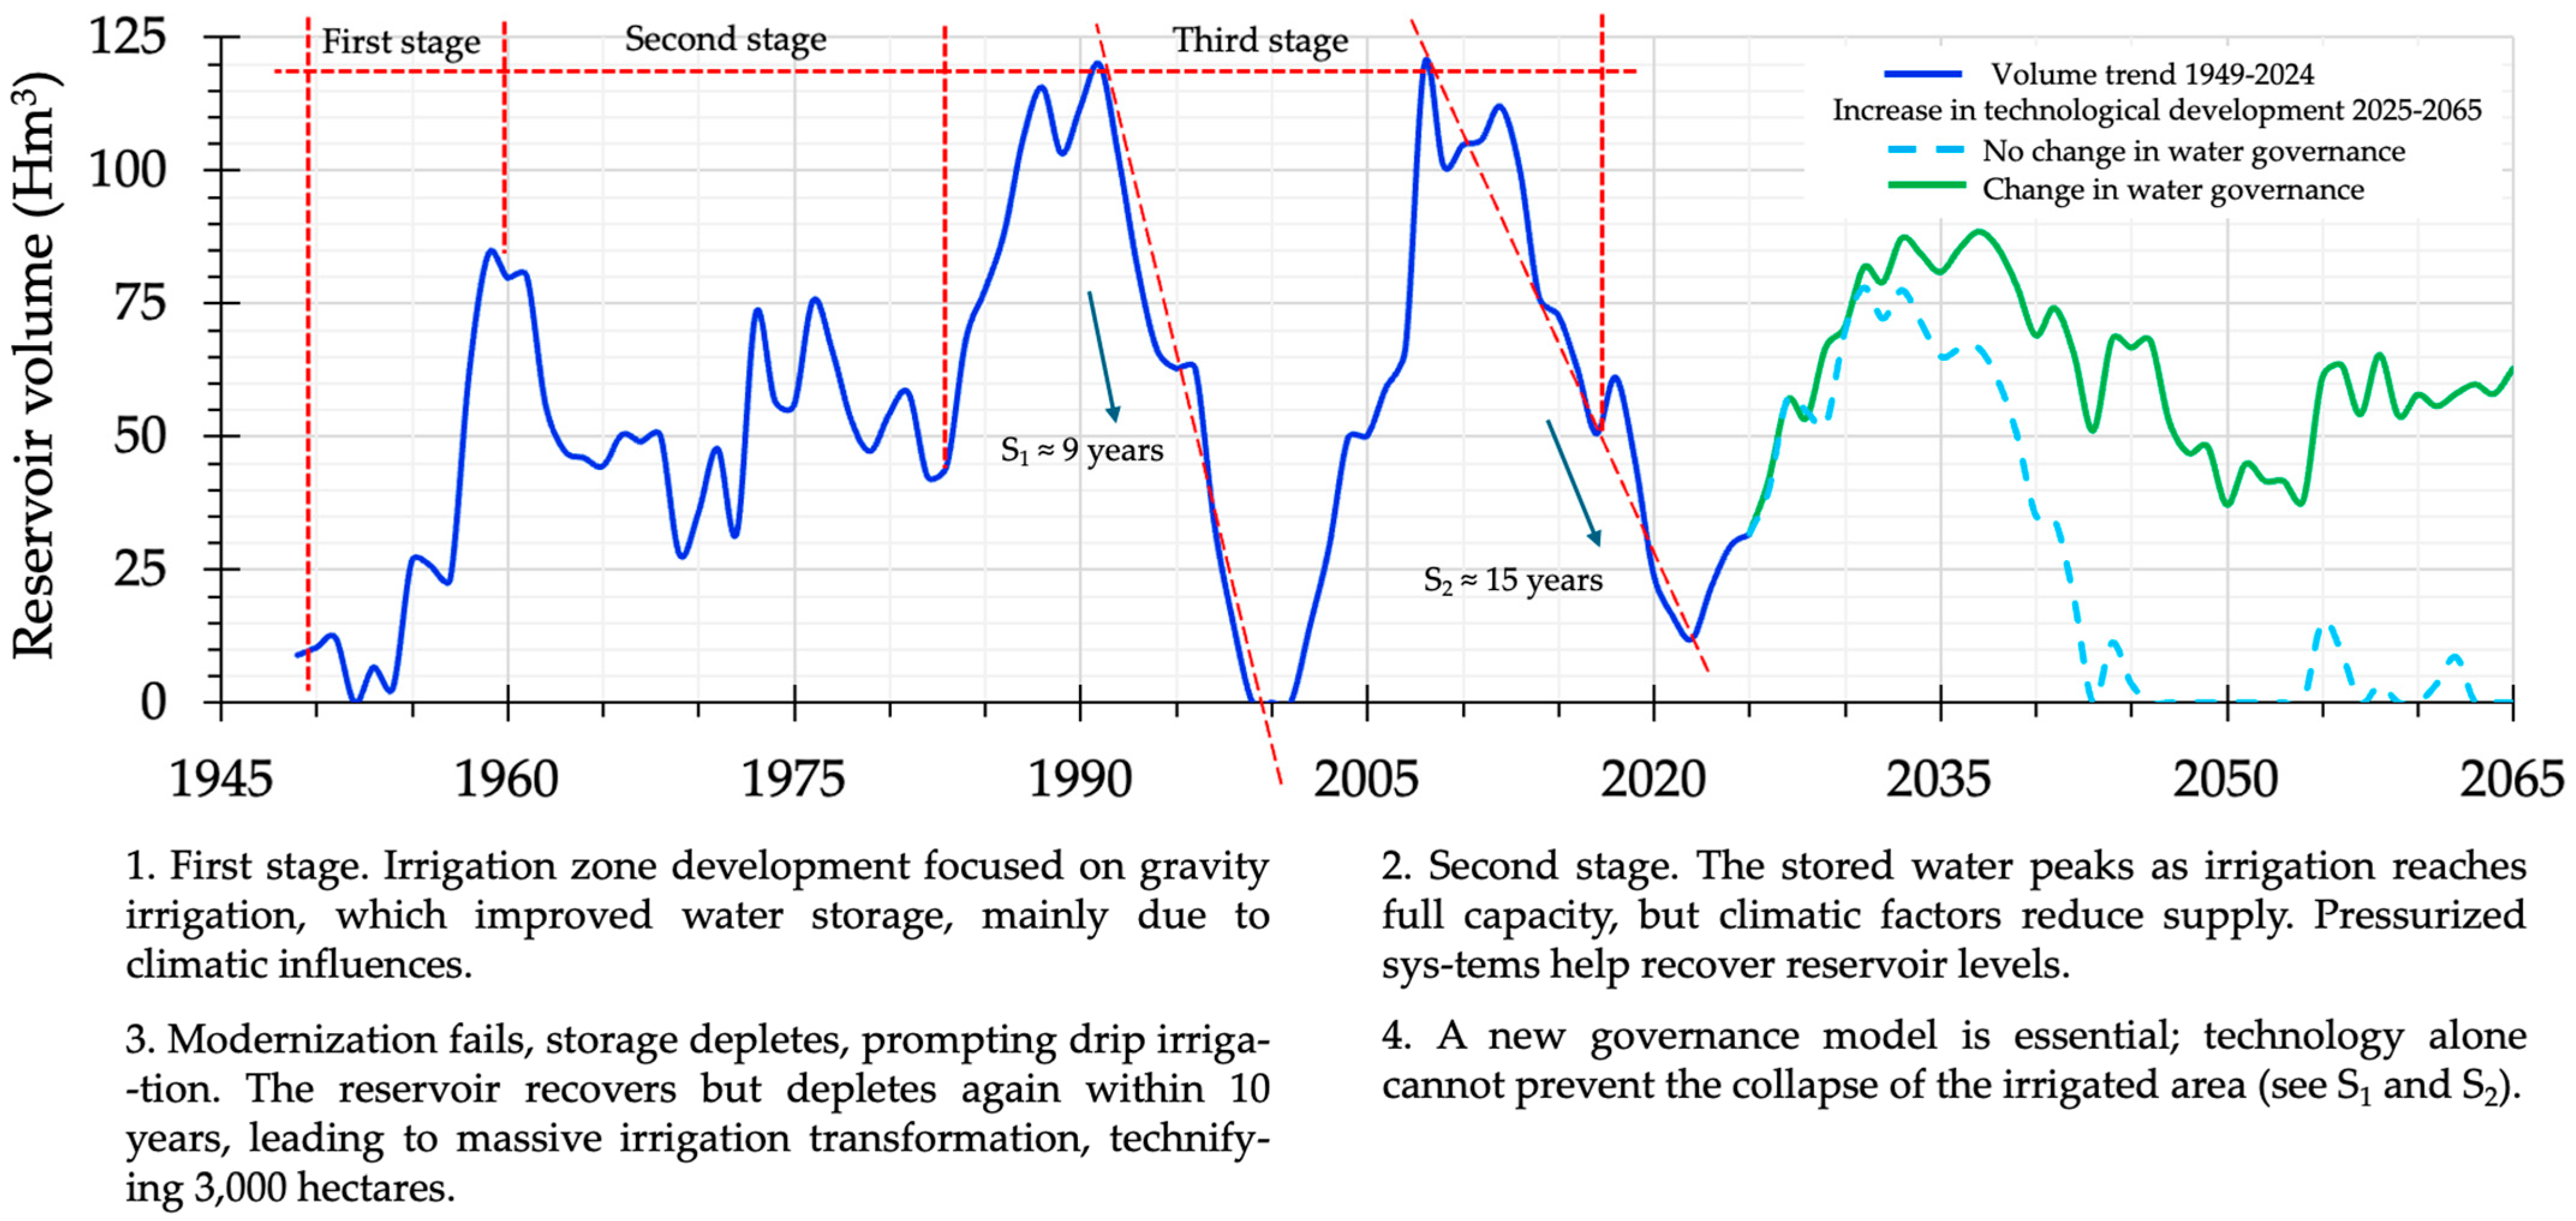
4.1. Modernization of Irrigation Modules: Climate Adaptation and Agricultural Sustainability

Zacatecas’ distinct rainfall patterns pose challenges across its three primary irrigation modules. JA irrigation module receives an annual average of 535.5 mm of rainfall, but precipitation variability exacerbates soil erosion and necessitates costly infrastructure repairs. While MA irrigation module experiences greater annual rainfall (714.4 mm) but high variability, alternating between drought-induced planting disruptions and waterlogging from heavy rains. LR irrigation module, with an annual average of 417.6 mm, relies on high-salinity water from the Leobardo Reynoso dam, further limiting viable crop options. Maize cultivation, spanning 1985 hectares, is deeply embedded in the region’s agricultural tradition but places significant pressure on water resources due to application between seven and nine cubic decameter of water per hectare [71], exceeding by far, crops such as tomatoes, beans, or oats. Recent diversification strategies, including intercropping with drought-resistant species like sorghum and beans in MA irrigation module, have reduced water use by 15% and improved soil fertility through nitrogen fixation.
Pressurized irrigation technologies, including drip and sprinkler systems, have replaced traditional open canals, reducing water losses by 30–35% [72,73]. Hydraulic modeling through EPANET has improved water delivery uniformity by 15% and reduced losses by 20% at waterworks distribution networks. Irrigation efficiency in JA irrigation module has increased to 70%, stabilizing maize and alfalfa production. MA irrigation module has achieved 70.4% efficiency, mitigating climatic variability impacts. The LR irrigation module has been shown to exhibit an 80% efficiency rate, a notable achievement attributed to its fully pressurized pipeline network. However, the region’s groundwater sources continue to be a significant concern, as the withdrawal rate has surpassed the natural recharge rate. This has led to a decline in the water supply potential of the aquifers in the area. These advancements have yielded substantial socio-economic and environmental benefits, increasing farmers’ incomes by 40% through high-value crops such as tomatoes, peppers, and avocados [74,75].

4.2. Integration of Traditional and Modern Practices

Hybrid approaches that blend modern irrigation technologies with traditional agricultural practices have emerged as a critical strategy for enhancing resilience and sustainability. Drip and sprinkler systems, which deliver precise amounts of water directly to crop root zones, are complemented by holistic practices such as rainwater harvesting, contour farming, mulching, cropping pattern rotation, basic food basket crops with regional climate resilience [76]. In MA irrigation module, these hybrid approaches have increased water retention by 25.0% and boosted crop yields by 20.0%. The FAO’s 2021 [1] report highlights the role of these systems in improving soil health, enhancing water-use efficiency, and reducing vulnerability to climate change. Similarly, IWMI [77] has identified hybrid systems as instrumental in achieving sustainable agricultural development in semi-arid regions.
Despite its successes, the modernization of irrigation in Zacatecas faces persistent challenges. The high cost of pressurized irrigation—ranging from $1200 to $2500 per hectare—remains a major challenge, especially for small farmers. From now on, irrigation modules will have to restructure their governance models since in critical dry years they will have to be subject to volumes below their annual concession. The LR irrigation module—equal for JA and MA irrigation modules—in low-water periods will have to agree to use less than 50% of the total annual volume, establishing low-profitability crops, which contrasts with production costs of irrigation systems that maintain a large percentage of irrigated land. A paradigm shift will have to emerge in the coming years: during dry seasons, the profitability of land should be distributed among those who are willing to cede their volume to those with perennial or fruit crops or to those who grow agricultural products with higher consumption than that established for a specific year. The cost of climatic anomalies should be borne by all users, and the benefit should be distributed equitably, and that will only be feasible to the extent that it is established in prevailing regulations in each case.
Expanding financial support through subsidies, low-interest loans, and cooperative funding is crucial. Training programs are also needed to help farmers operate and maintain these systems effectively. To ensure sustainability, policies should encourage renewable energy use and crop diversification while minimizing carbon emissions. Long-term success will also depend on financial reforms and better infrastructure maintenance. The modernization of irrigation systems by addressing inefficiencies, enhancing resilience, and fostering sustainability, illustrates the transformative potential of targeted investments in technology and governance. Continued investment in capacity building, environmental stewardship, and inclusive policies will be essential to consolidating these gains and achieving long-term agricultural sustainability.

5. Conclusions

This study evaluated the impact of irrigation modernization on small-scale agriculture in Zacatecas, Mexico, highlighting the challenges posed by water scarcity and climate variability. The integration of modern irrigation technologies with traditional water management practices significantly enhances water-use efficiency and agricultural resilience. The transition from open canal systems to pressurized irrigation networks has resulted in substantial improvements in water distribution and application efficiency, particularly in the Leobardo Reynoso (LR) module, where efficiencies reached 87.5%.
The analysis of long-term climatic trends revealed increasing temperature and precipitation variability, indicating that future irrigation demands for staple crops like maize and pastures are likely to increase. Modeling projections also highlighted the rising evapotranspiration rates, which further emphasize the need for adaptive, climate-responsive irrigation strategies that align with the evolving environmental conditions. Additionally, hydraulic and crop modeling analyses confirmed the significant gains in efficiency with the implementation of modern irrigation systems. The results demonstrated that pressurized irrigation systems substantially outperformed traditional gravity-based systems, reducing water losses and optimizing the allocation of resources. These models provided valuable insights into the potential improvements in water-use efficiency under different climate scenarios and confirmed the effectiveness of the proposed strategies for addressing water scarcity.
Despite these advancements, challenges remain, particularly related to financial constraints and infrastructure limitations. Modernizing irrigation systems must go beyond infrastructure improvements and include expanded institutional support, policy reforms, and financial incentives. Furthermore, equitable water distribution during dry periods will require collaborative governance models to ensure sustainability and economic viability for smallholder farmers. Looking ahead, further research should focus on optimizing hybrid irrigation systems that integrate modern technologies with traditional water management practices. Long-term studies on the socio-economic and environmental impacts of irrigation modernization will also be crucial for guiding policy and investment decisions. As irrigation systems reach their full capacity, especially for smaller farmers, embracing cooperative management and traditional practices will be essential to reduce production costs and sustain agricultural productivity, particularly in dry years.
Overall, this study reinforces the importance of continued investment in irrigation modernization, supported by modeling results that validate the proposed water conservation strategies. The integration of infrastructure upgrades, policy reforms, and community engagement will be key to ensuring the long-term sustainability of agricultural production in Zacatecas, particularly in the face of increasing water scarcity and climate variability.

Author Contributions

Conceptualization, C.B.-C. and H.P.-M.; methodology, C.B.-C. and H.P.-M.; software, L.A.F.-C.; validation, C.B.-C. and H.P.-M.; formal analysis, C.B.-C., H.P.-M. and L.F.P.-M.; investigation, C.B.-C., H.P.-M., L.A.F.-C. and L.F.P.-M.; writing—original draft preparation, C.B.-C. and H.P.-M.; writing—review and editing, L.F.P.-M.; visualization, L.A.F.-C.; supervision, C.B.-C., H.P.-M., L.A.F.-C. and L.F.P.-M. All authors have read and agreed to the published version of the manuscript.

Funding

This research received no external funding.

Data Availability Statement

Major data sets were obtained of Mexican agencies; in this sense historical records and time series were analyzed considering raw data downloaded from follow web sites. 1. https://smn.conagua.gob.mx/es/climatologia/informacion-climatologica/informacion-estadistica-climatologica (accessed on 18 September 2024), 2. https://sinav30.conagua.gob.mx:8080/SINA/?opcion=repda (accessed on 10 June 2024), 3. https://www.inegi.org.mx/default.html (accessed on 28 January 2025), 4. https://datos.gob.mx/ (accessed on 12 November 2024), 5. https://sih.conagua.gob.mx/ (accessed on 25 March 2024), 6. https://www.dof.gob.mx/#gsc.tab=0 (accessed on 14 September 2024) www.dof.gob.mx/index.php#gsc.tab=0. Besides, information from https://dataspace.copernicus.eu/ (accessed on 18 September 2024) was used in the study.

Acknowledgments

The authors acknowledge to Universidad Autónoma de Zacatecas «Francisco García Salinas» for extensive and unrestricted support for spending part of their contrac ted time with such institution to carry out the research.

Conflicts of Interest

The authors declare no conflicts of interest.

References

  1. Food and Agriculture Organization (FAO). The State of Food and Agriculture 2021. In Food and Agriculture Organization of the United Nations; Food and Agriculture Organization (FAO): Rome, Italy, 2021. [Google Scholar]
  2. Rockström, J.; Barron, J.; Fox, P. Water productivity in rain-fed agriculture: Challenges and opportunities for small-holder farmers in drought-prone tropical agroecosystems. Water Resour. Manag. 2007, 21, 43–56. [Google Scholar]
  3. Carr, E.R.; Fleming, G.; Kalala, T. Understanding women’s access to agricultural extensions services in Zambia: Opportunities and barriers. J. Rural Stud. 2019, 71, 49–58. [Google Scholar]
  4. Altieri, M.A.; Nicholls, C.I.; Montalba, R. Technological approaches to sustainable agriculture at a crossroads: An agroecological perspective. Sustainability 2015, 7, 4518–4526. [Google Scholar] [CrossRef]
  5. UN-Water. The United Nations World Water Development Report 2021: Valuing Water; United Nations: San Francisco, CA, USA, 2021. [Google Scholar]
  6. Intergovernmental Panel on Climate Change (IPCC). Climate Change 2021: The Physical Science Basis; Intergovernmental Panel on Climate Change: Geneva, Switzerland, 2021. [Google Scholar]
  7. Lal, R. Enhancing crop yields in the developing world through soil organic carbon sequestration. Adv. Agron. 2013, 118, 155–176. [Google Scholar]
  8. Adhikari, U.; Nejadhashemi, A.P.; Woznicki, S.A. Climate change and eastern Africa: A review of impact on major crops. Food Energy Secur. 2015, 4, 110–132. [Google Scholar] [CrossRef]
  9. Abhilash, P.C.; Dubey, R.K.; Tripathi, V.; Gupta, V.K.; Singh, H.B. Plant growth-promoting microorganisms for environmental sustainability. Trends Biotechnol. 2016, 34, 847–850. [Google Scholar] [CrossRef]
  10. Ward, F.A.; Pulido-Velazquez, M. Water conservation in irrigation can increase water use. Proc. Natl. Acad. Sci. USA 2008, 105, 18215–18220. [Google Scholar] [CrossRef]
  11. Lybbert, T.J.; Sumner, D.A. Agricultural technologies for climate change adaptation in developing countries: Policy options for innovation and technology diffusion. Food Policy 2012, 37, 114–123. [Google Scholar] [CrossRef]
  12. Bouman, B.A.M. Water productivity in rainfed agriculture. Irrig. Sci. 2007, 25, 181–196. [Google Scholar]
  13. Van Der Ploeg, M.J.; Gooren, H.P.; de Rooij, G.H. Innovative approaches to enhance water productivity in small-holder agriculture. Hydrol. Earth Syst. Sci. 2020, 24, 1051–1062. [Google Scholar]
  14. Meinzen-Dick, R. Property rights and sustainable irrigation: A developing country perspective. Agric. Water Manag. 2014, 145, 23–31. [Google Scholar] [CrossRef]
  15. Giordano, M. and de Fraiture, C. 2014. Small private irrigation: Enhancing benefits and managing trade-offs. Agric. Water Manag. 2014, 131, 175–182. [Google Scholar]
  16. Namara, R.E.; Upadhyay, B.; Nagar, R.K. Adoption and impacts of micro-irrigation technologies: Empirical results from India. Irrig. Sci. 2010, 31, 693–705. [Google Scholar]
  17. Servicio Meteorológico Nacional (SMN). Información Estadística Climatológica; Comisión Nacional del Agua, Gobierno de México: Ciudad de México, Mexico, 2024. [Google Scholar]
  18. Campos-Aranda, D.F. Búsqueda de tendencias en la precipitación anual del estado de Zacatecas, México; en 30 registros con más de 50 años. Ing. Investig. Tecnol. 2015, 16, 355–368. [Google Scholar]
  19. Yozgatligil, C.; Aslan, S.; Iyigün, C.; Batmaz, İ. Comparison of missing value imputation methods in time series: The case of Turkish meteorological data. In Theoretical and Applied Climatology; Springer: Berlin/Heidelberg, Germany, 2013. [Google Scholar] [CrossRef]
  20. Mair, A.; Fares, A. Comparison of rainfall interpolation methods in a mountainous region of a tropical island. J. Hydrol. Eng. 2011, 16, 371–383. [Google Scholar]
  21. Vicente-Serrano, S.; Saz-Sánchez, M.; Cuadrat, J. Comparative analysis of interpolation methods in the middle Ebro Valley (Spain): Application to annual precipitation and temperature. Clim. Res. 2003, 24, 161–180. [Google Scholar]
  22. Di Piazza, A.; Lo Conti, F.; Noto, L.V.; Viola, F.; La Loggia, G. Comparative analysis of different techniques for spatial interpolation of rainfall data to create a serially complete monthly time series of precipitation for Sicily, Italy. Int. J. Appl. Earth Obs. Geoinf. 2011, 13, 396–408. [Google Scholar]
  23. García-Vera, M.A.; Abaurrea, J.; Asín-Lafuente, J.; Centelles-Nogués, A. Evolución de las precipitaciones en la cuenca del Ebro: Caracterización espacial y análisis de tendencias. In VII Reunión Nacional de Climatología; Grupo de Clima de la Asociación de Geógrafos Españoles: Albarracín, Spain, 2002. [Google Scholar]
  24. Wilks, D.S. Indices of Rank Histogram Flatness and Their Sampling Properties. Am. Meteorol. Soc. Mon. Weather Rev. 2019, 17, 763–769. [Google Scholar]
  25. Hashemi, M.; Peralta, R.C.; Yost, M. Balancing Results from AI-Based Geostatistics versus Fuzzy Inference by Game Theory Bargaining to Improve a Groundwater Monitoring Network. Mach. Learn. Knowl. Extr. 2024, 6, 1871–1893. [Google Scholar] [CrossRef]
  26. Mann, H.B. Nonparametric tests against trend. Econom. J. Econom. Soc. 1945, 13, 245–259. [Google Scholar] [CrossRef]
  27. Kendall, M. Rank correlation measures. Charles Griffin 1975, 202, 15. [Google Scholar]
  28. Sen, P.K. Estimates of the regression coefficient based on Kendall’s tau. J. Am. Stat. Assoc. 1968, 63, 1379–1389. [Google Scholar]
  29. von Storch, H.; Navarra, A. Analysis of Climate Variability: Applications of Statistical Techniques, 2nd updated and extended ed.; Springer: Berlin/Heidelberg, Germany, 1999. [Google Scholar]
  30. Hamed, K.H.; Rao, A.R. A modified Mann–Kendall trend test for autocorrelated data. J. Hydrol. 1998, 204, 182–196. [Google Scholar]
  31. Yue, S.; Wang, C. The Mann–Kendall test modified by effective sample size to detect trend in serially correlated hydrological series. Water Resour. Manag. 2004, 18, 201–218. [Google Scholar]
  32. Pettitt, A.N. A non-parametric approach to the change-point problem. Appl. Stat. 1979, 28, 126–135. [Google Scholar]
  33. Alexandersson, H. A Homogeneity Test Applied to Precipitation Data. J. Climatol. 1986, 6, 661–675. [Google Scholar] [CrossRef]
  34. Buishand, T.A. Some Methods for Testing the Homogeneity of Rainfall Records. J. Hydrol. 1982, 58, 1127. [Google Scholar]
  35. von Neumann, J. Distribution of the Ratio of the Mean Square Successive Difference to the Variance. Ann. Math. Stat. 1941, 12, 367–395. [Google Scholar]
  36. Press, W.H.; Teukolsky, S.A.; Vetterling, W.T.; Flannery, B.P. Numerical Recipes: The Art of Scientific Computing, 3rd ed.; Cambridge University Press: Cambridge, UK, 2007. [Google Scholar]
  37. Box, G.E.; Jenkins, G.M.; Reinsel, G.C.; Ljung, G.M. Time Series Analysis: Forecasting and Control, 5th ed.; John Wiley & Sons: Hoboken, NJ, USA, 2015. [Google Scholar]
  38. Hyndman, R.J.; Athanasopoulos, G. Forecasting: Principles and Practice, 2nd ed.; OTexts: Melbourne, Australia, 2018. [Google Scholar]
  39. Pereira, L.S.; Alves, I. Crop Water Requirements. In Reference Module in Earth Systems and Environmental Sciences; Elsevier: Amsterdam, The Netherlands, 2013. [Google Scholar]
  40. Allen, R.G.; Pereira, L.S.; Raes, D.; Smith, M. Crop Evapotranspiration—Guidelines for Computing Crop Water Requirements. In Irrigation and Drainage, Paper No. 56; FAO: Rome, Italy, 1998. [Google Scholar]
  41. Surendran, U.; Sushanth, C.M.; Mammen, G.; Joseph, E.J. Modelling the Crop Water Requirement Using FAO-CROPWAT and Assessment of Water Resources for Sustainable Water Resource Management: A Case Study in Palakkad District of Humid Tropical Kerala, India. Aquat. Procedia 2015, 4 (Suppl. C), 1211–1219. [Google Scholar]
  42. Espinosa Espinosa, B.; Flores Magdaleno, H.; Ascencio Hernández, R.; Carrillo Flores, G. Diseño de un sistema de riego hidrante parcelario con los métodos por Turnos y Clement: Análisis técnico y económico. Terra Latinoam. 2016, 34, 431–440. [Google Scholar]
  43. Leal-Pinedo, A.; Domínguez-Hernández, F.; Morales-García, A. Aplicación del método de Clément en el diseño de un sistema de riego parcelario. Tecnol. Cienc. Agua 2016, 7, 431–445. [Google Scholar]
  44. Íñiguez-Covarrubias, M.; De León, M.B.; Prado, H.J.V.; Rendón, P.L. Análisis y comparación de tres métodos para determinar la capacidad de conducción de canales, aplicados en el distrito de riego La Begoña. Ing. Hidráulica 2007, XXII, 81–90. [Google Scholar]
  45. Abadía, R.; Ruiz, A.; Rocamora, M.C.; Puerto, H.; Andréu, J.; Pastor, J.J.; García, F.; Del Amor, M.A. Aplicación del método de Clément al cálculo de los caudales de línea en redes colectivas de distribución de agua a presión con servicio a la demanda modificada, para sistemas de riego por goteo. In Proceedings of the I Congreso Nacional de Ingeniería para la Agricultura y el Medio Rural, Valencia, Spain, 20 September 2001. [Google Scholar]
  46. Clement, R. Computation of flow in Irrigation Systems Operating ‘On Demand’. La Société du Canal de Provence et d’Aménagement de la Region Provencale; Le Tholonet, 13 December 1965; U.S. Bureau of Reclamation: Denver, CO, USA, 1979.
  47. Clemmens, A.J. Delivery System Schedules and Required Capacities. In Planning, Operation, Rehabilitation and Automation of Irrigation Water Delivery Systems: Symposium Proceedings; ASCE: New York, NY, USA, 1987. [Google Scholar]
  48. Christiansen, J.E. Irrigation by Sprinkling; University of California Agricultural Experiment Station: San Diego, CA, USA, 1942; Bulletin No. 670. [Google Scholar]
  49. Rossman, L.A. EPANET 2.0 User Manual; Water Supply and Water Resources Division, National Risk Management Laboratory, USEPA: Cincinnati, OH, USA, 2000.
  50. González-Trinidad, J.; Júnez-Ferreira, H.; Bautista-Capetillo, C.; Ávila, D.L.; Robles, R.C.O. Improving the water-use efficiency and the agricultural productivity: An application case in a modernized semiarid region in North-Central Mexico. Sustainability 2020, 12, 8122. [Google Scholar] [CrossRef]
  51. Organización Meteorológica Mundial (WMO). Los Indicadores del Cambio Climático Alcanzaron Niveles sin Precedentes en 2023; Organización Meteorológica Mundial: Geneva, Switzerland, 2024; Available online: https://wmo.int/es/news/media-centre/los-indicadores-del-cambio-climatico-alcanzaron-niveles-sin-precedentes-en-2023-omm (accessed on 14 February 2025).
  52. Ojeda-Bustamante, W.; Sifuentes-Ibarra, E.; Iñiguez-Covarrubias, M.; Montero-Martínez, M. Impacto del cambio climático en el desarrollo y requerimientos hídricos de los cultivos. Agrociencia 2011, 45, 1–11. [Google Scholar]
  53. Íñiguez-Covarrubias, M.; Ojeda-Bustamante, W.; Flores-Velázquez, J.; Díaz-Delgado, C. Planning of irrigation distribution, demand, and canal conduction capacity. Rev. Mex. Cienc. Agrícolas 2020, 11, 41–54. [Google Scholar]
  54. FAO. Water and Agriculture: Sustainability, Markets, and Policies; Food and Agriculture Organization: Rome, Italy, 2019. [Google Scholar]
  55. Döll, P. Impact of climate change and variability on irrigation requirements: A global perspective. Clim. Change 2002, 54, 269–293. [Google Scholar]
  56. Nourelahi, O.; Khaledian, M.; Kavoosi-Kalashami, M.; Pirmoradian, N. Factors affecting the adoption of collective pressurized irrigation systems. Environ. Dev. Sustain. 2022, 24, 12367–12386. [Google Scholar] [CrossRef]
  57. Phocaides, A. Handbook of Pressurized Irrigation Systems, 2nd ed.; Food and Agriculture Organization of the United Nations: Rome, Italy, 2007. [Google Scholar]
  58. Bolognesia, A.; Bragallia, C.; Lenzib, C.; Artina, S. Energy efficiency optimization in water distribution systems. Procedia Eng. 2014, 70, 181–190. [Google Scholar]
  59. Andrés, R.; Cuchí, J.A. Analysis of sprinkler irrigation management in the LASESA district, Monegros (Spain). Agric. Water Manag. 2014, 131, 95–107. [Google Scholar] [CrossRef]
  60. Fishman, R.; Giné, X.; Jacoby, H.G. Efficient irrigation and water conservation: Evidence from South India. In The Policy Research Working Paper Series; World Bank: Washington, DC, USA, 2023. [Google Scholar]
  61. Hufnagel, J.; Reckling, M.; Ewert, F. Diverse approaches to crop diversification in agricultural research. A review. Agron. Sustain. Dev. 2020, 40, 1–17. [Google Scholar] [CrossRef]
  62. Brumbelow, K.; Georgakakos, A. Consideration of climate variability and change in agricultural water resources planning. J. Water Resour. Plan. Manag. 2007, 133, 275–285. [Google Scholar]
  63. Buyukcangaz, H.; Demirtas, C.; Yazgan, S.; Korukcu, A. Efficient water use in agriculture in Turkey: The need for pressurized irrigation systems. Water Int. 2007, 32 (Suppl. 1), 776–785. [Google Scholar] [CrossRef]
  64. Hernández-Mendoza, J.; López-Martínez, A.; Ramírez-Gutiérrez, J. Inefficiencies in Traditional Irrigation Systems and Their Impact on Agricultural Productivity. Water 2020, 12, 1342. [Google Scholar] [CrossRef]
  65. Daccache, A.; Lamaddalena, N.; Fratino, U. Assessing pressure changes in an on-demand water distribution system on drip irrigation performance—Case study in Italy. J. Irrig. Drain. Eng. 2010, 136, 261–270. [Google Scholar] [CrossRef]
  66. Andrade, J.F.; Poggio, S.L.; Ermácora, M.; Satorre, E.H. Land use intensification in the Rolling Pampa, Argentina: Diversifying crop sequences to increase yields and resource use. Eur. J. Agron. 2017, 82, 1–10. [Google Scholar] [CrossRef]
  67. Alam, M.J.; Humphreys, E.; Sarkar, M.A.R.; Sudhir-Yadav. Intensification and diversification increase land and water productivity and profitability of rice-based cropping systems on the High Ganges River Floodplain of Bangladesh. Field Crops Res. 2017, 209, 10–26. [Google Scholar] [CrossRef]
  68. Torres, R.; Aguilar, J. The Role of Drip Irrigation in Reducing Water Demand in Arid Regions. Irrig. Sci. 2022, 40, 785–799. [Google Scholar]
  69. López, M.; García, R.; Pérez, A. Efficient Water Use through Modern Irrigation Systems in Mexico: A Case Study. Sustainability 2019, 11, 5438. [Google Scholar] [CrossRef]
  70. Ortega, L.; Fernández, C.; Gómez, P. Irrigation Modernization and Water Use Efficiency: A Review of Technological Advances. Agronomy 2018, 8, 226. [Google Scholar]
  71. Comisión Nacional del Agua (Conagua). National Water Management Report; Conagua: Mexico City, Mexico, 2021. [Google Scholar]
  72. García, P.; Martínez, F.; Ramírez, C. Climate Variability and Water Availability in Zacatecas: Implications for Agricultural Sustainability. Climate 2018, 6, 95. [Google Scholar] [CrossRef]
  73. Ortega, L.; Sánchez, M.; Domínguez, R. Water Consumption and Crop Selection in Semi-Arid Regions: A Comparative Analysis. Water 2021, 13, 1742. [Google Scholar]
  74. Clement, R.; Martínez, H.; López, G. Hydraulic Modeling and Optimization of Irrigation Networks Using EPANET. Water Resour. Manag. 2015, 29, 2421–2437. [Google Scholar]
  75. González-Prieto, J.; Fernández, A. Reducing Groundwater Extraction through Pressurized Irrigation Systems: A Case Study. Water Supply 2018, 18, 1290–1303. [Google Scholar] [CrossRef]
  76. Santos, F.; Ramírez, J. The Role of Sustainable Agriculture in Preventing Soil Degradation and Salinization. Land Degrad. Dev. 2016, 27, 1413–1421. [Google Scholar] [CrossRef]
  77. International Water Management Institute (IWMI). Water Productivity and Agricultural Sustainability in Drylands; IWMI: Colombo, Sri Lanka, 2020. [Google Scholar]
Figure 1. A sketch depiction of Leobardo Reynoso (LR), Julian Adame (JA) and Miguel Aleman (MA) irrigation module’s location.
Agronomy 15 00800 g001
Figure 2. Precipitation and temperature average evolution at LR, JA, and MA irrigation modules during 1961–2020 period.
Agronomy 15 00800 g002
Figure 3. Precipitation variability at LR, JA, and MA irrigation modules during 1961–2020. From left to right, Leobardo Reynoso, Julián Adame, and Miguel Alemán.
Agronomy 15 00800 g003
Figure 4. Dominant multiyear cycles for precipitation at LR, JA, and MA irrigation modules.
Agronomy 15 00800 g004
Figure 5. Yearly rainfall evolves for 1961–2020 period at LR, JA, and MA irrigation modules.
Agronomy 15 00800 g005
Figure 6. Precipitation (blue bars) and temperature regional (red polygon) anomalies for Leobardo Reynoso irrigation module. Red and blue dash lines are regressions for temperature and precipitation, respectively.
Agronomy 15 00800 g006
Figure 7. Schematic display of water conveyance network in Leobardo Reynoso irrigation module.
Agronomy 15 00800 g007
Figure 8. Reservoir volume evolution from 1949 to 2024, and projected from 2025 to 2065.
Agronomy 15 00800 g008
Table 1. Precipitation tendency into LR, MA, and JL irrigation modules for 1961–2020 period.
Irrigation ModuleWeather
Station
LatitudeLongitudeElevationMK TauSSLreg.Trend
(Degrees)(Degrees)(Masl)(mm Year−1)(mm Year−1)
Leobardo ReynosoCalera22.91−102.6620970.0500.3410.343Upward
Cañitas23.60−102.7320460.1390.2530.302
Fresnillo *23.17−102.8922010.1592.0051.905
El Sauz23.28−103.1120960.0210.4300.430
Sain Alto23.58−103.2620710.0710.8450.636
Santa Rosa *22.93−103.1122360.2021.4031.365
El Cazadero23.69−103.0918620.0680.7390.739
Julián AdameEl Chique22.00−102.8916480.0840.6971.002
Tayahua22.10−102.8717290.0280.4600.761
Villanueva22.36−102.8919350.0600.5840.633
Palomas22.35−102.8020250.0330.3280.719
Miguel AlemánExcamé21.65−103.341740−0.090−1.092−1.276Downward
La Villita21.60−103.341786−0.168−2.220−2.188
Casa Llanta22.06−103.361730−0.046−0.536−0.571
Tlaltenango21.77−103.311685−0.123−1.563−1.721
Teul21.47−103.461909−0.093−1.037−0.983
* Statistically Significant (p < 0.05).
Table 2. Minimum and maximum daily temperature statisticians for 1961–2020 period.
Irrigation ModuleTemperature Minimum (°C)Temperature Maximum (°C)
X ¯ SD X m i n m i n X m a x m i n X ¯ SD X m i n m a x X m a x m a x
Julián Adame8.65.4−16.022.526.84.32.041.0
Leobardo Reynoso8.35.2−13.021.526.44.5−2.042.0
Miguel Alemán10.15.1−10.523.527.44.9−1.045.0
Disclaimer/Publisher’s Note: The statements, opinions and data contained in all publications are solely those of the individual author(s) and contributor(s) and not of MDPI and/or the editor(s). MDPI and/or the editor(s) disclaim responsibility for any injury to people or property resulting from any ideas, methods, instructions or products referred to in the content.

