Article

Phosphorus Cycling Dominates Microbial Regulation of Synergistic Carbon, Nitrogen, and Phosphorus Gene Dynamics During Robinia pseudoacacia Restoration on the Loess Plateau

1
College of Life Sciences, Northwest Agriculture and Forestry University, Yangling 712100, China
2
State Key Laboratory of Loess Science, Institute of Earth Environment, Chinese Academy of Sciences, Xi’an 710061, China
3
College of Grassland and Grassland, Northwest Agriculture and Forestry University, Yangling 712100, China
*
Author to whom correspondence should be addressed.
These authors contributed equally to this work.
Agronomy 2025, 15(4), 797; https://doi.org/10.3390/agronomy15040797
Submission received: 9 February 2025 / Revised: 1 March 2025 / Accepted: 17 March 2025 / Published: 24 March 2025
(This article belongs to the Section Farming Sustainability)

Abstract

:
Carbon (C), nitrogen (N), and phosphorus (P) are key soil nutrients whose synergistic interactions regulate ecosystem nutrient cycling, yet the functional gene-level coordination and driving factors of these cycles remain poorly understood. This study addresses this gap by investigating the dynamic changes in C, N, and P cycling functional genes and their microbial and environmental drivers across Robinia pseudoacacia plantations of different restoration stages (10, 20, 30, and 40 years) on the Loess Plateau. We analyzed soil physicochemical properties and conducted metagenomic sequencing, redundancy analysis (RDA), and Partial Least Squares Structural Equation Modeling (PLS-SEM). Results showed that P-cycling functional genes, particularly pqqC and spoT, exhibited the highest network centrality, indicating their dominant role in regulating nutrient dynamics. Compared with farmland, STC, SOC, SAP, pH, and SWC significantly changed (p < 0.05) with restoration age, directly shaping key microbial groups such as Proteobacteria, Acidobacteria, Actinobacteria, and Chloroflexi. These microbial shifts were strongly correlated with the synergistic changes in C, N, and P functional gene abundance (p < 0.01). The findings highlight the central role of phosphorus-solubilizing genes in linking C, N, and P cycles and emphasize the microbial community responses to soil environmental changes as a key driver of nutrient cycling during ecological restoration. This study provides novel insights into microbial functional gene interactions and their ecological significance in soil nutrient dynamics, offering theoretical support for improving restoration strategies on the Loess Plateau.

1. Introduction

Carbon (C), nitrogen (N), and phosphorus (P) are key nutrient elements in soil, and their biogeochemical cycling regulates nutrient flows and ecosystem productivity. Furthermore, their synergistic interactions can substantially alter ecosystem nutrient use efficiency [1,2,3]. Soil microorganisms serve as the principal drivers of the terrestrial ecosystem C, N, and P cycles by encoding key enzymes involved in biogeochemical processes through the functional genes present in their genomes [4,5]. During ecological restoration, changes in the soil microenvironment, such as increased organic matter, changed structure, and altered pH, affect microbial communities [6,7,8]. These changes influence both the structure and function of microbial communities, leading to altered expression of C, N, and P functional genes [9,10]. Investigating the synergistic changes and driving factors of C, N, and P functional genes during ecological restoration can reveal how microorganisms regulate these genes to adapt to restoration environments, thereby providing both theoretical insights and practical guidance for improving restoration strategies.
Recent studies have shown that C, N, and P cycling in soil is not merely a series of independent processes; rather, these cycles interweave and interact closely, collectively driving nutrient cycling [11,12,13]. For example, nitrogen availability regulates topsoil carbon dynamics after permafrost thaw by altering microbial metabolic efficiency [14], and nitrogen enrichment stimulates rhizosphere C and P cycling genes by mediating plant biomass and root exudates [15]. Additionally, phosphorus limitation promotes soil carbon storage in nitrogen-fertilized boreal forests [16], and added inorganic or organic phosphorus boosts nitrogen and carbon fixation in the oligotrophic North Pacific [17]. Soil microorganisms, as the most active participants in nutrient cycling, drive and regulate the cycling processes of C, N, and P through the expression and regulation of their functional genes [18,19,20]. However, while the role of microorganisms in mediating C, N, and P cycling has been widely acknowledged [18,19,20], studies have predominantly focused on individual cycles. Research addressing the synergistic interactions among C, N, and P cycling functional genes remains scarce, particularly in the context of ecological restoration. This limits our ability to develop strategies that enhance nutrient cycling efficiency in degraded ecosystems.
The changes in soil C, N, and P functional genes are often the responses of microbial communities to environmental conditions [21]. For example, nitrifying bacteria activity decreases in acidic soils, reducing the expression of nitrification genes linked to the nitrogen cycle [15]. Long-term warming has been shown to affect the microbial expression of N cycling genes in grassland soils [22]. During ecological restoration, notable alterations in soil properties, such as increased organic matter and altered soil structure, reshape microbial habitats, and, consequently, influence the expression of functional genes [23]. Regarding the specific mechanisms behind the synergistic changes in soil C, N, and P functional genes, some studies have shown that increased soluble organic carbon in soil indirectly affects the abundance of nitrogen and phosphorus functional genes [24,25]. Other studies indicate that soil pH plays a critical role in regulating the assemblage of carbon-, nitrogen-, and phosphorus-related genes within soil profiles [8,26]. Additionally, the stoichiometric ratio of C:N:P largely determines the composition of microbial communities involved in soil nutrient cycling [18]. Despite these findings, current studies on the mechanisms of synergistic changes in functional genes during ecological restoration are limited and inconclusive. Investigating these changes and their drivers is essential for understanding soil nutrient cycling and the impacts of restoration on nutrient dynamics.
The Loess Plateau is one of the most ecologically fragile regions in China and globally, with its ecosystems severely challenged by soil erosion, land degradation, and climate change [27]. R. pseudoacacia, a tree species with strong stress resistance, has been widely used in ecological restoration projects in this region since the 1950s [28]. Extensive research has recently focused on soil nutrients and microbial communities during R. pseudoacacia restoration. For example, studies have shown that R. pseudoacacia, as a nitrogen-fixing plant, enhances soil organic matter, organic nitrogen, and inorganic nitrogen levels compared with grass vegetation [29]. It also increases microbial biomass carbon (MBC) and alkaline phosphatase activity while decreasing urease activity, though it does not affect dehydrogenase activity [30]. Additionally, R. pseudoacacia restoration has been shown to have a less pronounced effect on the dissimilarity of rare microbial communities compared with abundant taxa [31]. On the Loess Plateau, the C:N:P stoichiometry of soil microbes under R. pseudoacacia is nutrient-dependent rather than homeostatic [32]. However, changes in functional genes regulating soil C, N, and P cycles, along with the mechanisms driving these changes, remain relatively understudied. This study focuses on R. pseudoacacia stands of different restoration ages on the Loess Plateau, aiming to explore the dynamic changes in soil physicochemical properties and microbial composition as restoration progresses and how these changes influence the synergistic changes in C, N, and P cycling functional genes.
We hypothesize that C, N, and P functional genes exhibit significant synergistic changes during R. pseudoacacia restoration, primarily driven by key phosphorus-cycling genes due to their central role in linking the three cycles. These changes are expected to vary across restoration stages, influenced by soil physicochemical properties that shape the microbial community composition and functional gene expression at each stage. Furthermore, we expect that these synergistic changes are regulated by distinct environmental factors within each cycle (e.g., SOC and STC in the carbon cycle, STN in the nitrogen cycle, and SAP and pH in the phosphorus cycle), as well as by shared microbial drivers. To explore the driving factors of these synergistic changes, we integrate metagenomic sequencing with soil physicochemical analysis. This study assesses not only the relative abundance of key genes in C, N, and P cycling but also their expression and functionality across different restoration stages. Co-occurrence network analysis and redundancy analysis (RDA) are used to understand how soil properties shape gene dynamics, and Partial Least Squares Structural Equation Modeling (PLS-SEM) is employed to uncover causal relationships. Additionally, the metabolic pathways involved in carbon fixation, nitrogen mineralization, and phosphorus solubilization are investigated. This study seeks to clarify how soil microbial communities and soil factors collectively drive synergistic changes in C, N, and P cycling genes, providing theoretical support for ecological restoration and nutrient cycling in R. pseudoacacia plantations on the Loess Plateau.

2. Materials and Methods

2.1. Experimental Design and Sample Collection

The study area selected is in Ansai District, Yan’an City, Shaanxi Province, China (36°51′41″–36°52′50″ N, 109°19′49″–109°21′46″ E) (Figure S1), which is located in a warm temperate semi-arid continental monsoon climate zone, with an average altitude of 1371.9 m [33]. The region has an average annual rainfall of 505.3 mm and an average annual temperature of 8.8 °C [32]. This watershed, part of the hilly and gully region of the Loess Plateau, is characterized by loose soil with low erosion resistance, making it a typical loess erosion zone [34]. With the implementation of the Grain-for-Green Program, large-scale R. pseudoacacia plantations have been established in this area [35].
We selected R. pseudoacacia plantations aged 10 years (RP10), 20 years (RP20), 30 years (RP30), and 40 years (RP40) based on afforestation records and growth cone measurements. The determination of the restoration years of Robinia pseudoacacia and the selection of the plots were completed in July 2021. These ages represent distinct stages in ecological succession, capturing early (RP10), mid (RP20), late (RP30), and mature (RP40) restoration phases, which have been widely used in previous studies to assess soil and microbial dynamics during R. pseudoacacia restoration [34,35]. Farmland (FL) was selected as the control because it represents the dominant land use before afforestation and serves as a baseline for evaluating the impact of R. pseudoacacia restoration. Compared with sparse and fragmented natural vegetation, farmland provides a more standardized reference for assessing changes in soil properties, microbial communities, and functional genes.
For each plantation age, three independent replicate plots were established. Each plot contained three 20 m × 20 m subplots within which soil sampling was conducted. Soil samples were collected from the 0–10 cm layer, as this depth is the most biologically active zone, where microbial activity, organic matter decomposition, and root interactions are most pronounced [36]. Previous studies have demonstrated that this topsoil layer is highly responsive to ecological restoration, exhibiting significant changes in nutrient cycling and microbial dynamics. To account for spatial heterogeneity, soil sampling was conducted using an “S”-shaped pattern within each subplot, with 10 sampling points per subplot. To minimize the influence of terrain variability, plots were selected on slopes with similar aspects and gradients, avoiding extreme topographical variations. This approach ensures that observed differences in soil and microbial properties are primarily driven by restoration age rather than microtopography. The collected samples were thoroughly mixed and divided into two parts: one part was stored at −20 °C for metagenomic sequencing, and the other was air-dried after passing through a 2 mm sieve for soil physicochemical property analysis. The soil samples were collected in July 2022.
Soil water content (SWC) was determined by oven-drying the samples at 105 °C to a constant weight [37]. Soil bulk density (SBD) was calculated as the ratio of the soil mass to the total volume of the core (g·cm⁻3) after oven-drying at 105 °C to a constant weight [37]. Soil pH was measured using a pH meter (Model PHS-2, INESA Instrument, Shanghai, China) after shaking a soil–distilled water suspension (1:5 w/v) at 200 rpm for 30 min [38]. Soil temperature (ST) and clay content were determined using a laser particle size analyzer (Mastersizer 2000, Malvern Instruments, Malvern, UK), and the distribution of soil particles was analyzed by laser scattering [39]. Total soil organic carbon (STC) was measured by dry combustion using a TOC-TN analyzer (TOC-L CPH, Shimadzu Corp., Kyoto, Japan). Total nitrogen (STN) and total phosphorus (STP) concentrations were determined using a continuous flow analyzer (AA3; Norderstedt, Germany) following wet digestion with K₂SO₄·5H₂O (10:1 w/w)-H₂SO₄ and HClO₄-H₂SO₄, respectively [40]. Total dissolved nitrogen (TDN) was analyzed using a TOC-TN analyzer (TOC-L CPH, Shimadzu Corp., Kyoto, Japan) [41]. Ammonium nitrogen (NH₄+-N, SAN) and nitrate nitrogen (NO₃-N, SNN) were measured using a continuous flow analyzer (AA3; Norderstedt, Germany) after extracting fresh soil with 2 M KCl [42]. Dissolved organic nitrogen (DON) was calculated as the difference between TDN and inorganic nitrogen (NH₄+-N and NO₃-N) [34]. Soil available phosphorus (SAP) was extracted with ammonium lactate solution and determined by spectrophotometry and flame photometry [36]. The determination and analysis of these soil physicochemical properties were all carried out from November 2022 to January 2023.

2.2. DNA Extraction and Metagenomic Sequencing

DNA was extracted from 0.5 g of soil using the Power Soil DNA Isolation Kit (MO BIO Laboratories, Inc., Carlsbad, CA, USA), following the manufacturer’s instructions. DNA quality was assessed by measuring the concentration and purity using a NanoDrop spectrophotometer (Thermo Fisher Scientific, Waltham, MA, USA). DNA samples meeting the required quality standards were submitted to Shanghai Meiji Biotech for metagenomic sequencing. The sequencing process involved ultrasonic fragmentation (Covaris M220, Woburn, MA, USA) of the DNA to approximately 400 bp, followed by paired-end (PE) library construction, bridge PCR, and sequencing using the Illumina HiSeq 2500 platform. Raw sequencing data were processed and submitted to the National Center for Biotechnology Information (NCBI) (https://www.ncbi.nlm.nih.gov/, accessed on 27 November 2024) under the project accession number PRJNA1191551. The metagenomic sequencing was performed in October 2022.

2.3. Metagenomic Analysis

The raw sequencing data were initially processed using fastp (version 0.20.0) to filter out low-quality sequences. Sequences shorter than 50 bp, those with an average quality score below 20, and those containing ambiguous bases (denoted as “N”) were removed. The high-quality remaining reads were assembled into contigs using Megahit (version 1.1.2). Contigs longer than 300 bp were subjected to open reading frame (ORF) prediction using Prodigal (version 2.6), and only genes longer than 100 bp were retained for further analysis. These genes were translated into amino acid sequences. To reduce redundancy, the predicted gene sequences were clustered using CD-HIT (version 4.6.1) at a 95% identity and 90% coverage threshold to create a non-redundant gene set.
Gene abundance was determined by mapping cleaned reads from each sample back to the non-redundant gene set. The abundance was represented as the proportion of reads assigned to each gene. Functional annotation of these gene sets was performed by aligning them to the KEGG database using DIAMOND (version 0.8.35). Genes associated with key C, N, and P cycling pathways were specifically analyzed (see Table S2 in the Supplementary Materials for further details). Additionally, the non-redundant gene sets were compared with the NR database to obtain taxonomic information [43].

2.4. Statistical Analysis

All statistical analyses were conducted using R software (version 4.1.1, http://www.r-project.org/, accessed on 15 March 2023) and OriginLab (version 2021, https://www.originlab.com/, accessed on 22 January 2023). Prior to statistical tests, the Shapiro–Wilk test was used to assess data normality. If data did not meet normality assumptions, they were log-transformed before performing one-way ANOVA and Duncan’s multiple range test in OriginLab to determine significant differences in C, N, and P functional genes across restoration stages. Least squares linear regression was applied to soil STC, STN, STP, SOC, DON, and SAP data to determine the best-fit trend, and microbial composition was visualized using bar charts.
To explore the complex interactions among functional genes, weighted gene co-expression network analysis (WGCNA) was conducted using the “WGCNA” package in R. To minimize bias from sparse matrices, only genes with a relative abundance above 0.01% and detected in at least 50% of samples were included in the network analysis. Spearman correlation analysis was performed to identify robust associations between genes, with edges representing correlations above 0.7 (FDR-adjusted p < 0.01). The “igraph” package was used to calculate network topology attributes, including average connectivity, clustering coefficient, average path length, graph density, and modularity. The final network was visualized and edited in Gephi 0.10, and the top 30 C, N, and P functional genes based on centrality were displayed in a heatmap using the “pheatmap” package. To investigate the relationships between soil physicochemical properties and microbial functional genes, redundancy analysis (RDA) was performed using the “vegan” package in R. The first RDA assessed the influence of soil factors (STC, STN, STP, SOC, SAP, SWC, pH, and SBD) on C, N, and P functional gene abundance, while the second RDA analyzed how soil properties shape microbial community composition and diversity indices (Shannon index, Simpson index, and Pielou index). Finally, Partial Least Squares Structural Equation Modeling (PLS-SEM) was conducted using the “plspm” package to determine the direct and indirect effects of soil properties (e.g., STC, SOC, SAP, pH, and SWC) and microbial community attributes on the synergistic variation in C, N, and P functional genes. This model helped to quantify the causal pathways linking soil, microbes, and gene dynamics during R. pseudoacacia restoration.

3. Results

3.1. The Changes in Soil Physicochemical Properties and Nutrient Dynamics

Soil pH, SBD, and ST decreased substantially with increasing R. pseudoacacia restoration years, while clay increased (Table 1). Soil nutrient levels also changed significantly: STC and SOC increased notably with restoration age compared with FL (rising from 5.83 g kg−1 to 22.99 g kg−1 and from 49.85 mg kg−1 to 323.60 mg kg−1, respectively) (p < 0.01). STN and DON levels also increased, with STN rising from 0.28 g kg−1 to 1.06 g kg−1 and DON from 11.13 mg kg−1 to 46.86 mg kg−1 (p < 0.05). Although STP did not show a significant change (p > 0.05), SAP decreased overall. Linear regression analysis of nutrient element correlations (Figure S2) revealed a highly significant correlation between STC and STN (R2 = 0.864, p < 0.01) (Figure S2a); STN and STP also showed a significant correlation (R2 = 0.375, p < 0.05) (Figure S2c). Significant correlations were additionally observed between SOC and DON (Figure S2d), SAP and SOC (Figure S2e), and DON and SAP (Figure S2f) (R2 > 0.880, p < 0.01).

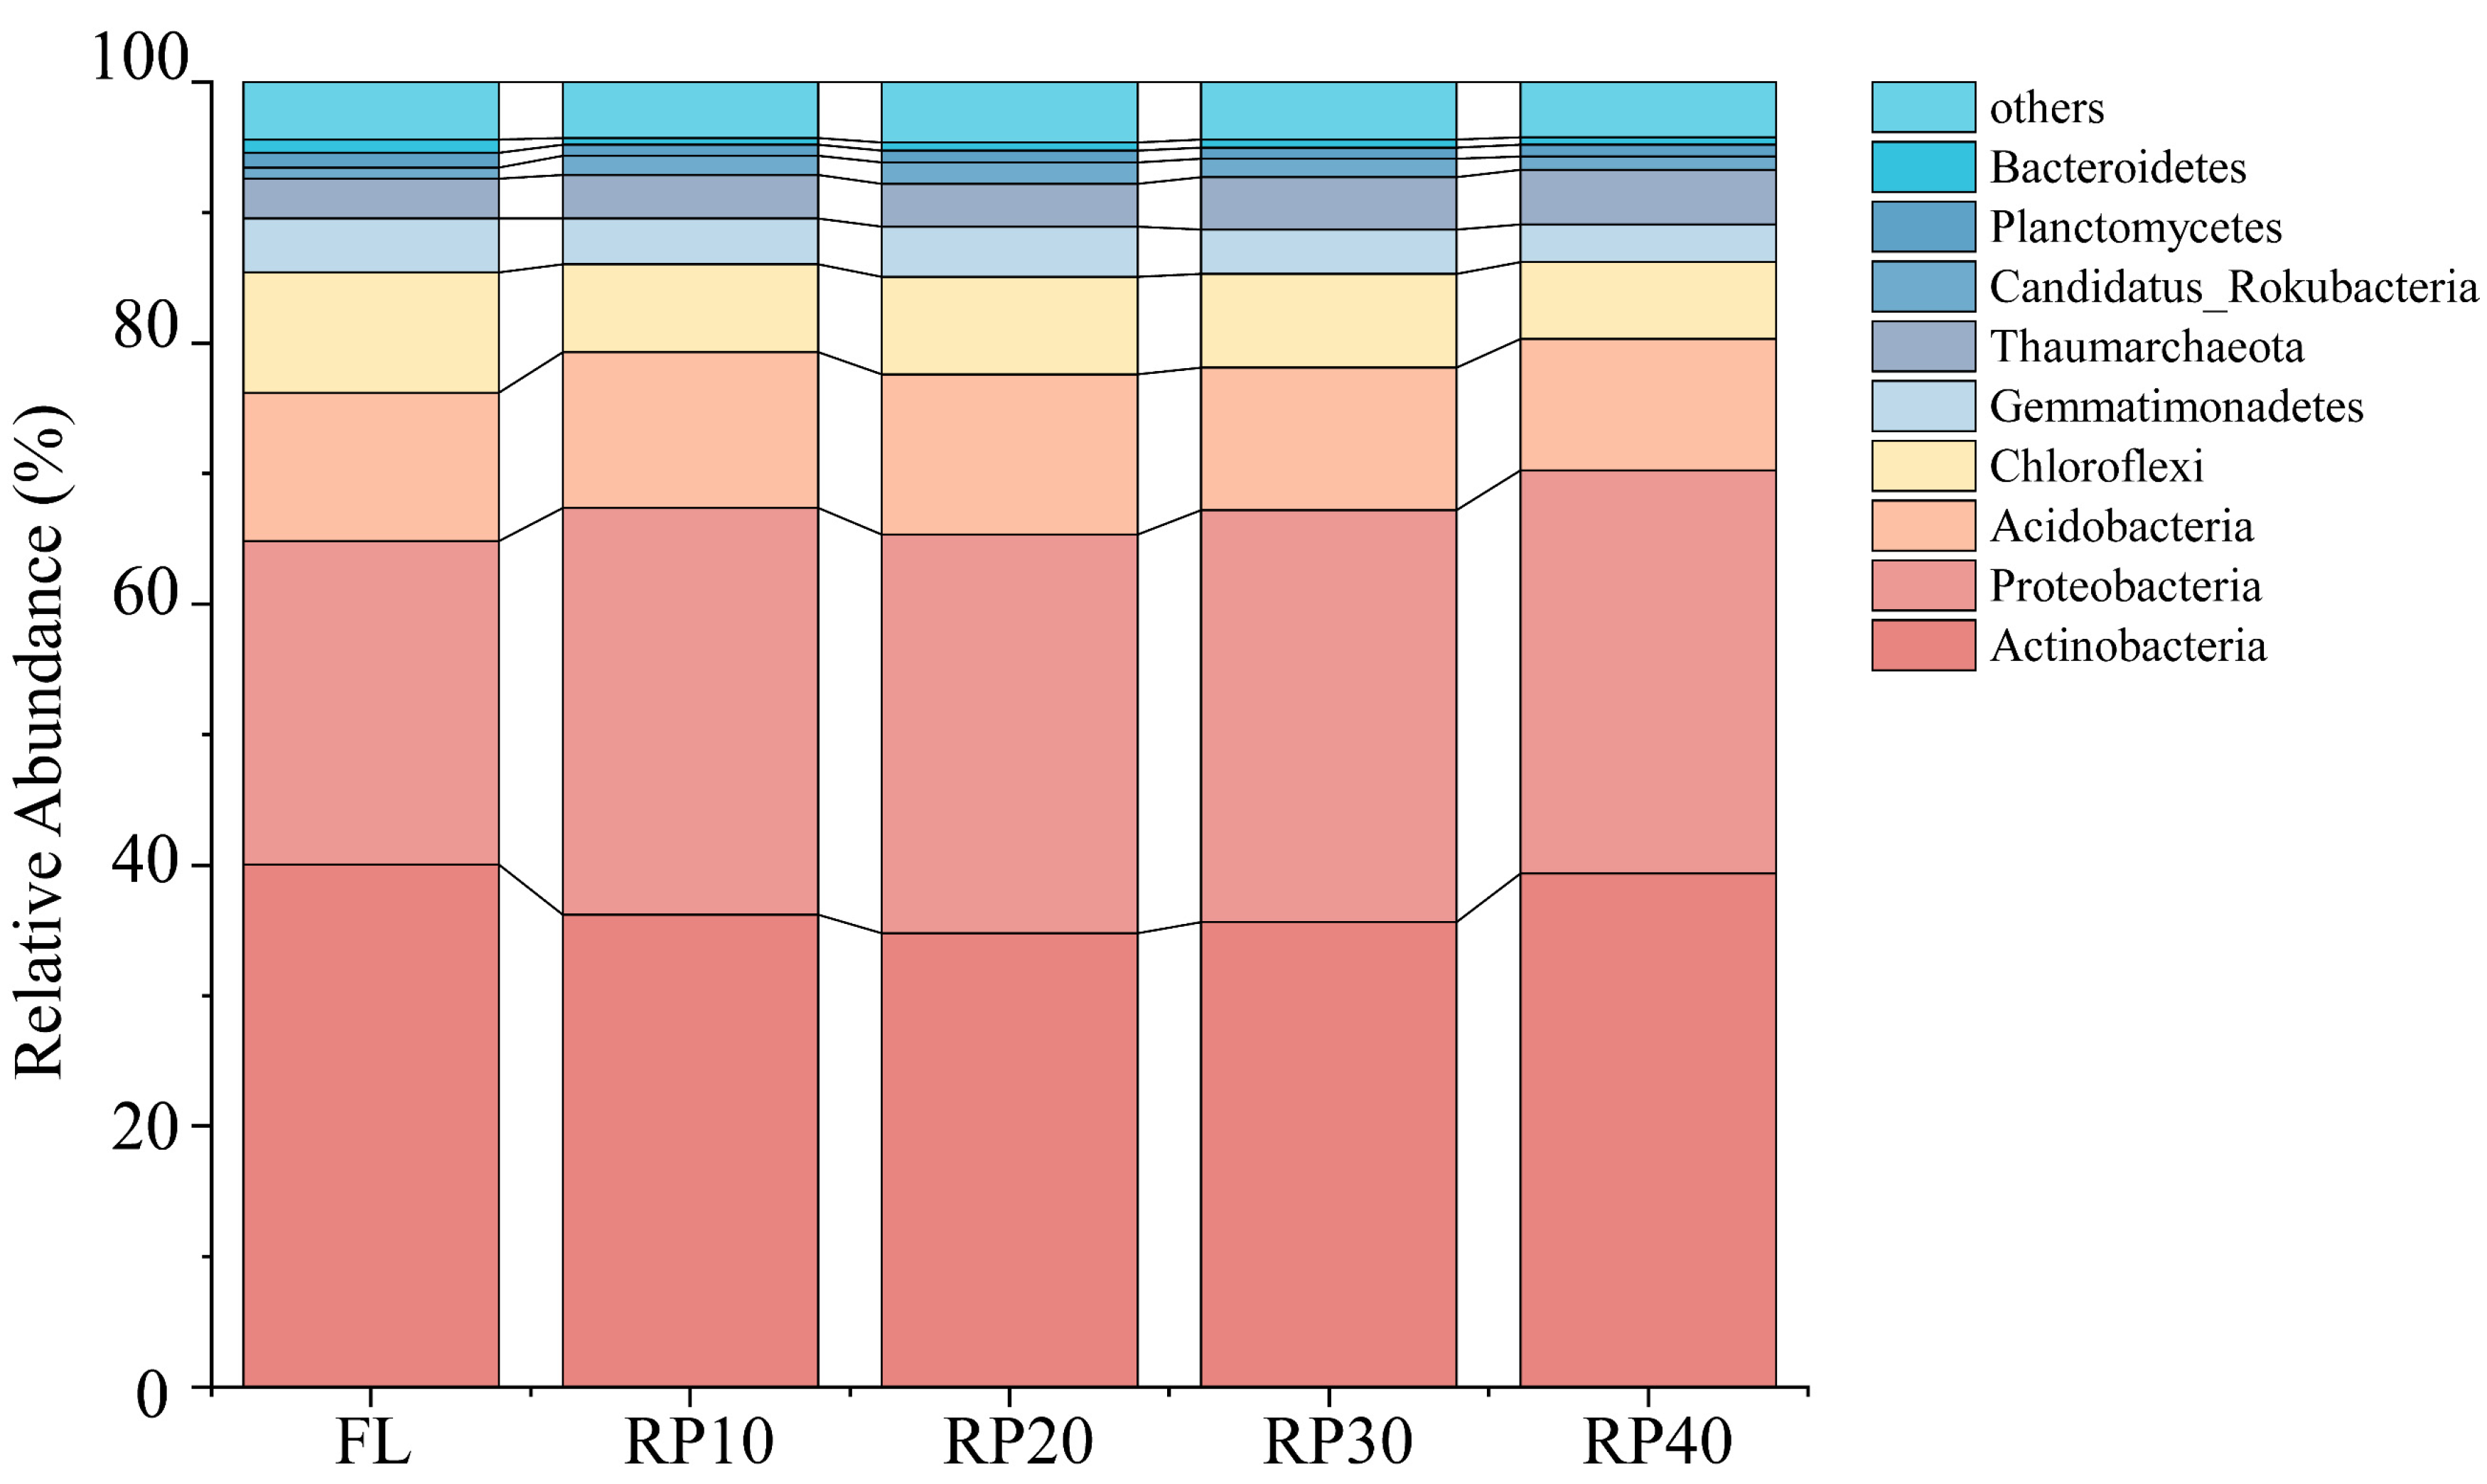
3.2. The Changes in Soil Microbial Composition

In addition to changes in soil properties, the microbial composition also exhibited significant shifts with increasing restoration years. A total of 29,565,266 genes were obtained from all samples, with annotations in the NR database covering 643 phyla and 32,051 species, and 8,188 KOs annotated in the KEGG database. At the phylum level, Actinobacteria was the most abundant across all plots (relative abundance > 35%), followed by Proteobacteria (>25%) and Acidobacteria (>10%) (Figure 1). Compared with FL, Actinobacteria abundance was lower in R. pseudoacacia plantations but increased with restoration age; Proteobacteria showed higher abundance in plantations than in FL, while Acidobacteria abundance did not vary significantly across the plots (p > 0.05).

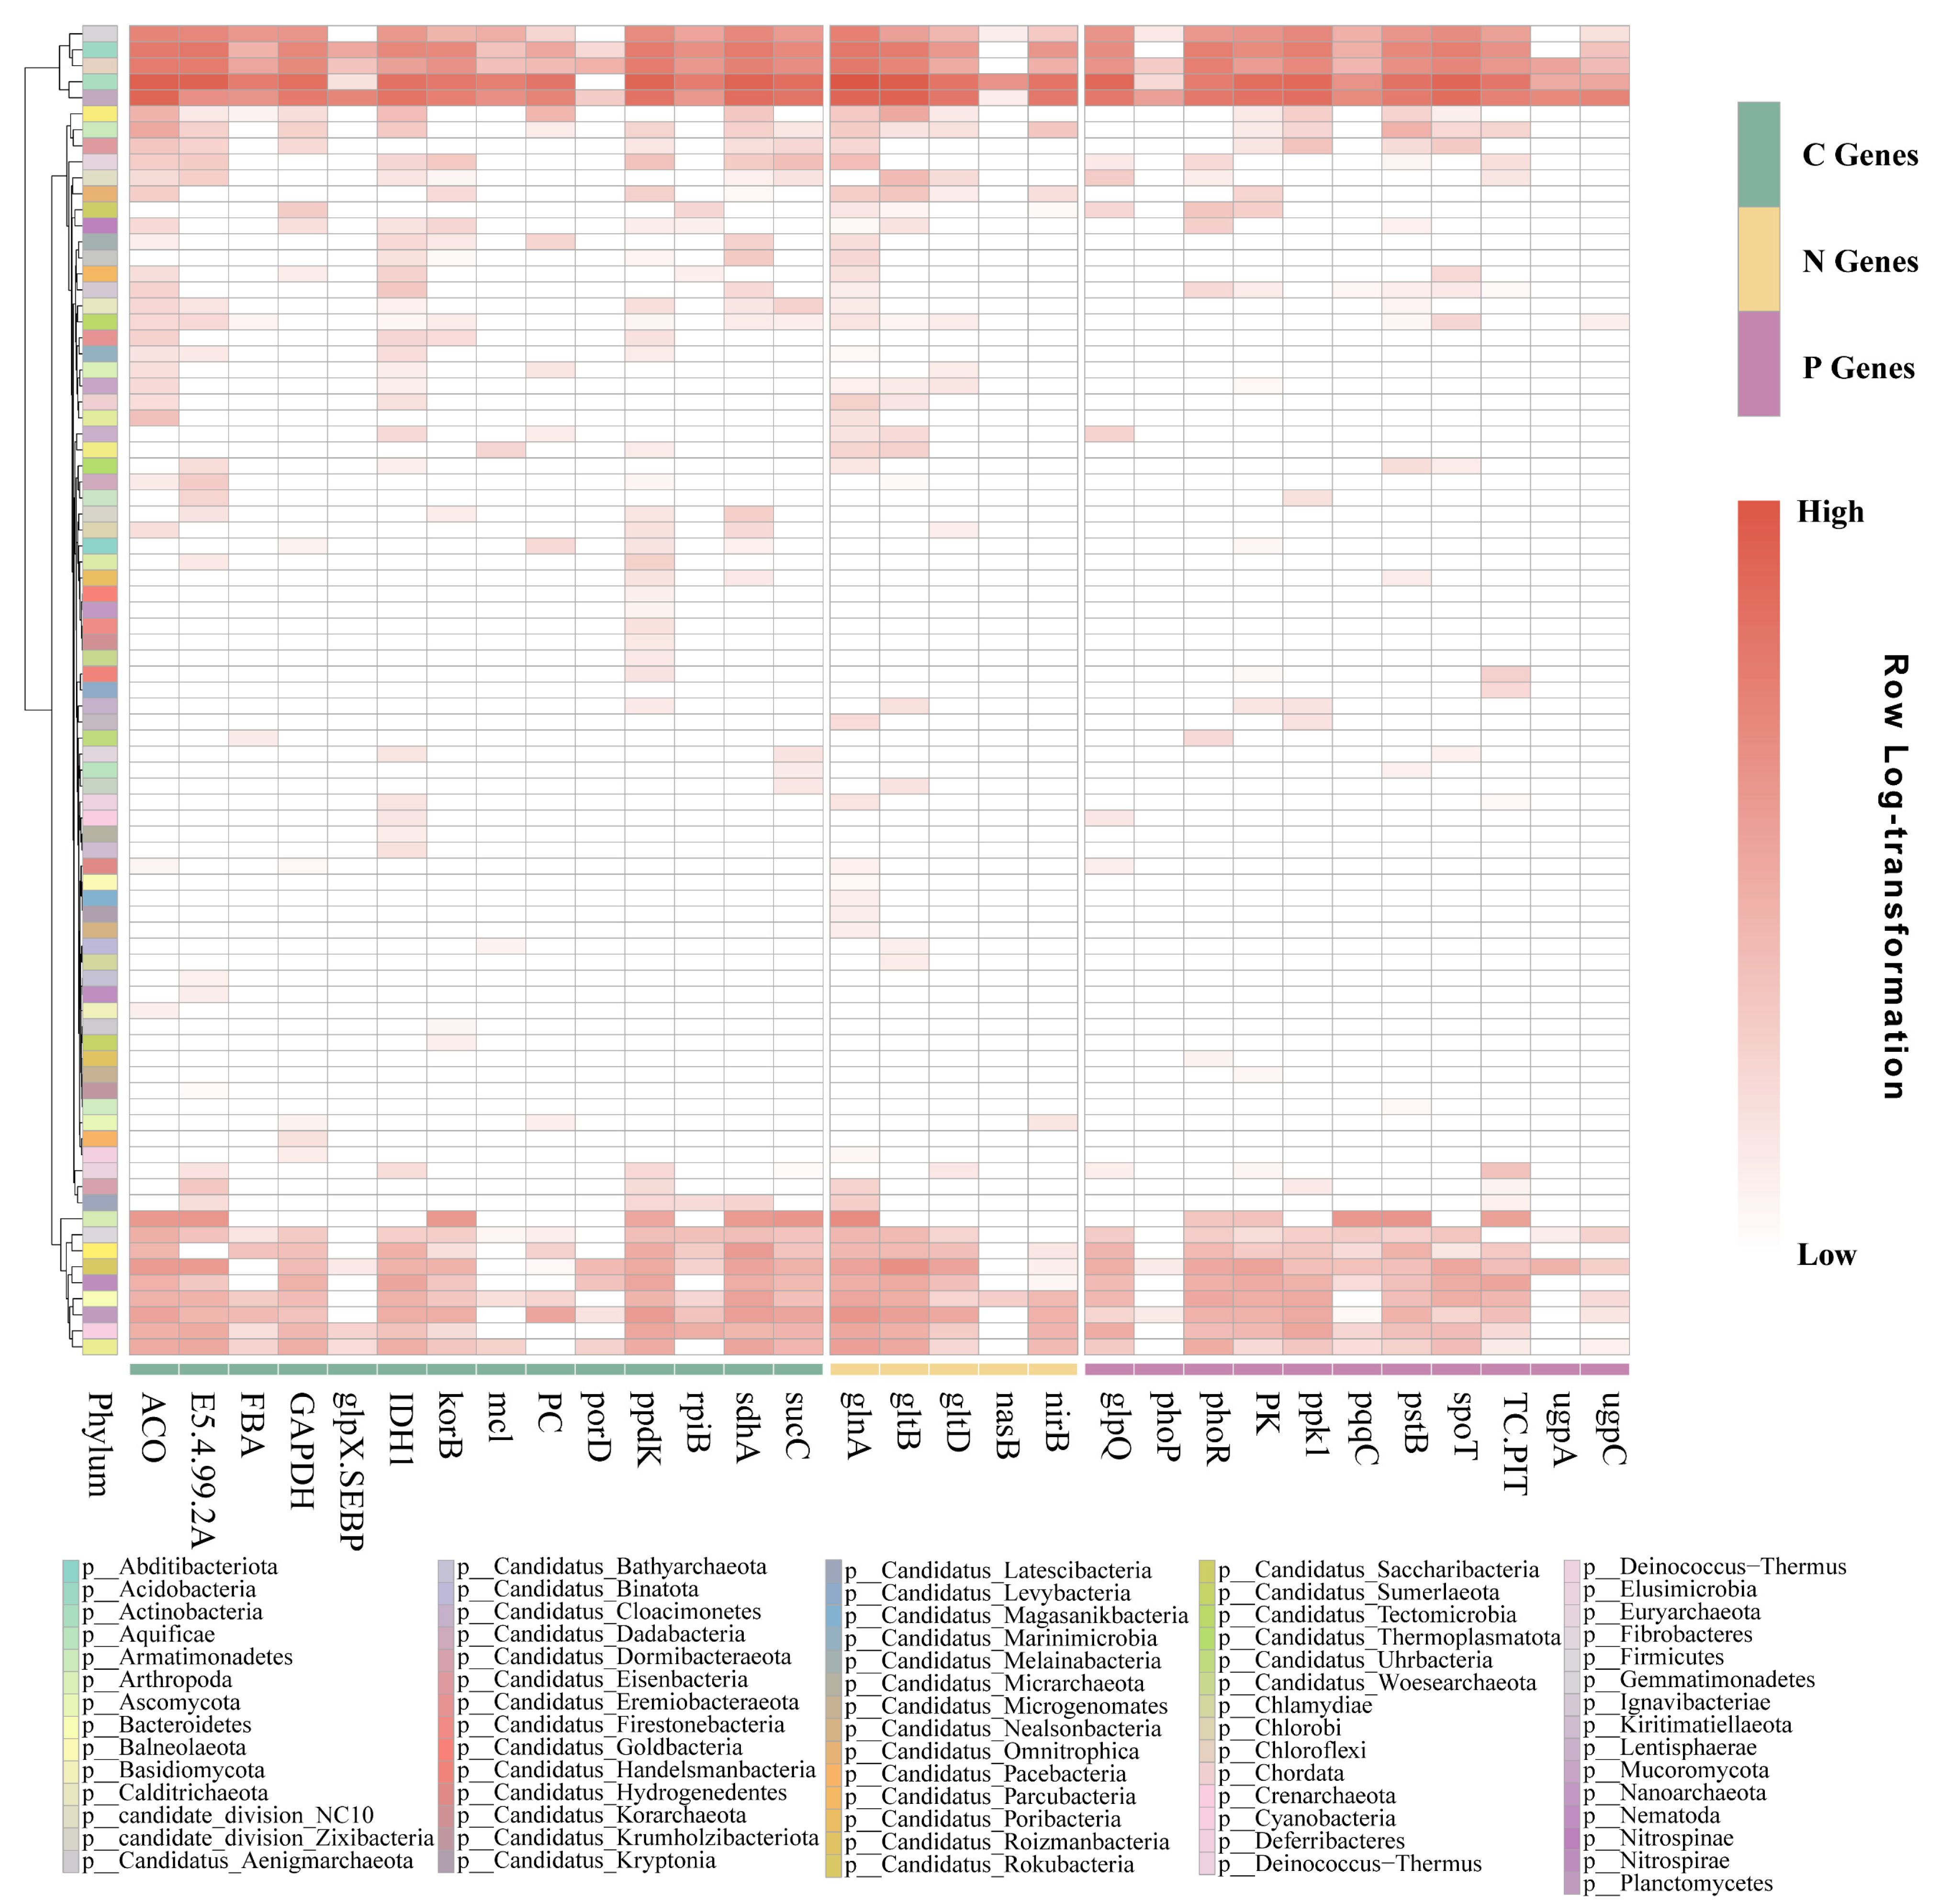
3.3. Co-Occurrence Network Analysis of C, N, and P Cycling Genes

To further understand the interactions among nutrient-cycling processes, we conducted a co-occurrence network analysis of genes involved in C, N, and P cycling. The co-occurrence network reveals the internal connections among genes involved in C, N, and P cycling processes (Figure 2a), featuring 72 nodes and 92 edges after K-core filtering. Among the top 30 genes by degree centrality, 14 are related to carbon cycling (PC, E5.4.99.2A, porD, ACO, korB, IDH1, FBA, sdhA, ppdK, GAPDH, rpiB, mcl, sucC, korA), 6 are associated with nitrogen cycling (nasB, gltD, nirB, glnA, glnB, NRT), and 10 are linked to phosphorus cycling (pqqC, spoT, TC.PIT, PK, pstB, ppk1, glpQ, phoR, phoP, ugpA) (Figure 2b). Genes with the highest centrality scores in the network are predominantly phosphorus-related, such as pqqC, spoT, TC.PIT, and PK. Of the top 30 genes by centrality, the majority are involved in carbon cycling, while nitrogen-related genes are the fewest and have relatively lower centrality scores.

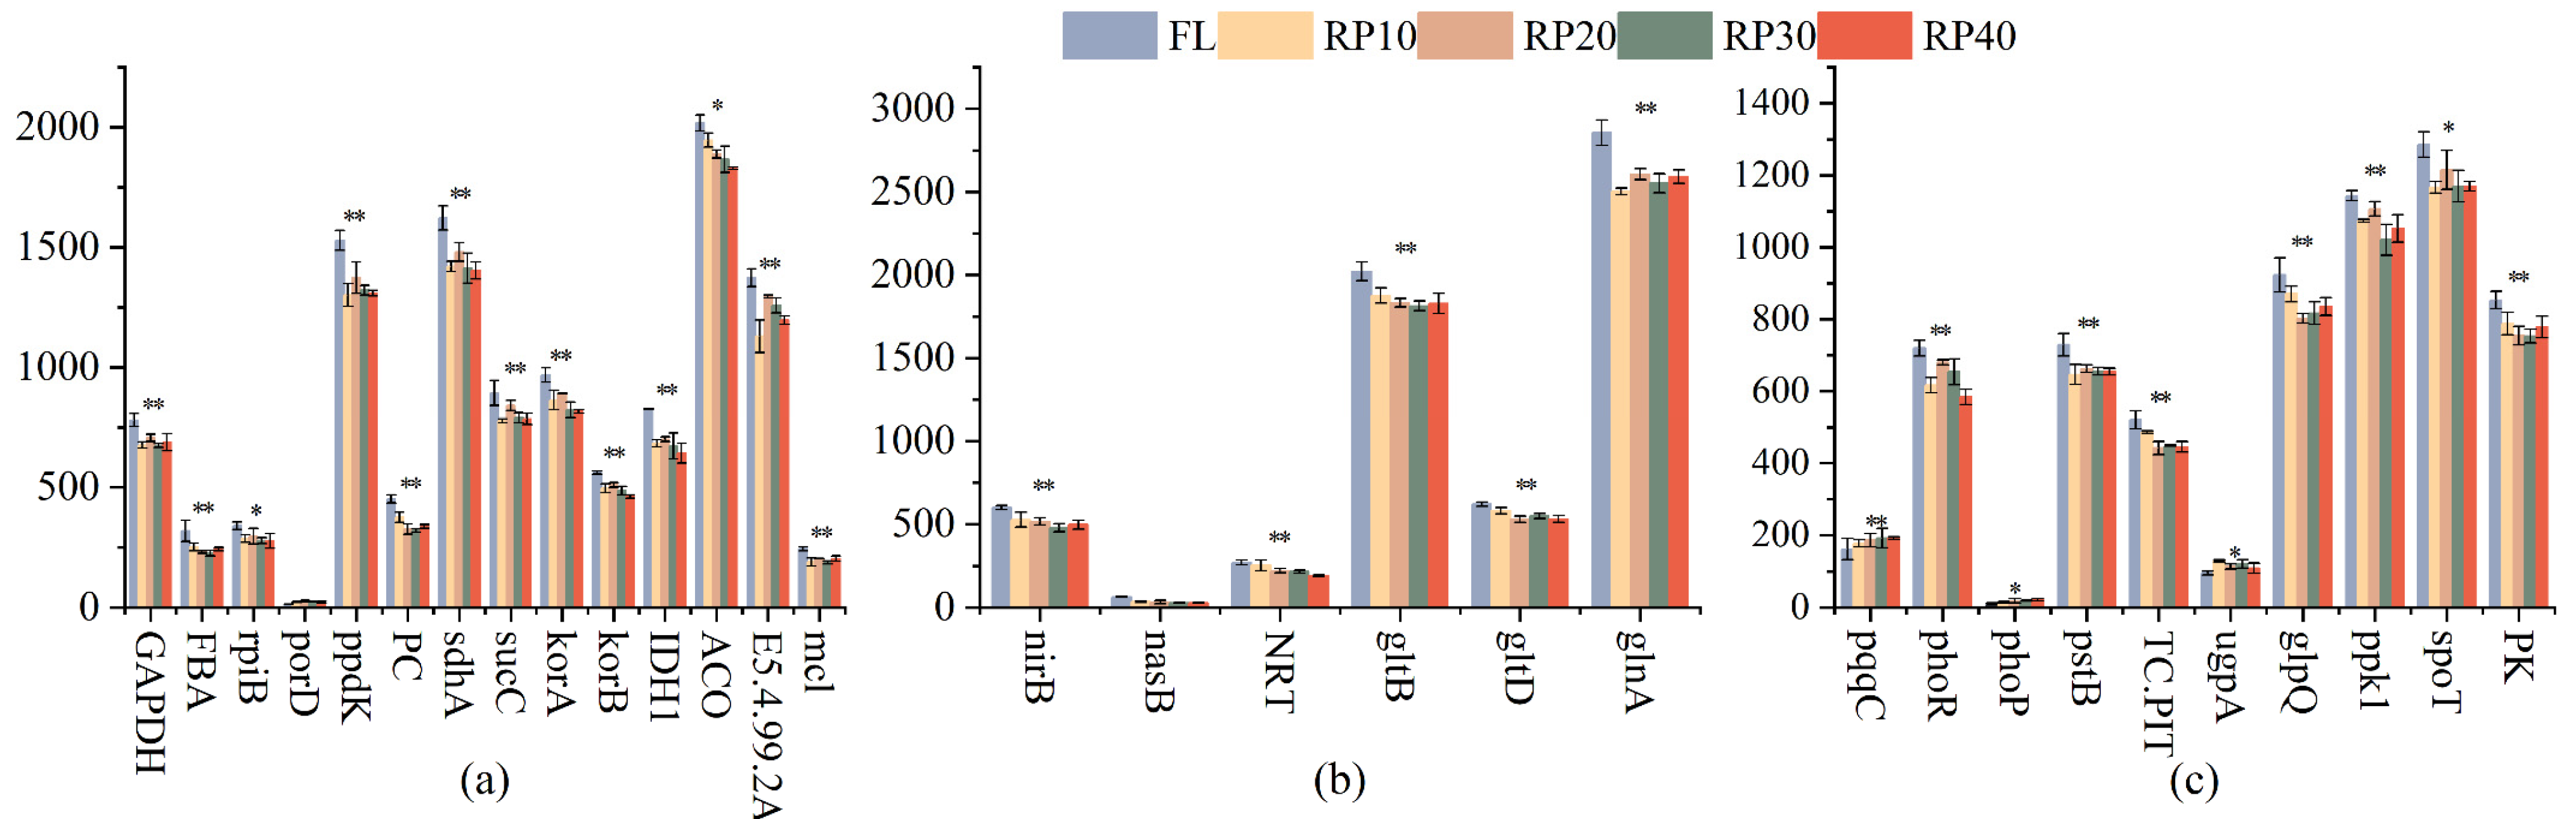
3.4. Changes in C-, N-, and P-Cycling Functional Genes

Among the 8188 KOs annotated in the KEGG database, we identified 69 functional genes related to carbon cycling (Figure S3), 36 to nitrogen cycling (Figure S4), and 14 to phosphorus cycling (Figure S5). These genes were grouped into seven carbon-cycling pathways (Figure S6a), seven nitrogen-cycling pathways (Figure S6b), and six phosphorus-cycling pathways (Figure S6c). Gene abundance trends varied across pathways within each cycle as R. pseudoacacia restoration progressed. For example, the total gene abundance in carbon-cycling pathways was generally lower in R. pseudoacacia plantations than in FL and followed a pattern of initial increase and subsequent decline with increasing restoration age (Figure S6a). In contrast, nitrogen-cycling pathways displayed more diverse trends, with gene abundance varying significantly over time (Figure S6b). Similarly, phosphorus-cycling pathways showed distinct gene abundance patterns across different stages of restoration, reflecting the dynamic and complex nature of nutrient cycling during ecological recovery (Figure S6c).
Genes associated with the synergistic changes in C, N, and P cycles exhibited differential patterns. Within the carbon cycle, functional genes with high centrality in the co-occurrence network generally had higher abundance in FL compared with R. pseudoacacia plantations (Figure 3a). However, as restoration progressed, their abundance often increased initially and then declined. For instance, genes such as GAPDH and rpiB (Reductive Pentose Phosphate Cycle), IDH1 and ppdK (Reductive Citrate Cycle), E5.4.99.2A (Hydroxypropionate–Hydroxybutylate Cycle), korA (Incomplete Reductive Citrate Cycle), sdhA (3-Hydroxypropionate Bi-cycle), and sucC (Dicarboxylate–Hydroxybutyrate Cycle) followed this trend. Conversely, genes such as PC and ACO, which are also central in the Reductive Citrate Cycle, exhibited a steady decline in abundance with increasing restoration years, highlighting the nuanced response of carbon-cycling genes to ecological restoration.
Nitrogen-cycling genes involved in synergistic changes in C, N, and P also displayed diverse patterns (Figure 3b). Genes in the organic N metabolism pathway (gltB, glnA, and gltD) showed complex variation trends. In the nitrogen transport pathway, the key gene nrtA exhibited lower abundance in early restoration stages but increased later. The assimilatory nitrate reduction pathway displayed a progressive decline in gene abundance, with the key gene nasB following a similar trend. By contrast, genes in the Dissimilatory Nitrate Reduction and Denitrification pathways initially decreased but later increased during restoration, exemplified by the key gene nirB.
Phosphorus-cycling genes also showed varying trends during R. pseudoacacia restoration (Figure 3c). In the polyphosphate synthesis pathway, the abundance of ppk1 fluctuated with restoration age, being higher in FL, and then showing an increase, decrease, and subsequent increase in plantations. The key gene spoT in the polyphosphate degradation pathway exhibited a similar pattern. In the regulatory pathway, phoR displayed an inverted “U”-shaped trend, with higher abundance in FL than in plantations. Similarly, in the transporters pathway, the key gene pstB mirrored this trend. The gene pqqC in the inorganic P solubilization pathway consistently increased with restoration years, while genes such as PK (polyphosphate degradation) and glpQ (transporters) followed a pattern of initial decline followed by an increase.

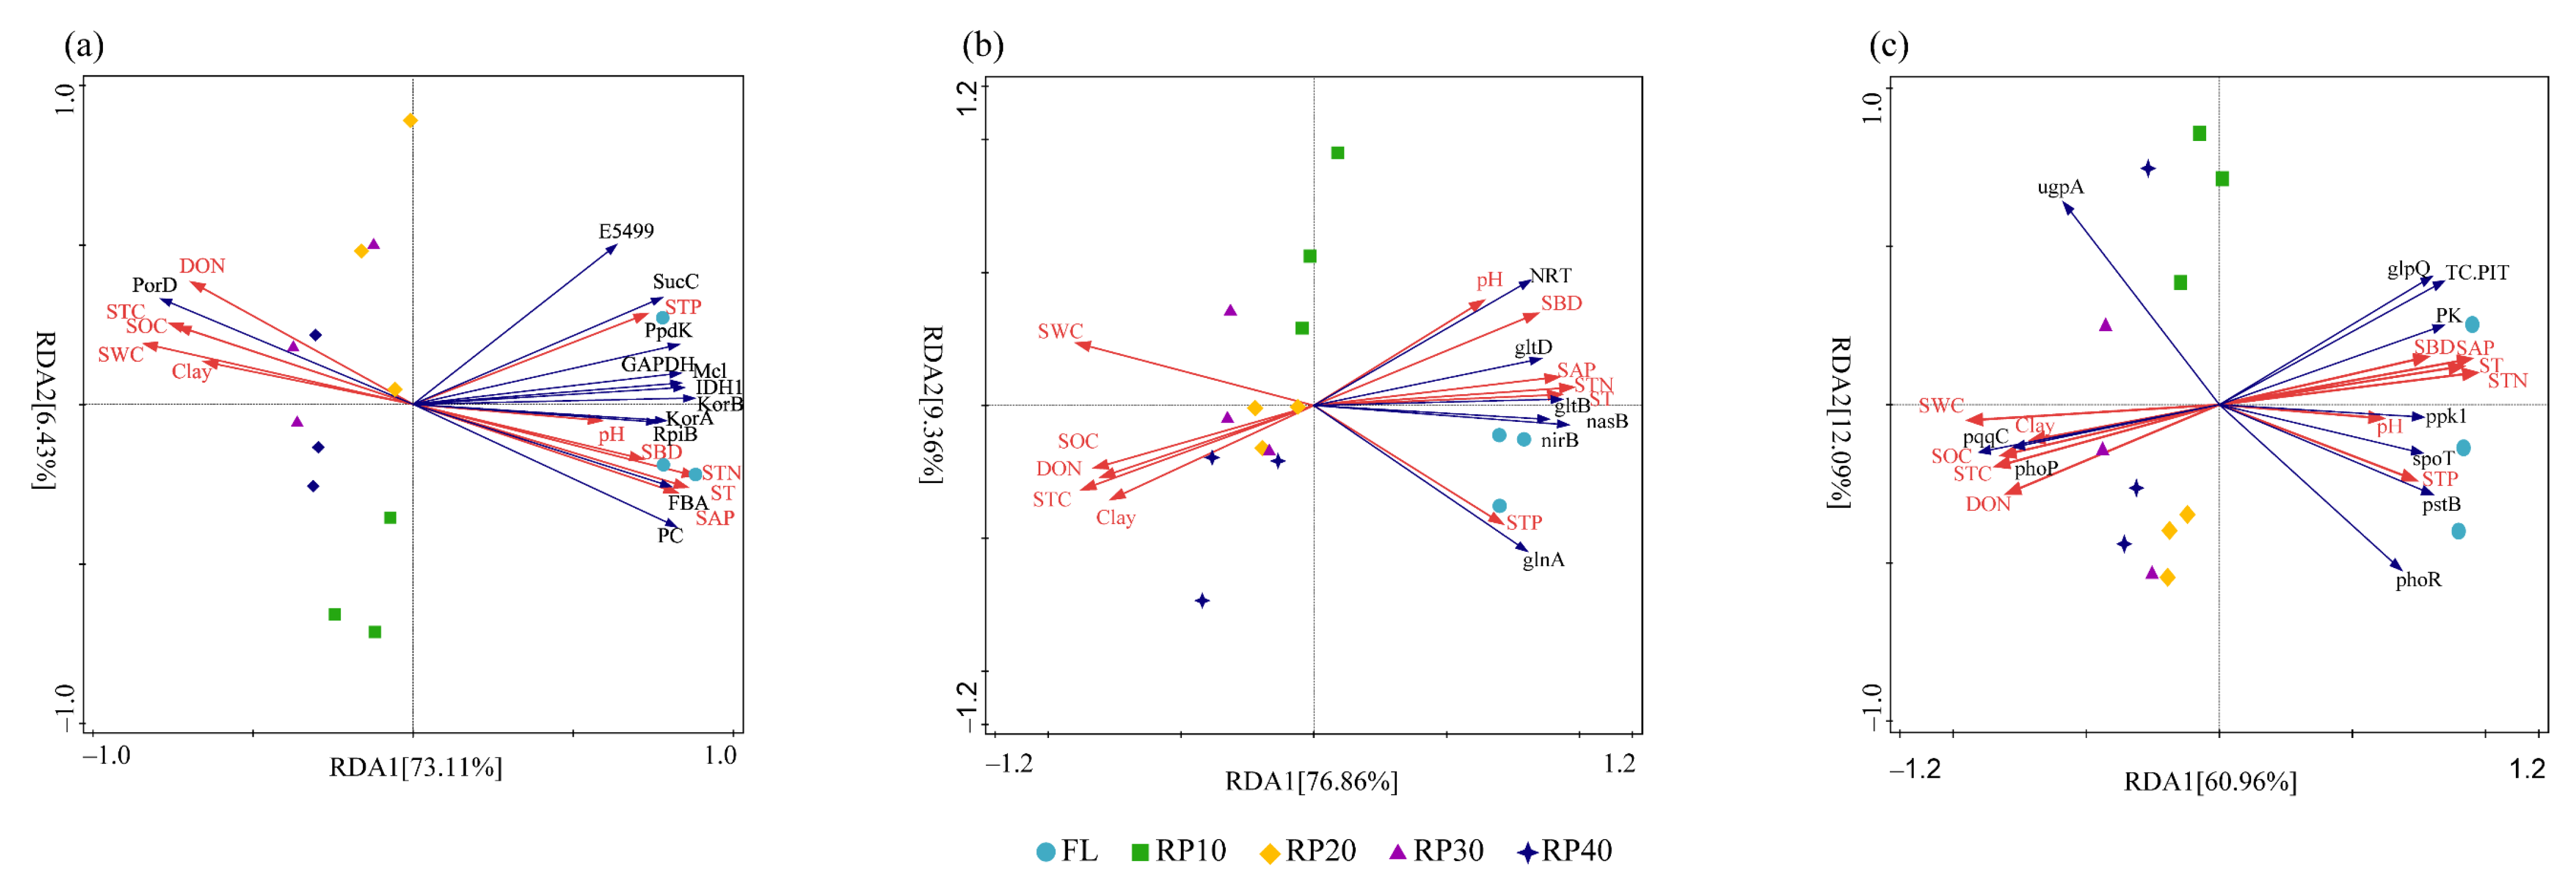
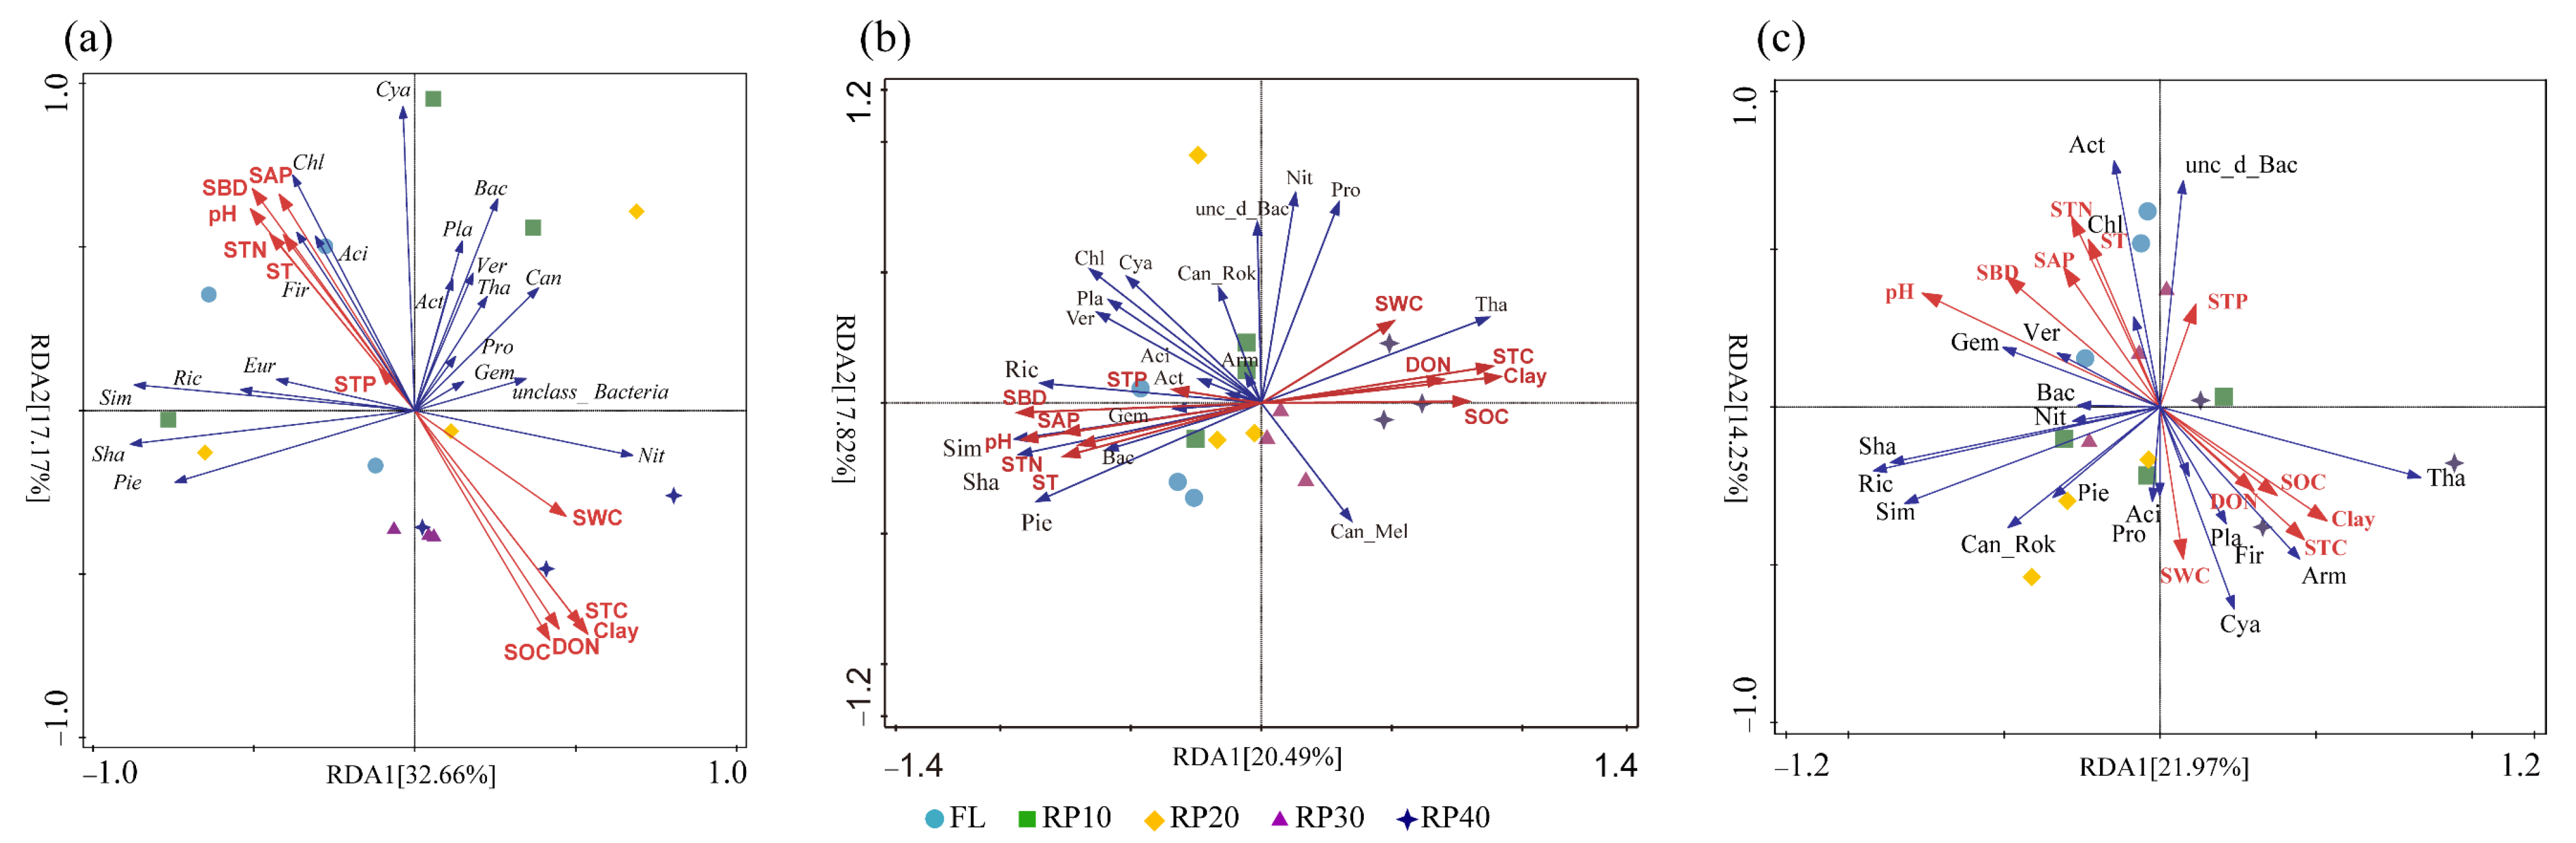
3.5. Driving Factors of Synergistic Changes in C-, N-, and P-Cycling Functional Genes

The heatmap results (Figure 4) highlight the distribution relationships between different functional genes in specific microbial phyla, which play essential roles in sustaining the cycling and synergistic changes in C, N, and P functional genes in soil. Overall, the microbial phyla closely associated with these synergistic C, N, and P functional genes include Gemmatimonadetes, Acidobacteria, Chloroflexi, Actinobacteria, and Proteobacteria, each of which contributes to various biogeochemical cycling processes. However, there are notable differences in the microbial groups associated with each specific cycling gene. For the carbon cycle, the glpX gene is linked with Gemmatimonadetes, Proteobacteria, and Actinobacteria; the korB gene is primarily associated with Acidobacteria, Chloroflexi, and Armatimonadetes; and the ppdK gene is connected to Proteobacteria, Candidatus Saccharibacteria, and Nitrospinae. In the nitrogen cycle, the glnA gene is associated mainly with Proteobacteria and Actinobacteria; gltB with Proteobacteria and Chloroflexi; and nasB with Proteobacteria. For the phosphorus cycle, the phoP gene is associated with Proteobacteria and Actinobacteria, phoR with Proteobacteria and Acidobacteria, and ppk1 with Proteobacteria. These findings reveal the complex, synergistic interactions between soil microorganisms and functional genes, emphasizing the vital role of diverse microbes through different metabolic pathways in regulating soil nutrient dynamics and supporting ecosystem function.
The RDA of the top 30 genes in the co-occurrence network for carbon-, nitrogen-, and phosphorus-cycling functional genes showed significant differences in the effects of soil physicochemical properties on functional genes in each cycle (Figure 5). Specifically, in the carbon cycling genes, the x-axis (RDA1) explained 76.86% of the variance, and the y-axis (RDA2) explained 9.36% (Figure 5a). Soil pH, SBD, SAP, STN, and ST were closely related to carbon cycling genes, with arrows pointing toward these genes, indicating that these properties significantly influenced carbon-cycling genes such as NRT, gltD, and gltB. In contrast, SOC, DON, STC, and clay had arrows in the opposite direction, indicating a negative regulation of carbon-cycling gene expression. For nitrogen-cycling genes, RDA1 explained 73.11% of the variance, and RDA2 explained 6.43% (Figure 5b). The PorD gene was strongly associated with soil properties such as SWC, SOC, DON, STC, and clay, as indicated by arrows pointing toward these properties. Meanwhile, properties such as pH, SBD, SAP, STN, and STP showed strong correlations with genes like PpdK, GAPDH, Mcl, IDH1, KorB, KorA, RpiB, FBA, and PC. In phosphorus-cycling genes, RDA1 explained 60.96% of the variance, and RDA2 explained 12.09% (Figure 5c). Soil properties such as SBD, SAP, ST, STN, and pH significantly impacted phosphorus-cycling genes like PK, ppk1, spoT, and pstB, while genes such as pqqC and phoP were strongly associated with SWC, clay, SOC, STC, and DON. These findings indicate that soil physicochemical properties have distinct regulatory effects on carbon-, nitrogen-, and phosphorus-cycling genes during R. pseudoacacia restoration, providing important insights into the mechanisms of soil ecological function recovery on the Loess Plateau.
We also calculated the diversity of microorganisms containing C-, N-, and P-cycling functional genes with synergistic changes, selecting the top 15 most abundant microbial phyla for RDA with soil physicochemical properties (Figure 6). Results showed distinct effects of soil properties on the microorganisms associated with each cycle. For carbon cycling gene-related microbes, properties such as SAP, SBD, pH, STN, and ST had a significant impact on microbial phyla, including Chloroflexi, Acidobacteria, and Firmicutes (Figure 6a). Nitrogen cycling gene-associated microbes were primarily influenced by properties like STP, SBD, SAP, pH, STN, and ST, which affected the diversity and composition of microbes like Bacteroidetes, Gemmatimonadetes, and Actinobacteria. Notably, Thaumarchaeota was solely influenced by SWC, DON, and STC (Figure 6b). For microorganisms associated with phosphorus-cycling genes, phyla such as Planctomycetes, Firmicutes, and Armatimonadetes were significantly influenced by SWC, DON, STC, SOC, and clay, while Actinobacteria, Chloroflexi, Gemmatimonadetes, and Verrucomicrobia were more affected by STN, SAP, SBD, ST, and pH (Figure 6c). These analyses highlight that soil physicochemical properties exert distinct regulatory effects on microorganisms associated with C-, N-, and P-cycling functional genes during R. pseudoacacia restoration.

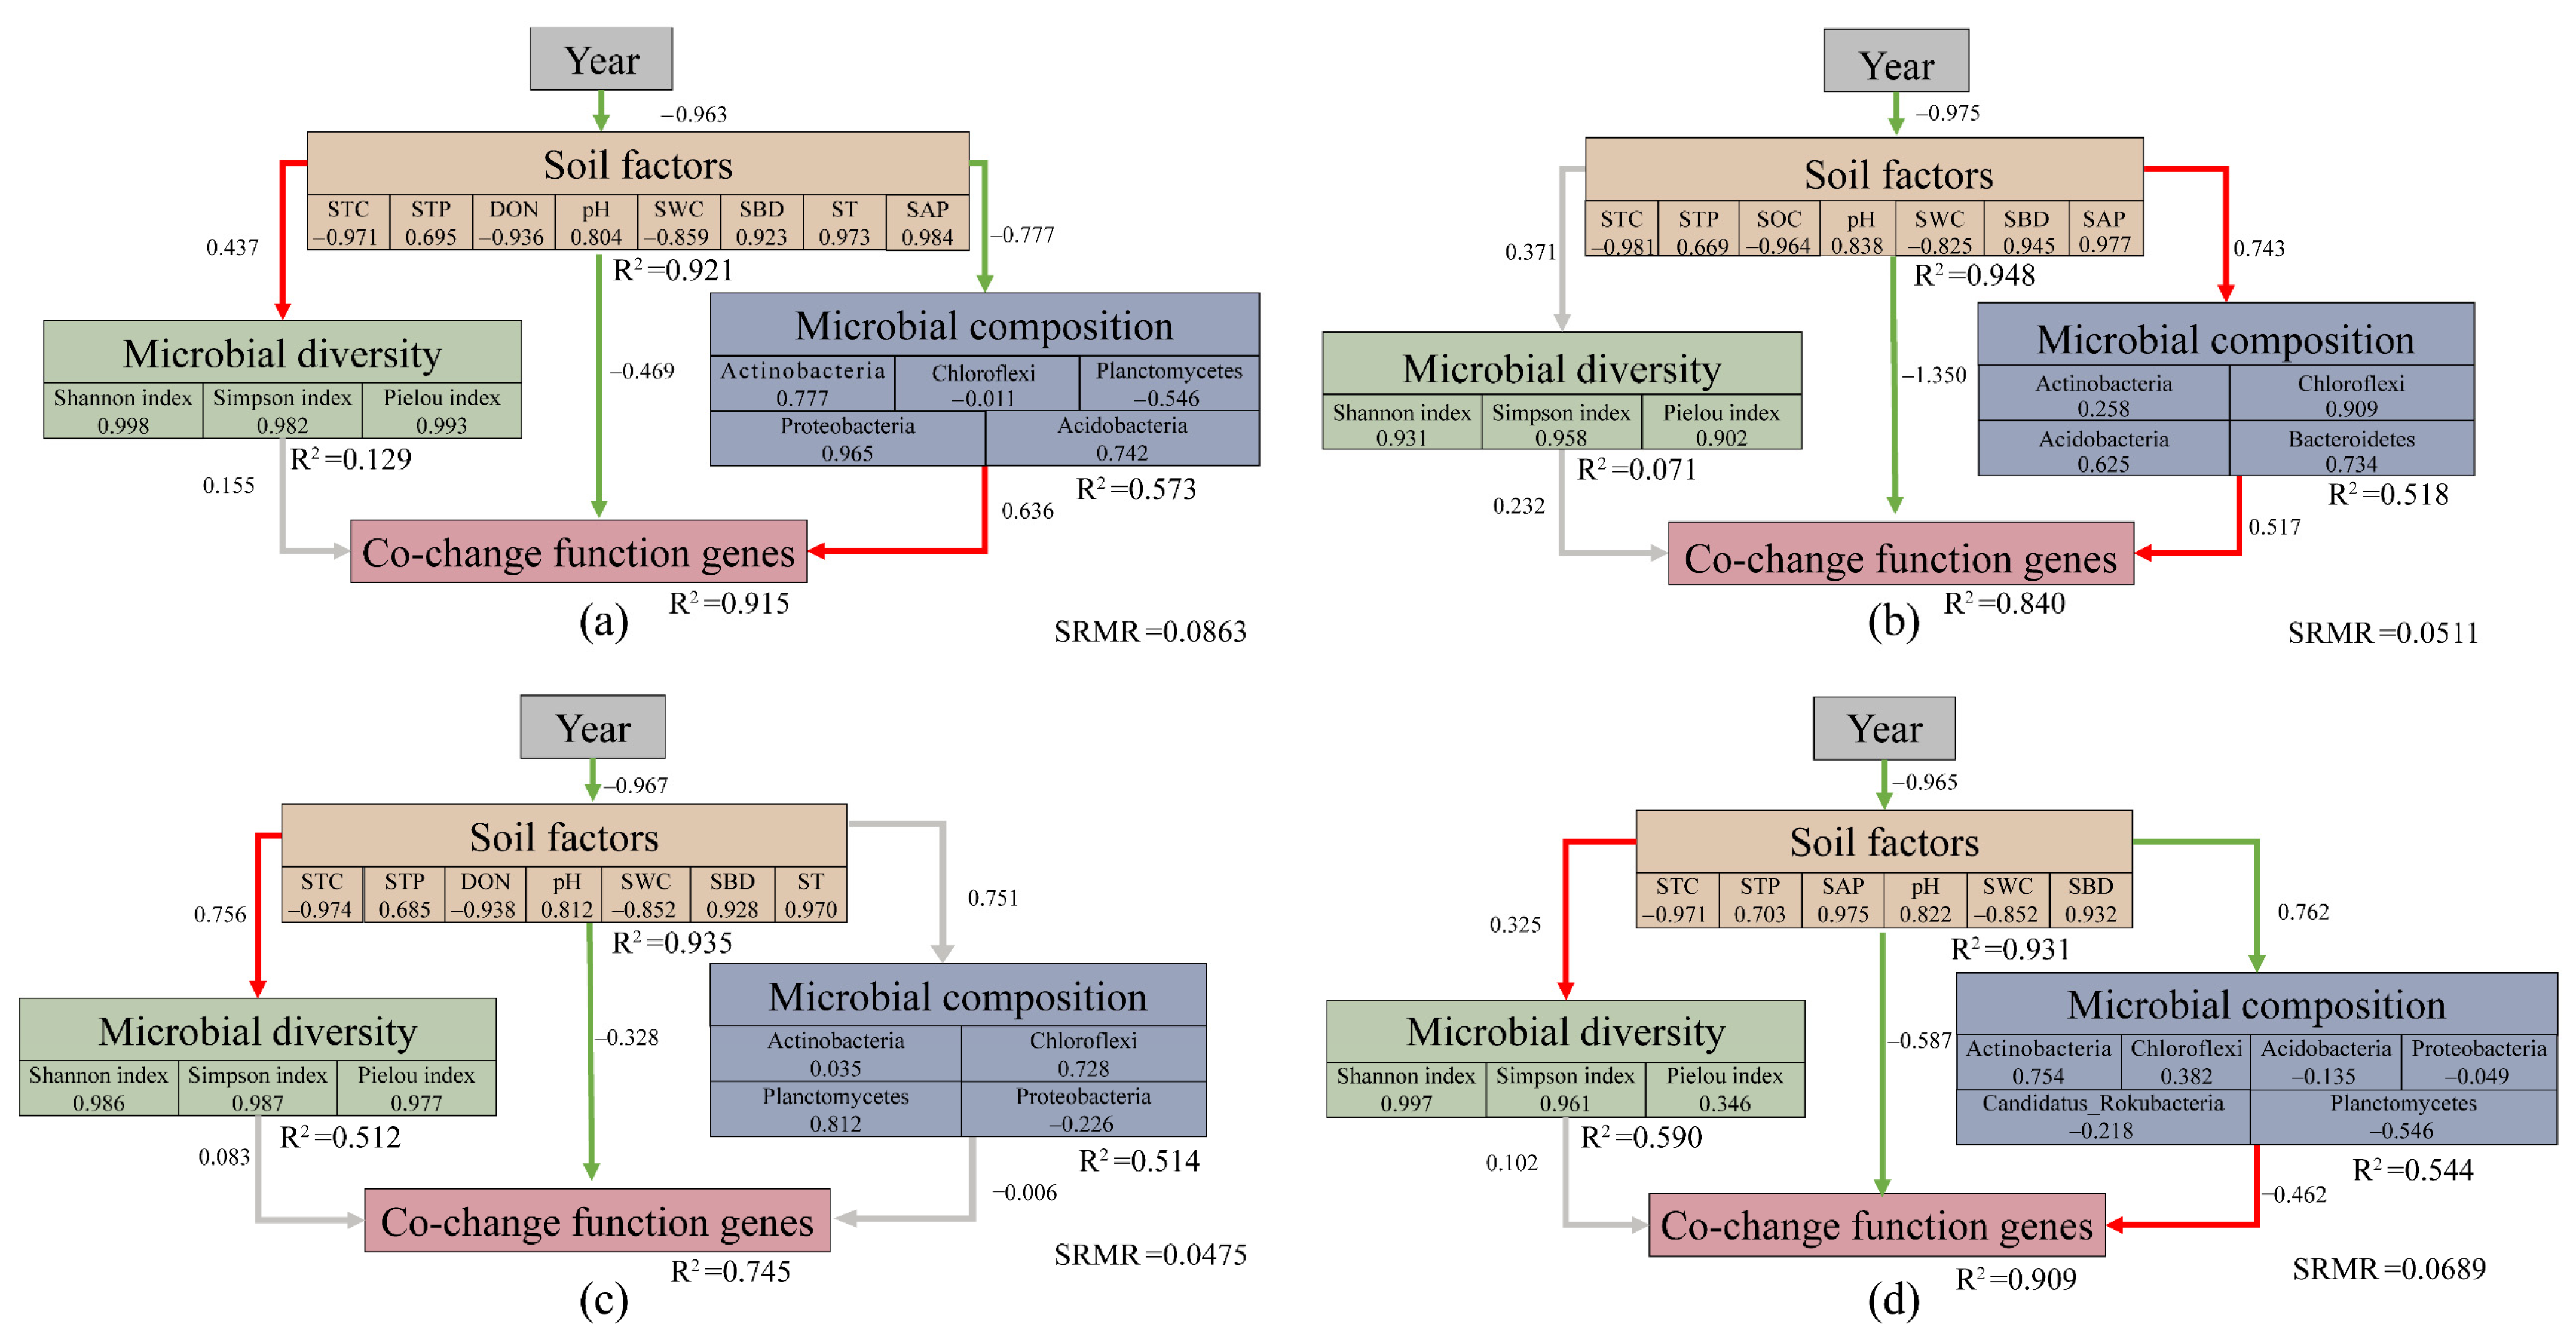
3.6. Structural Equation Modeling (SEM)

The PLS-SEM revealed that soil environmental factors significantly influenced the synergistic changes in soil C, N, and P functional genes during the restoration process of Robinia pseudoacacia forests (Figure 7). This influence was mediated by microbial diversity and community composition, with distinct patterns observed across the C, N, and P cycles.
Soil physicochemical properties, including SAP, soil pH, and SBD, were consistently identified as key positive drivers of the microbial community composition and, consequently, the coordinated changes in functional genes across all three nutrient cycles. Conversely, STC, SWC, and DON exhibited negative effects on microbial diversity and functional gene synergies (Figure 7a). These shared drivers underscore the overarching role of these soil factors in shaping microbial-mediated nutrient cycling.
In the carbon cycle, the microbial community (Figure 7b) is strongly influenced by STC and SOC, with groups such as Chloroflexi, Acidobacteria, Actinobacteria, and Bacteroidetes showing positive correlations with these soil properties. This positive relationship enhances the synergistic changes in genes involved in the C, N, and P cycles, supporting the interconnectedness of microbial communities and nutrient cycling. In contrast, the nitrogen cycle community (Figure 7c) is more affected by soil physicochemical properties but has less impact on gene synergism. This suggests that while microbial diversity in the nitrogen cycle is shaped by soil properties, it does not strongly drive the coordinated changes in functional genes as in the carbon cycle. The phosphorus cycle microbial community (Figure 7d) exhibits a negative correlation between microbial composition and soil physicochemical properties, with soil properties such as STC and pH exerting an inhibitory effect. However, microbial diversity in this cycle has a positive influence on gene synergism, with groups such as Actinobacteria, Chloroflexi, Acidobacteria, and Proteobacteria playing key roles in the coordinated changes in phosphorus-related functional genes.
Overall, the results from the structural equation model highlight the varying impacts of soil physicochemical properties, microbial composition, and microbial diversity on the synergistic changes in soil C, N, and P functional genes. Restoration age consistently shows a positive correlation with the changes in these genes, whereas soil physicochemical properties tend to exhibit negative effects. Microbial diversity generally exerts a weak positive influence, but the impact of microbial composition on gene synergism varies across the C, N, and P cycles. These findings underscore the complexity of soil–microbe interactions and their role in driving nutrient cycling during forest restoration.

4. Discussion

4.1. Soil Physicochemical Properties and Microbial Composition Undergo Significant Changes with the Increasing Restoration Years of R. pseudoacacia

As R. pseudoacacia restoration progresses on the Loess Plateau, soil physicochemical properties change, with increases in STC, STN, SWC, and SBD (Table 1), typically due to greater vegetation cover and improved soil structure [44], while soil nutrients also exhibit significant synergistic changes (Figure S2). A strong correlation between STC and STN (Figure S2a) suggests a close link between their levels, reflecting synchronized organic matter accumulation and nitrogen fixation driven by increased vegetation cover and microbial activity [22]. Although STP remains stable (Table 1), available SAP declines (Figure S2e, p < 0.05), likely due to increased plant uptake and microbial immobilization [45]. This highlights a critical trade-off: while carbon inputs fuel microbial phosphorus mineralization [46], rising phosphorus demand from both plants and microbes reduces SAP availability, creating a nutrient limitation feedback loop [47].
In R. pseudoacacia restoration sites with increasing stand age, Actinobacteria, Proteobacteria, Acidobacteria, and Chloroflexi are the dominant microbial groups (Figure 1). Among these, Actinobacteria abundance has steadily increased over time, likely due to two factors: First, Actinobacteria have a robust capacity to degrade complex organic materials such as cellulose, lignin, and chitin [48]. With the ecological restoration of R. pseudoacacia forests, the accumulation of plant litter and root exudates provides a rich source of carbon [32,49], supporting Actinobacteria growth and reproduction [50]. Additionally, some Actinobacteria species possess nitrogen-fixing abilities, converting atmospheric nitrogen into plant-available forms [51]. This trait is particularly important in R. pseudoacacia forests, where increasing nitrogen demand accompanies forest recovery, positioning Actinobacteria as key players in soil nitrogen cycling [52]. Proteobacteria, another highly diverse group, are abundant in these sites due to their rapid proliferation in nutrient-rich conditions, contributing to soil nitrogen cycling and organic matter degradation [53,54]. Meanwhile, Acidobacteria also exhibit a high abundance. Although the soil pH tends to shift toward neutral as restoration progresses, the increased carbon input from accumulated and decomposing organic matter may promote the growth of certain Acidobacteria subgroups, even with the overall pH change [55]. In nutrient-rich environments, Acidobacteria have shown strong adaptability, especially in the breakdown of recalcitrant organic compounds [56], which explains their substantial presence in aged restoration sites.

4.2. The Differences and Synergistic Changes in C-, N-, and P-Cycling Functional Genes with the Increasing Restoration Years of R. pseudoacacia

This study utilized co-occurrence network analysis to explore the interactions among microbial functional genes involved in the C, N, and P cycles (Figure 6a) [57,58]. As expected, genes related to the C, N, and P cycles demonstrated close interactions, involving both facilitative and inhibitory relationships. Centrality analyses identified highly connected nodes as critical to network stability [59].
Among the top 30 genes with the highest centrality (Figure 6b), P-cycling genes exhibited the highest network centrality, indicating a predominant role in maintaining the network’s structure and highlighting the importance of P cycling in C and N interactions. This might be due to the central P-cycling genes significantly influencing nutrient dynamics by encoding enzymes that release bioavailable phosphate [47], which meets the P demands of plants and microbes, facilitating C and N cycling [60,61]. The pqqC gene, encoding pyrroloquinoline quinone (PQQ)-dependent glucose dehydrogenase, plays a pivotal role in phosphorus solubilization by oxidizing glucose to gluconic acid, which acidifies the rhizosphere and releases inorganic phosphorus from mineral complexes (e.g., Ca₃(PO₄)₂) [62]. This process directly links carbon metabolism (GAPDH, ppdK) to phosphorus availability: gluconic acid not only releases phosphate but also provides carbon skeletons for microbial growth, amplifying cross-cycle synergies [63]. The centrality of pqqC (Figure 2b) reflects its dual role in alleviating phosphorus limitations and fueling microbial carbon demand, critical in nutrient-poor Loess Plateau soils [59]. In parallel, ppk1 and spoT, key genes in polyphosphate synthesis and degradation (Figure S5), exhibited fluctuating abundance during restoration (Figure 3c), reflecting dynamic shifts in the soil phosphorus availability influenced by pH and STP. These genes are integral to microbial strategies for maintaining phosphorus balance; ppk1 (polyphosphate kinase) synthesizes polyphosphate during phosphorus surplus, while spoT (polyphosphate hydrolase) degrades it under scarcity, acting as a microbial “P battery” [64]. Fluctuations in their abundance (Figure 3c) mirror restoration-driven shifts in P availability: early-stage labile P supports ppk1 activity, whereas later-stage P depletion activates spoT to mobilize stored polyphosphate [65]. These genes stabilize phosphorus supply, enabling microbes to buffer against fluctuating soil conditions, thereby maintaining C- and N-cycling efficiency [66,67].
Carbon- and nitrogen-cycling genes exhibit distinct but interconnected trends. Carbon-cycling genes, such as PC (pyruvate carboxylase) and ACO (aconitase), initially increase in abundance as labile carbon from root exudates fuels microbial activity, but they decline in later stages as soil organic carbon (SOC) transitions to recalcitrant forms like lignin [68]. This shift favors Actinobacteria-driven lignin degradation pathways, altering the functional gene landscape. Nitrogen-cycling genes, such as glnA (glutamine synthetase) and nasB (nitrate reductase), display divergent patterns tied to nitrogen demand. For example, glnA peaks during mid-restoration (Figure 3a), supporting amino acid synthesis amid rapid plant growth, but it declines as the nitrogen limitation eases [69]. These dynamics highlight the interdependence of nutrient cycles: phosphorus availability regulates ATP synthesis, which in turn drives carbon fixation and nitrogen assimilation [70]. Declining soil available phosphorus (SAP) in later stages further intensifies this integration, triggering compensatory upregulation of high-affinity phosphorus transporters (pstB) and mineralization genes (phoR), thereby coupling phosphorus scarcity to enhanced microbial scavenging and cross-cycle coordination [20].

4.3. Drivers of Synergistic Changes in C, N, and P Functional Genes with the Increasing Restoration Years of R. pseudoacacia

The synergistic changes in functional genes are driven by a complex interplay of soil physicochemical properties, microbial community succession, and nutrient limitation feedbacks [10,18]. Soil pH emerges as a master regulator, shaping microbial composition and enzymatic activity. Gradual acidification during restoration (Table 1) suppresses alkaliphilic taxa like Nitrososphaera while favoring acid-tolerant Acidobacteria and Actinobacteria [35,71,72]. This pH shift enhances pqqC-mediated phosphorus solubilization but inhibits alkaline-active phosphatases like phoR, creating divergent trends in phosphorus-cycling pathways [36,55]. Concurrently, soil organic carbon (SOC) quality dictates microbial succession. Labile carbon in the early stages fuels copiotrophic Proteobacteria, which dominate the carbon-cycling genes (PC, ACO) [73]. As SOC becomes recalcitrant, oligotrophic groups like Actinobacteria and Chloroflexi thrive, activating ligninolytic enzymes (e.g., laccases) and shifting gene abundance toward degradation pathways (Figure S6a; [74]).
Nutrient limitation further drives adaptive gene expression. Nitrogen scarcity in later restoration stages upregulates nitrate transporters (nrtA) and assimilatory nitrate reductases (nasB), while phosphorus limitation selects for phosphorus-sensing kinases (phoP) and solubilization genes (pqqC) [75,76,77]. These adaptations are mechanistically linked to soil properties: SAP decline correlates strongly with phoP upregulation, illustrating a direct soil-to-gene regulatory pathway (Figure 5c; [78]). Structural equation modeling (SEM) confirms that soil properties act as “bottom-up” controls, with SOC directly enhancing Chloroflexi abundance to drive carbon mineralization and support nitrogen assimilation (glnA), while SAP decline enriches phosphorus-scavenging Proteobacteria, reshaping the phosphorus-cycling networks (Figure 6c and Figure 7; [10]). Together, these drivers create a feedback loop where soil properties shape microbial communities, which in turn modulate functional gene expression to sustain nutrient cycling synergy during ecological restoration.
Our findings both align with and diverge from prior work on nutrient cycling during ecological restoration. The strong correlation between STC and STN (Figure S2a) echoes Séneca et al. (2021) [22], who attributed such synergy to plant–microbe carbon–nitrogen coupling in reforested systems. However, unlike their focus on mycorrhizal networks, we identify Actinobacteria-driven lignin degradation as a key driver of SOC accumulation, a process less emphasized in temperate forest studies [32]. The centrality of phosphorus genes also contrasts with nitrogen-centric models in grassland restoration [70], highlighting the unique nutrient limitations of calcium-rich loess soils.
Notably, the decline in SAP despite stable STP (Table 1) mirrors observations by Mehnaz et al. (2019) [45] in agroforestry systems, where microbial immobilization and plant uptake reduce the available phosphorus. Yet, our data uniquely link this trend to pqqC-mediated solubilization competing with polyphosphate storage, a mechanism previously undocumented in restoration contexts. These discrepancies underscore the importance of soil type and microbial community composition in shaping nutrient dynamics, challenging one-size-fits-all models of ecological recovery.

4.4. Practical Implications for Ecological Restoration and Soil Management

The findings offer actionable strategies to enhance restoration outcomes in degraded ecosystems:
Promoting Phosphorus-Solubilizing Microbes: Inoculating soils with pqqC-rich Actinobacteria or Proteobacteria strains could accelerate phosphorus availability in calcium-rich soils. This approach has succeeded in agroecosystems [62] and could be adapted for reforestation.
Managing SOC Quality: Early-stage addition of labile carbon (e.g., compost) could boost Proteobacteria-driven nutrient cycling, while later-stage incorporation of lignin-rich mulch may sustain Actinobacteria activity, balancing short- and long-term carbon sequestration.
pH Monitoring and Adjustment: Liming soils in early restoration could temporarily enhance alkaline phosphatase activity (phoR), while gradual acidification via organic amendments (e.g., pine needles) may later favor pqqC-mediated phosphorus release.
Gene-Based Monitoring: Tracking functional genes (pqqC, ppk1, glnA) via metagenomics could serve as a biomarker for restoration progress, enabling targeted interventions in nutrient-limited areas.
These strategies address the Loess Plateau’s specific challenges but are adaptable to other calcium-dominated ecosystems. By linking microbial gene networks to practical management, this study bridges the gap between theoretical ecology and on-ground restoration.

5. Conclusions

This study aimed to elucidate the mechanisms driving synergistic interactions among carbon (C)-, nitrogen (N)-, and phosphorus (P)-cycling functional genes during R. pseudoacacia restoration on the Loess Plateau. Our hypothesis, that phosphorus-cycle genes act as central hubs mediating cross-cycle nutrient dynamics, was strongly supported by the data. Key findings include the following:
Phosphorus Genes as Network Keystones: The centrality of pqqC, ppk1, and spoT in the co-occurrence network (Figure 2b) highlights their dual role in phosphorus solubilization and cross-cycle integration. pqqC bridges carbon metabolism (via gluconic acid production) and phosphorus availability, while ppk1 and spoT buffer phosphorus fluctuations through polyphosphate storage and mobilization.
Soil–Microbe Feedbacks: Soil acidification and organic carbon (SOC) shifts drove microbial succession, favoring Actinobacteria and Acidobacteria, which dominated lignin degradation and nitrogen mineralization. These shifts were mechanistically linked to functional gene expression, particularly in phosphorus cycling (Figure 5c).
Nutrient Limitation Drives Synergy: Declining available phosphorus (SAP) triggered the compensatory upregulation of phosphorus-scavenging genes (phoP, pstB), coupling phosphorus scarcity with enhanced carbon- and nitrogen-cycling efficiency.
Our work demonstrates phosphorus’s pivotal role in loess soils. This aligns with but extends prior studies [22,70], which emphasized nitrogen or carbon dominance in other ecosystems. The integration of metagenomics, network analysis, and structural equation modeling provided a novel framework to unravel soil–microbe–gene interactions. While this study clarifies short-term nutrient dynamics, the long-term effects of microbial succession and climate variability require further investigation. Future work should prioritize multi-decadal gene expression tracking and field trials of proposed management strategies to validate their efficacy across diverse ecosystems.

Supplementary Materials

The following supporting information can be downloaded at: https://www.mdpi.com/article/10.3390/agronomy15040797/s1, Table S1: Metagenomic sequencing raw data statistics; Table S2: Information of microbial functional genes involved in the C, N, and P cycling processes identified in this study; Table S3: Co-occurrence network centrality of C, N and P cycling functional genes; Figure S1: The schematic diagram of the study area, Ansai District, Yan’an City, Shaanxi Province, China; Figure S2: The linear regression analysis between soil carbon (C), nitrogen (N), and phosphorus (P) nutrients, including soil organic carbon (SOC), available phosphorus (SAP), and dissolved organic nitrogen (DON); Figure S3: Changes in Carbon Cycling Functional Gene Abundance with the increasing restoration years of R. pseudoacacia; Figure S4: Changes in Nitrogen Cycling Functional Gene Abundance with the increasing restoration years of R. pseudoacacia; Figure S5: Changes in Phosphorus Cycling Functional Gene Abundance with the increasing restoration years of R. pseudoacacia; Figure S6: The gene abundance of each pathway of carbon, nitrogen and phosphorus cycle changed with the increase of the age of Robinia pseudoacacia; Figure S7: The two-dimensional non-metric multidimensional scaling (NMDS) ordination of functional genes, including C functional cycling genes (a), N functional cycling genes (b), and P functional cycling genes (c), across different plots; Figure S8: The random forest model showed the effect of latent variables in the PLS-SEM model on the synergistic changes of carbon, nitrogen and phosphorus cycling functional genes; Text S1: Soil physicochemical analysis.

Author Contributions

N.P., Y.W., W.H. and W.Z. conceived the ideas and designed the methodology; H.W. provided constructive suggestions for the writing of the manuscript; H.H., A.S., Z.Y., S.L. and R.S. collected samples and measured the samples’ properties; N.P. and Y.W. analyzed the data; N.P., Y.W., W.H. and W.Z. led the writing of the manuscript. All authors have read and agreed to the published version of the manuscript.

Funding

This work was funded by the Shaanxi Academy of Forestry through the Key Special Project of Scientific and Technological Innovation in Forestry of Shaanxi Province (Grant No. SXLK2022-02-2, “Technology and Demonstration for Improving the Structure and Function of Artificial Forest and Grass Vegetation on the Loess Plateau”). The APC was funded by Northwest A&F University.

Data Availability Statement

The data and metadata supporting this study are included in the Supplementary Materials Tables S1–S3, which provide details on metagenomic sequencing raw data statistics, information on microbial functional genes involved in the C-, N-, and P-cycling processes, and the co-occurrence network centrality of C-, N-, and P-cycling functional genes. Additionally, the Illumina sequence data have been previously deposited in the National Center for Biotechnology Information (NCBI) under BioProject accession number PRJNA1191551. The specific data can be viewed and downloaded at the website: https://www.ncbi.nlm.nih.gov/bioproject/?term=PRJNA1191551.

Acknowledgments

This work is supported by the project “Technology and Demonstration for Improving the Structure and Function of Artificial Forest and Grass Vegetation on the Loess Plateau” (SXLK2022-02-2).

Conflicts of Interest

No conflict of interest exists in the submission of this manuscript, and the manuscript is approved by all authors for publication. We have provided all required supporting documentation according to the journal’s Instructions to Authors. The authors declare no conflict of interest.

References

  1. Wardle, D.A.; Bardgett, R.D.; Klironomos, J.N.; Setälä, H.; van der Putten, W.H.; Wall, D.H. Ecological linkages between aboveground and belowground biota. Science 2004, 304, 1629–1633. [Google Scholar] [CrossRef] [PubMed]
  2. Kaye, J.P.; McCulley, R.L.; Burke, I.C. Carbon fluxes, nitrogen cycling, and soil microbial communities in adjacent urban, native and agricultural ecosystems. Glob. Change Biol. 2005, 11, 575–587. [Google Scholar] [CrossRef]
  3. Serna-Chavez, H.M.; Fierer, N.; van Bodegom, P.M. Global drivers and patterns of microbial abundance in soil. Glob. Ecol. Biogeogr. 2013, 22, 1162–1172. [Google Scholar] [CrossRef]
  4. Trivedi, P.; Delgado-Baquerizo, M.; Trivedi, C.; Hu, H.; Anderson, I.C.; Jeffries, T.C.; Zhou, J.; Singh, B.K. Microbial regulation of the soil carbon cycle: Evidence from gene–enzyme relationships. ISME J. 2016, 10, 2593–2604. [Google Scholar] [CrossRef]
  5. Hartmann, M.; Six, J. Soil structure and microbiome functions in agroecosystems. Nat. Rev. Earth Environ. 2023, 4, 4–18. [Google Scholar] [CrossRef]
  6. Moreno-de las Heras, M. Development of soil physical structure and biological functionality in mining spoils affected by soil erosion in a Mediterranean-Continental environment. Geoderma 2009, 149, 249–256. [Google Scholar] [CrossRef]
  7. Chen, Y.; Chi, J.; Lu, X.; Cai, Y.; Jiang, H.; Zhang, Q.; Zhang, K. Fungal-bacterial composition and network complexity determine soil multifunctionality during ecological restoration. Catena 2023, 230, 107251. [Google Scholar] [CrossRef]
  8. Liu, Z.; Gu, H.; Yao, Q.; Jiao, F.; Hu, X.; Liu, J.; Jin, J.; Liu, X.; Wang, G. Soil pH and carbon quality index regulate the biogeochemical cycle couplings of carbon, nitrogen and phosphorus in the profiles of Isohumosols. Sci. Total Environ. 2024, 922, 171269. [Google Scholar] [CrossRef]
  9. Huang, J.; Liu, X.; Liu, J.; Zhang, Z.; Zhang, W.; Qi, Y.; Li, W.; Chen, Y. Changes of soil bacterial community, network structure, and carbon, nitrogen and sulfur functional genes under different land use types. Catena 2023, 231, 107385. [Google Scholar] [CrossRef]
  10. Liao, J.; Dou, Y.; Yang, X.; An, S. Soil microbial community and their functional genes during grassland restoration. J. Environ. Manag. 2023, 325, 116488. [Google Scholar] [CrossRef]
  11. Schleuss, P.-M.; Widdig, M.; Heintz-Buschart, A.; Guhr, A.; Martin, S.; Kirkman, K.; Spohn, M. Stoichiometric controls of soil carbon and nitrogen cycling after long-term nitrogen and phosphorus addition in a mesic grassland in South Africa. Soil. Biol. Biochem. 2019, 135, 294–303. [Google Scholar] [CrossRef]
  12. Niu, L.; Shao, Q.; Ning, J.; Yang, X.; Liu, S.; Liu, G.; Zhang, X.; Huang, H. Evaluation on the degree and potential of ecological restoration in Loess Plateau. J. Nat. Resour. 2023, 38, 779. [Google Scholar] [CrossRef]
  13. Wen, X.; Zhou, Y.; Liang, X.; Li, J.; Huang, Y.; Li, Q. A novel carbon-nitrogen coupled metabolic pathway promotes the recyclability of nitrogen in composting habitats. Bioresour. Technol. 2023, 381, 129134. [Google Scholar] [CrossRef]
  14. Chen, L.; Liu, L.; Mao, C.; Qin, S.; Wang, J.; Liu, F.; Blagodatsky, S.; Yang, G.; Zhang, Q.; Zhang, D.; et al. Nitrogen availability regulates topsoil carbon dynamics after permafrost thaw by altering microbial metabolic efficiency. Nat. Commun. 2018, 9, 3951. [Google Scholar] [CrossRef] [PubMed]
  15. Liao, L.; Wang, J.; Dijkstra, F.A.; Lei, S.; Zhang, L.; Wang, X.; Liu, G.; Zhang, C. Nitrogen enrichment stimulates rhizosphere multi-element cycling genes via mediating plant biomass and root exudates. Soil. Biol. Biochem. 2024, 190, 109306. [Google Scholar] [CrossRef]
  16. Richy, E.; Fort, T.; Odriozola, I.; Kohout, P.; Barbi, F.; Martinovic, T.; Tupek, B.; Adamczyk, B.; Lehtonen, A.; Mäkipää, R.; et al. Phosphorus limitation promotes soil carbon storage in a boreal forest exposed to long-term nitrogen fertilization. Glob. Change Biol. 2024, 30, e17516. [Google Scholar] [CrossRef]
  17. Watkins-Brandt, K.; Letelier, R.; Spitz, Y.; Church, M.; Böttjer, D.; White, A. Addition of inorganic or organic phosphorus enhances nitrogen and carbon fixation in the oligotrophic North Pacific. Mar. Ecol. Prog. Ser. 2011, 432, 17–29. [Google Scholar] [CrossRef]
  18. Luo, G.; Xue, C.; Jiang, Q.; Xiao, Y.; Zhang, F.; Guo, S.; Shen, Q.; Ling, N. Soil Carbon, Nitrogen, and Phosphorus Cycling Microbial Populations and Their Resistance to Global Change Depend on Soil C:N:P Stoichiometry. mSystems 2020, 5, e00162-e20. [Google Scholar] [CrossRef]
  19. Philippot, L.; Chenu, C.; Kappler, A.; Rillig, M.C.; Fierer, N. The interplay between microbial communities and soil properties. Nat. Rev. Microbiol. 2024, 22, 226–239. [Google Scholar] [CrossRef]
  20. Wu, H.; Cui, H.; Fu, C.; Li, R.; Qi, F.; Liu, Z.; Yang, G.; Xiao, K.; Qiao, M. Unveiling the crucial role of soil microorganisms in carbon cycling: A review. Sci. Total Environ. 2024, 909, 168627. [Google Scholar] [CrossRef]
  21. Wang, S.; Yuan, X.; Li, T.; Yang, J.; Zhao, L.; Yuan, D.; Guo, Z.; Liu, C.; Duan, C. Changes in soil microbe-mediated carbon, nitrogen and phosphorus cycling during spontaneous succession in abandoned PbZn mining areas. Sci. Total Environ. 2024, 920, 171018. [Google Scholar] [CrossRef] [PubMed]
  22. Séneca, J.; Söllinger, A.; Herbold, C.W.; Pjevac, P.; Prommer, J.; Verbruggen, E.; Sigurdsson, B.D.; Peñuelas, J.; Janssens, I.A.; Urich, T.; et al. Increased microbial expression of organic nitrogen cycling genes in long-term warmed grassland soils. ISME Commun. 2021, 1, 69. [Google Scholar] [CrossRef] [PubMed]
  23. Coban, O.; De Deyn, G.B.; van der Ploeg, M. Soil microbiota as game-changers in restoration of degraded lands. Science 2022, 375, abe0725. [Google Scholar]
  24. Li, H.; Yang, S.; Xu, Z.; Yan, Q.; Li, X.; van Nostrand, J.D.; He, Z.; Yao, F.; Han, X.; Zhou, J.; et al. Responses of soil microbial functional genes to global changes are indirectly influenced by aboveground plant biomass variation. Soil. Biol. Biochem. 2017, 104, 18–29. [Google Scholar] [CrossRef]
  25. Dai, Z.; Liu, G.; Chen, H.; Chen, C.; Wang, J.; Ai, S.; Wei, D.; Li, D.; Ma, B.; Tang, C.; et al. Long-term nutrient inputs shift soil microbial functional profiles of phosphorus cycling in diverse agroecosystems. ISME J. 2020, 14, 757–770. [Google Scholar] [CrossRef]
  26. Scarlett, K.; Denman, S.; Clark, D.R.; Forster, J.; Vanguelova, E.; Brown, N.; Whitby, C. Relationships between nitrogen cycling microbial community abundance and composition reveal the indirect effect of soil pH on oak decline. ISME J. 2021, 15, 623–635. [Google Scholar] [CrossRef]
  27. Wen, X.; Zhen, L. Soil erosion control practices in the Chinese Loess Plateau: A systematic review. Environ. Dev. 2020, 34, 100493. [Google Scholar] [CrossRef]
  28. Li, C.; Fu, B.; Wang, S.; Stringer, L.C.; Wang, Y.; Li, Z.; Liu, Y.; Zhou, W. Drivers and impacts of changes in China’s drylands. Nat. Rev. Earth Environ. 2021, 2, 858–873. [Google Scholar] [CrossRef]
  29. Zhang, K.; Li, J.-J.; Wei, Z.-H.; Fan, M.-C.; Shangguan, Z.-P. Revealing nutrient limitation status of microorganisms in the soil of Robinia pseudoacacia plantation through soil stoichiometry and enzyme metrology. Ying Yong Sheng Tai Xue Bao 2024, 35, 1799–1806. [Google Scholar] [CrossRef]
  30. Vlachodimos, K.; Papatheodorou, E.M.; Diamantopoulos, J.; Monokrousos, N. Assessment of Robinia pseudoacacia cultivations as a restoration strategy for reclaimed mine spoil heaps. Environ. Monit. Assess. 2013, 185, 6921–6932. [Google Scholar] [CrossRef]
  31. Li, J.; Fan, M.; Wei, Z.; Zhang, K.; Ma, X.; Shangguan, Z. Broad environmental adaptation of abundant microbial taxa in Robinia pseudoacacia forests during long-term vegetation restoration. Environ. Res. 2024, 242, 117720. [Google Scholar] [CrossRef] [PubMed]
  32. Zhang, W.; Xu, Y.; Gao, D.; Wang, X.; Liu, W.; Deng, J.; Han, X.; Yang, G.; Feng, Y.; Ren, G. Ecoenzymatic stoichiometry and nutrient dynamics along a revegetation chronosequence in the soils of abandoned land and Robinia pseudoacacia plantation on the Loess Plateau, China. Soil. Biol. Biochem. 2019, 134, 1–14. [Google Scholar] [CrossRef]
  33. Ren, C.; Kang, D.; Wu, J.P.; Zhao, F.; Yang, G.; Han, X.; Feng, Y.; Ren, G. Temporal variation in soil enzyme activities after afforestation in the Loess Plateau, China. Geoderma 2016, 282, 103–111. [Google Scholar] [CrossRef]
  34. Ren, C.; Wang, T.; Xu, Y.; Deng, J.; Zhao, F.; Yang, G.; Han, X.; Feng, Y.; Ren, G. Differential soil microbial community responses to the linkage of soil organic carbon fractions with respiration across land-use changes. For. Ecol. Manag. 2018, 409, 170–178. [Google Scholar] [CrossRef]
  35. Li, K.; Han, X.; Ni, R.; Shi, G.; de-Miguel, S.; Li, C.; Shen, W.; Zhang, Y.; Zhang, X. Impact of Robinia pseudoacacia stand conversion on soil properties and bacterial community composition in Mount Tai, China. For. Ecosyst. 2021, 8, 19. [Google Scholar] [CrossRef]
  36. Tian, H.; Qiao, J.; Zhu, Y.; Jia, X.; Shao, M. Vertical distribution of soil available phosphorus and soil available potassium in the critical zone on the Loess Plateau, China. Sci. Rep. 2021, 11, 3159. [Google Scholar] [CrossRef]
  37. Bao, S.D. Soil and Agricultural Chemistry Analysis; China Agriculture Press: Beijing, China, 2000; pp. 263–270. [Google Scholar]
  38. Peng, X.; Wang, W. Stoichiometry of Soil Extracellular Enzyme Activity along a Climatic Transect in Temperate Grasslands of Northern China. Soil Biol. Biochem. 2016, 98, 74–84. [Google Scholar] [CrossRef]
  39. Faé, G.S.; Montes, F.; Bazilevskaya, E.; Añó, R.M.; Kemanian, A.R. Making Soil Particle Size Analysis by Laser Diffraction Compatible with Standard Soil Texture Determination Methods. Soil. Sci. Soc. Am. J. 2019, 83, 1244–1252. [Google Scholar] [CrossRef]
  40. Liu, Z.-P.; Shao, M.-A.; Wang, Y.-Q. Spatial patterns of soil total nitrogen and soil total phosphorus across the entire Loess Plateau region of China. Geoderma 2013, 197–198, 67–78. [Google Scholar] [CrossRef]
  41. Jones, D.L.; Willett, V.B. Experimental evaluation of methods to quantify dissolved organic nitrogen (DON) and dissolved organic carbon (DOC) in soil. Soil. Biol. Biochem. 2006, 38, 991–999. [Google Scholar] [CrossRef]
  42. Baldrian, P.; Trögl, J.; Frouz, J.; Šnajdr, J.; Valášková, V.; Merhautová, V.; Cajthaml, T.; Herinková, J. Enzyme activities and microbial biomass in topsoil layer during spontaneous succession in spoil heaps after brown coal mining. Soil. Biol. Biochem. 2008, 40, 2107–2115. [Google Scholar] [CrossRef]
  43. Buchfink, B.; Reuter, K.; Drost, H.-G. Sensitive protein alignments at tree-of-life scale using DIAMOND. Nat. Methods 2021, 18, 366–368. [Google Scholar] [CrossRef]
  44. Feng, M.; Li, T.; Zeng, C.; He, B.; Zhang, D. Changes in soil water repellency and soil erosion resistance as affected by land uses in karst environments. J. Environ. Manag. 2024, 368, 122102. [Google Scholar] [CrossRef]
  45. Mehnaz, K.R.; Keitel, C.; Dijkstra, F.A. Phosphorus availability and plants alter soil nitrogen retention and loss. Sci. Total Environ. 2019, 671, 786–794. [Google Scholar] [CrossRef] [PubMed]
  46. Pan, F.; Yu, X.; Chen, M.; Liang, Y. Vegetation recovery reshapes the composition and enhances the network connectivity of phoD-harboring microorganisms to promote P availability in a karst ecosystem. Sci. Total Environ. 2024, 918, 170561. [Google Scholar] [CrossRef] [PubMed]
  47. Liang, J.-L.; Liu, J.; Jia, P.; Yang, T.; Zeng, Q.; Zhang, S.; Liao, B.; Shu, W.; Li, J. Novel phosphate-solubilizing bacteria enhance soil phosphorus cycling following ecological restoration of land degraded by mining. ISME J. 2020, 14, 1600–1613. [Google Scholar] [CrossRef]
  48. Goodfellow, M.; Williams, S.T. Ecology of actinomycetes. Annu. Rev. Microbiol. 1983, 37, 189–216. [Google Scholar] [CrossRef]
  49. Zhao, X.; Tian, P.; Wang, Q. Roots have greater effects on the accumulation of soil microbial residue carbon in microaggregate fractions than leaf litter in a subtropical forest. Geoderma 2024, 442, 116803. [Google Scholar] [CrossRef]
  50. Mitra, D.; Mondal, R.; Khoshru, B.; Senapati, A.; Radha, T.K.; Mahakur, B.; Uniyal, N.; Myo, E.M.; Boutaj, H.; Sierra, B.E.G.; et al. Actinobacteria-enhanced plant growth, nutrient acquisition, and crop protection: Advances in soil, plant, and microbial multifactorial interactions. Pedosphere 2022, 32, 149–170. [Google Scholar] [CrossRef]
  51. Ventura, M.; Canchaya, C.; Tauch, A.; Chandra, G.; Fitzgerald, G.F.; Chater, K.F.; van Sinderen, D. Genomics of Actinobacteria: Tracing the evolutionary history of an ancient phylum. Microbiol. Mol. Biol. Rev. 2007, 71, 495–548. [Google Scholar] [CrossRef]
  52. Javed, Z.; Tripathi, G.D.; Mishra, M.; Dashora, K. Actinomycetes—The microbial machinery for the organic-cycling, plant growth, and sustainable soil health. Biocatal. Agric. Biotechnol. 2021, 31, 101893. [Google Scholar] [CrossRef]
  53. Janssen, P.H. Identifying the dominant soil bacterial taxa in libraries of 16S rRNA and 16S rRNA genes. Appl. Environ. Microbiol. 2006, 72, 1719–1728. [Google Scholar] [CrossRef]
  54. Spain, A.M.; Krumholz, L.R.; Elshahed, M.S. Abundance, composition, diversity and novelty of soil Proteobacteria. ISME J. 2009, 3, 992–1000. [Google Scholar] [CrossRef] [PubMed]
  55. Kielak, A.M.; Castellane, T.C.L.; Campanharo, J.C.; Colnago, L.A.; Costa, O.Y.A.; Corradi Da Silva, M.L.; Van Veen, J.A.; Lemos, E.G.M.; Kuramae, E.E. Characterization of novel Acidobacteria exopolysaccharides with potential industrial and ecological applications. Sci. Rep. 2017, 7, 41193. [Google Scholar] [CrossRef]
  56. Jones, R.T.; Robeson, M.S.; Lauber, C.L.; Hamady, M.; Knight, R.; Fierer, N. A comprehensive survey of soil Acidobacterial diversity using pyrosequencing and clone library analyses. ISME J. 2009, 3, 442–453. [Google Scholar] [CrossRef] [PubMed]
  57. Ma, B.; Wang, Y.; Ye, S.; Liu, S.; Stirling, E.; Gilbert, J.A.; Faust, K.; Knight, R.; Jansson, J.K.; Cardona, C.; et al. Earth microbial co-occurrence network reveals interconnection pattern across microbiomes. Microbiome 2020, 8, 82. [Google Scholar] [CrossRef]
  58. Yuan, M.M.; Guo, X.; Wu Linwei Zhang, Y.; Xiao, N.; Ning, D.; Shi, Z.; Zhou, X.; Wu Liyou Yang, Y.; Tiedje, J.M.; Zhou, J. Climate warming enhances microbial network complexity and stability. Nat. Clim. Change 2021, 11, 343–348. [Google Scholar] [CrossRef]
  59. Du, T.; Hu, Q.; Mao, W.; Yang, Z.; Chen, H.; Sun, L.; Zhai, M. Metagenomics insights into the functional profiles of soil carbon, nitrogen, and phosphorus cycles in a walnut orchard under various regimes of long-term fertilisation. Eur. J. Agron. 2023, 148, 126887. [Google Scholar] [CrossRef]
  60. Rodríguez, H.; Fraga, R. Phosphate solubilizing bacteria and their role in plant growth promotion. Biotechnol. Adv. 1999, 17, 319–339. [Google Scholar] [CrossRef]
  61. Vyas, P.; Gulati, A. Organic acid production in vitro and plant growth promotion in maize under controlled environment by phosphate-solubilizing fluorescent Pseudomonas. BMC Microbiol. 2009, 9, 174. [Google Scholar] [CrossRef]
  62. Langhans, C.; Beusen, A.H.W.; Mogollón, J.M.; Bouwman, A.F. Phosphorus for Sustainable Development Goal target of doubling smallholder productivity. Nat. Sustain. 2022, 5, 57–63. [Google Scholar] [CrossRef]
  63. He, X.; Abs, E.; Allison, S.D.; Tao, F.; Huang, Y.; Manzoni, S.; Abramoff, R.; Bruni, E.; Bowring, S.P.K.; Chakrawal, A.; et al. Emerging multiscale insights on microbial carbon use efficiency in the land carbon cycle. Nat. Commun. 2024, 15, 8010. [Google Scholar] [CrossRef]
  64. Dai, S.; Wang, B.; Ye, R.; Zhang, D.; Xie, Z.; Yu, N.; Cai, C.; Huang, C.; Zhao, J.; Zhang, F.; et al. Structural Evolution of Bacterial Polyphosphate Degradation Enzyme for Phosphorus Cycling. Adv. Sci. 2024, 11, 2309602. [Google Scholar] [CrossRef]
  65. Yang, L.; Du, L.; Li, W.; Wang, R.; Guo, S. Divergent responses of phoD- and pqqC-harbouring bacterial communities across soil aggregates to long fertilization practices. Soil. Tillage Res. 2023, 228, 105634. [Google Scholar] [CrossRef]
  66. Lidbury, I.D.E.A.; Scanlan, D.J.; Murphy, A.R.J.; Christie-Oleza, J.A.; Aguilo-Ferretjans, M.M.; Hitchcock, A.; Daniell, T.J. A widely distributed phosphate-insensitive phosphatase presents a route for rapid organophosphorus remineralization in the biosphere. Proc. Natl. Acad. Sci. USA 2022, 119, e2118122119. [Google Scholar] [CrossRef] [PubMed]
  67. Duhamel, S. The microbial phosphorus cycle in aquatic ecosystems. Nat. Rev. Microbiol. 2024, 1–17. [Google Scholar] [CrossRef]
  68. Zhang, W.; Gao, H.; Huang, Y.; Wu, S.; Tian, J.; Niu, Y.; Zou, C.; Jia, C.; Jin, M.; Huang, J.; et al. Glutamine synthetase gene glnA plays a vital role in curdlan biosynthesis of Agrobacterium sp. CGMCC 2020, 11546. Int. J. Biol. Macromol. 2020, 165, 222–230. [Google Scholar] [CrossRef] [PubMed]
  69. Zhang, Y.; Qin, W.; Hou, L.; Zakem, E.J.; Wan, X.; Zhao, Z.; Liu, L.; Hunt, K.A.; Jiao, N.; Kao, S.-J.; et al. Nitrifier Adaptation to Low Energy Flux Controls Inventory of Reduced Nitrogen in the Dark Ocean. Proc. Natl. Acad. Sci. USA 2020, 117, 4823–4830. [Google Scholar] [CrossRef]
  70. Kuypers, M.M.M.; Marchant, H.K.; Kartal, B. The microbial nitrogen-cycling network. Nat. Rev. Microbiol. 2018, 16, 263–276. [Google Scholar] [CrossRef]
  71. Luo, C.; Zhang, B.; Liu, J.; Wang, X.; Han, F.; Zhou, J. Effects of Different Ages of Robinia pseudoacacia Plantations on Soil Physiochemical Properties and Microbial Communities. Sustainability 2020, 12, 9161. [Google Scholar] [CrossRef]
  72. Bastida, F.; Eldridge, D.J.; García, C.; Kenny Png, G.; Bardgett, R.D.; Delgado-Baquerizo, M. Soil microbial diversity–biomass relationships are driven by soil carbon content across global biomes. ISME J. 2021, 15, 2081–2091. [Google Scholar] [CrossRef] [PubMed]
  73. Tao, F.; Huang, Y.; Hungate, B.A.; Manzoni, S.; Frey, S.D.; Schmidt, M.W.I.; Reichstein, M.; Carvalhais, N.; Ciais, P.; Jiang, L.; et al. Microbial carbon use efficiency promotes global soil carbon storage. Nature 2023, 618, 981–985. [Google Scholar] [CrossRef] [PubMed]
  74. Zhang, M.; Song, X.; Wu, X.; Zheng, F.; Li, S.; Zhuang, Y.; Man, X.; Degré, A. Microbial Regulation of Aggregate Stability and Carbon Sequestration under Long-Term Conservation Tillage and Nitrogen Application. Sustain. Prod. Consum. 2024, 44, 74–86. [Google Scholar] [CrossRef]
  75. Luo, L.; Zhang, J.; Ye, C.; Li, S.; Duan, S.; Wang, Z.; Huang, H.; Liu, Y.; Deng, W.; Mei, X.; et al. Foliar Pathogen Infection Manipulates Soil Health through Root Exudate-Modified Rhizosphere Microbiome. Microbiol. Spectr. 2022, 10, e0241822. [Google Scholar] [CrossRef]
  76. Xie, Z.; Yu, Z.; Li, Y.; Wang, G.; Liu, X.; Tang, C.; Lian, T.; Adams, J.; Liu, J.; Liu, J.; et al. Soil microbial metabolism on carbon and nitrogen transformation links the crop-residue contribution to soil organic carbon. NPJ Biofilms Microbiomes 2022, 8, 14. [Google Scholar] [CrossRef]
  77. Gill, A.L.; Grinder, R.M.; See, C.R.; Chapin, F.S.; DeLancey, L.C.; Fisk, M.C.; Groffman, P.M.; Harms, T.; Hobbie, S.E.; Knoepp, J.D.; et al. Soil carbon availability decouples net nitrogen mineralization and net nitrification across United States Long Term Ecological Research sites. Biogeochemistry 2023, 162, 13–24. [Google Scholar] [CrossRef]
  78. Mosley, O.E.; Gios, E.; Close, M.; Weaver, L.; Daughney, C.; Handley, K.M. Nitrogen cycling and microbial cooperation in the terrestrial subsurface. ISME J. 2022, 16, 2561–2573. [Google Scholar] [CrossRef]
Figure 1. Microbial composition and its changes in soil with the increasing restoration years of R. pseudoacacia. The figure shows changes in the top ten most abundant microbial phyla based on relative abundance. RP10, RP20, RP30, and RP40 represent 10-year-old, 20-year-old, 30-year-old, and 40-year-old R. pseudoacacia plantations, respectively. FL represents farmland.
Agronomy 15 00797 g001
Figure 2. Network analysis of genes related to carbon, nitrogen, and phosphorus cycling (a) and degree centrality scores of the top 30 genes in the network (b).
Agronomy 15 00797 g002
Figure 3. The synergistic functional genes in C (a), N (b), and P (c) cycling change with increasing R. pseudoacacia restoration age. The x-axis represents the cycling functional genes of the synergistic changes in C, N, and P, and the y-axis indicates gene expression abundance (RPKM). Values are shown as mean ± SD (n = 3). RP10, RP20, RP30, and RP40 represent 10-year-old, 20-year-old, 30-year-old, and 40-year-old R. pseudoacacia plantations, respectively. FL represents farmland. Different asterisks indicate significant differences between treatments (one-way ANOVA and LSD test, * indicates p < 0.05, ** indicates p < 0.01).
Agronomy 15 00797 g003
Figure 4. Heatmap of microbial distribution for soil carbon, nitrogen, and phosphorus synergistic variation genes during ecological restoration. The heatmap illustrates the microbial taxa containing functional genes involved in the synergistic cycling of carbon, nitrogen, and phosphorus during ecological restoration, colored by phylum. The gradient of red (right) represents the RPKM values for each synergistic cycling gene. Microbial taxa are organized by hierarchical clustering, based on a Bray–Curtis dissimilarity matrix and the ward.D2 method. Rows represent microbial taxa, and columns represent the synergistic carbon-, nitrogen-, and phosphorus-cycling functional genes.
Agronomy 15 00797 g004
Figure 5. RDA analysis of soil physicochemical properties and soil C (a), N (b), and P (c) functional genes with the increasing restoration years of R. pseudoacacia. The analysis displays the influence of soil properties—total soil carbon (STC), total soil nitrogen (STN), total soil phosphorus (STP), dissolved organic nitrogen (DON), soil available phosphorus (SAP), soil organic carbon (SOC), soil water content (SWC), pH, soil bulk density (SBD), sand content (ST), and clay content (clay)—on synergistically varying functional genes related to carbon (a), nitrogen (b), and phosphorus (c). Red arrows indicate soil physicochemical properties, while blue arrows represent C, N, and P functional genes showing synergistic changes.
Agronomy 15 00797 g005
Figure 6. RDA analysis of soil physicochemical properties and microorganisms associated with functional genes involved in the synergistic cycling of C, N, and P with the increasing restoration years of R. pseudoacacia. The analysis shows the influence of soil physicochemical properties—soil total carbon (STC), soil total nitrogen (STN), soil total phosphorus (STP), dissolved organic nitrogen (DON), soil available phosphorus (SAP), soil organic carbon (SOC), soil water content (SWC), soil pH, soil bulk density (SBD), soil sand content (ST), and soil clay content—on the microbes associated with the synergistic variation of carbon (a), nitrogen (b), and phosphorus (c). Microbial groups include Chl (Chloroflexi), Nit (Nitrospirae), Pro (Proteobacteria), Gem (Gemmatimonadetes), Can_Rok (Candidatus Rokubacteria), Aci (Acidobacteria), Tha (Thaumarchaeota), unc_d_Bac (unclassified Bacteria), Cya (Cyanobacteria), Ver (Verrucomicrobia), Eur (Euryarchaeota), Pla (Planctomycetes), Bac (Bacteroidetes), Act (Actinobacteria), Fir (Firmicutes), and Arm (Armatimonadetes). Microbial diversity indices include Sha (Shannon index), Sim (Simpson index), Ric (Richness index), and Pie (Pielou index). Red arrows represent soil physicochemical properties, while blue arrows represent microbial groups.
Agronomy 15 00797 g006
Figure 7. The Partial Least Squares Structural Equation Model (PLS-SEM) illustrates how soil environmental factors, mediated by microbial composition and diversity across different communities, drive the synergistic changes in soil C, N, and P functional genes with the increasing restoration years of R. pseudoacacia. Subfigures represent (a) the overall microbial community, (b) carbon cycle-related microbes, (c) nitrogen cycle-related microbes, and (d) phosphorus cycle-related microbes. Large boxes denote latent variables, while small boxes represent observed variables. The data within the boxes indicate weights, with lines connecting latent variables indicating paths. Path coefficients are displayed next to the connecting lines, where gray denotes a non-significant relationship, red indicates a significant positive correlation, and green shows a significant negative correlation. “Co-changes function genes” are represented by the first principal component (PCA1) data of the C, N, and P functional genes. The red line represents a positive correlation between variables, with p < 0.05. The green line represents a negative correlation between variables, with p < 0.05. The gray line indicates that there is no significant correlation between variables, with p > 0.05. SRMR (Standardized Root-Mean-Square Residual) is an indicator for evaluating the goodness of fit of the model. An SRMR < 0.08 indicates a good model fit, SRMR < 0.10 means the model fit is acceptable, and SRMR > 0.10 means the model fit is not ideal.
Agronomy 15 00797 g007
Table 1. Soil physicochemical properties and nutrient dynamics of R. pseudoacacia plantation during ecological restoration. Shown are the mean values and the standard error (n = 3).
Soil PropertiesSample Plot
FLRP10RP20RP30RP40
STC (g kg−1)5.83 ± 0.24e10.37 ± 0.29d14.80 ± 0.052c19.39 ± 0.54b22.99 ± 0.34a
STN (g kg−1)0.28 ± 0.0037e0.50 ± 0.015d0.69 ± 0.024c0.92 ± 0.0060b1.06 ± 0.016a
STP (g kg−1)0.59 ± 0.0039a0.55 ± 0.0055c0.57 ± 0.0068b0.55 ± 0.0065bc0.57 ± 0.0051b
DON (mg kg−1)11.13 ± 0.57e18.38 ± 0.85d34.21 ± 2.018c56.87 ± 1.89a46.86 ± 1.21b
SAP (mg kg−1)4.46 ± 0.11a3.48 ± 0.089b2.87 ± 0.10c2.12 ± 0.033d2.27 ± 0.036d
SOC (mg kg−1)49.85 ± 3.17e124.57 ± 3.65d180.94 ± 1.18c359.02 ± 5.37a323.60 ± 5.63b
SWC (%)9.78 ± 0.16c13.54 ± 0.061b14.27 ± 0.35ab15.20 ± 0.11a13.76 ± 0.56b
pH8.41 ± 0.0058a8.30 ± 0.012ab8.25 ± 0.012b8.10 ± 0.015c7.72 ± 0.094d
SBD (g cm−3)1.29 ± 0.0095a1.24 ± 0.0032b1.20 ± 0.0060c1.15 ± 0.0096d1.09 ± 0.0149e
ST (%)18.72 ± 0.171a16.22 ± 0.10b15.18 ± 0.18c13.66 ± 0.17e14.35 ± 0.15d
Clay (%)18.30 ± 0.25d19.10 ± 0.18cd19.92 ± 0.17bc20.43 ± 0.18b22.20 ± 0.44a
Different lowercase letters from one-way ANOVA and Duncan’s multiple range test indicate significant variations among R. pseudoacacia plantation sites (p < 0.05). RP10, RP20, RP30, and RP40 represent 10-year-old, 20-year-old, 30-year-old, and 40-year-old R. pseudoacacia plantations, respectively. FL represents farmland. Abbreviations: total soil carbon (STC), total soil nitrogen (STN), total soil phosphorus (STP), dissolved organic nitrogen (DON), soil available phosphorus (SAP), soil organic carbon (SOC), soil water content (SWC), soil pH (pH), soil bulk density (SBD), soil sand content (ST), and soil clay content (clay).
Disclaimer/Publisher’s Note: The statements, opinions and data contained in all publications are solely those of the individual author(s) and contributor(s) and not of MDPI and/or the editor(s). MDPI and/or the editor(s) disclaim responsibility for any injury to people or property resulting from any ideas, methods, instructions or products referred to in the content.

