Abstract
HYDRUS-3D is a widely used software for modeling variably saturated water flow, but its performance under field conditions requires validation, particularly given the challenges of soil moisture detection. This study aimed to validate the accuracy of HYDRUS-3D in simulating soil water infiltration under drip irrigation using advanced horizontal mobile sensor systems (HMSSs). We designed a three-dimensional soil water infiltration experiment for drip-irrigated fields, employing two HMSSs which were orthogonally placed at 0.2 m and 0.4 m depths from the horizontal plane, and formed a trapezoidal configuration (height: 0.2 m, top edge width: 1 m) on the soil surface. These measurements provided three-dimensional data in the central area and two-dimensional data in the sloped sections. HYDRUS-3D simulations were compared to HMSS measurements, showing strong agreement in both the central area and sloped sections, with high R² values and low RMSE, indicating excellent model accuracy. These results confirm HYDRUS-3D’s reliability in simulating soil water movement under real-world conditions. In particular, the model effectively captured the horizontal fusion process of adjacent drip emitters, which advances its validation for field-scale applications and supports its use in precision agricultural water management.
1. Introduction
Water scarcity has been a serious issue in many countries, especially concerning agricultural water usage [1]. Improving water use efficiency and implementing water-saving measures are essential to addressing this challenge [2,3]. Among modern water-saving techniques, drip irrigation is currently the most efficient, significantly reducing soil water evaporation and deep percolation loss [4,5]. The effective design and management of drip irrigation systems depend on a thorough understanding of water infiltration dynamics.
Soil water infiltration experiments are widely used to study infiltration processes and can be categorized into laboratory tests [6,7] and field tests [8,9]. While laboratory tests are convenient and well suited for specialized research, they may not fully capture real field conditions. Field tests, on the other hand, are valuable for determining optimal irrigation management practices but are often costly and time-consuming. To address these limitations, soil water movement simulation models provide a practical alternative [10,11,12]. Combining field experiments with numerical simulations offers a more efficient and cost-effective approach for tracking soil water dynamics in various drainage indicators in farmlands.
HYDRUS-3D is a widely used and powerful tool for modeling variably saturated water movement [13]. Experimental studies have demonstrated the applicability of HYDRUS-3D across various plant/soil scenarios by using point-scale sensors (such as frequency domain reflectometry (FDR), time domain reflectometry (TDR), and tensiometers) and line-scale sensors (including longitudinal tubular sensors and neutron moisture meters) [14,15,16,17,18]. The main advantage of HYDRUS-3D is its ability to simulate the water movement in three dimensions, making it particularly effective in modeling the interactions between adjacent drip emitters [15]. Point-scale sensors, however, have inherent measurement errors and limited detection ranges [14,15,16]. Similarly, soil moisture data obtained from vertical tube multi-point measuring sensors do not fully capture the infiltration patterns around adjacent drip emitters [15,17,18]. Consequently, many studies validating water movement in HYDRUS-3D have not incorporated three-dimensional data, especially concerning horizontal movement. Elnesr and Alazba assessed the impact of various factors, such as domain geometry, element shape, coordinate system, emitter discharge, and soil texture, on the precision and stability of HYDRUS-2D and HYDRUS-3D simulations [5]. However, their study lacked experimental data to support the validation of these simulations. Therefore, new moisture detection methods and innovative field experiments are necessary to further validate the accuracy of HYDRUS-3D simulations.
A horizontal mobile sensor system (HMSS) has successfully expanded soil moisture measurement from the point scale to the line scale, with its application capability under drip irrigation conditions being well validated [19,20,21,22]. In a comparative study [23], the system was used to evaluate the performance of HYDRUS-2D in a drip-irrigation environment by using the extensive horizontal line-scale data collected. The HMSS’s ability to capture the dynamics of water movement in the horizontal direction became increasingly apparent, highlighting its potential to enhance the validation of the horizontal aspects of HYDRUS-3D, filling gaps where previous studies lacked such data or sensor capabilities.
The main goals of this study are as follows: (a) to investigate the three-dimensional infiltration of drip irrigation water, with a focus on the influence of adjacent drip emitters in the horizontal direction, using the HMSS in innovative field experiments, and (b) to validate the ability of HYDRUS-3D to simulate the three-dimensional infiltration in the field experiment based on the results measured by the HMSS.
2. Materials and Methods
2.1. Field Experiment
The experiment was conducted in a 5 m × 5 m field plot at the Research Field of the Hebei Agricultural University, Baoding, China, in May 2023. The entire process of the field experiment is presented in Figure 1. Two HMSSs were installed orthogonally at depths of 0.2 m and 0.4 m from the horizontal plane in a 5 m × 1 m trench (Figure 2a). The soil surface above each HMSS was shaped into a trapezoid, with a height of 0.2 m and a top width of 1 m. This setup created a soil water infiltration environment with a central cuboid region and sloped sections on the sides.
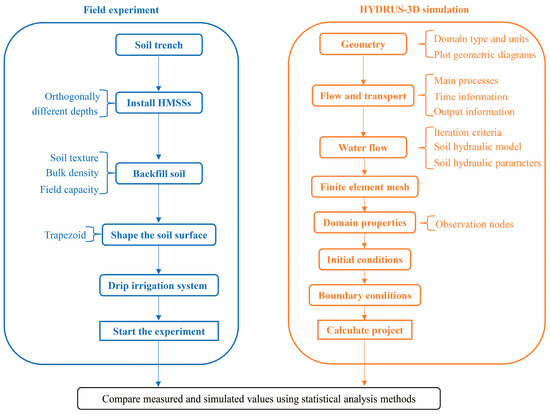
Figure 1.
Diagram depicting the steps of the field experiment and flowchart of the HYDRUS-3D simulation.
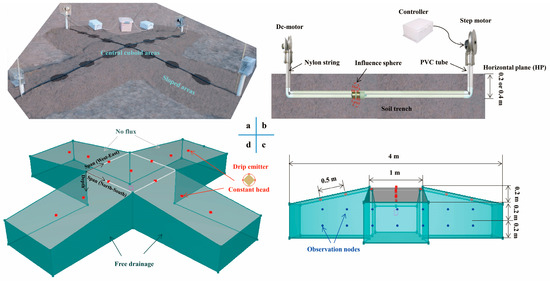
Figure 2.
Field experiment design schematic (a), showcasing two sets of horizontal mobile sensor systems (b) that are orthogonally buried at distances of 0.2 m and 0.4 m from the horizontal plane (HP). The soil surface is configured in a trapezoidal pattern with a drip tube spacing of 0.5 m. The HYDRUS-3D simulation setup is illustrated, including the water flow domain (c) and the boundary conditions (d).
Two sets of drip irrigation tubes (nominal diameter: 20 mm; wall thickness: 0.8 mm) including seven drip emitters were installed above the HMSS as water sources. Emitters were spaced 0.5 m apart, with the emitter at the center of the drip tube aligned with the geometric center of the soil surface. One of the central drip emitters was glued in place to prevent overlap. A pressure gauge (Y-150, accuracy: 0.001 MPa, range: 0–2.5 MPa, Qingdao Huaqing Automation Instrument Co. Ltd., Qingdao, China) was installed between the drip tube and the tap to maintain a constant pressure head of 0.1 MPa and a water flow rate of 1.2 L h−1 per emitter during the drip irrigation experiment. The irrigation lasted about 40 h.
Since soil bulk density is a crucial factor influencing water movement and an essential input parameter for HYDRUS-3D model simulation [14,24], maintaining consistent BD during sensor installation was a key objective. To achieve this, we carefully controlled the soil mass and the trench volume during the backfilling process. The detailed approach is as follows:
The trench was divided into 4 layers, each with a height of 10 cm. Approximately 1300 kg of soil was used and equally assigned in each layer. The soil was manually compacted using a wooden rammer. For the trapezoidal part above the horizontal plane, which was divided into two layers of 10 cm each in height, the soil mass was proportionally reduced according to the calculated volume. To verify the BD, 12 soil samples (2 per layer) were collected during the backfilling process using a ring cutter. Additionally, soil texture was determined from soil cores, and the water content at field capacity was measured using a pressure plate at 33 kPa (Soil Moisture Equipment, Santa Barbara, CA, USA) [25].
2.2. The Horizontal Mobile Sensor System
In the field experiment, we used the HMSS, a tubular dielectric soil moisture sensor with a PVC working pipe developed by ourselves, to collect the volumetric soil water content (VSWC) data [21]. The soil moisture sensor system (Figure 2b) consists of a pair of torus electrodes wrapped around a nylon cylinder, connected to a high-frequency electronic oscillator (100 MHz), which moves smoothly within a PVC tube. When in operation, the two copper ring electrodes act as a capacitor, and the generated edge field penetrates the soil through the PVC pipe. The dielectric constant of the water-bearing soil around the electrode was measured, allowing for the determination of soil volume moisture content.
Compared with conventional soil moisture sensors, HMSS employs a dual motor design. Among them, a stepper motor (Beijing Shidai Chaoqun Electrical Technology Co. Ltd., Beijing, China) drives the probe during measurement, while a DC motor (Mingyang Motor Co. Ltd., Shenzhen, China) operates in the opposite direction to return the sensor to its starting position after each measurement. In addition, the real-time pulse count from the stepper motor enables precise spatial dynamic positioning, enhancing measurement accuracy and reliability. The key technical advantage of the HMSS is its ability to measure soil moisture over a 3.75 m column (or row) at 0.05 m intervals using a single sensor [23]. Although the detection scale of this system is relatively small compared to a large-scale field, we can expand its detection range significantly to a much larger scale (even reaching the order of tens of meters). This can be achieved by extending the length of the PVC pipes and fine-tuning the detection program. However, conducting the field experiment on this larger scale will require more time, as the system must be pre-installed in the designated soil ahead of time. Moreover, the biggest challenge is guaranteeing that the sensor can perform the measurements over such a long distance. The issue arises because the power of the stepper motor and DC motor may not be sufficient to drive the sensors through the extended PVC pipes.
To ensure measurement accuracy, the volumetric soil water content (VSWC) sensors were calibrated with soil samples from the experimental field before installation [21]. The soil was first pulverized using a soil crusher and then sifted through a 2 mm sieve. It was then oven-dried at 105 °C for 24 h. Subsamples were wetted to a range of moisture levels, from dry to near-saturation. These subsamples were then sealed within PVC cylinders. The dimensions of these cylinders (inner diameter of 30 cm and height of 30 cm) were designed to be larger than the sensing volume of the tube sensor. Before packing the soil, a 30 cm-high segment of PVC tube was positioned at the center of each cylinder and fixed in position for 48 h. To guarantee an even distribution of soil moisture, each of these soil/access tube assemblies was turned upside down every 12 h.
2.3. The HYDRUS-3D Model
HYDRUS (2D/3D) is one of the most widely used models for simulating soil water and solute distribution in drip-irrigated farmland [13,26,27]. The HYDRUS-3D software describes the flow of water in a variable saturated porous medium based on the Richards equation [28], sets the head boundary according to the user’s needs, divides the simulation area into a grid, and solves Richard’s water transport equation by using the finite element method, to obtain the distribution results of water in three-dimensional space [29]:
where is the soil volume water content (cm3 cm−3), is the time (h), is the water conductivity of unsaturated soil (cm h−1), is the pressure head (cm), and are horizontal space coordinates, and is vertical space coordinates.
Soil water characteristic curve and soil unsaturated water conductivity were described by Van Genuchten (VG) model [30]:
where is effective saturation:
and where for soil saturated water content (cm3 cm−3), for soil residual water content (cm3 cm−3), for unsaturated soil hydraulic conductivity (cm h−1), for saturated soil hydraulic conductivity (cm h−1), is the pressure head (cm). The parameters , , , and are empirical coefficients that determine the shape of the hydraulic function, where = 1 − 1/, > 1. The Rosetta model embedded in the HYDRUS-3D was used to predict hydraulic parameters (, , , , , and ).
2.4. Modeling Scenarios
The detailed procedure of the HYDRUS-3D (Version 2.04) simulation is illustrated in Figure 1. Three-dimensional-General geometry was employed to model and delineate intricate three-dimensional geometries of the test area (Figure 2c,d). To simulate dripper water penetration in three-dimensional space, the drippers were represented as a circular region matching their actual spatial position and marked on the surface of the geometric model. Soil sampling and analysis during the experimental installation process provided input data, including soil textural classification (3.18% clay (0–2 μm), 69.74% silt (2–50 μm), and 27.08% sand (50–2000 μm)), bulk density (1.29 g cm−3), and field capacity (0.20 cm3 cm−3). These inputs were used in the Rosetta model to predict hydraulic parameters (Table 1).

Table 1.
The specific values for the hydraulic parameters.
As illustrated in Figure 2d, the boundary conditions for the simulation area were defined as follows: (i) the position of the drip emitter on the soil surface is equivalent to a circular area, which was set as the boundary of the constant head (0.1 MPa); (ii) no vegetation cover on the soil surface was present, and meteorological influences, temperature, and soil moisture hysteresis effects were ignored, resulting in a no-flux boundary condition for the soil surface except at the emitter location; (iii) the side edge and the soil ground profile were set as free drainage boundaries. The initial soil moisture (0.11 cm3 cm−3) was based on experimental measurements.
A total of 14 observation points were placed directly below the dripper, at 0.20 m and 0.40 m from the horizontal plane, using the HYDRUS-3D Observation Nodes dialog box, to monitor soil moisture dynamics at these locations during the simulation process. The observation data were compared with the measured results. The simulation duration is 40 h at a time step of 10 min, the same as the actual measurement, resulting in 240 print times.
2.5. Statistical Analysis
Two indicators, including the determination coefficient (R2) and the root mean square error (RMSE), were considered to evaluate the simulation accuracy of the model [15]:
where n is the total number of data points, is the measured value, is the simulated value, and are the mean of the measured value and the mean of the simulated value.
3. Results and Discussion
3.1. Dynamic of Soil Water Infiltration in Central Areas
Due to the symmetry of the experimental setup, the data obtained from the HMSS at different depths (0.2 m and 0.4 m) in the central region were used to create three-dimensional visualizations of the VSWC, which are shown in Figure 3a–c at different times. These figures clearly showed the arrangement of five drippers at the soil surface in the central area, and the progression of horizontal water diffusion over time.
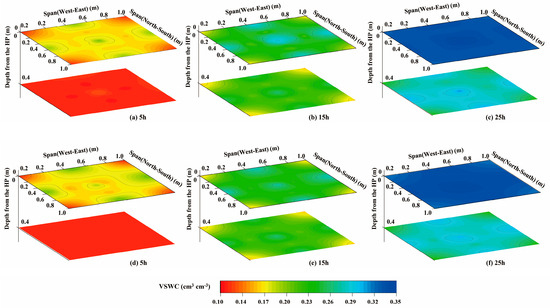
Figure 3.
Comparison of measured (a–c) and simulated (d–f) results for volumetric soil water content (VSWC) at soil depths of 0.20 m and 0.40 m from the horizontal plane (HP) at different times (5 h, 15 h, 25 h) following the irrigation event.
At both 0.2 m and 0.4 m depths, we observed the emergence of an almost-circular saturated ponding area near the emitter, which gradually enlarged over time. This observation was in line with the patterns observed on the soil surface [31]. After five hours of irrigation, water had not yet reached a depth of 0.4 m, leaving the VSWC at the 0.4 m horizontal level that remained unchanged, as seen in Figure 3a. The horizontal distribution of VSWC indicates that after 15 h, the wetting circles extended beyond 25 cm in width, a considerably larger spread than observed by Fernández-Gálvez and Simmonds [32], likely due to the low bulk density of the soil. By the 25th hour, the VSWC at a depth of 0.2 m had reached saturation, while the influence of the five drip emitters could still be observed at a depth of 0.4 m. The simulations using the HYDRUS-3D (Figure 3d–f) captured the process of dripper infiltration and integration in the horizontal direction at different depths. The simulation results closely matched the measurement results, with a minor discrepancy observed in the size of the wetting circle at the 0.2 m depth after 15 h. These results confirm that the HYDRUS-3D simulations are highly consistent with the HMSS measurement results, offering a clear visual representation of water distribution dynamics.
To the best of our knowledge, this is the first time that HMSSs have been used to enable 3D presentation of field measurements and enable direct comparison with simulations. Compared to other methods that have been employed in previous studies for HYDRUS-2D/3D simulation accuracy assessment, such as the gravimetric method [33], point-scale sensors (tensiometers [4,15,34,35,36], time-domain reflectometry [15,36], frequency domain reflectometry [16]), and vertical tube multi-point measuring sensors (neutron probe [10,15]), the HMSS offers distinct technical advantages under drip irrigation conditions [23].
To further assess the accuracy of HYDRUS-3D, comparisons between simulated and field-measured VSWC after irrigation, along with a 1:1 line plot, are presented in Figure 4. The data were composed of simulated observation points and HMSS measurements at the depths of 0.2 m and 0.4 m from the horizontal plane directly below the emitters. The RMSE at 0.2 m depth (0.0076 cm3 cm−3) is notably smaller than that at 0.4 m (0.0126 cm3 cm−3) depth, suggesting greater prediction accuracy near the surface. The causes for the prediction error may include uneven spatial distribution of soil and the temporal variability in soil hydraulic properties [37,38]. Using a 1:1 line to compare 3D measurements with simulated data is uncommon; only Honari et al. evaluated HYDRUS-3D soil moisture simulations of subsurface drip irrigation and obtained the RMSE ranges between 0.0174 and 0.0190 cm3 cm−3 [10]. Our study fills the gap by addressing surface drip irrigation conditions, achieving higher accuracy.
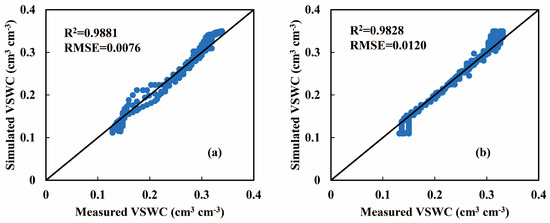
Figure 4.
Comparison of the simulated and measured VSWC at depths of 0.20 m (a) and 0.4 m (b) below the horizontal plane (HP) directly under the drip emitter.
3.2. Dynamic of Soil Water Infiltration in Slope Areas
Figure 5 reveals the process of water infiltration from two emitters on the soil surface in the slope area at different irrigation times. It also highlights the influence of water infiltration from one emitter at the center area and the slope boundary on the slope area. These figures clearly illustrate the sequence in which drip irrigation water reaches different soil planes, and the wetted area convergence. After 2 h of irrigation, water from the emitters, spaced 1.9 m apart, first reaches a depth of 0.2 m in the east–west direction. By the 5th hour, the influence of the central emitter becomes evident at a depth of 0.2 m. Additionally, the wetted area at positions spaced 1.9 m and 1.45 m apart begins to merge. By 15 h, the horizontal wetted areas from different emitters have largely integrated, and after 25 h, the maximum horizontal wetted area that can be achieved through drip irrigation is fully exhibited.
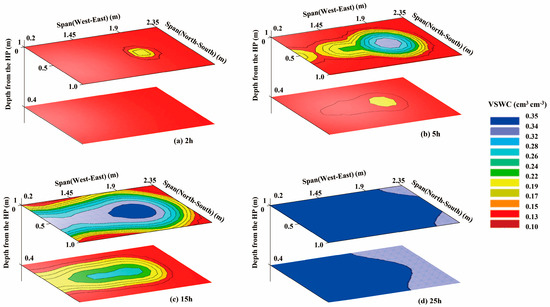
Figure 5.
Simulations of VSWC in slope areas at 2, 5, 15, and 25 h after irrigation.
Interestingly, the VSWC at a depth of 0.4 m below the drip emitters in the slope area is higher than that at 0.2 m in the central area. This suggests vertical infiltration increases with slope steepness, which aligns with the findings of Assouline and Ben-Hur [39]. These results demonstrate that HYDRUS-3D can effectively simulate the dynamics of drip irrigation water movement under slope conditions. Since natural soils are rarely perfectly horizontal, infiltration often occurs on slopes with varying gradients [40]. Furthermore, the results obtained by some theoretical [41,42] and experimental investigations [43,44] have drawn contrasting conclusions about the role of slope on infiltration. Our findings confirm that HYDRUS-3D is an effective technical tool for investigating the influence of slopes on the infiltration process.
Figure 6 demonstrates that the sensor detection results at depths of 0.2 m and 0.4 m in the slope area align closely with the simulation results. At 0.2 m depth (Figure 6a), two hours after irrigation, the horizontal distribution of soil water content highlights the position of the drip head, with a significantly higher water content observed than in other areas. Furthermore, the effect of the slope is evident, as the irrigation water front from the drip head progressively merges over time, ultimately reaching a near-uniform distribution. In contrast, at a depth of 0.4 m (Figure 6b), the horizontal distribution of soil water content appears relatively smooth, though there is a noticeable difference in water content between the two drip head positions. At a relative position of 1.45 m, no distinct wetting front is visible, whereas at 2.35 m, the wetting front is evident. This discrepancy is due to the influence of the slope, which varies the distance between the drip heads and the 0.4 m depth threshold; greater distance leads to a more leveled and gentler wetting front.
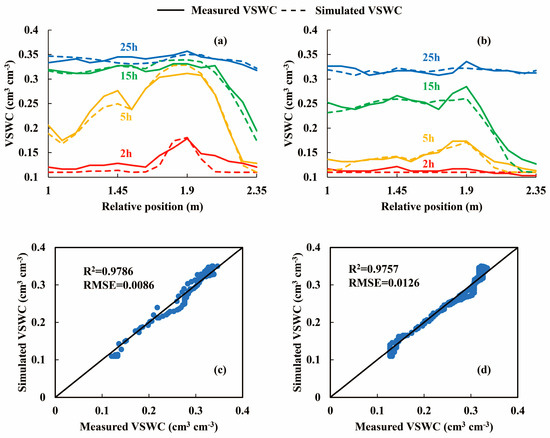
Figure 6.
Comparison between measured and simulated values of VSWC at depths of 0.2 m and 0.4 m from the horizontal plane (HP) in the slope area, showing dynamic changes of VSWC at different locations directly under the drip tube (a,b) and a 1:1 comparison result directly under the drip emitter (c,d).
Compared to the previous studies [4,10,16,17,35,45] on the accuracy validation of the HYDRUS-2D/3D simulation, which focused on vertical cross-sectional profiles at different depths, our research provides horizontal soil continuous distribution results. The merging process of several drippers is visible, highlighting the technical superiority of HMSS in capturing continuous horizontal soil moisture patterns.
By employing the 1:1 line, the simulated data corresponding to the observation point were contrasted against the actual measurements of HMSS detection at depths of 0.2 m and 0.4 m, directly beneath the emission point throughout the entire irrigation process, as shown in Figure 6c,d. The high R2 (≥0.9757) and low RMSE (≤0.0126) at both depths demonstrate the accuracy of HYDRUS-3D in simulating drip irrigation water infiltration. The observed prediction errors are likely due to the spatial heterogeneity of soil properties, such as bulk density, at the field scale [23,24,40], as well as the limited accuracy of soil hydraulic parameters predicted by Rosetta [15]. To address these issues, future field experiments should involve more detailed investigations. For instance, soil could be simulated in layers to minimize its spatial variation. Alternatively, simulations can be conducted using hydraulic parameters obtained from direct measurements or through multi-model fusion, thereby enhancing the accuracy of the model’s predictive accuracy.
In sloped areas, the two-dimensional dataset generated by HMSS measurements from two groups at different depths provides a detailed representation of water infiltration under drip irrigation. Compared to the results obtained from the previous HYDRUS-2D slope simulation [23], our results show superior R2 and RMSE values. This disparity may be attributed to the higher simulation accuracy and reliability of HYDRUS-3D compared to HYDRUS-2D, as reported in [5]. Another contributing factor could be the differences in experimental setups and simulation parameter settings between the two sets of experiments, which may have influenced the outcomes.
4. Conclusions
This field experiment assessed the accuracy of HYDRUS-3D soil moisture simulations under drip irrigation. Two HMSSs, placed orthogonally at different depths, along with a trapezoidal soil-surface setup, provided 3D data for the central area and 2D data for sloped sections. HYDRUS-3D simulations closely aligned with HMSS measurements in both the central area (R2 = 0.9828–0.9881, RMSE = 0.0076–0.0120 cm3 cm−3) and sloped sections (R2 = 0.9757–0.9786, RMSE = 0.0086–0.0126 cm3 cm−3). These results confirm the reliability of HYDRUS-3D for simulating real-world soil water movement under drip irrigation. Furthermore, both HMSS and HYDRUS-3D show potential for monitoring and simulation of water movement in other irrigation contexts, such as sprinkler and flood irrigation. The most significant achievement of this study was the ability of both sensor detection and numerical simulation to effectively capture the horizontal fusion process of adjacent drip emitters, with the results showing a remarkable degree of similarity. However, this study was limited to a specific soil type and a 40 h irrigation experiment. Future research should explore a broader range of soil types, conduct long-term simulations including non-irrigation scenarios, and investigate soil moisture redistribution dynamics.
Author Contributions
Conceptualization, Z.J., B.D., J.Q., G.Z. and G.S.; methodology, C.S., D.Z., X.N., W.C. and G.S.; validation, C.S., X.N., W.C. and G.S.; investigation, C.S., D.Z. and X.N.; resources, G.Z. and G.S.; data curation, C.S., D.Z. and G.S.; writing—original draft preparation, C.S., D.Z. and G.S.; writing—review and editing, C.S., D.Z., Z.J. and G.S. All authors have read and agreed to the published version of the manuscript.
Funding
This work was funded by Science and Technology Project of Hebei Education Department [KY2022002], 2023 Project for the Introduction of Overseas Scholars in Hebei Province [C20230338], Natural Science Foundation of Hebei Province [C2024204061], Introduction of Talents for Scientific Research of State Key Laboratory of North China Crop Improvement and Regulation (NCCIR2022RC-3), Introduction of Talents for Scientific Research of Hebei Agriculture University (YJ2022006), Baoding Science and Technology Plan Project (2494N003), and Hebei Agriculture Research System (HBCT2024200404).
Data Availability Statement
Data are available upon request to the corresponding author.
Conflicts of Interest
The authors declare no conflicts of interest.
References
- Karandish, F.; Šimůnek, J. A comparison of the HYDRUS (2D/3D) and SALTMED models to investigate the influence of various water-saving irrigation strategies on the maize water footprint. Agric. Water Manag. 2019, 213, 809–820. [Google Scholar] [CrossRef]
- Hu, Y.X.; Li, X.W.; Jin, M.G.; Wang, R.; Chen, J.Y.; Guo, S.L. Reduced co-occurrence and ion-specific preferences of soil microbial hub species after ten years of irrigation with brackish water. Soil Tillage Res. 2020, 199, 104599. [Google Scholar] [CrossRef]
- Wang, Z.M.; Li, Z.F.; Zhan, H.B.; Yang, S.F. Effect of long-term saline mulched drip irrigation on soil-groundwater environment in arid Northwest China. Sci. Total Environ. 2022, 820, 153222. [Google Scholar] [PubMed]
- Li, X.W.; Jin, M.G.; Zhou, N.Q.; Jiang, S.M.; Hu, Y.X. Inter-dripper variation of soil water and salt in a mulched drip irrigated cotton field: Advantages of 3-D modelling. Soil Tillage Res. 2018, 184, 186–194. [Google Scholar] [CrossRef]
- Elnesr, M.N.; Alazba, A.A. Computational evaluations of HYDRUS simulations of drip irrigation in 2D and 3D domains (i-Surface drippers). Comput. Electron. Agric. 2019, 162, 189–205. [Google Scholar] [CrossRef]
- Zhao, L.S.; Hou, R.; Wu, F.Q.; Keesstra, S. Effect of soil surface roughness on infiltration water, ponding and runoff on tilled soils under rainfall simulation experiments. Soil Tillage Res. 2018, 179, 47–53. [Google Scholar] [CrossRef]
- Younes, A.; Zaouali, J.; Fahs, M.; Slama, F.; Grunberger, O.; Mara, T.A. Bayesian soil parameter estimation: Results of percolation-drainage vs infiltration laboratory experiments. J. Hydrol. 2018, 565, 770–778. [Google Scholar]
- Jha, M.K.; Mahapatra, S.; Mohan, C.; Pohshna, C. Infiltration characteristics of lateritic vadose zones: Field experiments and modeling. Soil Tillage Res. 2019, 187, 219–234. [Google Scholar] [CrossRef]
- Sheng, F.; Liu, H.H.; Wang, K.; Zhang, R.D.; Tang, Z.H. Investigation into preferential flow in natural unsaturated soils with field multiple-tracer infiltration experiments and the active region model. J. Hydrol. 2014, 508, 137–146. [Google Scholar]
- Honari, M.; Ashrafzadeh, A.; Khaledian, M.; Vazifedoust, M.; Mailhol, J.C. Comparison of HYDRUS-3D Soil Moisture Simulations of Subsurface Drip Irrigation with Experimental Observations in the South of France. J. Irrig. Drain. Eng. 2017, 143, 04017014. [Google Scholar] [CrossRef]
- Jiang, Q.J.; Qi, Z.M.; Lu, C.; Tan, C.S.; Zhang, T.Q.; Prasher, S.O. Evaluating RZ-SHAW model for simulating surface runoff and subsurface tile drainage under regular and controlled drainage with subirrigation in southern Ontario. Agric. Water Manag. 2020, 237, 106179. [Google Scholar] [CrossRef]
- Bailey, R.T.; Bieger, K.; Flores, L.; Tomer, M. Evaluating the contribution of subsurface drainage to watershed water yield using SWAT+ with groundwater modeling. Sci. Total Environ. 2022, 802, 149962. [Google Scholar] [CrossRef]
- Šimůnek, J.; Van Genuchten, M.T.; Šejna, M. Recent developments and applications of the HYDRUS computer software packages. Vadose Zone J. 2016, 15, 1–25. [Google Scholar] [CrossRef]
- Domínguez-Niño, J.M.; Oliver-Manera, J.; Arbat, G.; Girona, J.; Casadesús, J. Analysis of the variability in soil moisture measurements by capacitance sensors in a drip-irrigated orchard. Sensors 2020, 20, 5100. [Google Scholar] [CrossRef] [PubMed]
- Domínguez-Niño, J.M.; Arbat, G.; Raij-Hoffman, I.; Kisekka, I.; Girona, J.; Casadesús, J. Parameterization of soil hydraulic parameters for HYDRUS-3D simulation of soil water dynamics in a drip-irrigated orchard. Water 2020, 12, 1858. [Google Scholar] [CrossRef]
- Carlos, F.U.; Cristian, K.F.; Marco, G.S.; Mauricio, G.; Humberto, A.; de Miranda Jarbas, H.; Oscar, S.S. Testing the model efficiency of HYDRUS 2D/3D under desert conditions for water content and pore electrical conductivity: A case study in an olive orchard. J. Soil Sci. Plant Nutr. 2022, 22, 1859–1872. [Google Scholar] [CrossRef]
- Morianou, G.; Kourgialas, N.N.; Karatzas, G.P. A review of HYDRUS 2D/3D applications for simulations of water dynamics, root uptake and solute transport in tree crops under drip irrigation. Water 2023, 15, 741. [Google Scholar] [CrossRef]
- Morianou, G.; Karatzas, G.P.; Arampatzis, G.; Pisinaras, V.; Kourgialas, N.N. Assessing Soil Water Dynamics in a Drip-Irrigated Grapefruit Orchard Using the HYDRUS 2D/3D Model: A Comparison of Unimodal and Bimodal Hydraulic Functions. Agronomy 2025, 15, 504. [Google Scholar] [CrossRef]
- Gravalos, I.; Moshou, D.; Loutridis, S.; Gialamas, T.; Kateris, D.; Bompolas, E.; Tsiropoulos, Z.; Xyradakis, P.; Fountas, S. 2D and 3D soil moisture imaging using a sensor-based platform moving inside a subsurface network of pipes. J. Hydrol. 2013, 499, 146–153. [Google Scholar] [CrossRef]
- Gravalos, I.G.; Moshou, D.E.; Loutridis, S.J.; Gialamas, T.A.; Kateris, D.L.; Tsiropoulos, Z.T.; Xyradakis, P.I. Design of a pipeline sensor-based platform for soil water content monitoring. Biosyst. Eng. 2012, 113, 1–10. [Google Scholar] [CrossRef]
- Sun, Y.; Zhou, H.; Qin, Y.; Schulze Lammers, P.; Berg, A.; Deng, H.; Cai, X.; Wang, D.; Jones, S.B. Horizontal monitoring of soil water content using a novel automated and mobile electromagnetic access-tube sensor. J. Hydrol. 2014, 516, 50–55. [Google Scholar]
- Shan, G.; Sun, Y.; Cheng, Q.; Wang, Z.; Zhou, H.; Wang, L.; Xue, X.; Chen, B.; Jones, S.B.; Schulze Lammers, P.; et al. Monitoring tomato root zone water content variation and partitioning evapotranspiration with a novel horizontally-oriented mobile dielectric sensor. Agric. For. Meteorol. 2016, 228, 85–94. [Google Scholar]
- Shan, G.; Sun, Y.; Zhou, H.; Schulze Lammers, P.; Grantz, D.; Xue, X.; Wang, Z. A horizontal mobile dielectric sensor to assess dynamic soil water content and flows: Direct measurements under drip irrigation compared with HYDRUS-2D model simulation. Biosyst. Eng. 2019, 179, 13–21. [Google Scholar]
- Basset, C.; Najm, A.M.; Ghezzehei, T.; Hao, X.X.; Daccache, A. How does soil structure affect water infiltration? A meta-data systematic review. Soil Tillage Res. 2023, 226, 105577. [Google Scholar]
- Zribi, W.; Aragüés, R.; Medina, E.; Faci, J.M. Efficiency of inorganic and organic mulching materials for soil evaporation control. Soil Tillage Res. 2015, 148, 40–45. [Google Scholar]
- Šimůnek, J.; Van Genuchten, M.T.; Šejna, M. Development and applications of the HYDRUS and STANMOD software packages and related codes. Vadose Zone J. 2008, 7, 587–600. [Google Scholar]
- Šimůnek, J.; Van Genuchten, M.T.; Šejna, M. Hydrus: Model use, calibration, and validation. Trans. ASABE 2012, 55, 1261–1274. [Google Scholar]
- Richards, L.A. Capillary conduction of liquids through porous mediums. J. Appl. Phys. 1931, 1, 318–333. [Google Scholar] [CrossRef]
- Gruber, N.; Galloway, J.N. An Earth-system perspective of the global nitrogen cycle. Nature 2008, 451, 293–296. [Google Scholar]
- Van Genuchten, M.T. A closed-form equation for predicting the hydraulic conductivity of unsaturated soils. Soil Sci. Soc. Am. J. 1980, 44, 892–898. [Google Scholar]
- Arbat, G.; Puig-Bargués, J.; Duran-Ros, M.; Barragán, J.; de Cartagena, F.R. Drip-Irriwater: Computer software to simulate soil wetting patterns under surface drip irrigation. Comput. Electron. Agric. 2013, 98, 183–192. [Google Scholar] [CrossRef]
- Fernández-Gálvez, J.; Simmonds, L.P. Monitoring and modelling the three-dimensional flow of water under drip irrigation. Agric. Water Manag. 2006, 83, 197–208. [Google Scholar] [CrossRef]
- Liu, Y.; Ao, C.; Zeng, W.Z.; Srivastava, A.K.; Gaiser, T.; Wu, J.W.; Huang, J.S. Simulating water and salt transport in subsurface pipe drainage systems with HYDRUS-2D. J. Hydrol. 2021, 292, 125823. [Google Scholar] [CrossRef]
- Sakaguchi, A.; Yanai, Y.; Sasaki, H. Subsurface irrigation system design for vegetable production using HYDRUS-2D. Agric. Water Manag. 2019, 219, 12–18. [Google Scholar] [CrossRef]
- Dou, X.; Shi, H.B.; Li, R.P.; Miao, Q.F.; Yan, J.W.; Tian, F.; Wang, B. Simulation and evaluation of soil water and salt transport under controlled subsurface drainage using HYDRUS-2D model. Agric. Water Manag. 2022, 273, 107899. [Google Scholar] [CrossRef]
- Tao, Y.; Li, N.; Wang, S.L.; Chen, H.R.; Guan, X.Y.; Ji, M.Z. Simulation study on performance of nitrogen loss of an improved subsurface drainage system for one-time drainage using HYDRUS-2D. Agric. Water Manag. 2021, 246, 106698. [Google Scholar] [CrossRef]
- Mubarak, I.; Mailhol, J.C.; Angulo-Jaramillo, R.; Ruelle, P.; Boivin, P.; Khaledian, M. Temporal variability in soil hydraulic properties under drip irrigation. Geoderma 2009, 150, 158–165. [Google Scholar] [CrossRef]
- Raij, I.; Ben-Gal, A.; Lazarovitch, N. Soil and irrigation heterogeneity effects on drainage amount and concentration in lysimeters: A numerical study. Agric. Water Manag. 2018, 195, 1–10. [Google Scholar] [CrossRef]
- Assouline, S.; Ben-Hur, M. Effects of rainfall intensity and slope gradient on the dynamics of interrill erosion during soil surface sealing. Catena 2006, 66, 211–220. [Google Scholar] [CrossRef]
- Morbidelli, R.; Saltalippi, C.; Flammini, A.; Govindaraju, R.S. Role of slope on infiltration: A review. J. Hydrol. 2018, 557, 878–886. [Google Scholar] [CrossRef]
- Chen, L.; Young, M.H. Green-Ampt infiltration model for sloping surfaces. Water Resour. Res. 2006, 42, W07420. [Google Scholar] [CrossRef]
- Wang, J.; Chen, L.; Yu, Z. Modeling rainfall infiltration on hillslopes using flux-concentration relation and time compression approximation. J. Hydrol. 2018, 557, 243–253. [Google Scholar] [CrossRef]
- Ribolzi, O.; Patin, J.; Bresson, L.; Latsachack, K.; Mouche, E.; Sengtaheuanghoung, O.; Silvera, N.; Thiébaux, J.P.; Valentin, C. Impact of slope gradient on soil surface features and infiltration on steep slopes in northern Laos. Geomorphology 2011, 127, 53–63. [Google Scholar] [CrossRef]
- Morbidelli, R.; Saltalippi, C.; Flammini, A.; Cifrodelli, M.; Picciafuoco, T.; Corradini, C.; Govindaraju, R.S. Laboratory investigation on the role of slope on infiltration over grassy soils. J. Hydrol. 2016, 543, 542–547. [Google Scholar] [CrossRef]
- Kandelous, M.; Šimůnek, J. Numerical simulations of water movement in a subsurface drip irrigation system under field and laboratory conditions using HYDRUS-2D. Agric. Water Manag. 2010, 97, 1070–1076. [Google Scholar] [CrossRef]
Disclaimer/Publisher’s Note: The statements, opinions and data contained in all publications are solely those of the individual author(s) and contributor(s) and not of MDPI and/or the editor(s). MDPI and/or the editor(s) disclaim responsibility for any injury to people or property resulting from any ideas, methods, instructions or products referred to in the content. |
© 2025 by the authors. Licensee MDPI, Basel, Switzerland. This article is an open access article distributed under the terms and conditions of the Creative Commons Attribution (CC BY) license (https://creativecommons.org/licenses/by/4.0/).