Article

Effects of Drainage Technology on Waterlogging Reduction and Rice Yield in Mid-Lower Reaches of Yangtze River

1
College of Urban and Rural Construction, Hebei Agricultural University, Baoding 071002, China
2
Institute of Farmland Irrigation, Chinese Academy of Agricultural Sciences, Xinxiang 453002, China
3
Institute of Food Crops, Hubei Academy of Agricultural Sciences, Wuhan 430064, China
4
Key Laboratory of North China Water-Saving Agriculture, Ministry of Agriculture and Rural Affairs, Baoding 071001, China
5
Key Laboratory of North China Crop Improvement and Regulation, Hebei Agricultural University, Baoding 071001, China
*
Author to whom correspondence should be addressed.
Agronomy 2025, 15(4), 905; https://doi.org/10.3390/agronomy15040905
Submission received: 5 March 2025 / Revised: 2 April 2025 / Accepted: 2 April 2025 / Published: 5 April 2025

Abstract

As extreme rainfall events become more frequent, leading to increased waterlogging hazards, it is crucial to explore various drainage methods that can alleviate the adverse effects of waterlogging on crop growth, thus addressing challenges related to global food security. Field experiments were carried out to evaluate the impacts of different drainage technologies on waterlogging mitigation, rice growth, dry matter accumulation, and yield. The experimental setup included varying straw blind ditch spacings (2, 3, 4, and 5 m) and subsurface pipe drainage spacings (6, 9, and 12 m), with surface drainage serving as the control (CK). The findings revealed that, in comparison to pipe drainage treatments, blind ditch treatments enhanced subsurface drainage volume by 15.1%. Regarding groundwater levels and soil moisture, the soil moisture in the 0–90 cm soil layer and groundwater levels under the blind ditch treatments were 11.3% and 6.1% lower than those under the CK as well as 22.0% and 23.9% lower than the pipe drainage treatments, respectively. Subsurface drainage treatments led to significant improvements in rice yield, with blind ditch and pipe drainage treatments increasing the yield by 8.0% and 6.0% compared to the CK. Rice yields initially increased before decreasing as burial spacing reduced. The S3 treatment resulted in yield increases of 14.4%, 8.6%, and 10.7% over the S2, S4, and S5 treatments, respectively. The G9 treatment produced 3.6% and 10.4% higher yields compared to the G6 and G12 treatments. The highest rice yield, 7.501 Mg·ha−1, was achieved with a blind ditch spacing of 3 m. Compared to the S4 and S5 treatments, the yield per hectare for the S3 treatment was higher by 0.592 Mg and 0.726 Mg, while the input cost was higher by CNY 3038 and 4560, respectively. Path analysis indicated that root biomass made the largest direct contribution (0.517) to the increase in rice yield. Subsurface drainage contributed to the regulation of soil moisture, reducing leaf biomass while increasing stem biomass, which enabled the blind ditch treatments to produce optimal rice yield. These results provide a scientific basis for agricultural drainage in waterlogged areas.

1. Introduction

Waterlogging disasters disrupt several aspects of crop physiology, including respiration, photosynthesis, root development, carbohydrate synthesis, and grain yield, primarily by altering soil permeability, obstructing nutrient uptake by roots, and impacting the quality of farmland water. Recognized as a significant challenge in agricultural production, waterlogging has been shown to reduce rice yields by more than 80% in years characterized by frequent extreme rainfall events [1]. This not only triggers disruptions in global food supply chains but also poses substantial risks to food security in developing nations, where staple food supplies are vulnerable. Projections for 2050 suggest that the frequency and intensity of waterlogging disasters will increase by 40–60% relative to current levels, with the duration of agricultural waterlogging potentially extending by an additional 23.5 rainy days annually [2]. The middle and lower reaches of the Yangtze River, a key rice-producing region in China, contribute approximately 51.5% of the country’s total rice output [3,4]. Nevertheless, waterlogging, exacerbated by rainfall and inadequate drainage systems, remains the primary factor limiting agricultural productivity in this area [5]. In light of the increasing occurrence of extreme rainfall events due to global climate change, the exploration of effective subsurface drainage technologies to mitigate the adverse effects of waterlogging on crop growth is crucial for tackling global food security concerns.
Subsurface drainage systems are often considered an optimal solution for mitigating waterlogging issues in agricultural land [6]. Numerous studies have indicated that crop yield reductions are strongly associated with excessive soil moisture, which arises from inefficient farmland drainage systems. Subsurface drainage, by effectively removing water from root zones, creates optimal conditions for root respiration [7,8]. For example, the use of perforated plastic pipes for subsurface drainage is a widely adopted method for controlling groundwater levels by removing excess soil and underground water, thereby alleviating waterlogging [9]. Research by Talukolaee et al. [10] demonstrated that subsurface drainage enhanced soil hydraulic conductivity and drainable porosity by lowering groundwater levels, improving soil structure and aeration conditions. In addition, long-term subsurface drainage studies by Askri et al. [11] revealed that these systems increased the groundwater depth by an average of 87%, contributing to the stabilization of groundwater levels. The integration of subsurface drainage strategies with agricultural production methods has proven to be indispensable. Darzi-Naftchali et al. [12] showed that alternate wetting and drying irrigation methods in subsurface-drained areas enhanced various growth and quality traits of rice varieties, surpassing the effects of surface drainage. Sojka et al. [13] found that controlled drainage can mitigate the impacts of climate change on agriculture by reducing both drought and flood risks. Several studies have reported that mid-season drainage suppresses ineffective rice tillering, enhances organic matter mineralization, increases available soil nutrients, and improves root development, thereby boosting rice yields [12,14]. Darzi-Naftchali and Shahnazari [15] examined the effects of mid-season subsurface pipe drainage and surface ditch drainage on rice growth, revealing that nitrogen uptake in subsurface-drained areas was significantly higher than in surface-drained areas, with rice yields higher by 27–68% compared to surface drainage. However, relying solely on individual drainage techniques may not adequately support rice growth under waterlogging conditions exacerbated by global climate change, highlighting their limitations in controlling waterlogging and improving soil quality. The integration of multiple drainage and soil improvement strategies offers promising prospects for enhancing waterlogged farmland and ensuring sustainable land use.
Crop straw, a porous organic material possessing notable strength and durability, has been recognized for its considerable potential for enhancing rice growth, boosting grain yield, and improving waterlogged farmland [16,17]. Post-rainfall, an increase in drainage intensity or a reduction in drainage spacing is often essential to expedite the removal of excess soil water. Plastic drainage pipes are recognized for their advantages such as convenient installation and corrosion resistance. But, as the drainage spacing decreases, the engineering cost also keeps increasing. To mitigate the high costs associated with plastic subsurface drainage, Nazrul Islam et al. [18] demonstrated that the application of straw to cover drainage pipes could lower installation expenses, alleviate waterlogging pressures more effectively, and enhance crop yields. Jia et al. [19] reported that the drainage capacity of farmland utilizing rice-husk-based subsurface drainage pipes was 2–3 times greater than that of conventional systems. In addition to cost reduction, straw drainage has been shown to significantly improve drainage efficiency. Lu et al. [20] compared the drainage performance of straw and plastic pipes, revealing that straw modules demonstrated markedly superior drainage rates, leaching efficiency, and groundwater level reduction when compared to plastic drainage pipes. Due to its porous nature, straw enhances drainage and can serve as an eco-friendly alternative to plastic drainage solutions. Yang et al. [21,22] demonstrated that buried straw drainage, when employed as a drainage method, can alter the soil water’s thermal and microbial properties, reduce soil moisture and groundwater levels significantly, and mitigate waterlogging stress on crops after rainfall. Moreover, crop yields increased by 7.07–20.78%. In conclusion, straw materials offer substantial potential for enhancing drainage performance and improving crop yields. Research aimed at accelerating surface water infiltration into the soil and examining underground drainage patterns under various drainage techniques plays a crucial role in establishing optimal drainage systems and maximizing their benefits.
Enhancing the efficiency of drainage system regulation in waterlogged agricultural lands is essential for maintaining consistent production and increasing income in the primary grain-producing regions of the middle and lower Yangtze River. This technological advancement not only addresses the immediate demands for sustainable regional agricultural development but also provides critical technical support for the establishment of a global food security framework [23,24]. Accordingly, the present study investigated the rice cultivation systems in waterlogging-prone areas of the middle and lower Yangtze River, with the objective of examining
(1)
The regulatory effects of drainage on groundwater levels and soil moisture;
(2)
The methods through which drainage affects rice growth and yield;
(3)
The interaction mechanisms between waterlogging alleviation and rice physiology on drainage.

2. Materials and Methods

2.1. Description of the Experimental Site

The experimental site was situated in a representative waterlogging-prone agricultural area in the middle and lower reaches of the Yangtze River, specifically within the Ezhou Base of the Hubei Academy of Agricultural Sciences (114°53′ E, 30°23′ N), covering a total planned area of 210 ha. The southern portion of the site is characterized by undulating hills and low mountains, extending from the Mubu Mountain range, while the northern region, adjacent to the river, consists of ridge plains. The southwestern area borders Liangzi Lake and is marked by low hills. The site falls within a subtropical monsoon climate zone, where the frequency of rainy days and heavy rainfall events has remained relatively stable, with a slight upward trend. The region has a mean annual temperature of 17 °C, an atmospheric pressure of 1011 hPa, and a relative humidity of 76% and receives an average of 129 rainy days annually, with a total precipitation of 1350 mm. The daily sunshine duration averages 5.3 h, with a sunshine percentage of 45%, wind speeds of 2.9 m·s−1, and a frost-free period ranging from 268 to 272 days. Meteorological data for the rice growing season in 2024 are presented in Figure 1. The site is noted for its deep and fertile soil layers, with a mature layer located at a depth of 30–40 cm. The experimental plot was characterized by loam-textured soil, with the fundamental physicochemical properties systematically presented in Table 1 and Table 2.

2.2. Experimental Design

The subsurface drainage systems in this study were designed with straw ditch spacings of 2 m (S2), 3 m (S3), 4 m (S4), and 5 m (S5), and pipe spacings of 6 m (G6), 9 m (G9), and 12 m (G12), all at a burial depth of 0.6 m and a slope of 0.5%, in addition to a surface drainage (CK) system. The field construction of the agricultural drainage systems, which included blind ditches and pipe drainage, was carried out from April to May 2024. Each plot was enclosed with cement walls on all sides, with conventional surface drainage outlets, and the wall foundation extended 60 cm below ground level. A collection ditch, 2 m wide and 1.2 m deep, was excavated along the longitudinal direction at the center of each plot to collect drainage water, monitor drainage volume, and gather water samples. Adjustable gates were installed between the field collection ditches and external drainage channels to regulate the field water levels. Construction of the pipe drainage system began in April 2024 and was completed by early May 2024. Prior to construction, measurements and line laying were performed in accordance with the specified spacing. A light grab excavator was employed, with depth and slope measurements taken every 5 m. The bottom of the ditch was leveled manually afterward. The drainage pipes used were 110 mm perforated PVC corrugated pipes wrapped in non-woven fabric. Each pipe was connected to a 1 m length of 110 mm solid PVC pipe at the outlet end to facilitate drainage discharge, with removable caps installed for water management purposes. After backfilling, collection ditches were dug at the terminal ends, lined with weed prevention fabric, and reinforced with flood prevention bags. The wire was used to secure the connections between the drainage pipes and the weed prevention fabric to prevent detachment. Except for the mechanical excavation of drainage and collection ditches, all other procedures were carried out manually. Construction of the blind ditch drainage system commenced in early May 2024 and was completed by mid-May 2024. The straw-filled blind ditches were 25 cm wide and 20 cm high, with straw compacted to a bulk density of 180 kg·m−3 and evenly distributed at the bottom. The excavation and backfilling procedures mirrored those of the pipe drainage system. To obtain comprehensive monitoring data for waterlogged farmland drainage, groundwater observation wells and Trime soil profile moisture monitoring tubes were installed at the central position between every two ditches (pipes) in each treatment. Taking the pipe drainage treatment as an example, when the pipe spacing (S) was 6 m, the groundwater observation wells and Trime soil profile moisture monitoring tubes were placed at the midpoint (3 m) between adjacent pipes. The groundwater observation wells were constructed using 250 cm long, 50 mm PVC pipes with perforated walls, covered with anti-clogging filters. The pipes were installed with 200 cm below the ground and 50 cm above the ground. The layout of the subsurface drainage system and soil sampling points is shown in Figure 2.

2.3. Crop Planting Scheme

The experimental field spanned an area of 1.1 ha, and the rice variety selected was EZhong No. 6. Sowing occurred on 25 May 2024, with transplantation on 23 June. The average plant spacing was 20 cm, and the row spacing was 25 cm. A compound fertilizer (15% N, 6.54% P, and 12.45% K) was applied as base fertilizer at 270 kg·ha−1 prior to transplanting. Following transplantation, flood irrigation was initiated, maintaining a field water level of approximately 5 cm. The herbicide application took place on July 15, followed by the insecticide application on 16 July. On 4 August, the field was drained to regulate rice tillering. Flood irrigation resumed on 16 August, followed by intermittent irrigation. The field was drained again on 23 September, as the rice approached maturity, and harvesting was completed on 12 October.

2.4. Monitoring Indicators and Methods

Soil samples from the 0–20 cm layer were collected using a ring knife sampling method at five points prior to land preparation in 2024. The soil properties were analyzed according to the National Standards and Industry Standards of China, including pH (NY/T 1377-2007) [25], organic matter (NY/T 85-1988) [26], total nitrogen (GB 7173-1987) [27], total phosphorus (NY/T 88-1988) [28], total potassium (LY/T 1234-2015) [29], hydrolyzable nitrogen (LY/T 1229-1999) [30], available phosphorus (NY/T 1121.7-2014) [31], and available potassium (NY/T 889-2004) [32].
A GEM groundwater level sensor, along with a data logger, was utilized to monitor real-time fluctuations in groundwater levels during periods of water submergence. Data were automatically recorded every 12 h, with the frequency maintained at 12 h intervals following rainfall events. Once the groundwater level stabilized, the monitoring interval was adjusted to 24 h. Following the completion of surface water drainage, measurements of drainage flow were initiated. The drainage flux from each subsurface pipe and blind ditch outlet was recorded every 12 h, measured by the volume of water collected per unit of time until the drainage process concluded. Soil profile moisture content was assessed using a TRIME moisture meter, which was calibrated using the oven-drying method. Soil moisture variations were monitored prior to sowing, during various growth stages, and at the conclusion of the growing season. Soil samples were taken in 10 cm intervals from the 0–90 cm soil layer.
Plant height, tiller number, and leaf area were measured at the tillering, jointing, heading, filling, and harvesting stages. For each treatment, five representative rice plants were selected, with three replications. The roots, stems, leaves, and panicles were separated, subjected to a heat treatment at 105 °C for 0.5 h, and then dried at 75 °C to a constant weight for biomass determination. At maturity, rice plants from a 1 m2 area were harvested for each treatment with three replications. Following drying, grain weight, straw weight, panicle weight, seed setting rate, 1000-grain weight, and overall yield were measured.

2.5. Data Analysis

All statistical analyses, encompassing correlation analysis, significance testing, and variance analysis, were conducted utilizing SPSS 27.0 (SAS Institute Inc., Chicago, IL, USA). Data were organized using Excel (Excel 2021®, Microsoft Corp., Redmond, WA, USA), and data visualization was performed with Origin Pro 2024 (Origin Lab, Northampton, MA, USA).

3. Results

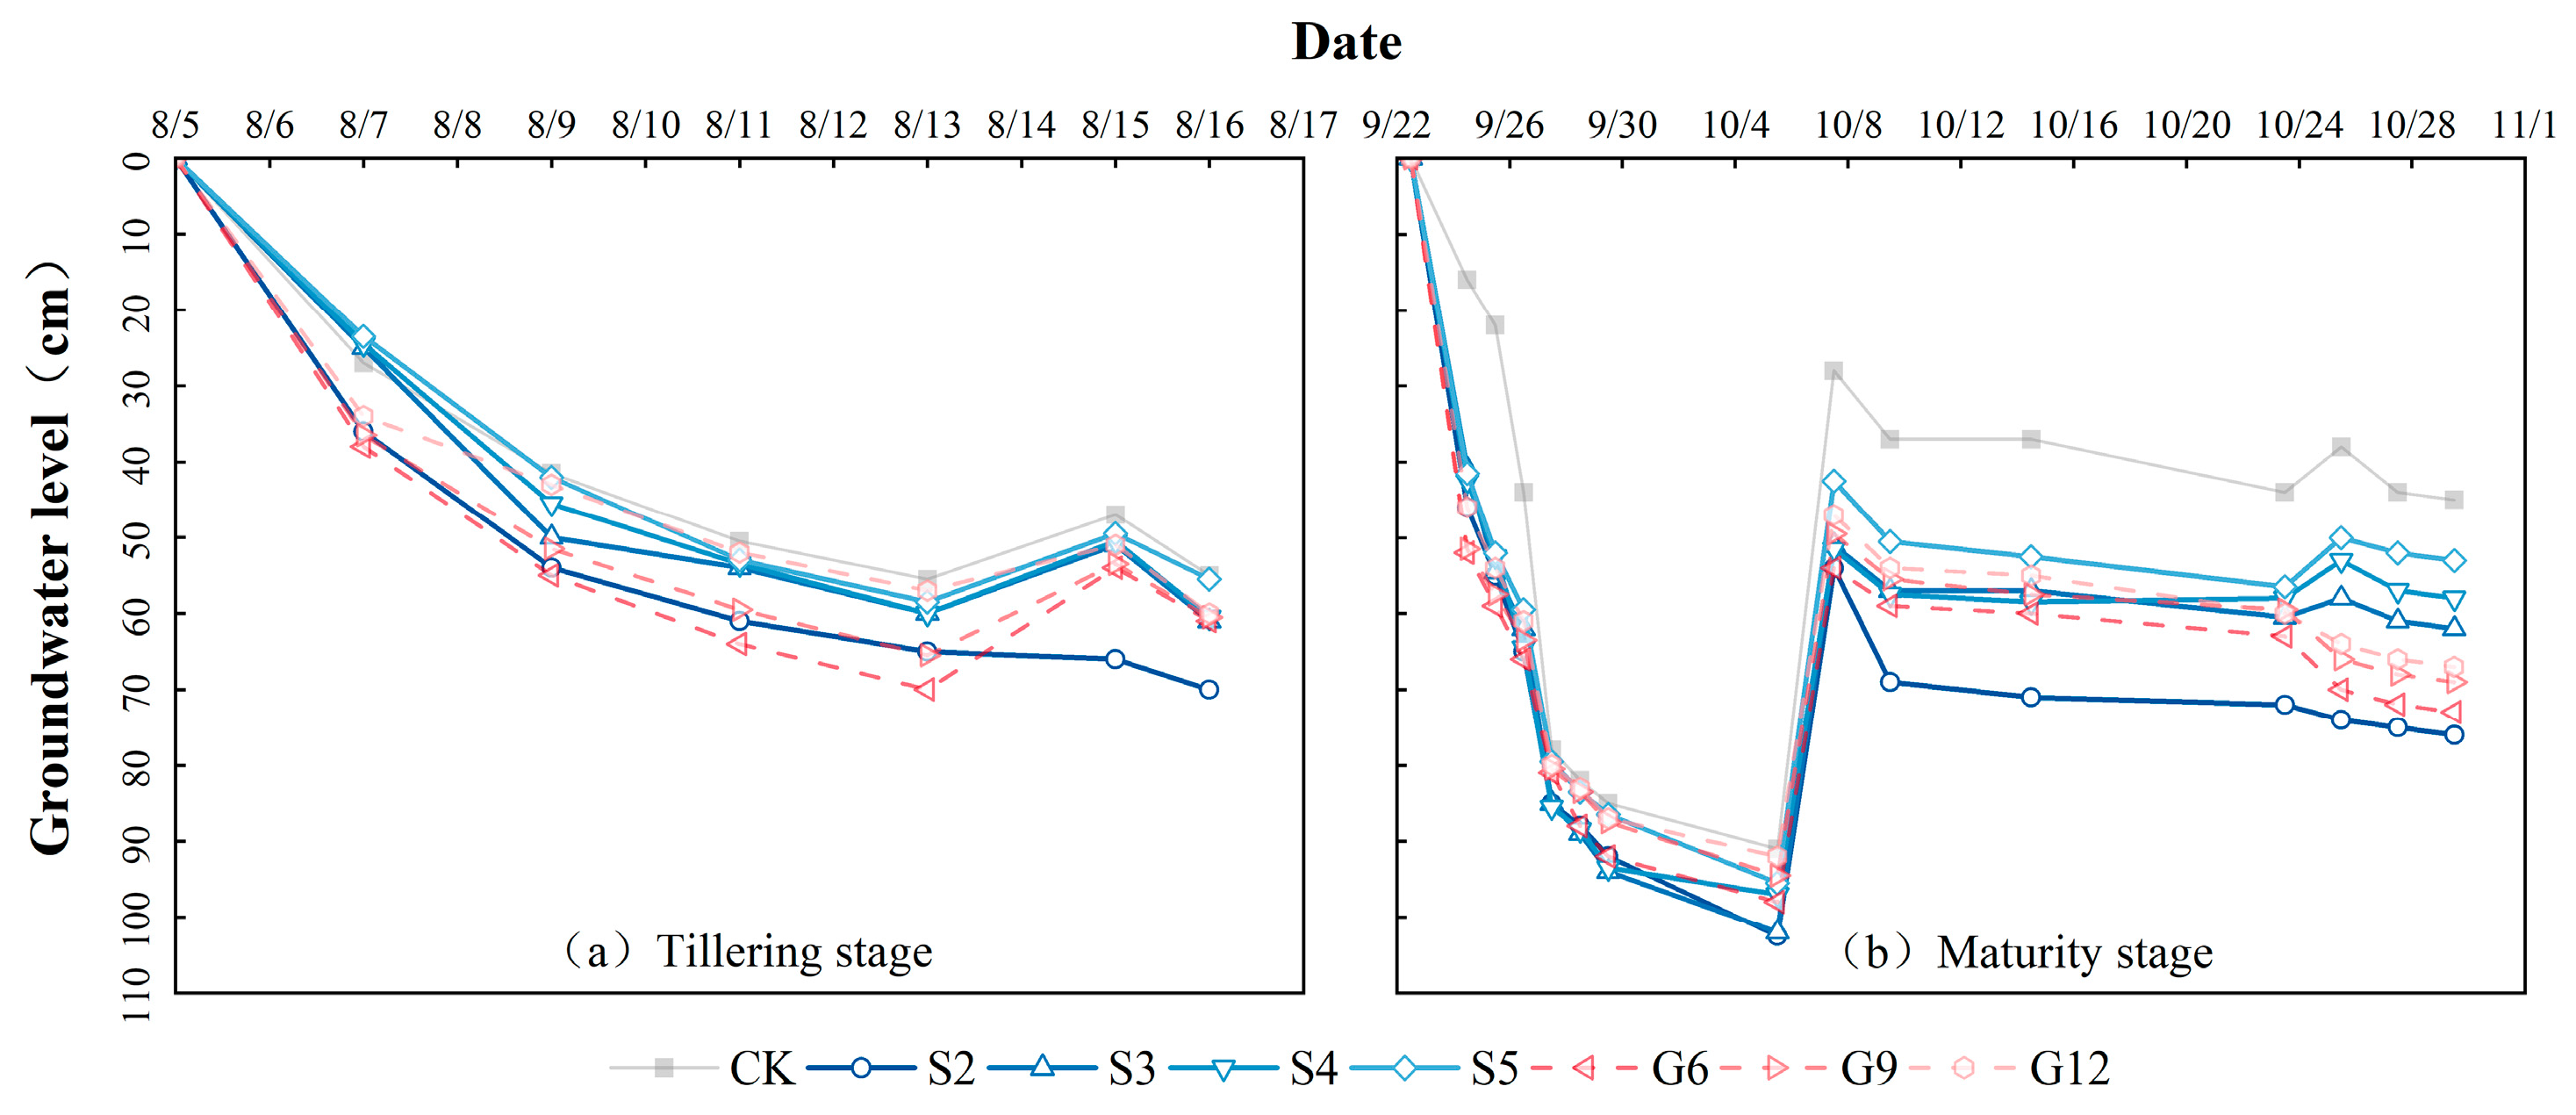
3.1. Comparison of Different Treatment Drainage Effects

A comparative analysis of drainage volumes across different treatments during the tillering and maturity stages was conducted (Figure 3). The results revealed that, relative to pipe drainage, the subsurface drainage volume under the blind ditch treatment was higher by 15.1%. During the tillering stage, the cumulative drainage volume in the blind ditch area generally decreased as burial spacing increased. Specifically, the drainage volume in the S2 treatment was higher by 6.4%, 9.1%, and 210.6% compared to the S3, S4, and S5 treatments, respectively (p < 0.05). In contrast, no significant difference was found between the G6 and G9 treatments in the pipe drainage area. Nevertheless, both the G6 and G9 treatments exhibited significantly higher drainage volumes than the G12 treatment, with increases of 352.0% and 381.7%, respectively (p < 0.05). During the maturity stage, the cumulative drainage volume in the blind ditch area similarly decreased as burial spacing increased. The drainage volume of the S2 treatment was 92.7%, 576.3%, and 792.7% greater than that of the S3, S4, and S5 treatments, respectively (p < 0.05). Furthermore, the drainage volume of the G6 treatment was 146.0% and 303.3% greater than that of the G9 and G12 treatments, respectively (p < 0.05). Overall, the S2 treatment was found to be the most effective in improving the subsurface drainage volume.
A comparative analysis of the groundwater level dynamics across the various treatments during the tillering and maturity stages was performed (Figure 4). The results revealed that, in comparison to the pipe drainage treatment, the ditch drainage treatment led to a reduction in groundwater levels by 22.0% and 23.9% relative to CK and the pipe drainage treatment, respectively. Over time, the groundwater levels in all treatments steadily decreased but exhibited rapid increases, followed by gradual declines, in response to the rainfall events. During the tillering stage, the ditch drainage area generally displayed a decreasing trend in groundwater drawdown depth as burial spacing increased. Upon the completion of drainage, the groundwater drawdown depth in the S2 treatment was 14.8%, 15.7%, and 26.1% greater than that observed in the S3, S4, and S5 treatments, respectively. A similar pattern was observed in the pipe drainage area, where the groundwater drawdown depth also decreased with increasing burial spacing. Upon drainage completion, the groundwater drawdown depth in the G6 treatment was 0.8% and 1.7% higher than those in the G9 and G12 treatments, respectively. During the maturity stage, the ditch drainage area maintained the same pattern, with the S2 treatment showing groundwater drawdown depths that were 22.6%, 31.0%, and 43.4% greater than those of the S3, S4, and S5 treatments, respectively, after drainage completed. Similarly, in the pipe drainage area, the G6 treatment exhibited groundwater drawdown depths that were 5.8% and 9.0% higher than those in the G9 and G12 treatments, respectively. Overall, the S2 treatment was found to be the most effective in lowering the groundwater levels after drainage.

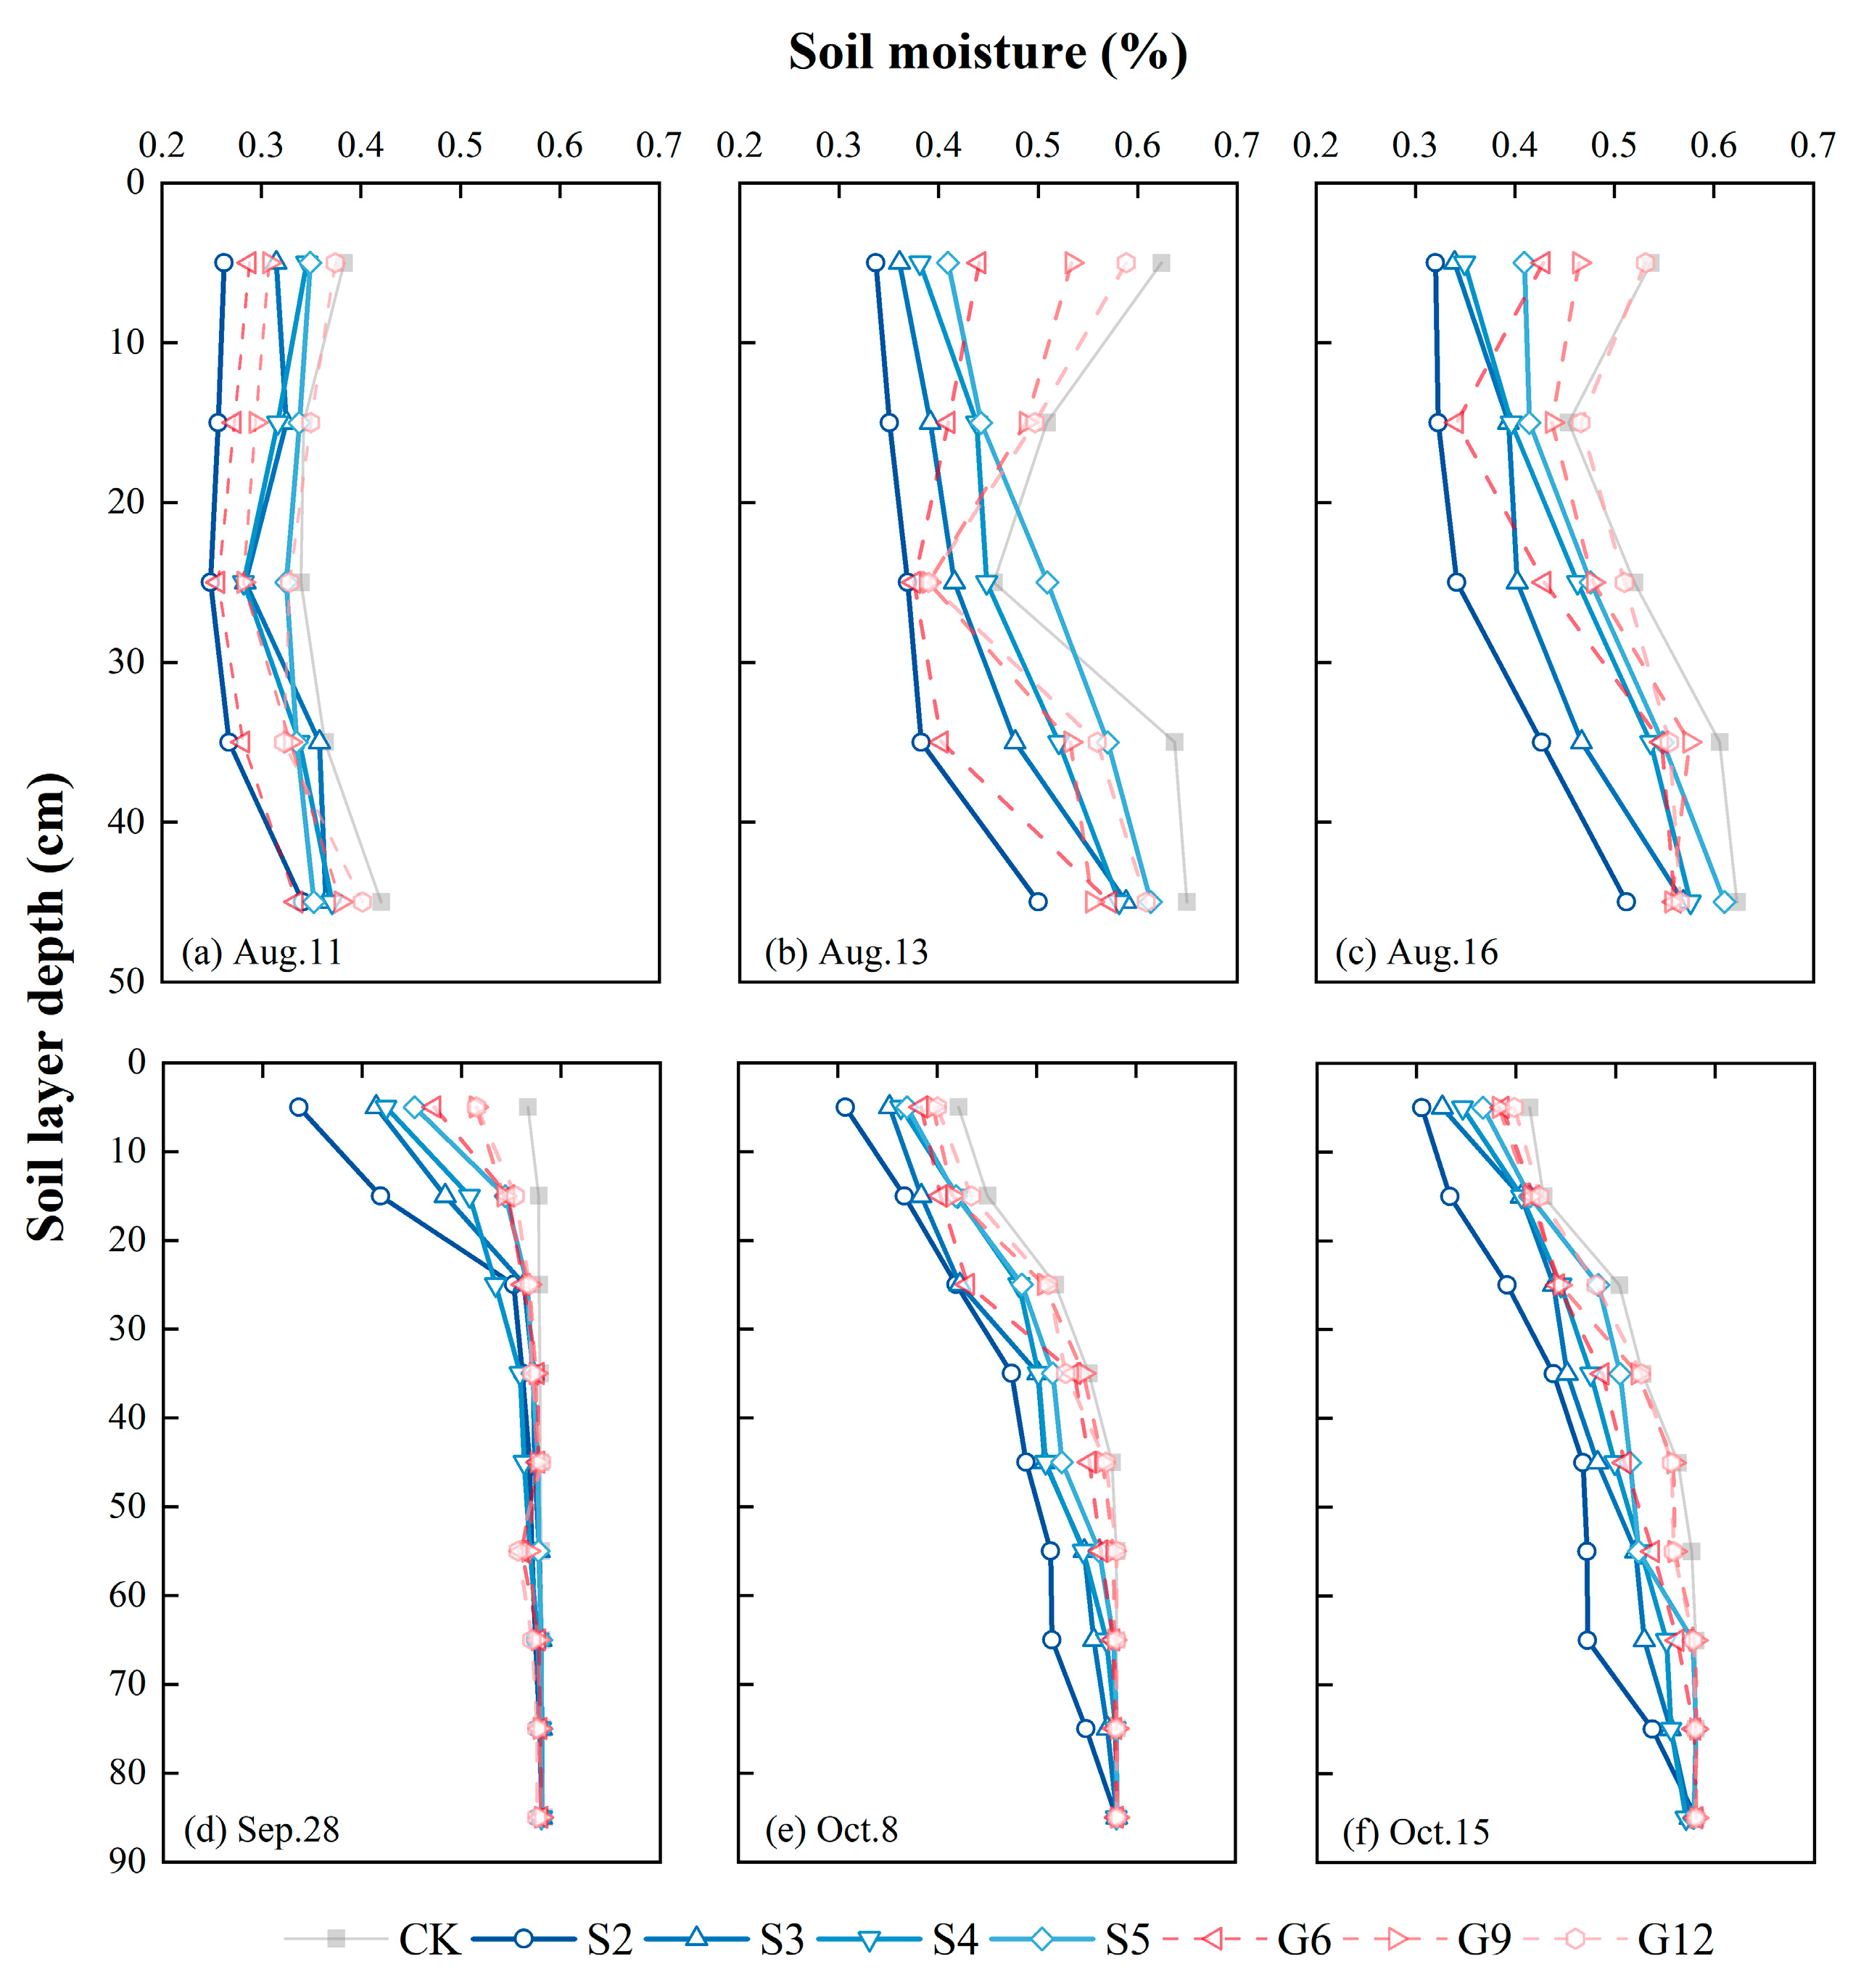
3.2. Effects of Different Treatments on Soil Moisture

A comparative analysis of the soil moisture across the different soil layers under the various treatments during the tillering and maturity stages was performed (Figure 5). The results revealed that, when compared to subsurface pipe drainage, the soil moisture in the 0–90 cm layer under the blind ditch treatment decreased by 11.3% and 6.1% relative to the CK and subsurface pipe drainage, respectively. Over time, a gradual decrease in soil moisture was observed for all treatments. However, after rainfall events, the surface soil moisture exhibited a pattern characterized by rapid increases, followed by gradual declines. During the tillering stage, the blind ditch drainage area generally exhibited higher soil moisture in all soil layers as burial spacing increased. Specifically, the average soil moisture in all layers in the S2 treatment was 12.8%, 20.6%, and 27.9% lower than that in the S3, S4, and S5 treatments, respectively. A similar trend was observed in the subsurface pipe drainage area, where soil moisture increased with increasing burial spacing. The average soil moisture in the G6 treatment was 8.9% and 14.0% lower than in the G9 and G12 treatments, respectively. During the maturity stage, the blind ditch drainage area continued to display a trend of increasing soil moisture with increasing burial spacing. The average soil moisture in all layers in the S2 treatment was 7.2%, 9.5%, and 13.7% lower than in the S3, S4, and S5 treatments, respectively. Similarly, in the subsurface pipe drainage area, soil moisture increased with burial spacing, with the G6 treatment showing reductions of 2.7% and 4.0% compared to the G9 and G12 treatments, respectively. In comparing the two drainage methods, the S2 treatment demonstrated the most effective reduction in soil moisture after drainage.

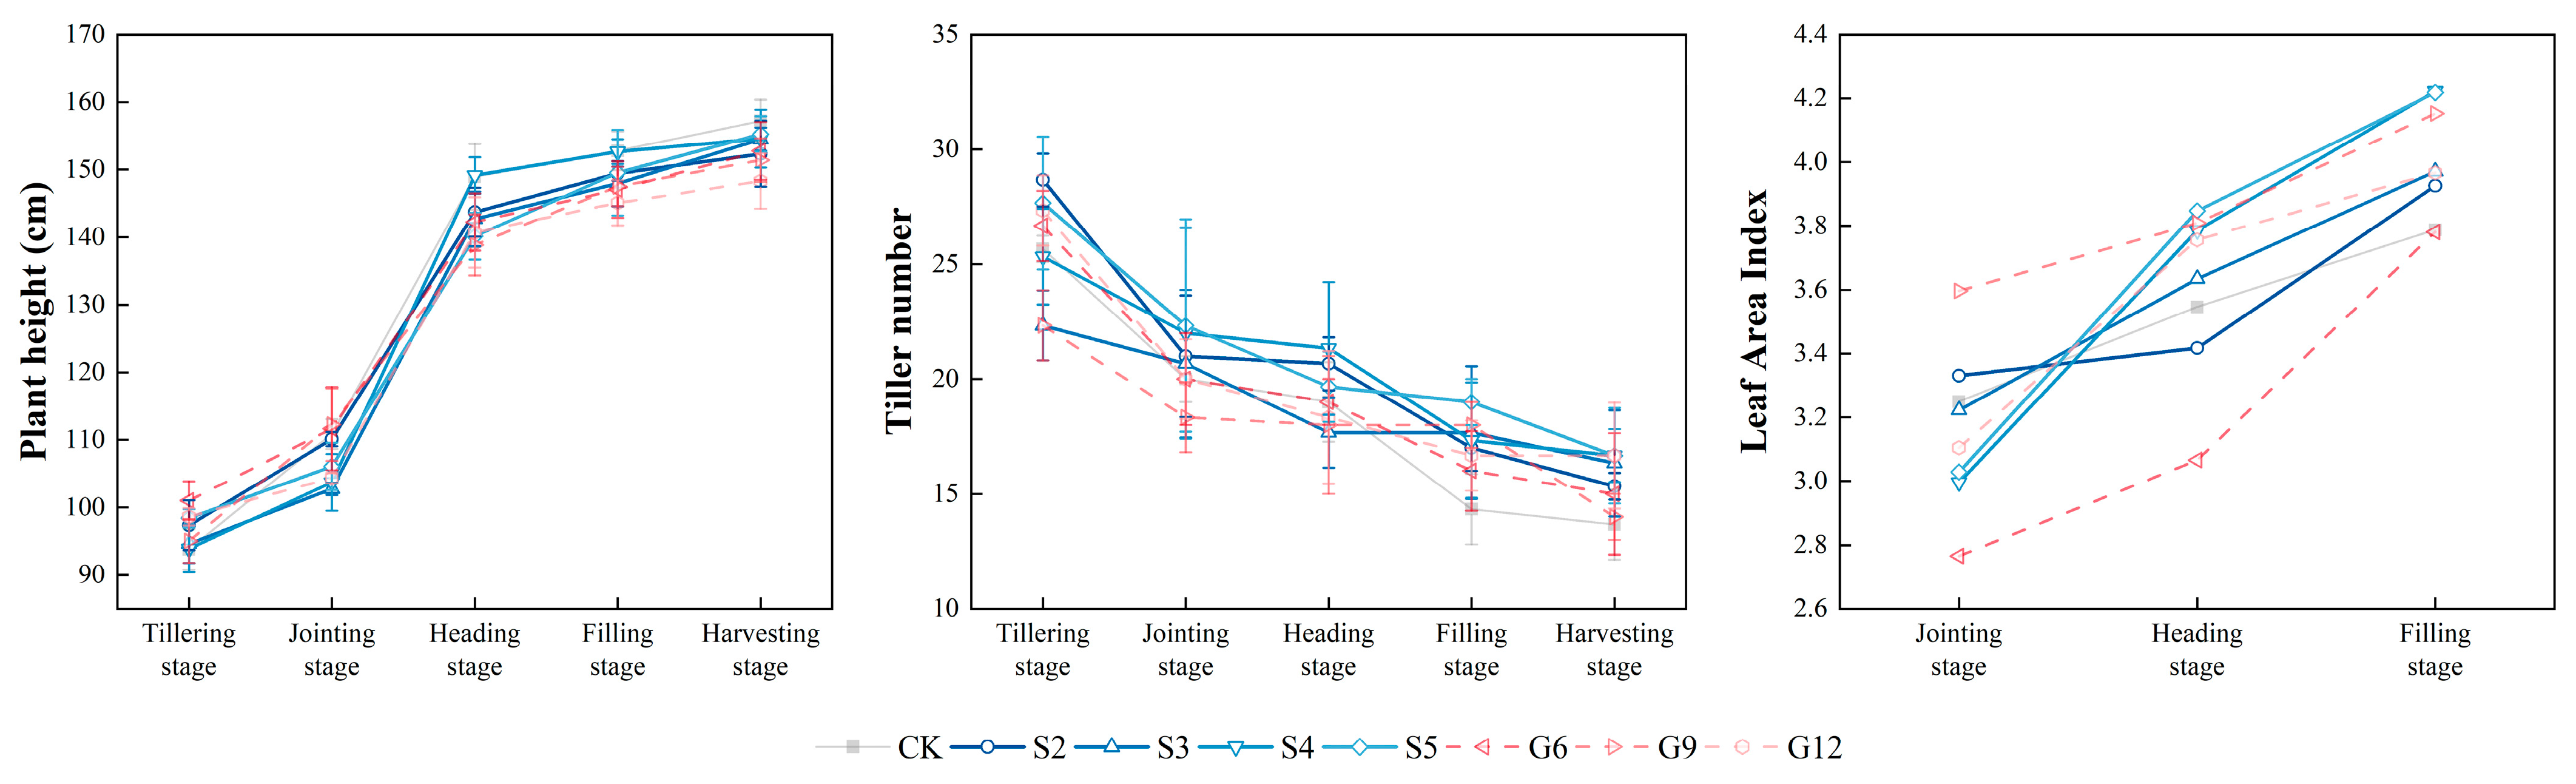
3.3. Effects of Different Treatments on Rice Growth

A comparative analysis of rice growth parameters under various treatments was conducted (Figure 6). The results revealed that as rice growth advanced, the minimum tiller number gradually declined in all treatments, while the maximum plant height and leaf area index exhibited an upward trend. In the blind ditch drainage area, with increasing burial spacing, the maximum plant height and minimum tiller number generally increased in all treatments, whereas the maximum leaf area index initially increased before showing a decrease. Specifically, in the S2 treatment, the maximum plant height was 1.4%, 1.5%, and 1.9% lower than in the S3, S4, and S5 treatments, respectively. The minimum tiller number in the S2 treatment was lower by 6.5%, 8.7%, and 8.7% relative to the S3, S4, and S5 treatments, while the maximum leaf area index in the S4 treatment was higher by 7.5%, 6.3%, and 0.1% compared to the S2, S3, and S5 treatments. In the subsurface pipe drainage area, as burial spacing increased, the maximum plant height decreased, while the minimum tiller number followed a trend of an initial decline, followed by an increase, and the maximum leaf area index showed an initial increase, followed by a decrease. The maximum plant height in the G6 treatment decreased by 0.9% and 3.0% compared to the G9 and G12 treatments, respectively. The minimum tiller number in the G9 treatment was 7.1% and 19.0% lower than in the G6 and G12 treatments, while the maximum leaf area index in the G9 treatment increased by 9.8% and 4.7% compared to the G6 and G12 treatments. Comparing the two systems, the S5 treatment demonstrated the most significant effect on increasing the plant height, the G9 treatment was the most effective in reducing tiller number, and the S4 treatment showed the best performance in enhancing the leaf area index.

3.4. Effects of Different Drainage Treatments on Rice Biomass Accumulation

A comparative analysis of the biomass accumulation in different rice organs among the various treatments was performed (Figure 7). The findings revealed that as rice development progressed, the leaf biomass in all treatments initially increased before decreasing. In contrast, the root, stem, and panicle biomass exhibited two distinct trends: either an initial increase followed by a decrease or a continuous rise. In the blind ditch drainage area, with increasing burial spacing, the maximum root and stem biomass values initially rose before declining, while the maximum leaf biomass showed a gradual decrease. The maximum panicle biomass followed a pattern of increase, decrease, and subsequent increase. Specifically, the maximum root and stem biomasses in the S3 treatment were 22.6%, 12.7%, and 6.8% as well as 3.6%, 13.3%, and 10.1% greater than in the S2, S4, and S5 treatments, respectively. The maximum leaf biomass in the S2 treatment increased by 2.1%, 3.5%, and 19.7% compared to the S3, S4, and S5 treatments, respectively. The maximum panicle biomass in the S3 treatment was 12.4%, 12.9%, and 0.4% higher than in the S2, S4, and S5 treatments, respectively. In the subsurface pipe drainage area, as burial spacing increased, the maximum root and leaf biomass values gradually decreased. The maximum root and leaf biomass in the G6 treatment were 6.6%, 16.7% and 8.0%, 12.7% higher than those in the G9 and G12 treatments, respectively. The maximum stem and panicle biomass exhibited an initial increase followed by a decrease, with the G9 treatment showing values that were 4.7%, 11.0%, and 3.4%, 2.5% higher than the G6 and G12 treatments, respectively. A comparison of the two systems revealed that the S3 treatment produced the most significant improvement in the rice root, stem, and panicle biomass, while the G6 treatment was most effective in enhancing leaf biomass.

3.5. Effects of Different Treatments on Rice Yield

A comparative analysis of rice yield and yield components under various treatments (Table 3) was conducted, revealing that both blind ditch and subsurface pipe drainage treatments resulted in yield increases of 8.0% and 6.0%, respectively, compared to CK. In the blind ditch drainage area, both yield and harvest index exhibited an initial increase followed by a decrease as burial spacing increased. The yield and harvest index in the S3 treatment were significantly higher than those in the S2, S4, and S5 treatments, with increases of 14.4%, 8.6%, and 10.7% in yield, and 19.2%, 14.9%, and 13.4% in harvest index, respectively (p < 0.05). However, no significant differences were observed in the seed setting rate or 1000-grain weight between S3 and the other treatments (S2, S4, S5). The S3 treatment exhibited slight increases of 8.2%, 8.1%, and 5.8% in the 1000-grain weight and 3.6%, 2.7%, and 1.4% in the seed setting rate compared to the S2, S4, and S5 treatments, respectively. In the subsurface pipe drainage area, the yield and harvest index followed a similar trend, with an initial increase that was followed by a decrease as pipe spacing increased. The G9 treatment resulted in significantly higher yield and harvest index compared to the G6 and G12 treatments, with increases of 3.6% and 10.4% in yield as well as 25.6% and 35.4% in harvest index, respectively (p < 0.05). However, no significant differences were observed in the seed setting rate or 1000-grain weight between the G9, G6, and G12 treatments. The G9 treatment produced increases in the seed setting rate by 6.1% and 7.5% compared to the G6 and G12 treatments, while its 1000-grain weight decreased by 0.4% and 3.8%, respectively. Overall, a comparison between the two drainage systems indicated that the S3 treatment produced the most effective performance in enhancing rice yield.
A cost analysis of a construction project of a blind ditch and subsurface pipe (Table 4) was conducted, revealing that compared to the S4 and S5 treatments, the input cost per hectare for the S3 treatment was higher by CNY 3038 and 4560, respectively, while its rice yield increased by 0.592 Mg and 0.726 Mg, respectively. The input cost per hectare for the G9 treatment was increased by CNY 3358 compared to the G12 treatment, and its rice yield increased by 0.672 Mg compared to G12. In comparing these two systems, we observed that the material cost of the blind ditch was approximately 65% lower than that of subsurface pipe (due to the resource utilization of agricultural waste). However, their construction required additional mechanical trenching and straw-filling steps, resulting in a 50% increase in labor costs. These experimental data and input cost results indicate that smaller spacing configurations can achieve higher drainage efficiency but incur relatively higher costs. Nevertheless, when balancing rice yield and investment costs, a 3 m spacing for blind ditch was proven to be the most effective.

3.6. Factors Affecting Soil Water Environment Improvement and Rice Yield Through Subsurface Drainage Conditions

To elucidate the relationships between soil water environment, crop growth, and yield using different subsurface drainage materials and under varying spacing conditions, a multiple regression analysis was performed on the actual yield, soil water conditions, and crop physiological growth indicators to ascertain the path coefficients. As presented in Table 5, the independent variables that had a significant impact on yield included soil water content, plant height, tiller number, leaf biomass, drainage volume, groundwater level, leaf area index, root biomass, stem biomass, and panicle biomass, with the first four exhibiting negative correlations with yield. The path analysis revealed that root biomass made the most substantial direct contribution to yield increase, while the leaf area index produced the least direct influence. Table 6 shows that leaf biomass (i) contributed most significantly to the increase in rice yield through the enhancement in stem biomass (j). These findings indicated that under subsurface drainage conditions, rice root biomass had the most direct influence on yield, and subsurface drainage played a crucial role in promoting rice yield growth by decreasing leaf biomass and increasing stem biomass.

4. Discussion

Straw-based improvement strategies have been shown to influence soil water movement dynamics and enhance crop yields. This paper presents both direct and indirect evidence indicating that rice straw, when used as a drainage material, can mitigate waterlogging damage in paddy fields, particularly in comparison to conventional subsurface pipe. Consequently, straw blind ditches offer significant benefits in reducing waterlogging stress during rice growth in the middle and lower Yangtze River basin in China, a region characterized by frequent rainfall. Field experiments conducted over the entire rice-growing season further confirmed the positive impact of blind straw ditches on rice yield.
The experimental results revealed that the use of straw in blind ditches significantly improved the drainage in paddy fields after sun-drying and rainfall events, thereby alleviating the effects of waterlogging stress on rice growth. This finding contrasts those previous studies that indicated straw incorporation decreased soil water infiltration and reduced water evaporation, leading to an increase in soil water content [33,34]. The observed discrepancy is likely due to alterations in the soil structure resulting from modifications in straw burial techniques. The blind ditch system involved compacted and bundled straw laid at a 0.5% slope in trenches, improving connectivity with collection ditches and enabling the system to function similarly to local subsurface pipe drainage systems, which are used to mitigate waterlogging damage to rice crops [22]. The straw buried beneath the plow layer in the blind ditch created a distinct subsurface water channel. Above this burial depth, the blind ditch disturbed the soil structure within the burial range, enhancing soil permeability and accelerating the reduction in groundwater levels in paddy fields [35,36]. As illustrated in Figure 3, the temporal fluctuations in groundwater levels under various treatments showed that while the blind ditch treatments were initially less effective than pipe drainage in reducing the groundwater levels, their drainage efficiency gradually improved and eventually surpassed that of pipe drainage over time. This suggests that, compared to pipe drainage, blind ditches may offer water storage capabilities that help moderate the rapid decline in groundwater levels [37,38,39]. Furthermore, the spacing of blind ditches and pipe drains played a significant role in drainage performance. In waterlogged areas, the reduced spacing between blind ditches and pipe drains improved drainage efficiency, with closer spacing correlating with faster soil water movement [40,41]. Additionally, soil water movement responses varied with different subsurface drainage materials. Both blind ditch and pipe drainage treatments resulted in greater reductions in groundwater levels and soil water content compared to the CK treatment. However, after initial field drainage, the surface soil water content in the pipe drainage treatment was higher than that in the 20–30 cm soil layer, likely due to the elevated air humidity during rice tillering and the more compact soil layers in the pipe drainage treatment. Evaporation significantly influenced the surface soil moisture in all treatments [42], driving upward water movement from the 20–30 cm soil layer and resulting in fluctuating soil water content in the 0–50 cm layer. In contrast to pipe drainage, the blind ditch treatment had lower moisture levels in the root zone and superior soil permeability, which was reflected in higher drainage volumes and faster declines in soil water content. Below the burial depth, undisturbed soil was more compact than the surface soil, potentially hindering downward water infiltration [43]. The results also revealed that the blind ditch treatment was significantly more effective than pipe drainage in reducing the soil moisture beneath the burial depth. This effect is attributed to the large contact area between the blind straw ditches and the soil, allowing water from the surrounding soil to be collected and discharged through the ditches, promoting the upward movement of soil water from beneath the burial depth [44,45]. The presence of low-moisture-content layers further facilitated the upward seepage of groundwater, accelerating the reduction in soil moisture below the blind ditch burial depth, thereby creating distinct soil moisture dynamics between the blind ditch and pipe drainage systems.
Improvement in crop yield remains a central objective in the assessment of various agricultural management practices [46,47]. The field experiments conducted throughout the rice growing season revealed that the blind ditch treatments yielded superior results in terms of rice plant height, tiller number, leaf area index, and biomass accumulation as well as redistribution across various plant organs, highlighting the potential benefits of using organic drainage materials. During the tillering stage, which is recognized as the most rapid growth period for rice, the plant height in the CK treatment was observed to surpass that of the other treatments following field drainage. This observation aligns with the findings of Zhen [48], Nishiuchi [49], and Lafitte [50]. As depicted in Figure 6, variations in rice plant height, tiller number, and leaf area index under the different drainage treatments throughout the growing period suggested that the rice growth was influenced by the drainage conditions during the tillering stage. The increased plant height and tiller number in the CK treatment were likely a result of enhanced ethylene and gibberellin secretion by plants adapting to waterlogged soil conditions [51,52], which in turn stimulated cell division and elongation, promoting the growth in leaf sheaths, leaves, and internodes, thereby sustaining plant development. However, field drainage during this stage hindered such processes. Subsurface drainage, by improving soil permeability, promoted root zone aeration and increased root activity, thereby inhibiting uncontrolled plant growth [53]. Following the completion of field drainage during the tillering stage, moderate drainage was observed to positively influence rice biomass accumulation, with lasting effects. These effects may be attributed to changes in biomass allocation among rice organs, typically resulting in an increased allocation to the panicles [54,55]. Consequently, this resulted in reduced biomass allocation to the stems and leaves, stimulating panicle biomass accumulation and promoting grain filling, which could be ascribed to rice’s inherent water tolerance. The straw layer, however, may also retain some soil moisture, providing sufficient water for biomass accumulation during the grain-filling period. Hence, irrespective of burial spacing, straw blind ditches are able to supply adequate water for optimal rice growth, preventing both excessive wetness and drought [56]. As shown in Figure 7, the temporal changes in the rice organ biomass under different drainage treatments indicated that moderate drainage favored rice biomass accumulation when compared to the CK treatment. During the heading and grain-filling stages, the S3, S4, and G9 treatments were found to facilitate the conversion of nutrients into panicle biomass. Rice yield initially increased and then declined as the burial spacing decreased. In the S2 and G6 treatments, excessive drainage led to a significant reduction in biomass across all plant organs, resulting in premature senescence. This is attributed to decreased photosynthesis caused by water deficit, which hindered leaf development, limited full leaf expansion, and ultimately restricted overall plant growth [57,58]. Conversely, the S5 and G12 treatments exhibited insufficient drainage under waterlogging stress, leading to markedly reduced panicle biomass accumulation and lower yields. Path analysis revealed that subsurface drainage influenced stem biomass by affecting leaf biomass, which ultimately determined rice yield. These findings align with previous studies [55,59,60], which reported that drought and waterlogging stress reduce rice growth and biomass, likely due to an altered nutrient status. Furthermore, while the G9 and S3 treatments showed comparable waterlogging reduction effects, discrepancies in the final grain yield were observed, with the reduction in waterlogging effects being dependent on drainage volume. This phenomenon can be explained by the following mechanism: Previous studies [13,61] have demonstrated that both waterlogging and drought can limit rice yield. However, at the boundary between wet and dry conditions, soil moisture may not contribute significantly to yield differences. In plots with buried straw, blind ditches may offer additional nutrients, thereby promoting an increase in rice yield. Although the S3 treatment showed the best yield potential, its promotion needs to comprehensively consider the economic cost. A preliminary estimate shows that compared with subsurface pipe drainage, the material cost of blind ditch drainage is reduced by about 65% (thanks to the resource utilization of agricultural waste), but its construction requires additional mechanical trenching and straw-filling steps, and the labor cost increases by about 50%. Long-term maintenance costs (such as the straw renewal cycle and the removal of ditch siltation) may further affect the net income. Our research team is actively developing and evaluating an integrated excavation and burial machine to reduce the labor cost of blind ditch drainage project implementation.
Although these findings highlight that reducing waterlogging disasters and utilizing straw blind ditches can enhance rice yields, several limitations still exist regarding the application of this new drainage technology. This study is based solely on data from a single-season field trial. Although the effectiveness of the technology was preliminarily validated, the long-term performance of straw ditch drainage (e.g., material durability and the stability of groundwater level regulation) still requires further verification through sustained observations across multiple seasons and under diverse climatic conditions [16,20]. Building on previous findings demonstrating that blind straw drainage outperforms subsurface pipe drainage in short-term drainage efficiency, these follow-up experiments will evaluate their sustainability over multiple growing seasons. We are currently actively conducting subsequent rice–wheat and rice–oil crop rotation experiments to further assess the long-term performance of subsurface drainage technology. We are actively developing and assessing such machinery. Furthermore, direct straw return promotes the accumulation of organic acids in the soil, particularly within the rice–wheat rotation system in the middle and lower reaches of the Yangtze River, where organic acids produced by straw return can negatively impact rice seedlings. In addition, the high carbon–nitrogen ratio in straw and the presence of polymers such as cellulose and lignin may act as a natural barrier to the biodegradation of straw. Especially at a relatively high straw return rate, straw may provide suitable conditions for the breeding of pests and pathogens [62]. Straw decomposition increases the levels of CO2 and OA in the soil. These weak acids may accelerate the leaching of BC, thereby causing soil acidification. The overall effect of blind straw ditches must be comprehensively considered to balance agricultural and environmental benefits [63,64]. Finally, although buried straw return achieves effective waterlogging reduction and potential yield increases, its capacity to function in a drainage blind ditch may diminish over time with prolonged use of this cultivation method. This study only employed rice straw as the material for blind ditches. Future research could investigate alternative rot-resistant straw bundling techniques and burial methods to enhance the longevity of blind straw ditch drainage and waterlogging mitigation effects.

5. Conclusions

A blind ditch treatment significantly enhanced subsurface drainage volume, while lowering groundwater levels and soil moisture. When compared to a pipe drainage treatment, the blind ditch treatment resulted in a 15.1% increase in subsurface drainage volume. In terms of groundwater levels and soil moisture, the soil water content in the 0–90 cm soil layer and groundwater levels under the blind ditch treatment were reduced by 11.3% and 6.1%, respectively, in comparison to the CK, and by 22.0% and 23.9% when compared to the pipe drainage treatment. The subsurface drainage treatments notably enhanced rice yield, with the blind ditch and pipe drainage treatments increasing yield by 8.0% and 6.0%, respectively, relative to CK. Rice yield initially increased and subsequently decreased as burial spacing reduced. The S3 treatment led to yield increases of 14.4%, 8.6%, and 10.7% when compared to the S2, S4, and S5 treatments, respectively. The G9 treatment increased rice yield by 3.6% and 10.4% relative to the G6 and G12 treatments. The optimal conditions for robust rice growth and maximum yield (7.501 Mg·ha−1) were attained with a blind ditch spacing of 3 m. Compared to the S4 and S5 treatments, the yield per hectare for the S3 treatment was higher 0.592 Mg and 0.726 Mg, while the input cost increased by CNY 3038 and 4560, respectively. Path analysis revealed that root biomass made the most significant direct contribution to yield increase, while the leaf area index had the smallest direct impact. Subsurface drainage influenced soil moisture regulation, reduced leaf biomass, and enhanced stem biomass, ultimately enabling blind ditch treatment to achieve the highest rice yield.

Author Contributions

B.Q.: conceptualization, methodology, writing—original draft, visualization, data curation, investigation. S.Y.: investigation, resources. D.L.: writing—review and editing, supervision, funding acquisition. D.Q.: data curation, investigation. X.Z. (Xingfei Zheng): data curation, investigation. J.H.: data curation, investigation. X.Z. (Xinguo Zhou): writing—review and editing, project administration, funding acquisition. H.L.: writing—review and editing, project administration, funding acquisition. All authors have read and agreed to the published version of the manuscript.

Funding

This research was funded by the National Key R&D Program (2023YFD2300301; 2023YFD2300304).

Data Availability Statement

The data that support the findings of this study are available from the corresponding author upon reasonable request.

Acknowledgments

Thanks to all authors, reviewers, and editors for their contributions to this article.

Conflicts of Interest

The authors declare that they have no known competing financial interests or personal relationships that could have appeared to influence the work reported in this paper.

References

  1. Awad, A.E.; Abuarab, M.E.; Abdelraouf, R.E.; Bakeer, G.A.; El-Shawadfy, M.A.; Ragab, R. Improving Yield and Irrigation Water Productivity of Green Beans under Water Stress with Agricultural Solid Waste-Based Material of Compacted Rice Straw as a Sustainable Organic Soil Mulch. Irrig. Sci. 2024. [Google Scholar] [CrossRef]
  2. Manik, S.M.N.; Pengilley, G.; Dean, G.; Field, B.; Shabala, S.; Zhou, M. Soil and Crop Management Practices to Minimize the Impact of Waterlogging on Crop Productivity. Front. Plant Sci. 2019, 10, 140. [Google Scholar] [CrossRef] [PubMed]
  3. Zhou, Y.; Ji, Y.; Zhang, M.; Xu, Y.; Li, Z.; Tu, D.; Wu, W. Exploring a Sustainable Rice-Cropping System to Balance Grain Yield, Environmental Footprint and Economic Benefits in the Middle and Lower Reaches of the Yangtze River in China. J. Clean. Prod. 2023, 404, 136988. [Google Scholar] [CrossRef]
  4. Darzi-Naftchali, A.; Mirlatifi, S.M.; Shahnazari, A.; Ejlali, F.; Mahdian, M.H. Effect of Subsurface Drainage on Water Balance and Water Table in Poorly Drained Paddy Fields. Agric. Water Manag. 2013, 130, 61–68. [Google Scholar] [CrossRef]
  5. Zhang, R.; Yue, Z.; Chen, X.; Huang, R.; Zhou, Y.; Cao, X. Effects of Waterlogging at Different Growth Stages on the Photosynthetic Characteristics and Grain Yield of Sorghum (Sorghum bicolor L.). Sci. Rep. 2023, 13, 7212. [Google Scholar] [CrossRef]
  6. Daniel, K.; Hartman, S. How Plant Roots Respond to Waterlogging. J. Exp. Bot. 2024, 75, 511–525. [Google Scholar] [CrossRef]
  7. Takeshima, R.; Murakami, S.; Fujiwara, Y.; Nakano, K.; Fuchiyama, R.; Hara, T.; Shima, T.; Koyama, T. Subsurface Drainage and Raised-Bed Planting Reduce Excess Water Stress and Increase Yield in Common Buckwheat (Fagopyrum esculentum Moench). Field Crops Res. 2023, 297, 108935. [Google Scholar] [CrossRef]
  8. Huang, W.; Yu, X.; Liang, H.; Wu, Y.; Xin, P.; Zhou, F. Subsurface Fluxes Dominate the Dissolved Nitrogen Losses from Rice Paddies in Central China. Agric. Ecosyst. Environ. 2024, 363, 108881. [Google Scholar] [CrossRef]
  9. Halbac-Cotoara-Zamfir, R.; Farias-Ramirez, A.J.; De Miranda, J.H.; Moreno-Pizani, M.A.; Duarte, S.N.; Paredes-Trejo, F.J.; Salvati, L.; Halbac-Cotoara-Zamfir, C. Simulation of Subsurface Drainage in the Sugarcane Crop under Different Spacing and Drain Depths. Land 2022, 11, 626. [Google Scholar] [CrossRef]
  10. Jafari Talukolaee, M.; Darzi Naftchali, A.; Zare Parvariji, L.; Ahmadi, M.Z. Investigating Long-Term Effects of Subsurface Drainage on Soil Structure in Paddy Fields. Soil Tillage Res. 2018, 177, 155–160. [Google Scholar] [CrossRef]
  11. Askri, B.; Khodmi, S.; Bouhlila, R. Impact of Subsurface Drainage System on Waterlogged and Saline Soils in a Saharan Palm Grove. Catena 2022, 212, 106070. [Google Scholar] [CrossRef]
  12. Darzi-Naftchali, A.; Ritzema, H.; Karandish, F.; Mokhtassi-Bidgoli, A.; Ghasemi-Nasr, M. Alternate Wetting and Drying for Different Subsurface Drainage Systems to Improve Paddy Yield and Water Productivity in Iran. Agric. Water Manag. 2017, 193, 221–231. [Google Scholar] [CrossRef]
  13. Sojka, M.; Kozłowski, M.; Stasik, R.; Napierała, M.; Kęsicka, B.; Wróżyński, R.; Jaskuła, J.; Liberacki, D.; Bykowski, J. Sustainable Water Management in Agriculture—The Impact of Drainage Water Management on Groundwater Table Dynamics and Subsurface Outflow. Sustainability 2019, 11, 4201. [Google Scholar] [CrossRef]
  14. Darzi-Naftchali, A.; Motevali, A.; Keikha, M. The Life Cycle Assessment of Subsurface Drainage Performance under Rice-Canola Cropping System. Agric. Water Manag. 2022, 266, 107579. [Google Scholar] [CrossRef]
  15. Darzi-Naftchali, A.; Shahnazari, A. Influence of Subsurface Drainage on the Productivity of Poorly Drained Paddy Fields. Eur. J. Agron. 2014, 56, 1–8. [Google Scholar] [CrossRef]
  16. Han, Y.; Ma, W.; Zhou, B.; Yang, X.; Salah, A.; Li, C.; Cao, C.; Zhan, M.; Zhao, M. Effects of Straw-Return Method for the Maize–Rice Rotation System on Soil Properties and Crop Yields. Agronomy 2020, 10, 461. [Google Scholar] [CrossRef]
  17. Hu, N.; Wang, B.; Gu, Z.; Tao, B.; Zhang, Z.; Hu, S.; Zhu, L.; Meng, Y. Effects of Different Straw Returning Modes on Greenhouse Gas Emissions and Crop Yields in a Rice–Wheat Rotation System. Agric. Ecosyst. Environ. 2016, 223, 115–122. [Google Scholar] [CrossRef]
  18. Islam, M.N.; Bell, R.W.; Barrett-Lennard, E.G.; Maniruzzaman, M. Shallow Drains and Straw Mulch Alleviate Multiple Constraints to Increase Sunflower Yield on a Clay-Textured Saline Soil I. Effects of Decreased Soil Salinity, Waterlogging and End-of-Season Drought. Eur. J. Agron. 2025, 162, 127416. [Google Scholar] [CrossRef]
  19. Jia, Z.; Terasaki, H.; Fukuhara, T.; Zhou, B. Efficient Desalination Method Using a Subsurface Drainage Pipe with Rice Husk in Paddy Fields. Geoderma Reg. 2023, 35, e00725. [Google Scholar] [CrossRef]
  20. Lu, P.; Zhang, Z.; Feng, G.; Huang, M.; Shi, X. Experimental Study on the Potential Use of Bundled Crop Straws as Subsurface Drainage Material in the Newly Reclaimed Coastal Land in Eastern China. Water 2018, 10, 31. [Google Scholar] [CrossRef]
  21. Yang, H.; Zhai, S.; Li, Y.; Zhou, J.; He, R.; Liu, J.; Xue, Y.; Meng, Y. Waterlogging Reduction and Wheat Yield Increase through Long-Term Ditch-Buried Straw Return in a Rice—Wheat Rotation System. Field Crops Res. 2017, 209, 189–197. [Google Scholar] [CrossRef]
  22. Yang, H.; Feng, J.; Zhai, S.; Dai, Y.; Xu, M.; Wu, J.; Shen, M.; Bian, X.; Koide, R.T.; Liu, J. Long-Term Ditch-Buried Straw Return Alters Soil Water Potential, Temperature, and Microbial Communities in a Rice-Wheat Rotation System. Soil Tillage Res. 2016, 163, 21–31. [Google Scholar] [CrossRef]
  23. Qian, Y.; Zhu, Y.; Ye, M.; Huang, J.; Wu, J. Experiment and Numerical Simulation for Designing Layout Parameters of Subsurface Drainage Pipes in Arid Agricultural Areas. Agric. Water Manag. 2021, 243, 106455. [Google Scholar] [CrossRef]
  24. Tian, Y.; Li, D.; Wang, Y.; Zhao, Q.; Li, Z.; Jing, R.; Zhou, X. Effect of Subsurface Drainage Combined with Biochar on the Bacterial Community Composition of Coastal Saline Soil. Water 2023, 15, 2701. [Google Scholar] [CrossRef]
  25. Chen, L.; Zhang, Z.; Tang, Z.; Liu, Y.; Sui, Q.; Huang, W.; Liu, S.; Feng, P.; Guo, Z.; He, H. Existent Forms and Ecological Risk Assessment of Uranium and Heavy Metals in Soil at a Uranium Mining Area in Northern Guangdong, China. J. Radioanal. Nucl. Chem. 2023, 332, 1805–1814. [Google Scholar] [CrossRef]
  26. Sun, N.; Zhang, W.; Liao, S.; Li, H. Divergent Changes in Bacterial Functionality as Affected by Root-Zone Ecological Restoration in an Aged Peach Orchard. Microorganisms 2022, 10, 2127. [Google Scholar] [CrossRef]
  27. Peng, Q.; Xie, Z.; Tang, G.; Jiang, H.; Guo, J.; Mao, Y.; Wang, B.; Meng, Q.; Yang, J.; Jia, S.; et al. Fungal Community Composition and Function in Different Spring Rapeseeds on the Qinghai-Tibet Plateau, China. Plant Soil 2024, 503, 659–675. [Google Scholar] [CrossRef]
  28. Tian, H.; Wang, Y.; Xie, J.; Li, H.; Zhu, Y. Effects of Soil Properties and Land Use Types on the Bioaccessibility of Cd, Pb, Cr, and Cu in Dongguan City, China. Bull. Environ. Contam. Toxicol. 2020, 104, 64–70. [Google Scholar] [CrossRef]
  29. Cuiyun, Y.; Yihang, L.; Jing, Y.; Hongyou, Z.; Zhaoyou, D.; Deying, T.; Oo, A.K.; Lixia, Z. Correlation between Soil Environment and Yield and Quality of Sharen (Amomi Fructus) under Different Planting Patterns. Digit. Chin. Med. 2023, 6, 221–233. [Google Scholar] [CrossRef]
  30. Zhang, R.; Zhou, Z.; Luo, W.; Wang, Y.; Feng, Z. Effects of Nitrogen Deposition on Growth and Phosphate Efficiency of Schima Superba of Different Provenances Grown in Phosphorus-Barren Soil. Plant Soil 2013, 370, 435–445. [Google Scholar] [CrossRef]
  31. Yan, Y.; Chen, Z.; Zhu, F.; Zhu, C.; Wang, C.; Gu, C. Effect of Polyvinyl Chloride Microplastics on Bacterial Community and Nutrient Status in Two Agricultural Soils. Bull. Environ. Contam. Toxicol. 2021, 107, 602–609. [Google Scholar] [CrossRef] [PubMed]
  32. Zhang, C.; Niu, D.; Ren, Y.; Fu, H. Extractability of Nutrients Using Mehlich 3 and Ammonium Bicarbonate-DTPA Methods for Selected Grassland Soils of China. Plant Soil Environ. 2018, 64, 448–454. [Google Scholar] [CrossRef]
  33. Huang, D.; Guo, Y.; Chen, S.; Wang, Z.; Sun, B.; Niu, Y.; Dong, S. Different Straw Lengths and Burial Modes Affect the Salt Distribution in Coastal Saline Soil and the Regulation of Salt Stress Resistance in Tomato. Plant Soil 2025. [Google Scholar] [CrossRef]
  34. Mukhopadhyay, R.; Fagodiya, R.K.; Narjary, B.; Barman, A.; Prajapat, K.; Kumar, S.; Bundela, D.S.; Sharma, P.C. Restoring Soil Quality and Carbon Sequestration Potential of Waterlogged Saline Land Using Subsurface Drainage Technology to Achieve Land Degradation Neutrality in India. Sci. Total Environ. 2023, 885, 163959. [Google Scholar] [CrossRef]
  35. Wu, G.; Ling, J.; Zhao, D.-Q.; Liu, Z.-X.; Xu, Y.-P.; Kuzyakov, Y.; Marsden, K.; Wen, Y.; Zhou, S.-L. Straw Return Counteracts the Negative Effects of Warming on Microbial Community and Soil Multifunctionality. Agric. Ecosyst. Environ. 2023, 352, 108508. [Google Scholar] [CrossRef]
  36. Liu, L.; Ouyang, W.; Liu, H.; Zhu, J.; Ma, Y.; Wu, Q.; Chen, J.; Zhang, D. Potential of Paddy Drainage Optimization to Water and Food Security in China. Resour. Conserv. Recycl. 2021, 171, 105624. [Google Scholar] [CrossRef]
  37. Akhtar, K.; Wang, W.; Khan, A.; Ren, G.; Afridi, M.Z.; Feng, Y.; Yang, G. Wheat Straw Mulching with Fertilizer Nitrogen: An Approach for Improving Soil Water Storage and Maize Crop Productivity. Plant Soil Environ. 2018, 64, 330–337. [Google Scholar] [CrossRef]
  38. Deininger, A.; Tamm, M.; Krause, R.; Sonnenberg, H. SE—Structures and Environment. J. Agric. Eng. Res. 2000, 77, 335–342. [Google Scholar] [CrossRef]
  39. Bagheri Novair, S.; Mirseyed Hosseini, H.; Etesami, H.; Pirmoradian, N.; Asgari Lajayer, B.; Price, G.W. Straw Application Improved Soil Biological Properties and the Growth of Rice Plant under Low Water Irrigation. Environ. Res. 2024, 255, 119138. [Google Scholar] [CrossRef]
  40. Shao, G.-C.; Deng, S.; Liu, N.; Yu, S.-E.; Wang, M.-H.; She, D.-L. Effects of Controlled Irrigation and Drainage on Growth, Grain Yield and Water Use in Paddy Rice. Eur. J. Agron. 2014, 53, 1–9. [Google Scholar] [CrossRef]
  41. Schultz, B.; Zimmer, D.; Vlotman, W.F. Drainage under Increasing and Changing Requirements. Irrig. Drain. 2007, 56, S3–S22. [Google Scholar] [CrossRef]
  42. Wei, X.; Zhou, Q.; Cai, M.; Wang, Y. Effects of Vegetation Restoration on Regional Soil Moisture Content in the Humid Karst Areas—A Case Study of Southwest China. Water 2021, 13, 321. [Google Scholar] [CrossRef]
  43. Tang, H.; Xu, C.; Xu, W.; Xu, Y.; Xiang, Y.; Wang, J. Method of Straw Ditch-Buried Returning, Development of Supporting Machine and Analysis of Influencing Factors. Front. Plant Sci. 2022, 13, 967838. [Google Scholar] [CrossRef] [PubMed]
  44. Zhou, L.-Y.; Zhu, Y.; Kan, Z.-R.; Li, F.-M.; Zhang, F. The Impact of Crop Residue Return on the Food–Carbon–Water–Energy Nexus in a Rice–Wheat Rotation System under Climate Warming. Sci. Total Environ. 2023, 894, 164675. [Google Scholar] [CrossRef]
  45. Ren, X.; Wang, S.; Yang, P.; Tao, Y.; Chen, H. Performance Evaluation of Different Combined Drainage Forms on Flooding and Waterlogging Removal. Water 2021, 13, 2968. [Google Scholar] [CrossRef]
  46. Xu, H.; Wang, H.; Zhang, Y.; Yang, X.; Lv, S.; Hou, D.; Mo, C.; Wassie, M.; Yu, B.; Hu, T. A Synthetic Light-Inducible Photorespiratory Bypass Enhances Photosynthesis to Improve Rice Growth and Grain Yield. Plant Commun. 2023, 4, 100641. [Google Scholar] [CrossRef]
  47. Misra, V.; Solomon, S.; Mall, A.K.; Prajapati, C.P.; Hashem, A.; Abd_Allah, E.F.; Ansari, M.I. Morphological Assessment of Water Stressed Sugarcane: A Comparison of Waterlogged and Drought Affected Crop. Saudi J. Biol. Sci. 2020, 27, 1228–1236. [Google Scholar] [CrossRef]
  48. Zhen, B.; Zhou, X.; Lu, H.; Li, H. Effects of Waterlogging on Rice Growth at Jointing–Booting Stage. Water 2024, 16, 1981. [Google Scholar] [CrossRef]
  49. Nishiuchi, S.; Yamauchi, T.; Takahashi, H.; Kotula, L.; Nakazono, M. Mechanisms for Coping with Submergence and Waterlogging in Rice. Rice 2012, 5, 2. [Google Scholar] [CrossRef]
  50. Lafitte, H.; Yongsheng, G.; Yan, S.; Li, Z.-K. Whole Plant Responses, Key Processes, and Adaptation to Drought Stress: The Case of Rice. J. Exp. Bot. 2006, 58, 169–175. [Google Scholar] [CrossRef]
  51. Pan, J.; Sharif, R.; Xu, X.; Chen, X. Mechanisms of Waterlogging Tolerance in Plants: Research Progress and Prospects. Front. Plant Sci. 2021, 11, 627331. [Google Scholar] [CrossRef]
  52. Singh, P.; Jaiswal, S.; Kushwaha, A.; Gahlowt, P.; Mishra, V.; Tripathi, D.K.; Singh, S.P.; Gupta, R.; Singh, V.P. Peroxynitrite Is Essential for Aerenchyma Formation in Rice Roots under Waterlogging Conditions. Planta 2023, 258, 2. [Google Scholar] [CrossRef] [PubMed]
  53. Chen, M.; Wang, G.; Jing, Y.; Zhou, J.; Song, J.; Chang, F.; Yu, R.; Wang, J.; Wang, W.; Sun, X.; et al. Straw Interlayer Improves Sunflower Root Growth: Evidence from Moisture and Salt Migration and the Microbial Community in Saline-Alkali Soil. J. Integr. Agric. 2024, 23, 3870–3881. [Google Scholar] [CrossRef]
  54. Marcaida, M.; Li, T.; Angeles, O.; Evangelista, G.K.; Fontanilla, M.A.; Xu, J.; Gao, Y.; Li, Z.; Ali, J. Biomass Accumulation and Partitioning of Newly Developed Green Super Rice (GSR) Cultivars under Drought Stress during the Reproductive Stage. Field Crops Res. 2014, 162, 30–38. [Google Scholar] [CrossRef]
  55. Katsura, K.; Okami, M.; Mizunuma, H.; Kato, Y. Radiation Use Efficiency, N Accumulation and Biomass Production of High-Yielding Rice in Aerobic Culture. Field Crops Res. 2010, 117, 81–89. [Google Scholar] [CrossRef]
  56. Cheng, J.; Lin, B.-J.; Chen, J.-S.; Duan, H.-X.; Sun, Y.-F.; Zhao, X.; Dang, Y.P.; Xu, Z.-Y.; Zhang, H.-L. Strategies for Crop Straw Management in China’s Major Grain Regions: Yield-Driven Conditions and Factors Influencing the Effectiveness of Straw Return. Resour. Conserv. Recycl. 2025, 212, 107941. [Google Scholar] [CrossRef]
  57. Nóia Júnior, R.D.S.; Asseng, S.; García-Vila, M.; Liu, K.; Stocca, V.; Dos Santos Vianna, M.; Weber, T.K.D.; Zhao, J.; Palosuo, T.; Harrison, M.T. A Call to Action for Global Research on the Implications of Waterlogging for Wheat Growth and Yield. Agric. Water Manag. 2023, 284, 108334. [Google Scholar] [CrossRef]
  58. Alam, M.S.; Sasaki, N.; Datta, A. Waterlogging, Crop Damage and Adaptation Interventions in the Coastal Region of Bangladesh: A Perception Analysis of Local People. Environ. Dev. 2017, 23, 22–32. [Google Scholar] [CrossRef]
  59. Zhang, J.; Zhang, S.; Cheng, M.; Jiang, H.; Zhang, X.; Peng, C.; Lu, X.; Zhang, M.; Jin, J. Effect of Drought on Agronomic Traits of Rice and Wheat: A Meta-Analysis. Int. J. Environ. Res. Public Health 2018, 15, 839. [Google Scholar] [CrossRef]
  60. Somaweera, K.A.T.N.; Suriyagoda, L.D.B.; Sirisena, D.N.; De Costa, W.A.J.M. Accumulation and Partitioning of Biomass, Nitrogen, Phosphorus and Potassium among Different Tissues during the Life Cycle of Rice Grown under Different Water Management Regimes. Plant Soil 2016, 401, 169–183. [Google Scholar] [CrossRef]
  61. Tang, H.; Wang, D.; Zhao, J.; Xu, C.; Wang, J. Mode and Experiments of a Straw Ditch-Burying Returning and Maturing in Cold Region of Northeast China. Eur. J. Agron. 2023, 151, 127006. [Google Scholar] [CrossRef]
  62. Su, Y.; Lv, J.L.; Yu, M.; Ma, Z.H.; Xi, H.; Kou, C.L.; He, Z.C.; Shen, A.L. Long-term Decomposed Straw Return Positively Affects the Soil Microbial Community. J. Appl. Microbiol. 2020, 128, 138–150. [Google Scholar] [CrossRef] [PubMed]
  63. Liang, F.; Li, B.; Vogt, R.D.; Mulder, J.; Song, H.; Chen, J.; Guo, J. Straw Return Exacerbates Soil Acidification in Major Chinese Croplands. Resour. Conserv. Recycl. 2023, 198, 107176. [Google Scholar] [CrossRef]
  64. Cheng, Z.; Li, A.; Wang, R.; Hu, Q.; Zhou, J.; Li, M.; Wang, T.; He, D.; Zhu, L. Long-Term Straw Return Promotes Accumulation of Stable Soil Dissolved Organic Matter by Driving Molecular-Level Activity and Diversity. Agric. Ecosyst. Environ. 2024, 374, 109155. [Google Scholar] [CrossRef]
Figure 1. Meteorological data for the rice growing season in 2024.
Agronomy 15 00905 g001
Figure 2. Layout of the subsurface drainage system and soil sampling points.
Agronomy 15 00905 g002
Figure 3. Cumulative drainage volumes across treatments during the tillering and maturity stages. S2, S3, S4, and S5 represent ditch spacings of 2 m, 3 m, 4 m, and 5 m, respectively; G6, G9, and G12 represent subsurface pipe spacings of 6 m, 9 m, and 12 m, respectively. Different letters indicate significant differences at p < 0.05 level when compared during the same period.
Agronomy 15 00905 g003
Figure 4. Dynamic changes in groundwater level under different treatments during tillering and maturity stages. S2, S3, S4, and S5 represent ditch spacings of 2 m, 3 m, 4 m, and 5 m, respectively; G6, G9, and G12 represent subsurface pipe spacings of 6 m, 9 m, and 12 m, respectively; CK represents the control treatment with conventional surface drainage.
Agronomy 15 00905 g004
Figure 5. Changes in soil moisture under different treatments during tillering and maturity stages. S2, S3, S4, and S5 represent ditch spacings of 2 m, 3 m, 4 m, and 5 m, respectively; G6, G9, and G12 represent subsurface pipe spacings of 6 m, 9 m, and 12 m, respectively; CK represents the control treatment with conventional surface drainage.
Agronomy 15 00905 g005
Figure 6. Changes in rice growth indicators under various treatments. S2, S3, S4, and S5 represent ditch spacings of 2 m, 3 m, 4 m, and 5 m, respectively; G6, G9, and G12 represent subsurface pipe spacings of 6 m, 9 m, and 12 m, respectively; CK represents the control treatment with conventional surface drainage.
Agronomy 15 00905 g006
Figure 7. Biomass accumulation in different rice organs under various treatments. S2, S3, S4, and S5 represent ditch spacings of 2 m, 3 m, 4 m, and 5 m, respectively; G6, G9, and G12 represent subsurface pipe spacings of 6 m, 9 m, and 12 m, respectively; CK represents the control treatment with conventional surface drainage.
Agronomy 15 00905 g007
Table 1. Basic physical properties of the soil.
Soil Layer Depth (cm)HC
(cm·d−1)
P
(%)
PC
(%)
BD
(g·cm−3)
FC
(%)
EC
(µS·cm−1)
0–200.7350451.3350.97
Note: HC, hydraulic conductivity; P, porosity; PC, particle content; BD, bulk density; FC, field capacity; EC, electrical conductivity.
Table 2. Basic chemical properties of the soil.
Soil Layer Depth (cm)pHOM (g·kg−1)TN (g·kg−1)TP (g·kg−1)TK (g·kg−1)HN (g·kg−1)AP (g·kg−1)AK (g·kg−1)
0–205.9224.562.380.4919.97160.514.97195.4
Note: OM, organic matter; TN, total nitrogen; TP, total phosphorus; TK, total potassium; HN, hydrolyzable nitrogen; AP, available phosphorus; AK, available potassium.
Table 3. Rice yield and yield components under various treatments.
TreatmentYield (Mg·ha−1)Seed Setting Rate1000-grain Weight (g)Harvest Index
CK6.425 ± 0.522 b0.78 ± 0.04 a20.14 ± 0.38 a0.32 ± 0.04 c
S26.558 ± 0.216 b0.80 ± 0.04 a20.13 ± 0.25 a0.40 ± 0.05 abc
S37.501 ± 0.300 a0.83 ± 0.03 a21.79 ± 2.30 a0.48 ± 0.02 a
S46.910 ± 0.479 ab0.81 ± 0.04 a20.15 ± 0.17 a0.42 ± 0.03 ab
S56.775 ± 0.240 ab0.82 ± 0.02 a20.59 ± 0.75 a0.42 ± 0.02 ab
G66.865 ± 0.386 ab0.79 ± 0.01 a20.27 ± 0.82 a0.38 ± 0.01 bc
G97.115 ± 0.366 ab0.83 ± 0.02 a20.18 ± 0.70 a0.48 ± 0.03 a
G126.443 ± 0.068 ab0.78 ± 0.06 a20.96 ± 0.63 a0.35 ± 0.06 bc
Note: S2, S3, S4, and S5 represent ditch spacings of 2 m, 3 m, 4 m, and 5 m, respectively; G6, G9, and G12 represent subsurface pipe spacings of 6 m, 9 m, and 12 m, respectively; CK represents the control treatment with conventional surface drainage. Different letters indicate significant differences at p < 0.05 level when compared during the same period.
Table 4. Cost analysis of construction project of blind ditch and subsurface pipe.
ItemsPrice (CNY·ha−1)
CKS2S3S4S5G6G9G12
Excavate the earth in the trench360012,600960081007200660056004600
Backfill the earthworks0250025002000200017001334700
Layout of the catchment ditch02000200020002000200020002000
Process the 110 mm corrugated pipe with non-woven fabric00000503825
110 mm corrugated pipe with non-woven fabric00000750050003750
Process the rice straw0800534400320000
Rice straw02520168012601008000
110 mm PVC pipe02900193414501160997645484
Artificial management fee50400400400400400400400
Transportation fee0606060601200900600
Engineering cost total365023,78018,70815,67014,14820,44715,91712,559
Note: S2, S3, S4, and S5 represent ditch spacings of 2 m, 3 m, 4 m, and 5 m, respectively; G6, G9, and G12 represent subsurface pipe spacings of 6 m, 9 m, and 12 m, respectively. The assessment of engineering costs was based in actual local prices. (USD/CNY = 7.26; EUR/CNY = 7.84. Date: 28 March 2025).
Table 5. Results of multiple regression analysis (stepwise regression).
Independent VariablesSimple Correlation Coefficient with Actual Yield, Y (r)Unstandardized
Regression Coefficient
Standardized Regression Coefficient (Path Coefficient, Direct Action)Significance
BStandard Error
Soil moisture, X1−0.2282259.0482092.8102.1180.302
Plant height, X2−0.368−1.9804.259−0.1430.650
Tiller number, X3−0.185−3.0607.444−0.1210.688
Leaf biomass, X4−0.127−0.8077.554−0.0430.917
Drainage volumes, X50.183−0.0890.892−0.1080.922
Groundwater level, X60.2269.20911.0371.8180.420
Leaf area index, X70.114155.176101.7680.8000.153
Root biomass, X80.51716.31310.3700.6570.142
Stem biomass, X90.16630.91011.9621.3840.024
Panicle biomass, X100.3292.8984.4790.3280.530
Note: The values under “significance” means the dependent variable was statistically significant for the independent variable (p < 0.05, to more comprehensively add independent variables that significantly affected the dependent variable).
Table 6. Results of multiple regression analysis (stepwise regression).
ij
Drainage Volumes, X5Groundwater Level, X6Leaf Area Index, X7Root Biomass,
X8
Stem Biomass, X9Panicle Biomass, X10
Soil moisture, X10.11370.84220.13220.26400.69250.0713
Plant height, X20.00170.25070.26270.25660.62810.0898
Tiller number, X30.00940.16500.10370.20760.02200.0231
Leaf biomass, X40.03250.08570.51060.08230.94720.2393
Note: The values in the table are the correlation coefficients rij between the independent variables i and j.
Disclaimer/Publisher’s Note: The statements, opinions and data contained in all publications are solely those of the individual author(s) and contributor(s) and not of MDPI and/or the editor(s). MDPI and/or the editor(s) disclaim responsibility for any injury to people or property resulting from any ideas, methods, instructions or products referred to in the content.

