
Comprehensive Analysis of Chloroplast Genomes in Leguminous Forage Species: Codon Usage, Phylogenetic Relationships, and Evolutionary Insights


Abstract
1. Introduction
2. Materials and Methods
2.1. Taxon Sampling, DNA Extraction and Library Sequencing
2.2. Chloroplast Genome Assembly and Annotation
2.3. Codon Bias and SSR Locus Analysis
2.4. Effective Number of Codons (ENC) Plot Analysis
2.5. Parity Rule 2 Bias Plot (PR2 Plot) Analysis
2.6. Analysis of the Neutrality Plot
2.7. Correspondence Analysis (COA)
2.8. Collinearity Analysis and Phylogenetic Tree Construction of 30 Leguminous Forages
3. Results
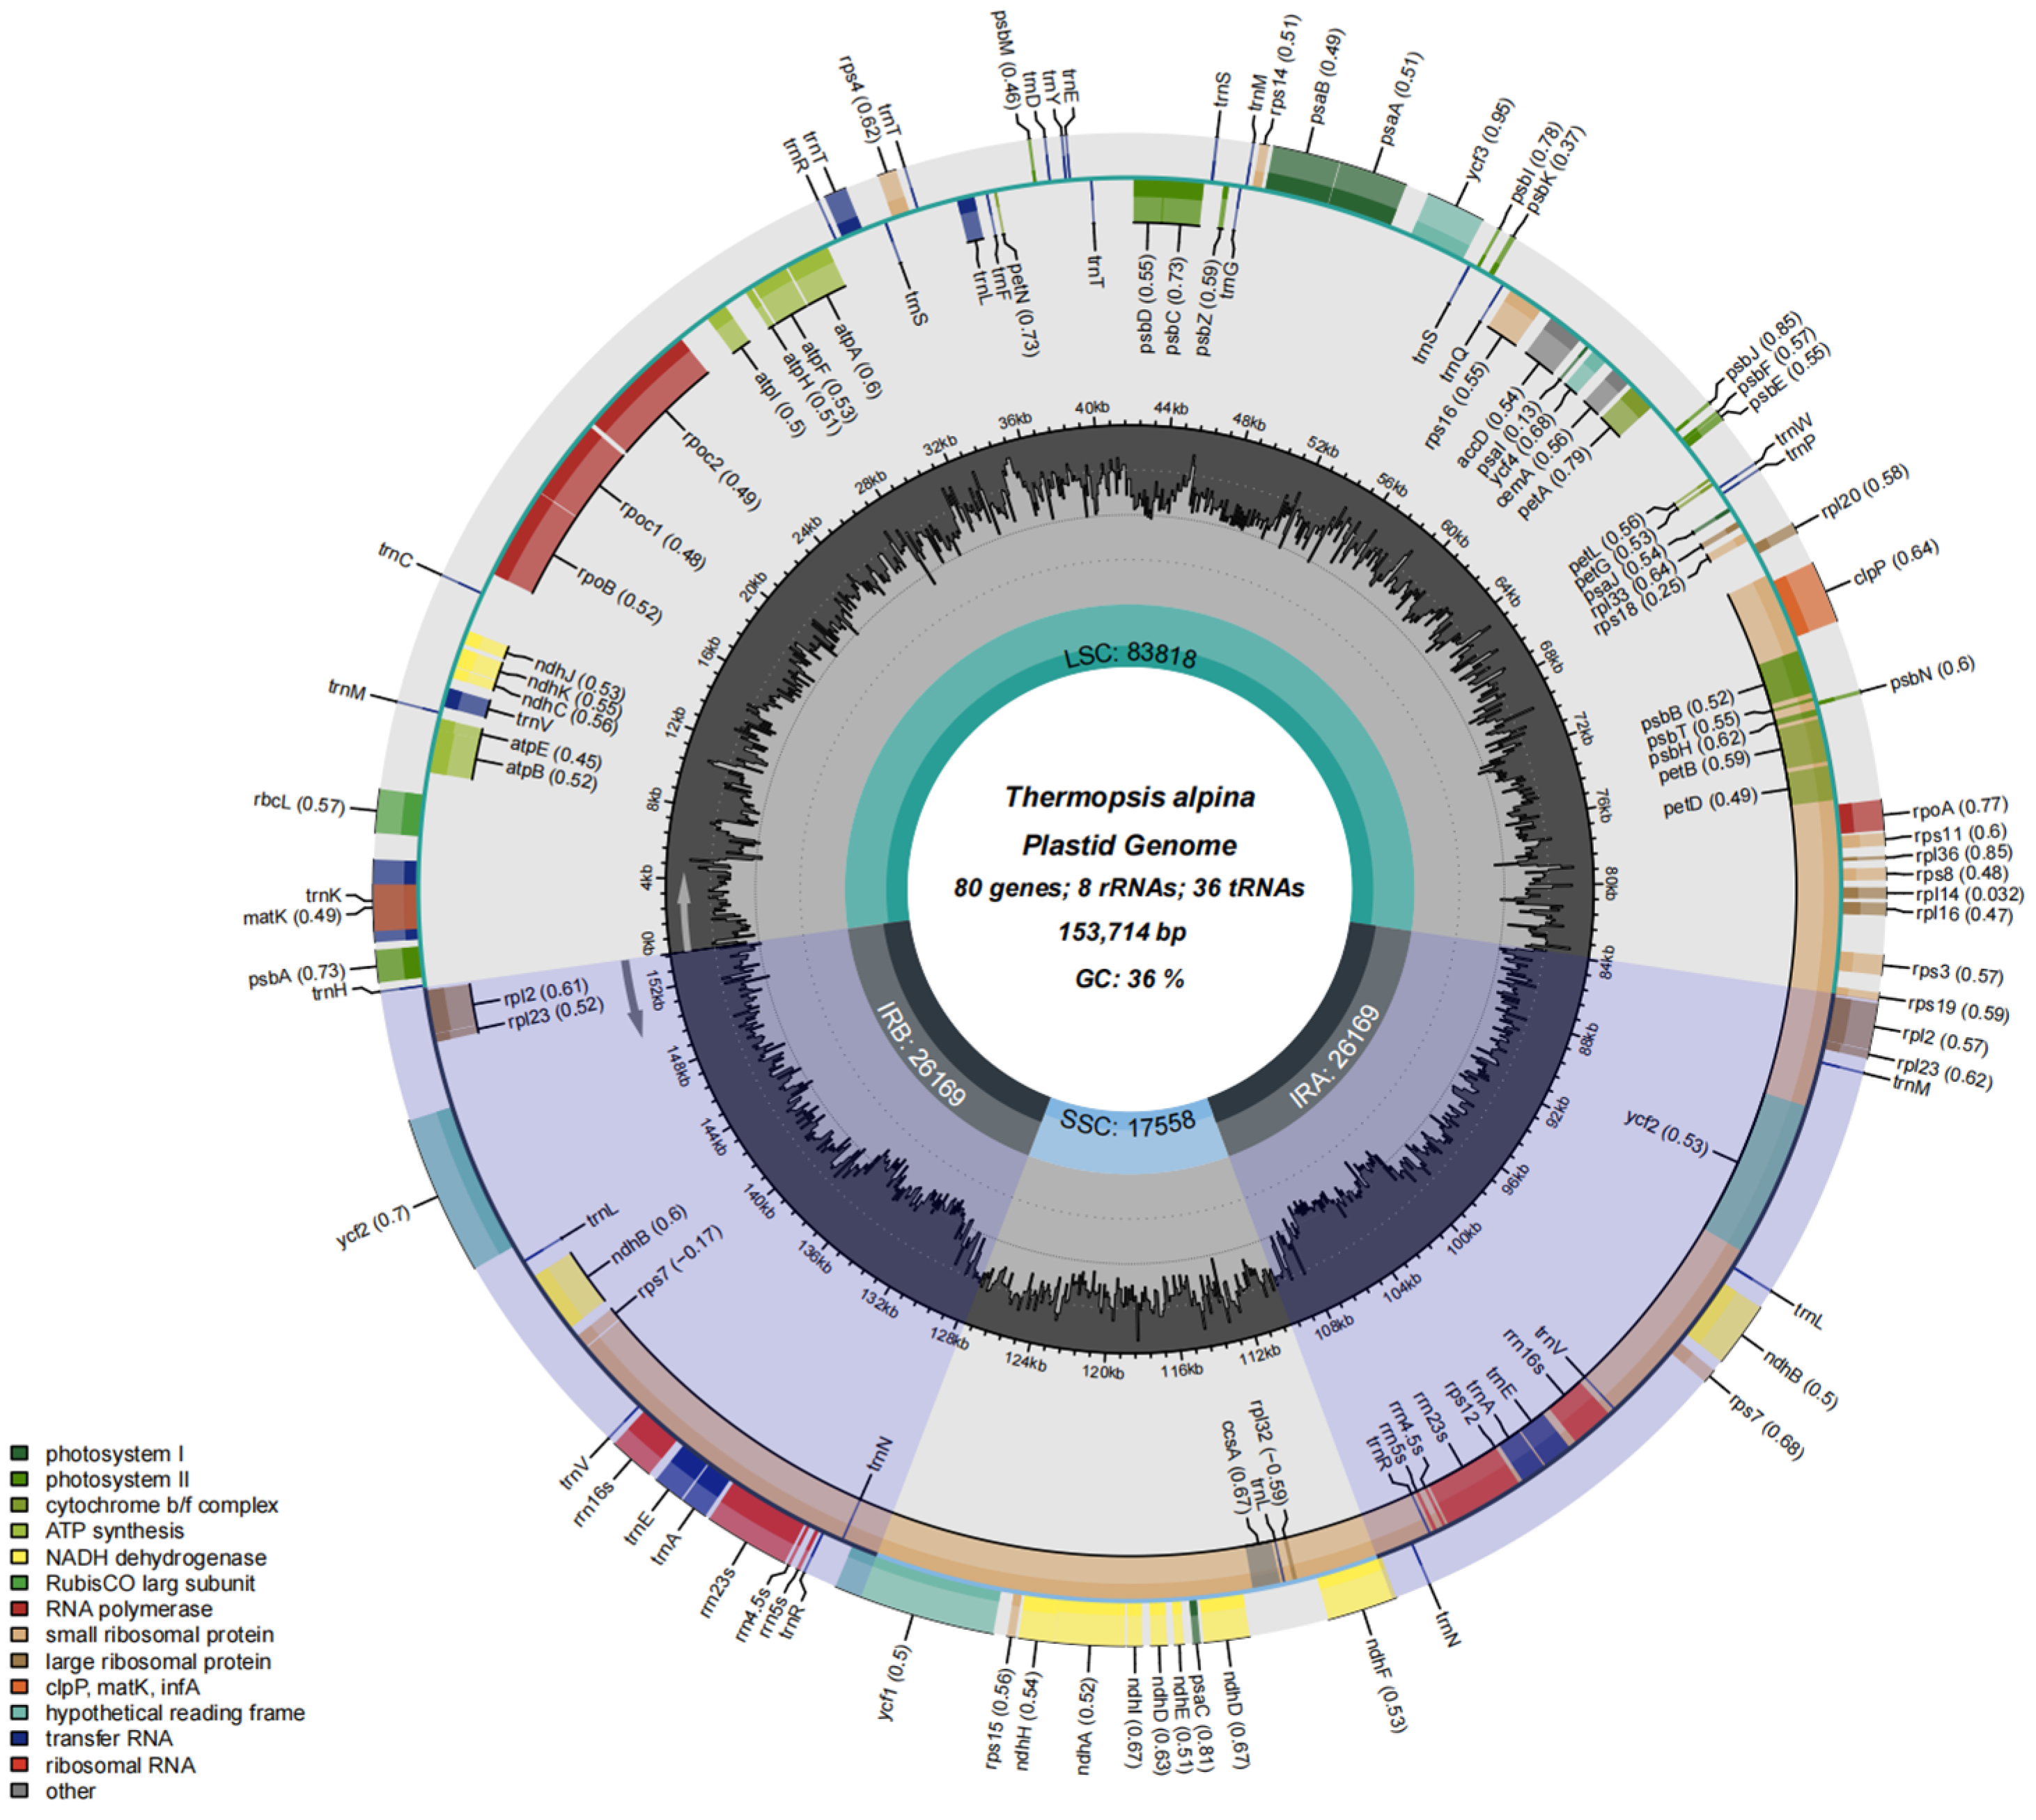
3.1. Chloroplast Genome Structure, Classification, Function and Characterization
3.2. Nucleotide Composition Analysis
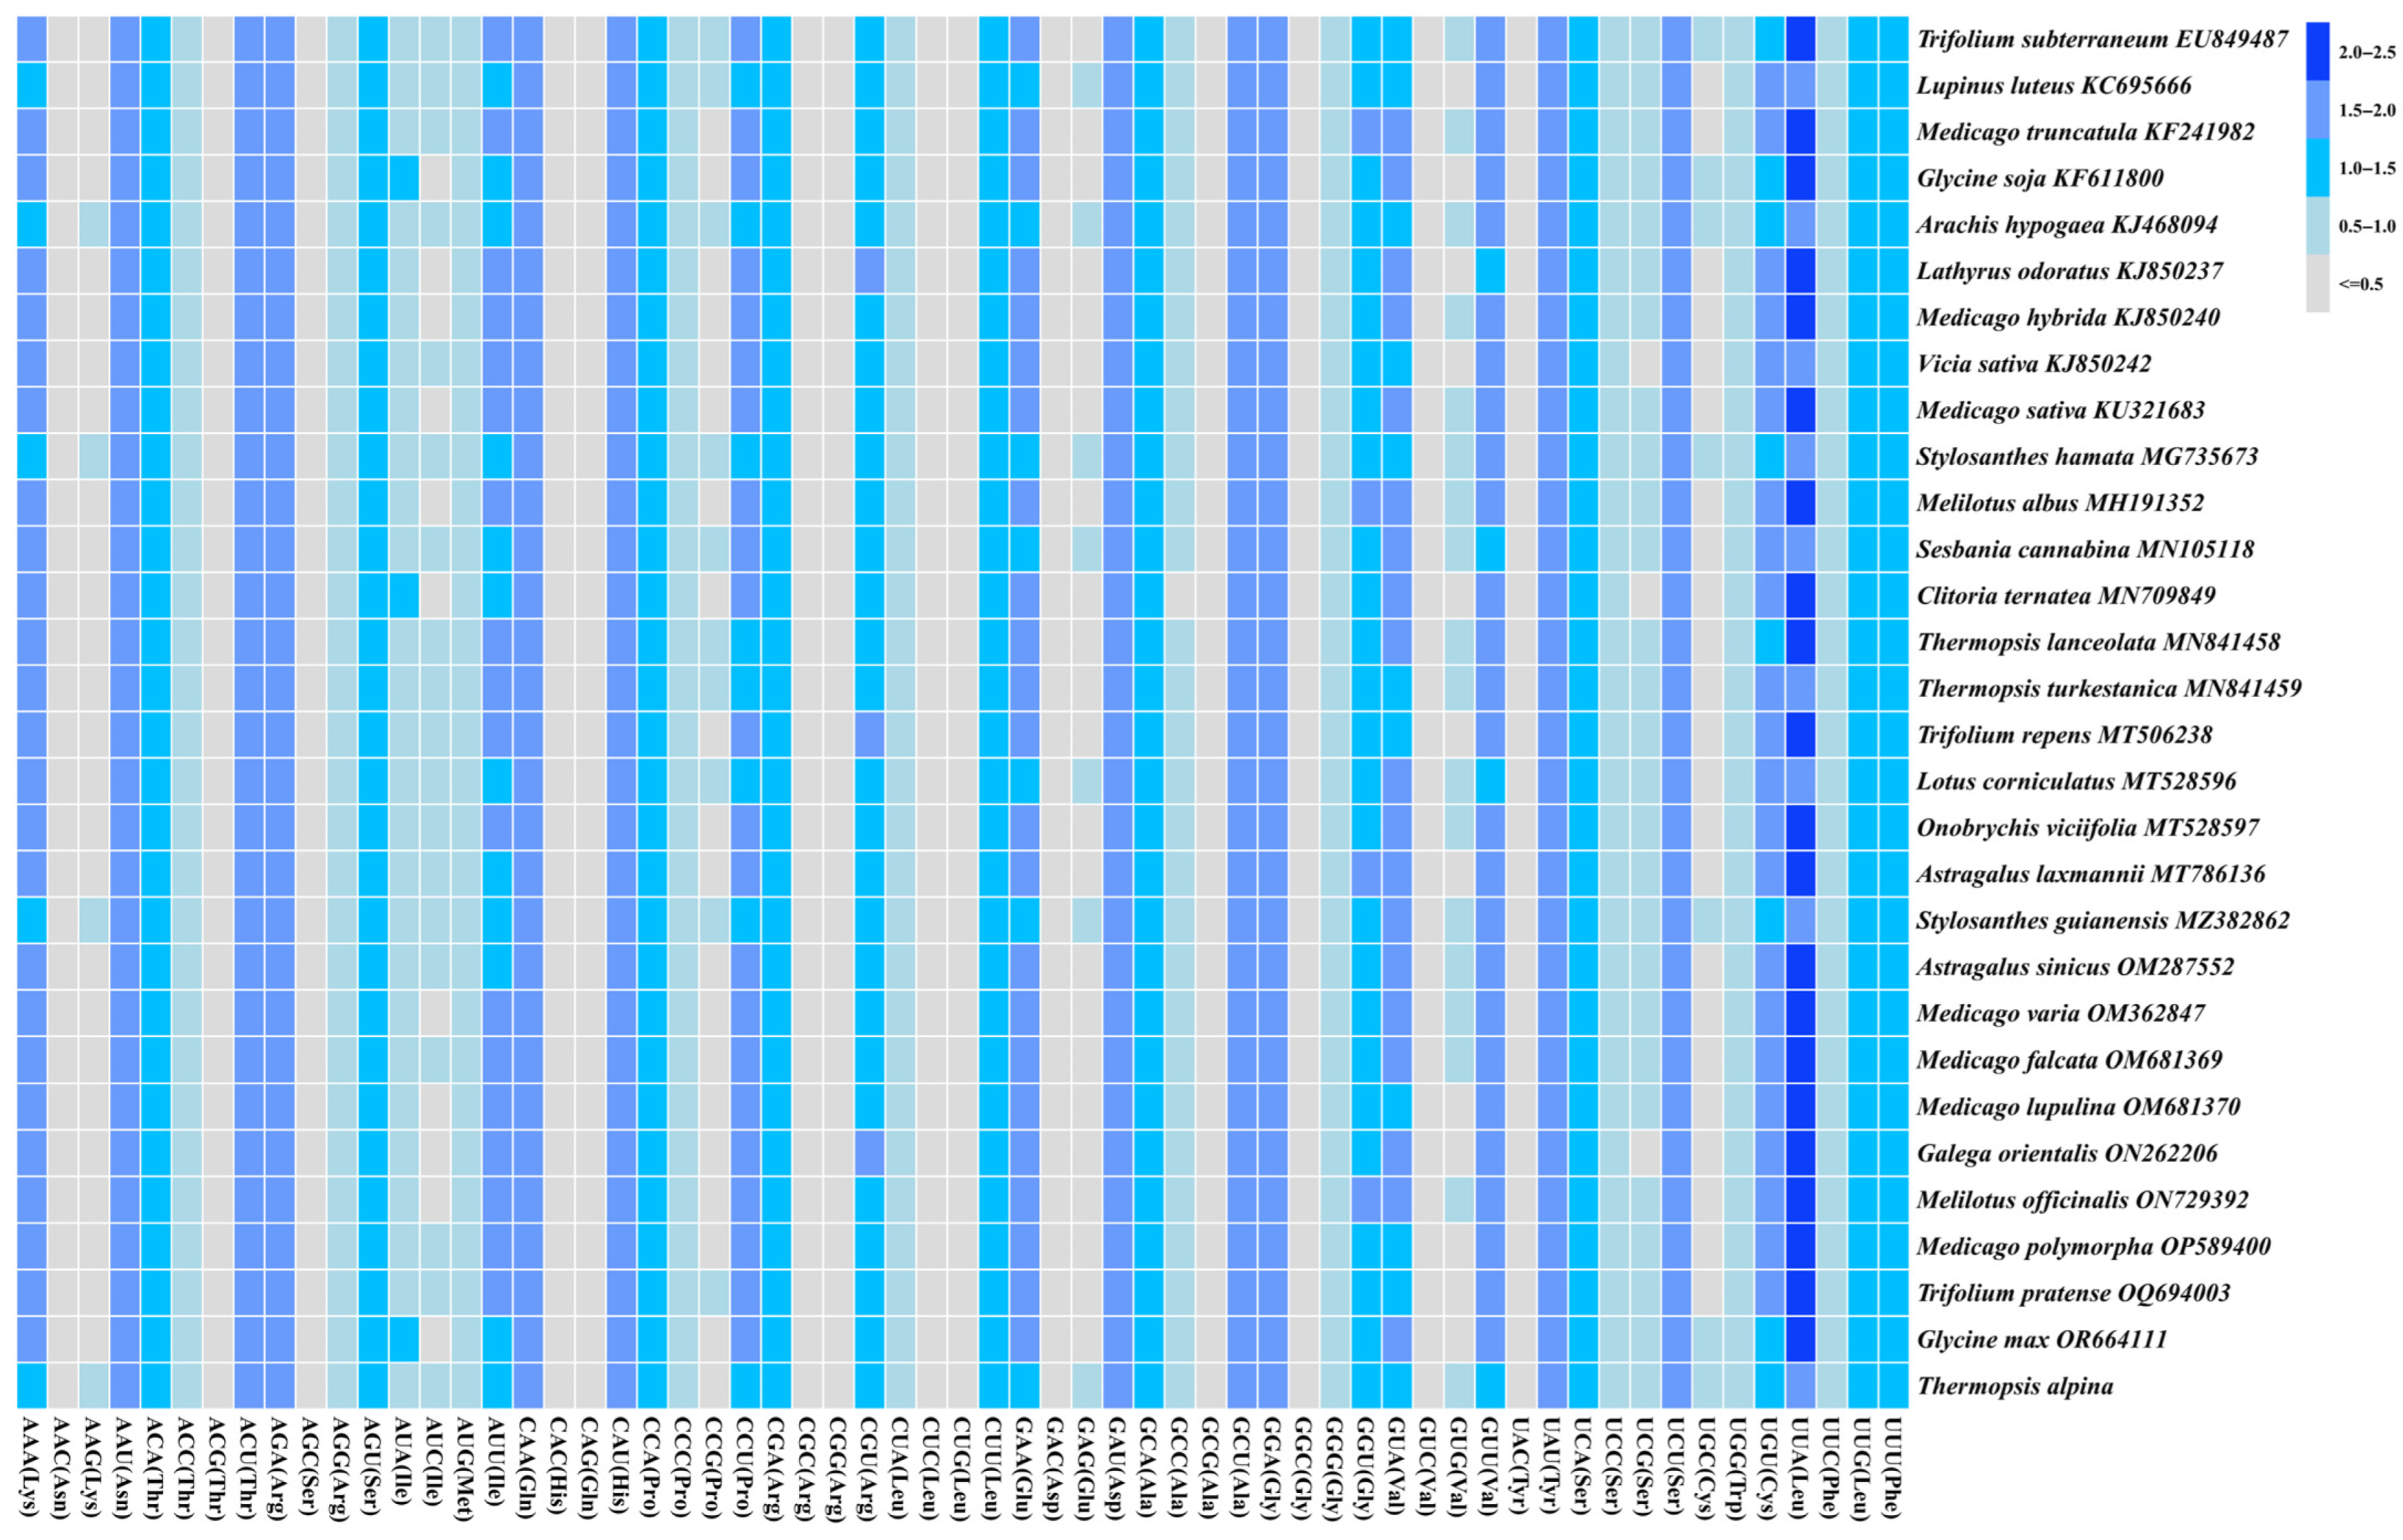
3.3. RSCU Analysis
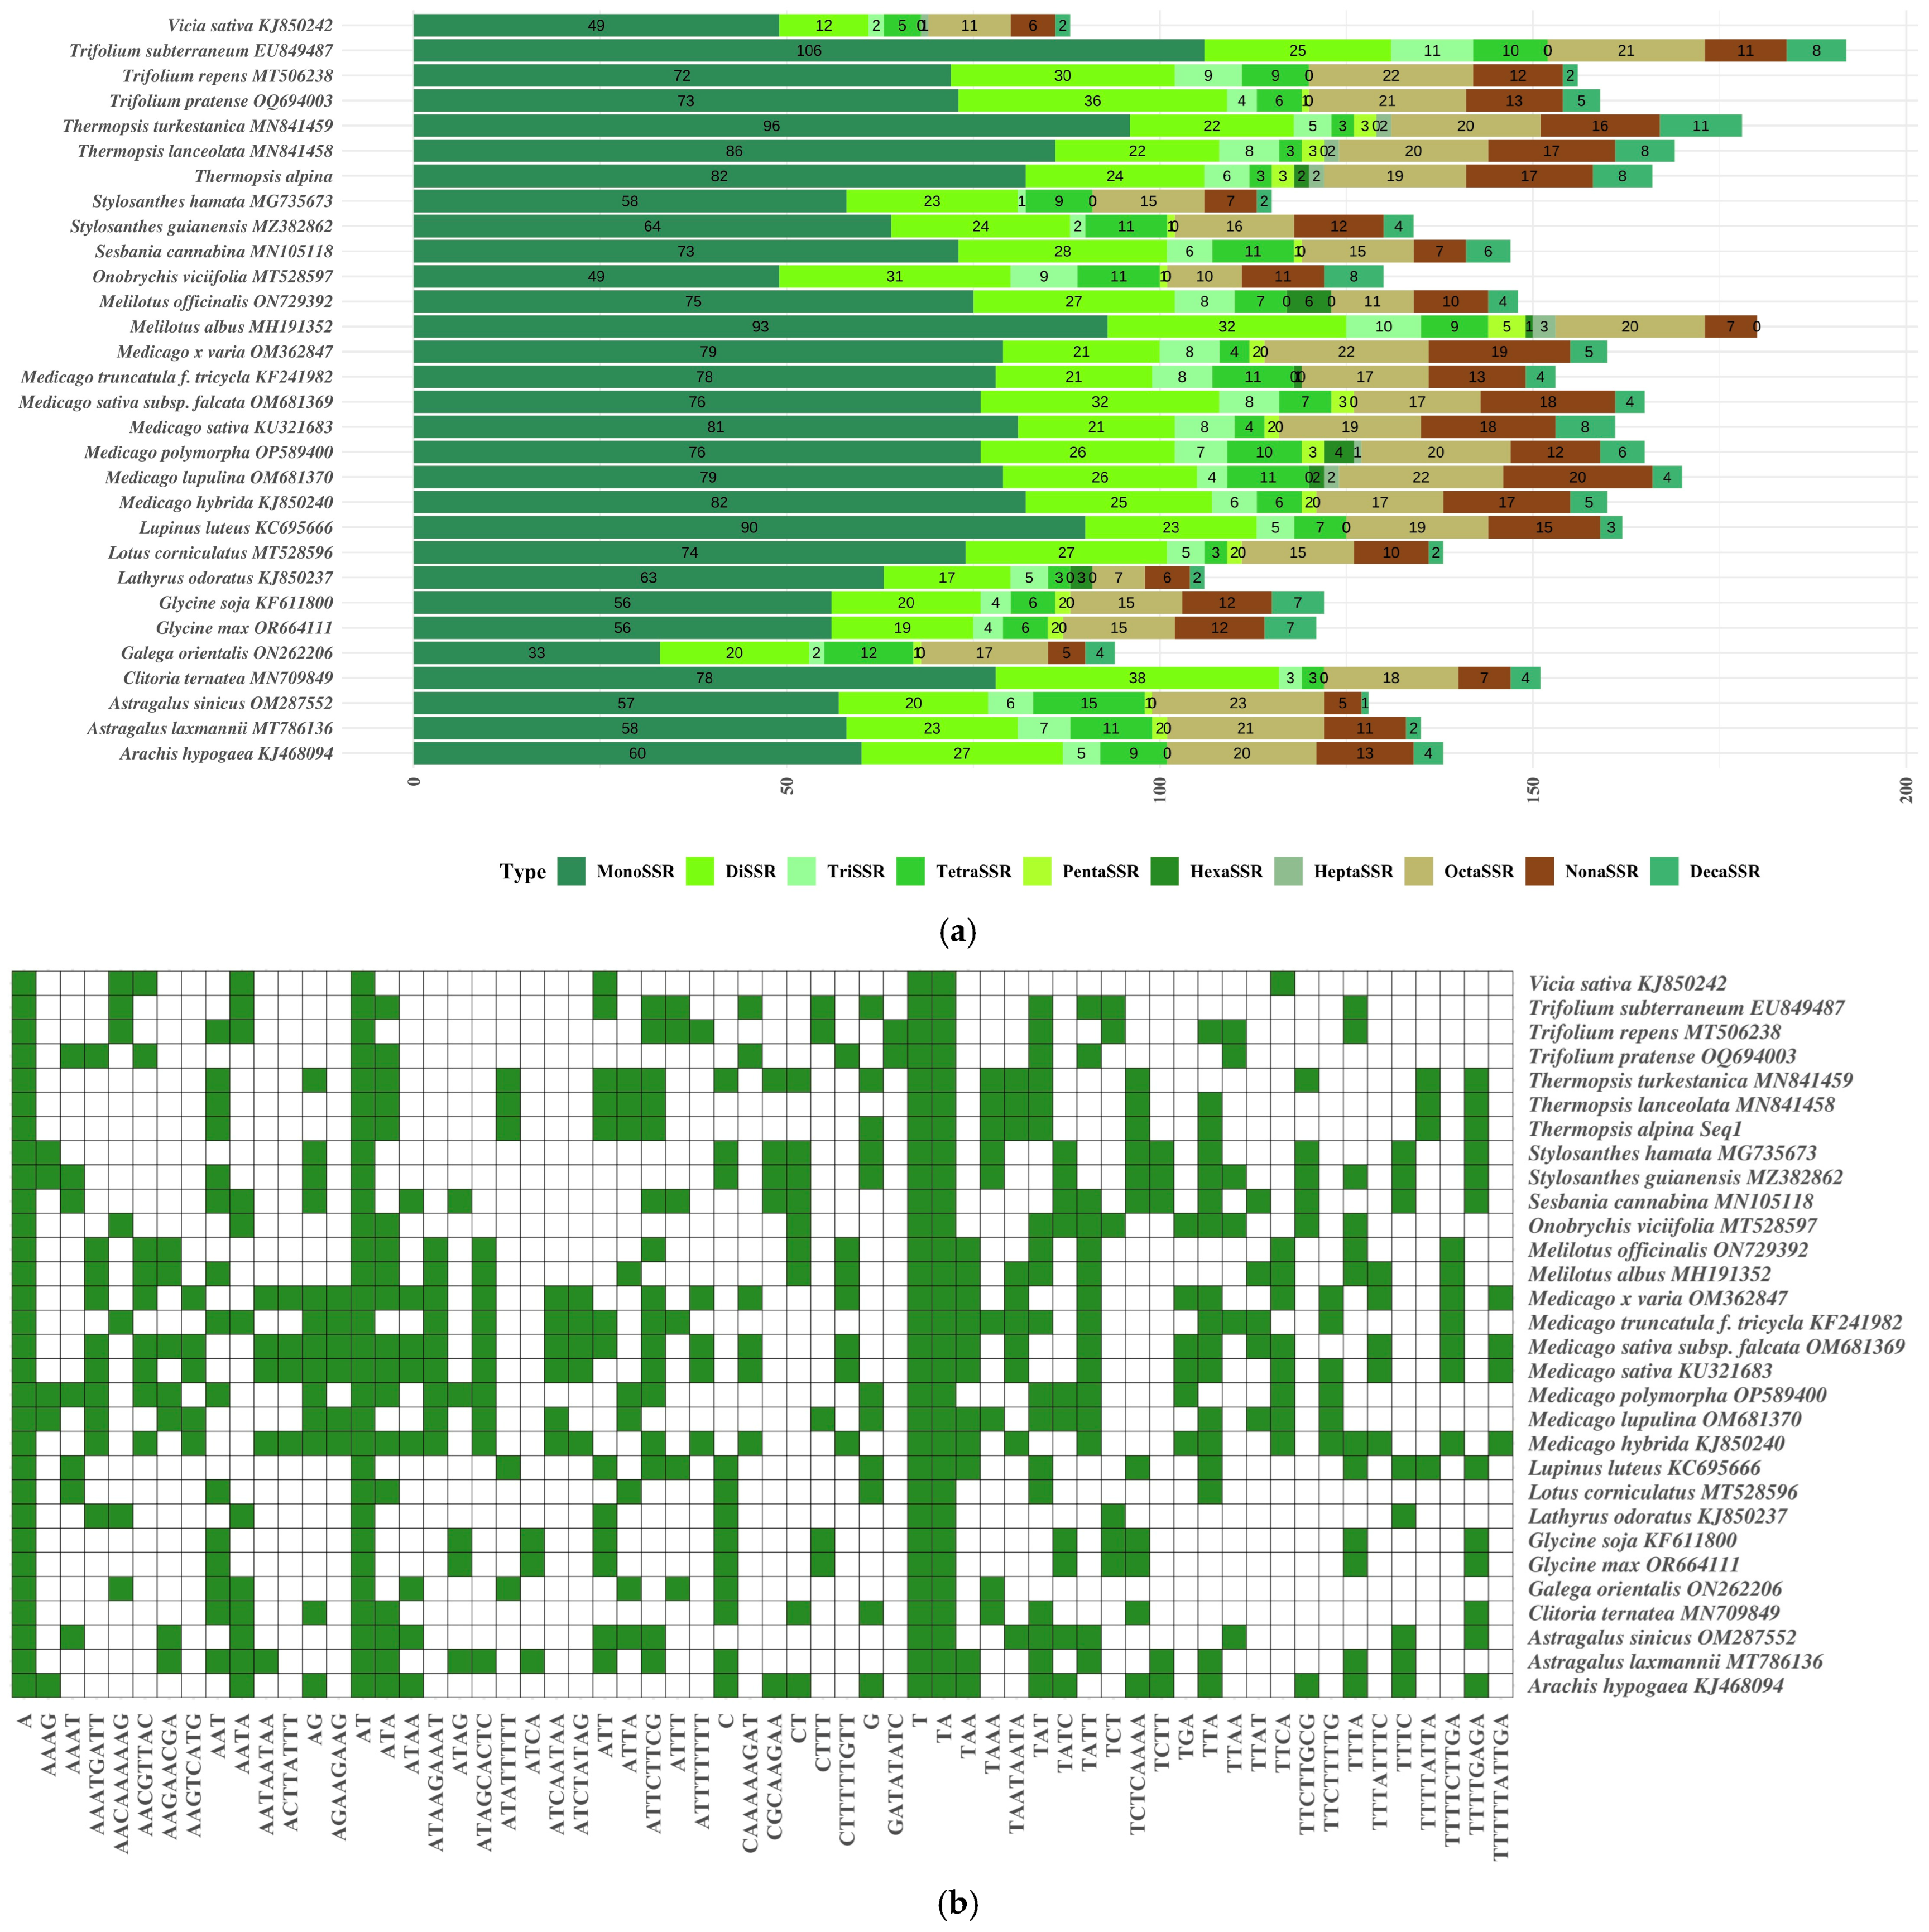
3.4. SSR Analysis
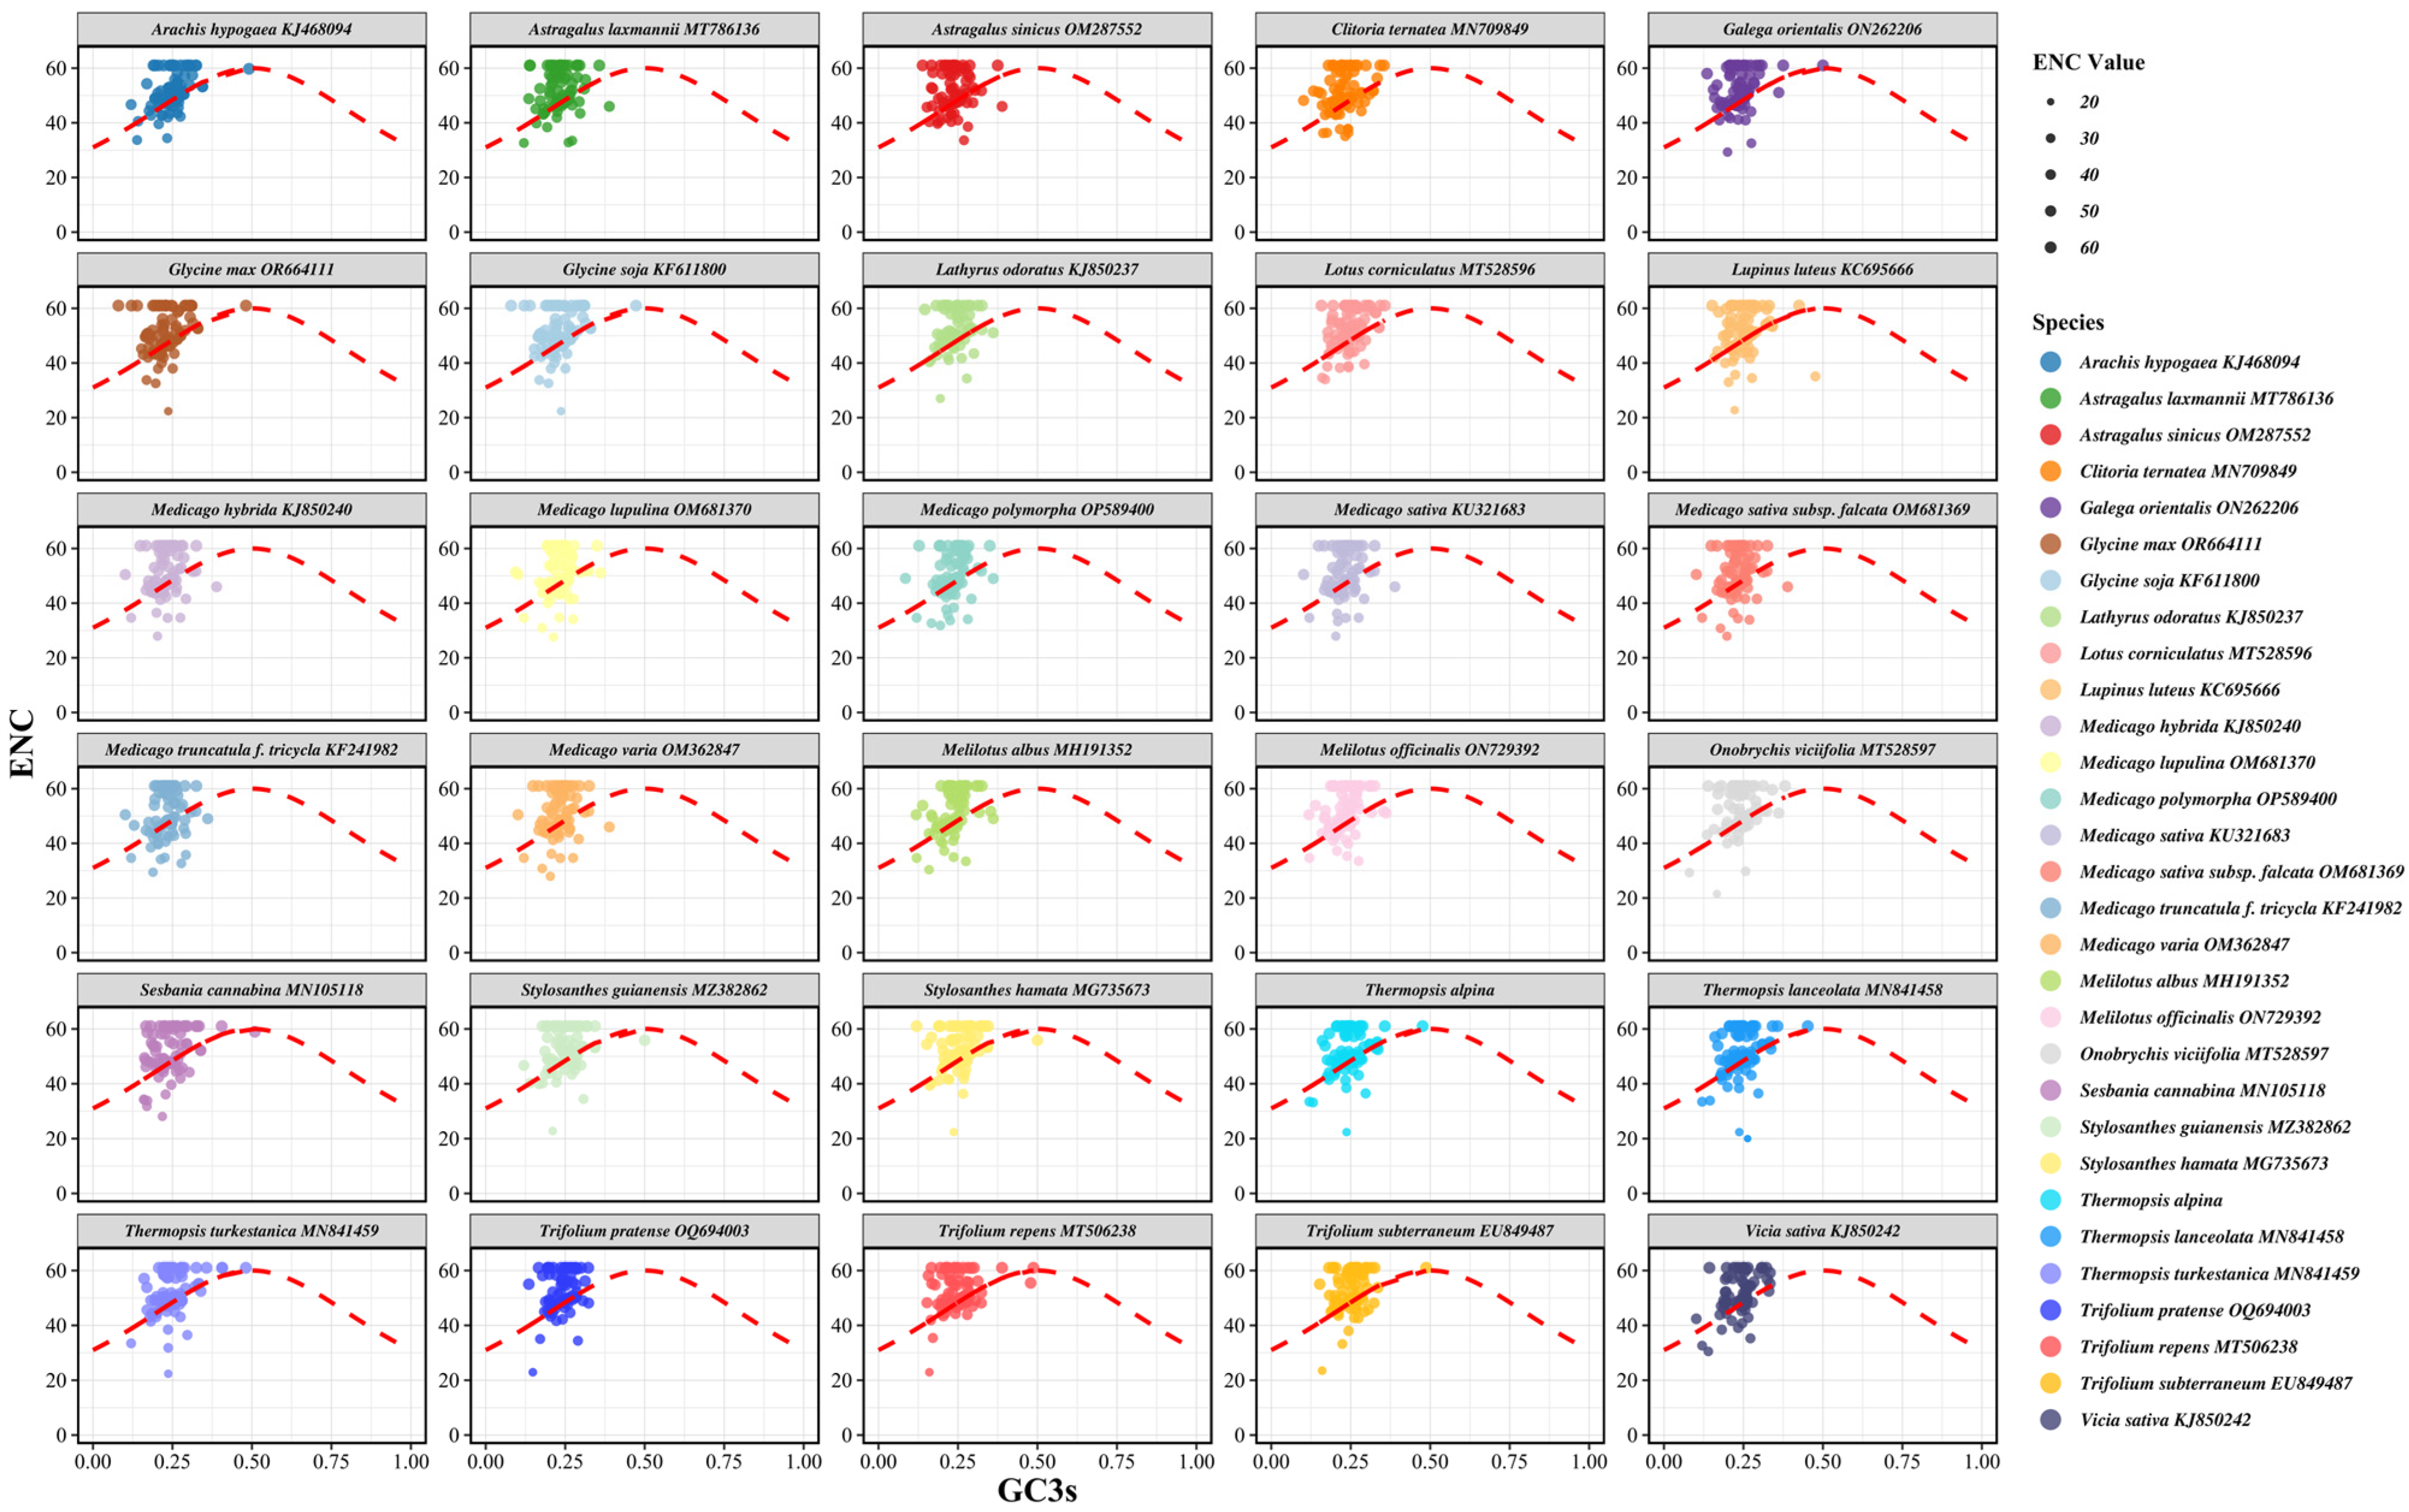
3.5. ENC Plot Analysis
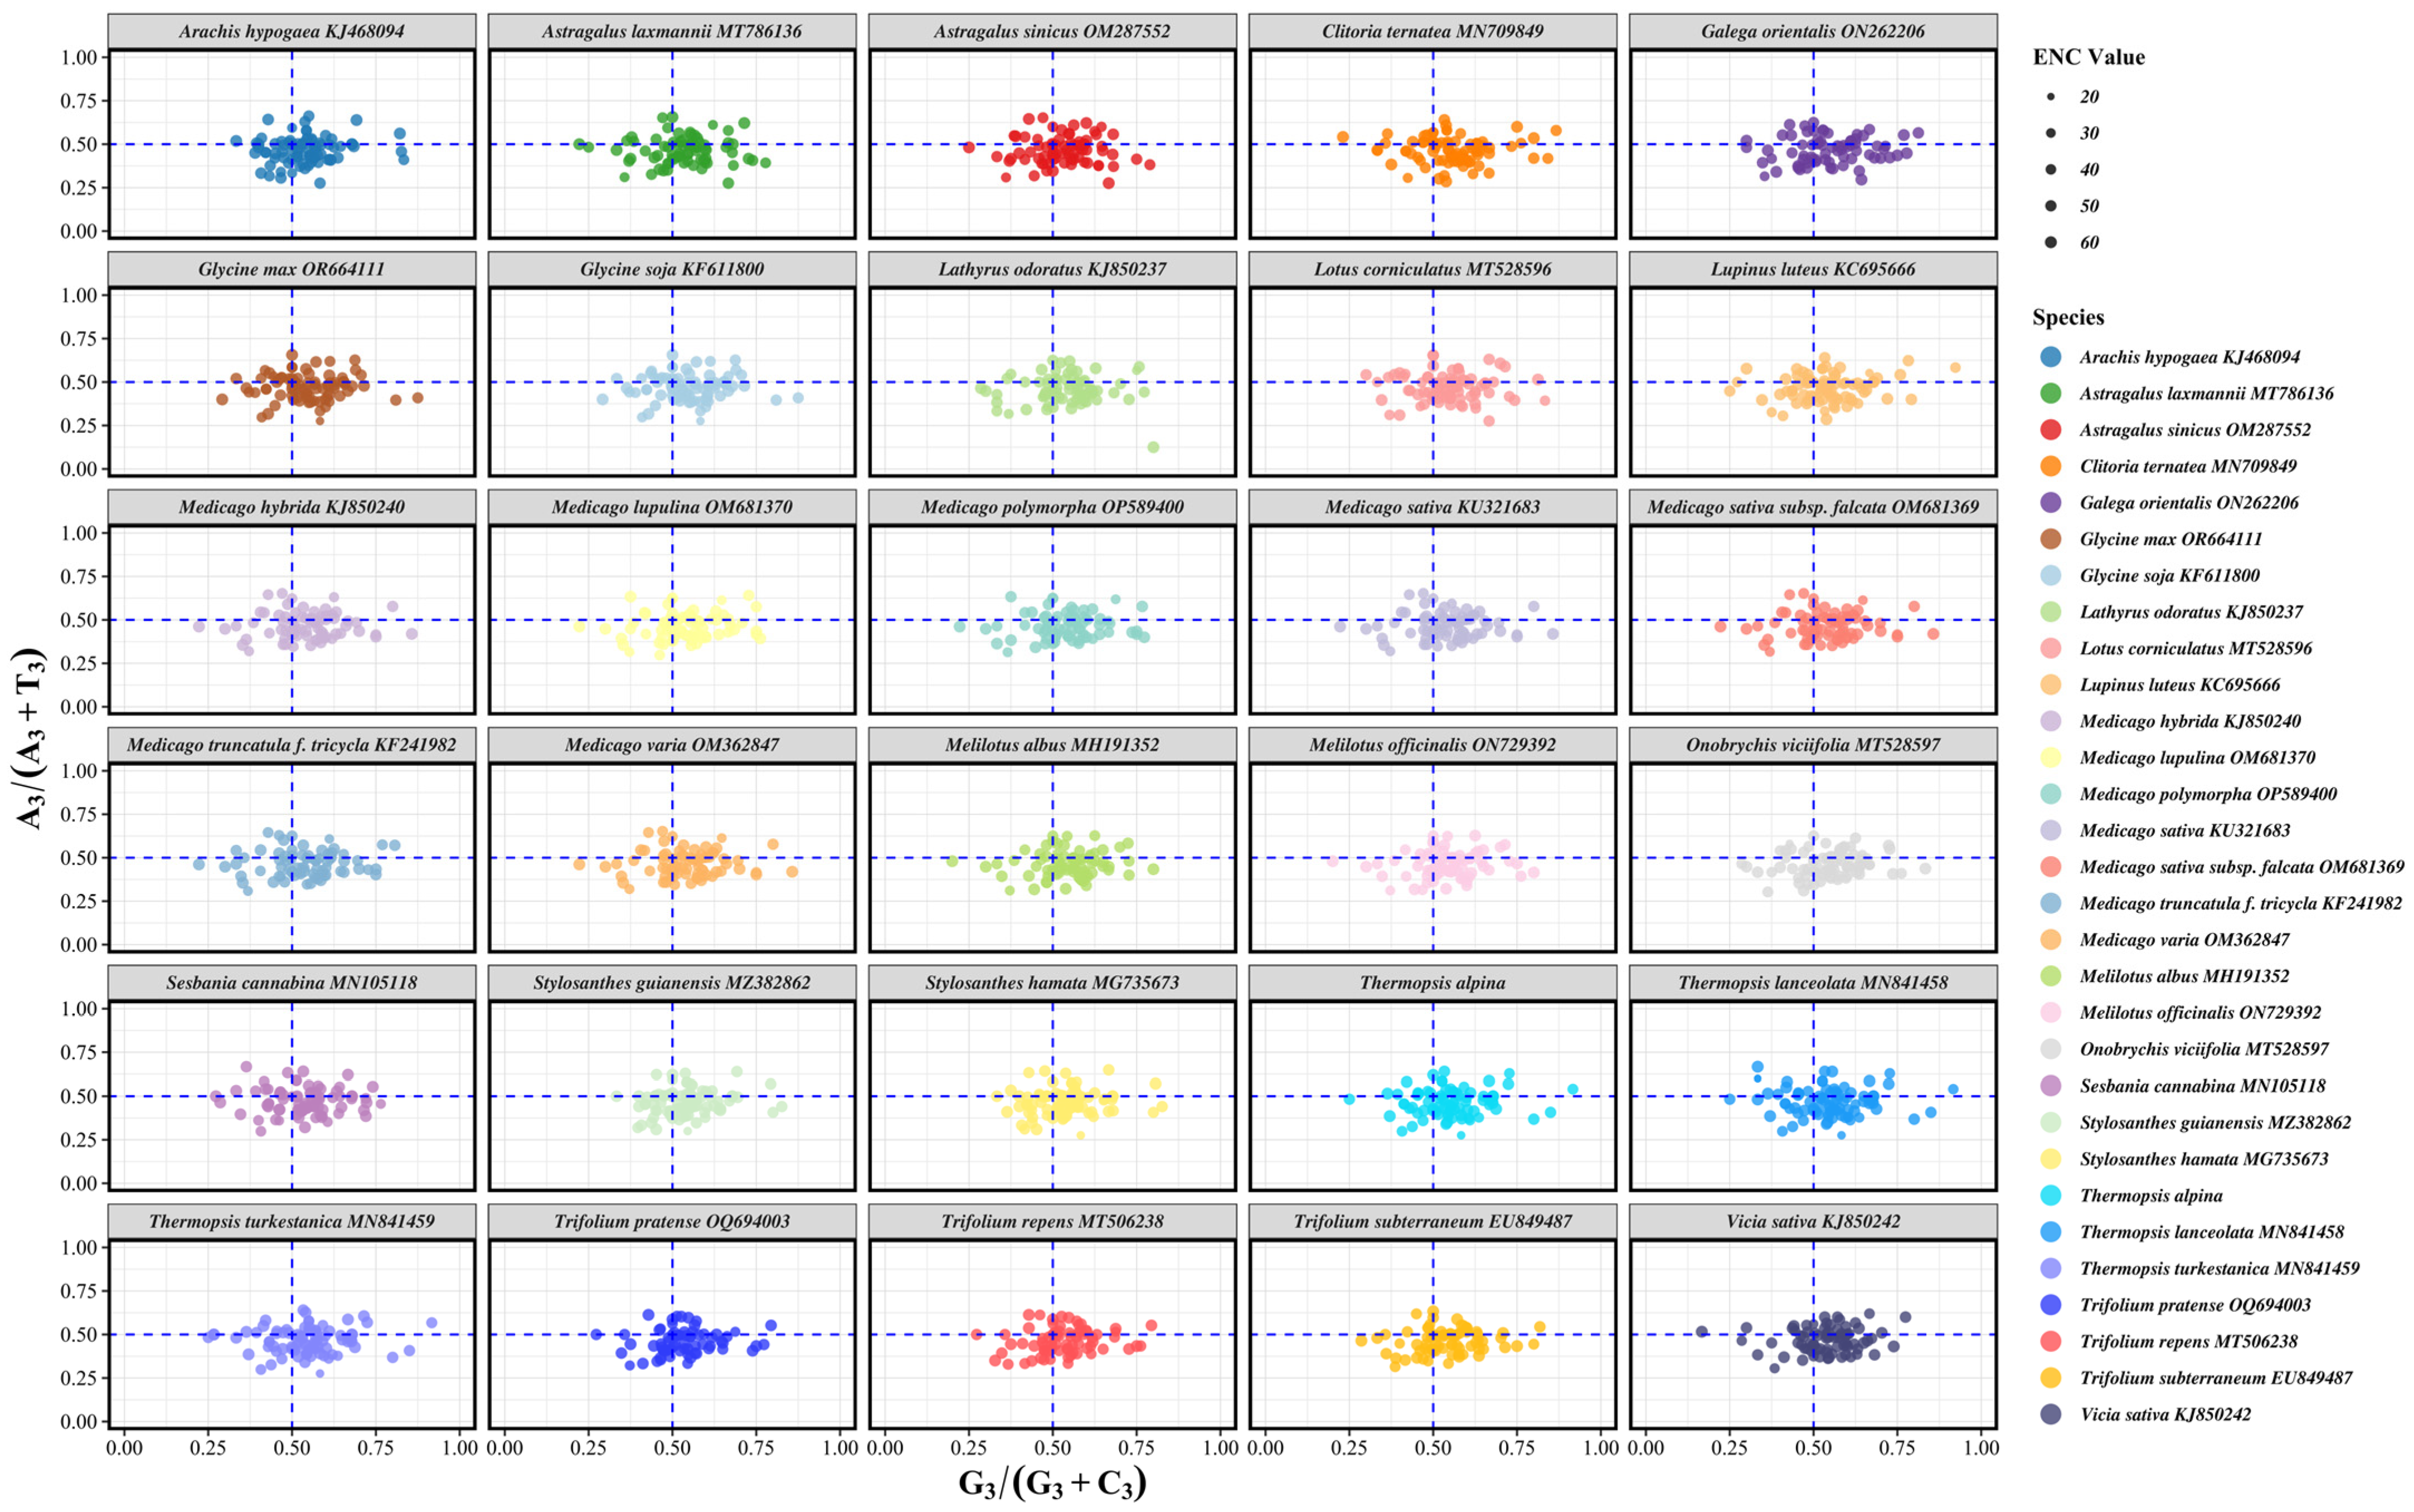
3.6. PR2-Plot Analysis
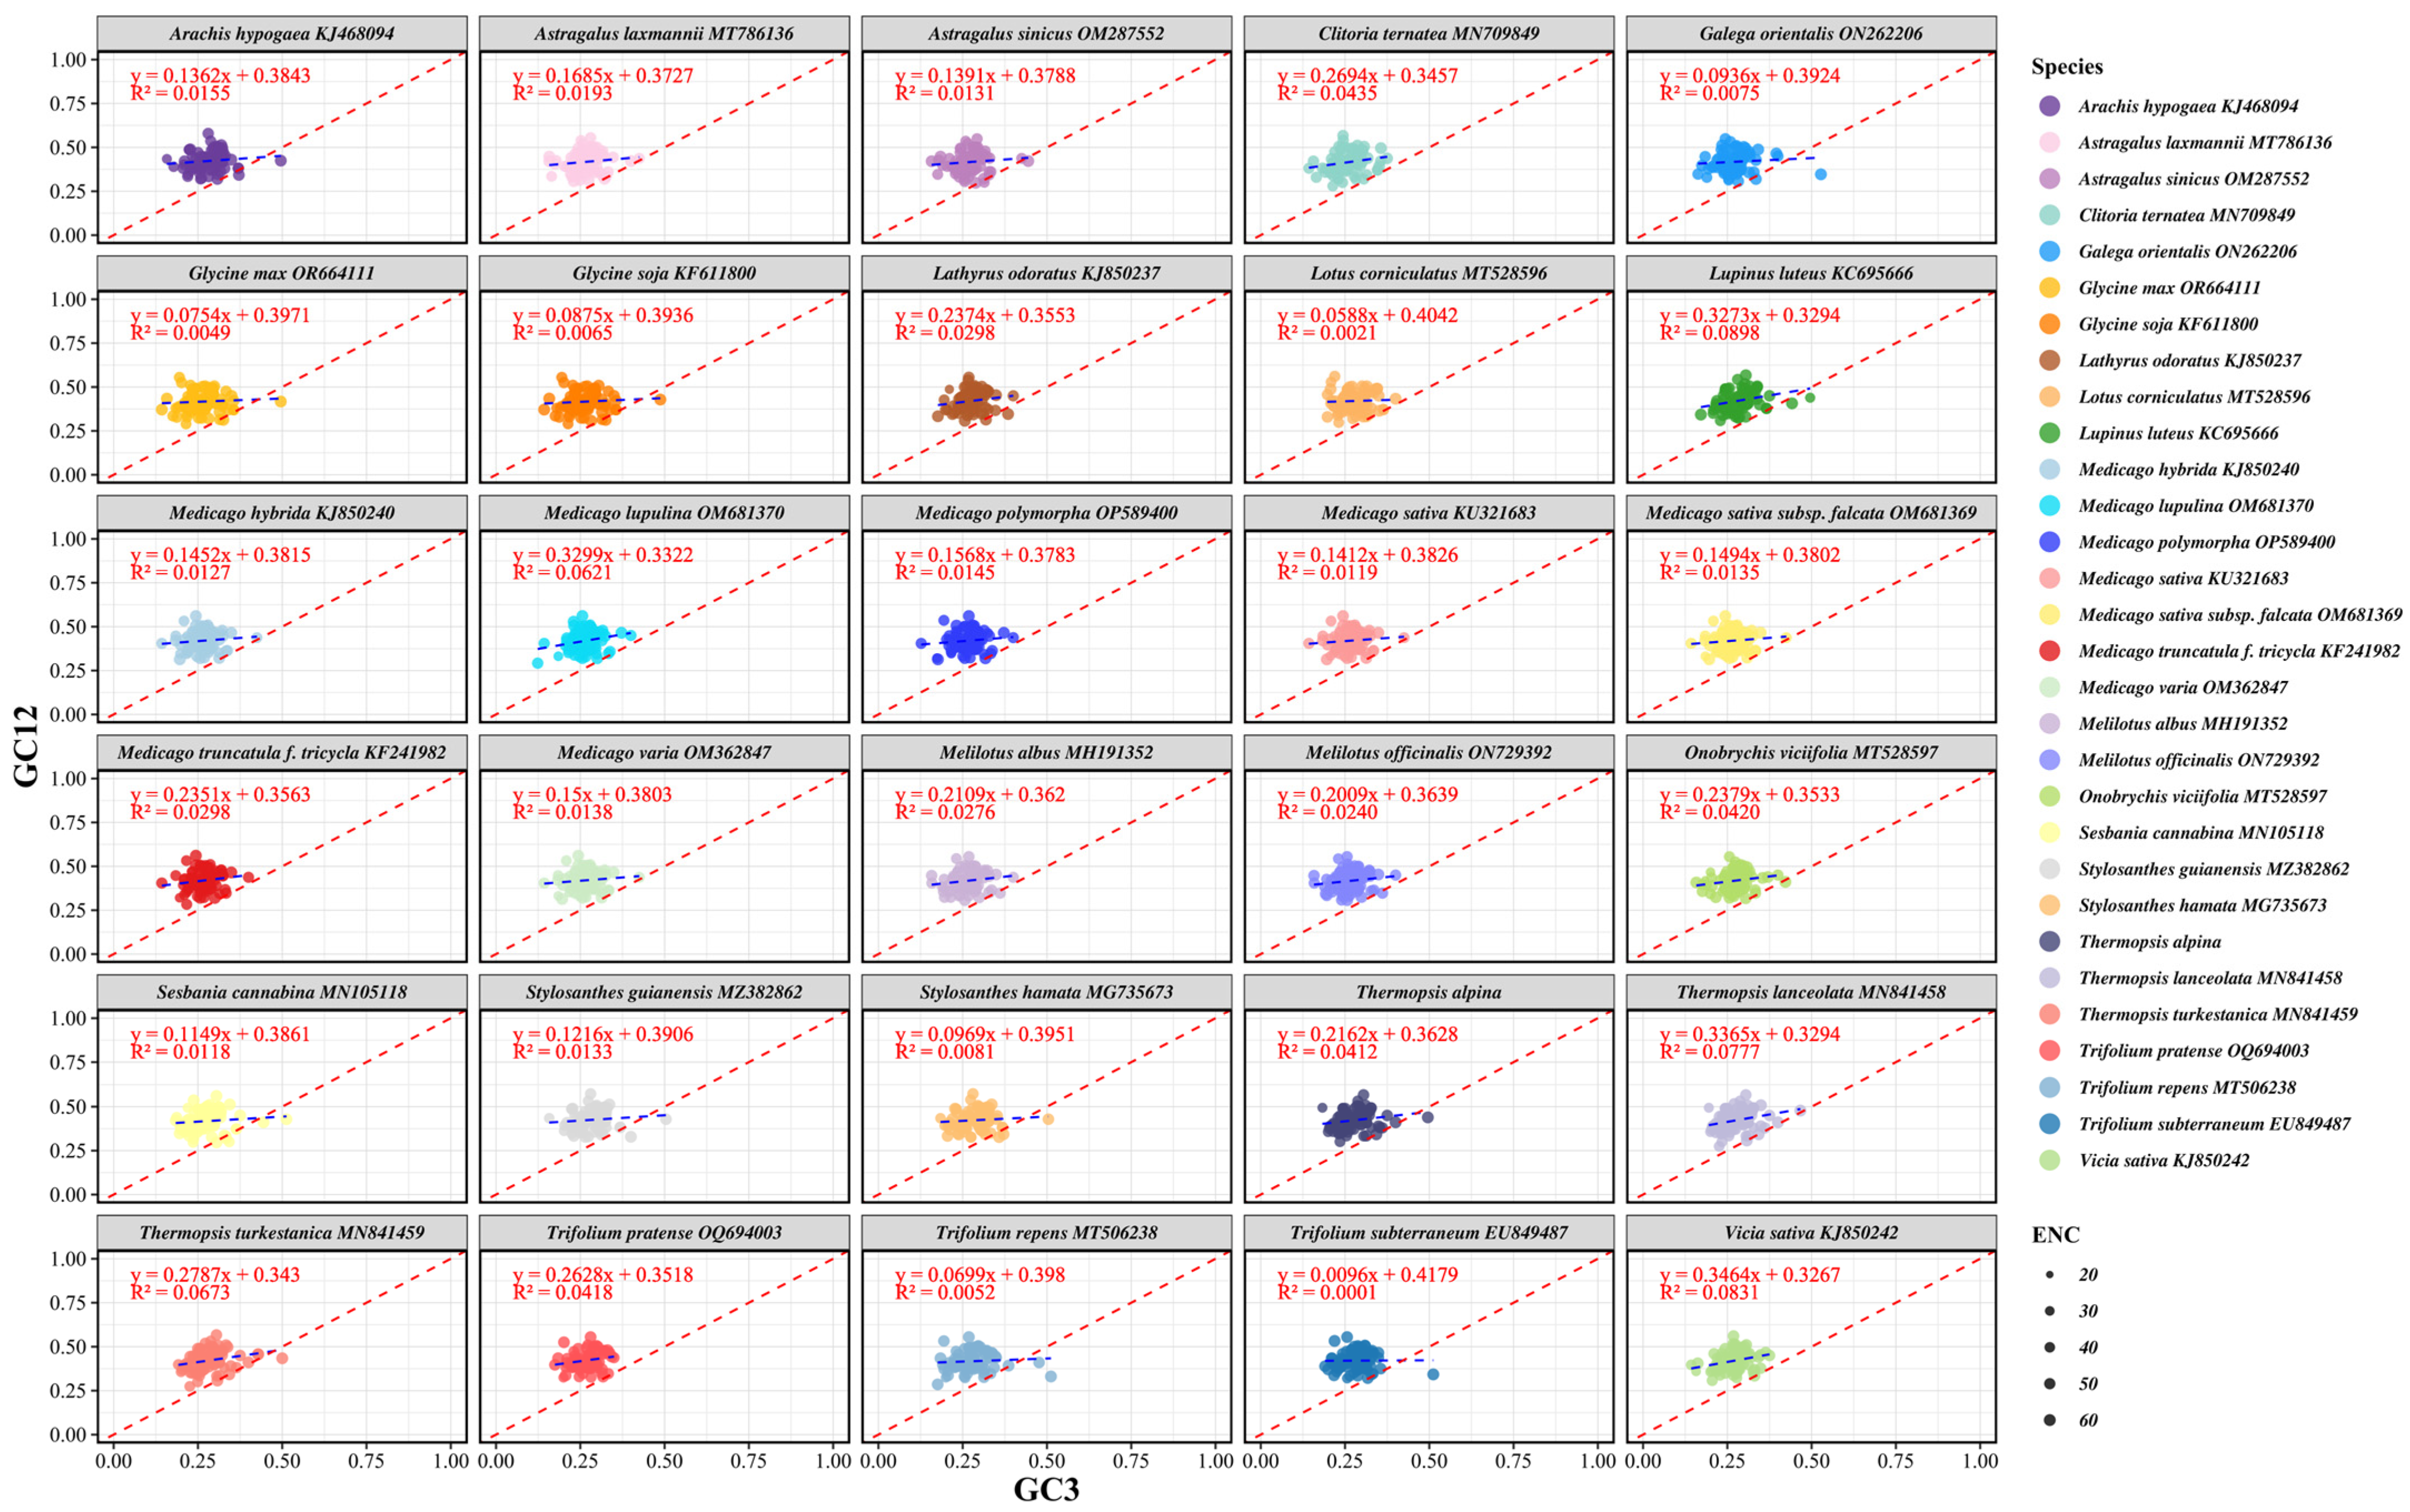
3.7. Neutrality Plot Analysis
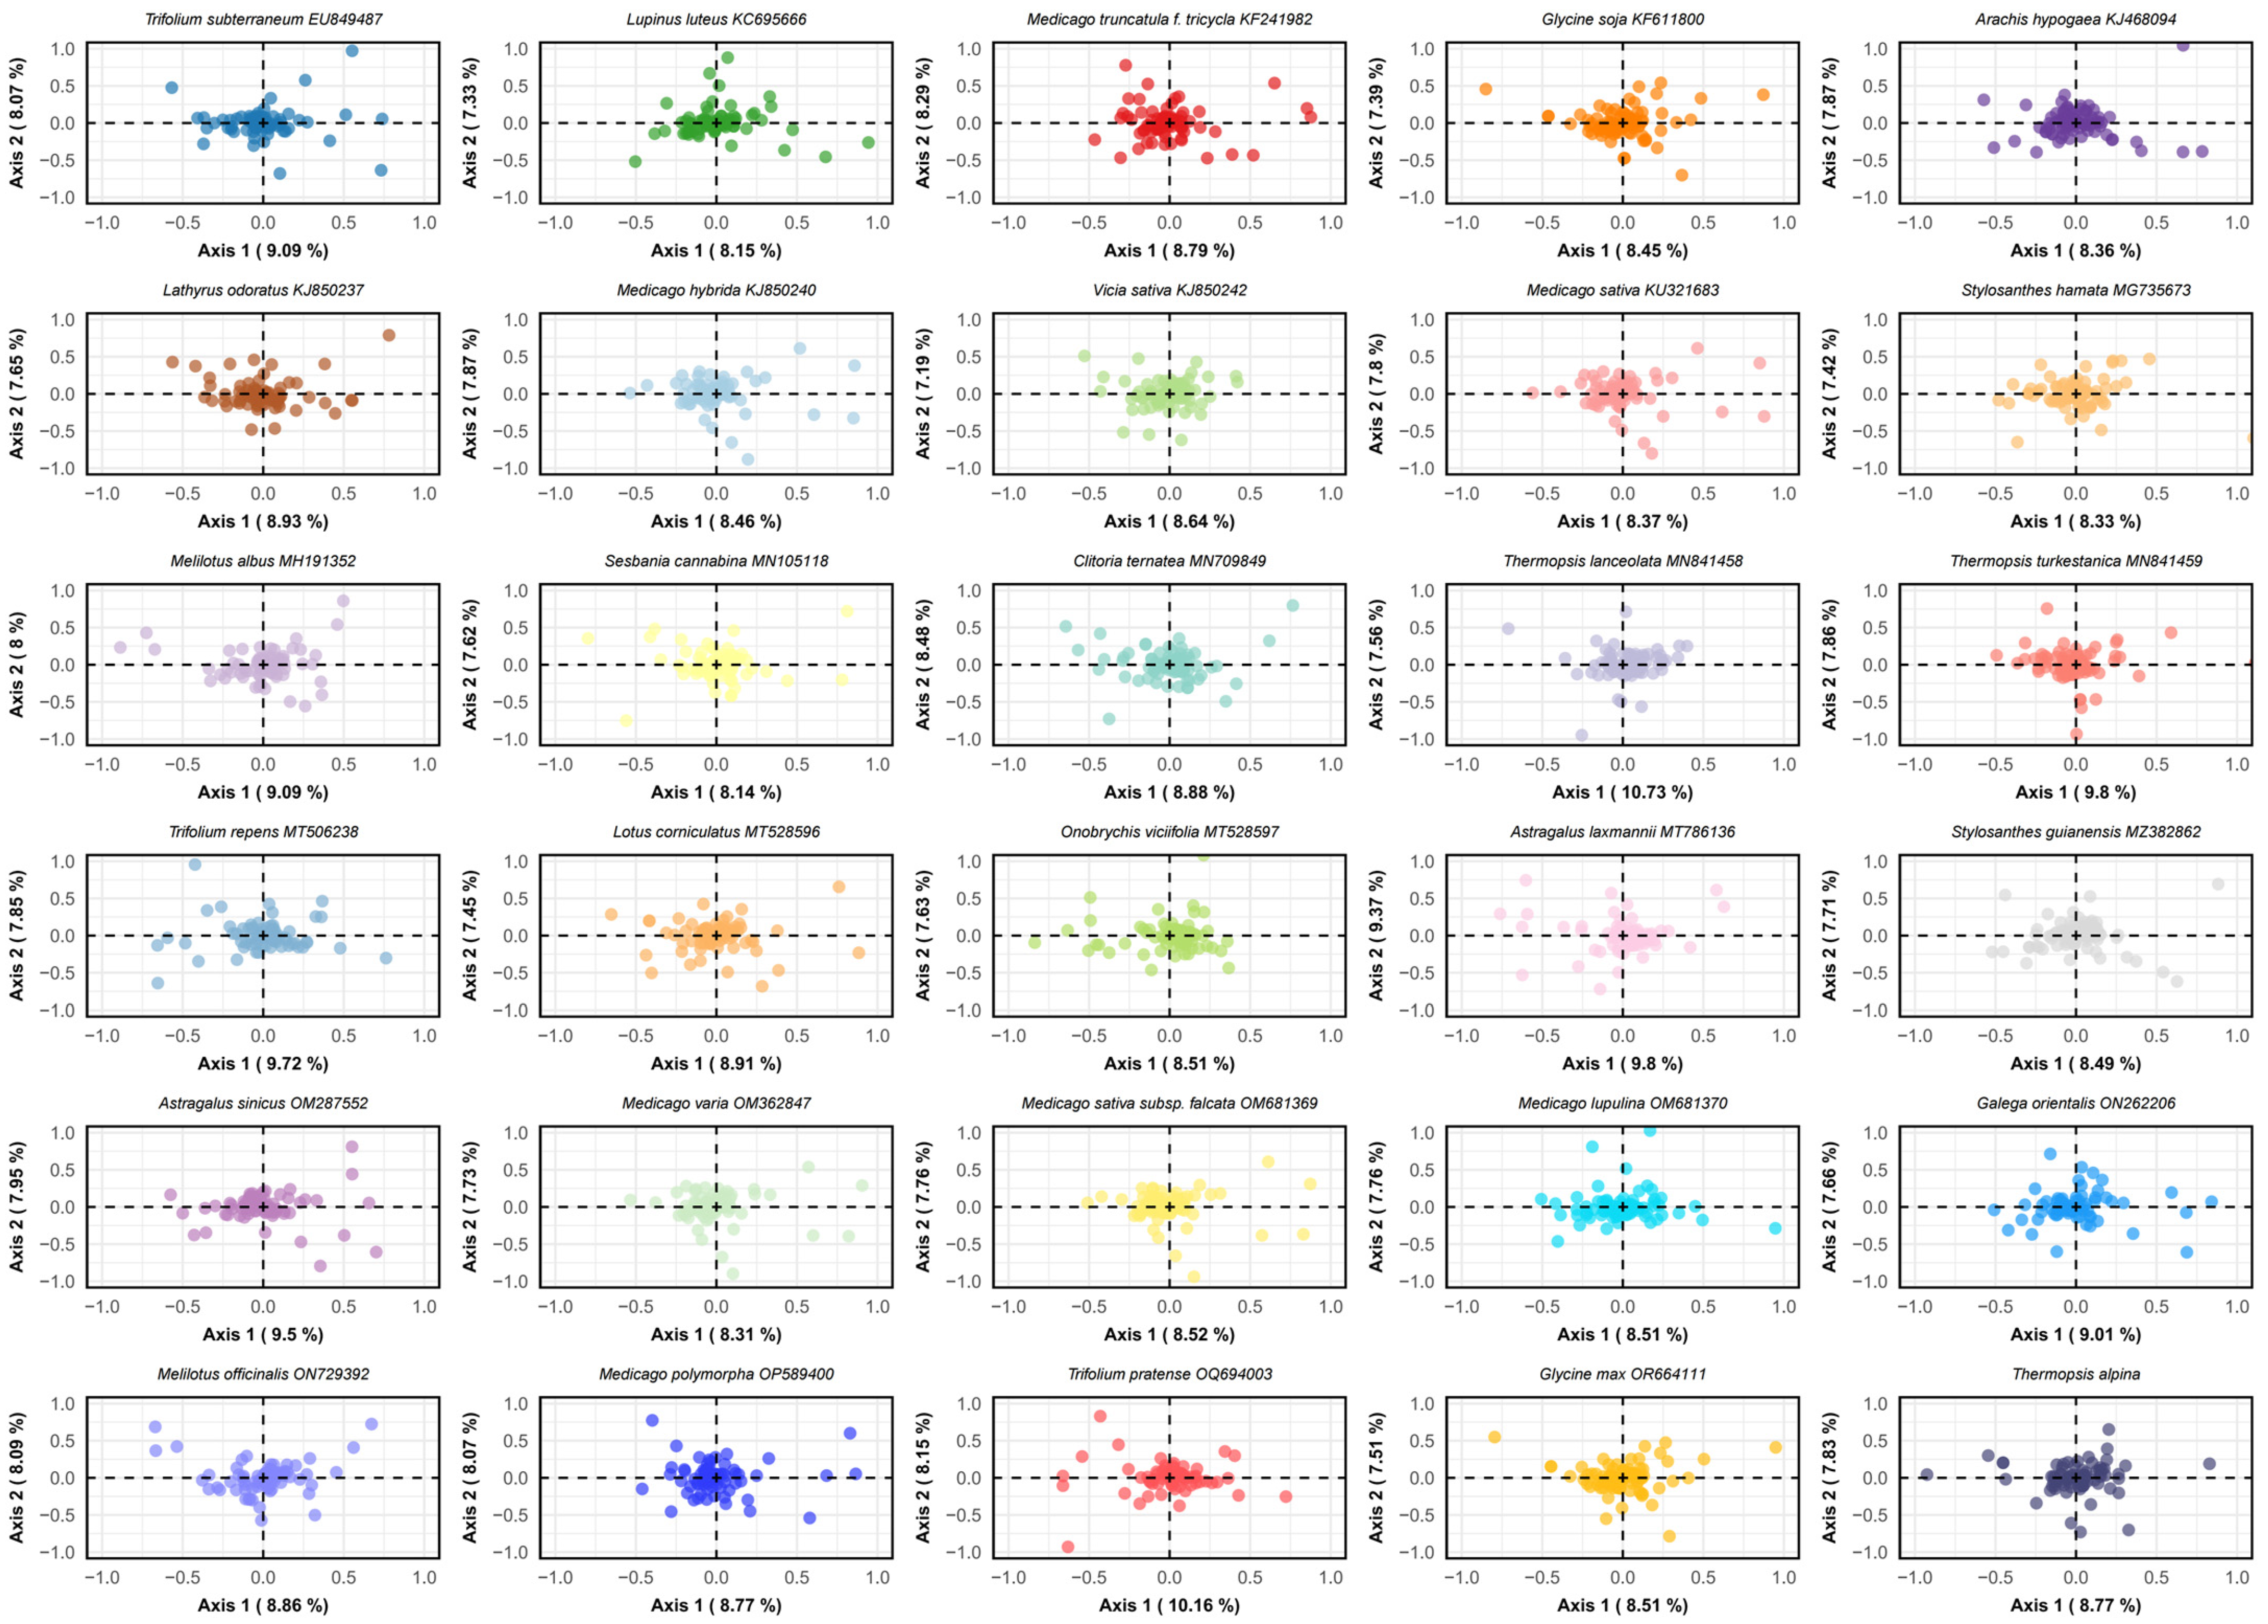
3.8. Correspondence Analysis (COA)
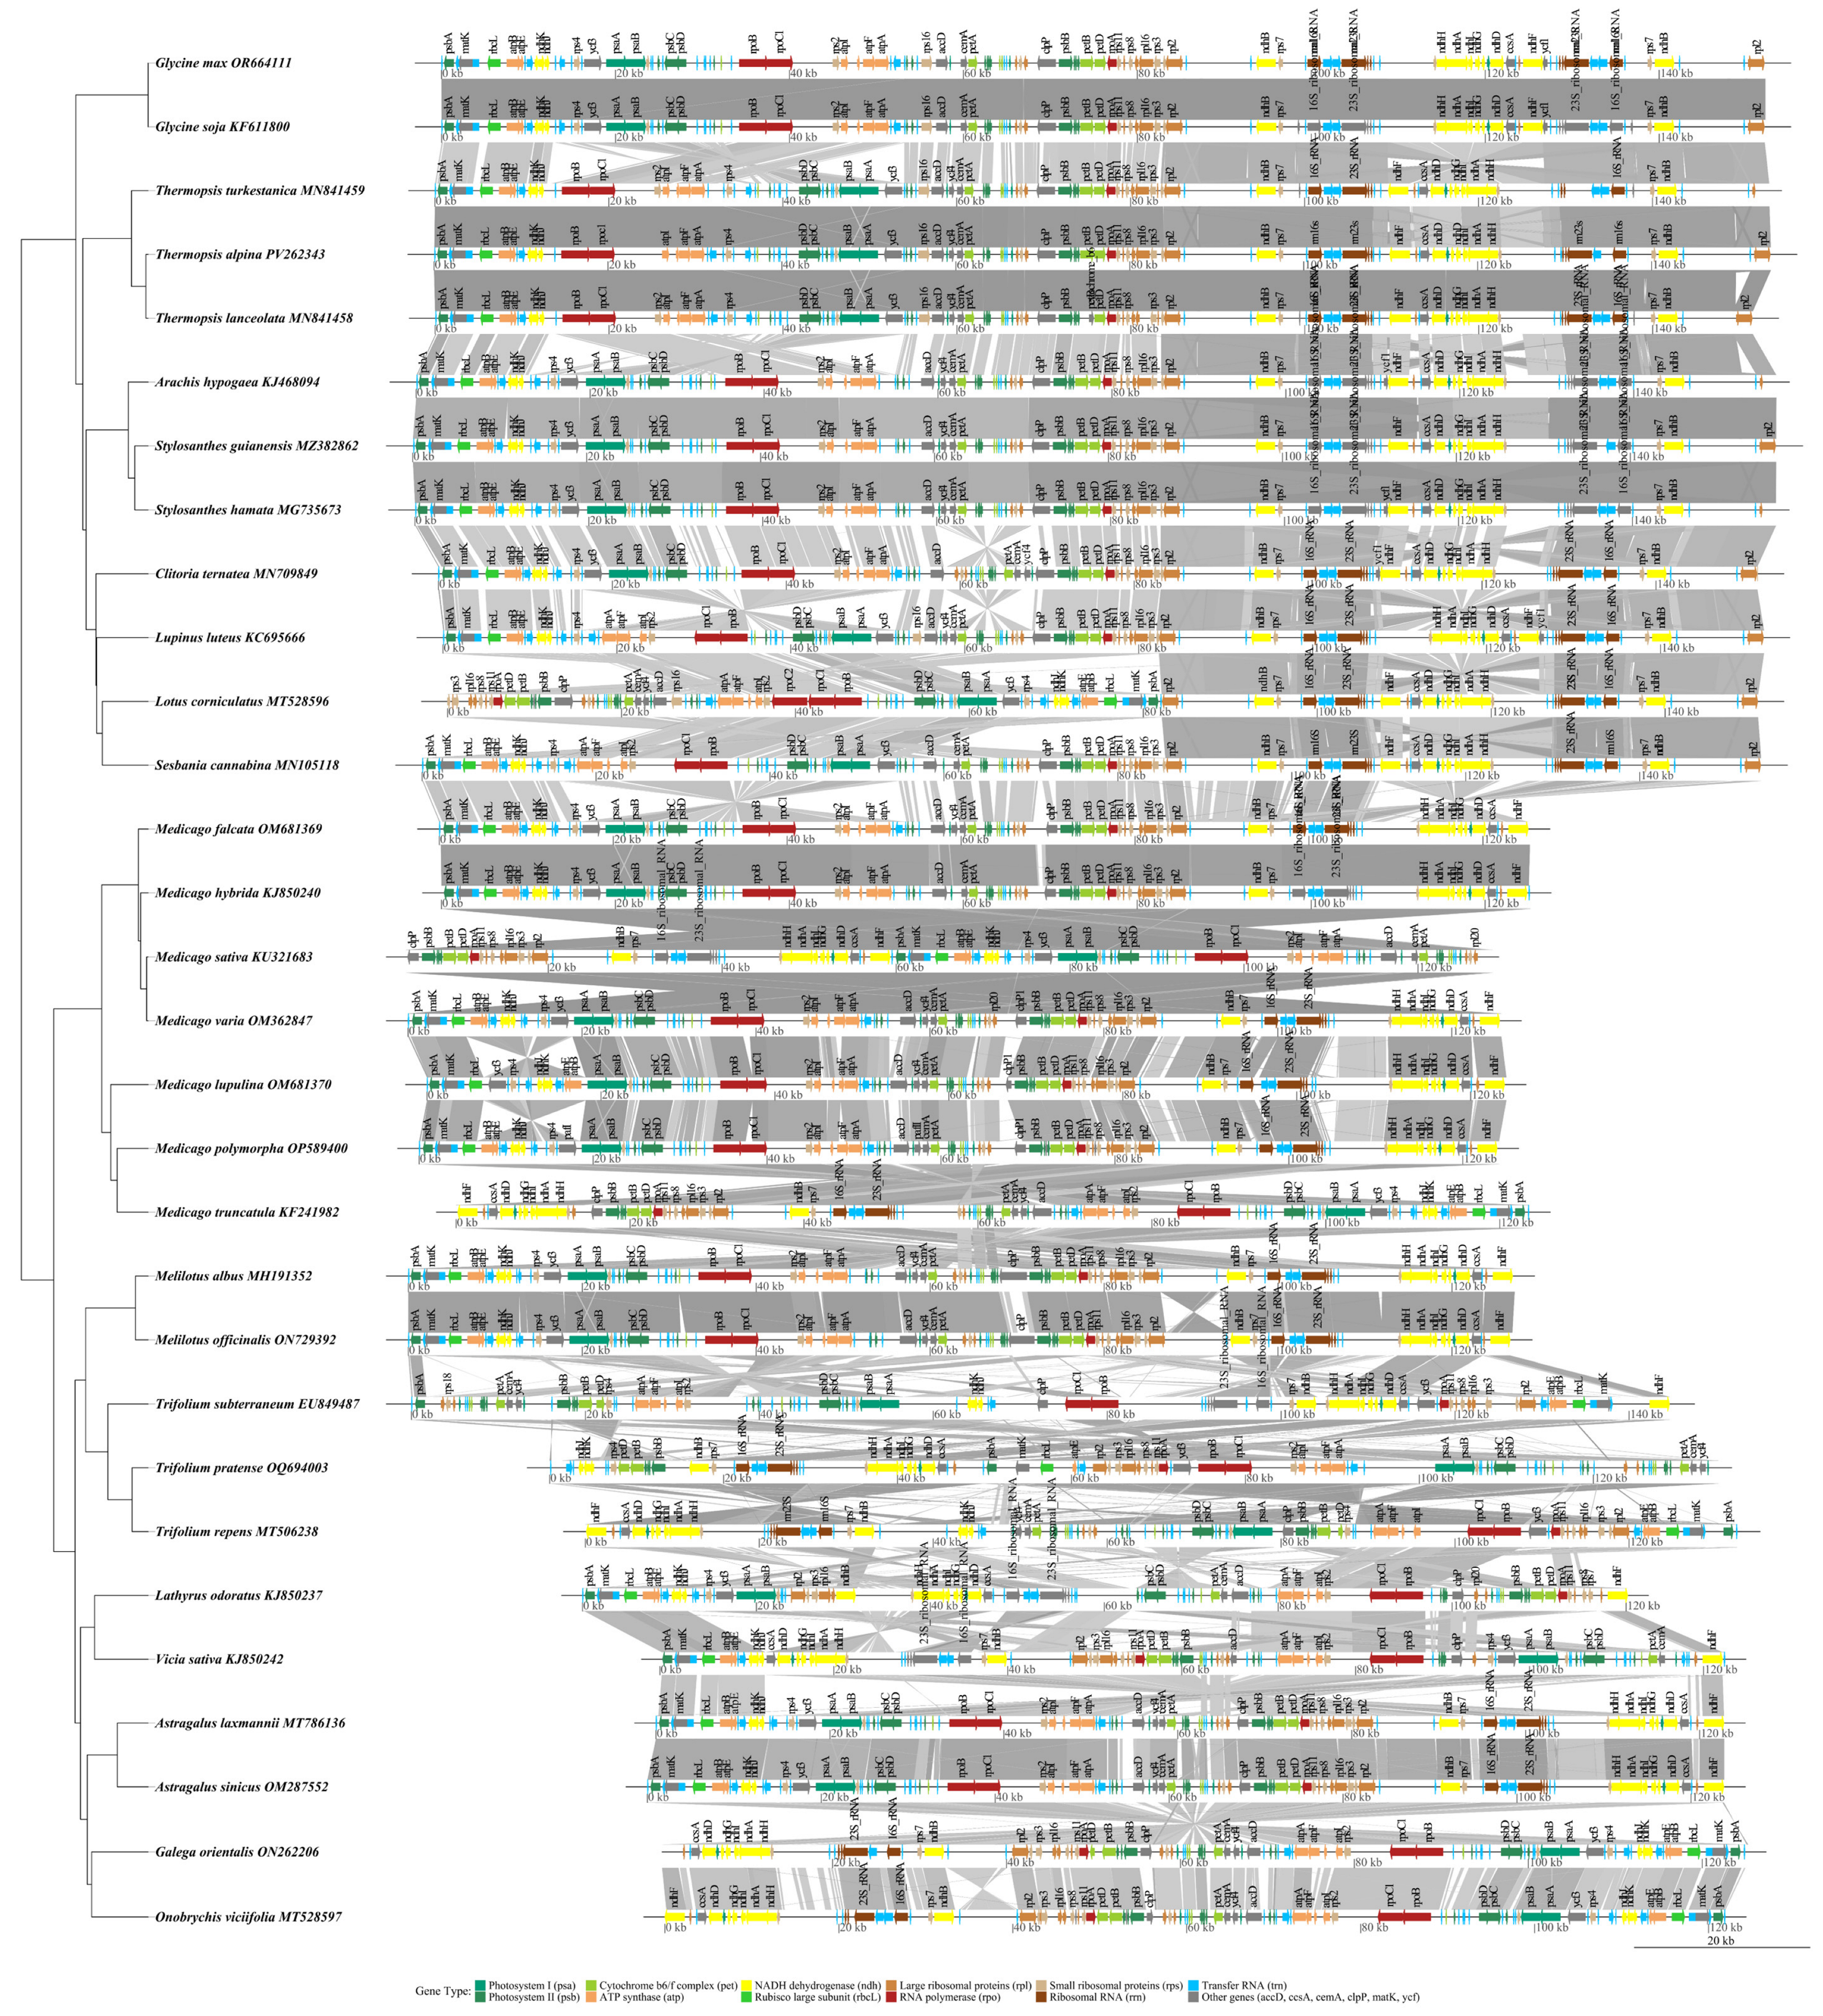
3.9. Collinearity Analysis and Phylogenetic Analysis
4. Discussion
4.1. Codon Usage Bias and Natural Selection
4.2. GC Content and Base Composition
4.3. SSRs and Genetic Diversity
4.4. Phylogenetic Analysis and Evolutionary Relationships
5. Conclusions
Supplementary Materials
Author Contributions
Funding
Data Availability Statement
Acknowledgments
Conflicts of Interest
References
- Phelan, P.; Moloney, A.P.; McGeough, E.J.; Humphreys, J.; Bertilsson, J.; Riordan, E.G.O.; Kiely, P.O. Forage Legumes for Grazing and Conserving in Ruminant Production Systems. Crit. Rev. Plant Sci. 2015, 34, 281–326. [Google Scholar]
- Jiao, P.P.; Xi, J.; Qu, W.R.; Zhang, S.H.; Yang, T.G.; Wu, Z.H. Complete chloroplast genome sequence of Thermopsis turkestanica Gand. (Leguminosae). Mitochondrial DNA Part B. Resour. 2021, 6, 335–336. [Google Scholar]
- Yu, X.C.; Zhu, H.Y. Enacting partner specificity in legume–rhizobia symbioses. aBIOTECH 2024, 1–17. [Google Scholar] [CrossRef]
- Mielmann, A. The utilisation of lucerne (Medicago sativa): A review. Br. Food. J. 2013, 115, 590–600. [Google Scholar]
- McKenna, P.; Cannon, N.; Conway, J.; Dooley, J. The use of red clover (Trifolium pratense) in soil fertility-building: A Review. Field Crops Res. 2018, 221, 38–49. [Google Scholar]
- Soumare, A.; Diedhiou, G.A.; Thuita, M.; Hafidi, M.; Ouhdouch, Y.; Gopalakrishnan, S.; Kouisni, L. Exploiting Biological Nitrogen Fixation: A Route Towards a Sustainable Agriculture. Plants 2020, 9, 1011. [Google Scholar] [CrossRef]
- Zhang, Y.; Nie, X.; Jia, X.; Zhao, C.; Biradar, S.S.; Wang, L.; Du, X.; Weining, S. Analysis of codon usage patterns of the chloroplast genomes in the Poaceae family. Aust. J. Bot. 2012, 60, 461–470. [Google Scholar]
- Dobrogojski, J.; Adamiec, M.; Luciński, R. The chloroplast genome: A review. Acta Physiol. Plant 2020, 42, 155–167. [Google Scholar] [CrossRef]
- Rolland, N.; Curien, G.; Finazzi, G.; Kuntz, M.; Maréchal, E.; Matringe, M.; Ravanel, S.; Seigneurin-Berny, D. The Biosynthetic Capacities of the Plastids and Integration Between Cytoplasmic and Chloroplast Processes. Annu. Rev. Genet. 2012, 46, 233–264. [Google Scholar] [CrossRef]
- Joyard, J.; Ferro, M.; Masselon, C.; Seigneurin-Berny, D.; Salvi, D.; Garin, J.; Rolland, N. Chloroplast proteomics highlights the subcellular compartmentation of lipid metabolism. Prog Lipid Res. 2009, 49, 128–158. [Google Scholar]
- Kwak, S.Y.; Lew, T.T.S.; Sweeney, C.J.; Koman, V.B.; Wong, M.H.; BohmertTatarev, K.; Snell, K.D.; Seo, J.S.; Chua, N.H.; Strano, M.S. Chloroplast-selective gene delivery and expression in planta using chitosan-complexed single-walled carbon nanotube carriers. Nat. Nanotechnol. 2019, 14, 447–455. [Google Scholar] [CrossRef] [PubMed]
- Tsuneyoshi, K. Review of cytological studies on cellular and molecular mechanisms of uniparental (maternal or paternal) inheritance of plastid and mitochondrial genomes induced by active digestion of organelle nuclei (nucleoids). J. Plant Res. 2010, 123, 207–230. [Google Scholar]
- Wolfe, K.H.; Li, W.H.; Sharp, P.M. Rates of nucleotide substitution vary greatly among plant mitochondrial, chloroplast, and nuclear DNAs. Proc. Natl. Acad. Sci. USA 1987, 84, 9054–9058. [Google Scholar] [CrossRef]
- Li, Q.J.; Su, N.; Zhang, L.; Tong, R.C.; Zhang, X.H.; Wang, J.R.; Chang, Z.Y.; Zhao, L.; Daniel, P. Chloroplast genomes elucidate diversity, phylogeny, and taxonomy of Pulsatilla (Ranunculaceae). Sci. Rep. 2020, 10, 19781. [Google Scholar]
- Zhou, J.; Chen, X.; Cui, Y.; Sun, W.; Li, Y.; Wang, Y.; Song, J.; Yao, H. Molecular Structure and Phylogenetic Analyses of Complete Chloroplast Genomes of Two Aristolochia Medicinal Species. Int. J. Mol. Sci. 2017, 18, 1839. [Google Scholar] [CrossRef]
- Andrea, W.J.D.; Theroux, S.; Bradley, R.S.; Huang, X. Does phylogeny control [formula omitted]-temperature sensitivity? Implications for lacustrine alkenone paleothermometry. Geochim. Cosmochim. Acta 2016, 175, 168–180. [Google Scholar]
- Deng, N.X.; Sun, Z.X.; Meng, J.; Zhao, Y. Comparison of chloroplast genome characteristics and phylogenetic analysis of five Medicago L. species in M. sect. Medicago. Grassl. Turf. 2024, in press.
- Wang, X.J.; Dong, W.P.; Zhou, S.L. The Evolution Path of Medicago in China based on the Chloroplast Genome Analysis. Acta Ecol. Sin. 2022, 42, 6125–6136. [Google Scholar]
- Wang, Z.; Cai, Q.; Wang, Y.; Li, M.; Wang, C.; Wang, Z.; Jiao, C.; Xu, C.; Wang, H.; Zhang, Z. Comparative Analysis of Codon Bias in the Chloroplast Genomes of Theaceae Species. Front. Genet. 2022, 13, 824610. [Google Scholar] [CrossRef]
- Mads, M.; Eduardo, V.; Antonio, V.; Martin, W.B. Differential expression of the three independent CaM genes coding for an identical protein: Potential relevance of distinct mRNA stability by different codon usage. Cell Calcium 2022, 107, 102656. [Google Scholar]
- Chaney, L.J.; Clark, L.P. Roles for Synonymous Codon Usage in Protein Biogenesis. Annu. Rev. Biophys. 2015, 44, 143–166. [Google Scholar]
- Fran, S. The Code of Silence: Widespread Associations Between Synonymous Codon Biases and Gene Function. J. Mol. Evol. 2016, 82, 65–73. [Google Scholar]
- Plotkin Joshua, B.; Kudla, G. Synonymous but not the same: The causes and consequences of codon bias. Nat. Rev. Genet. 2011, 12, 32–42. [Google Scholar] [PubMed]
- Thankeswaran, S.P.; Varatharajalu, U.; Vijaipal, B. Codon usage bias. Mol. Biol. Rep. 2021, 49, 539–565. [Google Scholar]
- Arella, D.; Dilucca, M.; Giansanti, A. Codon usage bias and environmental adaptation in microbial organisms. Mol. Genet. 2021, 296, 751–762. [Google Scholar]
- Tian, C.Y.; Wu, Z.N.; Li, X.S.; Zhiyong, L. Codon Usage Bias of Chloroplast Genome in Medicago ruthenica. Acta Agrestia Sin. 2021, 29, 2678–2684. [Google Scholar]
- Xiao, M.; Hu, X.; Li, Y.; Liu, Q.; Shen, S.; Jiang, T.; Zhang, L.; Zhou, Y.; Li, Y.; Luo, X.; et al. Comparative analysis of codon usage patterns in the chloroplast genomes of nine forage legumes. Physiol. Mol. Biol. Plants. 2024, 30, 153–166. [Google Scholar]
- Gao, S.Y.; LI, Y.M.; Yang, Z.Q.; Dong, K.H.; Xia, F.S. Codon usage bias analysis of the chloroplast genome of Bothriochloa ischaemum. Acta Prataculturae Sin. 2023, 32, 85–95. [Google Scholar]
- Jin, J.J.; Yu, W.B.; Yang, J.B.; Song, Y.; dePamphilis, C.W.; Yi, T.S.; Li, D.Z. Getorganelle: A fast and versatile toolkit for accurate denovo assembly of organelle genomes. Genome Biol. 2020, 21, 241. [Google Scholar]
- Dierckxsens, N.; Mardulyn, P.; Smits, G. NOVOPlasty: De novo assembly of organelle genomes from whole genome data. Nucleic Acids Res. 2017, 45, e18. [Google Scholar]
- Shi, L.; Chen, H.; Jiang, M.; Wang, L.; Wu, X.; Huang, L.; Liu, C. Cpgavas2, an integrated plastome sequence annotator and analyzer. Nucleic Acids Res. 2019, 47, W65–W73. [Google Scholar]
- Kashi, Y.; King, D.G. Simple sequence repeats as advantageous mutators in evolution. Trends Genet. 2006, 22, 253–259. [Google Scholar] [PubMed]
- Beier, S.; Thiel, T.; Münch, T.; Scholz, U.; Mascher, M. MISA-web: A web server for microsatellite prediction. Bioinformatics 2017, 33, 2583–2585. [Google Scholar]
- Wright, F. The ’effective number of codons’ used in a gene. Gene 1990, 87, 23–29. [Google Scholar] [PubMed]
- Sueoka, N. Near homogeneity of PR2-bias fingerprints in the human genome and their implications in phylogenetic analyses. J. Mol. Evol. 2001, 53, 469–476. [Google Scholar]
- Xiang, H.; Zhang, R.Z.; Butler, R.R.; Liu, T.; Zhang, L.; Pombert, J.F.; Zhou, Z.Y. Comparative Analysis of Codon Usage Bias Patterns in Microsporidian Genomes. PLoS ONE 2015, 10, e129223. [Google Scholar]
- He, B.; Dong, H.; Jiang, C.; Cao, F.L.; Tao, S.T.; Xu, L.A. Analysis of codon usage patterns in Ginkgo biloba reveals codon usage tendency from A/U-ending to G/C-ending. Sci. Rep. 2016, 6, 35927. [Google Scholar]
- Sueoka, N. Directional mutation pressure and neutral molecular evolution. Proc. Natl. Acad. Sci. USA 1988, 85, 2653–2657. [Google Scholar]
- Romero, H.; Zavala, A.; Musto, H.; Bernardi, G. The influence of translational selection on codon usage in fishes from the family Cyprinidae. Gene 2003, 317, 141–147. [Google Scholar]
- Wang, H.C.; Hickey, D. Rapid divergence of codon usage patterns within the rice genome. BMC Evol. Biol. 2007, 7, S6. [Google Scholar]
- Ying, C.; Weicai, Y.; Yongdong, Z.; Yuesheng, X. High speed BLASTN: An accelerated MegaBLAST search tool. Nucleic. Acids. Res. 2015, 43, 7762–7768. [Google Scholar]
- Kazutaka, K.; Standley, D.M. MAFFT multiple sequence alignment software version 7: Improvements in performance and usability. Mol. Biol. Evol. 2013, 30, 772–780. [Google Scholar]
- Guy, L.; Roat Kultima, J.; Andersson, S.G. genoPlotR: Comparative gene and genome visualization in R. Bioinformatics 2010, 26, 2334–2335. [Google Scholar] [PubMed]
- Koonin, V.E.; Novozhilov, S.A. Origin and Evolution of the Universal Genetic Code. Annu. Rev. Genet. 2017, 51, 45–62. [Google Scholar]
- Li, Y.C.; Korol, A.B.; Fahima, T.; Beiles, A.; Nevo, E. Microsatellites: Genomic distribution, putative functions and mutational mechanisms: A review. Mol. Ecol. 2002, 11, 2453–2465. [Google Scholar]
- Sueoka, N.; Kawanishi, Y. DNA G+C content of the third codon position and codon usage biases of human genes. Gene 2000, 261, 53–62. [Google Scholar]
- Blake, W.J.; Kaern, M.; Cantor, C.R.; Collins, J.J. Noise in eukaryotic gene expression. Nature 2003, 422, 633–637. [Google Scholar]
- Olejniczak, M.; Uhlenbeck, O.C. tRNA residues that have coevolved with their anticodon to ensure uniform and accurate codon recognition. Biochimie 2006, 88, 943–950. [Google Scholar]
- Gu, W.J.; Zhou, T.; Ma, J.M.; Sun, X.; Lu, Z.H. Folding type specific secondary structure propensities of synonymous codons. IEEE Trans. Nanobiosci. 2003, 2, 150–157. [Google Scholar]
- Deschavanne, P.; Filipski, J. Correlation of GC content with replication timing and repair mechanisms in weakly expressed E. coli genes. Nucleic. Acids. Res. 1995, 23, 1350–1353. [Google Scholar]
- Zheng, S.; Liang, M.; Robert, M.; Xiansheng, Z.; Dawei, H. Analysis of codon usage on Wolbachia pipientis w Mel genome. Sci. Sin. 2009, 39, 948–953. [Google Scholar]
- Huang, Y.; Koonin, E.V.; Lipman, D.J.; Przytycka, T.M. Selection for minimization of translational frameshifting errors as a factor in the evolution of codon usage. Nucleic. Acids. Res. 2009, 37, 6799–6810. [Google Scholar] [CrossRef]
- Hiraoka, Y.; Kawamata, K.; Haraguchi, T.; Chikashige, Y. Codon usage bias is correlated with gene expression levels in the fission yeast Schizosaccharomyces pombe. Genes Cells 2009, 14, 499–509. [Google Scholar] [CrossRef]
- Sharp, P.M.; Emery, L.R.; Zeng, K. Forces that influence the evolution of codon bias. Philos. Trans. R. Soc. Lond. Ser. B Biol. Sci. 2010, 365, 1203–1212. [Google Scholar] [CrossRef] [PubMed]
- Li, G.; Zhang, L.; Xue, P. Codon usage pattern and genetic diversity in chloroplast genomes of Panicum species. Gene 2021, 802, 145866. [Google Scholar] [CrossRef] [PubMed]
- Song, H.; Liu, J.; Chen, T.; Nan, Z.B. Synonymous codon usage pattern in model legume Medicago truncatula. J. Integr. Agric. 2018, 17, 2074–2081. [Google Scholar] [CrossRef]
- Tao, X.L.; Ma, L.; Zhang, Z.S.; Liu, W.X.; Liu, Z.P. Characterization of the complete chloroplast genome of alfalfa (Medicago sativa) (Leguminosae). Gene Rep. 2017, 6, 667–673. [Google Scholar] [CrossRef]
- Dorjee, T.; Gao, F.; Zhou, Y.J. The complete chloroplast genome of Thermopsis lanceolata: Genome structure and its phylogenetic relationships within the family Fabaceae. Mitochondrial DNA Part B. Resour. 2022, 7, 2076–2080. [Google Scholar] [CrossRef]
- Zhang, Y.; Shen, Z.N.; Meng, X.R.; Zhang, L.M.; Liu, Z.G.; Liu, M.J.; Zhang, F.; Zhao, J. Codon usage patterns across seven Rosales species. BMC Plant Biol. 2022, 22, 65. [Google Scholar] [CrossRef]
- Yang, X.M.; Wang, Y.; Gong, W.X.; Li, Y.X. Comparative Analysis of the Codon Usage Pattern in the Chloroplast Genomes of Gnetales Species. Int. J. Mol. Sci. 2024, 25, 10622. [Google Scholar] [CrossRef]
- Bhattacharyya, D.; Uddin, A.; Das, S.K.; Chakraborty, S. Mutation pressure and natural selection on codon usage in chloroplast genes of two species in Pisum L. (Fabaceae: Faboideae). Mitochondrial DNA A DNA Mapp Seq Anal. 2019, 30, 664–673. [Google Scholar] [CrossRef]
- Sharp, P.M.; Stenico, M.; Peden, J.F.; Lloyd, A.T. Codon usage: Mutational bias, translational selection, or both? Biochem. Soc. Trans. 1993, 21, 835–841. [Google Scholar] [PubMed]
- Morton, B.R. Selection on the codon bias of chloroplast and cyanelle genes in different plant and algal lineages. J. Mol. Evol. 1998, 46, 449–459. [Google Scholar]
- Zhang, P.; Xu, W.; Lu, X.; Wang, L. Analysis of codon usage bias of chloroplast genomes in Gynostemma species. Physiol. Mol. Biol. Plants. 2021, 27, 2727–2737. [Google Scholar] [PubMed]
- Pugh, T.; Fouet, O.; Risterucci, A.M.; Brottier, P.; Abouladze, M.; Deletrez, C.; Courtois, B.; Clement, D.; Larmande, P.; N’Goran, J.A.K.; et al. A new cacao linkage map based on codominant markers: Development and integration of 201 new microsatellite markers. TAG Theor. Appl. Genet. 2004, 108, 1151–1161. [Google Scholar] [PubMed]
- Powell, W.; Morgante, M.; McDevitt, R.; Vendramin, G.G.; Rafalski, J.A. Polymorphic simple sequence repeat regions in chloroplast genomes: Applications to the population genetics of pines. Proc. Natl. Acad. Sci. USA 1995, 92, 7759–7763. [Google Scholar]
- Zhang, Y.M.; Han, L.J.; Yang, C.W.; Yin, Z.L.; Tian, X.; Qian, Z.G.; Li, G.D. Comparative chloroplast genome analysis of medicinally important Veratrum (Melanthiaceae) in China: Insights into genomic characterization and phylogenetic relationships. Plant Divers. 2022, 44, 70–82. [Google Scholar]
- Li, Y.C.; Korol, A.B.; Fahima, T.; Nevo, E. Microsatellites within genes: Structure, function, and evolution. Mol. Biol. Evol. 2004, 21, 991–1007. [Google Scholar]
- Smýkal, P.; Coyne, C.J.; Ambrose, M.J.; Maxted, N.; Schaefer, H.; Blair, M.W.; Berger, J.; Greene, S.L.; Nelson, M.N.; Besharat, N.; et al. Legume Crops Phylogeny and Genetic Diversity for Science and Breeding. Crit. Rev. Plant Sci. 2015, 34, 43–104. [Google Scholar]
- Bartolomé, S. Evolution and Function of the Chloroplast. Current Investigations and Perspectives. Int. J. Mol. Sci. 2018, 19, 3095. [Google Scholar] [CrossRef]
- Li, C.C.; Bao, Y.; Hong, T.; Li, J.C.; Yao, M.Z.; Wang, N.; Wu, X.M.; Xie, K.D.; Zhou, Y.F.; Guo, W.W. Insights into chloroplast genome evolution in Rutaceae through population genomics. Hortic. Adv. 2024, 2, 13. [Google Scholar]
- Jiang, D.; Cai, X.; Gong, M.; Xia, M.; Xing, H.; Dong, S.; Tian, S.; Li, J.; Lin, J.; Liu, Y.; et al. Correction: Complete chloroplast genomes provide insights into evolution and phylogeny of Zingiber (Zingiberaceae). BMC Genom. 2023, 24, 397. [Google Scholar]
- Hu, J.X.; Yan, D.L.; Yuan, H.W.; Zhang, J.H.; Zheng, B.S. Comparative analysis of chloroplast genomes in ten holly (Ilex) species: Insights into phylogenetics and genome evolution. BMC Ecol. Evol. 2024, 24, 133. [Google Scholar]
- Feng, Y.; Gao, X.F.; Zhang, J.Y.; Jiang, L.S.; Li, X.; Deng, H.N.; Liao, M.; Xu, B. Complete Chloroplast Genomes Provide Insights Into Evolution and Phylogeny of Campylotropis (Fabaceae). Front Plant Sci. 2022, 13, 895543. [Google Scholar] [PubMed]

| No. | Species Name | Accession Numbers | Genome Size | CDS Number | Toxic |
|---|---|---|---|---|---|
| 1 | Trifolium subterraneum | EU849487 | 144,763 | 69 | N |
| 2 | Lupinus luteus | KC695666 | 151,894 | 74 | Y |
| 3 | Medicago truncatula f. tricycla | KF241982 | 123,355 | 67 | N |
| 4 | Glycine soja | KF611800 | 152,217 | 77 | N |
| 5 | Arachis hypogaea | KJ468094 | 156,395 | 75 | N |
| 6 | Lathyrus odoratus | KJ850237 | 120,289 | 70 | Y |
| 7 | Medicago hybrida | KJ850240 | 125,208 | 70 | N |
| 8 | Vicia sativa | KJ850242 | 122,467 | 70 | Y |
| 9 | Medicago sativa | KU321683 | 128,574 | 70 | N |
| 10 | Stylosanthes hamata | MG735673 | 156,502 | 76 | N |
| 11 | Melilotus albus | MH191352 | 127,205 | 72 | N |
| 12 | Sesbania cannabina | MN105118 | 153,978 | 72 | N |
| 13 | Clitoria ternatea | MN709849 | 151,673 | 76 | Y |
| 14 | Thermopsis lanceolata | MN841458 | 151,526 | 78 | Y |
| 15 | Trifolium repens | MT506238 | 132,429 | 70 | N |
| 16 | Lotus corniculatus | MT528596 | 150,700 | 72 | Y |
| 17 | Onobrychis viciifolia | MT528597 | 122,102 | 71 | N |
| 18 | Astragalus laxmannii | MT786136 | 122,844 | 70 | Y |
| 19 | Stylosanthes guianensis | MZ382862 | 156,763 | 76 | N |
| 20 | Astragalus sinicus | OM287552 | 123,830 | 71 | Y |
| 21 | Medicago x varia | OM362847 | 125,698 | 71 | N |
| 22 | Medicago sativa subsp. falcata | OM681369 | 125,406 | 71 | N |
| 23 | Medicago lupulina | OM681370 | 124,107 | 72 | N |
| 24 | Galega orientalis | ON262206 | 125,280 | 67 | Y |
| 25 | Melilotus officinalis | ON729392 | 126,946 | 72 | N |
| 26 | Medicago polymorpha | OP589400 | 124,163 | 71 | N |
| 27 | Trifolium pratense | OQ694003 | 134,370 | 65 | Y |
| 28 | Glycine max | OR664111 | 152,226 | 77 | N |
| 29 | Thermopsis turkestanica | MN841459 | 153,538 | 76 | Y |
| 30 | Thermopsis alpina | PV262343 | 153,714 | 80 | Y |
| Category of Genes | Group of Genes | Gene Name |
|---|---|---|
| Genes for photosynthesis | Subunits of photosystem I (5) | psaA, psaB, psaC, psaI, psaJ |
| Subunits of photosystem II (14) | psbA, psbB, psbC, psbD, psbE, psbF, psbI, psbJ, psbK, psbH, psbM, psbN, psbT, psbZ | |
| Subunits of cytochrome (6) | petA, petB, petD, petG, petL, petN | |
| Subunits of ATP synthase (6) | atpA, atpB, atpE, atpF *, atpH, atpI | |
| Subunits of NADH-dehydrogenase (12) | ndhA *, ndhB *a, ndhC, ndhD a, ndhE, ndhF, ndhH, ndhI, ndhJ, ndhK | |
| Subunit of rubisco (1) | rbcL | |
| Transcription and translation | Large subunit of ribosome (10) | rpl14, rpl16, rpl2 *a, rpl20, rpl23 a, rpl32, rpl33, rpl36 |
| DNA-dependent RNA polymerase (4) | rpoA, rpoB, rpoC1 *, rpoC2 | |
| Small subunit of ribosome (12) | rps11, rps12, rps14, rps15, rps16, rps18, rps19, rps3, rps4, rps7 a, rps8 | |
| rRNA Genes (8) | rrn16S a, rrn23S a, rrn4.5S a, rrn5S a | |
| tRNA Genes (36) | trnA-UGC *a, trnC-GCA, trnD-GUC, trnE-UUC *, trnF-GAA, trnG-GCC, trnG-UCC, trnH-GUG, trnI-GAU, trnK-UUU *, trnL-CAA a, trnL-UAA *, trnL-UAG, trnM-CAU a, trnfM-CAU, trnN-GUU a, trnP-UGG, trnQ-UUG, trnR-ACG a, trnR-UCU, trnS-GCU, trnS-GGA, trnS-UGA, trnT-CGU *, trnT-GGU, trnT-UGU, trnV-UAC *, trnV-GAC a, trnW-CCA, trnY-GUA | |
| Other genes | Subunit of Acetyl-CoA-carboxylase (1) | accD |
| c-type cytochrom synthesis gene (1) | ccsA | |
| Envelop membrane protein (1) | cemA | |
| Protease (1) | clpP ** | |
| Maturase (1) | matK | |
| Genes of unknown function | Conserved open reading frames (5) | ycf1, ycf2 a, ycf3 **, ycf4 |
| No. | Species Name | Total Length (bp) | Total GC (%) | A (%) | T (%) | C (%) | G (%) | GC1 (%) | GC2 (%) | GC3 (%) | GC3s (%) | Average ENC |
|---|---|---|---|---|---|---|---|---|---|---|---|---|
| 1 | Trifolium subterraneum | 144,763 | 34.40 | 31.67 | 33.93 | 17.74 | 16.66 | 45.55 | 37.60 | 28.63 | 25.69 | 46.61 |
| 2 | Lupinus luteus | 151,894 | 36.61 | 31.37 | 32.02 | 18.35 | 18.26 | 44.73 | 37.57 | 29.55 | 26.63 | 47.33 |
| 3 | Medicago truncatula f. tricycla | 123,355 | 34.02 | 32.66 | 33.32 | 17.22 | 16.80 | 45.23 | 37.11 | 26.82 | 23.81 | 44.71 |
| 4 | Glycine soja | 152,217 | 35.38 | 32.36 | 32.26 | 17.40 | 17.97 | 44.13 | 36.84 | 27.48 | 24.47 | 46.00 |
| 5 | Arachis hypogaea | 156,395 | 36.37 | 31.85 | 31.78 | 18.04 | 18.33 | 44.67 | 37.70 | 29.65 | 26.71 | 47.47 |
| 6 | Lathyrus odoratus | 120,289 | 35.16 | 32.34 | 32.51 | 17.46 | 17.70 | 45.40 | 37.54 | 27.99 | 24.92 | 46.03 |
| 7 | Medicago hybrida | 125,208 | 33.82 | 33.08 | 33.10 | 16.38 | 17.44 | 45.18 | 37.3 | 26.78 | 23.80 | 45.26 |
| 8 | Vicia sativa | 122,467 | 35.15 | 32.39 | 32.46 | 18.11 | 17.04 | 45.41 | 37.41 | 27.82 | 24.85 | 46.57 |
| 9 | Medicago sativa | 128,574 | 34.39 | 32.81 | 32.81 | 16.58 | 17.81 | 45.27 | 37.30 | 26.84 | 23.86 | 45.11 |
| 10 | Stylosanthes hamata | 156,502 | 36.58 | 31.74 | 31.68 | 18.17 | 18.41 | 44.80 | 37.69 | 30.11 | 27.17 | 48.70 |
| 11 | Melilotus albus | 127,205 | 33.61 | 33.27 | 33.12 | 16.29 | 17.33 | 45.06 | 37.32 | 26.77 | 23.81 | 45.54 |
| 12 | Sesbania cannabina | 153,978 | 35.61 | 31.86 | 32.53 | 18.07 | 17.55 | 44.31 | 37.12 | 28.04 | 25.02 | 46.24 |
| 13 | Clitoria ternatea | 151,673 | 34.55 | 32.84 | 32.60 | 17.24 | 17.31 | 43.74 | 36.67 | 26.84 | 23.81 | 46.51 |
| 14 | Thermopsis lanceolata | 151,526 | 36.44 | 31.78 | 31.78 | 18.06 | 18.37 | 45.06 | 37.94 | 28.33 | 25.31 | 46.14 |
| 15 | Trifolium repens | 132,429 | 34.28 | 31.81 | 33.90 | 17.79 | 16.49 | 45.32 | 37.92 | 27.80 | 24.82 | 46.00 |
| 16 | Lotus corniculatus | 150,700 | 36.03 | 32.06 | 31.91 | 18.29 | 17.75 | 44.44 | 37.05 | 28.93 | 26.00 | 46.92 |
| 17 | Onobrychis viciifolia | 122,102 | 34.58 | 32.86 | 32.56 | 17.88 | 16.71 | 45.23 | 37.37 | 27.66 | 24.63 | 45.07 |
| 18 | Astragalus laxmannii | 122,844 | 34.11 | 33.01 | 32.88 | 16.52 | 17.60 | 44.81 | 37.30 | 27.15 | 24.17 | 45.07 |
| 19 | Stylosanthes guianensis | 156,763 | 36.43 | 31.82 | 31.75 | 18.10 | 18.33 | 44.95 | 37.88 | 29.93 | 27.01 | 48.19 |
| 20 | Astragalus sinicus | 123,830 | 34.10 | 33.02 | 32.89 | 16.49 | 17.61 | 44.93 | 37.19 | 27.17 | 24.15 | 45.51 |
| 21 | Medicago x varia | 125,698 | 33.81 | 33.08 | 33.10 | 16.36 | 17.45 | 45.26 | 37.32 | 26.81 | 23.82 | 44.87 |
| 22 | Medicago sativa subsp. falcata | 125,406 | 33.88 | 33.09 | 33.03 | 16.41 | 17.47 | 45.26 | 37.31 | 26.83 | 23.85 | 44.98 |
| 23 | Medicago lupulina | 124,107 | 33.88 | 33.05 | 33.07 | 16.43 | 17.45 | 45.02 | 37.19 | 26.79 | 23.78 | 44.78 |
| 24 | Galega orientalis | 125,280 | 34.11 | 32.92 | 32.97 | 17.58 | 16.53 | 45.75 | 38.05 | 26.73 | 23.66 | 45.99 |
| 25 | Melilotus officinalis | 126,946 | 33.85 | 33.09 | 33.06 | 16.32 | 17.53 | 44.83 | 37.07 | 26.76 | 23.84 | 45.43 |
| 26 | Medicago polymorpha | 124,163 | 34.09 | 32.94 | 32.96 | 16.49 | 17.60 | 45.32 | 37.21 | 27.10 | 24.10 | 44.68 |
| 27 | Trifolium pratense | 134,370 | 34.27 | 33.89 | 31.84 | 16.52 | 17.75 | 45.80 | 38.12 | 27.42 | 24.38 | 46.15 |
| 28 | Glycine max | 152,226 | 35.37 | 32.37 | 32.25 | 17.40 | 17.98 | 44.16 | 36.86 | 27.44 | 24.43 | 45.98 |
| 29 | Thermopsis turkestanica | 153,538 | 36.60 | 31.70 | 31.69 | 18.18 | 18.42 | 45.19 | 37.87 | 28.74 | 25.71 | 47.30 |
| 30 | Thermopsis alpina | 153,714 | 36.46 | 31.77 | 31.78 | 18.09 | 18.36 | 44.94 | 37.58 | 28.89 | 25.92 | 47.10 |
Disclaimer/Publisher’s Note: The statements, opinions and data contained in all publications are solely those of the individual author(s) and contributor(s) and not of MDPI and/or the editor(s). MDPI and/or the editor(s) disclaim responsibility for any injury to people or property resulting from any ideas, methods, instructions or products referred to in the content. |
© 2025 by the authors. Licensee MDPI, Basel, Switzerland. This article is an open access article distributed under the terms and conditions of the Creative Commons Attribution (CC BY) license (https://creativecommons.org/licenses/by/4.0/).
Share and Cite
Yang, R.; Xue, Y.; He, X.; Zhang, T. Comprehensive Analysis of Chloroplast Genomes in Leguminous Forage Species: Codon Usage, Phylogenetic Relationships, and Evolutionary Insights. Agronomy 2025, 15, 765. https://doi.org/10.3390/agronomy15040765
Yang R, Xue Y, He X, Zhang T. Comprehensive Analysis of Chloroplast Genomes in Leguminous Forage Species: Codon Usage, Phylogenetic Relationships, and Evolutionary Insights. Agronomy. 2025; 15(4):765. https://doi.org/10.3390/agronomy15040765
Chicago/Turabian StyleYang, Rui, Ying Xue, Xiaofan He, and Tiejun Zhang. 2025. "Comprehensive Analysis of Chloroplast Genomes in Leguminous Forage Species: Codon Usage, Phylogenetic Relationships, and Evolutionary Insights" Agronomy 15, no. 4: 765. https://doi.org/10.3390/agronomy15040765
APA StyleYang, R., Xue, Y., He, X., & Zhang, T. (2025). Comprehensive Analysis of Chloroplast Genomes in Leguminous Forage Species: Codon Usage, Phylogenetic Relationships, and Evolutionary Insights. Agronomy, 15(4), 765. https://doi.org/10.3390/agronomy15040765