Article

Effects of Low-Temperature Stress During Anthesis Stage on Dry Matter Accumulation and Yield of Winter Wheat

1
Jiangsu Provincial University Key Laboratory of Agricultural and Ecological Meteorology, Key Laboratory of Carbon Source and Sink-China Meteorological Administration (ECSS-CMA), School of Ecology and Applied Meteorology, Nanjing University of Information Science and Technology, Nanjing 210044, China
2
Laboratory of Organic Chemistry and Environment Sciences (LaCOSE), Faculty of Sciences and Technology, University of Kara-Togo, Kara 404, Togo
*
Author to whom correspondence should be addressed.
These authors contributed equally to this work.
Agronomy 2025, 15(4), 761; https://doi.org/10.3390/agronomy15040761
Submission received: 17 February 2025 / Revised: 16 March 2025 / Accepted: 19 March 2025 / Published: 21 March 2025

Abstract

:
Wheat growth is highly sensitive to temperature fluctuations, and with the intensification of global climate change, low-temperature stress has become more frequent during various growth stages of wheat, severely affecting its growth and reducing wheat yield. An experiment examined the effects of low-temperature (daytime 8:00–20:00/nighttime 20:00–next day 8:00: 16 °C/8 °C, 12 °C/4 °C, 8 °C/0 °C, and 4 °C/−4 °C) and exposure durations (1, 3, and 5 days) on winter wheat yield during the anthesis stage. Compared to exposure duration, temperature was the main factor affecting dry matter accumulation, distribution, and transport. Temperature had an average influence of 79.7%, 57.5%, 61.9%, and 79.0% on dry matter distribution in the stem-sheath, leaf, spike axis+glume, and grain, respectively. It also affected pre-anthesis translocation amount, the contribution of pre-anthesis translocation to grains, post-anthesis accumulation amount, and the contribution of post-anthesis accumulation to grains by 48.3%, 55.1%, 44.2%, and 48.2%, respectively. Conversely, exposure duration mainly influenced grain-filling parameters, with an average effect of 43.8%, 44.0%, 83.3%, and 43.8% on the maximum filling rate, average filling rate, filling rate in the fast-increasing period, and filling rate during the slow growth period, respectively. Low-temperature duration also significantly altered the fast-increasing period, slow growth period, and grain weight per spike by 79.9%, 79.9%, and 51.3%, respectively. Low-temperature stress alters the accumulation and distribution of dry matter in wheat, and the duration of exposure further affects the grain-filling process, ultimately resulting in a decrease in yield.

1. Introduction

Wheat is amongst the three major grain crops in the world, and damage caused by low-temperature chilling is a significant limiting factor affecting wheat yield [1]. In recent years, climate change facilitates an increased frequency, intensity, and duration of extremely low-temperature events, exacerbating the detrimental effects of low temperature [2]. Prolonged and intense cold injury in spring has led to a considerable decrease in wheat (Triticum aestivum) yield [3]. The main source of wheat yield is dry matter accumulation, and the process of wheat grain yield formation is fundamentally linked to the accumulation, distribution, and transport of dry matter [4]. Low-temperature stress can disrupt the physiological and metabolic processes of wheat, inhibiting its growth and development [5], reducing the photosynthetic capacity of flag leaves [6], decreasing the metabolic rate of carbohydrates [7], and impeding the accumulation and distribution of dry matter in wheat, ultimately resulting in reduced yield [8,9]. Low-temperature stress from the jointing stage to the booting stage could reduce biomass transfer to stems and leaves, leading to a decrease in dry matter accumulation [10]. The effect of low-temperature stress at the booting stage on the dry matter transport of wheat organs at the anthesis stage had no significant impact on the contribution rate of grain [11]. However, low-temperature stress during the jointing stage reduced the accumulation of post-anthesis dry matter and the rate at which this dry matter contributes to grain, ultimately affecting grain weight [12].
In wheat, grain weight is closely tied to the filling process. Low-temperature stress during the seedling stage prolongs the grain-filling stage, leading to decreased average and maximum filling rates, as well as reduced grain dry matter accumulation, resulting in decreased grain weight [13,14]. The impact of low temperature on wheat growth and development depends on the level and duration of the low temperature. Research findings indicated a negative correlation between the duration of low temperature and the level of low temperature and the yield, number of spikes per plant, number of grains per plant, and grain-filling parameter [8]. When wheat experienced cold damage during the seedling stage, the duration of low temperature did not have a significant impact on the yield. However, the interaction between the level yield temperature, the duration of low temperature, and the water level significantly affected the yield [15]. Low-temperature stress affected wheat fertility [16]. The low temperature at the anthesis stage and the booting stage led to the degeneration of the florets and a decrease in the fertility of the pollen and the number of grains per spike [17]. The low temperature mainly affected the development of the grain from the booting stage to the anthesis stage, resulting in a decrease in the weight of the grain [18]. The optimal temperature range for wheat flowering is 18–24 °C, with a minimum temperature threshold of approximately 9–12 °C. Within this range, wheat can flower and pollinate normally. However, when temperatures drop below 9 °C, flowering and pollination may be inhibited, leading to reduced yield [19,20]. The low temperatures in April, coinciding with the critical flowering period of wheat, severely affect the growth of wheat and other crops [21,22]. In China, the middle and lower reaches of the Yangtze River frequently experience spring low-temperature disasters due to climate change, especially during the heading and flowering stages, where low temperatures significantly impact the number of grains per spike and the thousand-grain weight of wheat [23]. Taking Jiangsu Province as an example, over the past 55 years, spring cold snaps have occurred on average 3.8 times per year, lasting an average of 3.2 days each time, with the occurrence rate of moderate and above-level spring cold snaps reaching over 22% [24]. Moreover, similar spring low-temperature events occur every two to four years in temperate regions worldwide, such as South Korea, the United States, Canada, and Australia, posing a threat to wheat yields [25]. It is evident that spring low temperature has become an important climatic factor restricting wheat production. However, limited research comprehensively evaluated the impact of low-temperature chilling injury during the critical stage of anthesis in wheat, despite extensive studies on temperature effects during the jointing and booting stages.
Low-temperature during the anthesis stage can impact wheat dry matter accumulation and translocation, grain-filling dynamics, and yield. We hypothesized that prolonged exposure to low temperature during the anthesis stage would exceed the plant’s acclimation capacity, thereby causing declines in post-anthesis dry matter accumulation and translocation, grain-filling dynamics, and yield. Additionally, we hypothesized that the intensity of low-temperature stress would have a stronger negative impact on these parameters compared to the duration of low-temperature exposure. This study employs controlled environmental experiments to simulate the effects of low temperature and its duration on wheat during the anthesis stage. The aim is to (1) evaluate the effects of varying low-temperature intensities and durations during anthesis stage on wheat dry matter accumulation, partitioning, and post-anthesis translocation; (2) characterize how these stressors alter grain-filling dynamics and yield; (3) quantify the relative contributions of temperature intensity versus duration to dry matter accumulation and translocation, grain filling, and yield. These findings can quantify the independent impacts of low-temperature intensity and duration during the wheat anthesis stage on dry matter accumulation, grain-filling dynamics, and yield. By calculating the contribution rates, this research clarifies the distinct mechanisms through which low-temperature intensity and duration affect wheat yield. Moreover, the findings offer significant theoretical support and practical guidance for addressing the impact of spring cold snaps on temperate wheat-growing regions under climate change, holding broad global relevance.

2. Materials and Methods

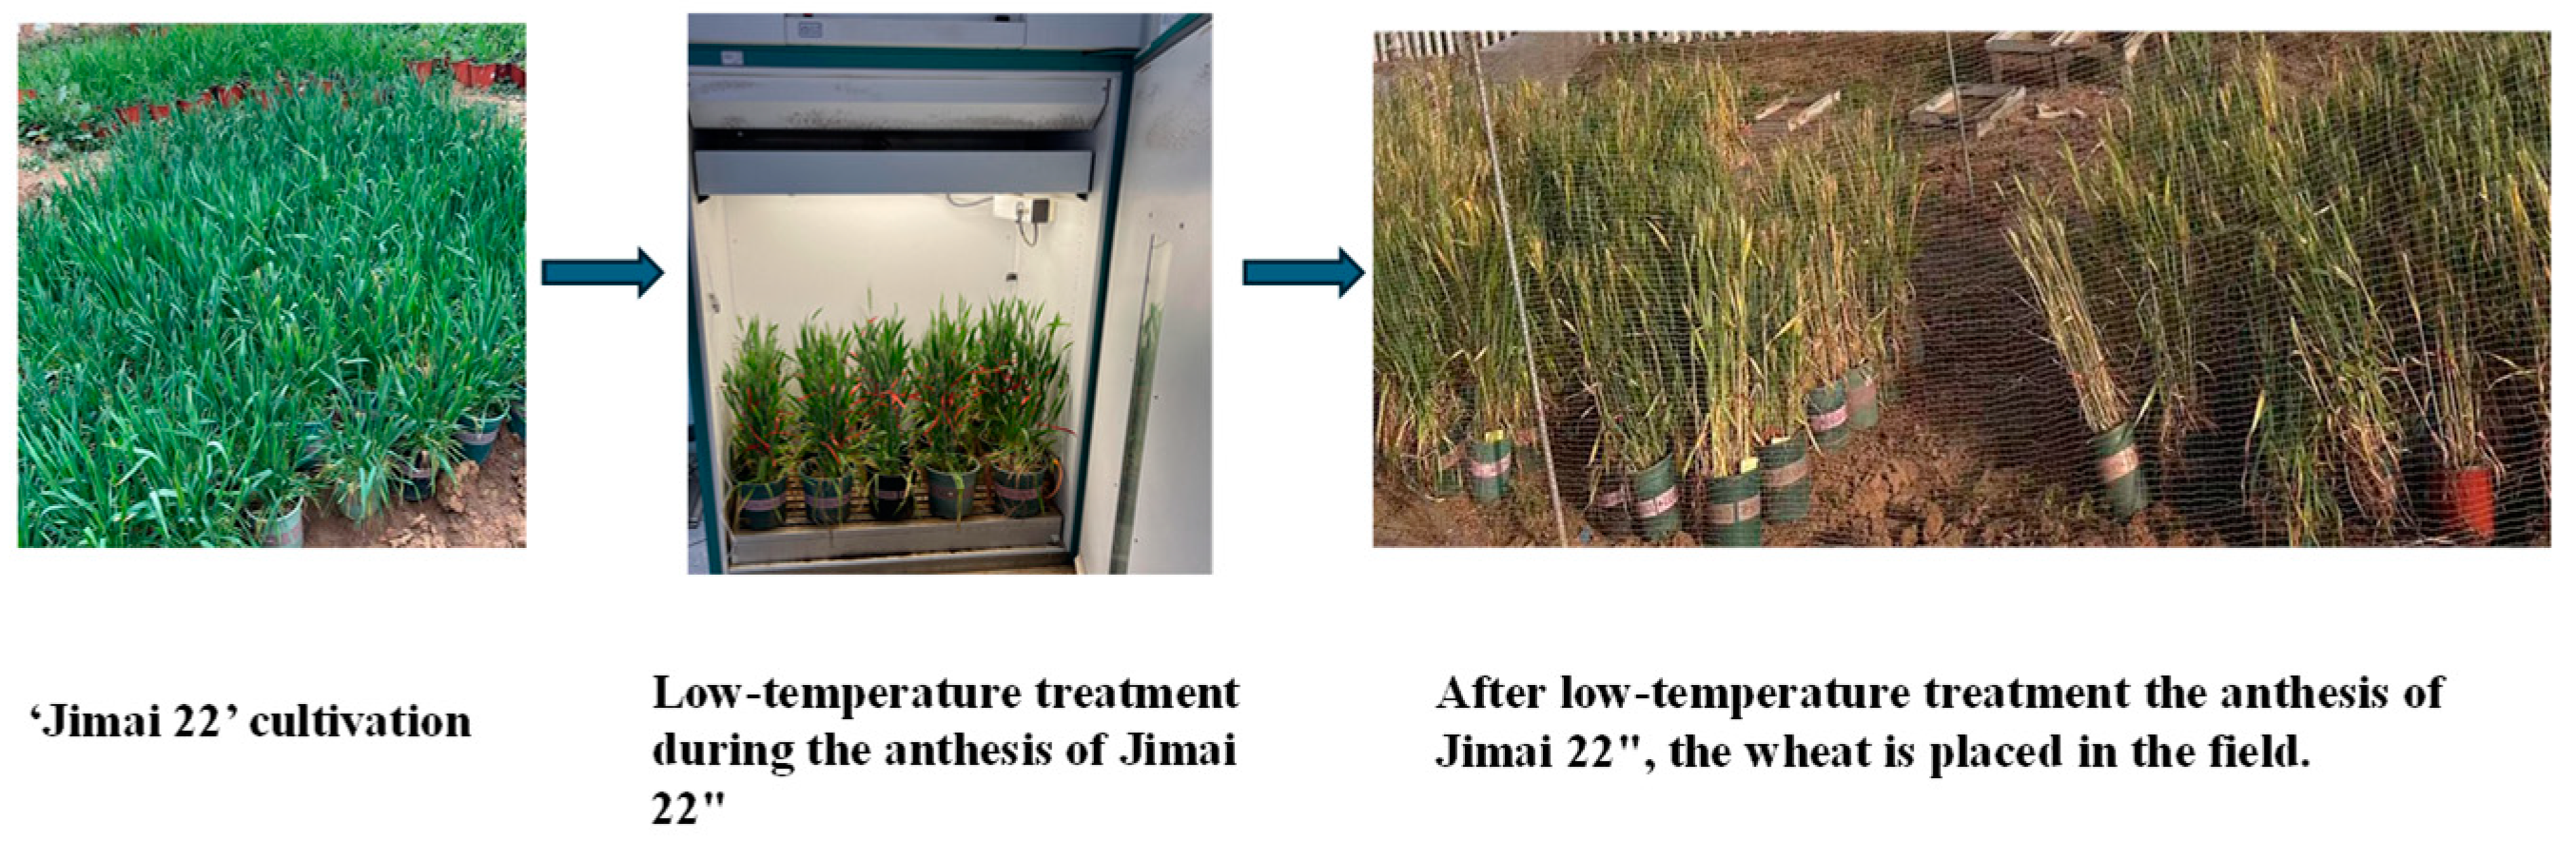
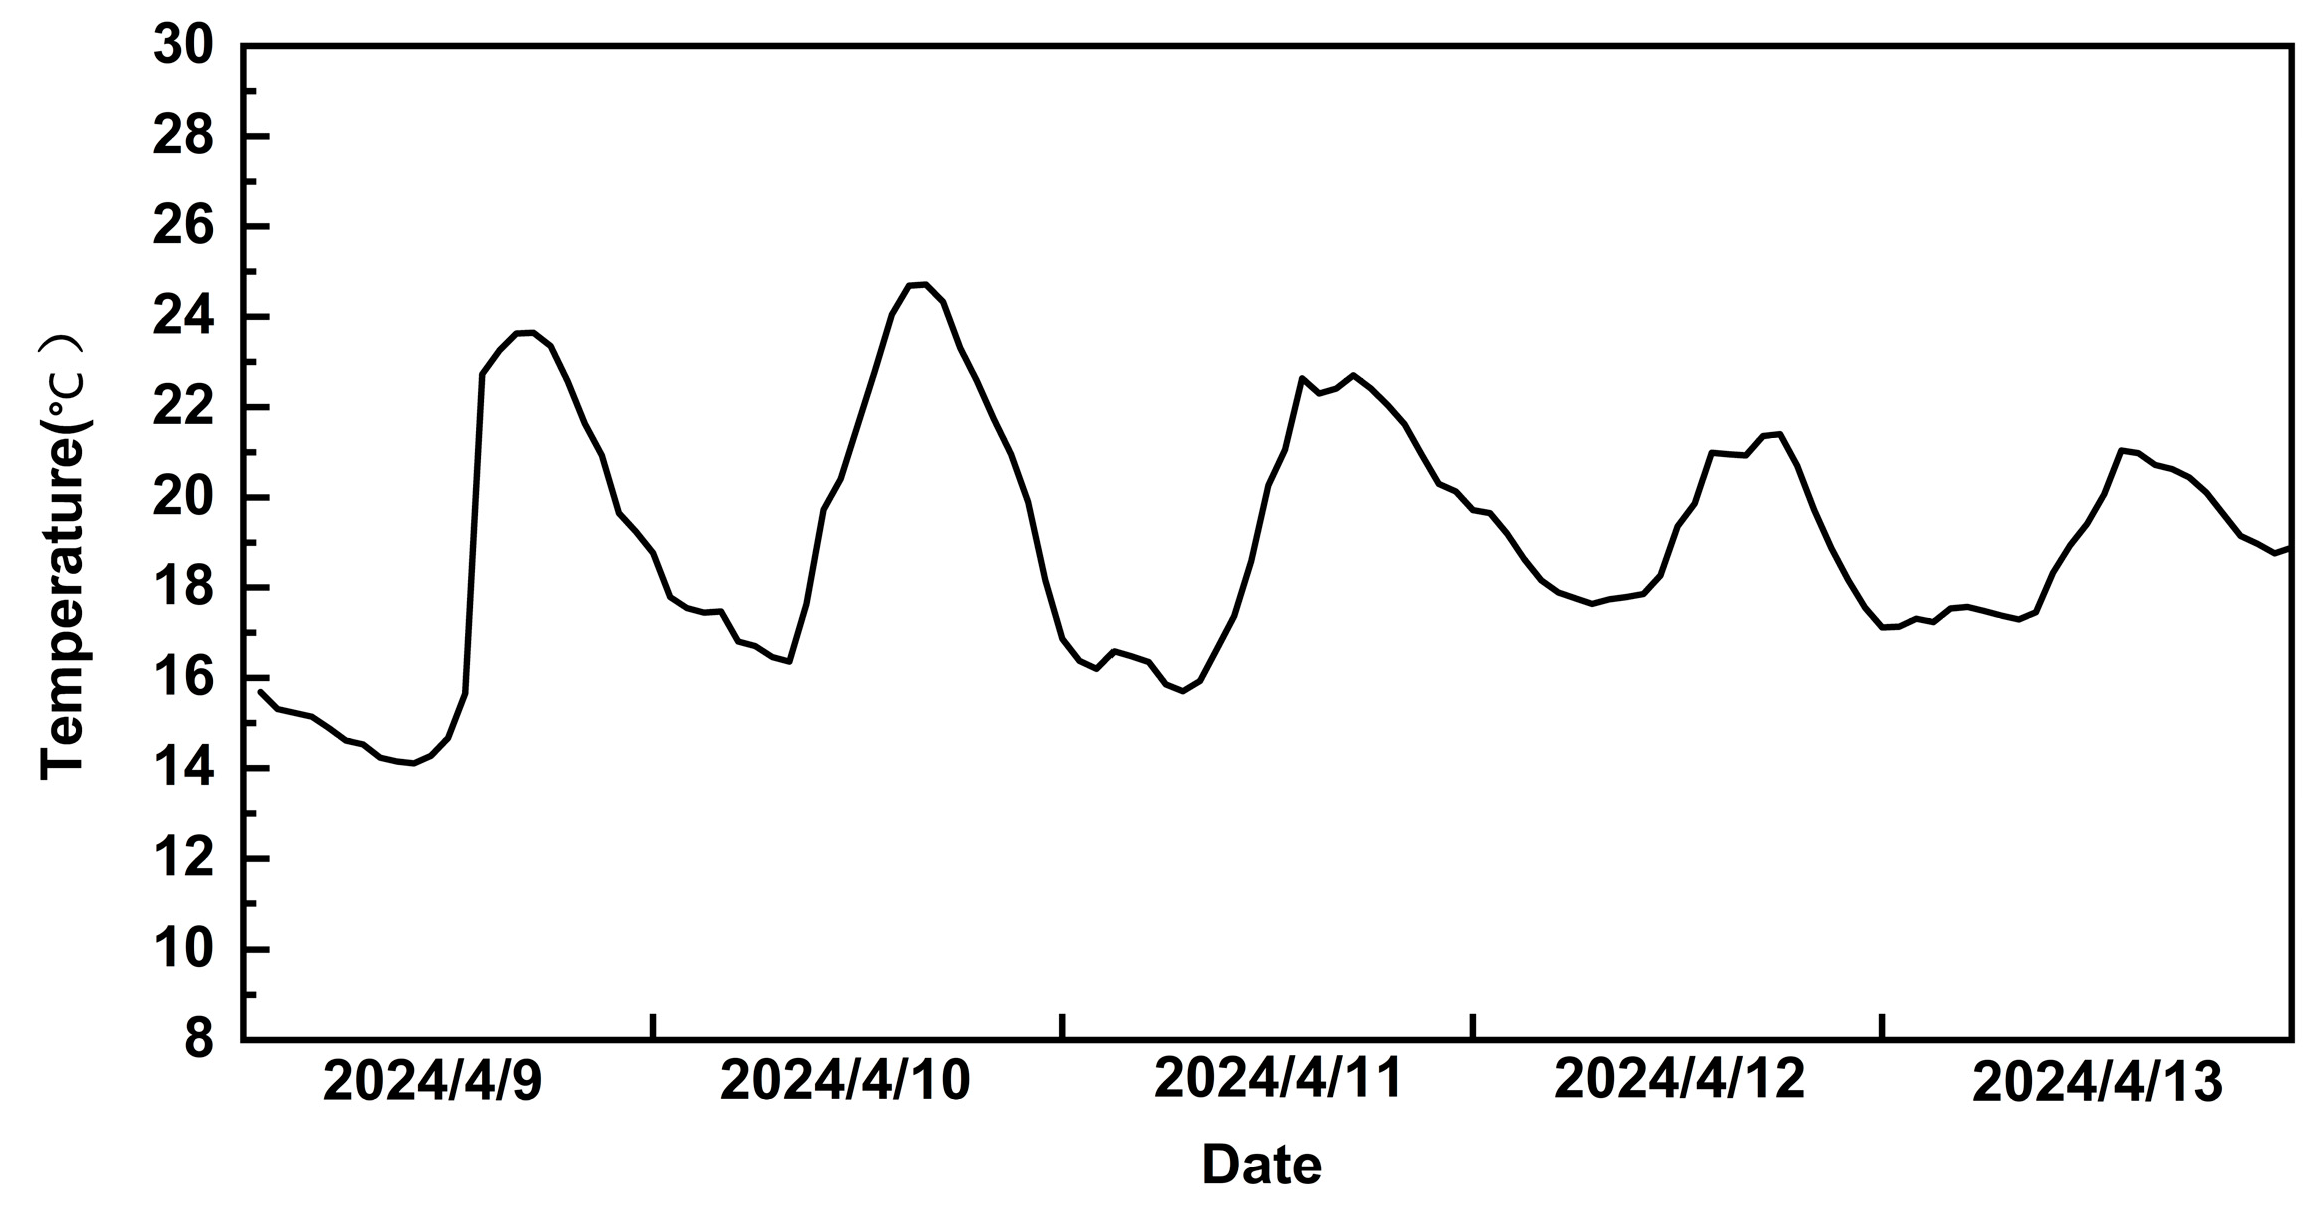
2.1. Experimental Design

The experiment was conducted at the Agricultural Meteorology Experimental Station of Nanjing University of Information Science and Technology from November 2023 to May 2024. The cultivar of semi-winter wheat (Triticum aestivum L.) used in the experiment was ‘Jimai 22’, a variety known for its resilience to low-temperature stress. It was developed by the Crop Research Institute of Shandong Academy of Agricultural Sciences and exhibits excellent lodging resistance. It maintains stable physiological conditions and high root activity under low-temperature conditions, thereby mitigating the negative impacts of cold stress on growth. Additionally, ‘Jimai 22’ has moderate disease resistance and broad adaptability and is widely cultivated in the Huang-Huai-Hai region [26,27]. The wheat seeds were planted in pots with a 30 cm diameter and 15 cm height. To ensure that the soil conditions were representative of the actual growth environment, the soil used for the experiments was sourced from the same field where the trials were conducted. Each pot was irrigated with the same amount of water to ensure a consistent water supply for all plants (all plants should be irrigated to 70% of the field capacity) and to prevent water shortage. The wheat was sown in pots on November 4, 2023, and initially placed in the natural field environment (Figure A1). On April 8, 2024, for the early anthesis stage of winter wheat, characterized by the release of pollen from the anthers of the middle spikelet of the wheat ear, the wheat pots were transferred to an artificial climate chamber. Four temperature regimes were applied: 16 °C/8 °C, 12 °C/4 °C, 8 °C/0 °C, and 4 °C/−4 °C, maintaining a 12 h photoperiod (08:00–20:00) followed by a 12 h dark period (20:00–08:00). The stress treatments were implemented for durations of 1, 3, and 5 days under each temperature condition, as detailed in Table 1. The air relative humidity was maintained at 70% ± 5.0%. The light intensity in the artificial climate chamber was 800 μmol∙m−2∙s−1 during the daytime and 0 μmol∙m−2∙s−1 at night. The type of light source in the artificial climate chamber is LED (Planck Optoelectronics, Shenzhen, China), which includes red light (660 nm), blue light (450 nm), and far-red light (730 nm). After the low-temperature stress treatment was completed, the plants were transferred to the natural field environment until maturity. Among them, the plants subjected to the T-4 °C treatment for 3 days and 5 days matured earlier on 29 April 2023, while the plants under the other treatments matured on 13 May 2024. The temperature variations within the field environment and artificial climate chamber throughout the experiment are shown in Figure 1 and Figure 2. Wheat grown in a natural field environment from the time of sowing to harvest served as the control (CK). Each treatment was replicated three times, and each replication consisted of 18 pots.

2.2. Determination of Items and Methods

During the anthesis stage, wheat plants that flowered on the same day and exhibited similar growth conditions and ear size were selected and marked. Subsequently, these wheat plants were subjected to low-temperature treatments in different artificial climate chambers for durations of 1 day, 3 days, and 5 days. After the low-temperature treatments were completed, the plants were removed from the climate chambers and placed in the field. Dry matter samples were taken from the marked plants on the day of anthesis, as well as at 7, 14, 21, and 28 days post-anthesis and at maturity.

2.2.1. Accumulation, Transport, and Distribution of Dry Matter

Samples were collected at the anthesis and maturity stages, with a total of 30 tagged wheat plants collected per treatment. During the anthesis stage, the samples were separated into three distinct parts: stem-sheath, leaf, and spikes. At the maturity stage, the samples were further divided into four components: stem-sheath, leaf, spike axis+glume, and grain. The samples were dried at 75 °C to a constant weight, after which the dry weights of the various organs were measured. Subsequently, the pre-anthesis translocation amount (PTA), the contribution of pre-anthesis translocation to grains (CPT), the post-anthesis accumulation amount (PAA), and the contribution of post-anthesis accumulation to grains (CPA) were calculated to evaluate the partitioning of dry matter within the plant.
The calculation formulas used in this study are as follows:
P T A g · stem - 1 = D r y   m a t t e r   a c c u m u l a t i o n   o f   v e g e t a t i v e   o r g a n s   a t   a n t h e s i s V e g e t a t i v e   o r g a n   a c c u m u l a t i o n   a t   m a t u r i t y
CPT % = Dry matter transport before anthesis Grain dry matter accumulation at mature × 100 %
P A A g · stem - 1 = G r a i n   d r y   w e i g h t   a t   m a t u r i t y A m o u n t   o f   d r y   m a t t e r   t r a n s f e r   b e f o r e   a n t h e s i s
CPA % = Grain   dry   matter   accumulation   after   anthesis Grain   dry   matter   accumulation   at   maturity × 100 %

2.2.2. Grain Weight

Sample collection started on the 7th day after anthesis and was performed every 7 days thereafter. For each treatment, a total of 30 stems that were specifically marked were collected. The spikes were dried at 75 °C until they reached a constant weight. Following this, the grains were carefully extracted, and counted, and their dry weight was measured to determine the thousand-grain weight.

2.2.3. Fitting of Grain-Filling Process

Fitting of winter wheat grain filling by logistic model
W =   K 1 + B e - At - 1
W is the thousand-grain weight of winter wheat (g·1000-grain−1), K is the theoretical maximum (g·1000-grain−1), t is the days after anthesis, and A and B are regression parameters. Simulating the logistic model, the following parameters can be calculated:
Average filling rate (Rave, g·1000-grain−1 d−1)
R ave = K T 99
Maximum filling rate ( R m a x , g·1000-grain−1 d−1)
R max   = KA 4
The duration of gradual-increasing stage ( t 1 , day), the duration of the fast-increasing period ( t 2 , day), and the duration of the slow growth period ( t 3 , day).
t 1   = ln B - ln 2 + 3 A
t 2 = ln B + ln 2 + 3 A
t 3 = ln B + 4.59512 A
Δ t 1   =   t 1
Δ t 2   = t 2   - t 1
Δ t 3 =   t 3 - t 2
The filling rate in the gradual-increasing stage (R1, g·1000-grain−1·d−1), the filling rate in the fast-increasing period (R2, g·1000-grain−1·d−1), and the filling rate during the slow growth period (R3, g·1000-grain−1·d−1).
R 1 = K 1 + B e - A t 1 - 1 Δ t 1
R 2 = K 1 + B e - A t 2 - 1 - K 1 + B e - A t 1 - 1 Δ t 2
R 3   = K 1 + B e - A t 3 - 1 - K 1 + B e - A t 2 - 1 Δ t 3

2.2.4. Determination of Yield Components

At the mature stage of wheat, the number of fruiting spikelets, sterile spikelets, grains per spike, thousand-grain weight, and grain weight were measured.

2.2.5. Determination of Pollen Viability

At 10:00 AM, upon completion of the low-temperature treatment during anthesis, anthers were harvested from the central region of the wheat ear for each treatment. These anthers were then subjected to I2-K staining [28] to assess pollen viability, and the pollen abortion rate was subsequently calculated.

2.3. Data Processing

All data presented are averaged across three replicates for each treatment. Comparative analyses between treatments with varying temperature and durations of low-temperature stress were conducted by computing the mean values of pertinent response indicators. Statistical analyses were executed using SPSS version 27, with significant differences among treatments assessed via the least significant difference (LSD) test at a significant level of 0.01. The threshold for statistical significance was set at p < 0.01. To assess the effects of temperature levels, duration, and their interaction on wheat dry matter, grain-filling characteristics, and yield components, ANOVA was performed using SPSS version 27. Logical curves were fitted using PyCharm 2024, and data were visualized with Origin Pro 2023b.

3. Results

3.1. Effects of Low-Temperature Stress During Anthesis Stage on Dry Matter Accumulation, Distribution, and Transport of Winter Wheat

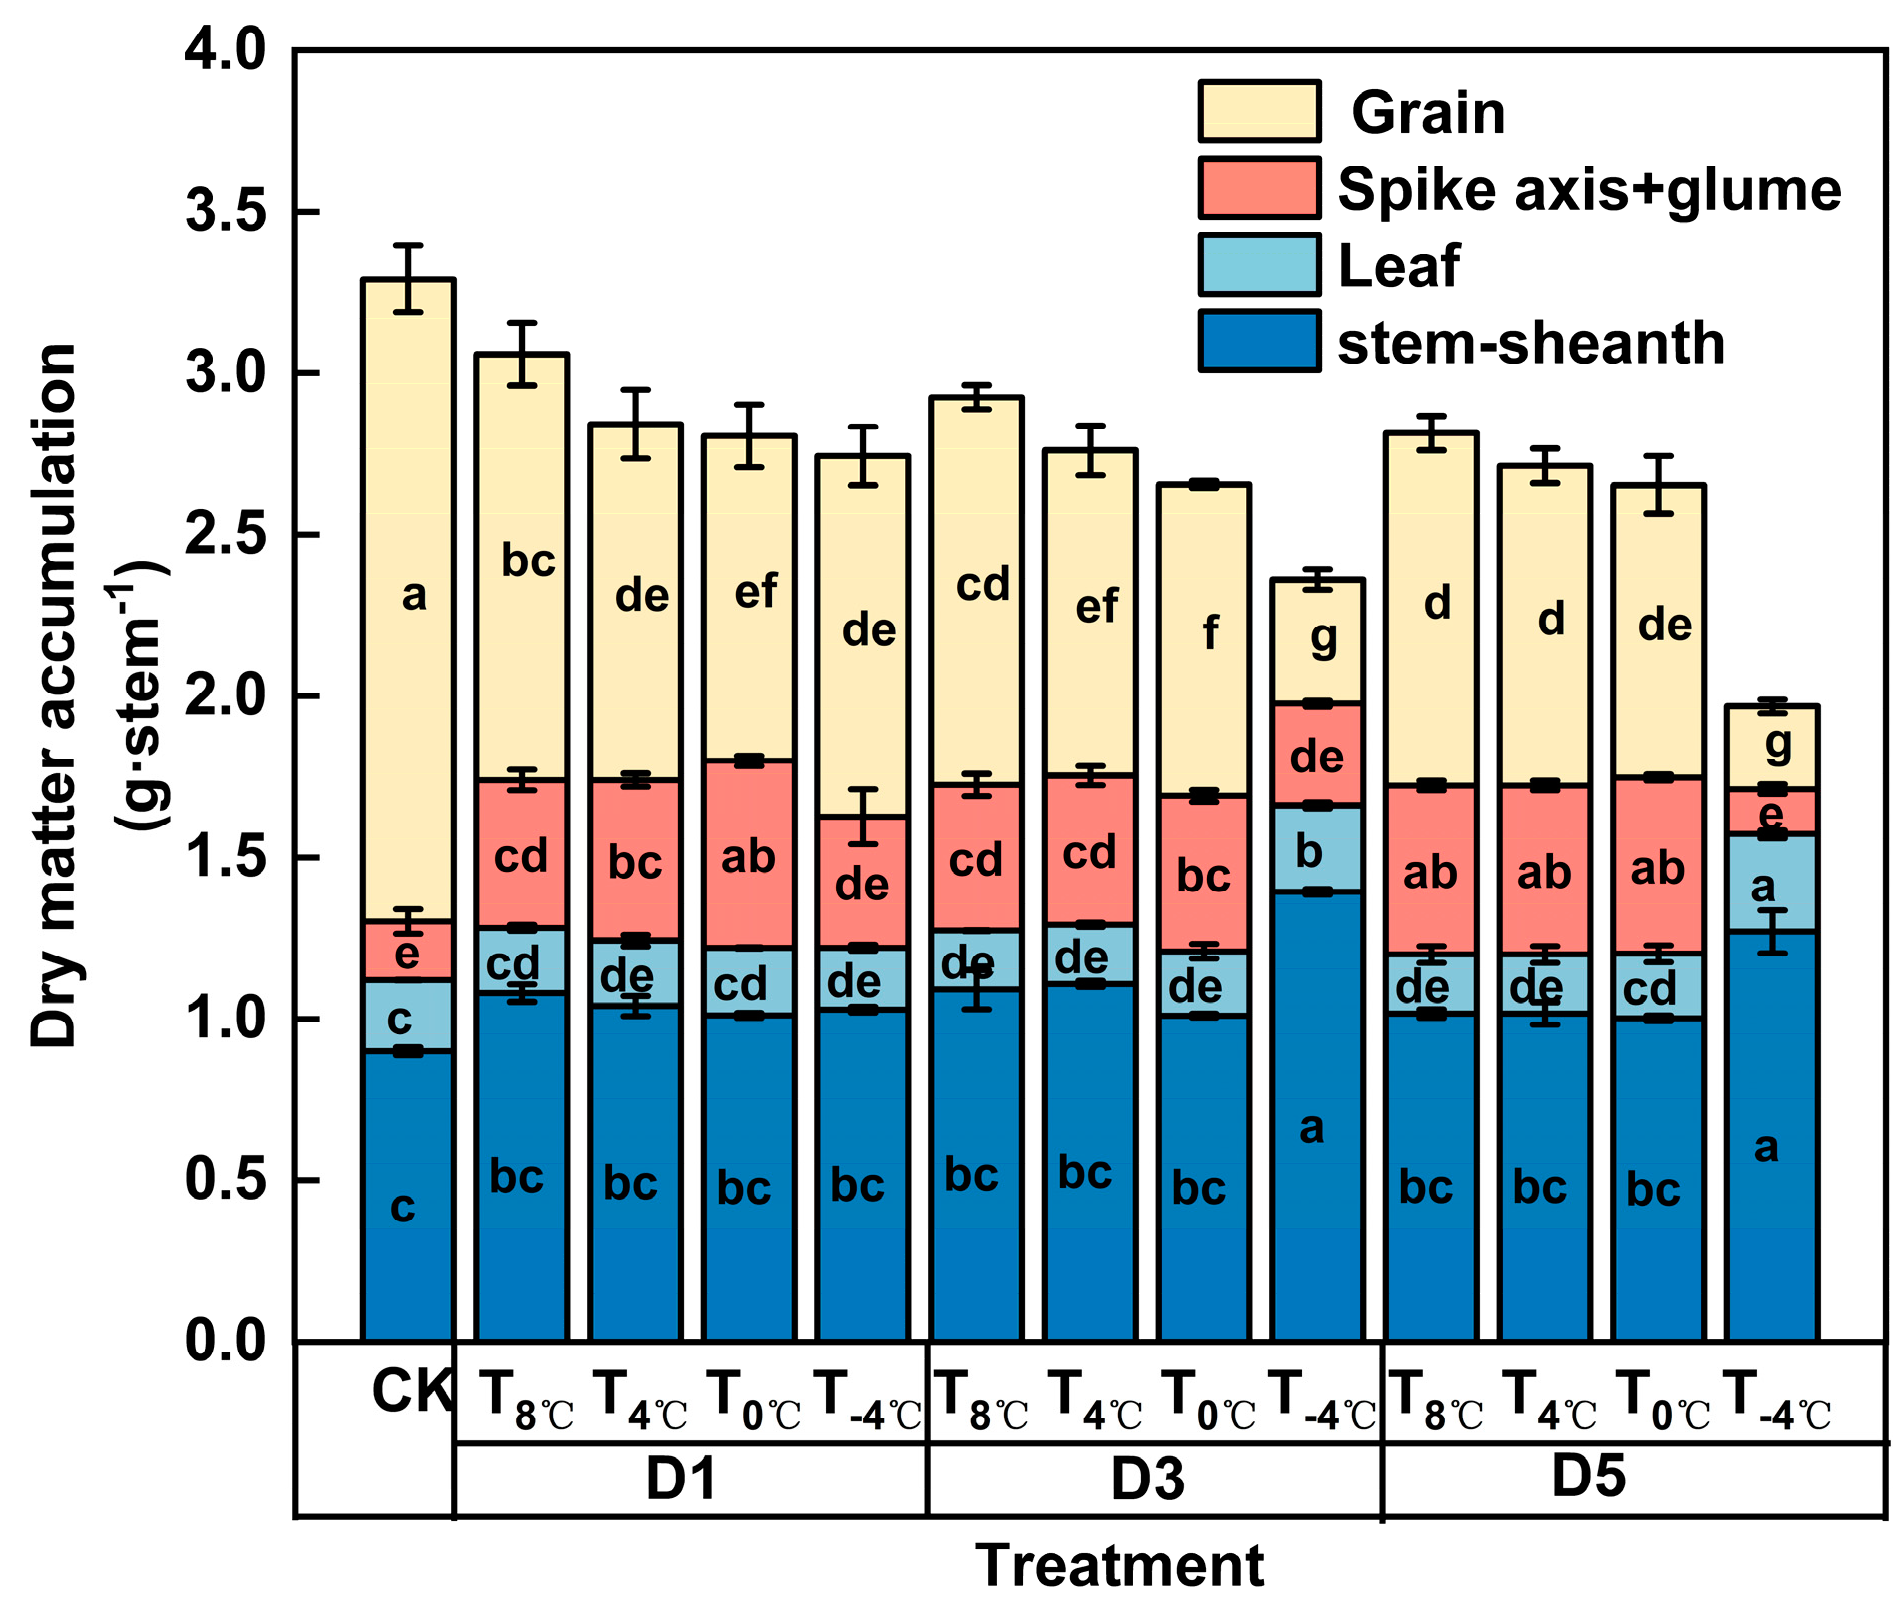
3.1.1. Effect of Low-Temperature Stress on Dry Matter Accumulation at Anthesis Stage

A significant reduction in dry matter accumulation at maturity was observed when plants were subjected to low temperature during the anthesis stage (p < 0.05, Figure 3).
The accumulation patterns of dry matter varied across different plant organs following exposure to low-temperature stress during anthesis. Notably, the grains exhibited a substantial decrease in dry matter accumulation compared to CK under various temperature treatments (Figure 3). As the temperature dropped and the duration of low-temperature exposure increased, there was a consistent decline in dry matter accumulation, particularly when temperature fell below 0 °C and plants were exposed for more than 3 days. Compared to the control group (CK), the accumulation of dry matter in the grains decreased significantly with lower temperature levels for the same duration of exposure to low temperature. Specifically, the grain dry matter accumulation of CK was 1.99 g·stem−1; for every 1 °C decreases in temperature, the dry matter accumulation in grains decreased by 0.020 g·stem−1, 0.068 g·stem−1, and 0.070 g·stem−1 at D1, D3, and D5, respectively, compared to CK. When plants were continuously exposed to low temperature, the response of grain dry matter accumulation to stress duration differed across grain-filling stages, with a reduced effect compared to CK. An increase in low-temperature duration by 1 d resulted in a decrease in grain dry matter accumulation by 0.25 g, 0.27 g·stem−1, 0.28 g·stem−1, and 0.33 g·stem−1 at the mature stage under T8 °C, T4 °C, T0 °C, and T−4 °C treatments, respectively. In the CK, the dry matter accumulation of the spike axis and glumes was 0.90 g·stem−1. Under the D1, D3, and D5 treatments, there was a significant increase in the dry matter accumulation of the spike axis and glumes compared to the CK, with increases of 133.11%, 137.34%, and 169.32%, respectively. At T8 °C, T4 °C, T0 °C, and T−4 °C, these increases were 155.21%, 174.33%, 197.43%, and 59.38%, respectively. In the CK, the dry matter accumulation in leaves reached 0.2205 g·stem−1 at maturity. However, exposure to low temperatures during the flowering stage led to a significant decrease in leaf dry matter accumulation at maturity when compared to the CK levels. Notably, the T−4 °C treatment increased leaf dry matter accumulation at D3 and D5 by 0.050 g·stem−1 and 0.08 g·stem−1 higher than that of CK, with no significant differences among other low-temperature treatments. The imbalance in the sink–source relationship disrupted the transport of dry matter from source organs to sink organs, resulting in a significant accumulation of dry matter assimilation in the stem sheath after anthesis. Under low-temperature stress, the dry matter accumulation of the stem and sheath was notably higher at the mature stage compared to the CK, which had a dry matter accumulation of 0.18 g·stem−1. At temperature below−4 °C and with low-temperature durations exceeding 3 days, there was a significant increase in the dry matter accumulation of the culm sheath. Specifically, under the T−4 °C treatment, the dry matter accumulation in the culm sheath increased by 0.34 and 0.22 g·stem−1 after 3 days (D3) and 5 days (D5), respectively, compared to CK, with no significant differences observed among other temperature treatments.

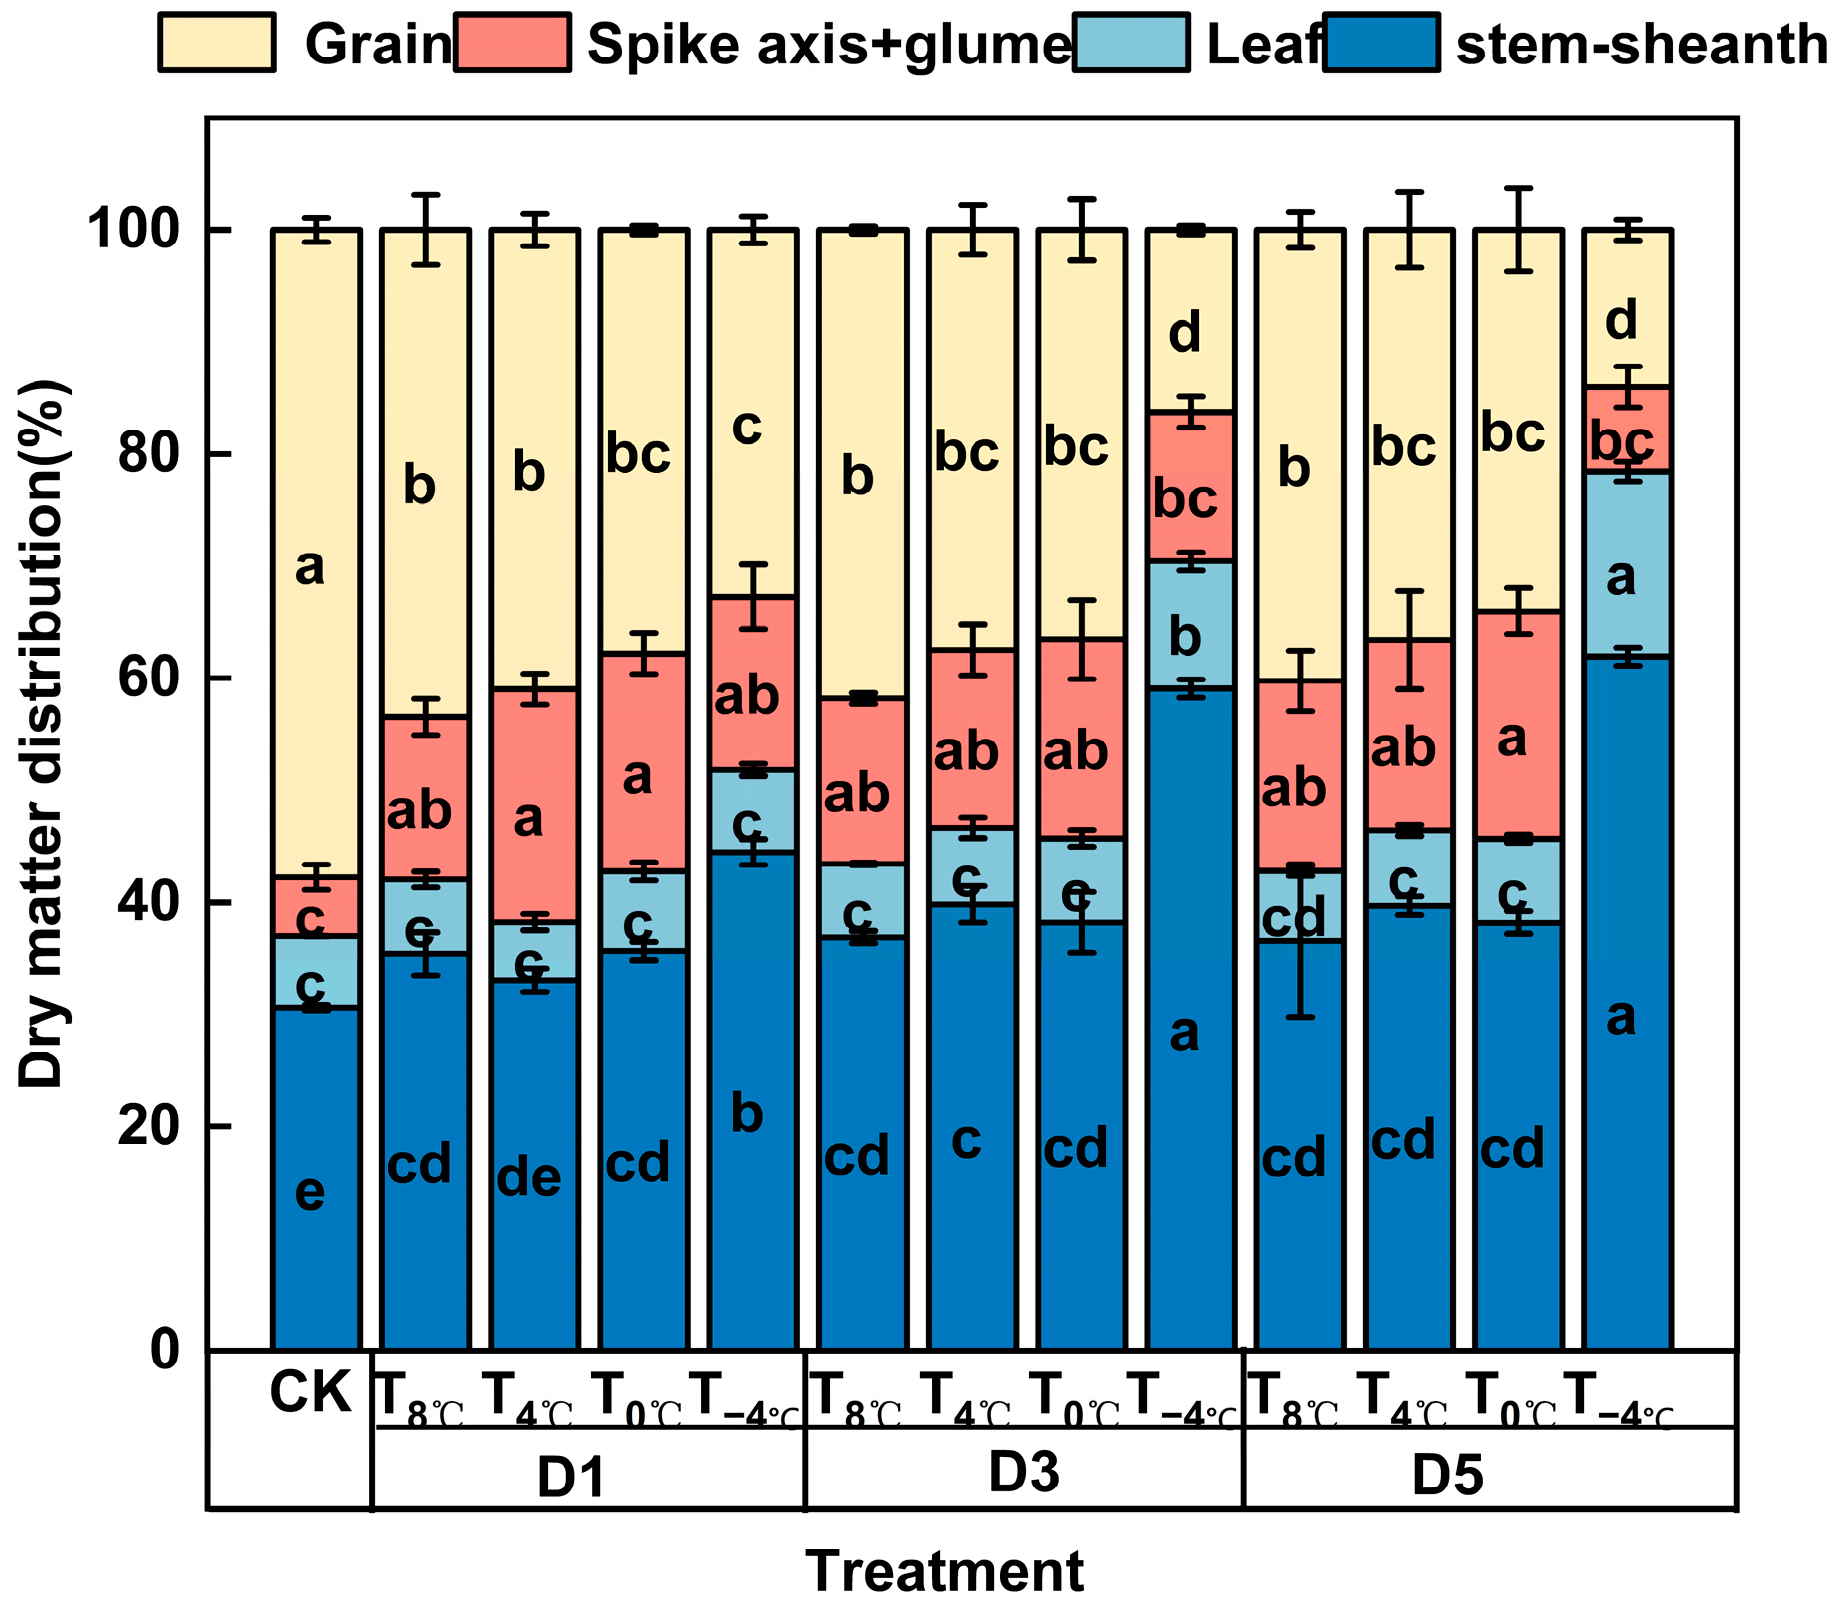
3.1.2. Effect of Low-Temperature Stress on Dry Matter Distribution at Anthesis Stage

The distribution of dry matter among various organs exhibited variability under low-temperature stress during anthesis (Figure 4).
As temperature levels declined and the duration of exposure extended, the proportion of dry matter in the grain consistently decreased, with a notable drop occurring at −4 °C for exposure periods ranging from 1 to 5 days. Specifically, for every 1 °C decrease during the anthesis stage, there was a corresponding decrease in grain dry matter distribution by 0.89%, 2.13%, and 2.35% at D1, D3, and D5, respectively. Moreover, maintaining the same low temperature for additional days resulted in further reductions: at T8 °C, T4 °C, T0 °C, and T−4 °C, each additional day led to decreases of 0.30%, 0.34%, 0.45%, and 4.68%, respectively. Following low-temperature treatment, the dry matter distribution ratio of the spike axis+glume was significantly elevated compared to CK. However, this ratio decreased significantly when the T−4 °C treatment persisted for 3 to 5 days. In comparison to CK, the dry matter distribution of the spike axis+glume increased by 193.48%, 240.47%, 265.09%, and 130.08% under T8 °C, T4 °C, T0 °C, and T−4 °C treatments, respectively. Additionally, at D1, D3, and D5, the dry matter distribution to the ear axis plus glumes showed significant increments of 193.94%, 207.96%, and 220.08%, respectively, compared to CK. Under low-temperature stress, the proportion of dry matter distribution in leaves was significantly higher than in the CK. This proportion increased further with decreasing temperature and longer durations of exposure. Notably, when temperature dropped below −4 °C and the duration of low-temperature treatment exceeded 3 days, the dry matter distribution ratio in the leaves was markedly higher compared to other low-temperature treatments. In CK, the dry matter distribution ratio of leaves was 6.40%. Specifically, the weight distribution ratio of leaves exposed to T8 °C, T4 °C, T0 °C, and T−4 °C increased by 2.98%, 7.40%, 21.71%, and 94.53%, and D1, D3, and D5 resoled in increases of 16.50%, 33.26%, and 45.20% compared to CK. The dry matter distribution ratio of the stem and sheath increased at lower temperature and with longer exposure duration. The treatment with −4 °C had the most apparent effect on the dry matter distribution ratio of the stem and sheath at D3 and D5. In the CK, the dry matter distribution ratio of the stem and sheath was 30.59%. Compared to the control group, the dry matter distribution ratio of the stem and sheath increased by 16.40%, 19.47%, 19.97%, and 80.31% under T8 °C, T4 °C, T0 °C, and T−4 °C treatments and by 24.89%, 35.02%, and 42.21% at D1, D3, and D5, respectively. Similarly, the dry matter distribution ratio of the spike axis+glume increased at lower temperature and with longer durations of exposure. The treatment of T−4 °C had the most pronounced effect on the dry matter distribution ratio of the stem and sheath at D3 and D5. In the CK, the dry matter distribution ratio of the stem and sheath was 30.59%. The dry matter distribution ratio of ear axis+ glume was significantly higher than that of CK after low-temperature treatment. However, it decreased significantly when T−4 °C treatment lasted for 3–5 days. Compared with CK, the dry matter distribution of ear axis+ glume treated at T8 °C, T4 °C, T0 °C, and T−4 °C increased by 193.48%, 240.47%, 265.09%, and 130.08%, respectively. In comparison to CK, the dry matter distribution to the ear axis plus glumes exhibited significant increments of 193.94%, 207.96%, and 220.08% at D1, D3, and D5, respectively. This indicated that the stress caused damage to the stem transport tissue, hindering assimilation transport to the grains. Consequently, more assimilation was retained in the stem sheath, leaf, and ear axis+glume.

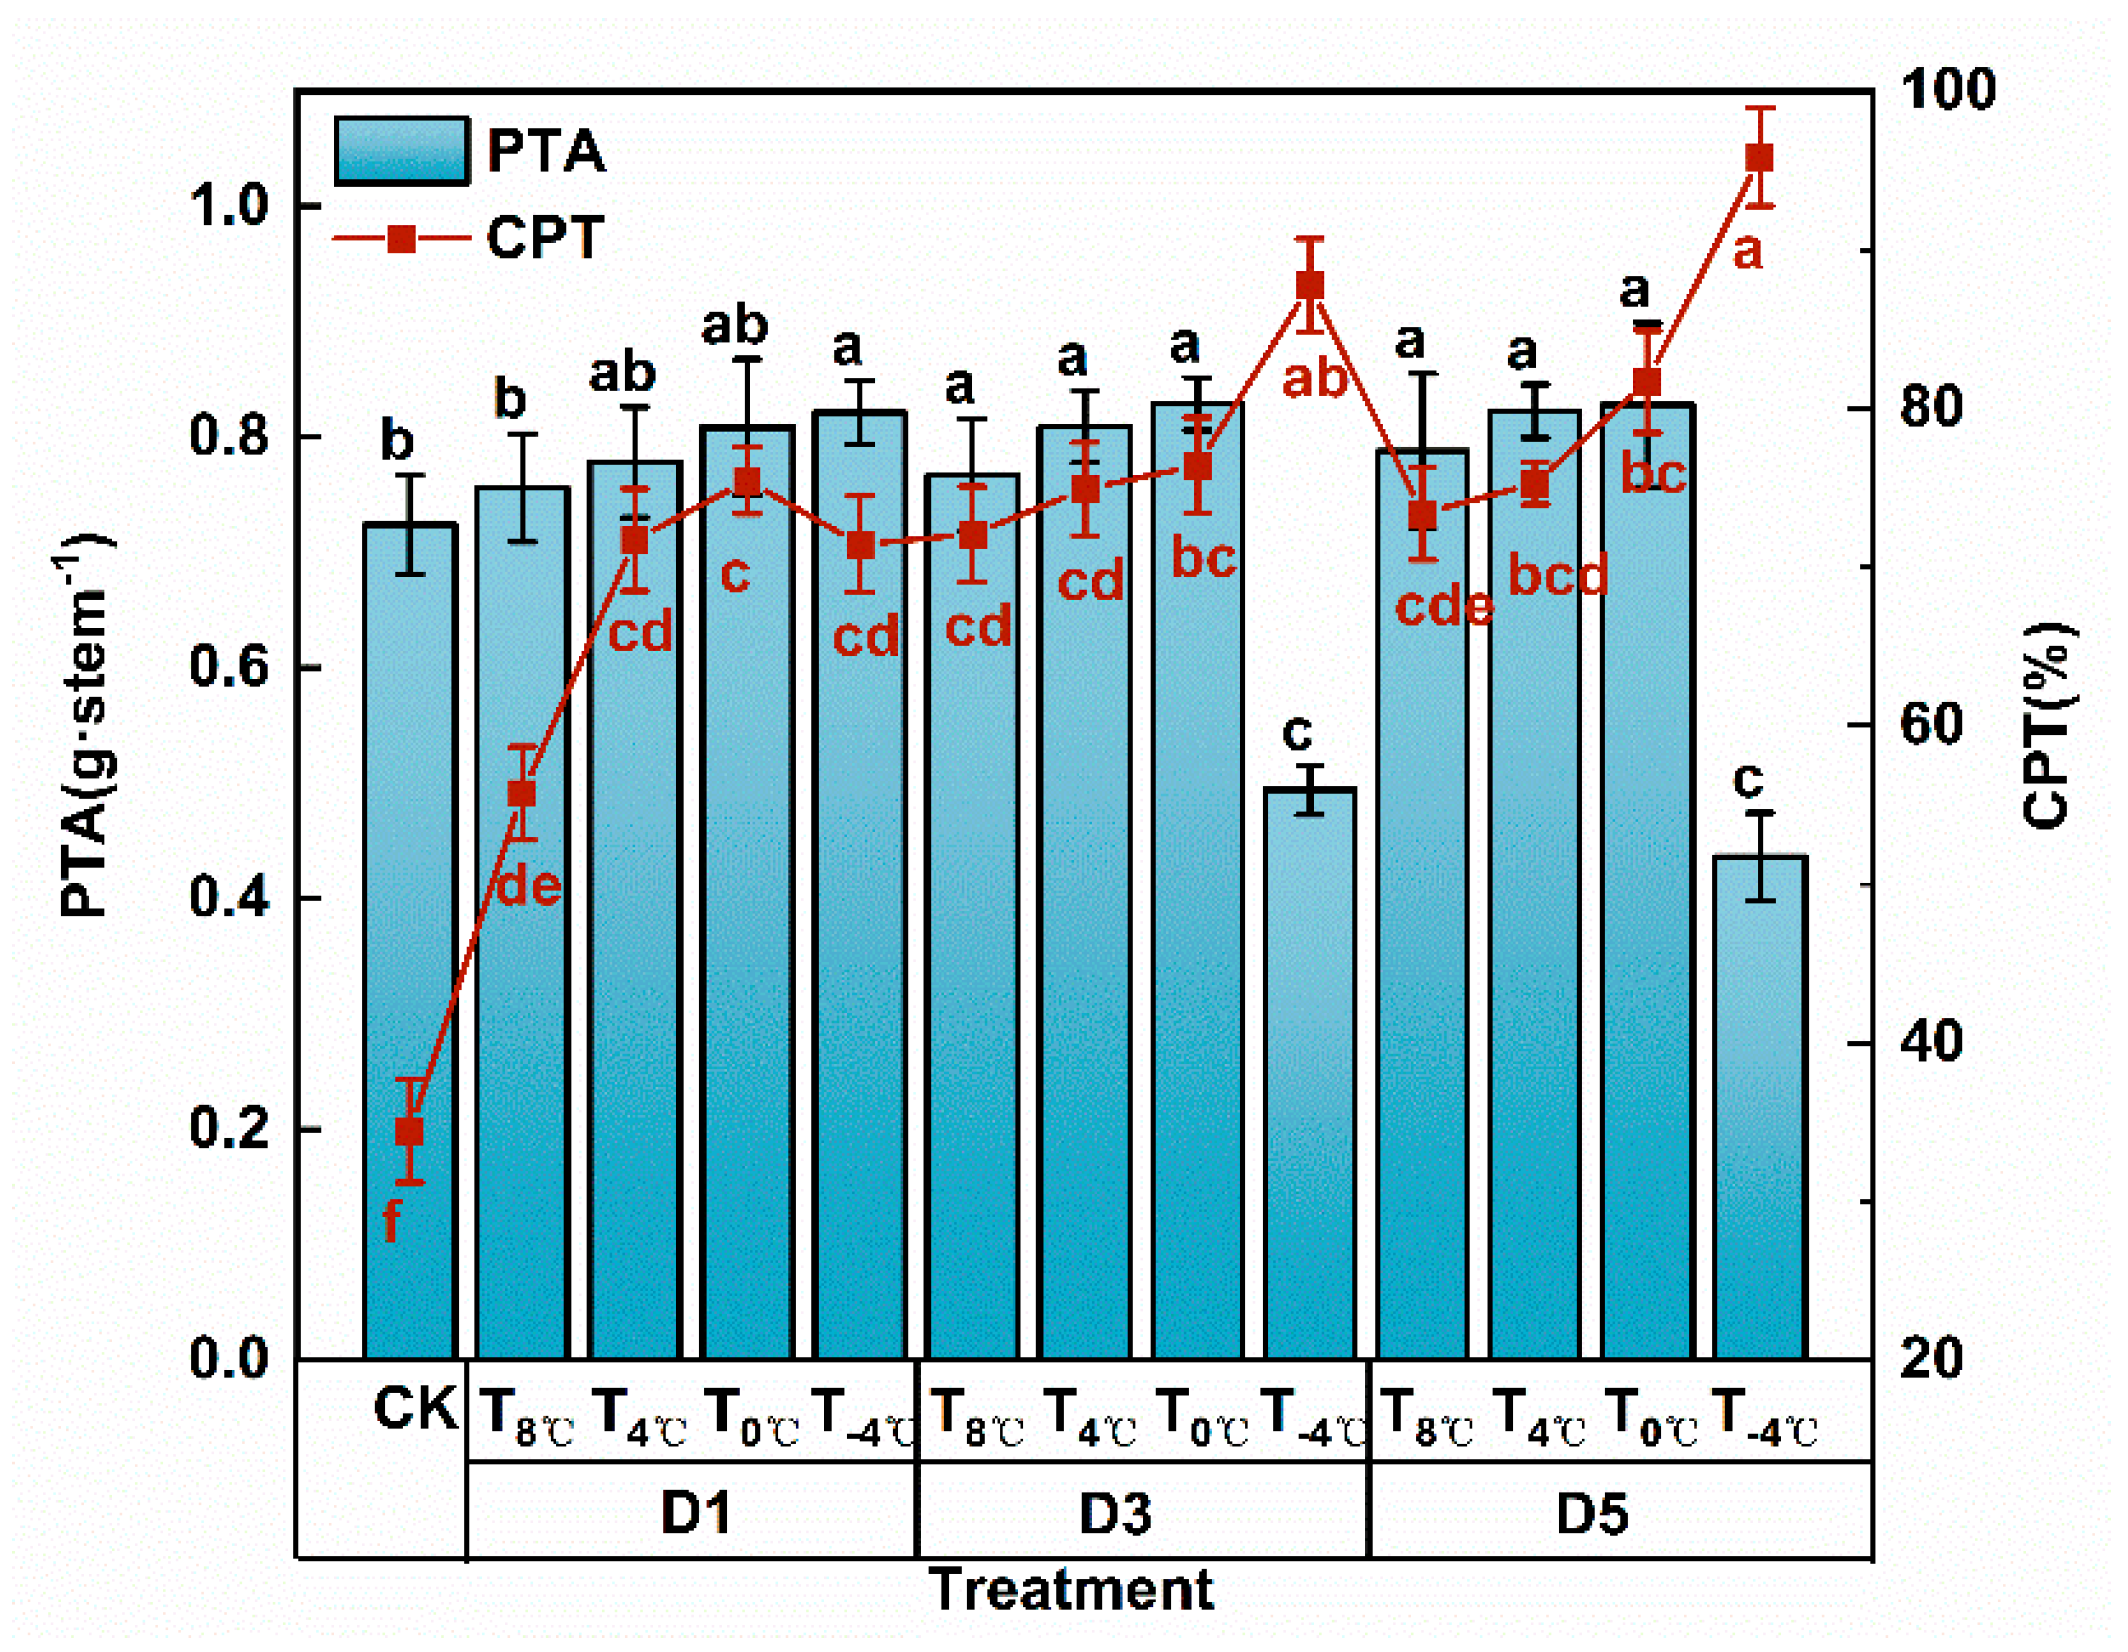
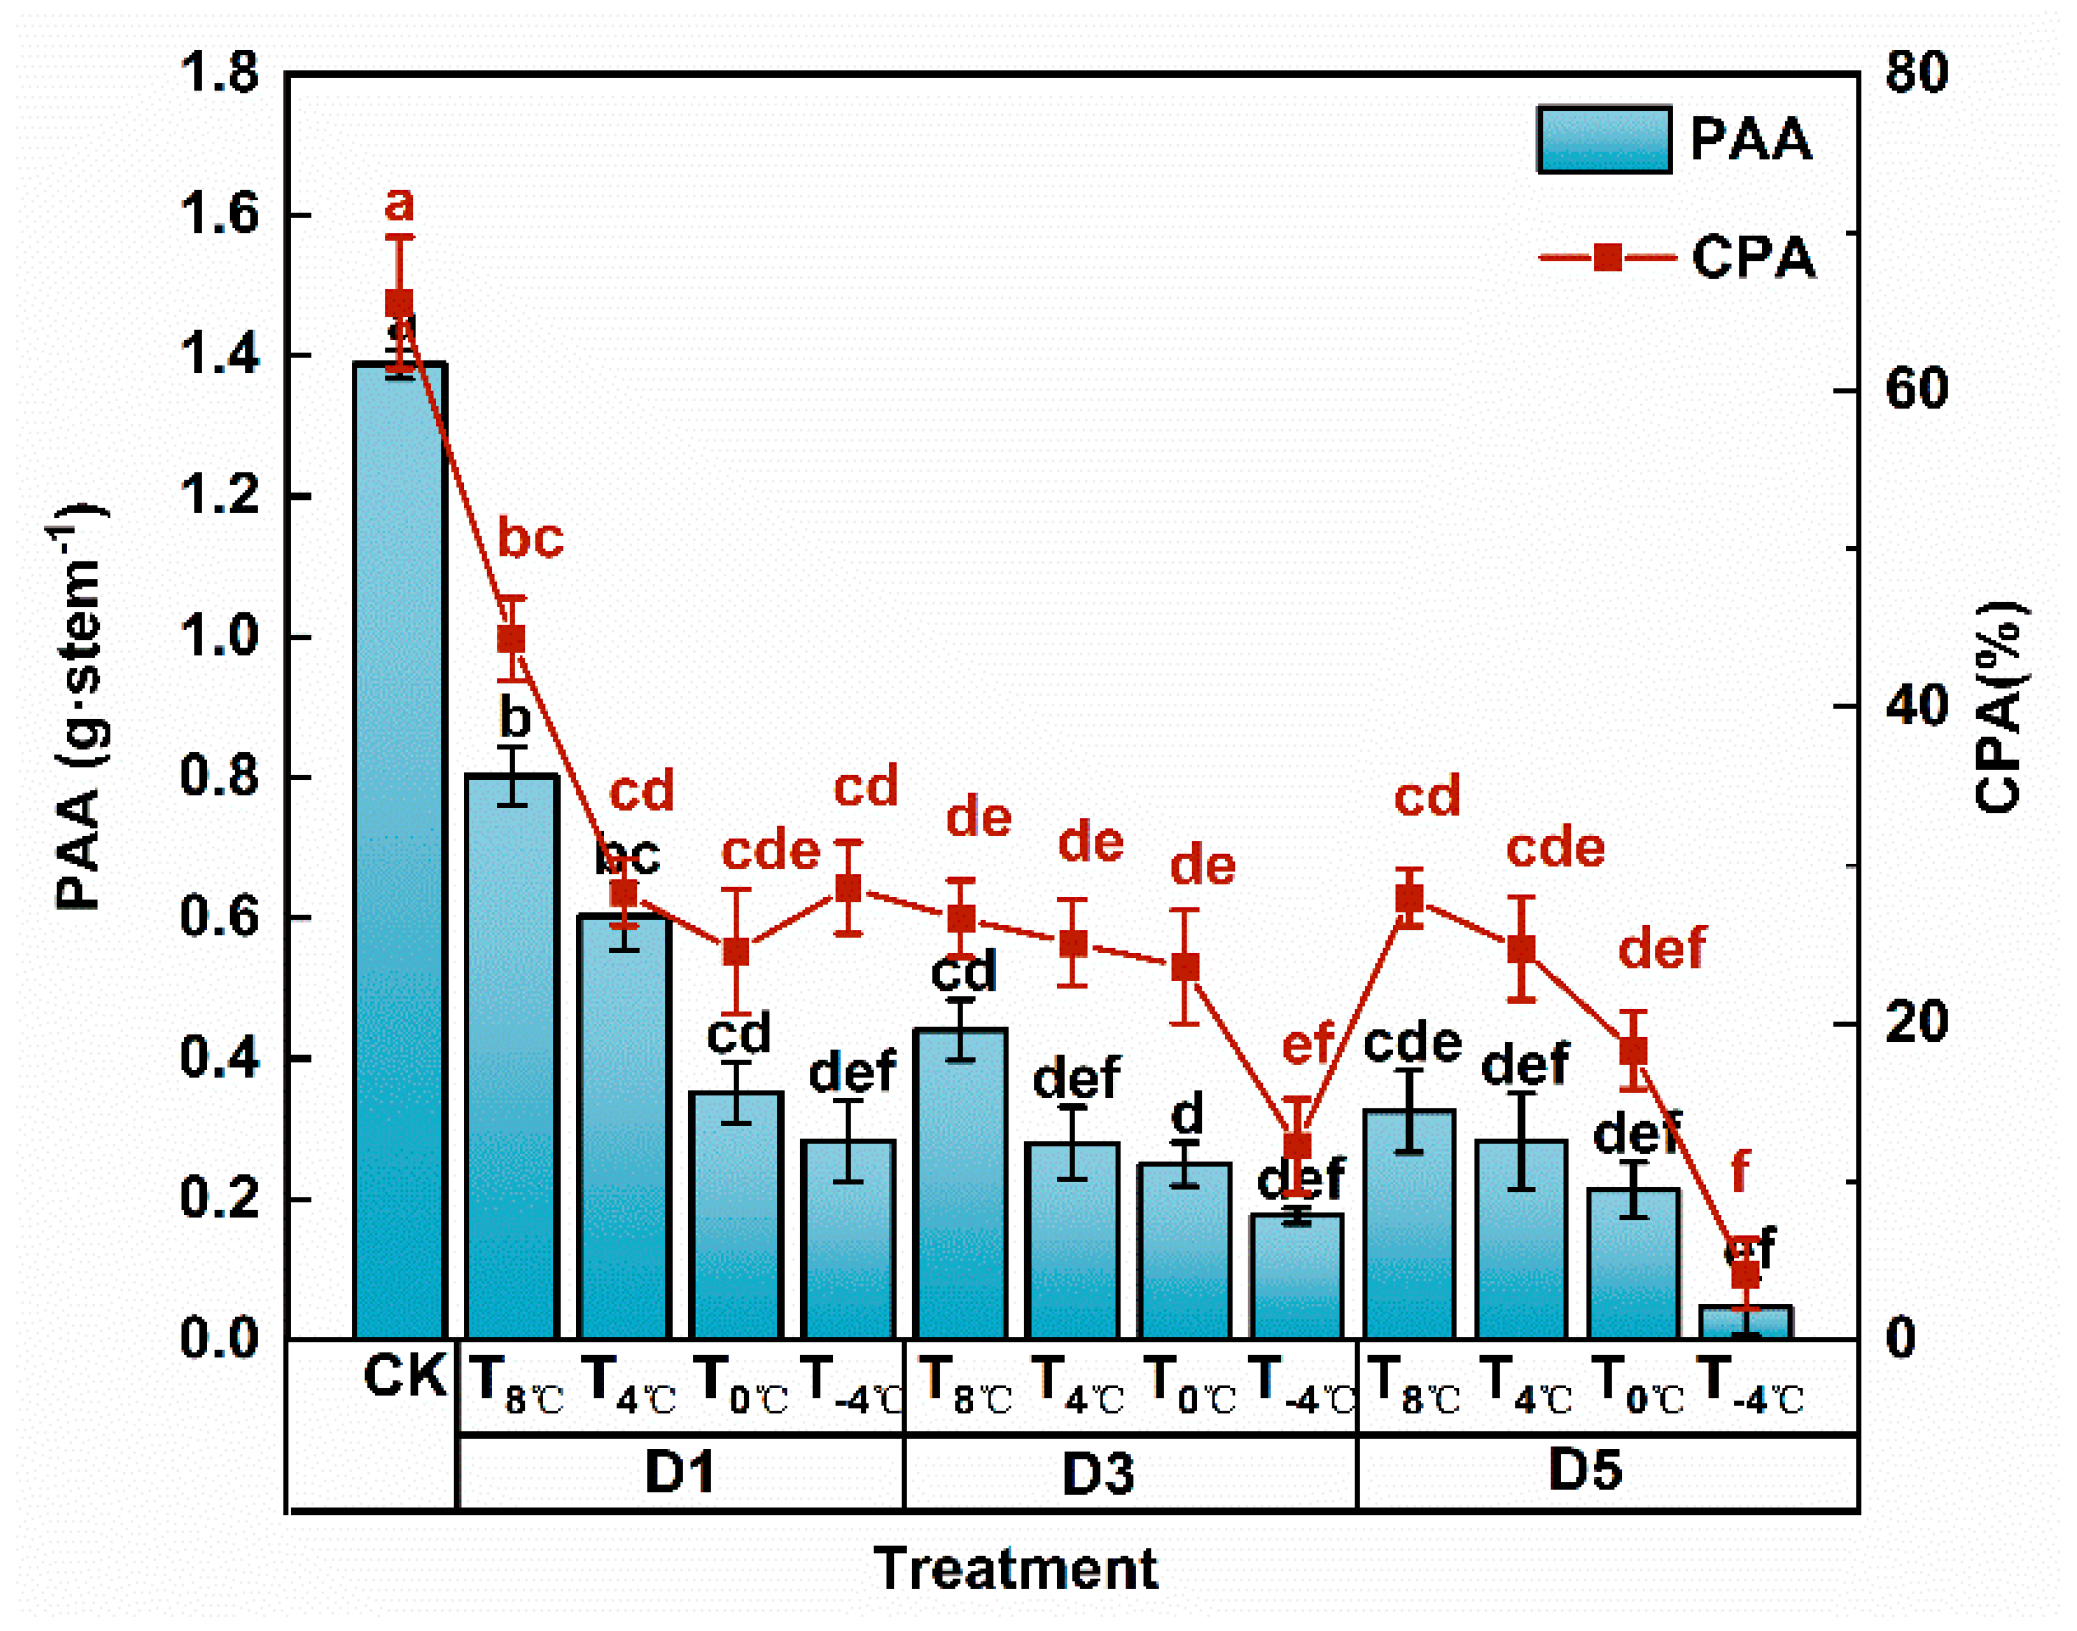
3.1.3. Effect of Low Temperature Stress on Dry Matter Transportation at Anthesis Stage

PTA and CPT increased as the temperature decreased, and the duration of exposure extended (Figure 5). However, the wheat plants incurred significant damage. The PTA and CPT of the CK are 0.72 g·stem−1 and 34.47%. Grains matured prematurely after exposure to 4 °C for 3 or 5 days, resulting in a notable decline in PTA compared to CK. For the same duration of low temperature exposure, PTA and CPT increased by 6.40%, 10.93%, 13.49% and 94.56%, 114.63%, and 125.93% under T8 °C, T4 °C, T0 °C, and T−4 °C treatments, respectively, compared to CK. For D1, D3, and D5, PTA and CPT increased by 9.26%, 10.71%, 12.24% and 99.02%, 125.70%, and 136.64%, respectively.
Low-temperature stress during anthesis stage had a significant impact on PAA and CPA. As the temperature decreased, the contribution rate of dry matter accumulated after anthesis also decreased significantly, reaching its lowest value at 4 °C. PAA and CPA displayed the most apparent significant decreases when low-temperature exposure lasted for 3–5 days (Figure 6). The PAA and CPA of the CK are 1.39 g·stem−1 and 65.54%. Additionally, during the same low-temperature duration, PAA and CPA increased by 62.40%, 72.06%, 80.46%, 87.85% and 49.72%, 60.27%, 66.21%, 77.13%, 63.32%, 79.36%, 84.39% and 52.06%, 66.60%, and 71.34%, respectively, compared with CK at T8 °C, T4 °C, T0 °C and T−4 °C, respectively. Furthermore, D1, D3, and D5 increased PAA and CPA by 63.32%, 79.36%, 84.39% and 52.06%, 66.60%, and 71.34%, respectively. The findings of this experiment show that low-temperature stress during the anthesis stage increased pre-anthesis dry matter transport and contribution rate. Conversely, post-anthesis dry matter assimilation and accumulation decreased. This suggests that under low-temperature stress during anthesis, grain yield depends more on dry matter transport after anthesis.

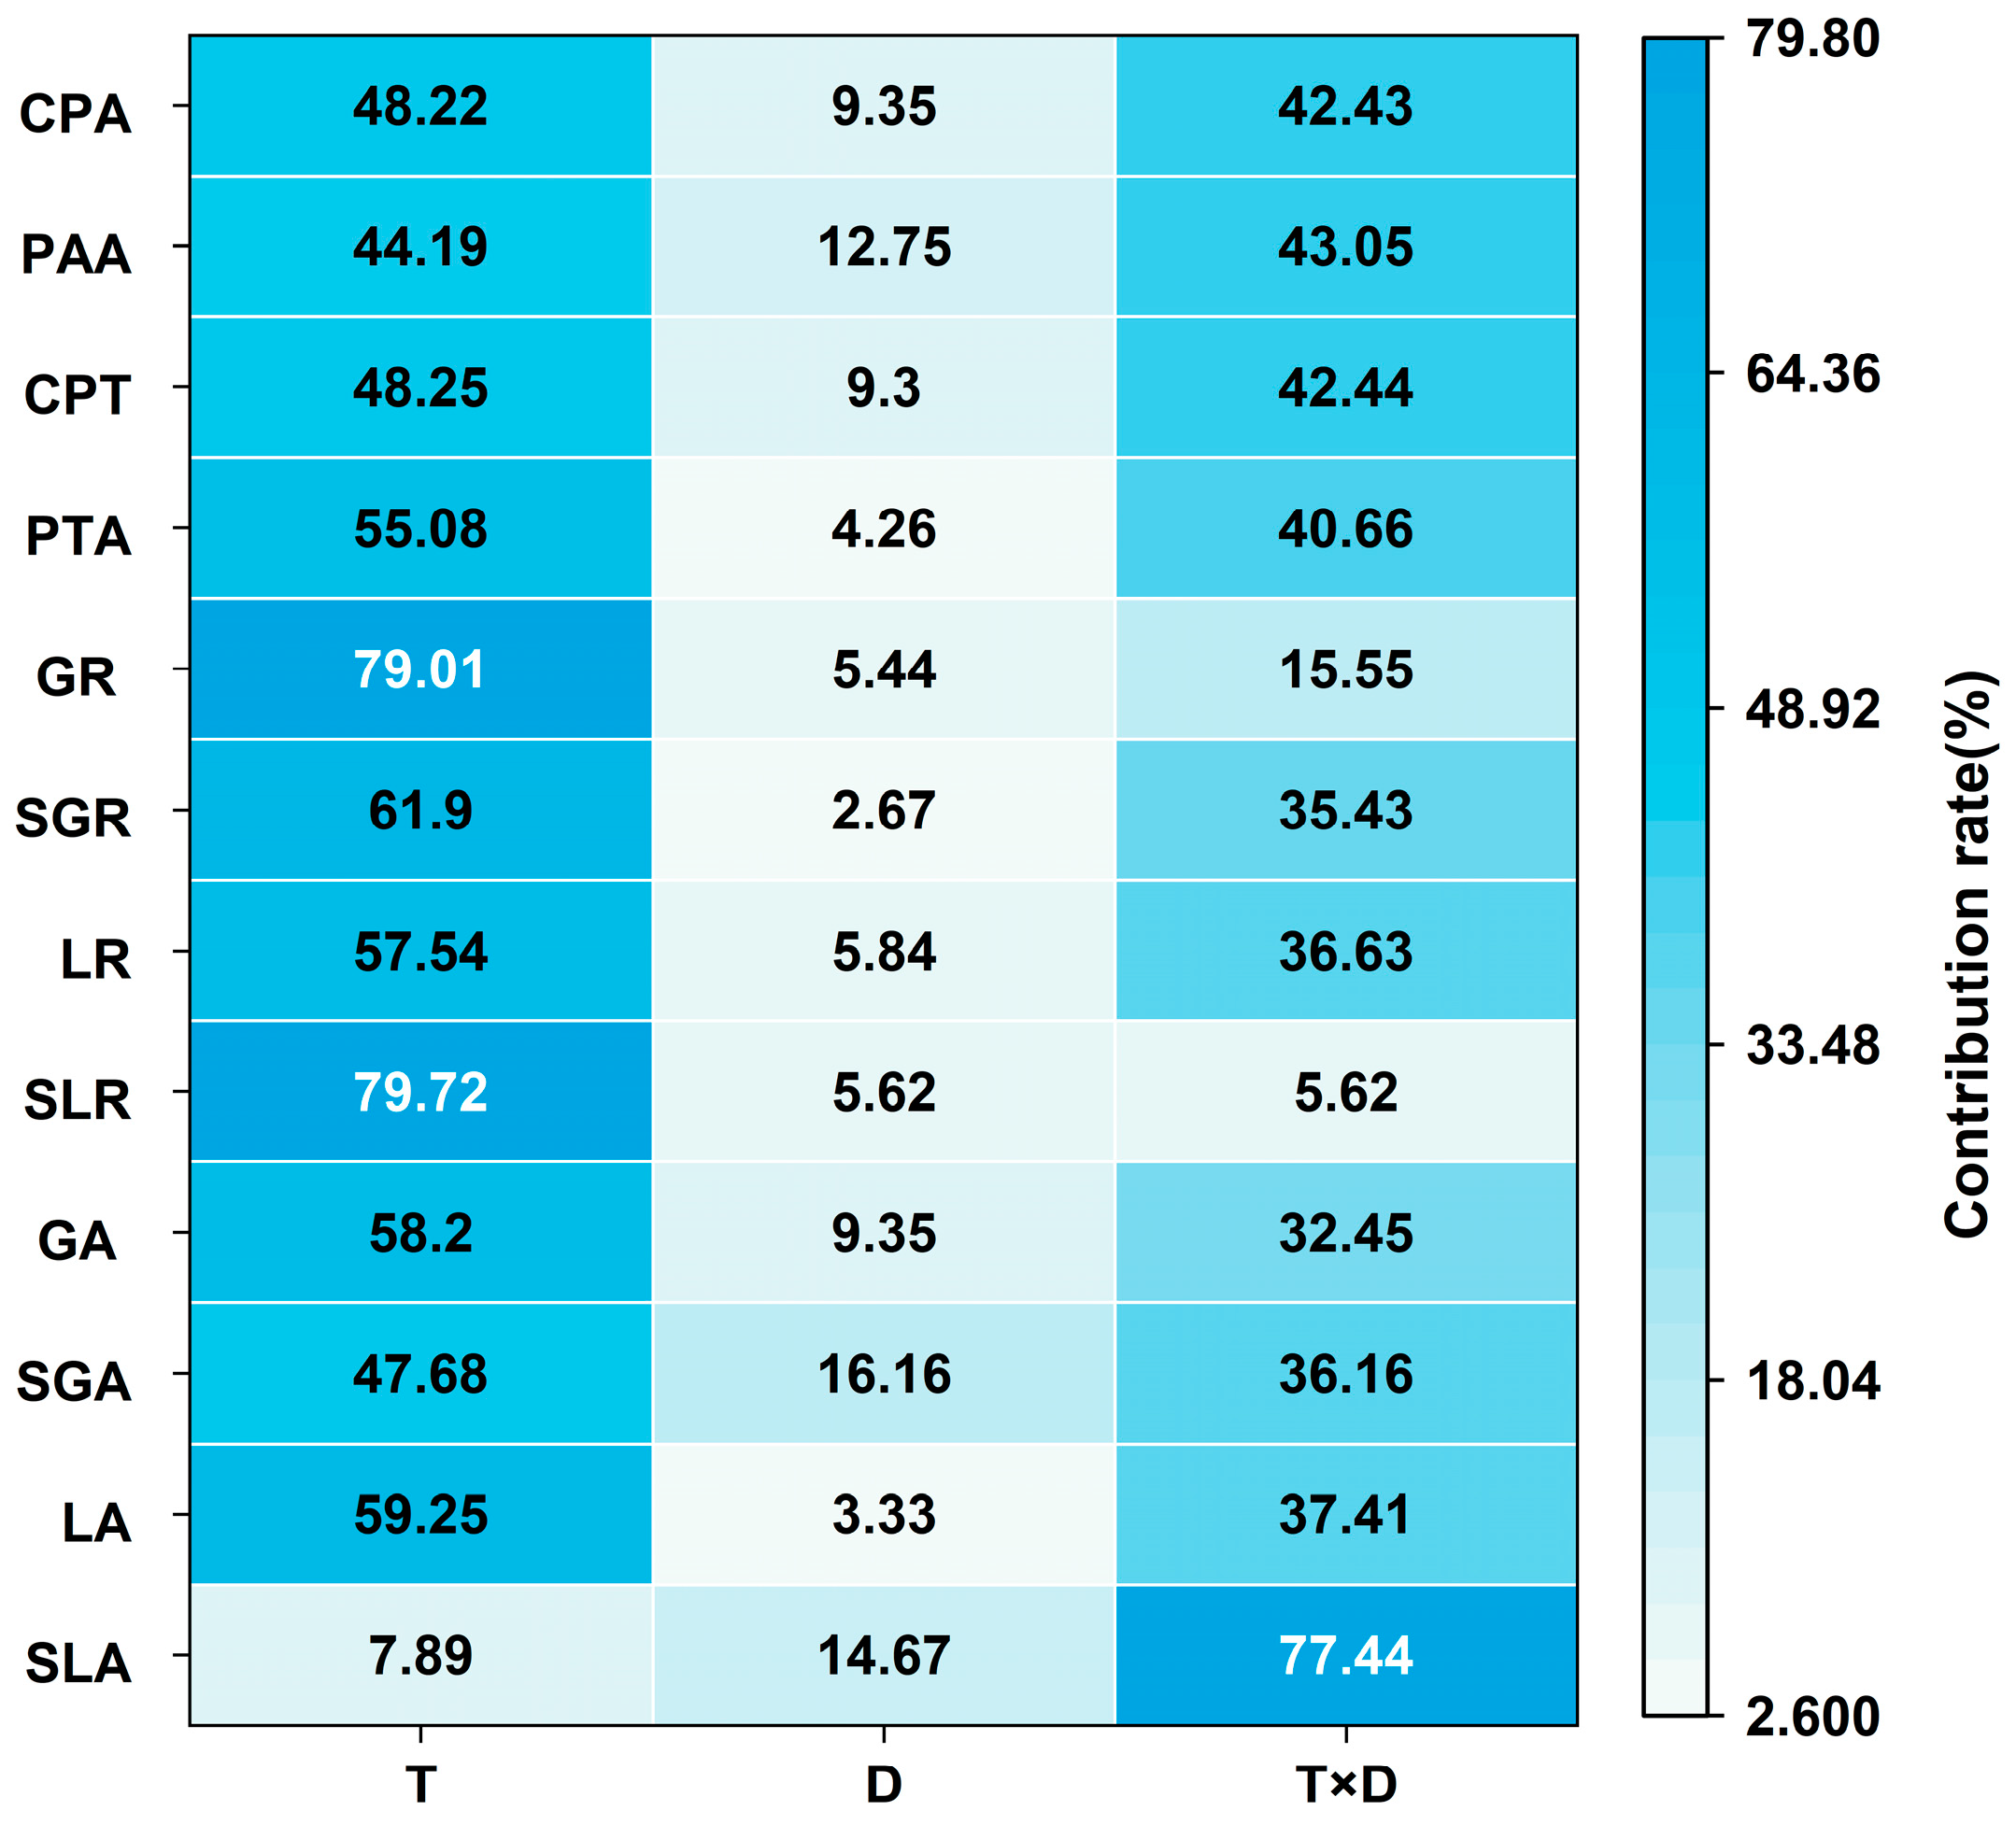
3.1.4. Analysis of Variance of Low Temperature and Duration of Low-Temperature Stress on Dry Matter Accumulation and Distribution at Anthesis Stage

The accumulation of dry matter in the stem and sheath was notably influenced by the interplay of treatment duration and temperature (Figure 7, Table A1). The duration of low-temperature exposure, temperature levels, and their interactive effects significantly influenced dry matter accumulation in the culm sheath (p < 0.01). In a similar vein, temperature and the interaction between temperature and duration significantly affect dry matter accumulation in the leaves (p < 0.01). Temperature alone significantly impacted dry matter accumulation in the rachis plus glumes (p < 0.05). Furthermore, temperature, duration, and interaction significantly influenced dry matter accumulation in the grains (p < 0.01). An analysis of the relative influence of these factors indicated that temperature was the most critical factor affecting dry matter accumulation in stem-sheath, leaf, and grain, with contribution rates of 59.25%, 47.68%, and 58.20%, respectively, followed by the interaction between temperature and duration. The interaction between temperature and duration had the most pronounced effect on dry matter accumulation in the culm sheath, accounting for 77.44% of the variance. Temperature, duration, and their interaction significantly affected the distribution ratio of dry matter in the stem-sheath, leaf, spike axis+glume, and grain (p < 0.05), with temperature exerting the most substantial influence on the distribution ratio in these components, at 79.72%, 57.54%, 61.90%, and 79.01%, respectively, followed by the interaction between temperature and duration. The effects of temperature and the interaction between temperature and duration on PTA, CPT, PAA, and CPA were significant (p < 0.05), with duration also significantly affecting PAA (p < 0.05). Temperature had the most substantial impact on CPT, PTA, PAA, and CPA, with contribution rates of 48.25%, 55.08%, 44.19%, and 48.22%, respectively. These findings underscore that temperature is the primary factor influencing the accumulation and distribution of dry matter in wheat.

3.2. Effects of Low-Temperature Stress During Anthesis Stage on Grain-Filling Characteristics

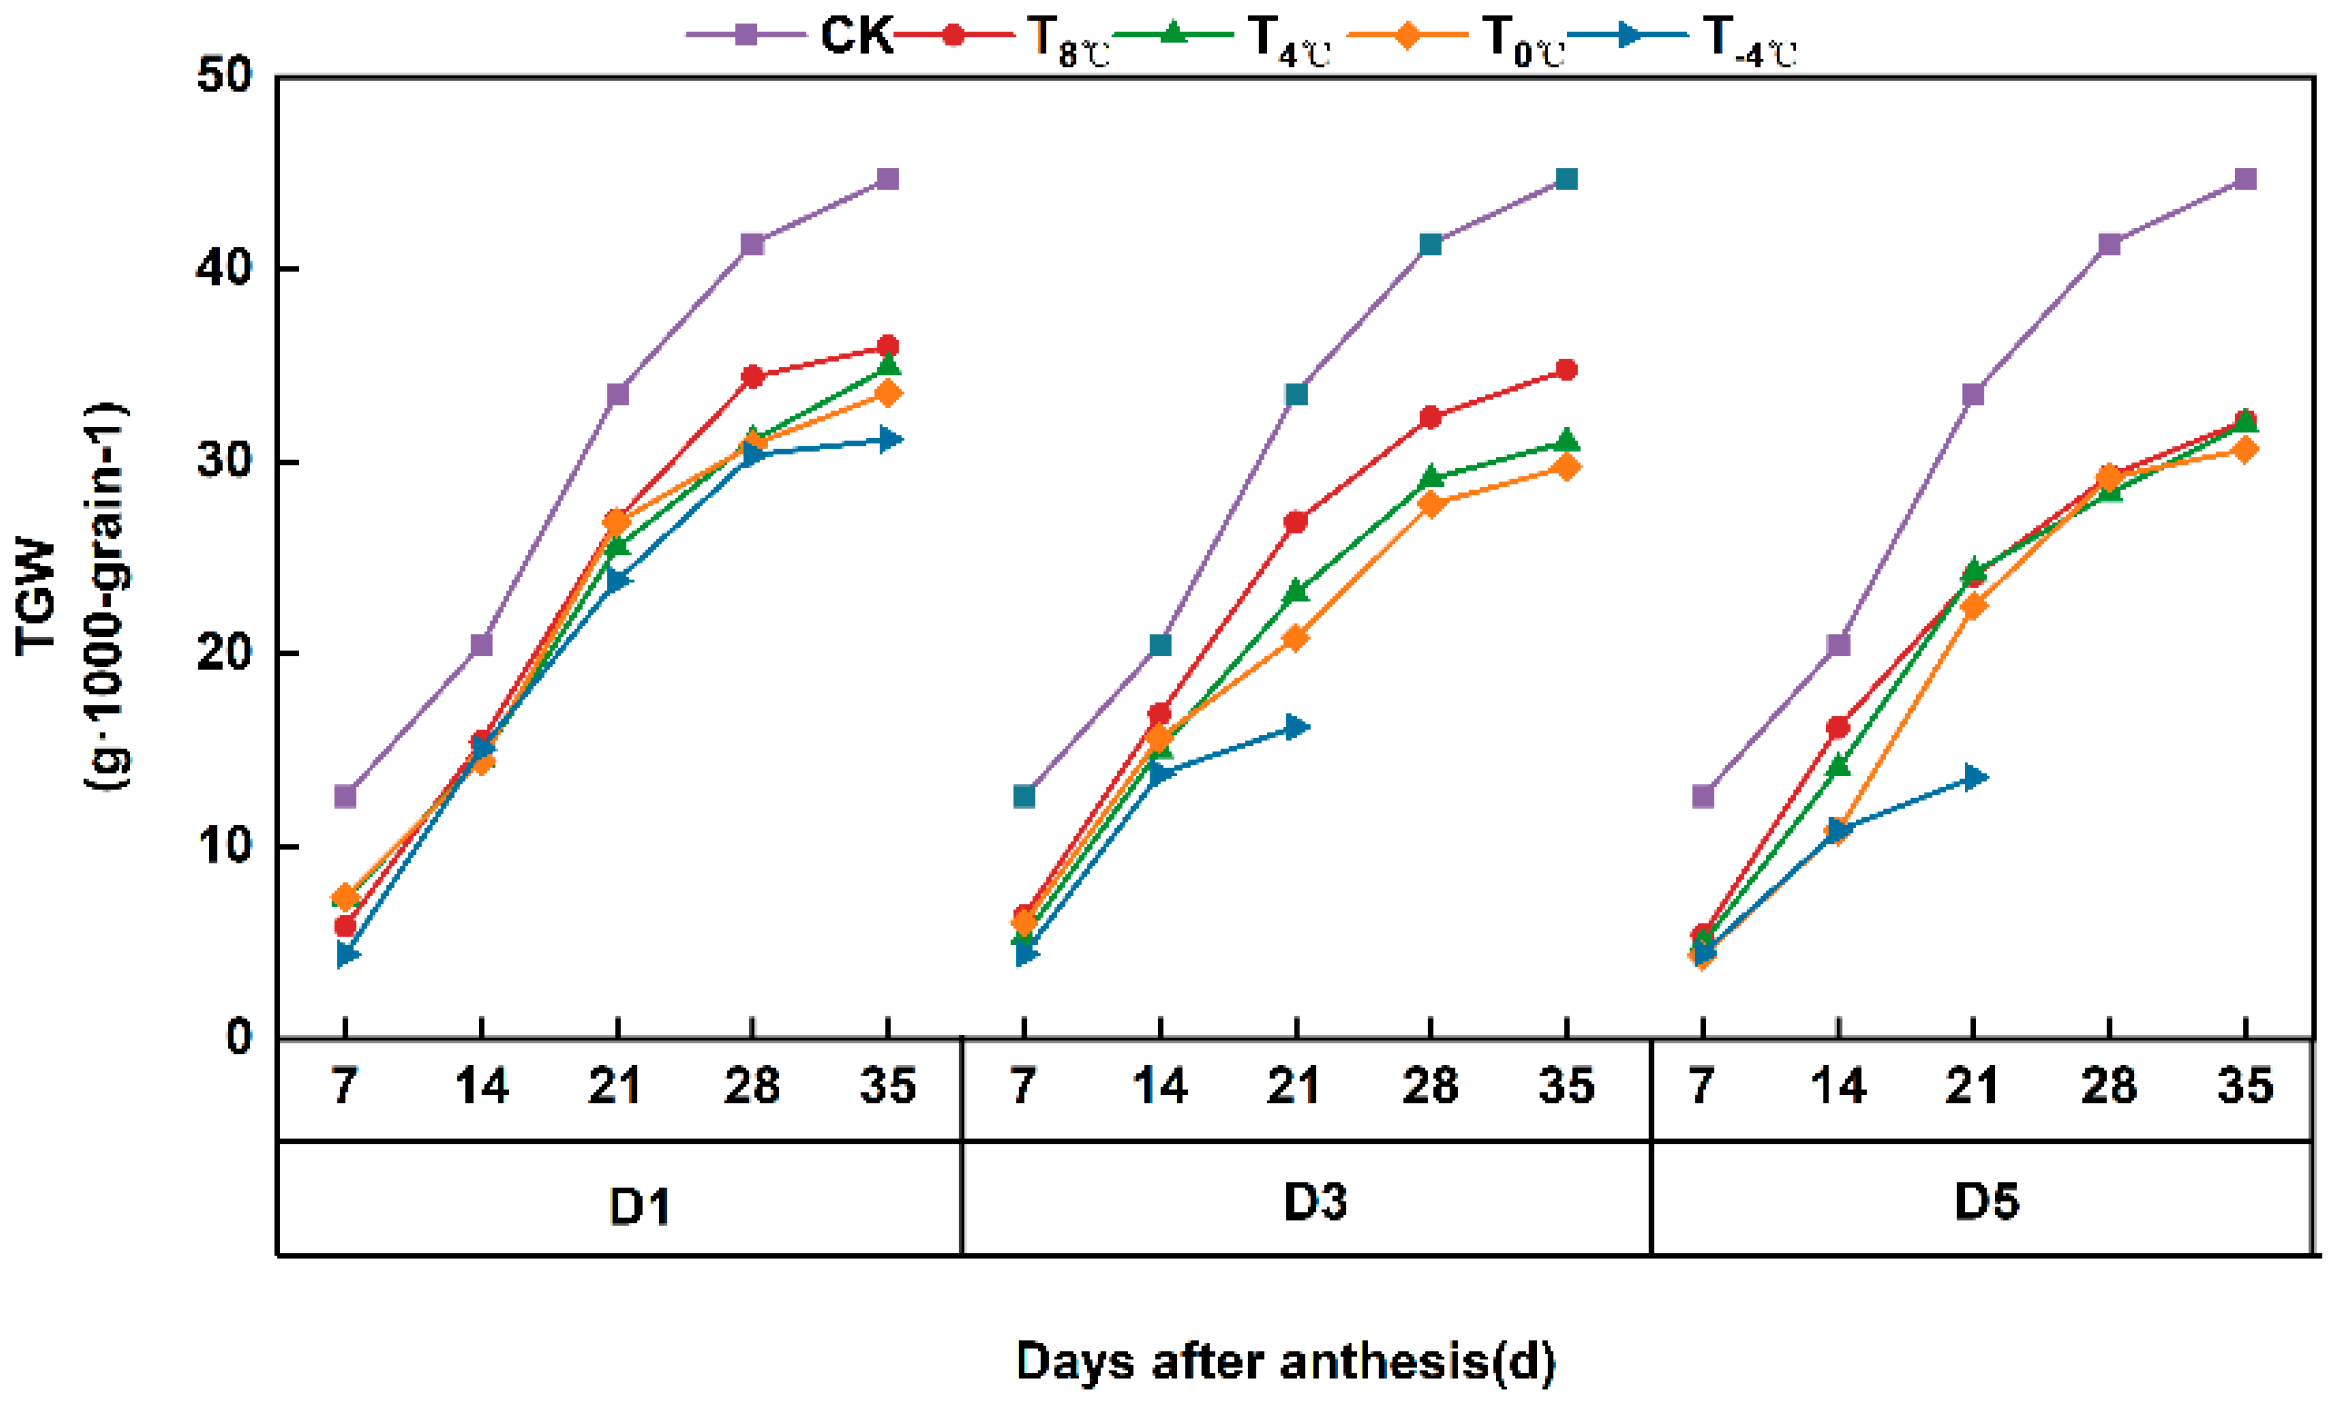
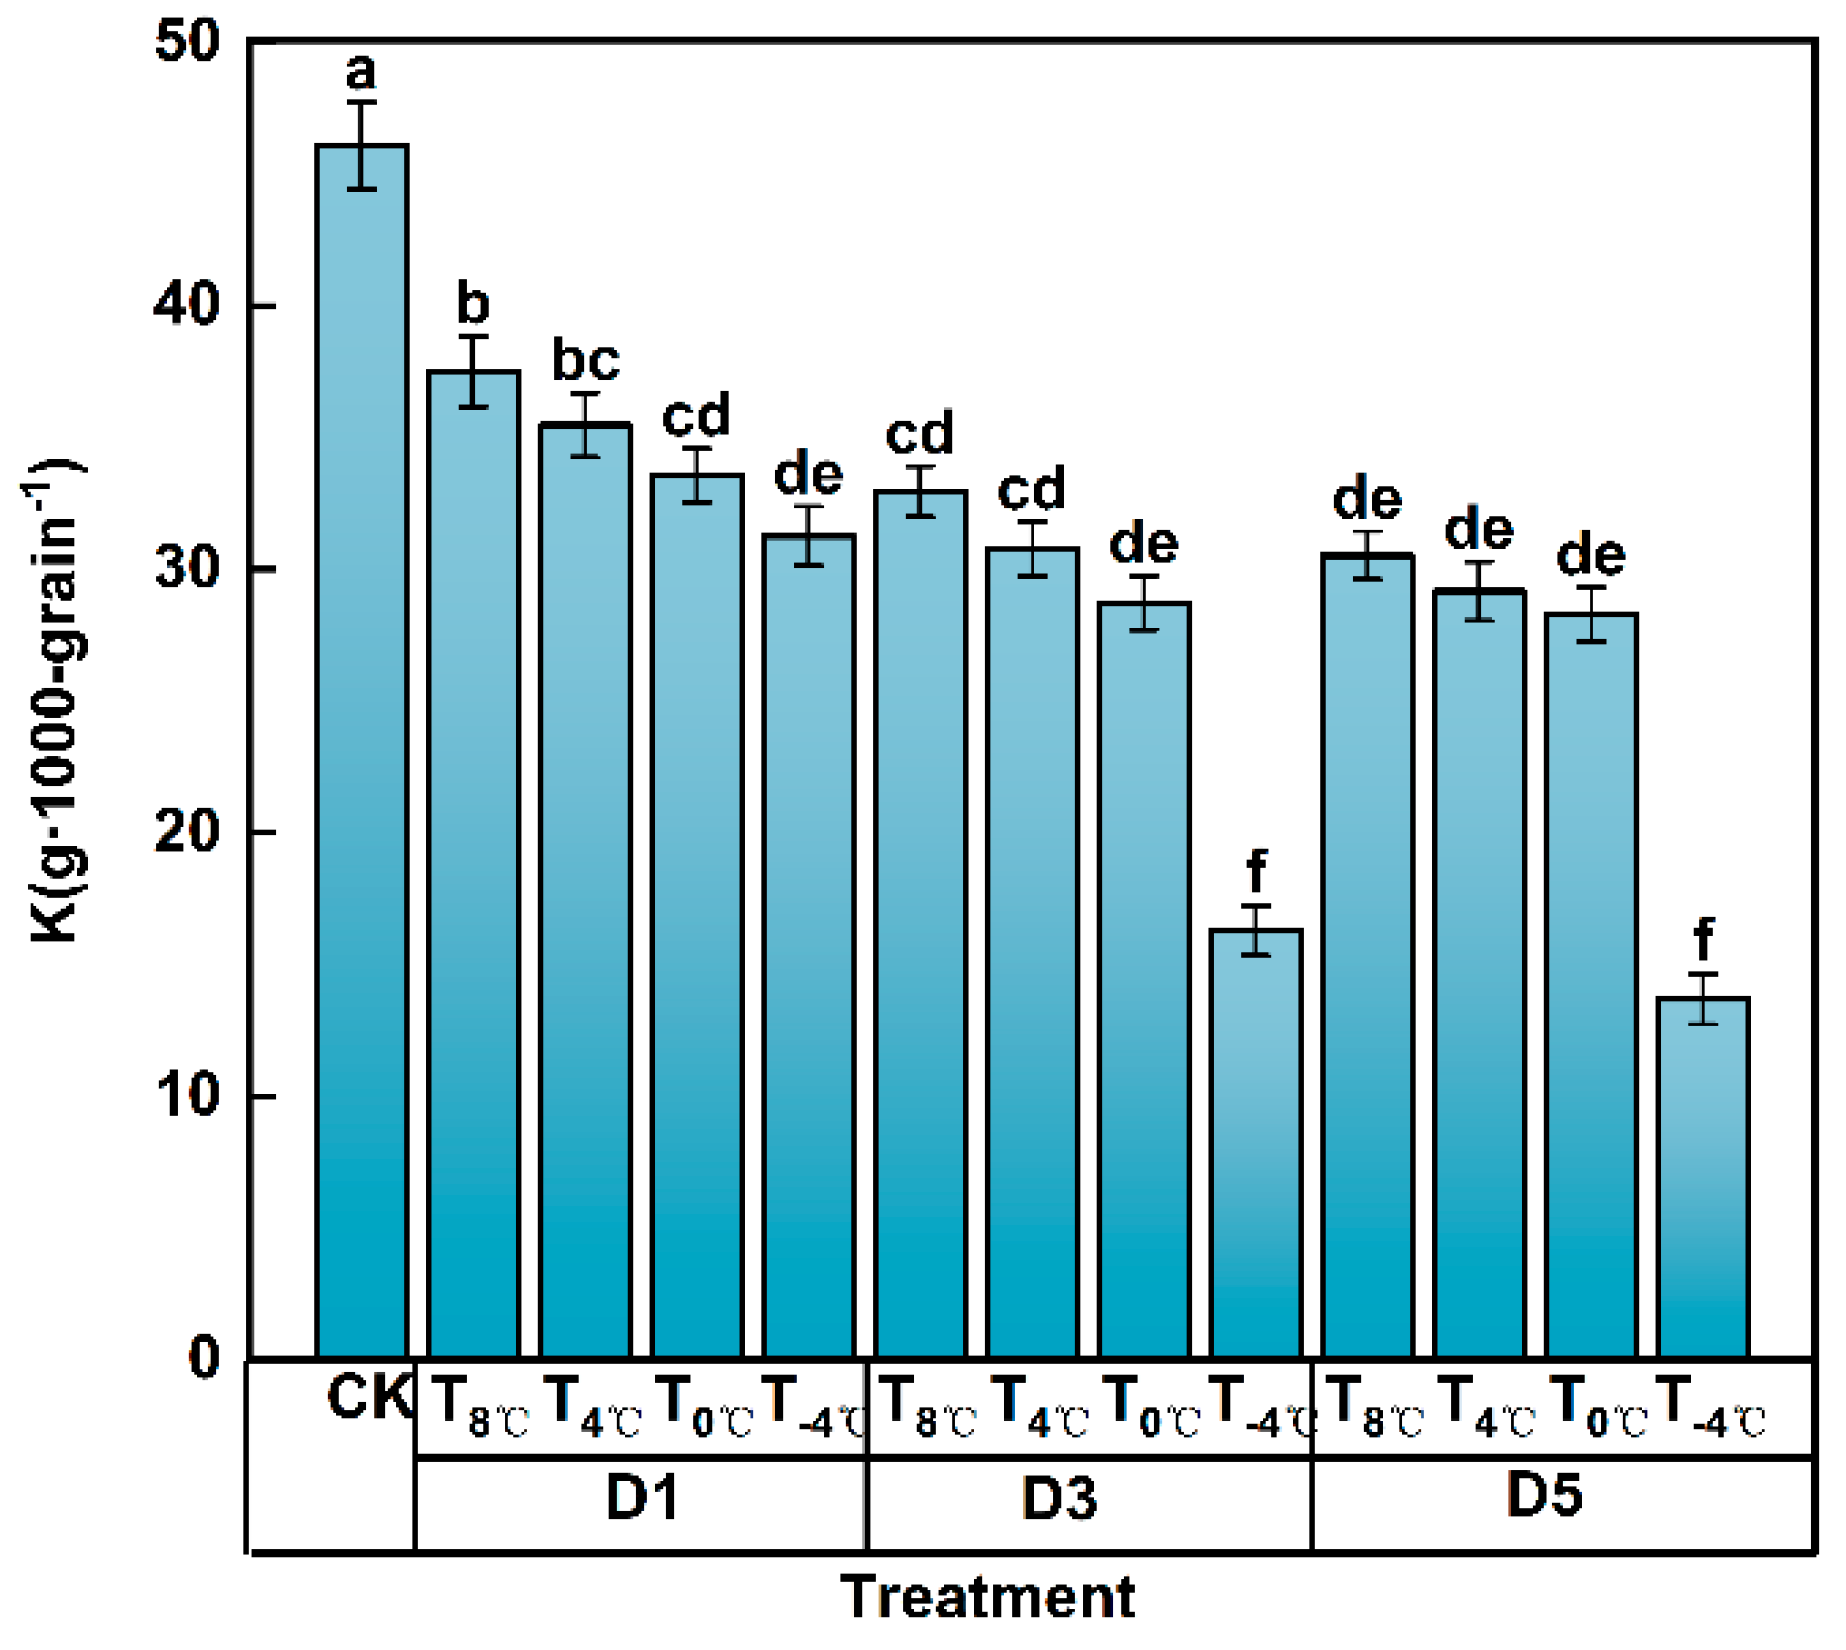
3.2.1. Effect of Low-Temperature Stress on the Variation Process of Thousand Grain Weight of Wheat Grain at Anthesis Stage

The weight of grain during the filling stage adhered to an S-shaped growth curve, with the most rapid increase occurring between 14 and 21 days after anthesis (Figure 8). Under low-temperature conditions of the same duration, the thousand-grain weight (TGW) significantly decreased compared to CK. The TGW of the CK is 44.68 g·1000-grain−1. Specifically, when T4 °C lasted for 3–5 days, the grains matured 21 days after anthesis, and the TGW at maturity decreased by 28.44 and 31.07 g·1000-grain−1, respectively, compared to CK. With a 1 °C decrease in temperature, TGW decreased by 0.40, 1.55, and 1.54 g·1000-grain−1 at D1, D3, and D5, relatively. Keeping the low temperature constant, an increase in the duration of low-temperature exposure by 1 day resulted in decreases in TGW at maturity by 0.74, 0.97, 0.98, and 4.39 g per 1000 grains for T8 °C, T4 °C, T0 °C, and T−4 °C, respectively.

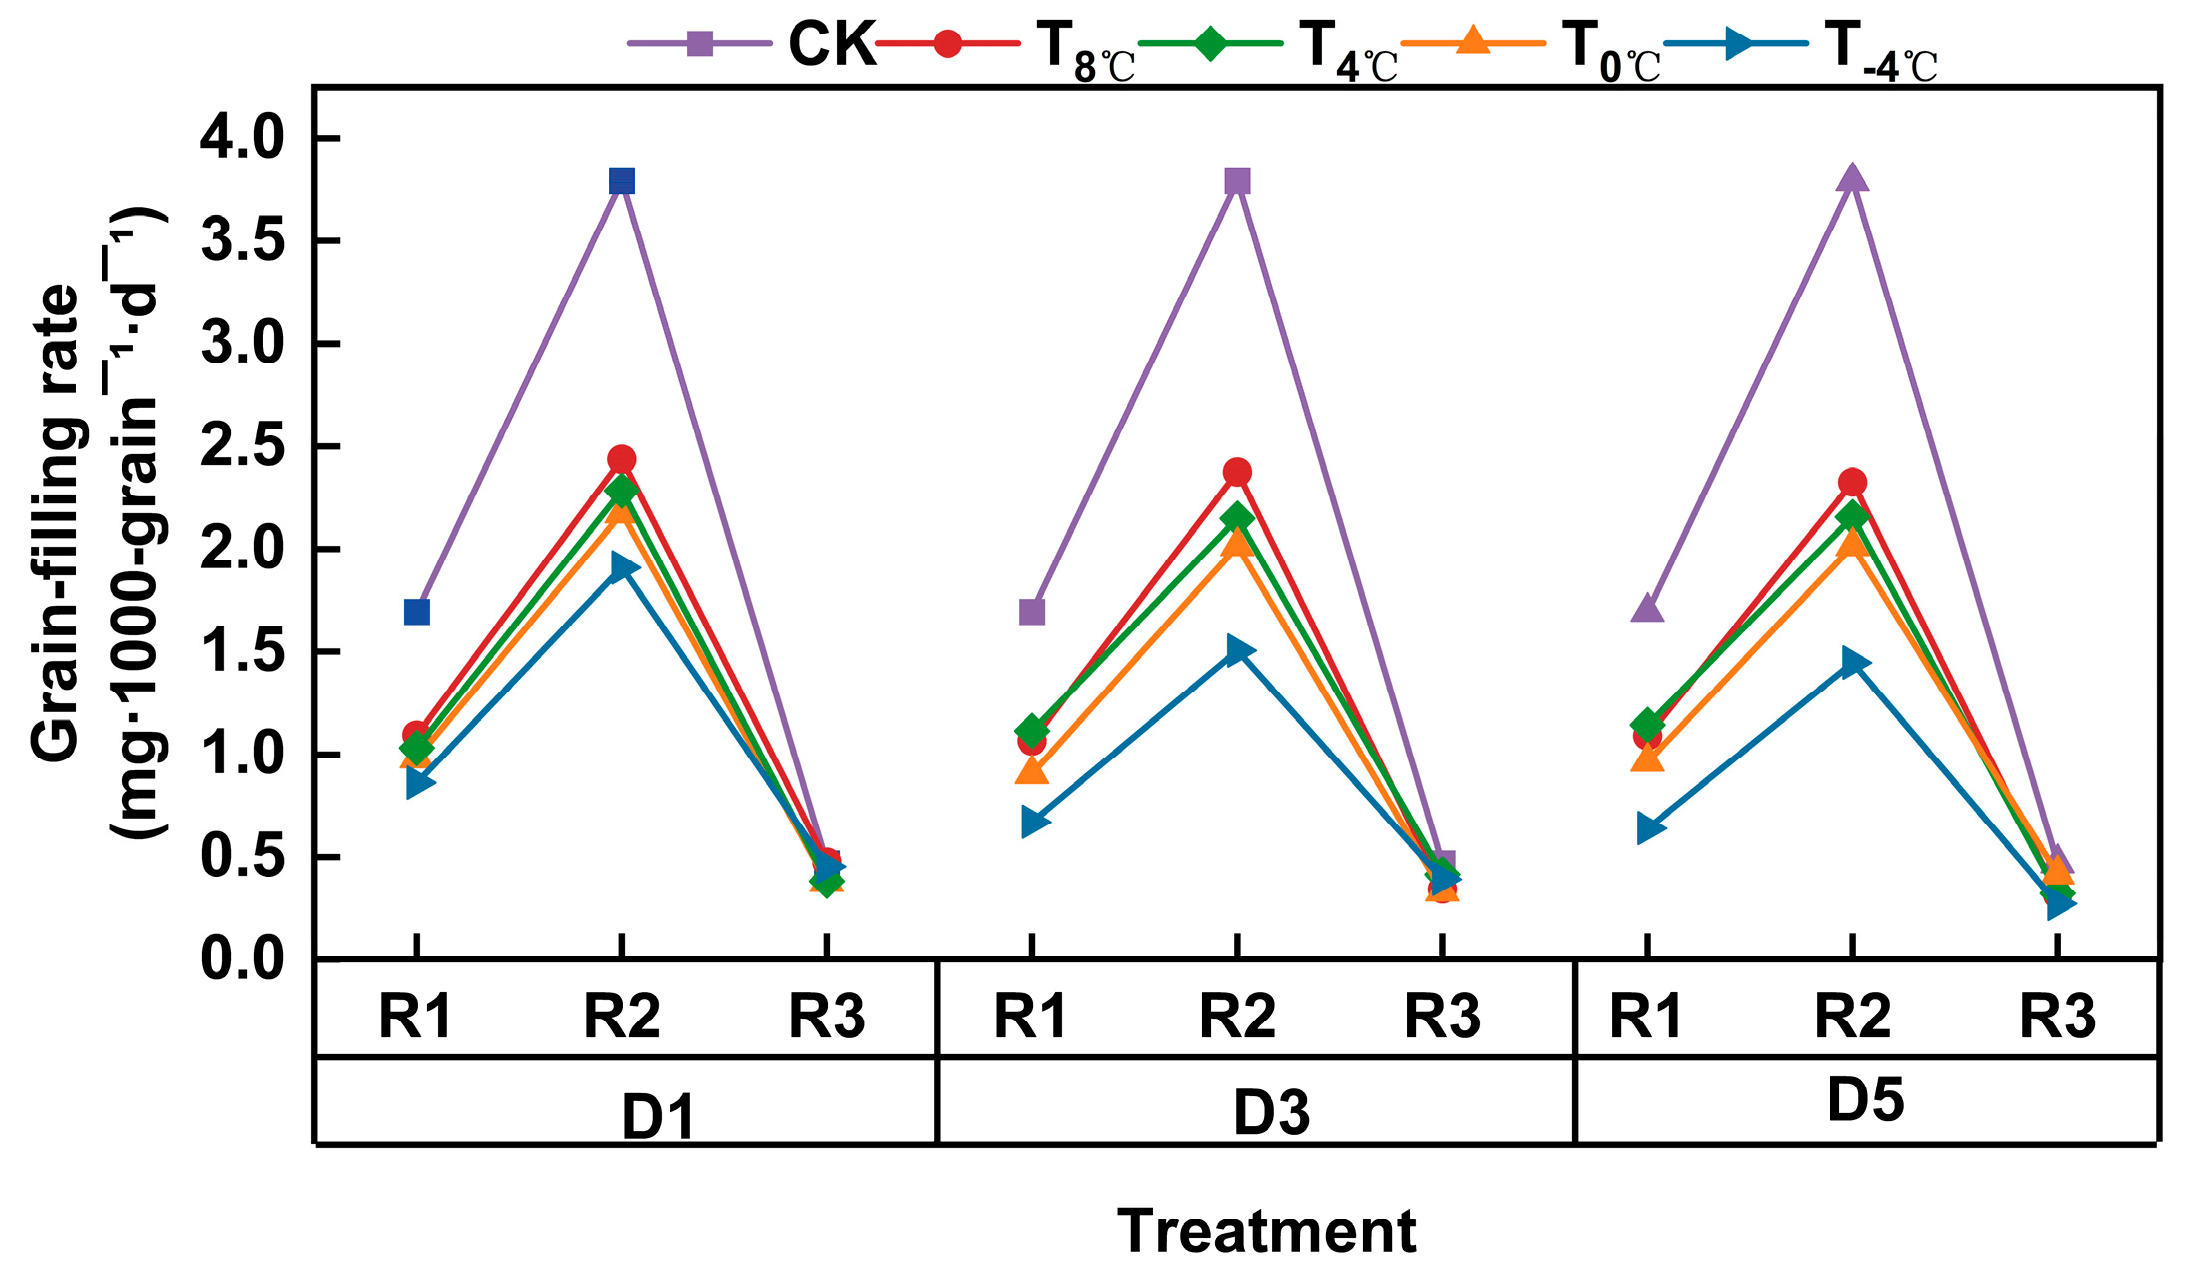
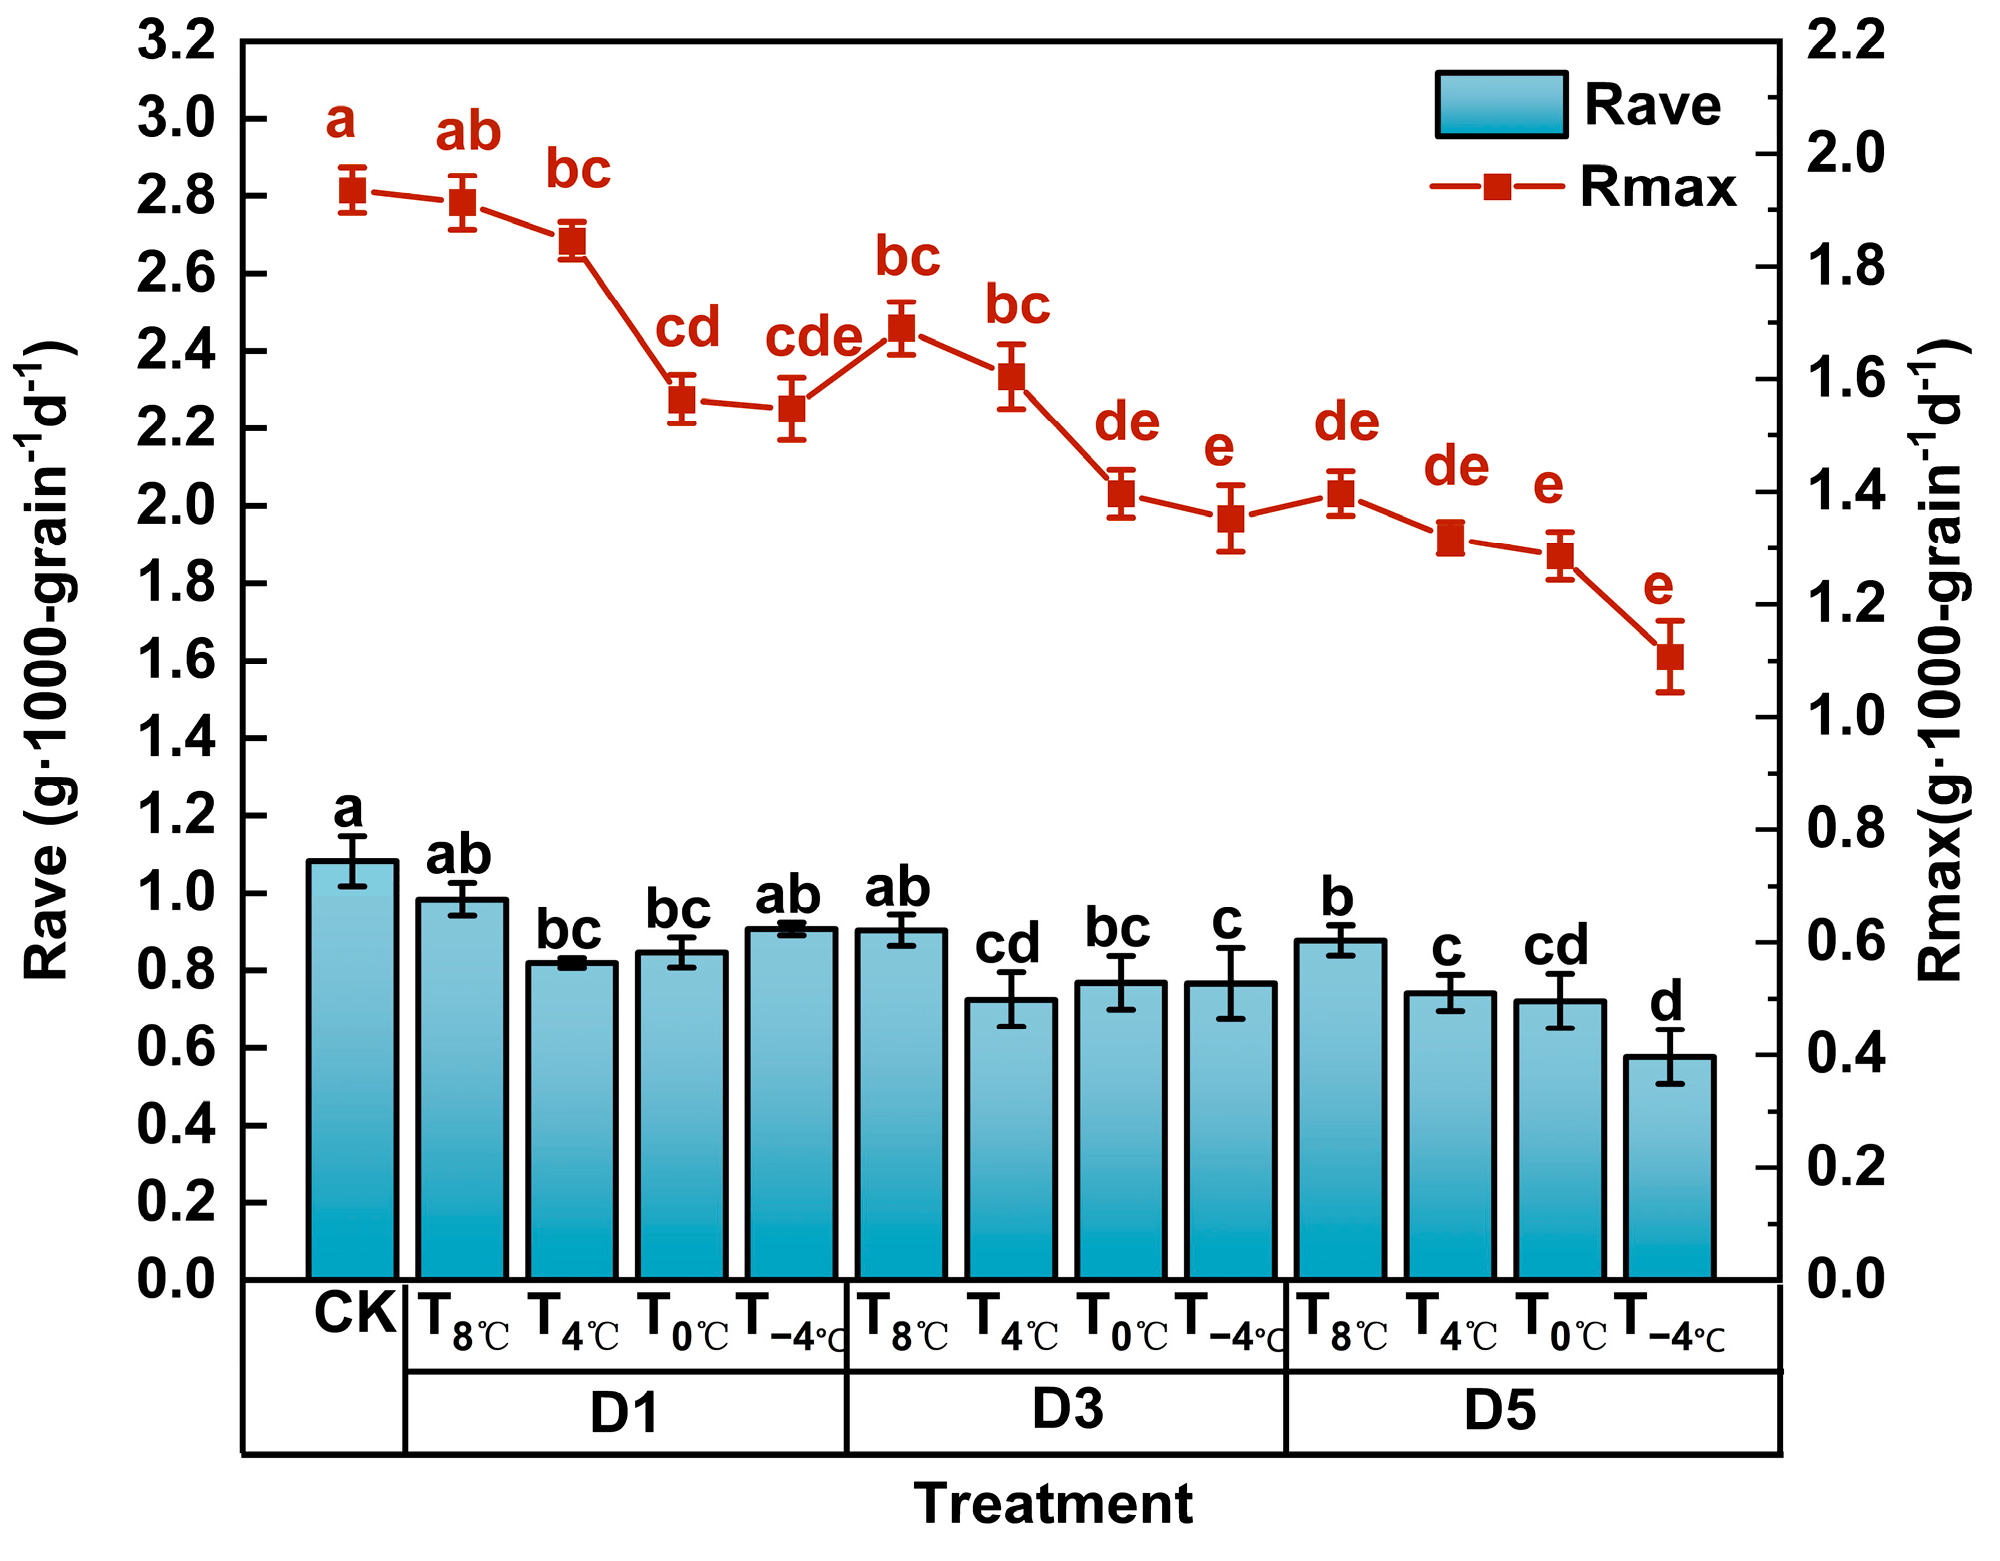
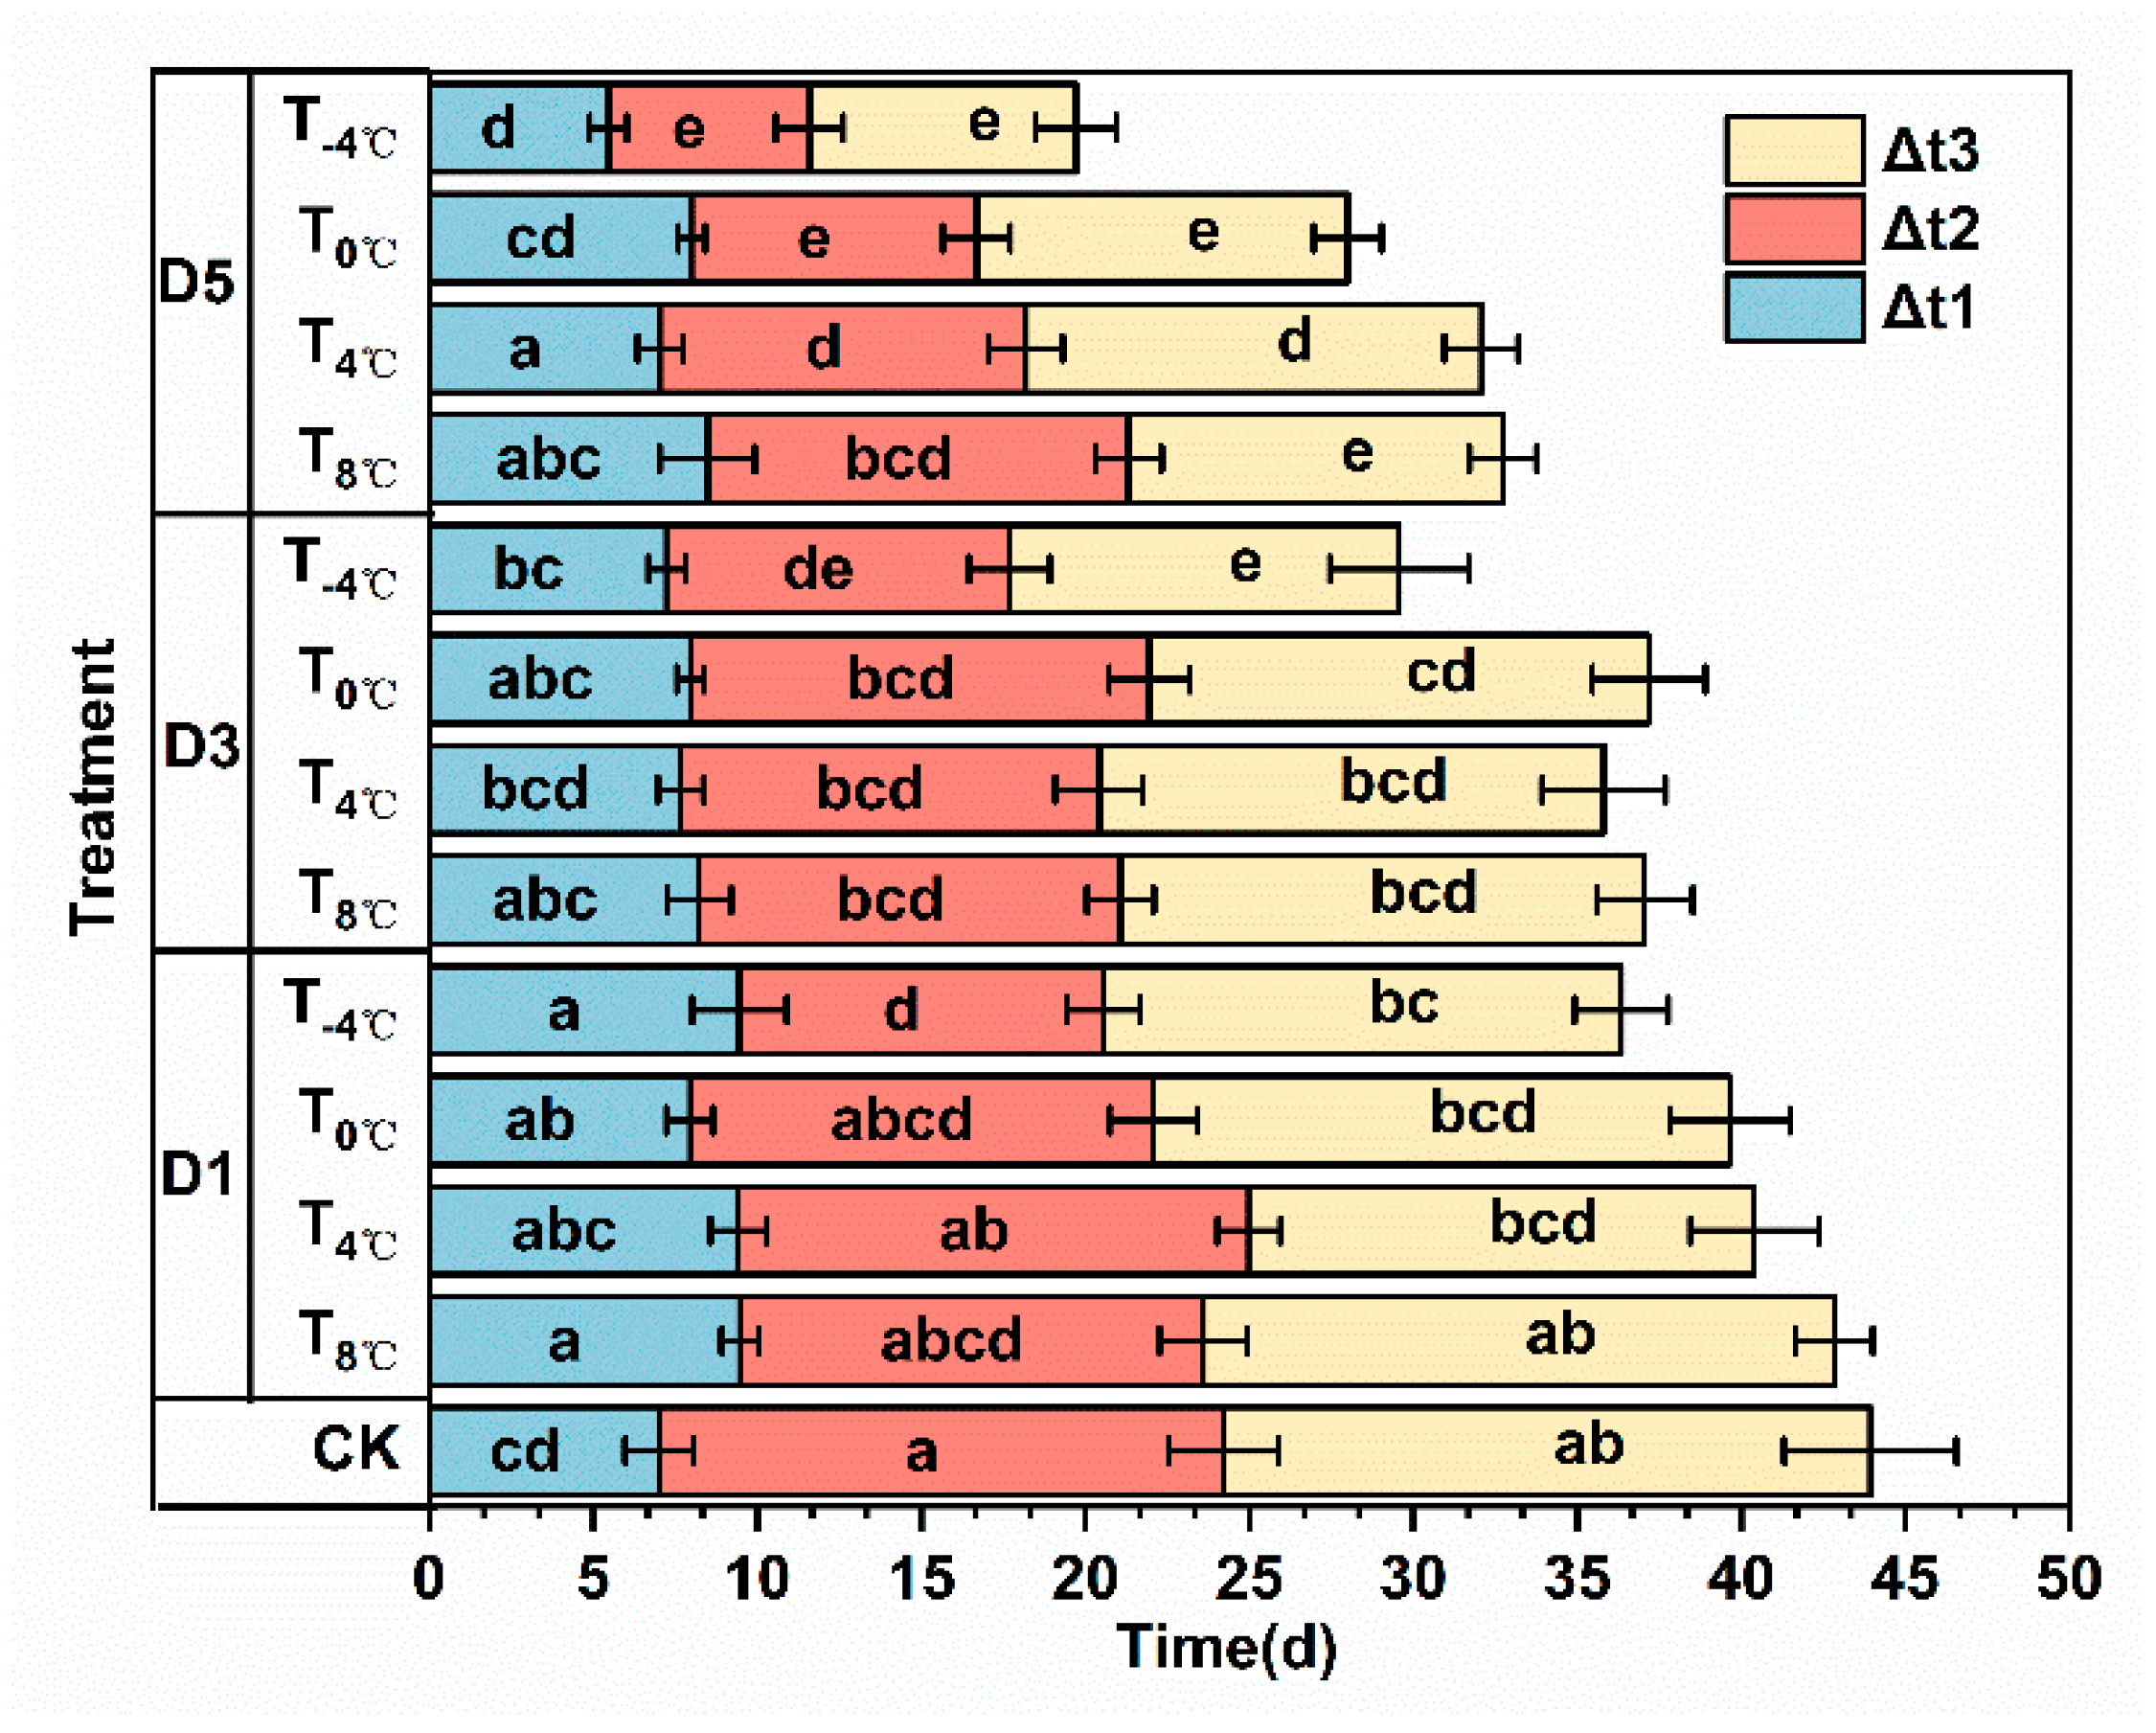
3.2.2. Effect of Low-Temperature Stress on Grain-Filling Parameters at Anthesis Stage

The logistic model was used to fit the grain-filling process under different low-temperature treatments (Table 2). The coefficient of determination (R2) for each equation ranged from 0.94 to 0.99, reaching a significant level. This indicates that the model could accurately reflect the grain-filling condition.
After being subjected to low-temperature stress during anthesis, the grain-filling rate of wheat exhibited a unimodal pattern, characterized by a sequence of rapid filling rate (R2) > gradually increasing grain-filling rate (R1) > slowly increasing grain-filling rate (R3) across different periods (Figure 9). The rapid and slow increasing stages of grain filling were found to be crucial periods influencing thousand-grain weight. The results indicated that higher R2 and R3 treatments were associated with greater thousand-grain weight.
In comparison to CK, both Rave and Rmax decreased due to low-temperature stress during anthesis stage (Figure 10). The Rmax of the CK is 1.94 g·1000-grain−1·d−1. The filling rate notably decreased under the combined influence of low temperature and prolonged exposure duration. This decline was associated with lower temperature and extended exposure durations, becoming particularly pronounced when temperature dropped below 0 °C and after enduring continuous low-temperature exposure for 3–5 days. The Rave of the CK is 1.08 g·1000-grain−1·d−1. Specifically, under T8 °C, T4 °C, T0 °C, and T−4 °C treatments on days 3 and 5, respectively, Rave decreased by 20.36%, 24.10%, 28.07%, and 30.71%, while Rmax decreased by 13.88%, 17.88%, 26.85%, and 30.99% compared to CK. Furthermore, Rave decreased by 17.88%, 26.93%, and 32.62%, while Rmax decreased by 11.25%, 21.93%, and 34.02%.
During the anthesis stage, exposure to low-temperature stress resulted a decrease in Δt2 and Δt3 during the fast-increasing period and slow growth period (Figure 11). The Δt2 and Δt3 of the CK are 17.21 and 19.71 d. Compared to CK, Δt2 and Δt3 decreased by 3.08–11.07 d and 0.49–11.59 d, respectively, while Δt1 increased by 0.02–2.46 d. After just 3 days of exposure to low-temperature stress at T4 °C, Δt2 and Δt3 significantly shortened, with Δt3 showing an even more pronounced reduction after 5 days. Furthermore, for every 1 °C decreases in temperature over the same exposure period, Δt2 shortened by 0.20–0.56 d and Δt3 by 0.25–0.34 d at D1, D3, and D5. At constant low-temperature levels (T8 °C, T4 °C, T0 °C, and T−4 °C), an increase in the duration of low-temperature exposure by 1 day led to a shortening of Δt2 by 0.32 to 1.95 d and Δt3 by a similar range.
The maximum theoretical weight of a thousand grains (K) exhibited varying degrees of reduction with different treatments (Figure 12). The K of the CK is 46.07 g·1000-grain−1. The longer the duration of low-temperature exposure, the greater the decrease in K. For instance, when T4 °C was continuously applied for 3 or 5 d, the grain-filling process was finished earlier, causing a substantial decline in K. The values obtained were 29.79 and 32.39 g·1000-grain−1 lower than CK, respectively. Within the same period of low-temperature exposure, a decrease in temperature led to a marked reduction in K. For instance, compared to CK, K decreased by 24.23%, 28.26%, 40.73%, and 41.14% under T8 °C, T4 °C, T0 °C, and T−4 °C, respectively. Furthermore, D1, D3, and D5 decreased K by 22.82%, 29.22%, and 48.73%, respectively.

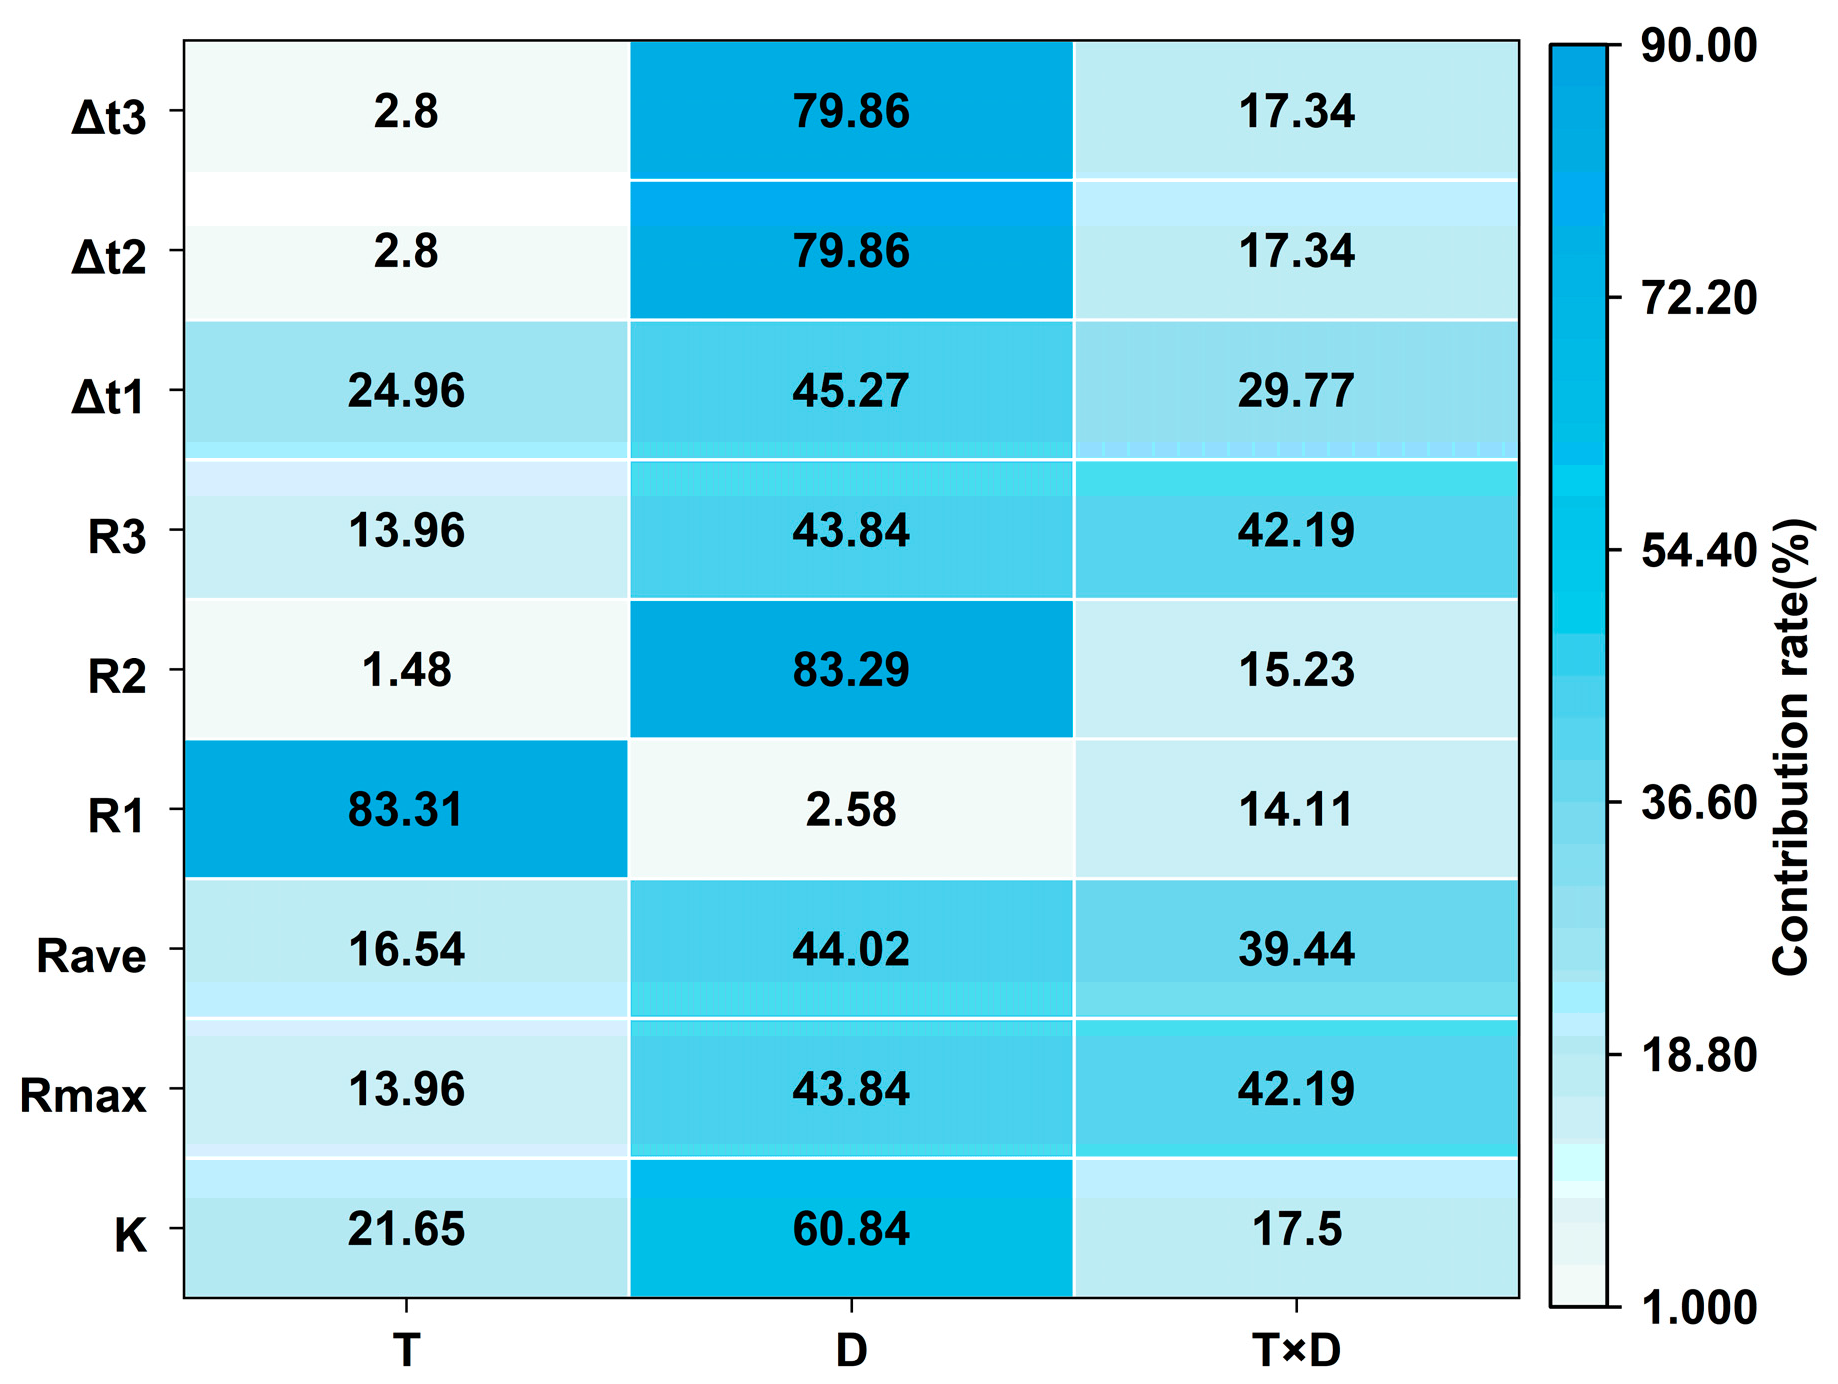
3.2.3. Analysis of Variance of Low Temperature and Duration of Low-Temperature Stress on Grain-Filling Dynamics at Anthesis Stage

The analysis presented in Figure 13 and Table A2 delineates the variations in the impact of low temperature and the duration of continuous exposure on grain-filling dynamics. The synergistic effects of temperature and exposure duration exerted a highly significant impact on the coefficient K (p < 0.01), with the exposure duration being the predominant factor, accounting for 60.84% of the variance in K. Regarding filling rates during different periods, temperature significantly affected R1 (p < 0.01), while exposure duration significantly affected Rmax, Rave, R2, and R3 (p < 0.05). The interaction between temperature and duration significantly affected Rmax and R3 (p < 0.01). Temperature had the most pronounced impact on R1, contributing 83.31%, while duration had the greatest effect on Rmax, Rave, R2, and R3, with contribution rates of 43.84%, 44.02%, 83.29%, and 43.84%, respectively. Temperature mainly influenced the early-stage grain filling, particularly R1. Meanwhile, exposure duration played a significant role in the middle and later filling stages, followed by the interaction between temperature and duration. Notably, there was no significant effect on Rmax, Rave, R2, and R3 at low-temperature levels. The effects of temperature and duration on Δt1 were also found to be significant (p < 0.05). Moreover, the interaction between temperature and exposure duration significantly impacted Δt2 and Δt3. Duration had the most significant influence on Δt2 and Δt3 (p < 0.05), contributing 79.86% and 75.48%, respectively, while temperature had the greatest effect on Δt1, with a contribution rate of 45.27%. Temperature primarily influenced the duration of early filling, and the time needed to reach the maximum filling rate, whereas duration was the main factor affecting the filling duration in the middle and later stage.

3.3. Effect of Low Temperature During Anthesis Stage on Yield

3.3.1. Effect of Low-Temperature Stress on Yield at Anthesis Stage

The number of grains per spike and grain weight are key factors influencing wheat yield. Table 3 shows the effects of low-temperature stress during anthesis stage on yield components. As the temperature decreased and the duration of low-temperature exposure increased, the pollen abortion rate gradually rose. The pollen abortion rate of the CK is 6.60%. In the same duration of low temperature, T8 °C, T4 °C, T0 °C, and T−4 °C showed respective increases of 74.58%, 132.76%, 192.39%, and 244.44% compared to CK. Similarly, increases of 113.11%, 159.06%, and 177.37% were noted at D1, D3, and D5, respectively, compared to CK. The rise in pollen abortion rate resulted in a reduction in the number of grains per spike, which decreased gradually with decreasing temperature and increasing exposure duration. CK had 47.67 grains per spike. The most significant decrease in the number of grains per spike was observed under the T−4 °C treatment. Compared to CK, the number of grains per spike significantly decreased as the temperature decreased under the same duration of low-temperature exposure. A temperature decreases of 1 °C led to a reduction of 0.80, 1.20, and 1.31 grains per spike in D1, D3, and D5 treatments, respectively. Moreover, when the duration of low-temperature exposure increased by 1 day while maintaining the same temperature level, the number of grains per spike decreased by 0.050, 0.30, 0.43, and 1.58 grains under T8 °C, T4 °C, T0 °C, and T−4 °C, respectively. Additionally, grain weight per spike also underwent a significant decrease under low-temperature stress during anthesis stage, showing a gradual decline with prolonged exposure duration across different temperature treatments. The grain weight of the CK is 2.20 g·spike−1. Comparatively, when the temperature decreased by 1 °C, the grain weight per spike decreased by 0.035 g, 0.036 g, and 0.048 g at D1, D3, and D5, respectively, in comparison to CK. Under the condition of constant low temperature, an increase in exposure duration by 1 day resulted in a decrease in grain weight per spike by 0.090 g, 0.058 g, 0.073 g, and 0.13 g under T8 °C, T4 °C, T0 °C, and T−4 °C, respectively.

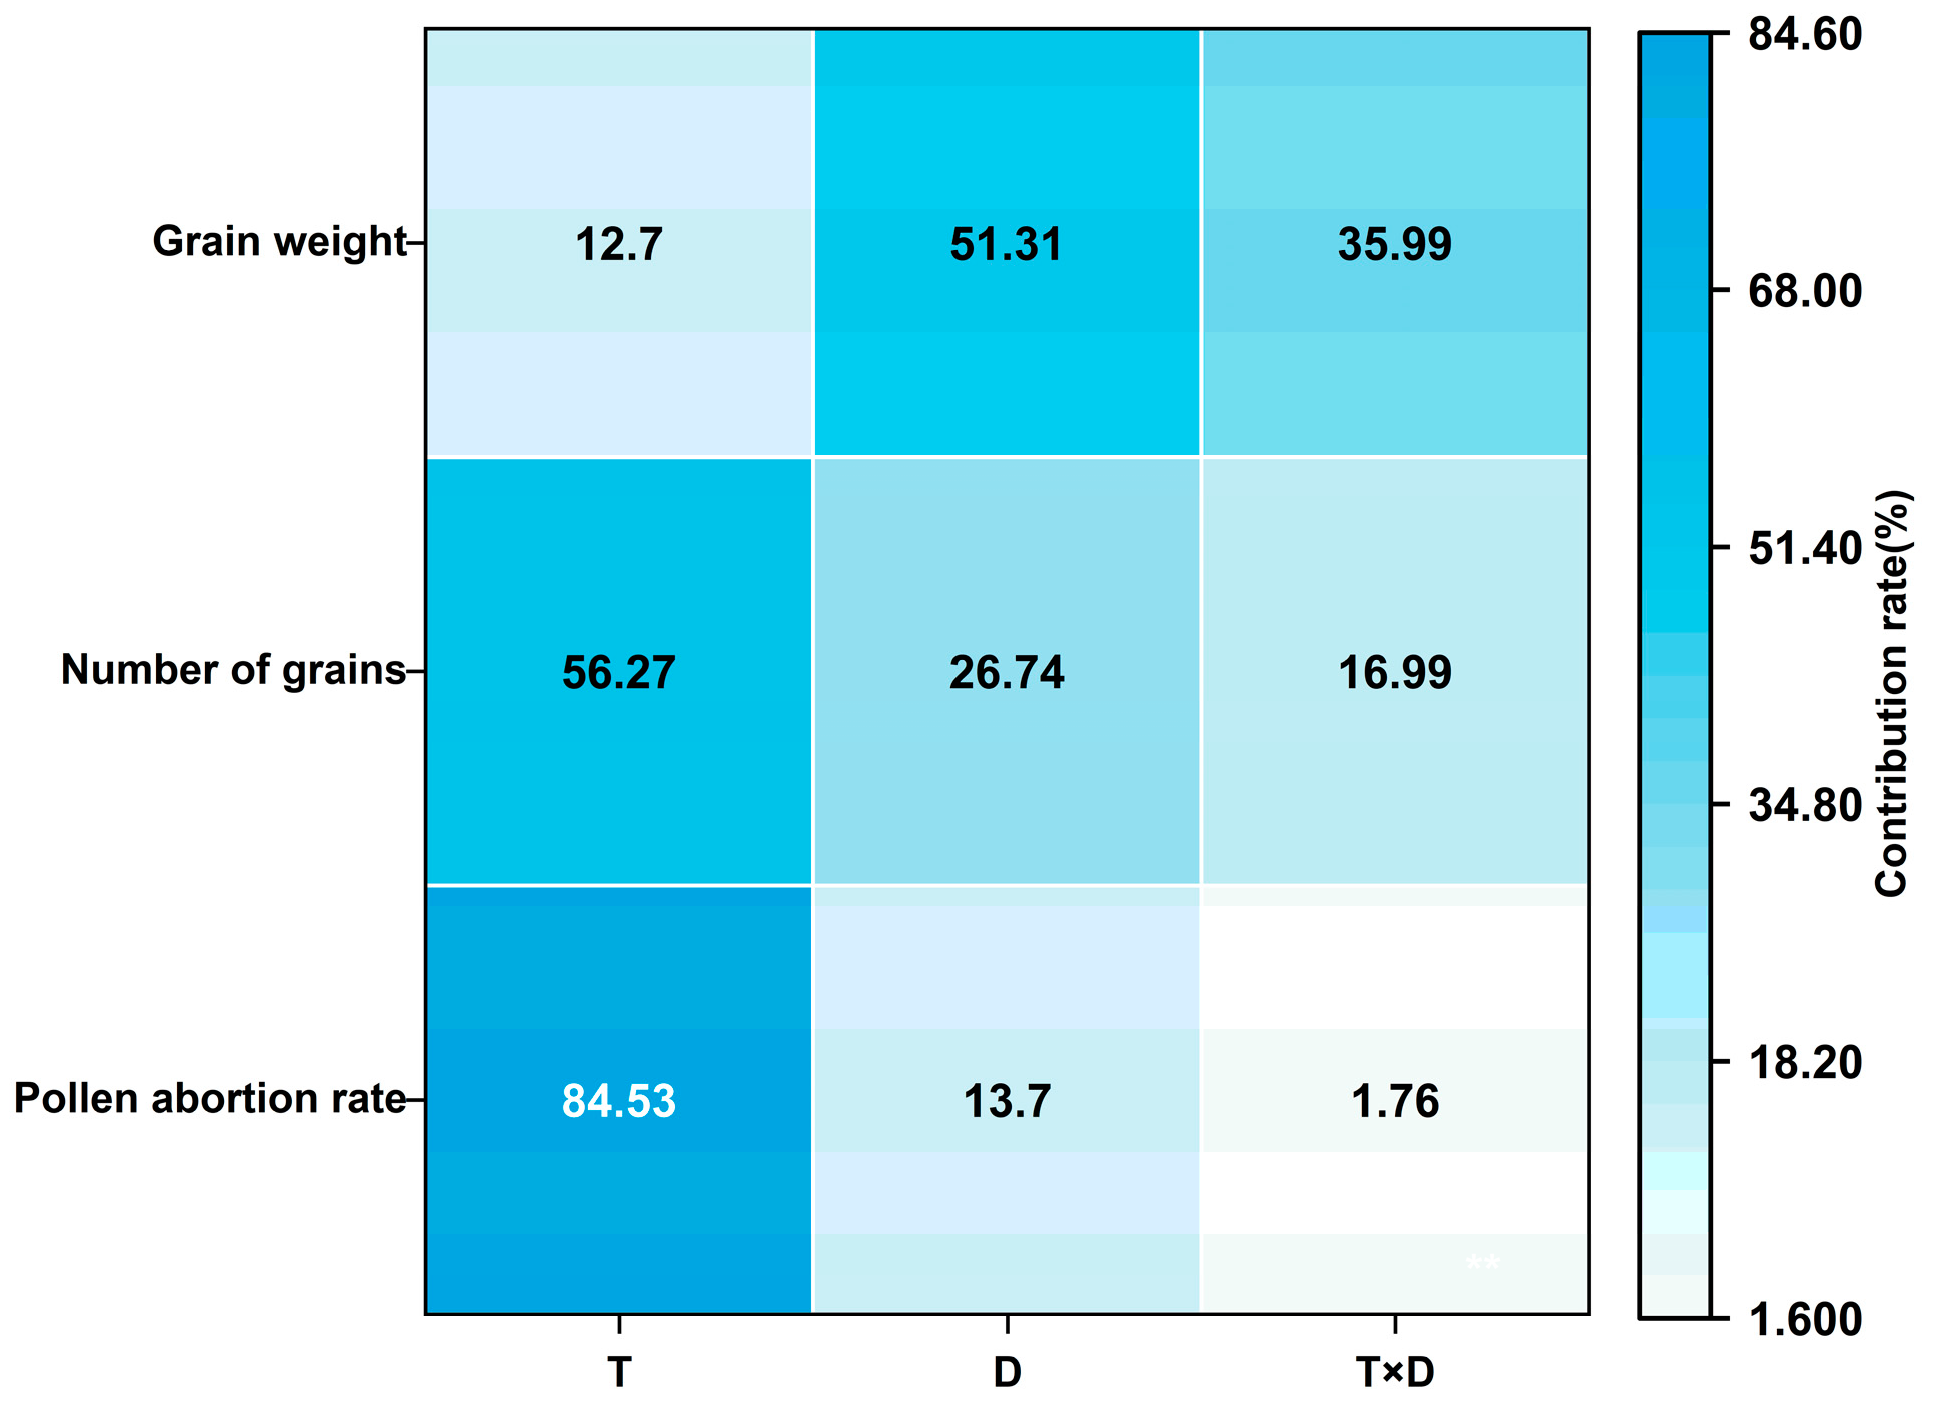
3.3.2. Analysis of Variance of Low Temperature and Duration of Low-Temperature Stress on Wheat Yield at Anthesis Stage

The analysis of variance (ANOVA) concerning the influence of temperature and duration on wheat yield components (Figure 14, Table A3). Temperature significantly affected the pollen abortion rate, grain number per spike, and grain weight per spike, while the duration of treatment significantly influenced (p < 0.01) both grain number and grain weight per spike. Furthermore, the interaction between temperature and exposure duration had a significant impact (p < 0.01) on grain weight per spike. The data indicated that temperature played a pivotal role in determining pollen abortion rate and grain number per spike, accounting for 84.53% and 56.27% of the variance, respectively. Conversely, exposure duration had the greatest impact on grain weight per ear, with a contribution rate of 51.31%. Low temperature and exposure duration are key determinants of wheat yield components. Specifically, temperature level significantly affects grain number per spike, whereas exposure duration has a greater impact on grain weight.

4. Discussion

The grain yield of wheat is closely related to the accumulation and translocation of above-ground dry matter, which is directly associated with the accumulation of assimilates post-anthesis and the transport and allocation between the sink and source during the grain-filling period [29]. Research has found that wheat grain yield increases with the enhancement of the translocation of stored materials from vegetative organs prior to flowering and the accumulation of dry matter after flowering [30]. When exposed to low-temperature stress, leaf photosynthesis is reduced, impacting the accumulation and transportation of dry matter to grain [31]. This suggests that under low-temperature stress during anthesis, grain yield depends more on dry matter transport after anthesis. Research has revealed that the impact of low-temperature stress on plants may be achieved through the regulation of carbohydrate metabolism and sugar transport pathways [32]. Furthermore, the vascular bundle serves as the conduit for carbohydrate transportation, and its structure and developmental status directly influences the transport and accumulation of carbohydrates, thereby affecting the development and grain weight formation of wheat [33]. Studies have found that exposure to low-temperature stress during the booting stage can lead to a reduction in the number of vascular bundles in the wheat spike axis, causing structural damage that inhibits the normal transport of assimilates in the young spike, thereby affecting the formation of wheat grain weight [34]. It was observed that the interaction between low temperature and duration significantly affected post-anthesis dry matter assimilation and accumulation, and temperature was the primary factor influencing dry matter transport. Low-temperature stress during anthesis decreased dry matter accumulation in the wheat stem while increasing accumulation in the stem sheath, leaf, and ear axis+glume. This indicates that the stress has likely damaged the stem transport tissue, hindering assimilate transport to the grains and causing more assimilates to be retained in the stem sheath, leaf, and ear axis+glume. This imbalance disrupted the transport of dry matter from source organs to sink organs, resulting in significant accumulation of dry matter assimilation in the stem sheath after anthesis. These findings align with the conclusions drawn by Sabagh et al. [35]. These findings are in line with previous studies [12,36,37], and the results demonstrated that low-temperature stress at the anthesis stage altered the dry matter distribution ratio, with reductions for the grain and leaf and increases for the stem-sheath and ear axis+glume. The period after anthesis is crucial for grain filling, during which high dry matter assimilation is necessary for normal wheat grain filling [13,38]. Under low-temperature stress, the accumulation of reactive oxygen species (ROS) in plant roots can lead to oxidative damage to unsaturated fatty acids in membrane lipids, resulting in structural and functional impairment of the membrane system. This, in turn, inhibits the normal transport of assimilates in young wheat spikes and subsequently affects the formation of wheat grain weight [39,40]. The experiment showed that low-temperature stress during anthesis increased pre-anthesis dry matter transport and contribution rate while decreasing post-anthesis dry matter assimilation and accumulation, consistent with findings by Wang et al. [41]. This further suggests that under low-temperature stress during anthesis, grain yield depends more on dry matter transport after anthesis.
The grain-filling process is critical for determining grain weight, with the rate and duration of grain filling playing key roles [42]. Decreases in these factors significantly reduce thousand-grain weight [38,43]. This study observed significant reductions in grain-filling rates (R1, R2, R3, Rmax, and Rave) under lower temperatures and longer cold exposure durations during anthesis, consistent with findings by Du et al. [44]. The rapid and slow increasing stages of grain filling were identified as crucial periods influencing thousand-grain weight [45]. Higher R2 and R3 values were associated with greater thousand-grain weight, while the combined effects of low temperature and prolonged exposure notably decreased the filling rate. Additionally, low-temperature stress shortened the grain-filling duration (Δt2 and Δt3) and increased the initial filling period (Δt1) [46]. These findings align with research by K. Zhao et al. [47]. Overall, the study concludes that prolonged low-temperature exposure during anthesis primarily reduces thousand-grain weight by decreasing the grain-filling rate and duration, with exposure duration being the most significant factor influencing grain filling.
Low temperature is a critical environmental factor that restricts wheat growth and development [48], leading to reduced wheat yield. The number of grains per spike and grain weight are key factors influencing wheat yield [16,48]. The impact of low temperature on wheat yield formation depends not only on temperature and exposure duration but also on the growth stage of wheat. During low-temperature stress at anthesis, decreased temperature and increased exposure duration can reduce wheat pollen vigor and increase pollen abortion rates, resulting in fewer grains per spike [49,50]. Under low-temperature stress, the content of endogenous hormone gibberellin (GA) in rice anthers decreases, leading to the abortion of small flowers and a significant reduction in grain numbers per panicle [51,52]. Following exposure to low-temperature stress, there is a significant decrease in the content of IAA and GA in the wheat spikelet, leading to insufficient nutrient input to the spikelet and reduced fertility of wheat florets, resulting in a decline in yield [53,54]. During the critical stage of wheat booting, exposure to low-temperature stress can lead to a significant accumulation of reactive oxygen species (ROS) within the anthers, causing oxidative stress and disrupting the redox homeostasis of the anthers. This excessive accumulation of ROS is one of the primary factors contributing to pollen abortion rate and subsequent reduction in grain numbers per panicle [55]. Research has found that there is a highly significant positive correlation between the number of vascular bundles in the wheat spike axis and the number of grains set in the spikelets [36]. Following exposure to low-temperature stress, the number of vascular bundles in the wheat spike axis decreases and their structure is damaged, which inhibits the normal transport of assimilates in the young spike and reduces the nutritional supply for the development of wheat florets, thus affecting the formation of wheat grain numbers and grain weight [53]. In this study, the duration and severity of low-temperature stress significantly affected the number of grains per spike, with temperature being the primary influencing factor. Additionally, grain weight, largely determined by post-anthesis grain filling, is a major contributor to yield reduction. Low-temperature stress during anthesis can significantly decrease grain weight per ear, with reductions becoming more pronounced as temperature decreases and exposure duration increases [56]. Overall, the duration of low-temperature exposure had a significant impact on both the ear and grain, highlighting its critical role in wheat yield formation.

5. Conclusions

In this study, we investigated the effects of low temperature and its duration on grain filling, dry matter accumulation, distribution, transport, and yield components of winter wheat during the anthesis stage. The results showed that low-temperature stress significantly reduced dry matter accumulation, diminished capacity to transport photosynthates to the grain, shortened the grain-filling time, and decreased the filling rate, leading to a reduction in grain weight. Furthermore, low-temperature stress decreased pollen fertility, resulting in a decrease in the number of grains per ear. The reduction in both grain weight and the number of grains per spike led to a decline in yield. The impact of varying low temperature levels and their duration on wheat yield differs significantly. Temperature has the greatest influence on the accumulation, distribution, and transport of dry matter, as well as the number of grains per spike. Conversely, temperature exposure. This finding offers a scientific basis for developing agricultural strategies to mitigate climate change and extreme weather, especially in areas with frequent spring low temperatures.

Author Contributions

Conceptualization, X.J., Q.C. and Z.Y.; methodology, X.J. and Q.C.; investigation, Q.C. and J.Z.; formal analysis, Q.C. and J.Z.; writing—original draft, X.J. and Q.C.; writing—review and editing, X.J., E.A., Q.C. and M.T. All authors have read and agreed to the published version of the manuscript.

Funding

This research was funded by the National Key Research and Development Program of China, grant number 2022YFD2300202.

Data Availability Statement

The original contributions presented in this study are included in the article. Further inquiries can be directed to the corresponding author(s).

Conflicts of Interest

The authors declare no conflicts of interest.

Abbreviations

The following abbreviations are used in this manuscript:
SAStem-sheath dry matter accumulation
LALeaf dry matter accumulation
SGASpike axis+glume dry matter accumulation
GAGrain dry matter accumulation
SRStem-sheath dry matter allocation ratio
LRLeaf dry matter allocation ratio
SGRSpike axis+glume dry matter allocation ratio
GRGrain dry matter allocation ratio
PTAPre-anthesis translocation amount
CPTContribution of pre-anthesis translocation to grains
PAAPost-anthesis accumulation amount
CPAContribution of post-anthesis accumulation to grains
TGWThousand-grain weight
KTheoretical maximum thousand-grain weight
RaveAverage filling rate
RmaxMaximum filling rate
R1The filling rate in the gradual-increasing stage
R2The filling rate in the fast-increasing period
R3The filling rate during the slow growth period
Δt1The duration of gradual-increasing stage
Δt2The duration of the fast-increasing period
Δt3The duration of the slow growth period

Appendix A

Figure A1. Full-cycle of wheat ‘Jimai 22’ low-temperature stress study: spanning from field seedling stage to anthesis stage, with controlled stress treatment in artificial climate chambers and post-treatment field observations.
Agronomy 15 00761 g0a1
Table A1. Two-way ANOVA of the effects of temperature treatment (T) and duration of exposure (D) on wheat ‘Jimai 22’ dry matter accumulation, partitioning, and translocation.
Treatmentp
SAT0.05
D<0.01
T × D<0.01
LAT<0.01
D0.04
T × D<0.01
SGAT0.01
D0.11
T × D0.14
GAT<0.01
D<0.01
T × D<0.01
SRT<0.01
D<0.01
T × D<0.01
LRT<0.01
D<0.01
T × D<0.01
SGRT0.07
D0.84
T × D0.60
GRT<0.01
D0.01
T × D<0.01
PTAT<0.01
D0.28
T × D<0.01
CPTT<0.01
D0.13
T × D0.01
PAAT<0.01
D0.04
T × D<0.01
CPAT<0.01
D0.13
T × D0.01
Note: T and D represent temperature treatment and days of exposure duration, respectively.
Table A2. Two-way ANOVA of the effects of temperature treatment (T) and duration of exposure (D) on wheat ‘Jimai 22’ grain-filling characteristics of wheat grains.
Treatmentp
KT<0.01
D<0.01
T × D<0.01
RmaxT0.10
D<0.01
T × D0.01
RaveT0.39
D0.04
T × D0.26
R1T<0.01
D0.76
T × D0.79
R2T<0.01
D0.59
T × D0.13
R3T0.02
D<0.01
T × D<0.01
Δt1T0.04
D<0.01
T × D0.11
Δt2T<0.01
D0.22
T × D0.02
Δt3T<0.01
D0.21
T × D0.01
T99T<0.01
D0.01
T × D<0.01
TmaxT<0.01
D<0.01
T × D0.11
Note: T and D represent temperature treatment and days of exposure duration, respectively.
Table A3. Two-way ANOVA of the effects of temperature treatment (T) and du ration of exposure (D) on wheat ‘Jimai 22’ yield components.
Treatmentp
Pollen abortion rateT<0.01
D0.13
T × D0.21
Number of grainsT<0.01
D<0.01
T × D0.24
Grain weightT<0.01
D<0.01
T × D<0.01
Note: T and D represent temperature treatment and days of exposure duration, respectively.

References

  1. Bai, H.; Xiao, D.; Tang, J.; Liu, D.L. Evaluation of wheat yield in North China Plain under extreme climate by coupling crop model with machine learning. Comput. Electron. Agric. 2024, 217, 108651. [Google Scholar] [CrossRef]
  2. Zhang, Y.; Liu, L.; Chen, X.; Li, J. Effects of Low-Temperature Stress during the Anther Differentiation Period on Winter Wheat Photosynthetic Performance and Spike-Setting Characteristics. Plants 2022, 11, 389. [Google Scholar] [CrossRef] [PubMed]
  3. Xiao, L.; Liu, L.; Asseng, S.; Xia, Y.; Tang, L.; Liu, B.; Cao, W.; Zhu, Y. Estimating Spring frost and its impact on yield across winter wheat in China. Agric. For. Meteorol. 2018, 260–261, 154–164. [Google Scholar] [CrossRef]
  4. Latifmanesh, H.; Deng, A.; Nawaz, M.M.; Li, L.; Chen, Z.; Zheng, Y.; Wang, P.; Song, Z.; Zhang, J.; Zheng, C.; et al. Integrative impacts of rotational tillage on wheat yield and dry matter accumulation under corn-wheat cropping system. Soil Tillage Res. 2018, 184, 100–108. [Google Scholar] [CrossRef]
  5. Zhang, W.; Huang, Z.; Xu, K.; Liu, L.; Zeng, Y.; Ma, S.; Fan, Y. The effect of plant growth regulators on recovery of wheat physiological and yield-related characteristics at booting stage following chilling stress. Acta Physiol. Plant. 2019, 41, 133. [Google Scholar] [CrossRef]
  6. Gupta, S.M.; Agarwal, A.; Dev, B.; Kumar, K.; Prakash, O.; Arya, M.C.; Nasim, M. Assessment of photosynthetic potential of indoor plants under cold stress. Photosynthetica 2016, 54, 138–142. [Google Scholar] [CrossRef]
  7. Shahryar, N.; Maali-Amiri, R. Metabolic acclimation of tetraploid and hexaploid wheats by cold stress-induced carbohydrate accumulation. J. Plant Physiol. 2016, 204, 44–53. [Google Scholar] [CrossRef] [PubMed]
  8. Liu, L.; Ji, H.; An, J.; Shi, K.; Ma, J.; Liu, B.; Tang, L.; Cao, W.; Zhu, Y. Response of biomass accumulation in wheat to low-temperature stress at jointing and booting stages. Environ. Exp. Bot. 2019, 157, 46–57. [Google Scholar] [CrossRef]
  9. Obembe, O.S.; Hendricks, N.P.; Tack, J. Decreased wheat production in the USA from climate change driven by yield losses rather than crop abandonment. PLoS ONE 2021, 16, e0252067. [Google Scholar] [CrossRef]
  10. Bhattacharya, A. Effect of Low Temperature Stress on Photosynthesis and Allied Traits: A Review. In Physiological Processes in Plants Under Low Temperature Stress; Springer: Singapore, 2022; pp. 199–297. [Google Scholar] [CrossRef]
  11. Li, X.; Pu, H.; Liu, F.; Zhou, Q.; Cai, J.; Dai, J.; Cao, W.; Jiang, D. Winter Wheat Photosynthesis and Grain Yield Responses to Spring Freeze. Agron. J 2015, 107, 1002–1010. [Google Scholar] [CrossRef]
  12. Zhang, W.; Zhang, A.; Zhou, Q.; Fang, R.; Zhao, Y.; Li, Z.; Zhao, J.; Zhao, M.; Ma, S.; Fan, Y.; et al. Low-temperature at booting reduces starch content and yield of wheat by affecting dry matter transportation and starch synthesis. Front. Plant Sci. 2023, 14, 1207518. [Google Scholar] [CrossRef] [PubMed]
  13. Xiao, L.; Asseng, S.; Wang, X.; Xia, J.; Zhang, P.; Liu, L.; Tang, L.; Cao, W.; Zhu, Y.; Liu, B. Simulating the effects of low-temperature stress on wheat biomass growth and yield. Agric. For. Meteorol. 2022, 326, 109191. [Google Scholar] [CrossRef]
  14. Kumar, A.; Yadav, R.; Gupta, S.; Gaikwad, K.B.; Jain, N.; Ranjan, R.; Kumar, M. Identification of genotypes and marker validation for grain filling rate and grain filling duration in wheat under conservation agriculture. Indian J. Genet. Plant Breed. 2018, 78, 309–316. [Google Scholar]
  15. Xie, Y.; Wang, C.; Yang, W.; Feng, M.; Qiao, X.; Song, J. Canopy hyperspectral characteristics and yield estimation of winter wheat (Triticum aestivum) under low temperature injury. Sci. Rep. 2020, 10, 244. [Google Scholar] [CrossRef]
  16. Ji, H.; Xiao, L.; Xia, Y.; Song, H.; Liu, B.; Tang, L.; Cao, W.; Zhu, Y.; Liu, L. Effects of jointing and booting low temperature stresses on grain yield and yield components in wheat. Agric. For. Meteorol. 2017, 243, 33–42. [Google Scholar] [CrossRef]
  17. Knott, C.A. Estimated winter wheat yield reduction following spring freeze events in field conditions. Crop Forage Turfgrass Manag. 2020, 6, e20080. [Google Scholar] [CrossRef]
  18. Wang, X.; Cai, J.; Liu, F.; Jin, M.; Yu, H.; Jiang, D.; Wollenweber, B.; Dai, T.; Cao, W. Pre-anthesis high temperature acclimation alleviates the negative effects of post-anthesis heat stress on stem stored carbohydrates remobilization and grain starch accumulation in wheat. J. Cereal Sci. 2012, 55, 331–336. [Google Scholar] [CrossRef]
  19. Si, D. Optimal Temperature Conditions for Wheat Growth and Development. Beijing Agric. 1995, 15. [Google Scholar]
  20. Thakur, P.; Kumar, S.; Malik, J.A.; Berger, J.D.; Nayyar, H. Cold stress effects on reproductive development in grain crops: An overview. Environ. Exp. Bot. 2009, 67, 429–443. [Google Scholar] [CrossRef]
  21. Zheng, B.; Chapman, S.C.; Christopher, J.T.; Frederiks, T.M.; Chenu, K. Frost trends and their estimated impact on yield in the Australian wheatbelt. J. Exp. Bot. 2015, 66, 3611–3623. [Google Scholar] [CrossRef]
  22. Barlow, K.M.; Christy, B.P.; O’Leary, G.J.; Riffkin, P.A.; Nuttall, J.G. Simulating the impact of extreme heat and frost events on wheat crop production: A review. Field Crops Res. 2015, 171, 109–119. [Google Scholar] [CrossRef]
  23. Li, M.X.; Huo, Z.G.; Kong, R.; Jiang, M.Y.; Mi, Q.C. Construction of Spring Low-Temperature Disaster Grade Index for Winter Wheat in the Huang-Huai-Hai Region. J. Appl. Meteorol. Sci. 2024, 35, 45–56. [Google Scholar] [CrossRef]
  24. Gao, Y.; Zhang, Y.; Ma, Q.; Su, S.; Li, C.; Ding, J.; Zhu, M.; Zhu, X.; Guo, W. Effects of low temperature in spring on fertility of pollen and formation of grain number in wheat. Acta Agron. Sin. 2021, 47, 104–115. [Google Scholar] [CrossRef]
  25. Wang, Y.; Wang, M.; Tian, P.; Ren, D.; Zhang, H.; Ma, G.; Duan, J.; Wang, C.; Feng, W. Mechanism of Irrigation Before Low-Temperature Exposure on Mitigating the Reduction in Yield Loss and Spikelet Abortion at the Jointing Stage of Wheat. Antioxidants 2024, 13, 1451. [Google Scholar] [CrossRef] [PubMed]
  26. Zhang, F.; Jiang, N.; Zhang, H.; Huo, Z.; Yang, Z. Effect of Low Temperature on Photosynthetic Characteristics, Senescence Characteristics, and Endogenous Hormones of Winter Wheat “Ji Mai 22” during the Jointing Stage. Agronomy 2023, 13, 2650. [Google Scholar] [CrossRef]
  27. Zhao, D.; Zeng, J.; Liu, D.; Tian, Y.; Sani, S.R.; Xu, X.; Hao, Y.; He, Z.; Wang, C.; Yang, L.; et al. Identification of genetic loci for powdery mildew resistance in bread wheat. Crop Sci. 2023, 63, 2941–2951. [Google Scholar] [CrossRef]
  28. Li, M.; Jiang, F.; Huang, L.; Wang, H.; Song, W.; Zhang, X.; Zhang, Y.; Niu, L. Optimization of In Vitro Germination, Viability Tests and Storage of Paeonia ostii Pollen. Plants 2023, 12, 2460. [Google Scholar] [CrossRef]
  29. Jiang, M.; Xuan, S.; Muneer, M.A.; Sun, B.; Shi, C.; Liu, F.; Wu, R. Response of dry matter partition and yield components to waterlogging and sunlight shortage in different growth stages of wheat. Nat. Hazards 2022, 110, 1133–1152. [Google Scholar] [CrossRef]
  30. Xu, X.; Zhang, M.; Li, J.; Liu, Z.; Zhao, Z.; Zhang, Y.; Zhou, S.; Wang, Z. Improving water use efficiency and grain yield of winter wheat by optimizing irrigations in the North China Plain. Field Crops Res. 2018, 221, 219–227. [Google Scholar] [CrossRef]
  31. Xu, H.; Hassan, M.A.; Sun, D.; Wu, Z.; Jiang, G.; Liu, B.; Ni, Q.; Yang, W.; Fang, H.; Li, J.; et al. Effects of Low Temperature Stress on Source–Sink Organs in Wheat and Phosphorus Mitigation Strategies. Front. Plant Sci. 2022, 13, 807844. [Google Scholar] [CrossRef]
  32. Li, J.; Guo, H.; Lou, Q.; Zeng, Y.; Guo, Z.; Xu, P.; Gu, Y.; Gao, S.; Xu, B.; Han, S.; et al. Natural variation of indels in the CTB3 promoter confers cold tolerance in japonica rice. Nat. Commun. 2025, 16, 1613. [Google Scholar] [CrossRef]
  33. Wu, L.Q.; Cai, Z.H.; Zhang, G.L.; Liu, Y.T.; Zhao, R. Effects of low temperature on physiological characteristics of rice seedlings with different cold tolerance and anatomical structure of root tip. Chin. J. Agrometeorol. 2018, 39, 805–813. [Google Scholar] [CrossRef]
  34. Yang, L.; Li, Y.; Wang, J.Q.; Zhang, A.M.; Huang, Z.L.; Ma, S.Y.; Fan, Y.H.; Zhang, W.J. Effects of Low Temperature during Panicle Development on Wheat Panicle Development and Yield. Acta Agric. Nucl. Sin. 2022, 36, 2490–2500. [Google Scholar] [CrossRef]
  35. EL Sabagh, A.; Islam, M.S.; Skalicky, M.; Ali Raza, M.; Singh, K.; Anwar Hossain, M.; Hossain, A.; Mahboob, W.; Iqbal, M.A.; Ratnasekera, D.; et al. Salinity Stress in Wheat (Triticum aestivum L.) in the Changing Climate: Adaptation and Management Strategies. Front. Agron. 2021, 3, 661932. [Google Scholar] [CrossRef]
  36. Shokat, S.; Großkinsky, D.K.; Roitsch, T.; Liu, F. Activities of leaf and spike carbohydrate-metabolic and antioxidant enzymes are linked with yield performance in three spring wheat genotypes grown under well-watered and drought conditions. BMC Plant Biol. 2020, 20, 400. [Google Scholar] [CrossRef]
  37. Saleem, M.; Fariduddin, Q.; Janda, T. Multifaceted Role of Salicylic Acid in Combating Cold Stress in Plants: A Review. J. Plant Growth Regul. 2021, 40, 464–485. [Google Scholar] [CrossRef]
  38. Fahad, S.; Ihsan, M.Z.; Khaliq, A.; Daur, I.; Saud, S.; Alzamanan, S.; Nasim, W.; Abdullah, M.; Khan, I.A.; Wu, C.; et al. Consequences of high temperature under changing climate optima for rice pollen characteristics-concepts and perspectives. Arch. Agron. Soil Sci. 2018, 64, 1473–1488. [Google Scholar] [CrossRef]
  39. Jiang, L.N.; Zhang, D.J.; Lin, L.; Shao, Y.; Yu, H.B.; Li, C.X. Effects of Low Temperature on Dry Matter Accumulation and Root Exudates of Wheat Seedlings. J. Triticeae Crops. 2012, 32, 1171–1176. [Google Scholar]
  40. Ke, Y.Y.; Chen, X.; Ni, Q.Q.; Zhang, L.L.; Liu, L.Z.; Xu, H.; Wei, F.Z.; Li, J.C. Research Progress of the Metabolism of Reactive Oxygen Species and Its Regulation Mechanisms in Wheat under Low Temperature Stress. Barley Cereal Sci. 2021, 38, 1–6+21. [Google Scholar] [CrossRef]
  41. Wang, W.; Wang, X.; Huang, M.; Cai, J.; Zhou, Q.; Dai, T.; Jiang, D. Alleviation of Field Low-Temperature Stress in Winter Wheat by Exogenous Application of Salicylic Acid. J. Plant Growth Regul. 2021, 40, 811–823. [Google Scholar] [CrossRef]
  42. Yu, M.; Chen, H.; Mao, S.-L.; Dong, K.-M.; Hou, D.-B.; Chen, G.-Y. Contribution of photosynthetic- and yield-related traits towards grain yield in wheat at the individual quantitative trait locus level. Biotechnol. Biotechnol. Equip. 2020, 34, 1188–1197. [Google Scholar] [CrossRef]
  43. Miao, Y.; Yan, J.; Zhao, D.; Tian, Y.; Yan, J.; Xia, X.; Zhang, Y.; He, Z. Relationship between Grain Filling Parameters and Grain Weight in Leading Wheat Cultivars in the Yellow and Huai Rivers Valley. Acta Agron. Sin. 2018, 44, 260–267. [Google Scholar] [CrossRef]
  44. Du, S.; Qiao, Y.; Li, W.; Chen, H.; Zhao, Z.; Zhang, X.; Cao, C. Effects of sowing date and rate on grain filling characteristics of winter wheat under chilling injury. Chin. J. Eco-Agric. 2014, 22, 551–559. [Google Scholar]
  45. Agurla, S.; Gahir, S.; Munemasa, S.; Murata, Y.; Raghavendra, A.S. Mechanism of Stomatal Closure in Plants Exposed to Drought and Cold Stress. Adv. Exp. Med. Biol. 2018, 1081, 215–232. [Google Scholar] [CrossRef] [PubMed]
  46. Nasehzadeh, M.; Ellis, R.H. Wheat seed weight and quality differ temporally in sensitivity to warm or cool conditions during seed development and maturation. Ann. Bot. 2017, 120, 479–493. [Google Scholar] [CrossRef]
  47. Zhao, K.; Tao, Y.; Liu, M.; Yang, D.; Zhu, M.; Ding, J.; Zhu, X.; Guo, W.; Zhou, G.; Li, C. Does temporary heat stress or low temperature stress similarly affect yield, starch, and protein of winter wheat grain during grain filling? J. Cereal Sci. 2022, 103, 103408. [Google Scholar] [CrossRef]
  48. Wang, R.; Yan, C.; Zhan, X.; Sun, G.; Qian, Z.; Qi, X.; Mou, Q.; Xiao, S. Effect of low temperature in spring on yield and photosynthetic characteristics of wheat. Acta Agron. Sin. 2018, 44, 288–296. [Google Scholar] [CrossRef]
  49. Hassan, M.A.; Xiang, C.; Farooq, M.; Muhammad, N.; Yan, Z.; Hui, X.; Yuanyuan, K.; Bruno, A.K.; Lele, Z.; Jincai, L. Cold Stress in Wheat: Plant Acclimation Responses and Management Strategies. Front. Plant Sci. 2021, 12, 676884. [Google Scholar] [CrossRef]
  50. Yuan, G.; Wang, Y.; Yuan, S.; Wang, P.; Duan, W.; Bai, J.; Sun, H.; Wang, N.; Zhang, F.; Zhang, L.; et al. Functional Analysis of Wheat TaPaO1 Gene Conferring Pollen Sterility Under Low Temperature. J. Plant Biol. 2018, 61, 25–32. [Google Scholar] [CrossRef]
  51. Aya, K.; Ueguchi-Tanaka, M.; Kondo, M.; Hamada, K.; Yano, K.; Nishimura, M.; Matsuoka, M. Gibberellin modulates anther development in rice via the transcriptional regulation of GAMYB. Plant Cell 2009, 21, 1453–1472. [Google Scholar] [CrossRef]
  52. Sakata, T.; Oda, S.; Tsunaga, Y.; Shomura, H.; Kawagishi-Kobayashi, M.; Aya, K.; Saeki, K.; Endo, T.; Nagano, K.; Kojima, M.; et al. Reduction of Gibberellin by Low Temperature Disrupts Pollen Development in Rice. Plant Physiol. 2014, 164, 2011–2019. Available online: https://pubmed.ncbi.nlm.nih.gov/24569847/ (accessed on 18 March 2025). [CrossRef] [PubMed]
  53. Zhang, W.; Zhao, Y.; Li, L.; Xu, X.; Yang, L.; Luo, Z.; Wang, B.; Ma, S.; Fan, Y.; Huang, Z. The Effects of Short-Term Exposure to Low Temperatures During the Booting Stage on Starch Synthesis and Yields in Wheat Grain. Front. Plant Sci. 2021, 12, 684784. [Google Scholar] [CrossRef]
  54. Scheres, B.; van der Putten, W.H. The plant perceptron connects environment to development. Nature 2017, 543, 337–345. [Google Scholar] [CrossRef] [PubMed]
  55. Wang, S.; Zhang, G.; Zhang, Y.; Song, Q.; Chen, Z.; Wang, J.; Guo, J.; Niu, N.; Wang, J.; Ma, S. Comparative studies of mitochondrial proteomics reveal an intimate protein network of male sterility in wheat (Triticum aestivum L.). J. Exp. Bot. 2015, 66, 6191–6203. [Google Scholar] [CrossRef]
  56. Cai, D.; Shoukat, M.R.; Zheng, Y.; Tan, H.; Sun, M.; Yan, H. Improving Wheat Grain Yield and Nitrogen Use Efficiency by Optimizing the Fertigation Frequency Using Center Pivot Irrigation System. Water 2023, 15, 1932. [Google Scholar] [CrossRef]
Figure 1. Temperature variations in the field from 1 to 5 days after wheat anthesis.
Agronomy 15 00761 g001
Figure 2. Diurnal temperature variation of the artificial climatic chamber during the experiments.
Agronomy 15 00761 g002
Figure 3. Effect of low-temperature stress on wheat ‘Jimai 22’ dry matter accumulation at anthesis. Note: The short line indicates the standard error. Different lowercase letters represented significant differences in dry matter accumulation in other treatments (p < 0.05) by the Duncan test. The same as below.
Agronomy 15 00761 g003
Figure 4. Effect of low-temperature stress on wheat ‘Jimai 22’ dry matter distribution at anthesis. Note: The short line indicates the standard error. Different lowercase letters represented significant differences in dry matter accumulation in other treatments (p < 0.05) by the Duncan test.
Agronomy 15 00761 g004
Figure 5. Pre-anthesis dry matter translocation and contribution to grains in different low-temperature treatments of wheat ‘Jimai 22’. Note: PTA: pre-anthesis translocation amount; CPT: contribution of pre-anthesis translocation to grains. The short line indicates the standard error. Different lowercase letters represented significant differences in dry matter accumulation in other treatments (p < 0.05) by the Duncan test.
Agronomy 15 00761 g005
Figure 6. Amount of wheat ‘Jimai 22’ post-anthesis dry matter assimilated and its contribution to seeds in different low-temperature treatments. Note: PAA: post-anthesis accumulation amount; CPA: contribution of post-anthesis accumulation to grains. The short line indicates the standard error. Different lowercase letters represented significant differences in dry matter accumulation in other treatments (p < 0.05) by the Duncan test.
Agronomy 15 00761 g006
Figure 7. The contribution rates of temperature treatment (T) and duration of exposure (D) on wheat ‘Jimai 22’ dry matter accumulation, partitioning, and translocation. Note: contribution rate (%) = SSF × 100/(SST-SSE-SSB). SSF refers to the sum of squares away from the mean difference. SST, SSE, and SSB denote the sum of squares for total, error, and block, respectively. T and D represent temperature treatment and days of exposure duration. SLA: stem-sheath dry matter accumulation; LA: leaf dry matter accumulation; SGA: spike axis+glume dry matter accumulation; GA: grain dry matter accumulation; SLR: stem-sheath dry matter allocation ratio; LR: leaf dry matter allocation ratio; SGR: spike axis+glume dry matter allocation ratio; GR: grain dry matter allocation ratio; PTA: pre-anthesis translocation amount; CPT: contribution of pre-anthesis translocation to grains; PAA: post-anthesis accumulation amount; CPA: contribution of post-anthesis accumulation to grains.
Agronomy 15 00761 g007
Figure 8. Effect of low-temperature stress on the variation process of thousand grain weight of wheat ‘Jimai 22’ grain at anthesis stage.
Agronomy 15 00761 g008
Figure 9. Effect of different temperature treatments on the variation process of wheat ‘Jimai 22’ grain-filling rate.
Agronomy 15 00761 g009
Figure 10. Effect of different temperature treatments on the average and maximum grouting rate of wheat ‘Jimai 22’ grain. Note: The short line indicates the standard error. Different lowercase letters represented significant differences in dry matter accumulation in other treatments (p < 0.05) by the Duncan test.
Agronomy 15 00761 g010
Figure 11. Effect of different temperature treatments on the duration of the wheat ‘Jimai 22’ grain-filling period. Note: Δt1 means duration of the asymptotic period; Δt2 means duration of the fast-increasing period; Δt3 means duration of the slow-increasing period. The short line indicates the standard error. Different lowercase letters represented significant differences in dry matter accumulation in other treatments (p < 0.05) by the Duncan test.
Agronomy 15 00761 g011
Figure 12. Effect of different temperature treatments on the wheat ‘Jimai 22’ theoretical maximum thousand-grain weight of wheat. Note: The short line indicates the standard error. Different lowercase letters represented significant differences in dry matter accumulation in other treatments (p < 0.05) by the Duncan test.
Agronomy 15 00761 g012
Figure 13. The contribution rates of temperature treatment (T) and duration of exposure (D) on wheat ‘Jimai 22’ grain-filling characteristics of wheat grains.
Agronomy 15 00761 g013
Figure 14. The contribution rates of temperature treatment (T) and duration of exposure (D) on wheat ‘Jimai 22’ yield components.
Agronomy 15 00761 g014
Table 1. Different temperature treatments.
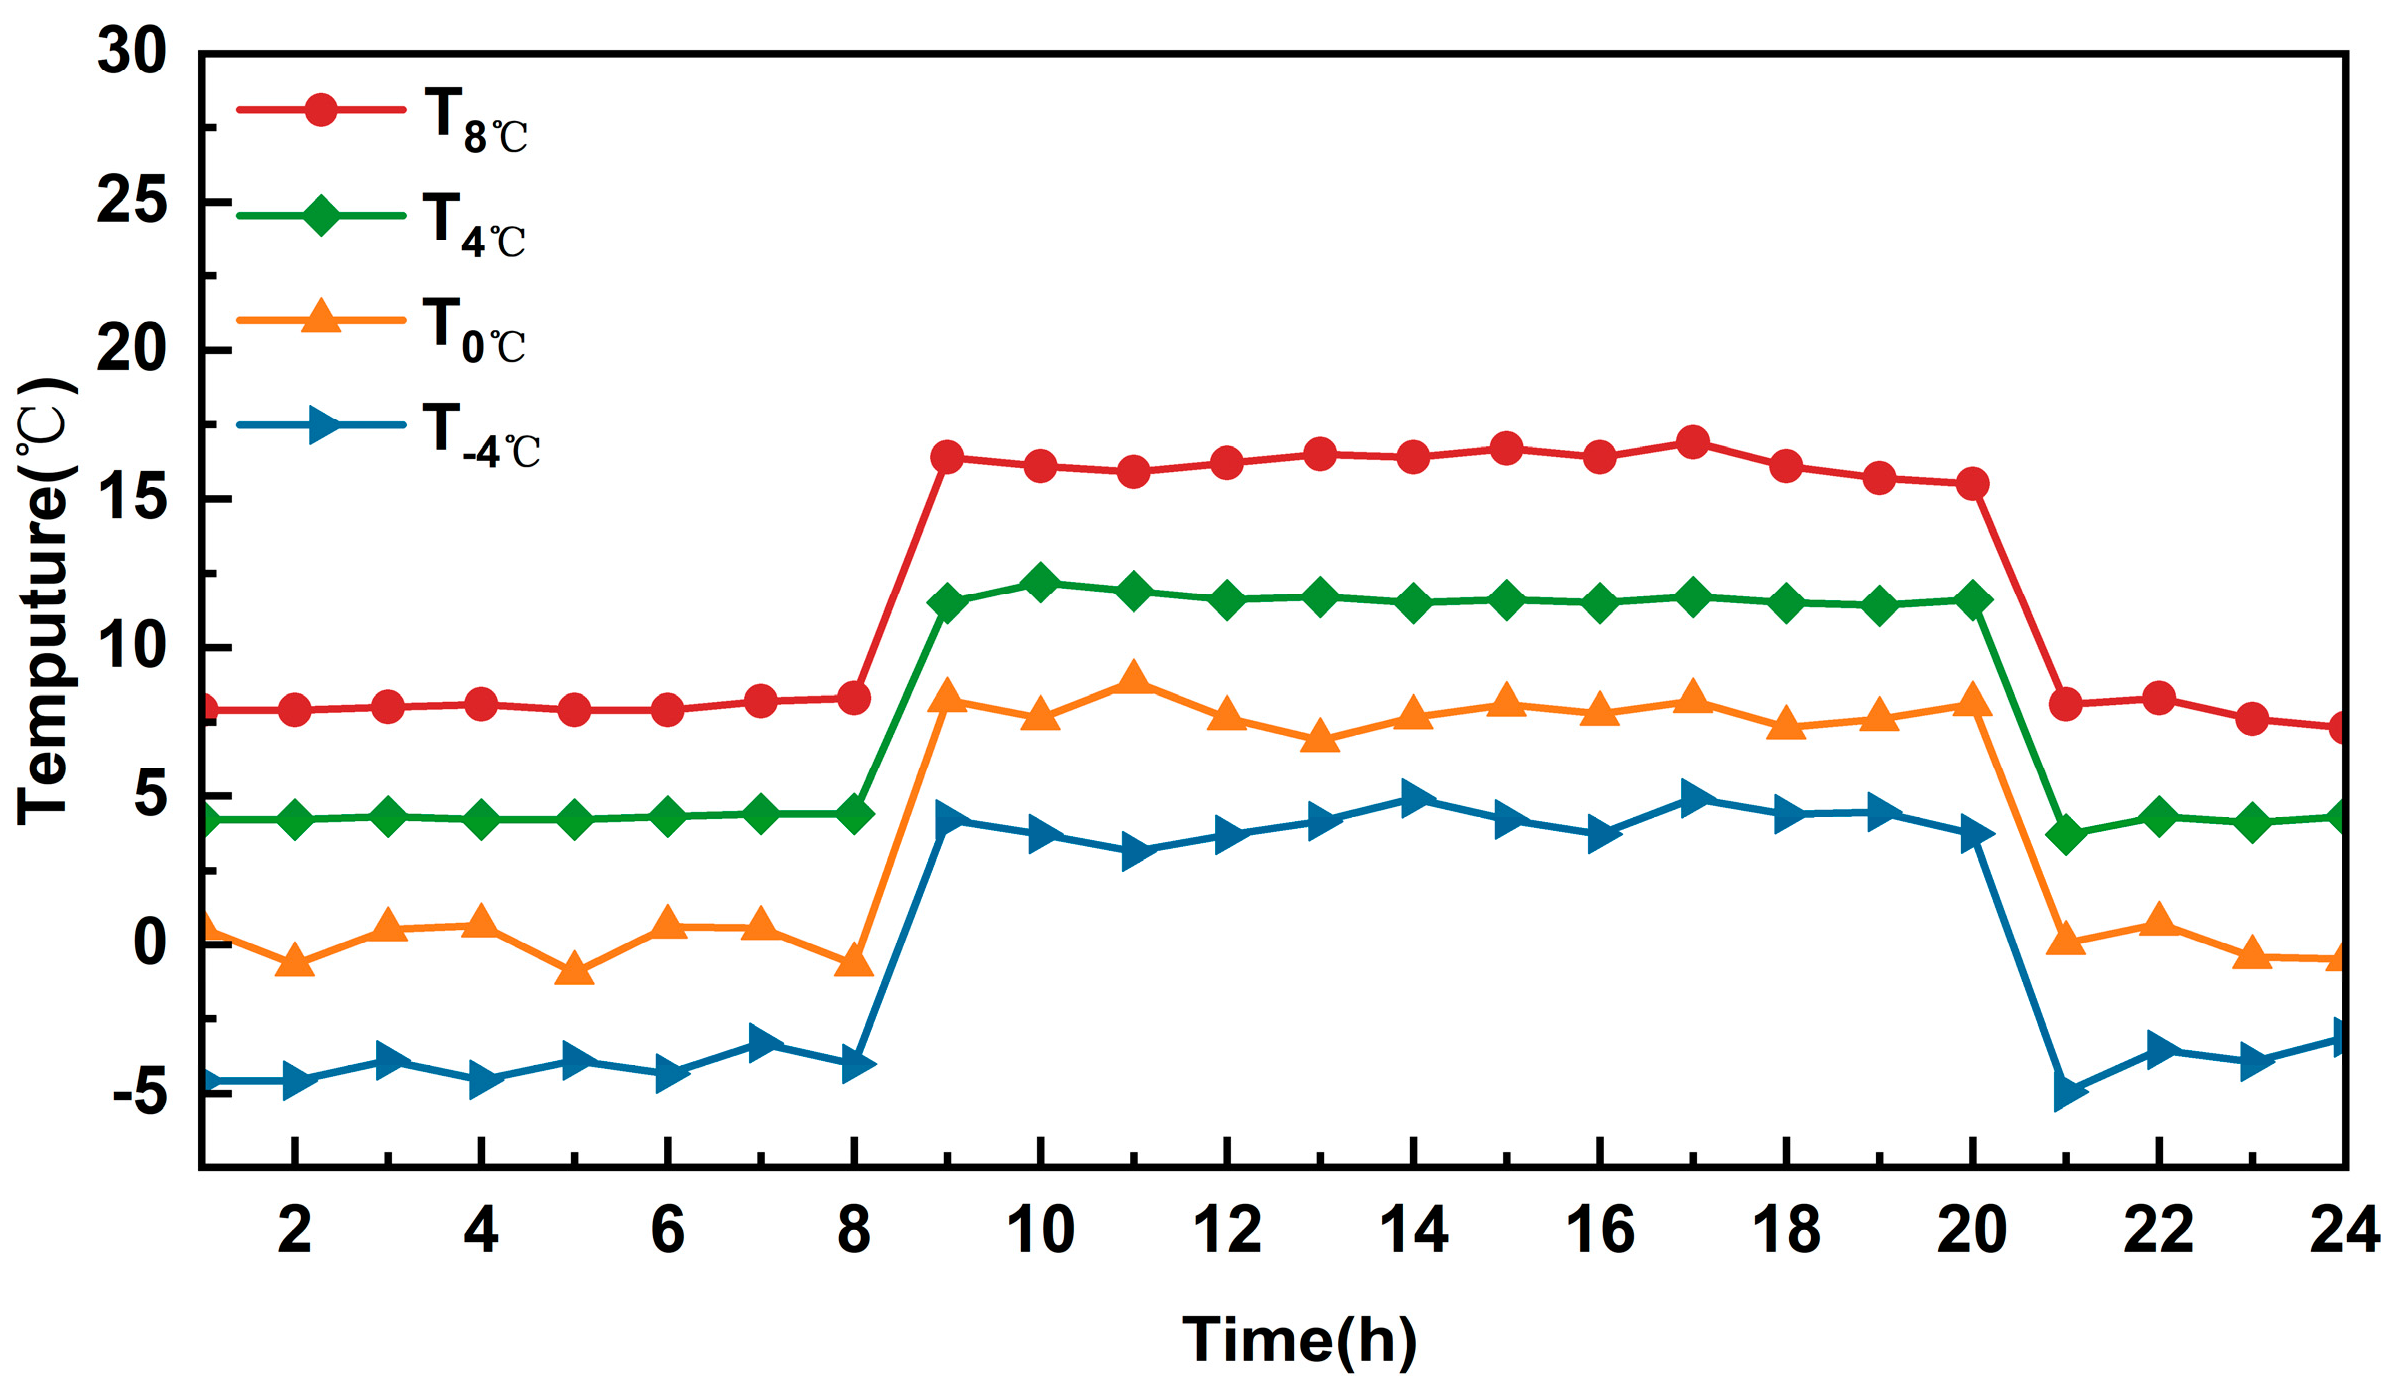
Temperature (℃)
(Daytime 8:00–20:00/Night-time 20:00–8:00)
Duration of Days
(d)
CK (22/12)---
T8 °C (16/8)D1(1)
T4 °C (12/4)D1(1)
T0 °C (8/0)D1(1)
T−4 °C (4/−4)D1(1)
T8 °C (16/8)D3(3)
T4 °C (12/4)D3(3)
T0 °C (8/0)D3(3)
T−4 °C (4/−4)D3(3)
T8 °C (16/8)D5(5)
T4 °C (12/4)D5(5)
T0 °C (8/0)D5(5)
T−4 °C (4/−4)D5(5)
Table 2. Logistic fitting equations for different temperature treatments for the wheat ‘Jimai 22’ grain-filling process.
Duration of Days (d)Temperature (°C)EquationR2
D1CK W = 46.07 / ( 1 + 11.98 e 0.17 t ) 0.98
T8 °C W = 37.50 / ( 1 + 26.35 e 0.21 t )0.99
T4 °C W = 35.47 / ( 1 + 19.30 e 0.17 t ) 0.98
T0 °C W = 33.55 / ( 1 + 16.43 e 0.19 t ) 0.97
T−4 °C W = 31.25 / ( 1 + 34.76 e 0.24 t ) 0.99
D3T8 °C W = 32.95 / ( 1 + 17.96 e 0.21 t ) 0.99
T4 °C W = 32.77 / ( 1 + 14.51 e 0.17 t ) 0.97
T0 °C W = 28.72 / ( 1 + 17.58 e 0.19 t ) 0.97
T−4 °C W = 16.27 / ( 1 + 23.67 e 0.28 t ) 0.99
D5T8 °C W = 31.52 / ( 1 + 23.18 e 0.22 t ) 0.99
T4 °C W = 31.16 / ( 1 + 12.27 e 0.17 t ) 0.96
T0 °C W = 30.60 / ( 1 + 12.70 e 0.15 t ) 0.94
T−4 °C W = 13.68 / ( 1 + 21.38 e 0.32 t ) 0.98
Note: D1, D3, and D5 represent the duration of low-temperature exposure, corresponding to 1 day, 3 days, and 5 days, respectively. T8 °C, T4 °C, T0 °C, and T−4 °C denote the low-temperature levels, which correspond to the temperature conditions of 16 °C/8 °C, 12 °C/4 °C, 8 °C/0 °C, and 4 °C/−4 °C, respectively, the same as below.
Table 3. Wheat ‘Jimai 22’ yield components of different low-temperature treatments.
Duration of Days (d)Temperature (°C)Pollen Abortion Rate (%)Number of Grains (pcs)Grain Weight
(g·spike−1)
D1CK6.60 ± 0.52 g47.67 ± 2.87 a2.20 ± 0.16 a
T8 °C9.57 ± 1.13 g38.80 ± 2.80 b1.32 ± 0.27 bc
T4 °C14.04 ± 4.31 ef35.47 ± 3.13 bc1.10 ± 0.06 cd
T0 °C18.59 ± 1.91 cd31.27 ± 3.60 cd1.03 ± 0.02 cd
T−4 °C22.93 ± 2.70 ab29.20 ± 3.42 de0.90 ± 0.11 f
D3T8 °C11.96 ± 0.50 f39.40 ± 3.26 b1.02 ± 0.0 cd
T4 °C15.19 ± 1.86 ef35.60 ± 2.42 bc1.01 ± 0.08 de
T0 °C19.23 ± 1.53 bc31.87 ± 1.15 cd0.97 ± 0.01 ef
T−4 °C22.01 ± 3.43 ab25.00 ± 1.15 e0.59 ± 0.10 g
D5T8 °C13.03 ± 1.29 f38.60 ± 1.6 b0.96 ± 0.07 cd
T4 °C16.86 ± 2.01 de34.27 ± 3.60 bc0.87 ± 0.16 de
T0 °C20.08 ± 0.40 ab30.07 ± 3.47 cd0.74 ± 0.13 ef
T−4 °C23.26 ± 1.26 a22.87 ± 4.05 e0.38 ± 0.01 g
Note: The values in the table represent the mean ± standard deviation. Different lowercase letters represented significant differences in dry matter accumulation in other treatments (p < 0.05) by the Duncan test.
Disclaimer/Publisher’s Note: The statements, opinions and data contained in all publications are solely those of the individual author(s) and contributor(s) and not of MDPI and/or the editor(s). MDPI and/or the editor(s) disclaim responsibility for any injury to people or property resulting from any ideas, methods, instructions or products referred to in the content.

