Abstract
Intensive and large-scale drip irrigation plays a crucial role in ensuring cotton production in Northwest China. However, significant differences in cotton production have occurred at times within large-scale irrigation systems, and quantitative information on the importance and interactions of factors related to cotton growth and constraints is scarce. In 2018–2019, we monitored six possible constraints (irrigation depth, soil texture, soil salt, soil moisture, soil inorganic nitrogen and soil organic matter) associated with drip irrigation management and seed cotton yields in a collective drip irrigation system (CDIS, composed of several drip irrigation subsystems (DISs)) in southern Xinjiang to assess the importance of different factors and identify the main constraints. In 2023, other more refined field trials were conducted to further evaluate the influencing mechanism of the main constraints on crop growth in one typical DIS within the selected CDIS. The results revealed large yield differences within the CDIS; although the average seed cotton yield was good (2018: 8051 kg ha−1, 2019: 6617 kg ha−1). Excessive irrigation depths (>500 mm) and coarse soil texture (sand content > 70%) were identified as the main constraints, affecting more than 45% of the plant area in the CDIS based on boundary line analysis (a typical analysis method to study the responses between variables) The results from the DISs revealed that the two constraints directly affected the soil moisture and soil inorganic nitrogen in the root zone, which reduced the effectiveness of irrigation and fertilization under drip irrigation. The Structural Equation Model (used to evaluate the causal relationships among multiple variables) revealed that both irrigation depth and soil texture indirectly affect yield by affecting soil inorganic nitrogen and plant N uptake and that soil nitrogen management is critical in resisting yield decline caused by constraints. An optimized irrigation schedule, improved uniformity of the drip irrigation network and adjusted drip fertilization strategies could be used for site-specific management to address the yield decline due to the main constraints and improve water and fertilizer use efficiency under drip irrigation management.
1. Introduction
China is the largest cotton production, consumption and importing country in the world [1]. Owing to its abundant light and heat resources, Xinjiang is the dominant cotton-producing region, and approximately 90% of the cotton in China is produced in this area [2]. However, this region often suffers from low precipitation (<270 mm), high evaporation (>1000 mm) and the comparatively frequent occurrence of extreme drought, which restricts the development of cotton production in Xinjiang [3].
Drip irrigation is an effective technology for achieving crop intensification and conserving irrigation water and has been widely used as a primary measure to cope with regional drought and water shortages in cotton production [4,5]. Currently, the area of fields planted with cotton under drip irrigation management in Xinjiang exceeds 2 million hectares, accounting for more than half of the farmland used for cotton cultivation in China, and approximately 50% of farmers in Xinjiang are engaged in cotton production [6]. Overall, the application of drip irrigation technology has significantly promoted the development of agricultural cotton production in Xinjiang. It has been reported that drip irrigation has increased seed cotton yield by as much as 30% while saving up to half of the irrigation water [7].
With the development of intensive agriculture in Xinjiang, a collective drip irrigation system (CDIS), which involves multiple drip irrigation subsystems (DISs) owned by different farmers, has become the most common management mode [8]. On relatively large-scale farmland, plant growth usually shows spatial variability caused by multiple and interacting production constraints [9]. Numerous studies in Xinjiang have focused on the influence of single constraints, such as irrigation water salinity and insect pests, on agricultural production [10,11]. However, these studies are usually plot tests in a small field, which may not necessarily be representative of the region. Furthermore, how to partition the impacts of the different constraints on yield is another important issue, and initiatives to increase productivity should focus on conquering the most significant obstacles simultaneously. Boundary line analysis, as introduced by Webb [12], might generate additional insights into the function of constraints in limiting crop yields. This method assumes that there are no interactions between the constraints; thus, it is used to analyze the response of yield to one specific factor among the many constraints that affect yield [13]. Currently, this method is widely used to analyze the relationship between soil nutrients/agronomic practices and crop yield [14]. Wairegi et al. [15] evaluated the influence of 12 abiotic and override biotic constraints on banana production and identified the primary constraints on central, southern and southwestern farmland. Wang et al. [16] directly evaluated the relative importance of individual coffee production constraints via boundary line analysis and identified constraints in eastern, southwestern, and northwestern Uganda, as well as region-specific management practices. Identifying the main constraint factors associated with drip cotton production is helpful for understanding yield variation and increasing field management within a relatively large CDIS.
Drip irrigation can increase yield and the efficiency of water and fertilizer application; however, its superiority may not be realized because of several constraints, in which the effects of management (i.e., irrigation and fertilization schedules) and soil properties have received increased attention [17]. Research has demonstrated that shortages of irrigation and nitrogen fertilization are the main constraints on cotton production in Xinjiang [18]. Unreasonable water and fertilizer management results in fluctuations in crop yield, whereas excessive irrigation and fertilization can increase the risk of soil degradation and underground water pollution. Soil properties are another major cause of yield variability in terms of crop yield under drip irrigation management. In irrigation farming, crop growth may depend more on the variability of the soil property attributes that affect water holding capacity, drainage, and the field-scale water regime [19]. For example, soil texture may affect the distribution patterns of water and nutrients under drip irrigation, which eventually leads to yield variation [20]. Furthermore, efforts have focused on soil salt, initial soil moisture and available nitrogen, soil fertility, elevation and soil organic matter (SOM), due to their influence on crop growth under drip irrigation management [21]. Although the importance of these factors for drip irrigation planting has been emphasized, little information is available on cotton growth within relatively large-scale drip irrigation systems.
The purpose of this work was (i) to quantify the relative importance of possible constraints and identify the main factors affecting cotton production in the CDIS; (ii) to further evaluate the influencing mechanism of the main constraints on cotton growth through field trials in DISs; and (iii) to provide recommendations for drip irrigation management during cotton production.
2. Materials and Methods
2.1. Site Description
This study was carried out at the Soil and Water Conservation Monitoring Station of the First Division of the Xinjiang Production and Construction Corps (81°11′43″ E, 40°37′22″ N, altitude 1017 m above mean sea level). This area is characterized by a typical extremely arid climate with an average annual precipitation of 45.7 mm, an average annual evaporation of 2218 mm and an average annual temperature of 11.3 °C [22]. A HOBO Weather Station with an RX3000 data logger (Onset, Bourne, MA, USA) was installed within the study area for monitoring the meteorological information every 30 min (Figure 1). The total precipitation for the 2018, 2019 and 2023 cotton growing seasons was 41.6, 36.8 and 24.4 mm, respectively.
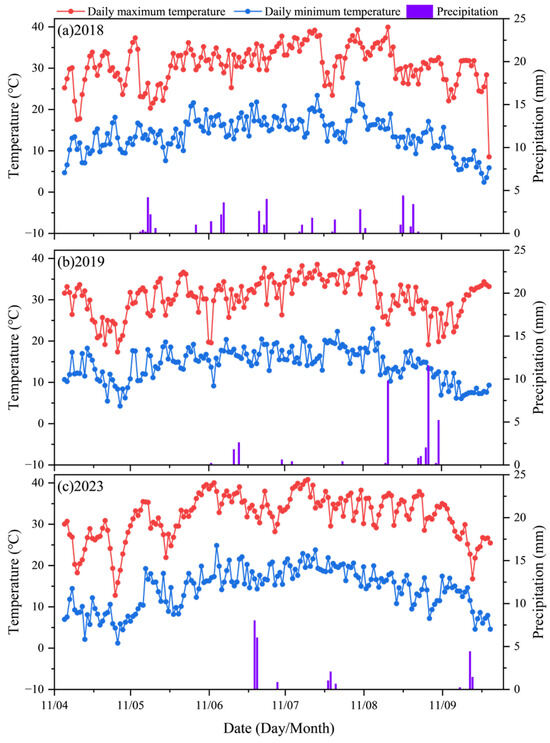
Figure 1.
Meteorological information of the study area during the cotton growing season in (a) 2018, (b) 2019 and (c) 2023.
The region of the station is characterized by arid irrigated agriculture with production dominated by cotton and jujube. The irrigation water derived from canals is pressurized by pumping stations, and then conveyed to farmlands through pressurized networks. The pressurized irrigation system, which comprises 28 hydrants designed to supply 320 m3 h−1 with a service pressure of 0.3 MPa, plays an important role in irrigated agricultural production in these regions. In the pumping station, centrifugal filters and disc filters (120 mesh) were installed to remove sand and particulate matter from the irrigation water, ensuring the quality of the irrigation water, and there were no additional filters installed in each DIS managed by the farmers. Drip irrigation is the most common type of on-farm irrigation system and is used for irrigation and fertilization of farmland. The drip tape used in field cultivation has a diameter of 16mm, with a distance between emitters of 20 cm and a mean nominal discharge rate of 3.5 L h−1 at 0.1 MPa. The CDIS of the station comprises 12 DISs of different sizes, and the total area is approximately 150 ha (Figure 2a). Based on the result of a field hydraulic performance assessment, the irrigation uniformity of the drip irrigation subunits within CDIS ranged from 80% to 86%, with a tendency to decrease as the irrigation progresses. In 2018 and 2019, part of the CDIS, which was used for cotton planting, was selected for the experiment, with total areas of 103.51 and 95.59 ha, respectively (Figure 2a). The sampling points were located in crop rows spaced on a regular 125 × 125 m grid, totaling 66 and 60 for the 2018 and 2019 growing seasons, respectively (Figure 2b). In 2023, the experiment was conducted on a typical DIS of 11.74 ha to further evaluate the response of cotton growth to constraint factors. The field contains 12 drip irrigation subunits, with 8 sampling points evenly distributed in each subunit. There were 96 sampling points in the 2023 experiment (Figure 2c). During the experimental period, soil and crop data were measured at each sampling point in the field for subsequent research and analysis.
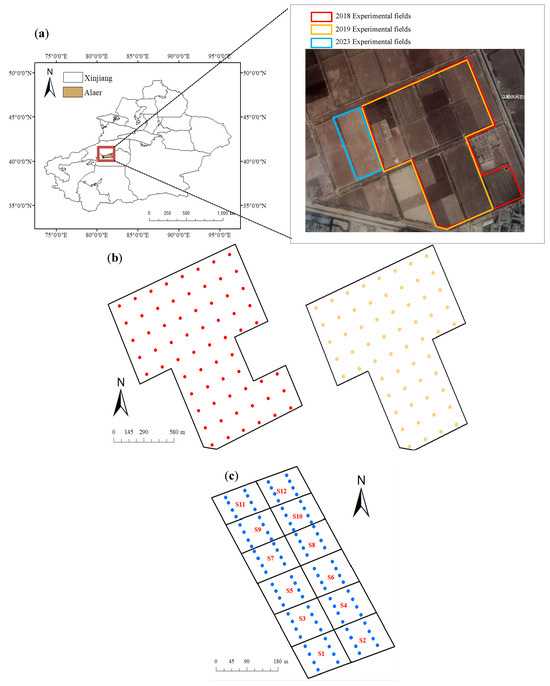
Figure 2.
Locations of the experimental drip irrigation system and the experimental fields over the three years (a). The sampling grid for the field experiment of the CDIS during 2018 and 2019 (b). Locations of the sampling points and coding of the subunits (S1–S12) in the DIS during the 2023 growing season (c). The farmland inside the red, orange and blue borderlines in Figure 1a represents the experimental fields in 2018, 2019 and 2023 respectively. The red, orange and blue solid circles in Figure 1b and 1c represent the sampling points in 2018, 2019 and 2023, respectively.
2.2. Crop Management
The study field was under cotton (Gossypium hirsutum L.) production during the three years of the experiment. The cotton was seeded between 15 and 20 April 2018 and 2019, and the seeding day in 2023 was 20 April. Mulched drip irrigation was used for cotton planting, and the field planting patterns were consistent across the three years. Regular weeding and insecticide spraying were performed during the growing season to ensure normal cotton growth. In early July, the experimental area was uniformly subjected to topping via drone-sprayed pesticides to optimize cotton yield. In late September, defoliant was uniformly applied via drone spraying to facilitate mechanical harvesting. The cotton was harvested mechanically in mid-October.
2.3. Data Collection
2.3.1. Irrigation Management and N Fertilizer Application
The irrigation period starts in approximately the middle of June and ends at the beginning of September. Local farmers are organized into an organization that is collectively responsible for the daily use, management and maintenance of the CDIS. Farmers submit the water request 7–10 days in advance, thereby determining the opening sequence of the intakes at the station distributed throughout a week to reduce head losses and provide the service with the maximum pressure. During the cotton growing season, the irrigation interval is generally 7 to 10 days, and the single irrigation volume ranges from approximately 40 to 54 mm. In 2018 and 2019, the irrigation schedule of the CDIS was obtained from technicians. During each irrigation event, the flow rate in the water conveyance pipes was measured using ultrasonic flow meters (YOKE, TUF-2000H). The total irrigation volume applied to the cotton fields during the growth period was calculated by multiplying the measured flow rate by the irrigation duration. In 2023, water meters and pressure gauges were installed at the inlet of each subunit’s manifold within the DIS to record the irrigation water volume and pressure information. Fertilization practices were unified in the experimental field according to local recommendations to maximize production. Before sowing, compound fertilizer (N–P2O5–K2O of 14–16–15) was applied at a rate of 155 kg ha−1. According to the field investigation, farmers top-dressed with nitrogen fertilizer (urea, 46% N) at each irrigation event. At the beginning of each irrigation event, the dissolved urea was applied through drip fertilization systems. During the bud stage (June), the amount of urea applied during each irrigation event was approximately 75 kg ha−1, and this amount increased to 108 kg ha−1 during the flowering stage (July) and boll opening stage (August). The total rate of urea used in cotton production was 1200 kg ha−1.
2.3.2. Soil Sampling and Laboratory Analyses
In May of 2018 and 2019 (the beginning of the cotton growing season), samples from the 0–40 cm soil layer were collected at each sampling point for analysis of the soil constraints studied in this work. The partial soil samples were used to assess the gravimetric water content via the oven-drying method, and the volumetric water content (soil moisture) was calculated by multiplying the gravimetric water content by the bulk density of the soil. The other parts of the soil samples were air-dried, crushed, sieved through a 2 mm sieve and then analyzed by an external laboratory to determine the other soil parameters. The soil textures (sand, silt and clay with grain sizes ranging from 50–2000, 2–50 and <2 µm, respectively) were analyzed via the laser diffraction method. The potassium dichromate method was used to determine the amount of soil organic matter (SOM). The soil samples (20 g) were extracted with 1 mol L−1 KCl (50 mL) before the soil inorganic nitrogen contents (NMin, nitrate and ammonium) were determined with an Auto Analyzer (Bran+Lubbe, Norderstedt, Germany). The soil salt (S, g kg−1) content was determined from the electrical conductivity of the 5:1 weight extract (EC5:1, dS m−1) via the empirical relationship established in the same experimental area by Lin et al. [21]:
In 2023, samples from five soil layers, i.e., 0–20, 20–40, 40–60, 60–80 and 80–100 cm, were collected at each sampling point within the DIS for analysis of the main soil parameters on the basis of the results of 2018 and 2019. Moreover, five sampling times were used (May, June, July, August and October) to evaluate the influence of constraints on cotton growth and soil water/fertilizer. The time to sample the soil was set as the second day after irrigation, and the soil moisture and NMin were determined as described above.
2.3.3. Plant Sampling and Measurements
Cotton plants were harvested in mid-October for the three seasons. For the measuring points on the farmland, 3 rows of 1 m long seed cotton in half pieces of mulch were harvested, weighed, and then recorded at each sampling point. Cotton harvesting was conducted three times to accurately assess yield. During each test, mature cotton bolls within the designated measurement area were manually picked. The number of harvested bolls was recorded and weighed to obtain precise weight measurements. At the end of the harvesting period, unopened cotton bolls were estimated based on the average weight of the harvested bolls per plant. The total yield was then calculated by integrating the data from all three harvests.
In 2023, three selected plants were collected from each sampling point by clipping the aboveground plant at the bud stage, the flowering stage, and the boll opening stage. The fresh samples were first oven-dried for 0.5 h at 105 °C, and then 70 °C until a constant weight was reached to determine the dry biomass (kg ha−1). The dry matter of the cotton plants was ground and sieved through 1 mm meshes for further nutrient uptake analysis. A Kjeltec Analyzer (Kjeltec 8400, Foss Inc., Hilleroed) was used to measure the total N content. The N uptake (kg ha−1) of cotton was determined by multiplying the N contents of the different plant parts by the biomass.
After cotton harvest, the irrigation water productivity (IWP, kg m−3) [23] and partial factor productivity of N fertilizer (PFPN, kg kg−1) [24] were calculated as follows:
where Y is the seed cotton yield (kg ha−1), I is the total amount of irrigation water (m3 ha−1) and NA is the N fertilizer applied (kg ha−1).
2.4. Data Analysis
2.4.1. Statistical Analysis
The mean, minimum, maximum, standard deviation and coefficient of variation were calculated for each variable via SPSS 20.0 software (SPSS Inc., Chicago, IL, USA, 2009). SPSS 20.0 was also used to assess the differences of seed cotton yield, IWP and PFPN between subunits using ANOVA (p < 0.05) and Student’s t test.
2.4.2. Boundary Line Analysis
Boundary line analysis (BLA) was first used in biological experiments by Webb [12] and is often used to analyze plant responses to environmental influences. In this work, BLA was used to investigate the relationship between seed cotton yield and constraints in the CDIS system. For each data set of constraints (x-axis) and yield (y-axis), the upper boundary points were built from scatter plots via the method developed by Schnug et al. [25]. The boundary lines that represented the maximum yield response to the various constraints were subsequently fitted through the upper boundary points of the data cloud via the model adapted by Fermont et al. [26]:
where Yatt is the highest yield attained in the CDIS, x is the constraint factor and K and R are constants. The best boundary line model was obtained by minimizing the root mean squared error (RMSE) between the fitted boundary line (Yp) and the boundary points. For each constraint (i = 1, 2, …, n) in each plot, the maximum yield that could be achieved (Yxi) was predicted via the boundary line function.
For the plots around each sampling point, the minimum predicted yield (Ymin) was determined according to von Liebig’s law of the minimum [27]. The law states that the yield is determined by the constraint factor present in the (relative) minimum amount; that yield will vary with changes in this attribute, until it is no longer the limiting factor, and that changes in other yield-influencing factors will not affect yield. Ymin is described as follows:
Finally, for each constraint studied in the CDIS, the number of plots in which it was identified as the most limiting was calculated for each region. This allowed the ranking of the most limiting factors per region, with the most important constraint being the factor that was most often identified as corresponding to Ymin.
2.4.3. Structural Equation Model
The causal connections and path mechanisms between variables can be explained by the Structural Equation Model (SEM). The SEM disassembles the direct and indirect effects among components and describes the interaction mechanisms utilizing the path directions in the structure diagram [28]. Based on the field trial in the DISs, we expected that the main constraint factors would affect cotton growth through direct correlations with soil moisture/fertilizer conditions under drip irrigation management. The SEM was used to reveal the effects of the mechanisms and paths of the main constraints on soil moisture/nitrogen dynamics, as well as cotton growth, to identify the most important link causing yield variation. The SEM was used to verify whether the causal relationships proposed on the basis of a priori knowledge matched the results of the DISs experiment. The IBM SPSS AMOS 24.0 (IBM Corp, Armonk, NY, USA) was used to perform the SEM analysis, and the comparative fit index (CFI), normal fit index (NFI) and the chi-square/degree of freedom ratio (CMIN/DF) were employed to test the adequacy of the fitted model [29,30].
3. Results
3.1. Identifying the Main Constraints in the CDIS
3.1.1. Constraints and Seed Cotton Yields
The study area has extremely low precipitation with amounts of 41.6 and 36.8 mm in cotton growing season of 2018 and 2019, respectively, and the amounts in the main water demand period (June to August) were 34 mm and 36 mm, respectively. The amount for an individual precipitation event was less than 10 mm; therefore, the water demand of cotton was completely met by irrigation. The distribution of irrigation depths in each field during the two years is shown in Figure 3. In 2018, the irrigation amount of the different fields ranged from 515 to 644 mm, and the range was 556 to 632 mm in 2019. According to the field investigation, the irrigation scheduling designed by the farmers was based on the use of empirical methods, which lead to spatial and temporal variations in irrigation depths. In general, the amount of irrigated farmland was large, and excessive irrigation was observed in some of the fields.
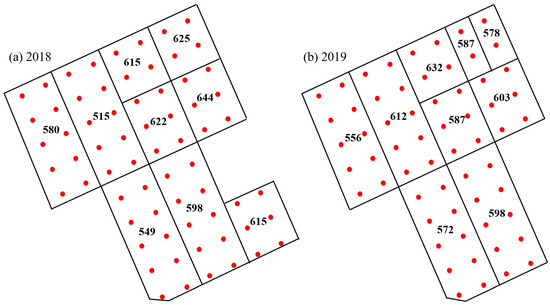
Figure 3.
Distribution of total irrigation depths applied in the fields of the CDIS in (a) 2018 and (b) 2019. The black number represents the actual cumulative irrigation depth (mm) of each DIS.
The soil factors within the root zone (0~40 cm) in the CDIS system are shown in Table 1. The CV of each soil factor varies between 21% and 73%, indicating moderate spatial variability [31]. The soil texture in the CDIS was mainly sandy loam and partly loamy sand according to the USDA soil classification. The mean values were as follows: SOM 8.65 g kg−1, sand 63%, silt 34%, initial soil moisture (2018) 0.17 cm3 cm−3, NMin (2018) 10.91 mg kg−1, soil salt (2018) 3.88 g kg−1, initial soil moisture (2019) 0.17 cm3 cm−3, NMin (2019) 6.18 mg kg−1 and soil salt (2019) 4.31 g kg−1. Owing to the subtle differences in spring irrigation management before sowing, there were interannual differences in soil moisture, NMin and soil salt.

Table 1.
Descriptive statistics of cotton yield and soil constraints (0–40 cm) in the CDIS system.
In 2018, the seed cotton yield varied between 4537 and 10,485 kg ha−1, with an average yield of 8051 kg ha−1 (Table 1). The yield declined slightly in 2019, where the range of cotton yield was 3694 to 9365 kg ha−1, and the average value was 6617 kg ha−1. The CVs of the seed cotton yields in the two years presented moderate spatial variability; however, a large yield gap was still observed between some sampling points.
3.1.2. The Responses of Cotton Production to the Constraints
Boundary regression lines were obtained between the constraints and seed cotton yield. The upper fitted lines represent the maximum yield (Yx) for every given level of the factors under consideration, and the points below the lines indicate the circumstances in which the crop yield was constrained by variables other than the factors under examination. The fitted lines of the study factors revealed similar trends between the two years. The data shown in Figure 4a,b indicate that the seed cotton yield decreased over the range of irrigation depths and that the boundary line presented a negative response to increasing in irrigation depth. Indeed, this response was strengthened as the irrigation depth exceeded 590 mm, which indicates that excessive irrigation inhibited cotton yield. Similarly, a negative relationship was also found for sand (Figure 4e,f) and soil salt (Figure 4m,n). The boundary line indicated that the strongest yield response occurred where the amount of sand (soil salt) exceeded 60% (6 g kg−1). To achieve higher yield potentials, these factors should be controlled within a reasonable range, through appropriate management measures, to reduce the risk of production reduction. Figure 4c,d shows that the relationship between yield and SOM was strong and initially positive up to reaching the attainable yield in the observed range. The boundary lines indicate that the positive response tapered off as the SOM content of 7 g kg−1 approached where the attainable yield was reached. The yields slightly increased (or stabilized) as the SOM content further increased. Similar results are also observed for silt (Figure 4g,h), soil moisture (Figure 4k,l) and NMin (Figure 4g). A strong positive yield response occurred when the soil silt, moisture and NMin contents were less than 40%, 0.20 cm3 cm−3 and 5 g kg−1, respectively. When the constraints are greater than the above values, the yields do not vary greatly because of the variable levels. In this interval, many of the yield fluctuations at the data points were attributable to other factors. Overall, for these factors (e.g., SOM, moisture or NMin), a very substantial content was not required to obtain higher yield potentials from a management standpoint.
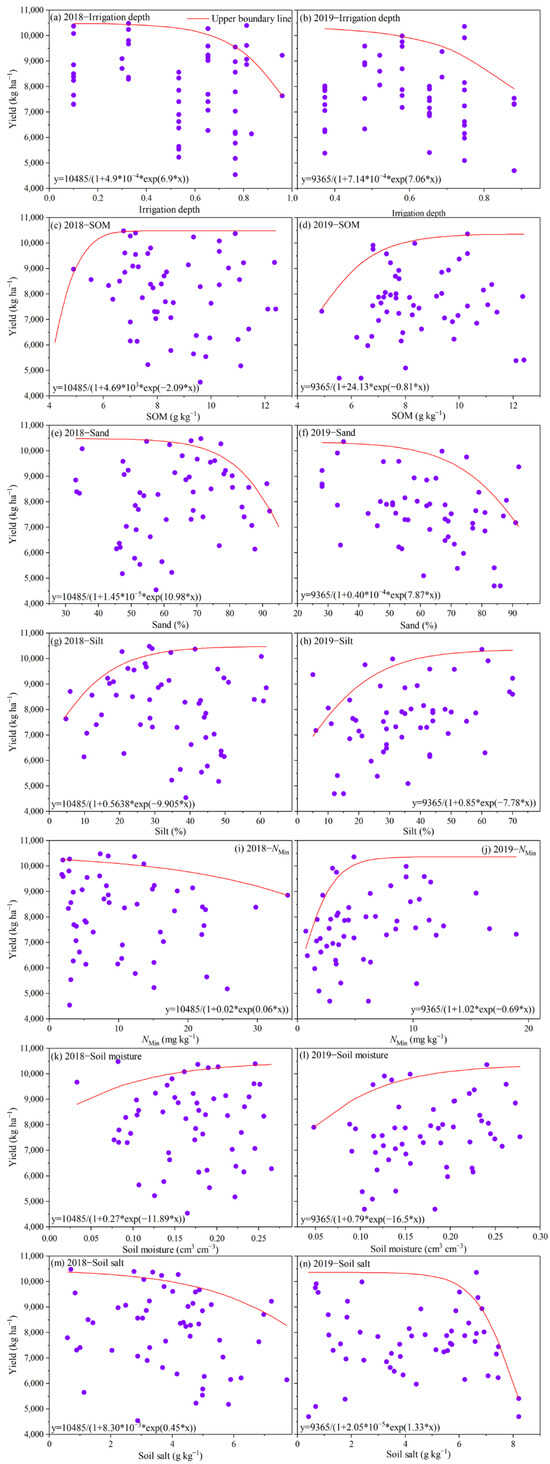
Figure 4.
Relationships between seed cotton yield and constraint factors in the CDIS. The lines represent the upper boundary lines. The boundary line equation is shown at the bottom of each figure. The irrigation data were normalized to the interval (0, 1), in which 0 and 1 represent irrigation depths of 500 and 650 mm, respectively. SOM represents the soil organic matter (g kg−1) and NMin represents soil inorganic nitrogen content (mg kg−1).
In 2018, irrigation depth was the primary constraint in 43% of the plots, followed by soil salt (23%), soil texture (15%), soil moisture (13%), NMin (4%) and SOM (2%) (Figure 5). In 2019, soil texture was the primary constraint in 26% of the plots, followed by irrigation depth (21%), NMin (17%), soil salt (15%), soil moisture (13%) and SOM (8%). The variation in the proportions of limiting factors between 2018 and 2019 was caused mainly by the differences in cotton irrigation and planting management between the two years. In general, the most important constraints affecting the growth of drip irrigation for cotton production in this region are irrigation depth and soil texture. These results indicated that a certain number of plots in the CDIS experienced a potential decline in productivity due to excessive irrigation depth and poor soil texture (exorbitant sand content). Moreover, soil salt appears to be an important limiting factor for seed cotton yield in some fields, and targeted management is needed to reduce salt damage in cotton.
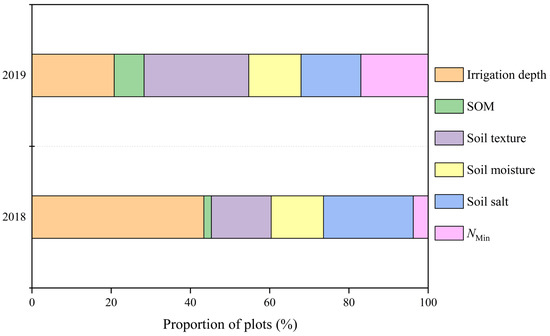
Figure 5.
Most limiting factors were identified via the boundary line approach and the corresponding proportion of plots (%) in which these factors were most limiting in the CDIS. SOM represents the soil organic matter and NMin represents the soil inorganic nitrogen content.
3.2. Influence of the Main Constraints on Cotton Growth
3.2.1. Soil Texture and Irrigation Management
The soil texture of the DISs was loamy sand with a greater sand content (Table 2). The average values of the sand, silt and clay contents were 76%, 23% and 1%, respectively. Moreover, there were differences in soil texture among the subunits (Figure 6a). The sand content decreased from south to north. The northern part of the farmland (S9–S11) had the highest sand content (>80%), whereas the silt and clay contents were highest in subunits S1–S4 (silt > 32%, clay > 1.8%).
Table 2.
Descriptive statistics of the soil texture of the DIS in 2023.
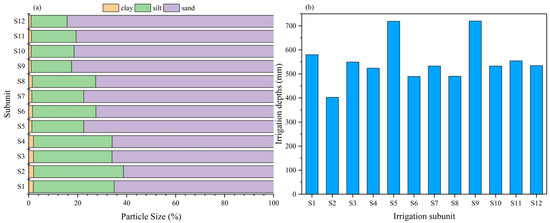
Figure 6.
Average soil particle size of the 0–40 cm soil layer (a) and cumulative irrigation depth of each subunit in the DIS during the 2023 growing season (b).
The number of irrigation events at the DIS was 14 and the mean total irrigation depth was 552 mm in the 2023 season. The subunit was the most basic unit of irrigation management during an irrigation event. After irrigation starts, farmers open the subunit valves according to a predetermined order, which guarantees that the irrigation duration of each subunit is equal. However, the irrigation depths of the subunits varied greatly due to differences in the hydraulic performance of the drip irrigation network. The seasonal irrigation depths of the subunits ranged from 403 to 720 mm with a maximum difference of 317 mm, in which S5 and S2 were the upper and lower limits, respectively (Figure 6b). The results indicated that there were still local excessive irrigation depths in a nominally uniformly managed DIS system.
3.2.2. Soil Moisture
The irrigation of the DIS system in the study started at the beginning of the bud stage (5 June) and ended at the middle of the boll opening stage (2 September), which lasted up to 90 days. The mean soil moisture of the different layers was maintained within a moderate range of 0.10–0.14 cm3 cm−3 (field capacity and wilting point are approximately 0.18 cm3 cm-3 and 0.04 cm3 cm−3, respectively) during the irrigation season and rapidly decreased to a lower level after irrigation ceased. The CV of soil moisture in the five layers varied between 18% and 65% (Table 3), indicating moderate variability. In addition, the CV increased with increasing irrigation depths. For example, the CV of the 0–20 cm layer at the seedling stage was 23%, which increased to 51% at the boll opening stage. This fact may be attributed to the decrease in hydraulic performance of the drip irrigation system with irrigation. The study area has a relatively high irrigation depth (>500 mm), which is accompanied by a long operating period of the drip irrigation system. The lack of filtration at the DIS level leads to sediment accumulation as irrigation progresses, reducing the water conveyance efficiency of the manifold/lateral, and further causing emitter clogging. This phenomenon has been documented by the study of Wang et al. [32], indicating a deterioration in system performance with time in this area, and the progressively increasing emitter clogging was a major reason for this phenomenon. This phenomenon eventually led to the nonuniform water distribution and aggravated the difference of soil moisture at the DIS level.
Table 3.
Descriptive statistics of soil moisture (cm3 cm−3) and soil inorganic nitrogen (mg kg−1) at different soil depths and different growth stages.
The differences in soil moisture (0–40 cm) between the 12 subunits are compared in Figure 7. The results revealed that the moisture decreased from south to north. Greater soil moisture was usually observed in the southern subunits (S1 to S4), whereas the moisture in the northern subunits (S9 to S12) was often lower. The variation in soil texture between subunits might be an important reason for this phenomenon, as the subunit with lower soil sand content could maintain higher soil moisture (visual estimation). Furthermore, the correlation between irrigation depth and soil moisture content was not obvious; i.e., a greater irrigation amount did not necessarily accompany increasing soil moisture. For example, in the boll opening stage, the highest moisture content was found in S2, in which the cumulative irrigation depth was the lowest (403 mm). However, the moisture contents of S5 (719 mm) and S9 (720 mm) were only 0.04 and 0.03 cm3 cm−3, respectively, and the differences among S2, S5 and S11 were significant (p = 0.05).
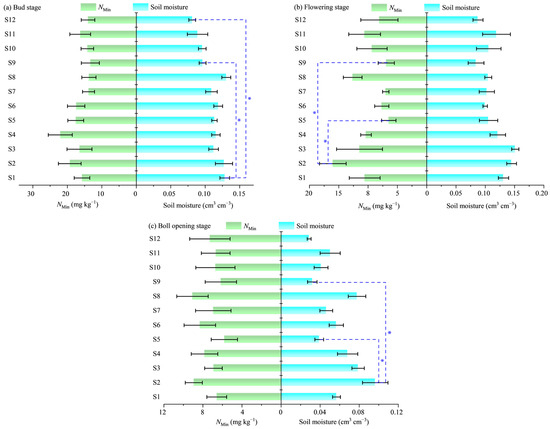
Figure 7.
Average soil moisture and NMin (0–40 cm) of the 12 subunits in (a) Bud stage, (b) Flowering stage and (c) Boll opening stage. * represents significant differences at p ≤ 0.05.
3.2.3. Soil Inorganic Nitrogen
The mean values of NMin in the five soil layers varied between 4.44 and 18.43 mg kg−1 during the different growth periods (Table 3). The 0–40 cm soil layer was the richest in NMin among the five soil layers. During the irrigation period, NMin decreased with time in the different layers, especially in the 0–40 cm layer. The CVs of NMin at all depths ranged from 37–111%, indicating moderate to high variability (Table 3).
As irrigation progressed, the NMin of the 12 subunits decreased. The difference in NMin reached a greater level among the subunits at the flowering stage (Figure 7). A negative correlation seems to exist between NMin and irrigation depth (visual estimation). The highest NMin was found in S2 (16.01 kg ha−1), with a cumulative irrigation depth of 267 mm, whereas the NMin values in S5 (566 mm) and S9 (546 mm) were only 6.48 and 6.90 kg ha−1, respectively. There was a significant difference (p = 0.05) between S2, S5 and S11. The phenomenon of variation in NMin could further lead to differences in the nutrient absorption and utilization mechanisms of cotton plants.
3.2.4. Cotton N Uptake
The cotton N uptake increased with the beginning of drip irrigation/fertilization at the bud stage and ended at the boll opening stage (chemical defoliation to inhibit plant growth for mechanized cotton harvesting), with the greatest growth margin occurring at the flowering to boll opening stage (Figure 8). The difference in cotton N uptake among the 12 subunits was obvious: S2 had the maximum average value of 586.03 kg ha−1 and the minimum value was found in S5, with an average cotton N uptake of 481.61 kg ha−1. The difference between the 12 subunits might be due to the difference in NMin, which affects plant nutrient uptake and further leads to differences in cotton growth.
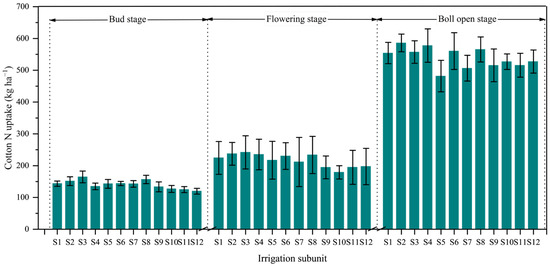
Figure 8.
Cotton N uptake of the 12 subunits during the irrigation period.
3.2.5. Yield, IWP and PFPN
The seed cotton yield varied between 4557 and 9678 kg ha−1 in the 2023 season (Figure 9a). The yield of the 12 subunits generally increased with decreasing irrigation depth in the study field. The maximum mean yield (8884 kg ha−1) was found in S2, where the irrigation depth was lowest (403 mm), whereas the yields of S5 (719 mm) and S9 (720 mm) were only 7136 and 7381 kg ha−1, respectively. In addition, IWP and PFPN presented similar trends in yield (Figure 9b). An increase in irrigation depth reduced the two indicators in the subunits, and both the maximum IWP (2.20 kg m−3) and PFPN (14.81 kg kg−1) occurred in S2. The IWPs of S5 and S9 were 0.99 and 1.02 kg m−3, respectively, and the PFPN values were 11.89 and 12.30 kg kg−1 respectively. There was a significant difference (p = 0.05) between S2, S5 and S11.
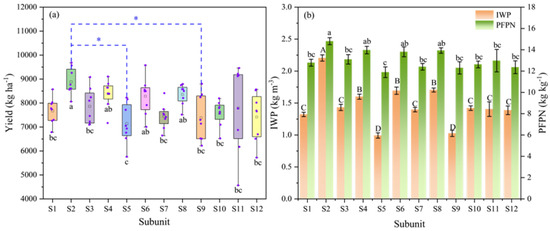
Figure 9.
Box plots of actual seed cotton yield (a). Irrigation water productivity (IWP) and nutrient partial factor productivity (PFPN) of the 12 subunits (b). For each region in Figure 9a, the three horizontal lines of the boxes indicate the 75% percentile (up), median (solid line across boxes) and 25% percentile (bottom) of seed cotton yields; the upper and bottom bars outside the boxes represent the maximum and minimum seed cotton yields, respectively. Different capital letters in the figure (A, B, C and D) indicate significant differences in IWP between subunits at p < 0.05. Different lowercase letters in the figure (a, b and c) indicate significant differences in PFPN between subunits at p < 0.05. * represents significant differences at p ≤ 0.05.
3.2.6. Comprehensive Analysis of the Factors Affecting Cotton Growth
Across the 12 subunits, cotton N uptake, yield, average soil moisture and NMin during the irrigation period were significantly correlated with soil texture (sand, silt and clay), and the strongest correlation was found between soil moisture (r > 0.9 or r < −0.9, p < 0.01) and soil texture, indicating that the soil moisture was subjected to the soil texture of the subunit (Figure 10a). The NMin, cotton N uptake and yield were negatively correlated with irrigation depth. Moreover, significant correlations occurred between soil moisture and NMin (r = 0.83, p < 0.01).
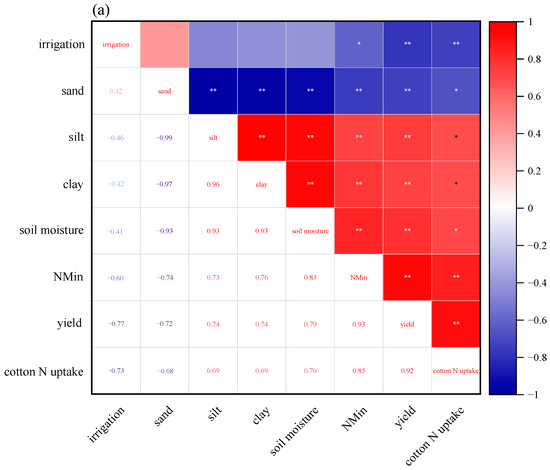
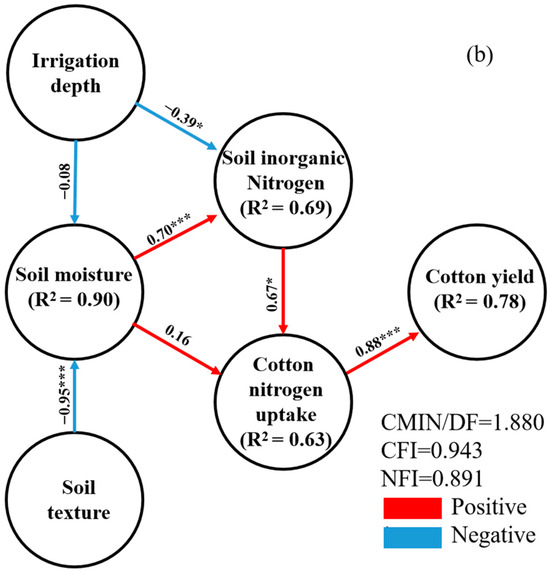
Figure 10.
Correlations between any two different parameters under the 12 subunits (a) and the Structural Equation Model (b). ***, ** and * represent significant differences at p ≤ 0.001, p ≤ 0.01 and p ≤ 0.05, respectively.
The SEM was used to demonstrate the interrelationships between constraints (irrigation depth and soil texture) and seed cotton yield (Figure 10b). Overall, the SEM adequately fit the data (CMIN/DF = 1.880, CFI = 0.943, NFI = 0.891). The results showed that increasing irrigation depths directly limited root-zone soil inorganic nitrogen conditions (standardized path coefficient, SPC = −0.39, p < 0.05), thereby affecting cotton N uptake. The soil texture directly affected the soil moisture (SPC = −0.95, p < 0.001), which had direct and indirect influences on NMin and cotton N uptake. Plant N supplementation seems to be the most critical process affecting yield. NMin affected mainly cotton N uptake, with an SPC of 0.67, and cotton N uptake affected mainly cotton yield, with an SPC of 0.88. The SEM analysis revealed that NMin and cotton N uptake could directly or indirectly explain 78% of the variation in yield among the different subunits.
4. Discussion
4.1. Constraints to Cotton Production in the CDIS
Ensuring cotton production and saving water in arid areas in China require a multipronged approach. Owing to intensive agriculture and cultivation techniques in which drip irrigation has remained a central technology, cotton productivity in Xinjiang has markedly increased. The field experiment revealed that the spatial variation in seed cotton yield was moderate in the CDIS study, in which the area has been cultivated for more than ten years, and the average values for 2018 and 2019 were 8051 and 6617 kg ha−1, respectively. The interannual gap in seed cotton yield might be caused by the differences in weather conditions. Scarpin et al. [33] has reported the importance of meteorological variation in causing cotton yield temporal variability. The cotton seedlings experienced strong sandstorms and low temperatures in early May 2019 (Figure 1), which lead to lower seed cotton yield. Furthermore, poorer yields were still observed during the two years (2018: 4537 kg ha−1; 2019: 3694 kg ha−1). The large yield gap observed between the measuring points indicated that cotton growth in the CDIS might be constrained by factors that could be considered target factors in the improvement of current drip irrigation management practices.
In this study, we screened six possible constraint factors in the CDIS system that varied significantly among fields and years. The results showed that irrigation depth was an important constraint in the CDIS. Irrigation is a risk management strategy used to alleviate drought during cotton growth in Xinjiang [34]. In the CDIS, irrigation usually depends on farmer experience rather than other factors (e.g., sowing, weeding and pesticide), which are managed uniformly according to the recommended specifications, leading to variations in irrigation depths across fields and years. The BLA results revealed that the seed cotton yield decreased with increasing irrigation depth when the amount exceeded 500 mm. Interestingly, local farmers tend to increase irrigation depth to ensure cotton production, which disagrees with our results. Previous work by Tan et al. [35] suggested that the suitable irrigation depth for cotton production in southern Xinjiang was 358–457 mm, while excess irrigation depths may limit the seed cotton yield. Excessive irrigation can enhance vegetative growth in cotton plants, thereby weakening reproductive growth and leading to reduced yields [36]. This finding is consistent with our experimental observations, where vigorous stem and leaf growth was noted in areas with excessive irrigation. Farmers may overemphasize the production constraint of inadequate irrigation because damage by drought could be more easily observed, which might increase the potential crisis of excessive irrigation and yield decline.
The soil texture was identified as another important constraint in the CDIS. Soil texture has often been cited as an important factor related to crop production, and this index is considered the main indicator of soil water and solute retention [37]. Our findings showed that a soil texture with an exorbitant sand content would limit cotton production, and this result was consistent with farmer perceptions. The higher ranking given to the soil texture compared with other factors by farmers and increasing irrigation depth was usually a management practice to cope with the possible decline in production. The rationality of this practice remains to be discussed because excessive irrigation depth is also a constraint. Another key constraint was soil salt (Figure 5). Initial soil salinity affects seed germination and limits crop production [38]. However, this factor has not been taken seriously by local farmers because spring irrigation (unified application before sowing to reduce the amount of soil salt) weakens farmers’ attention to salinity risk. Soil organic matter (SOM) is associated with aggregate stability and bulk density in a soil’s surface layers, and a higher SOM can increase soil porosity and water retention [39]. The study area is located in the northwestern part of China and is characterized by a relatively low SOM content in the arable layer [40]. The limited spatial variability of SOM further reduces its impact on local cotton growth, making its influence relatively minor. Overall, irrigation depth and soil texture were the main constraints on cotton production in the CDIS. Further determination of the reasons for the constraints or subsequent development of recommendations should clarify the impact on the cotton growth process, and an experimental field smaller than the current CDIS should be targeted to prevent interference from various factors.
4.2. Influence of Constraint Factors on Cotton Growth in DISs
In 2023, we conducted experiments in a representative DIS (with exorbitant sand content and excessive irrigation) to evaluate the response of cotton growth to the main constraints. The results of the descriptive statistical analysis revealed wide variation in the soil moisture, and the soil texture was strongly associated with the soil moisture among the 12 subunits (Figure 10a). As a rule, higher sand contents reduce the soil water retention capacity [41], which may explain why the soil moisture of subunits S9 to S12 was always at the lowest level during the irrigation period. It is reasonable to assume that deep percolation occurred in the DIS system (especially for S5 and S9, with irrigation depths > 700 mm). The excess water applied in farmlands permeates deeper than the effective depth of the roots, meaning the crops cannot use it, and this process might be accompanied by nitrate being washed to a depth below the root zone [42]. We observed that the NMin in the DIS decreased continuously with increasing irrigation depth and that irrigation depth was negatively associated with NMin (Figure 10a). The local recommended fertilization rate is as high as 1355 kg ha−1 (N application rate of approximately 600 kg ha−1), while higher N dosages usually increase the residual nitrogen in soil and even cause environmental problems [43]. Interestingly, a significant decrease in residual nitrogen was also found in the CDIS of the experiments in 2018 and 2019. Several studies have demonstrated that higher irrigation depths in drip irrigation systems could reduce soil nitrogen content within the root zone and increase the risk of nitrate leaching [44,45]. Therefore, we inferred that irrigation management in CDIS leads to nitrate leaching at different levels and that excessive irrigation aggravates this phenomenon and might further limit cotton growth.
Nitrogen (N) is a vital macronutrient that is required more than other nutrients in cotton growth [46,47]. In this work, a significant positive correlation was observed between NMin and cotton N uptake and yield (Figure 10a), suggesting that the soil nitrogen supply plays an important role in cotton growth and yield. Previous studies have discussed the limiting effect of NMin deficiency on plant yield, which may be due to insufficient external nitrogen supply or nitrate leaching [48]. Moreover, a significant negative correlation between the subunit irrigation depth and yield was also detected in the DIS (Figure 10a). Cotton yield may be restricted by waterlogging caused by intensive irrigation [49]; however, this phenomenon is rare in western China. On the basis of the SEM results, we infer that the negative response of seed cotton yield to irrigation depth was due to nitrate leaching (Figure 10b). Assessing the results from different subunits revealed that water and NMin were more likely to be maintained in soils with finer textures than in soils with coarser textures because of variations in the water retention characteristics (Figure 7). The soil texture regulates water movement and nitrate leaching from the root zone to the aquifer, and this process occurs more rapidly in soils with higher sand contents [50]. Moreover, the risk of nitrate leaching is lower in soils with high water holding capacities [51]. Our results revealed that soil texture could affect the distribution patterns of soil moisture and NMin and ultimately lead to variations in cotton growth between the 12 subunits. Usowicz et al. [52] also proposed that the soil textural variability can aggravate the inherent unevenness of water and nutrients in drip irrigation systems Therefore, for plots where irrigation depth or soil texture was the main constraint factor, regulating the cotton nitrogen supply seems to be the key to ensuring yield.
4.3. Suggestions for Cotton Production Under Drip Irrigation Management
In the current CDIS, excessive irrigation was one of the main constraints on cotton production and caused a reduction in water and fertilizer utilization efficiency (Figure 4 and Figure 9), which led to the disappearance of the savings effect of drip irrigation. Optimizing irrigation management (e.g., irrigation volume and frequency) is an important measure to improve cotton production in Xinjiang, which has received widespread attention [53]. Therefore, it is necessary to control the cumulative irrigation amount and formulate reasonable irrigation schedules. Furthermore, we found that soil texture (another constraint factor) strongly affected the efficiency of drip irrigation and fertilization. The variation in soil texture decreases the effectiveness of irrigation management in terms of uniformity, scheduling and water use efficiency. Additional studies are needed to find an effective way to incorporate soil texture in site-specific irrigation (fertilization) schedules for drip irrigation systems.
Drip irrigation performance usually reflects the uniformity of the field water distribution after irrigation. An excellent drip irrigation system provides a more uniform water distribution throughout the farmland. (i.e., almost the same amount of water is given to each plant) and avoids excessive and insufficient irrigation for the entire system, thereby improving crop yields [54]. Unfortunately, in this work, although the DISs were nominally uniform, the drip hydraulic performance reduced irrigation uniformity, which aggravated the deep loss of water and NMin in the local subunits. The calculated CUs of all 12 irrigation events were less than 90%, especially for the four irrigation events in June which were less than 70%. The inferior hydraulic performance is likely due to two factors: (1) an unreasonable irritation network and (2) clogging, wear and deterioration of the irrigation equipment [32,55]. Hydraulic performance variability in the DISs diminished the irrigation uniformity, resulting in extremely low IWPs and PFPNs in local subunits (S5 and S9); however, farmers usually cannot detect this problem. The need to improve irrigation uniformity explains the necessity of improving the design quality of drip irrigation networks and thorough and continuous performance evaluation after the drip irrigation system is installed.
NMin deficiency was the main reason for the variability in cotton growth. Urea is the main type of nitrogen fertilizer used for cotton production in local areas (approximately 1200 kg ha−1). The dissolved urea flows easily with infiltrating irrigation water, transferring this nitrate source away from the soil zone with maximum root density [56]. In addition, fertigation by farmers, which consists of short injection durations at the start of long irrigation events, aggravated the movement of NMin to depths below 40 cm. Strategies that delay the fertilization time within an irrigation event could be used to reduce nitrate loss and improve fertilizer utilization efficiency.
4.4. Strengths and Limitations of the Study
This study assessed the impacts of six constraints on cotton production within a CDIS, and further evaluated the influence of primary constraints in a CDIS, providing a basis for future system optimization. Since the study primarily focuses on the main constraints affecting cotton production within the CDIS, constraints of local area (such as soil salt and brackish water) are overlooked. In addition, the hydraulic performance of drip irrigation may exacerbate the unevenness of irrigation at a smaller scale (subunits), leading to localized over-irrigation and under-irrigation. This phenomenon may lead to localized water deficits in cotton. Future research on the impact of hydraulic performance and salinity on cotton growth might provide more help for formulating targeted management measures.
5. Conclusions
The impacts of constraint factors on cotton production under drip irrigation management within a CDIS were assessed over 3 years of research in southern Xinjiang, China. The main results and conclusions of this study are as follows:
- Among the six constraint factors evaluated in the CDIS, excessive irrigation and poor soil texture were identified as the primary constraints, affecting more than 45% of the drip-irrigated cotton fields.
- Excessive irrigation and poor soil texture significantly influence soil moisture and Nmin in cotton fields, directly limiting the water/nitrogen use efficiency (IWP and PFPN) under drip irrigation management. This phenomenon leads to substantial variations in cotton growth within the CDIS.
- The differences in Nmin caused by the main constraints (excessive irrigation and poor soil texture) were the primary factors affecting cotton nitrogen uptake and subsequent yield reductions. Ensuring the N supply was the key to addressing the yield decline in the drip irrigation system.
- Three suggestions according to the current management situation were derived to address cotton decline within the CDIS: (i) optimized irrigation scheduling; (ii) an improved drip irrigation network; and (iii) adjusted drip fertilization strategies. Future research could further focus on the response of cotton quality to multiple constraints within the CDIS. This will help optimize the management of drip irrigation and improve the quality of local cotton production.
Author Contributions
Z.S.: investigation, conceptualization, data curation, formal analysis, methodology, writing—original draft, and visualization. Z.W.: writing—review and editing, resources, funding acquisition, conceptualization, and methodology. J.L.: supervision, project administration, writing—review and editing, funding acquisition, and conceptualization. All authors have read and agreed to the published version of the manuscript.
Funding
This research was funded by National Key R&D Program of China grant number [2022YFD1900404]. This research was funded by National Natural Science Foundation of China grant numbers [52279053 and 51790531].
Data Availability Statement
The original contributions presented in the study are included in the article; further inquiries can be directed to the corresponding authors.
Conflicts of Interest
The authors declare that they have no known competing financial interests or personal relationships that could have appeared to influence the work reported in this paper.
References
- FAOSTAT. Food and Agriculture Organization Corporate Statistical Database. Available online: http://www.fao.org/faostat/ (accessed on 5 June 2024).
- National Bureau of Statistics of China. 2022. Available online: https://www.stats.gov.cn/sj/ndsj/2023/indexch.htm (accessed on 5 June 2024).
- Bai, Z.T.; Xie, C.; Yu, J.; Bai, W.Q.; Pei, S.Z.; Li, Y.X.; Li, Z.J.; Zhang, F.C.; Fan, J.L.; Yin, F.H. Effects of irrigation and nitrogen levels on yield and water-nitrogen-radiation use efficiency of drip-fertigated cotton in south Xinjiang of China. Field Crops Res. 2024, 308, 109280. [Google Scholar] [CrossRef]
- Daccache, A.; Lamaddalena, N.; Fratino, U. Assessing pressure changes in an on-demand water distribution system on drip irrigation performance—Case study in Italy. J. Irrig. Drain. Eng. 2010, 136, 261–270. [Google Scholar] [CrossRef]
- Darouich, H.M.; Pedras, C.M.G.; Gonçalves, J.M.; Pereira, L.S. Drip vs. surface irrigation: A comparison focussing on water saving and economic returns using multicriteria analysis applied to cotton. Biosyst. Eng. 2014, 122, 74–90. [Google Scholar] [CrossRef]
- Zhang, H.; Xu, A. Present situation, problems and countermeasures of cotton industry in Xinjiang of China. China Cotton Process 2020, 5, 18–20, (In Chinese with English abstract). [Google Scholar]
- Hou, X.H.; Fan, J.L.; Zhang, F.C.; Hu, W.H.; Xiang, Y.Z. Optimization of water and nitrogen management to improve seed cotton yield, water productivity and economic benefit of mulched drip-irrigated cotton in southern Xinjiang, China. Field Crops Research 2024, 308, 109301. [Google Scholar]
- Guan, C.K.; Ma, X.L.; Shi, X.P. The impact of collective and individual drip irrigation systems on fertilizer use intensity and land productivity: Evidence from rural Xinjiang, China. Water Resour. Econ. 2022, 38, 100196. [Google Scholar] [CrossRef]
- Gatti, M.; Garavani, A.; Squeri, C.; Diti, I.; Monte, A.d.; Scotti, C.; Ponie, S. Effects of intra-vineyard variability and soil heterogeneity on vine performance, dry matter and nutrient partitioning. Precis. Agric. 2022, 23, 150–177. [Google Scholar] [CrossRef]
- Ma, R.; Dou, S.; Zhang, Y.F.; Wu, D.; Ndzelu, B.S.; Xie, S.; YaLiHong, D. Different soil particle size changes the 15N re-tention in soil and 15N utilization by maize. Sci. Total Environ. 2022, 843, 157133. [Google Scholar] [CrossRef]
- Jiang, H.; Tian, Y.Q.; Yan, W.J.; Chen, J.J.; Zhang, Z.X.; Xu, H.H. Drip chemigation of flonicamid effectively controls cot-ton aphid (Aphis gossypii) and is benign to lady beetle (Coccinella septempunctata) and lacewing larva (Chrysoperla sinica). Crop Prot. 2022, 129, 105039. [Google Scholar] [CrossRef]
- Webb, R.A. Use of the Boundary Line in the analysis of biological data. J. Hortic. Sci. 1972, 47, 309–319. [Google Scholar] [CrossRef]
- Lark, R.M. An empirical method for describing the joint eff ects of environmental and other variables on crop yield. Ann. Appl. Biol. 1997, 131, 141–159. [Google Scholar] [CrossRef]
- Walworth, J.L.; Letzsch, W.S.; Sumner, M.E. Use of boundary lines in establishing diagnostic norms. Soil Sci. Soc. Am. J. 1986, 50, 123–128. [Google Scholar] [CrossRef]
- Wairegi, L.W.I.; Asten, P.J.A.V.; Tenywa, M.M.; Bekunda, M.A. Abiotic constraints override biotic constraints in East African highland banana systems. Field Crops Res. 2010, 117, 146–153. [Google Scholar] [CrossRef]
- Wang, N.; Jassogne, L.; van Asten, P.J.A.; Mukasa, D.; Wanyama, I.; Kagezi, G.; Giller, K.E. Evaluating coffee yield gaps and important biotic, abiotic, and management factors limiting coffee production in Uganda. Eur. J. Agron. 2015, 63, 1–11. [Google Scholar] [CrossRef]
- Lin, S.D.; Wang, Q.J.; Deng, M.J.; Su, L.J.; Wei, K.; Guo, Y.; Zhang, J.H. Assessing the influence of water fertilizer, and climate factors on seed cotton yield under mulched drip irrigation in Xinjiang Agricultural Regions. Eur. J. Agron. 2024, 152, 127034. [Google Scholar] [CrossRef]
- Zhou, Y.Q.; Li, F.; Xin, Q.C.; Li, Y.M.; Lin, Z.D. Historical variability of cotton yield and response to climate and agro-nomic management in Xinjiang, China. Sci. Total Environ. 2024, 912, 169327. [Google Scholar] [CrossRef] [PubMed]
- Vories, E.; O’Shaughnessy, S.; Sudduth, K.; Evett, S.; Andrade, M.; Drummond, S. Comparison of precision and conventional irrigation management of cotton and impact of soil texture. Precis. Agric. 2021, 22, 414–431. [Google Scholar] [CrossRef]
- Wang, Z.; Li, J.; Zhang, H.; Li, Y. Analyzing the influence of drip irrigation uniformity on spring maize yield using the spatial effect model. Sci. Agric. Sin. 2013, 46, 4905–4915, (In Chinese with English abstract). [Google Scholar]
- Lin, X.M.; Wang, Z.; Li, J.S. Identifying the factors dominating the spatial distribution of water and salt in soil and cotton yield under arid environments of drip irrigation with different lateral lengths. Agric. Water Manag. 2021, 250, 106834. [Google Scholar] [CrossRef]
- China Meteorological Administration. Available online: https://data.cma.cn (accessed on 5 June 2024).
- Fernández, J.E.; Alcon, F.; Diaz-Espejo, A.; Hernandez-Santana, V.; Cuevas, M.V. Water use indicators and economic analysis for on-farm irrigation decision: A case study of a super high density olive tree orchard. Agric. Water Manag. 2020, 237, 106074. [Google Scholar] [CrossRef]
- Chen, B.P.; Guo, L.J.; Tang, J.C.; Li, Y.S.; Li, C.F. Comprehensive impacts of different integrated rice-animal coculture systems on rice yield, nitrogen fertilizer partial factor productivity and nitrogen losses: A global meta-analysis. Sci. Total Environ. 2024, 915, 169994. [Google Scholar] [CrossRef]
- Schnug, E.; Heym, J.; Achwan, F. Establishing critical values for soil and plant analysis by means of the boundary line development system (bolides). Commun. Soil Sci. Plant Anal. 1996, 27, 2739–2748. [Google Scholar] [CrossRef]
- Fermont, A.M.; van Asten, P.J.A.; Tittonell, P.; van Wijk, M.T.; Giller, K.E. Closing the cassava yield gap: An analysis from smallholder farms in East Africa. Field Crops Res. 2009, 112, 24–36. [Google Scholar] [CrossRef]
- Shatar, T.M.; Mcbratney, A.B. Boundary-line analysis of field-scale yield response to soil properties. J. Agric. Sci. 2004, 142, 553–560. [Google Scholar] [CrossRef]
- Grace, J.B. Structural Equation Modeling and Natural Systems; Cambridge University Press: Cambridge, UK, 2006. [Google Scholar]
- Lu, J.S.; Hu, T.T.; Geng, C.M.; Cui, X.L.; Fan, J.L.; Zhang, F.C. Response of yield, yield components and water-nitrogen use efficiency of winter wheat to different drip fertigation regimes in Northwest China. Agric. Water Manag. 2021, 255, 107034. [Google Scholar] [CrossRef]
- Liao, Z.Q.; Zhang, C.; Yu, S.L.; Lai, Z.L.; Wang, H.D.; Zhang, F.C.; Li, Z.J.; Wu, P.; Fan, J.L. Ridge-furrow planting with black film mulching increases rainfed summer maize production by improving resources utilization on the Loess Plateau of China. Agric. Water Manag. 2023, 289, 108558. [Google Scholar] [CrossRef]
- Shao, M.A.; Wang, Q.J.; Huang, M.B. Soil Physics; Higher Education Press: Beijing, China, 2006. [Google Scholar]
- Wang, Z.; Zhang, Z.H.; Li, J.S.; Li, Y.F. Field evaluation of fertigation performance for a drip irrigation system with different lateral layouts under low operation pressures. Irrig. Sci. 2022, 40, 191–201. [Google Scholar] [CrossRef]
- Scarpin, G.J.; Bhattarai, A.; Hand, L.C.; Snider, J.L.; Roberts, P.M.; Bastos, L.M. Cotton lint yield and quality variability in Georgia, USA: Understanding genotypic and environmental interactions. Field Crops Res. 2025, 325, 109822. [Google Scholar] [CrossRef]
- Feike, T.; Khor, L.Y.; Mamitimin, Y.; Ha, N.; Li, L.; Abdusalih, N.; Xiao, H.; Doluschitz, R. Determinants of cotton farmers’ irrigation water management in arid Northwestern China. Agric. Water Manag. 2017, 187, 1–10. [Google Scholar] [CrossRef]
- Tan, S.; Wang, Q.J.; Zhang, J.H.; Chen, Y.; Shan, Y.Y.; Xu, D. Performance of AquaCrop model for cotton growth simulation under film-mulched drip irrigation in southern Xinjiang, China. Agric. Water Manag. 2018, 196, 99–113. [Google Scholar] [CrossRef]
- Baird, J.; Schwenke, G.; Macdonald, B.; Nachimuthu, G.; McPherson, A.; Mercer, C. Efficiency over excess: Maximising cotton lint yields with optimum irrigation and nitrogen fertiliser application. Field Crops Res. 2024, 315, 109484. [Google Scholar] [CrossRef]
- Souza, S.A.; Rodrigues, L.N.; da Cunha, F.F. Assessing the precision irrigation potential for increasing crop yield and water savings through simulation. Precis. Agric. 2023, 24, 533–559. [Google Scholar] [CrossRef]
- Jisha, K.C.; Vijayakumari, K.; Puthur, J.T. Seed priming for abiotic stress tolerance: An overview. Acta Physiol. Plant 2023, 35, 1381–1396. [Google Scholar] [CrossRef]
- Mauget, S.A.; Himanshu, S.K.; Goebel, T.S.; Ale, S.; Lascano, R.J.; Gitz, D.C. Soil and soil organic carbon effects on simulated Southern High Plains dryland Cotton production. Soil Tillage Res. 2021, 212, 105040. [Google Scholar] [CrossRef]
- Li, Y.; Chen, Z.; Chen, Y.; Li, T.; Wang, C.; Li, C. Predicting the spatial distribution of soil organic carbon in the clack soil area of northeast plain, China. Sustainability 2025, 17, 396. [Google Scholar] [CrossRef]
- Klein, V.A.; Baseggio, M.; Madalosso, T.; Marcolin, C.D. Textura do solo e a estimativa do teor de água no ponto de murcha permanente com psicrômetro (soil texture and water content estimation at permanent wilting point with psychrometer). Ciência Rural 2010, 40, 1550–1556. [Google Scholar] [CrossRef]
- Barzegari, M.; Sepaskhah, A.R.; Ahmadi, S.H. Irrigation and nitrogen managements affect nitrogen leaching and root yield of sugar beet. Nutr. Cycl. Agroecosyst. 2017, 108, 211–230. [Google Scholar] [CrossRef]
- Tsibart, A.S.; Dillen, J.; Elsen, A.; Postelmans, A.; van De Ven, G.; Saeys, W. Potential to reduce the nitrate residue after harvest in maize fields without sacrificing yield through precision nitrogen management. Precis. Agric. 2024, 25, 940–962. [Google Scholar] [CrossRef]
- Sun, X.L.; Yang, X.S.; Hu, Z.Y.; Liu, F.L.; Xie, Z.J.; Li, S.Y.; Wang, G.X.; Li, M.; Sun, Z.; Bol, R. Biochar effects on soil nitrogen retention, leaching and yield of perennial citron daylily under three irrigation regimes. Agric. Water Manag. 2024, 296, 108788. [Google Scholar] [CrossRef]
- Pool, S.; Francés, F.; Garcia-Prats, A.; Puertes, C.; Pulido-Velazquez, M.; Sanchis-Ibor, C.; Schirmer, M.; Yang, H.; Jiménez-Martínez, J. Impact of a transformation from flood to drip irrigation on groundwater recharge and nitrogen leaching under variable climatic conditions. Sci. Total Environ. 2022, 825, 153805. [Google Scholar] [CrossRef]
- Manderscheid, R.; Pacholski, A.; Frühauf, C.; Weigel., H.J. Effects of free air carbon dioxide enrichment and nitrogen supply on growth and yield of winter barley cultivated in a crop rotation. Field Crops Res. 2009, 110, 185–196. [Google Scholar] [CrossRef]
- Zurweller, B.A.; Rowland, D.L.; Mulvaney, M.J.; Tillman, B.L.; Migliaccio, K.; Wright, D.; Erickson, J.; Payton, P.; Vellidis, G. Optimizing cotton irrigation and nitrogen management using a soil water balance model and in-season nitrogen applications. Agric. Water Manag. 2019, 216, 306–314. [Google Scholar] [CrossRef]
- Shareef, M.; Gui, D.W.; Zeng, F.J.; Waqas, M.; Ahmed, Z.; Zhang, B.; Iqbal, H.; Xue, J. Nitrogen leaching, recovery efficiency, and cotton productivity assessments on desert-sandy soil under various application methods. Agric. Water Manag. 2019, 223, 105716. [Google Scholar] [CrossRef]
- Bange, M.P.; Milroy, S.P.; Thongbai, P. Growth and yield of cotton in response to waterlogging. Field Crops Res. 2004, 88, 142. [Google Scholar] [CrossRef]
- Sedghi, N.; Cavigelli, M.; Weil, R. Soil texture, fertilization, cover crop species and management affect nitrous oxide emissions from no-till cropland. Sci. Total Environ. 2024, 914, 169991. [Google Scholar] [CrossRef] [PubMed]
- Kurunc, A.; Ersahin, S.; Yetgin Uz, B.; Sonmez, N.K.; Uz, I.; Kaman, H.; Bacalan, G.E.; Emekli, Y. Identification of nitrate leaching hot spots in a large area with contrasting soil texture and management. Agric. Water Manag. 2011, 98, 1013–1019. [Google Scholar] [CrossRef]
- Usowicz, B.; Lipiec, J. Spatial variability of soil properties and cereal yield in a cultivated field on sandy soil. Soil Tillage Res. 2017, 174, 241–250. [Google Scholar] [CrossRef]
- Xiao, C.; Zhang, F.C.; Li, Y.; Fan, J.L.; Xu, X.T.; Liu, X.Q. Optimal drip irrigation leaching amount and times enhance seed cotton yield and its stability by improving soil chemical environment and source-sink relationship. Field Crops Res. 2024, 317, 109531. [Google Scholar]
- Benouniche, M.; Kuper, M.; Hammani, A.; Boesveld, H. Making the user visible: Analysing irrigation practices and farmers’ logic to explain actual drip irrigation performance. Irrig. Sci. 2014, 32, 405–420. [Google Scholar] [CrossRef]
- Boularbah, S.; Kuper, M.; Hammani, A.; Mailhol, J.; Taky, A. The blind angle: Performance assessment of drip irrigation in use in a large-scale irrigation scheme in Morocco. Irrig. Drain. 2019, 68, 925–936. [Google Scholar] [CrossRef]
- Hanson, B.; Šimůnek, J.; Hopmans, J. Evaluation of urea–ammonium–nitrate fertigation with drip irrigation using nu-merical modeling. Agric. Water Manag. 2006, 86, 113. [Google Scholar] [CrossRef]
Disclaimer/Publisher’s Note: The statements, opinions and data contained in all publications are solely those of the individual author(s) and contributor(s) and not of MDPI and/or the editor(s). MDPI and/or the editor(s) disclaim responsibility for any injury to people or property resulting from any ideas, methods, instructions or products referred to in the content. |
© 2025 by the authors. Licensee MDPI, Basel, Switzerland. This article is an open access article distributed under the terms and conditions of the Creative Commons Attribution (CC BY) license (https://creativecommons.org/licenses/by/4.0/).