Article

Comparative Transcriptomic Profiling Reveals Divergent Drought-Response Mechanisms Between Resistant and Susceptible Apple Genotype Roots

1
State Key Laboratory of Crop Stress Biology for Arid Areas, Shaanxi Key Laboratory of Apple, College of Horticulture, Northwest A&F University, Yangling 712100, China
2
The National and Local Joint Engineering Laboratory of High Efficiency and Superior-Quality Cultivation and Fruit Deep Processing Technology of Characteristic Fruit Trees in Southern Xinjiang, College of Horticulture and Forestry, Tarim University, Alar 843300, China
3
Xinjiang Production and Construction Corps Key Laboratory, Biological Resources Protection and Utilization in Tarim Basin, Alar 843300, China
4
College of Agriculture, Guangxi University, Nanning 530004, China
*
Authors to whom correspondence should be addressed.
These authors contributed equally to this work.
Agronomy 2025, 15(3), 748; https://doi.org/10.3390/agronomy15030748
Submission received: 28 February 2025 / Revised: 13 March 2025 / Accepted: 15 March 2025 / Published: 20 March 2025

Abstract

:
Drought stress caused a significant threat to apple growth and production. Although there is an increasing studies concerning the molecular mechanism in apple response to drought, most of these studies focus on the leaves. However, the roots is the first organism to sense the drought signal and play important role in drought response. The molecular mechanisms underlying the apple roots in response to drought needs to be further explored. In this study, we conducted a comparative transcriptomic analysis of roots from drought-resistant (Malus prunifolia) and drought-susceptible (Malus hupehensis) apple genotypes under different soil water contents with 60% (control), 30% (mild drought), 10% (moderate drought), and 5% (severe drought). The further Mapman pathways analysis showed that Malus prunifolia exhibited more rapid activation of abscisic acid (ABA) biosynthesis (NCED, PYL) and signaling pathway, as well as the induction of transcription factors (NAC, WRKY, MYB) compare to Malus prunifolia under mild and moderate drought treatments. This might be one of the reasons why Malus prunifolia exhibits greater drought resistance. Furthermore, weighted gene co-expression network analysis (WGCNA) was adopted for the identification of core drought-responsive genes. Notably, three hub genes, ubiquitin-conjugating enzyme 32 (UBC32), basic leucine-zipper 4 (bZIP4), and highly ABA-induced PP2C gene 2 (HAI2), were selected from the different modules, suggesting their vital roles in drought response. Taken together, our results gain insights into the global expression alterations in drought-resistance and susceptible germplasms under different drought conditions and identify some key genes involved in drought response, which is helpful for drought-resistant apple breeding in future.

1. Introduction

Droughts, as a major consequence of climate change, have affected a significant proportion of the world’s land area and have had a severe impact on agricultural production. As sessile organisms, plants have evolved a variety of strategies to cope with drought stress, such as morphological, physiological, and molecular adaptations [1]. For the morphological level, plants may increase root length, root diameter, and root hair density to enhance water absorption capacity and increase water uptake. Meanwhile, plants may also reduce the leaf area or increase leaf thickness to decrease the water loss from transpiration. For the physiological level, plants can regulate their water status by adjusting osmotic accumulations and controlling stomatal closure [2]. Also, plants can change the metabolic flux to cope with drought stress, such as the synthesis or degradation of carbohydrates, lipids, and proteins, as well as alter the accumulation levels of osmoprotectants, such as proline, glycine betaine, and soluble sugars to maintain cellular osmotic homeostasis. From the perspective of molecular biology on drought signals, the signals of cellular water loss firstly promote the production of stress-protectant metabolites such as trehalose and proline, then triggered the antioxidant system to maintain the homeostasis of redox substances, and again deploy peroxidase enzymes to response and prevent acute membrane integrity and cellular damage [1].
For the molecular level, plants have developed a series of molecular mechanisms in response to drought, including sensing and signaling mechanisms, transcriptional regulations, and epigenetic regulations (DNA methylation, histone modifications, and miRNA responses) [3]. Plants response to drought stress mainly includes abscisic acid (ABA)-dependent and ABA-independent pathways. For ABA-dependent pathways, ABA is quickly synthesized and accumulated in plant cells when plants suffer from drought stress [4]. Then, the ABA receptors (such as PYR/PYL/RCAR proteins) bind to the ABA molecules, and the receptors with ABA can interact with protein phosphatases 2C (PP2Cs) and inhibit the activities of PP2Cs. The inhibition of PP2Cs results in the activation of SnRK2 protein kinases and the activated SnRK2 kinases phosphorylate a series of transcription factors, such as AREB/ABF, which can bind to the ABA-responsive element (ABRE) in the promoters of downstream drought-responsive genes and activate their expression [5]. These downstream drought-responsive genes include those involved in osmoprotectant synthesis, antioxidant defense, and stress-related protein production pathways. In apple, ABA and drought can induced the expression of MdABI5, which activates the ABA-responsive genes MdEM6 and MdRD29A by directly binding their promoters, resulting in the enhanced drought tolerance [6]. Also, MdAREB2 was up-regulated by the drought stress and it could activate the expression of amylase genes (MdAMY1, MdAMY3, MdBAM1, and MdBAM3), Sucrose uptake transporter (MdSUT2), and tonoplast monosaccharide transporter (MdTMT1), which leads to the soluble sugar accumulation and increased drought resistance [7]. For the ABA-independent pathways, abundant previous studies indicated that the DREB/CBF pathway is a major ABA-independent pathway involved in drought response. DREB/CBF transcription factors bind to the dehydration-responsive element (DRE) within the promoters of downstream drought-responsive genes and activate their expression. The up-regulation of these drought-responsive genes enhances the drought resistance of plants [8,9]. Moreover, studies have revealed that the expression of DREB/CBF genes was also regulated by multiple up-stream factors, such as ICE1 and CAMTA, which play important roles in the perception and transduction of drought signals [10]. Additionally, transcription factors also play a vital role among the gene regulatory networks of drought-responsive genes during plants in response to drought. In addition to AREB/ABF and DREB/CBF, transcription factors, including NAC, ERF, WRKY, bZIP, MYB, HD-Zip, ZnF, bHLH, ASR, NF-Y and so on, were widely reported to participating the drought response process [11]. In apple, MdMYB88 and MdMYB124 were up-regulated by the water deficiency, and they can bound to the promoters of MdMYB46 and MdVND6, which promoted the cellulose and lignin deposition to enhance the drought tolerance [12]. Similarly, a secondary wall-associated NAC domain protein 1 (MdSND1) participates in the osmotic stress response by activating the expression of MdMYB46/83 and enhancing the lignin biosynthesis [13]. Also, MdGH3.6 negatively regulated the antioxidant enzyme activities, root development, and cuticular wax content, resulting negatively regulated the drought tolerance in apple [14]. Additionally, MdWRKY17 can bind to the promoter of MdSUFB (encoding a member of sulfur mobilization system), and indirectly downregulates the chlorophyll catabolic genes (MdCLH) and pheide a oxygenase (MdRCCR) in response to drought. Moreover, drought-activated MdMEK2–MdMPK6 complex can catalyze the phosphorylation of MdWRKY17 and fine-tuning the expression of MdSUFB to stabilize the chlorophyll contents under drought [15].
These transcription factors can also modulate by other regulatory proteins by interacting with them, such as protein kinases and phosphatases, which can modulate the activity and stability of transcription factors and then affect the expression of downstream genes [16]. The genes involved in sensing and signaling pathway, and transcription factors, as well as drought-responsive genes form the complex gene regulatory networks to integrate the molecular mechanisms of drought response in plants.
Although there is an increasing studies concerning on the plant in response to drought, however, as perennial plants, fruit trees are frequently subjected to both long-term and short-term drought stress during their life cycles, and their physiological and molecular mechanisms have attracted significant attention [3]. Apple (Malus × domestica Borkh.) is one of the most important economic fruit crops and widely growing around the world, which is also widely acclaimed for its good flavor and rich nutritional profile. However, apple orchards are often affected by water deficit, which can cause significant losses in yield and quality of apple fruits [17]. Drought stress can affect apple tree growth, fruit development, and photosynthesis, leading to a reduction of fruit size, sugar content, and other metabolites contents [18]. Uncovering the molecular mechanism is benefit for the apple drought resistance improvement from the molecular level. Although there are many studies concerning about the molecular regulations in apple response to drought, previous studies have mainly focused on the transcriptional changes in apple leaves under drought stress [19]. The studies on the transcriptional alterations in root system under drouth stress are relatively limited. However, the root system is the primary site for plants to perceive and respond to the drought signal, and it plays a crucial role in water uptake and signal transduction.
In this study, we selected the drought-tolerance Malus prunifolia and drought-sensitive Malus hupehensis to perform transcriptome analysis of their roots under drought stress at different time points. The drought resistance germplasm “Malus prunifolia Fupingqiuzi” (QZ) was the commonly used apple rootstock in China due to its known tolerances to abiotic and biotic stresses, especially drought stress [20]. The drought susceptible germplasm was used “Malus hupehensis Pingyitiancha” (PYTC), which was considered as drought susceptible germplasm according to the previous study [21]. Abundant previous studies had revealed the differences of drought resistant ability from physiological and biochemical aspects between two apple accessions, the drought-tolerance Malus prunifolia and drought-sensitive Malus hupehensis [22]. However, which genes responsible for the apple roots in response to drought and the possible molecular mechanism of drought resistance differences among two apple accessions were the key point of this study. Therefore, our results constructed the molecular regulatory networks of apple roots in response to drought and identify key genes and pathways involved in the differences of drought resistance among two apple accessions. Our results gain an insight into the primary molecular mechanism of apple root in response to drought and provide the candidate genes for the further investigation.

2. Material and Methods

2.1. Experimental Design of This Study

The material used for drought treatment was the three-month seedlings of Malus hupehensis and Malus prunifolia. The experiments were conducted at Northwest A&F University, Yangling, located in the loess plateau of China (34°200′ N, 108°240′ E). All plants were grown in the greenhouse (temperature 25–30 °C, humidity 50%). Plants of comparable height and growth conditions were selected and cultivated in an identical weight of substrate, composed of a 3:1:1 ratio of peat, perlite, and vermiculite (v/v/v). For the drought treatments, three to four apple seedlings with uniform growth were selected as one biological replicate, and a total of three biological replicates were used for the following drought experiment. To ensure a precise evaluation of drought stress levels and to validate the robustness of our findings, we applied soil moisture content (SMC) to reflect the degree of drought stress. The SMC of 60% was served as control (S60d), the SMC of 30% was served as mild drought (S30d) which performed drought treatment for 4 days in PYTC and 5 days in QZ, the SMC of 10% was served as moderate drought (S10d) which performed drought treatment for 7 days in PYTC and 9 days in QZ, and the SMC of 5% was served as severe drought (S5d) which performed drought treatment for 8 days in PYTC and 12 days in QZ (Figure 1). The selection of these moisture levels was informed by the saturated moisture content as a reference standard. After drought treatments finished, the roots samples were cleaned and collected, then swiftly frozen in liquid nitrogen and stored at −80 °C. Post-sampling, the soil of the sampled plants was promptly mixed and weighed, with 5 g taken in an aluminum container, which was then placed in an oven at 105 °C for 12 h. After cooling in a desiccator, the sample was weighed to determine the water content. The percentage of soil moisture content for different drought treatments is defined as the ratio of soil water content to the saturated water content at the respective time point. Samples of roots from various drought treatments were used for subsequent experiment.

2.2. RNA Extraction and RNA-Seq Library Construction

After collecting the roots samples of Malus hupehensis or Malus prunifolia under four different soil moisture contents, a total of 24 samples including three independent replicates were submitted to the RNA extraction process. The RNAprep Pure Plant Kit (Polysaccharides & Polyphenolics-rich, DP441, Tiangen Biotech, Beijing, China) were utilized for RNA extraction. Then, the extracted RNA samples were load to 1% agarose gel electrophoresis to assess RNA degradation and contamination. The purity and concentration of the RNA samples were assessed by the NanoPhotometer® spectrophotometer (IMPLEN, Westlake Village, CA, USA). The A260/A280 ratio of all the RNA samples were up to 1.8. The Qubit® RNA Assay Kit in conjunction with the Qubit® 2.0 Fluorometer (Life Technologies, Carlsbad, CA, USA) provided additional quantification and integrity assessment. The integrity of the RNA used in this study was all greater than 7.0. Furthermore, the Nano 6000 Assay Kit on the Bioanalyzer 2100 system (Agilent Technologies, Santa Clara, CA, USA) was employed to check the integrity of RNA samples.
A total of 20 ng of quantified RNA per sample was utilized for the following RNA-seq library construction. For library preparation intended for sequencing, the Epicentre Ribo-zero™ rRNA Removal Kit (Epicentre, Madison, WI, USA) was used to eliminate ribosomal RNA, followed by purification via ethanol precipitation. Subsequently, the rRNA-depleted RNA was processed using the NEBNext® Ultra™ Directional RNA Library Prep Kit for Illumina® (NEB, Ipswich, MA, USA) to generate sequencing libraries. The cBot Cluster Generation System, utilizing the TruSeq PE Cluster Kit v3-cBot-HS (Illumina, San Diego, CA, USA), was used to cluster the index-coded samples. These libraries were then sequenced on the Illumina Hiseq 4000 platform to obtain 150 bp paired-end reads.

2.3. The Bioinformatic Analysis of RNA-Seq Data

The RNA-seq process including quality control, sequence alignment and differential analysis refer to our previous study [23]. Simply, the raw data was cleaned by removing adapter reads, poly-N reads, and low-quality reads. Clean data were used for quality control by FastQC v0.11.9 (http://www.bioinformatics.babraham.ac.uk/projects/fastqc/, accessed on 8 August 2022) with default parameters. After quality control, the clean reads were mapped to the reference genome [24] by HISAT2 v2.1.0 [25,26]. Then samtools v1.9 was used with parameter -bq 1 [27] to get the sorted binary bam file after transformation and sorting. The mRNA reads were then counted using Htseq v0.13.5 [28]. FPKM stands for fragments per kilobase of exon model per million mapped fragments, and it is calculated using the following formula: FPKM = read counts/(mapped reads (Millions) * exon length (KB). Before gene clustering, genes with a total FPKM of 0 in all samples were filtered out, and the remaining genes were clustered based on K-means.
Differential expression analysis of expression matrix was performed using the R/DESeq2 [29]. The significance level was determined by using the corrected p-value (padj). The absolute value of log2(fold change) > 1 with padj < 0.05 was defined as the different expression genes. The R package clusterProfiler was applied for the Gene ontology (GO) enrichment of differentially expressed genes (DEGs) [30]. Differentially expressed genes were identified as highly enriched for GO terms with FDR less than 0.05. The scatter plots of GO and circos were made by using the OmicStudio tools at https://www.omicstudio.cn/tool (accessed on 20 August 2022) [31]. Heatmaps and Venn plots were produced by TBtools v2.156 [32]. For the assignments of DEGs into various pathways, Mapman software (https://mapman.gabipd.org/home (accessed on 20 August 2022)) was adopted to distribute the DEGs into different Mapman bins and illustrated in overall metabolic pathway maps.

2.4. Quantitative RT-PCR Analysis

The quantitative RT-PCR analysis was performed as previous descripted [4]. The total RNA was used as the same as the RNA-seq analysis. The total RNA was used as the template for the reverse-transcription PCR by using the RevertAid First Strand cDNA Synthesis Kit (Thermo Scientific, Waltham, MA, USA). The quantitative RT-PCR reaction was used qPCR Master Mix (Promega, Madison, WI, USA) and then the reaction mix was performed in a Bio-Rad CFX96TM system. The MdMDH gene was used as the reference gene. Three independent replicates were performed and Error bars indicate SD (n = 3).

2.5. Co-Expression Network Construction and Trait Association Analysis of Modules

To reveal the correlation between differential genes under drought treatments, 17,768 differentially expressed candidate genes were analyzed by weighted correlation network analysis using the WGCNA package (1.70–3) in R [33]. An “unsigned” matrix with a soft threshold of 12 was used for subsequent analysis. MergeCutHeight is 0.1 and minModuleSize is 150 in network construction and module detection. The rest of the analyses use the default parameters. Modules were assigned to differentially expressed genes based on a Topological Overlap Matrix (TOM) and identified via dynamic tree-cutting. Module eigengenes (MEs) represented expression patterns, while module genes underwent further analysis. The top 200 edges connections with the highest weight were chosen for co-expression networks. Hub genes and neighboring key genes from these connections were used to construct co-expression networks in Cytoscape v3.8.2 [34].

2.6. Statistical Analysis

Data were expressed as the mean ± SD. SPSS (Version 24.0) was used for one-way ANOVA (Tukey’s test) analysis to determine the statistical significance. The different letters on the top of columns indicated they had significant differences.

3. Results

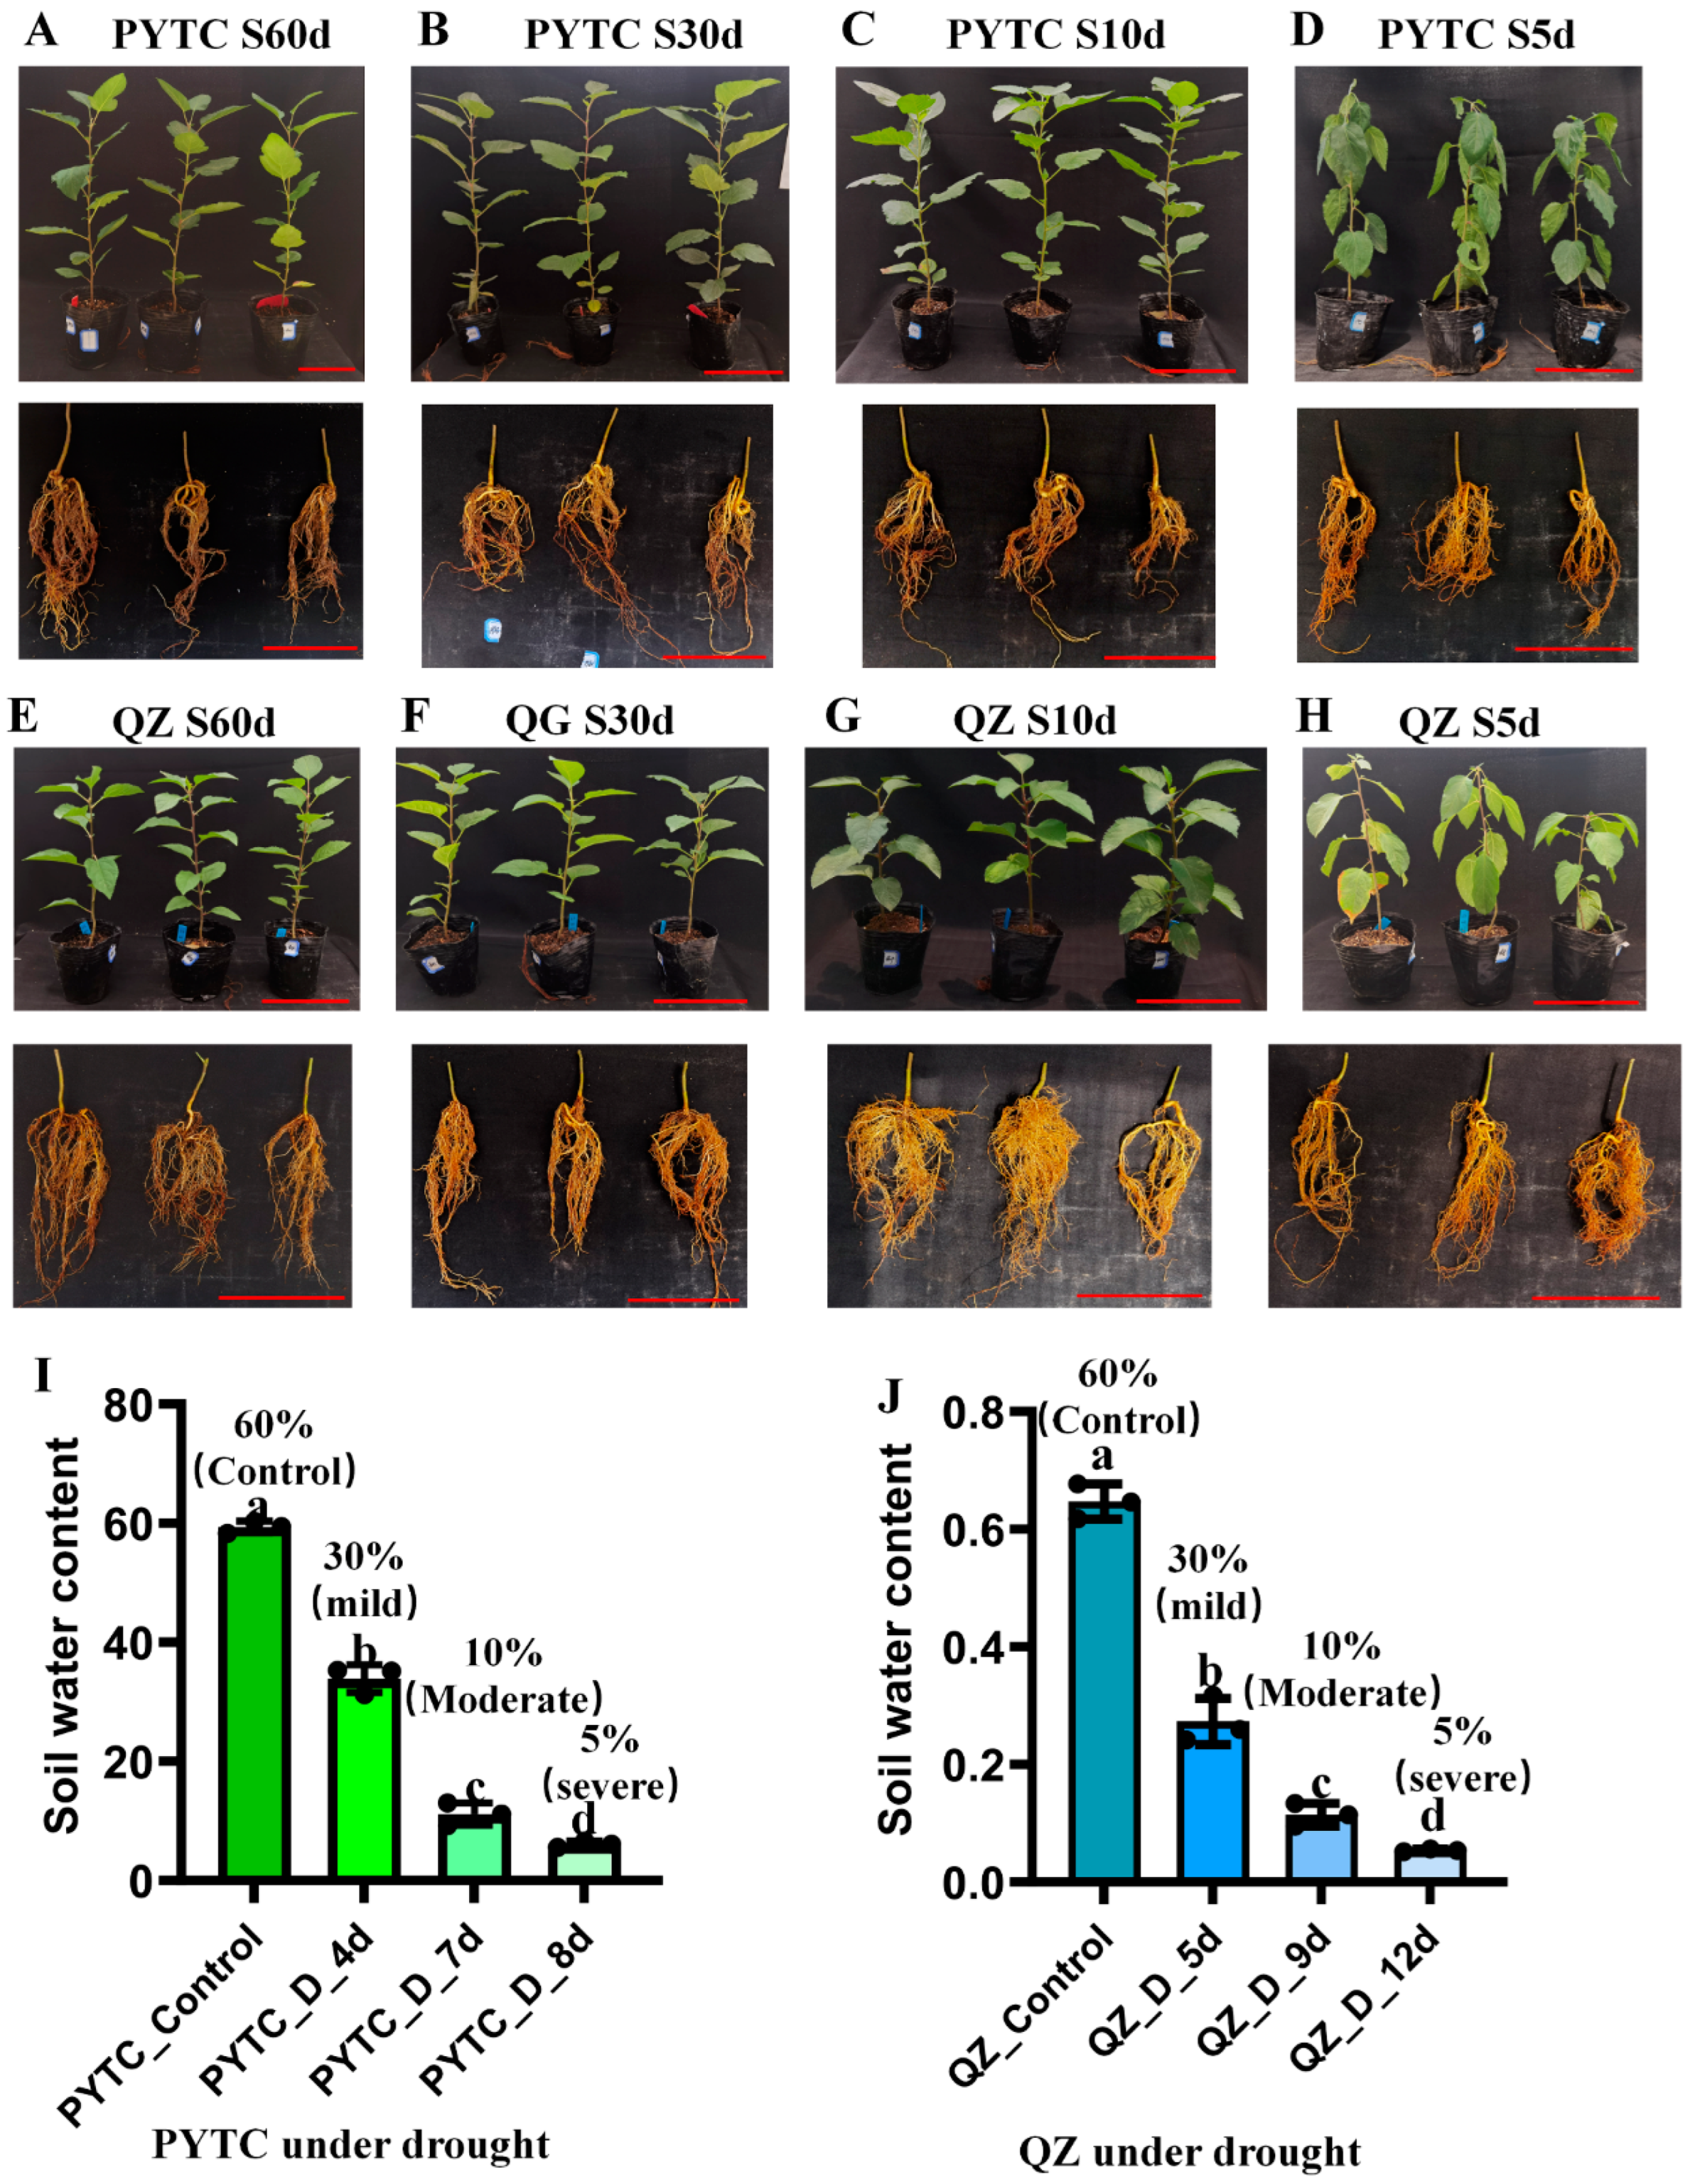
3.1. Drought Treatments on Drought Resistant (Malus prunifolia) and Susceptible (Malus hupehensis) Apple Genotype Roots

To explore the molecular mechanism of apple roots in response to drought stress, we selected drought resistant (Malus prunifolia, QiuZi-QZ) and susceptible (Malus hupehensis, PingYiTianCha-PYTC) apple genotypes to perform drought treatments and collected their root samples under different degrees of drought. The phenotypes of plants and roots under drought treatments were displayed in Figure 1 (Figure 1A–D were PYTC, and Figure 1E–H were QZ). The roots samples were collected when the soil water contents were decreased into nearly 60% (named S60d as the control), 30% (named S30d as the mild drought), 10% (named S10d as the moderate drought), and 5% (named S5d as the severe drought) (Figure 1I,J). We take S60d as the control, S30d as the mild drought, S10d as the moderate drought, and S5d as the severe drought. Generally, the drought treatments were largely inhibited root growth, and the root system of QZ was more developed than that of PYTC. This also corresponds to the previous study that QZ had the higher drought resistance ability among the apple accessions.

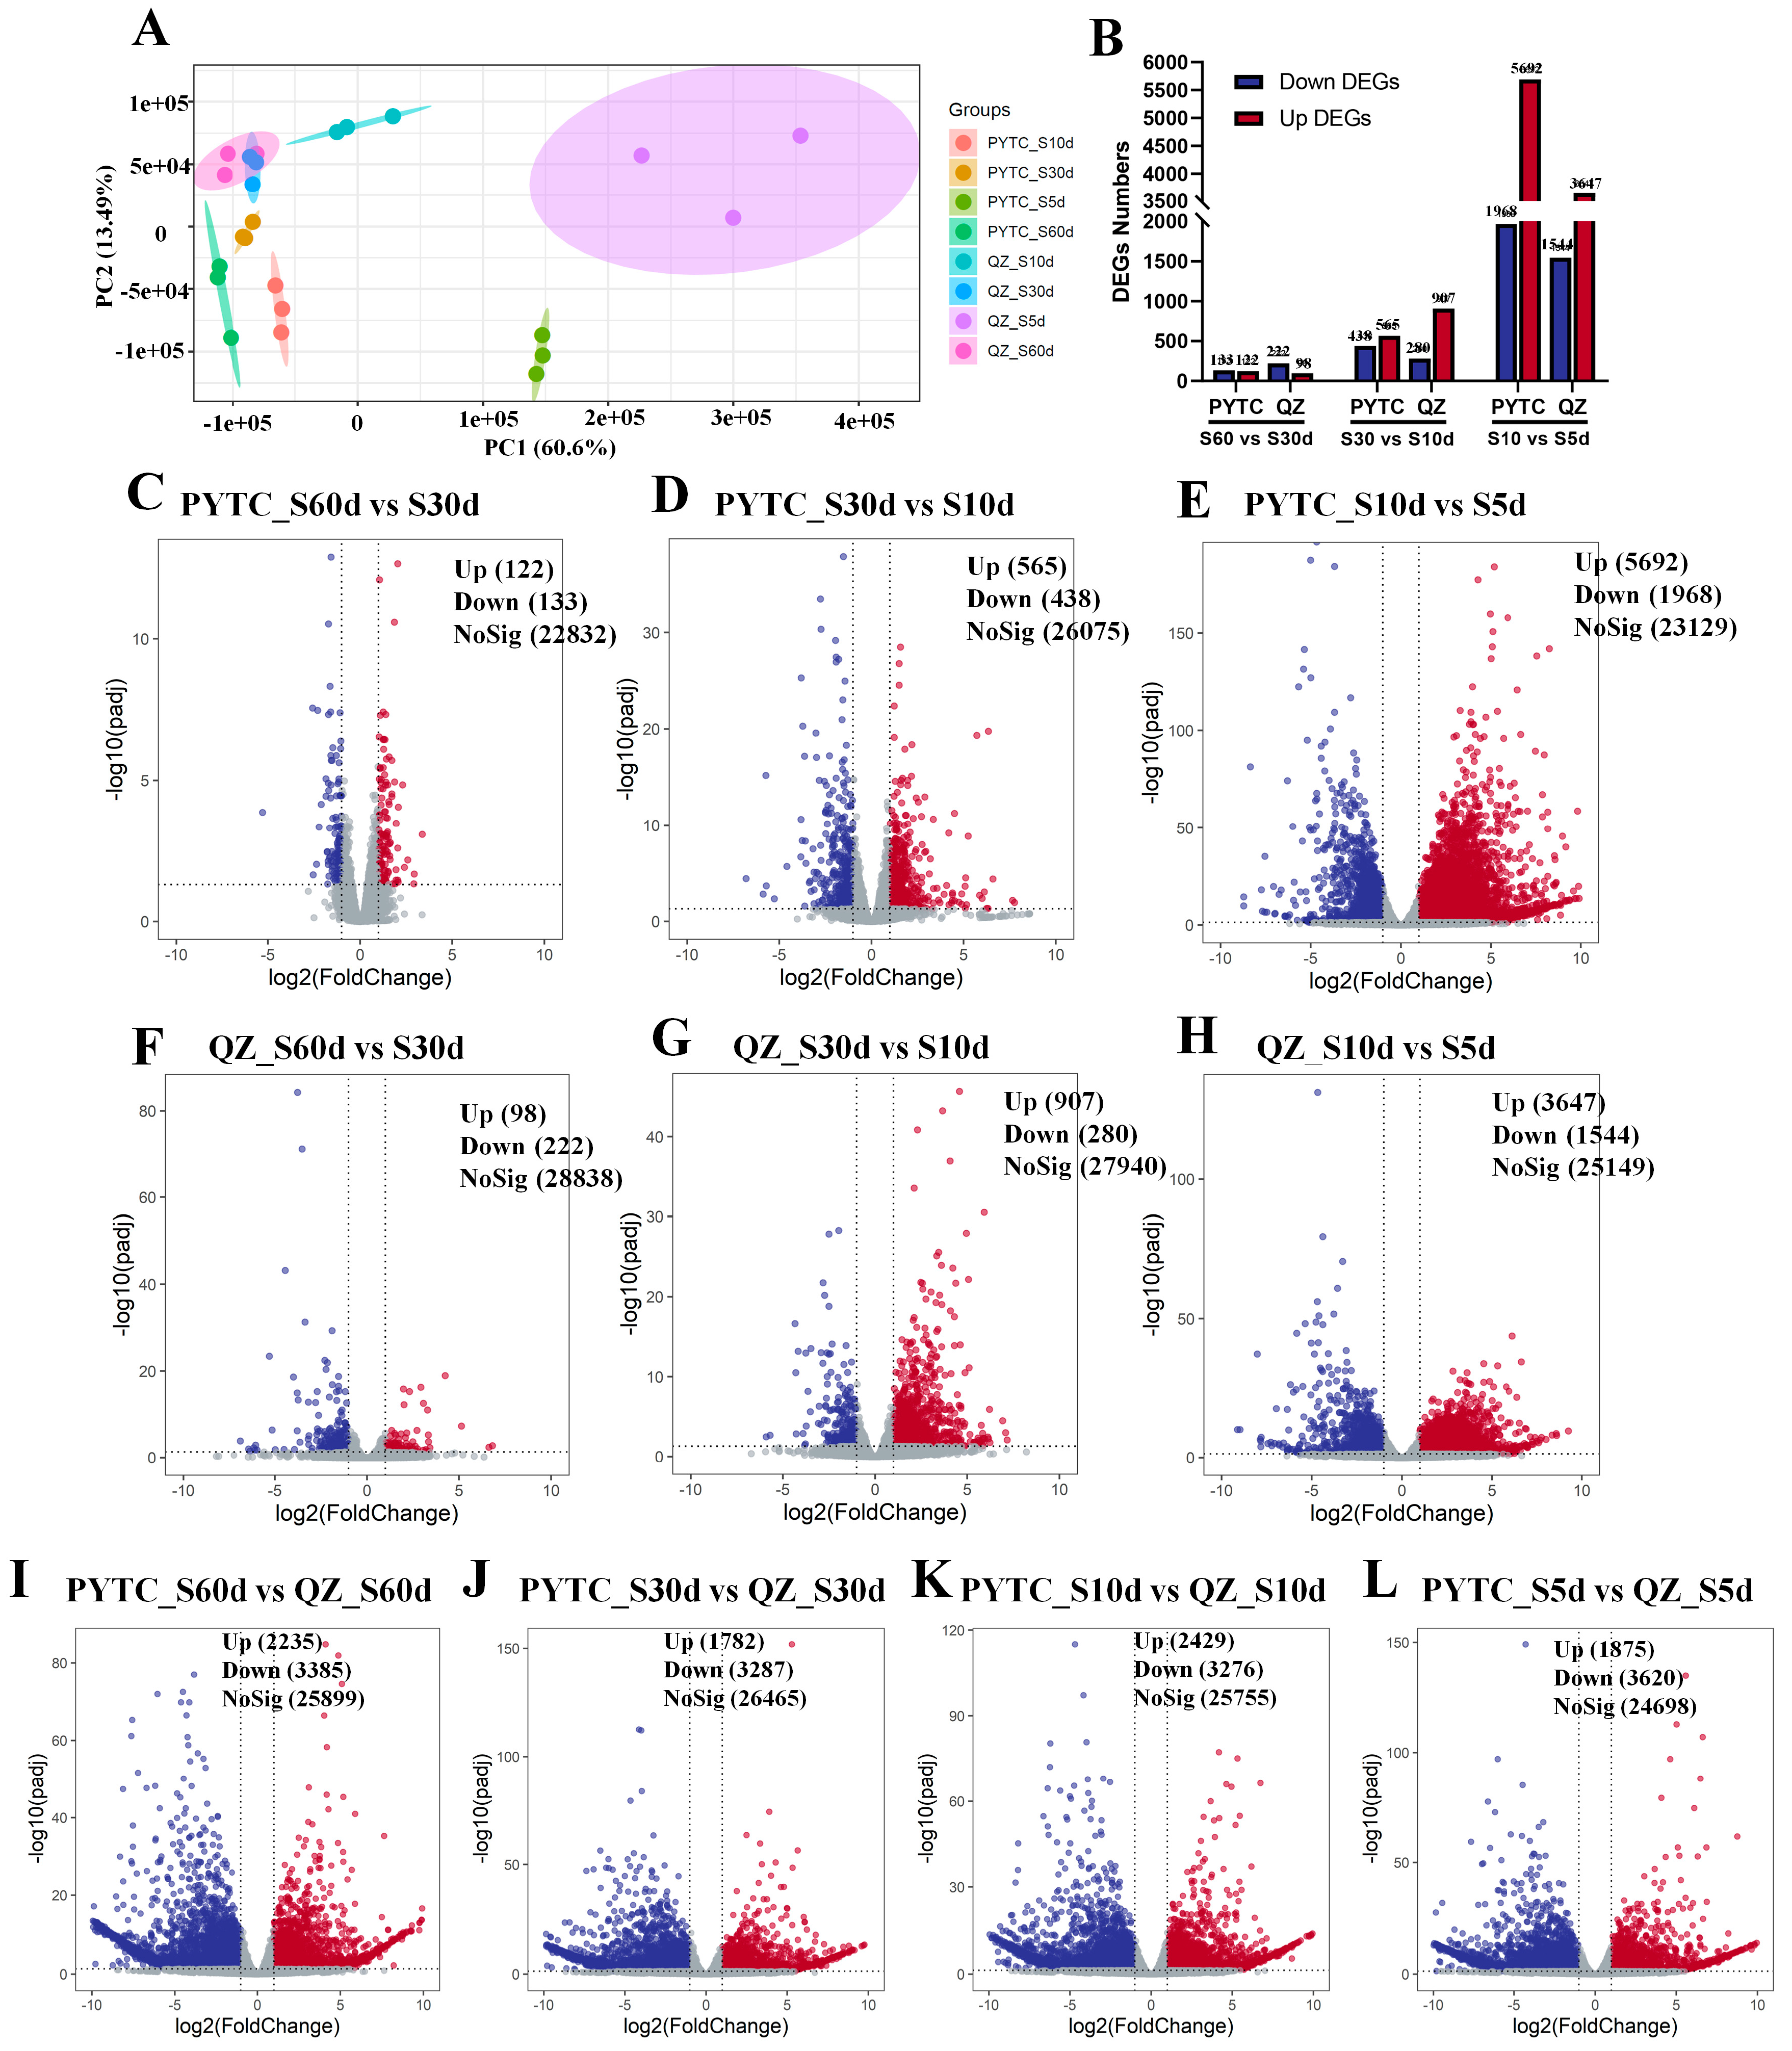
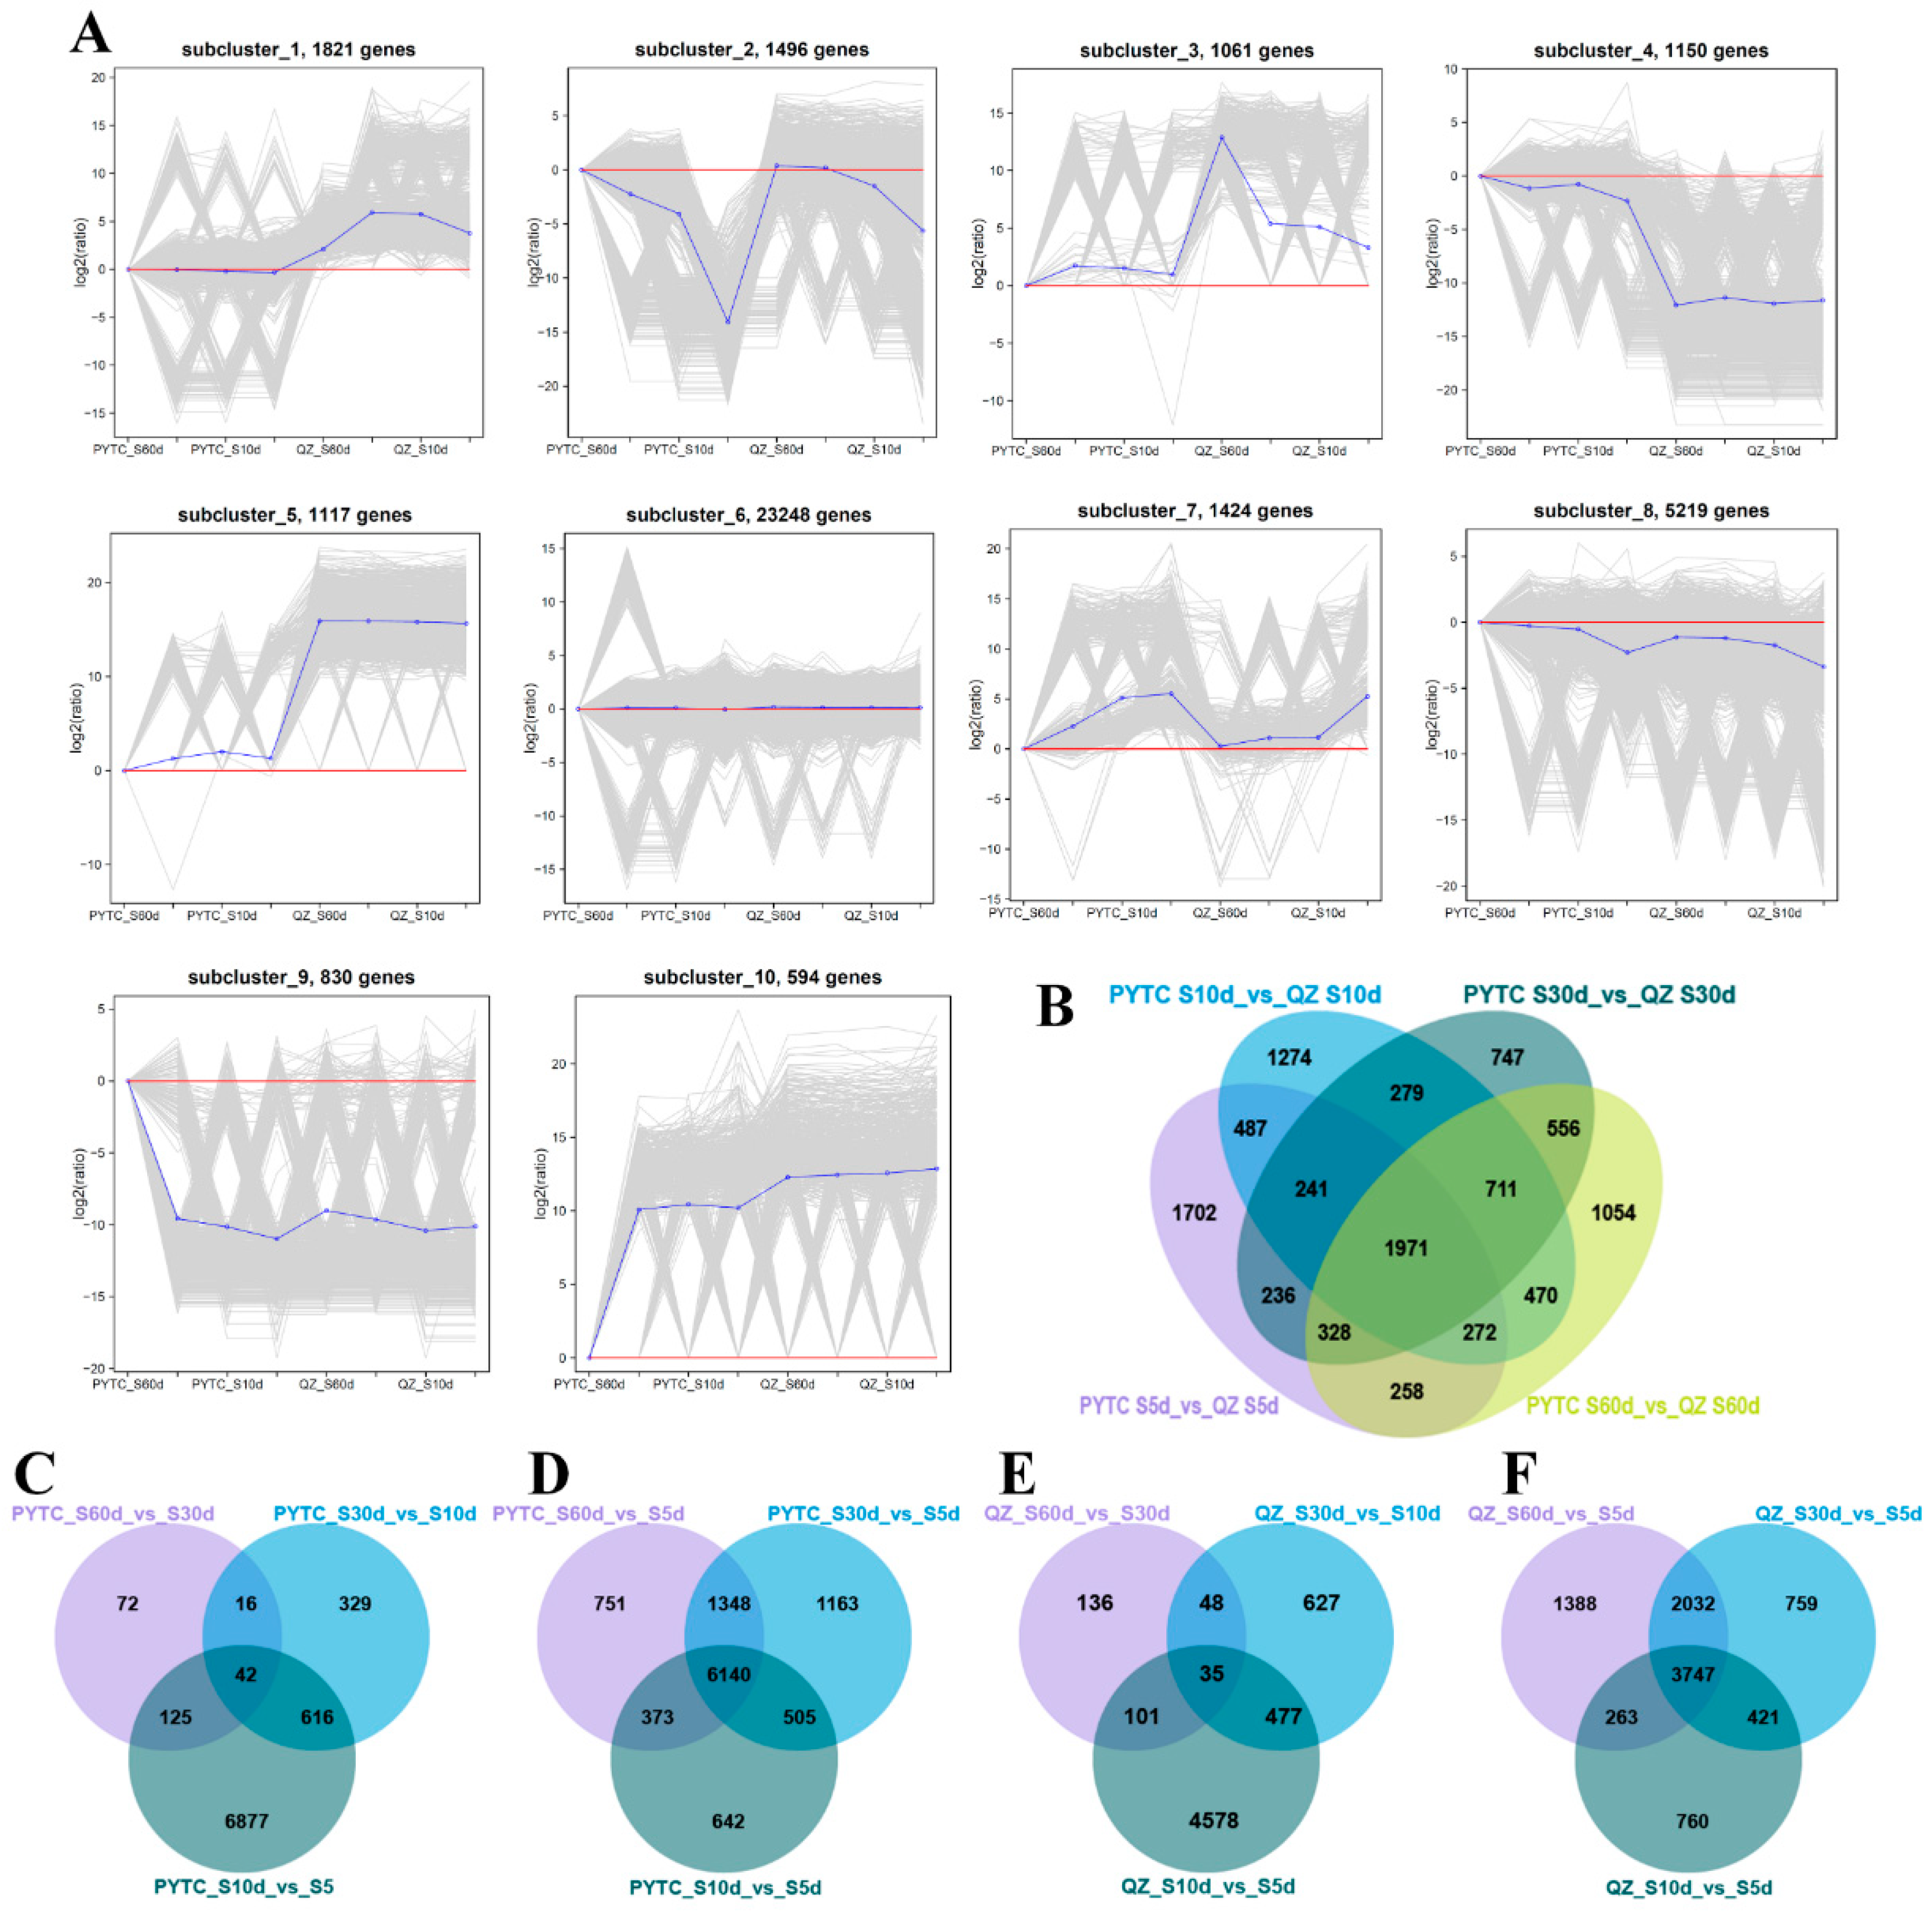
3.2. Transcriptomic Analysis of Malus prunifolia and Malus hupehensis Roots Under Drought

To further revealed the global expression alterations and regulation networks of Malus prunifolia and Malus hupehensis roots under drought, we performed the transcriptomic analysis on the root samples when the soil water contents were 60% (S60d), 30% (S30d), 10% (S10d), and 5% (S5d). More than twenty million clean reads were generated for each sample replicate, and the overall alignment rates were 85.1–87.65% for the PYTC root samples, and the QZ root samples had the 89.76–91.7% overall alignment rates (Supplementary Table S1). The Pearson correlation of read counts for each sample were displayed in Supplementary Figure S1. The further PCA (Principal Component Analysis) for each sample were illustrated in Figure 1A, suggesting the three replicates of the samples had good consistency. After identifying the differentially expressed genes, the differentially expressed genes (DEGs) were identified among PYTC and QZ under different drought degrees (Figure 2B). In detail, the PYTC_S60d vs. S30d (PYTC_ S30d compare with PYTC_S60d) comparison had a total of 255 DEGs with 133 down-regulated DEGs and 122 up-regulated DEGs (Figure 2C). For PYTC_S30d vs. S10d, a total of 1003 DEGs were identified which contained 438 down-regulated DEGs and 565 up-regulated DEGs (Figure 2D). The PYTC_S10d vs. S5d contains 7660 DEGs with 1968 down-regulated DEGs and 5692 up-regulated DEGs (Figure 2E). For the QZ under drought, QZ_S60d vs. S30d, QZ_S30d vs. S10d, QZ_S10d vs. S5d had the 320 DEGs (222 down-regulated DEGs and 98 up-regulated DEGs), 1187 DEGs (280 down-regulated DEGs and 907 up-regulated DEGs), 5191 DEGs (1544 down-regulated DEGs and 3647 up-regulated DEGs), respectively (Figure 2F–H). Interestingly, at the mild drought (S60d vs. S30d), the numbers of up-regulated DEGs were smaller than that of down-regulated DEGs. However, when the apple roots were under moderate and severe drought, the numbers of up-regulated DEGs were quite larger than that of down-regulated DEGs, especially in QZ roots. This implied that the apple roots might respond to mild drought and severe drought based on the different mechanisms. Moreover, the DEGs number in PYTC under severe drought (S5d) was much larger than that in QZ under severe drought (Figure 2E,H). This also suggested that PYTC was more sensitive to drought than that of QZ.
To explore the underling mechanism of drought-resistance difference among PYTC and QZ, we also identified the DEGs among the PYTC and QZ under different drought degrees (Figure 2I–L). For the control water condition, PTYC_S60d vs. QZ_S60d had 2235 up-regulated DEGs and 3385 down-regulated DEGs. For the drought conditions, there are 1782 up-DEGs and 3287 down-DEGs, 2429 up-DEGs and 3276 down-DEGs, as well as 1875 up-DEGs and 3620 down-DEGs between PYTC and QZ under mild (S30d), moderate (S10d) and severe (S5d) drought, respectively. Interestingly, the numbers of down-DEGs were always larger than that of up-DEGs, suggesting that PYTC mobilizes a greater number of genes with high expression levels to cope with drought stress compare with QZ under drought. This also reflected that the PYTC was more sensitive to drought than that of QZ.

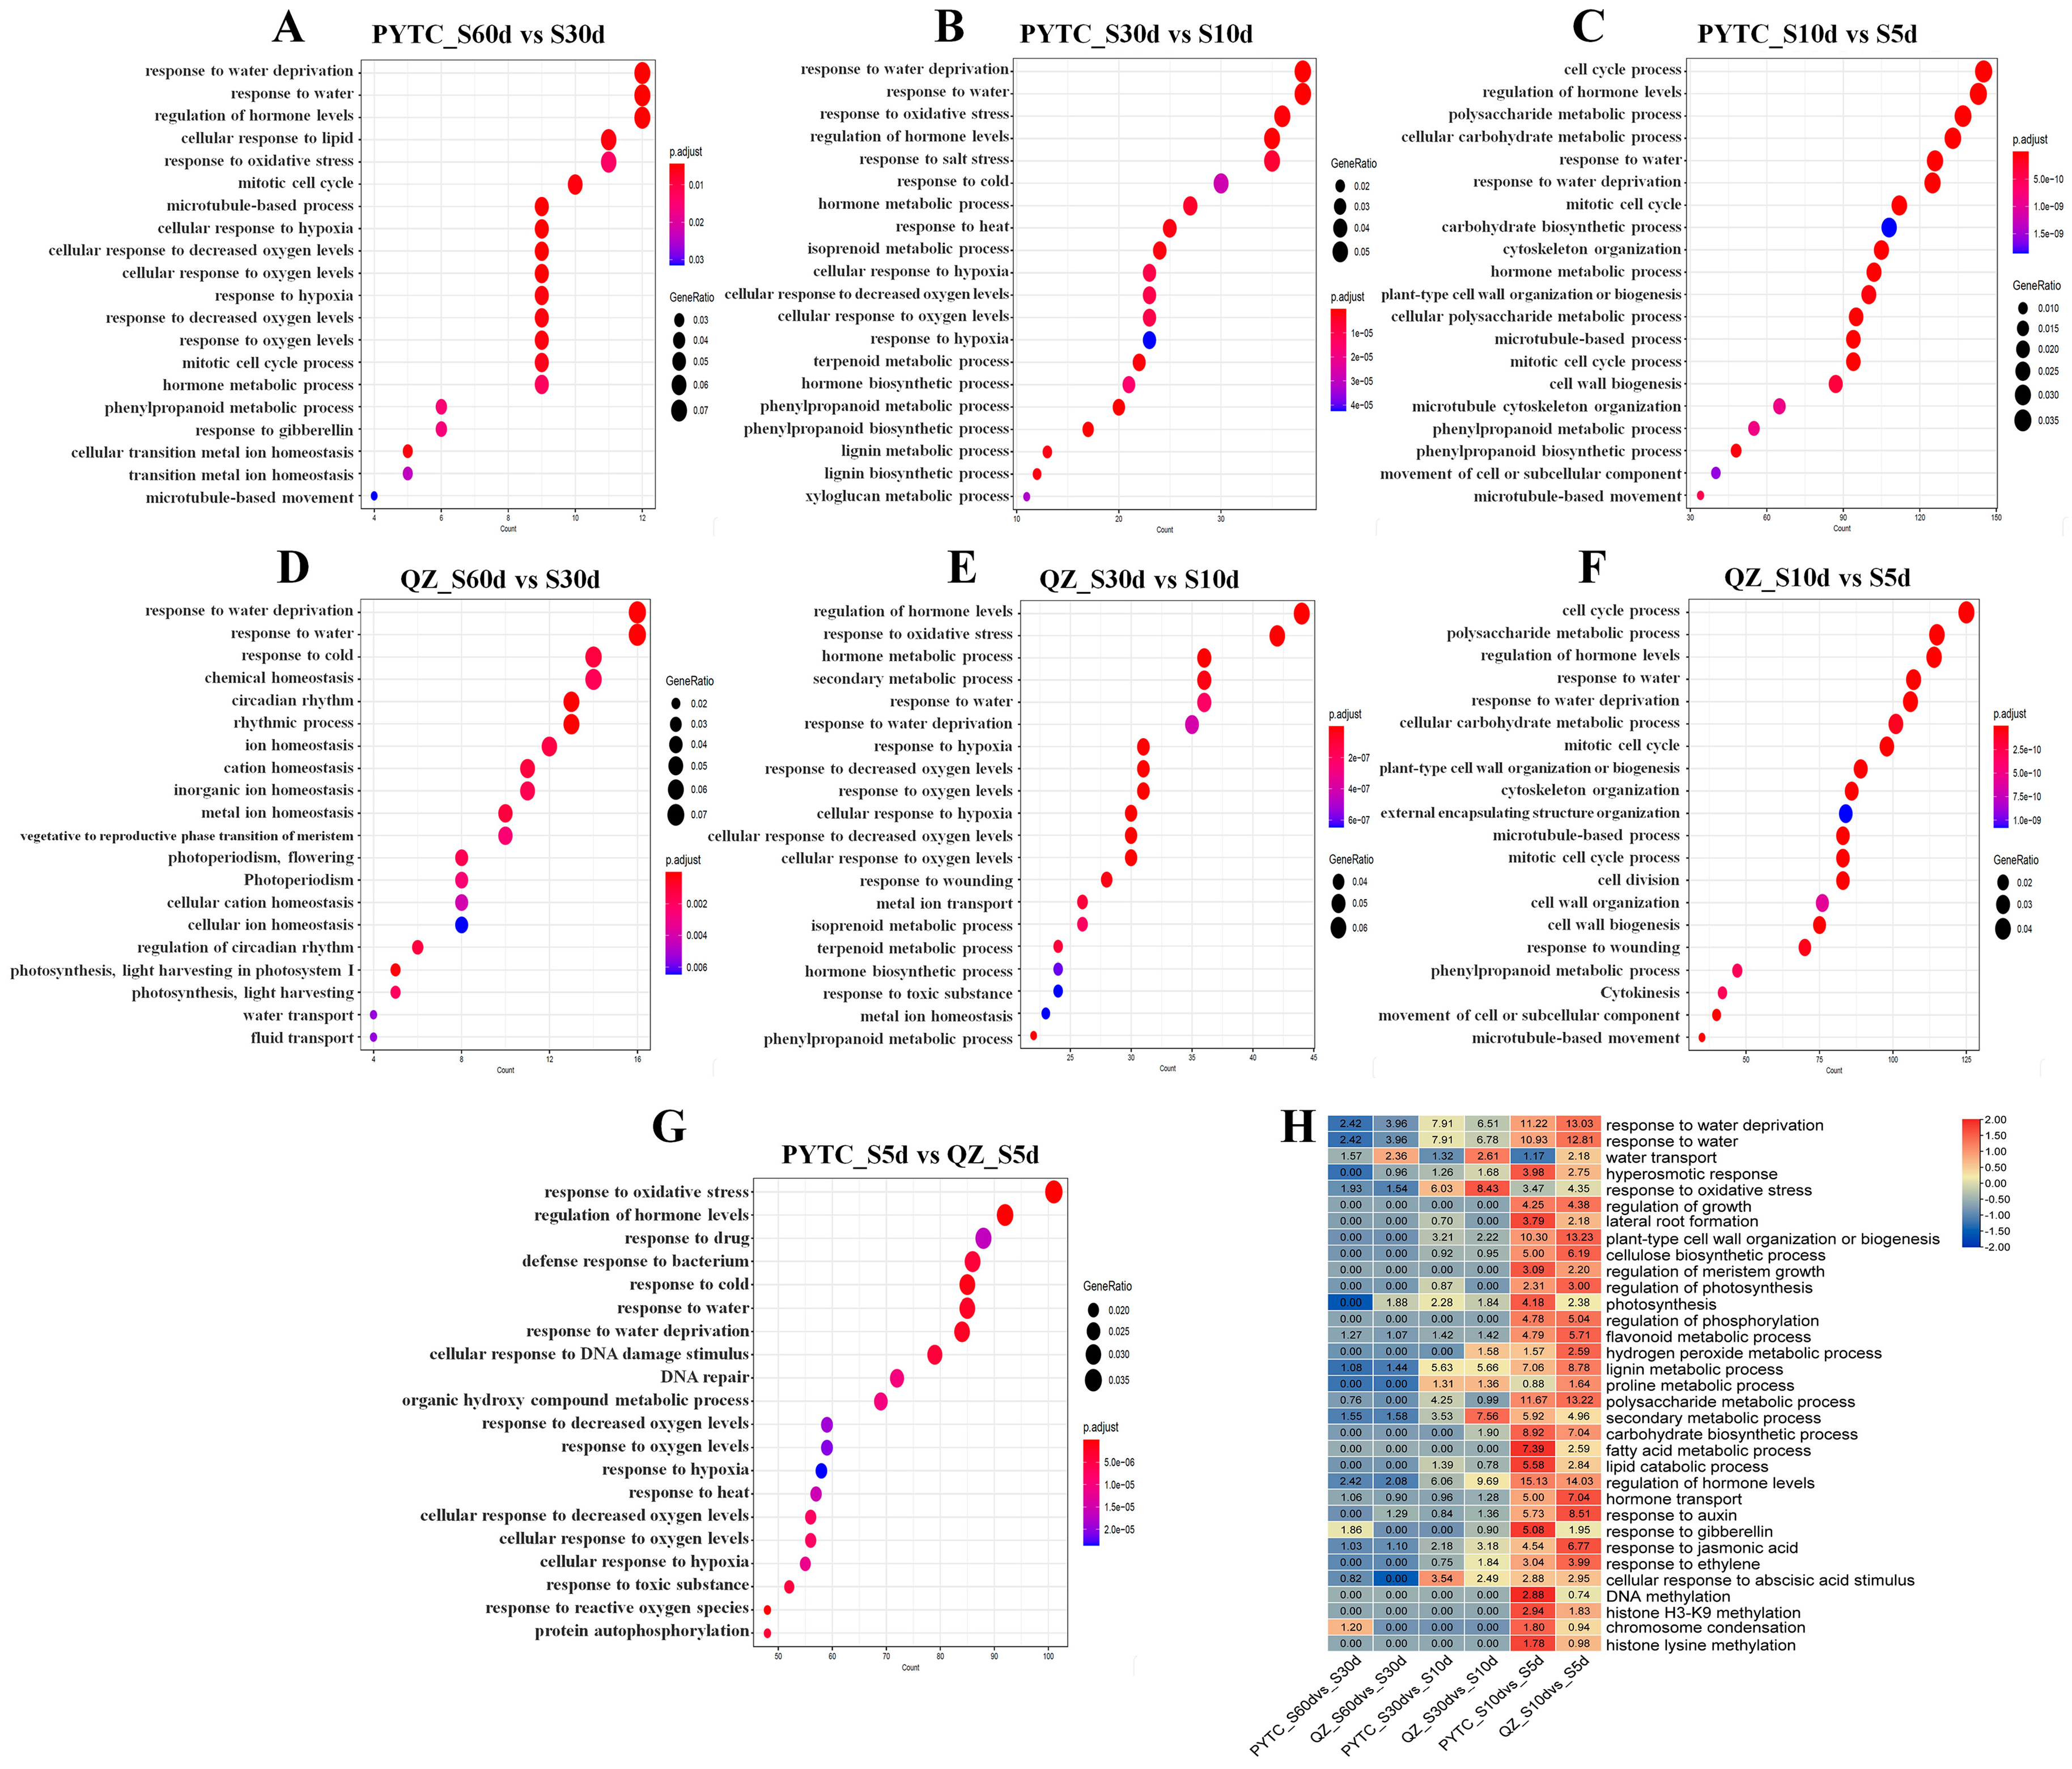
3.3. Gene Ontology (GO) Analysis Revealed the Gene Functions of DEGs Among Malus prunifolia and Malus hupehensis Roots Under Drought

To further investigate the expression changes among Malus prunifolia and Malus hupehensis roots under drought, we performed the cluster analysis according to the gene’s expression abundances. Ten subclusters were assigned and the results were showed in Figure 3A. The results reflected the tendency of gene expression changes among different samples. For example, subcluster 1 presented these genes were up-regulated in QZ under drought, but remain stable in PYTC. For subcluster 4 and 5, these genes showed great expression differences among PYTC and QZ. Subcluster 9 genes presented significant decrease in PYTC under drought but remained stable in QZ; while subcluster 10 genes showed distinct increase in PYTC under drought but remained stable in QZ (Figure 3A). These gene expression differences might relate to the difference of drought resistance among two accessions. To further analyzed the common genes among these two accessions under drought, we overlapped the DEGs among PYTC and QZ under different drought degrees (Figure 3B). Notably, a substantial proportion of genes (1971 DEGs) were shared across the all-comparative combinations of the four periods. The results suggested that these genes were basically differentially expressed among these two accessions, even remained differentially expressed across the four drought periods and might play a role in drought response (Figure 3B). However, three combinations concerning PYTC_S60d vs. S30d, PYTC_S30d vs. S10d, and PYTC_S10d vs. S5d shared a small proportion of common genes (Figure 3C). Correspondingly, a similar situation was also observed in QZ (Figure 3E). This result suggested that there were different manners for apple roots modulating gene expression alterations in response to mild, moderate and severe drought. Interestingly, when we overlapped DEGs from S60d vs. S5d, S30d vs. S5d, and S10d vs. S5d, a great proportion of genes were shared among the three combinations in both PYTC (Figure 3D) and QZ (Figure 3F), especially in PYTC. This result indicated that plants altered lots of common genes expression levels in response to severe drought status.
In order to explore the functions of DEGs, we assigned DEGs among different combinations to Gene Ontology (GO) catalogs. For PYTC_S60d vs. S30d, DEGs significantly enriched in “response to water deprivation”, “response to water”, “regulation of hormone levels”, “response to oxidative stress” and so on (Figure 4A), which were closely related to the drought response. The PYTC_S30d vs. S10d showed similar GO catalogs with PYTC_S60d vs. S30d (Figure 4B). However, PYTC_S10 vs. S5d contains “carbohydrate metabolic process”, “hormone metabolic process” in addition to “response to water” (Figure 4C). This implied that apple roots modulated different genes in response to severe drought compare with mild and moderate drought. Also, the DEGs in QZ roots under drought presented a similar GO manner to PYTC roots under drought (Figure 4D–F). However, we also compared the PYTC_S5d with QZ_S5d, the GO catalogs were mainly in “response to oxidative stress”, “regulation of hormone levels” (Figure 4G), implying that DEGs among PYTC and QZ under severe drought might involve in oxidative and hormone processes. As shown in Figure 4H, the significances of enrichment GO catalogs were displayed with heatmaps and the results showed that many drought-related GO catalogs were significantly enriched, such as water deprivation response, oxidative stress, photosynthesis, proline metabolism, hormone processes and so on, especially under the severe drought condition (Figure 4H).

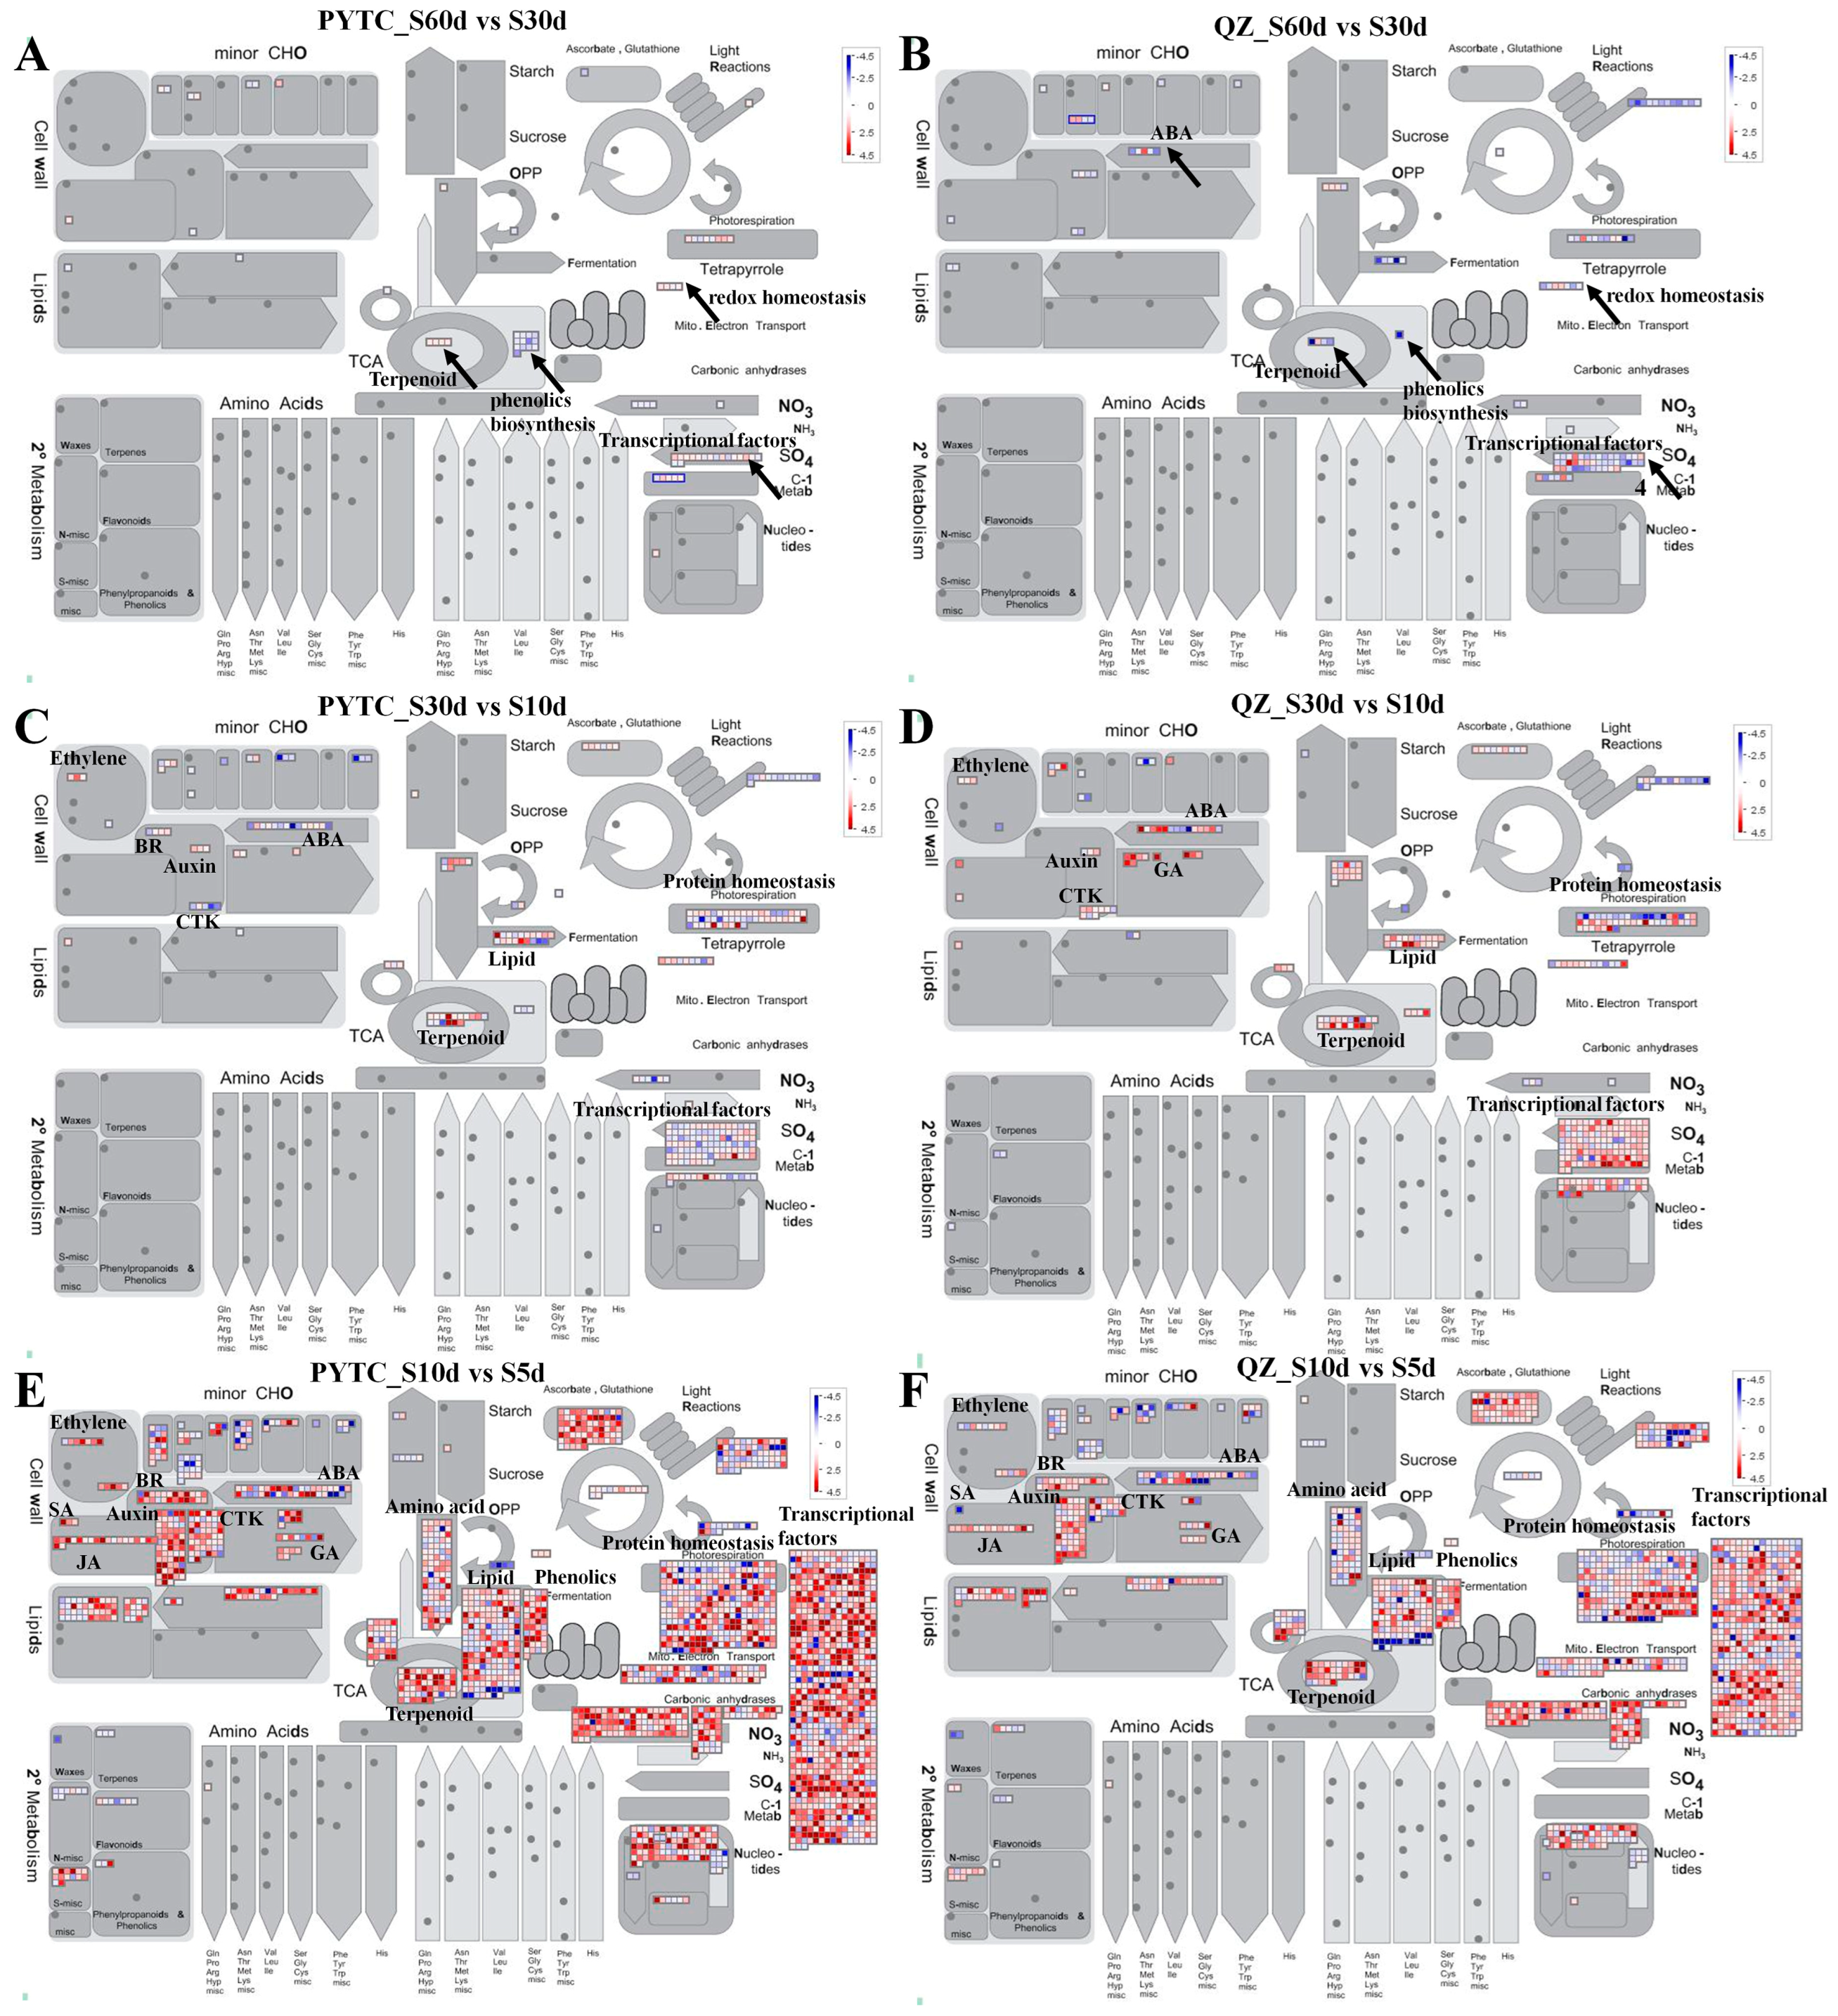
3.4. Differentially Expressed Genes Involved in Various Biological Regulatory Pathways

In order to further investigate the DEGs participating the biological regulatory pathways, we assigned DEGs into Mapman pathway bins (http://mapman.gabipd.org/home, accessed on 20 February 2025). For PYTC_S60d vs. S30d, DEGs involved in phenolics biosynthesis including PAL, three CHS genes, CHIL, two FLS genes, HIS, two ANS genes, and LAR were significantly down-regulated, while four genes involved in terpenoid biosynthesis were up-regulated (Figure 5A). This result suggested that these genes, as well as the flavonoid and terpenoid metabolites, play a role in apple roots under mild drought (early response period). Also, four genes involved in redox homeostasis were up-regulated (Figure 5A). Notably, abundant transcriptional factor genes including bZIP, bHLH, DOF, SBP, HD-ZIP, MYB, BBX, NAC, WRKY, ERF, etc. were generally up-regulated, suggesting they play a role in early drought response (Figure 5A). Concerning the QZ under mild drought, in addition to genes involved in flavonoid and terpenoid metabolites, as well as redox hemostasis (Figure 5B), gene involved in ABA biosynthesis and signaling, including ABI1, NCED, PYL, and ATTR, were assigned (Figure 5B). Interestingly, much more transcriptional factor genes were responded to the mild drought in QZ than that of in PYTC (Figure 5A,B). It seems that ABA pathway related genes and transcriptional factor genes were more active in QZ than that of in PYTC under early drought response. Generally, mild drought stress disrupts a relatively small number of biological pathways, corresponding to the fewer differentially expressed genes observed.
Based on the early drought response, the moderate drought enhanced the modulation of terpenoid metabolites, ABA pathway, redox homeostasis, and transcriptional factor genes which affected under mild drought (Figure 5C,D). In addition to these pathways, the hormone pathways including ethylene (ETH), brassinosteroid (BR), auxin, cytokinin (CTK), as well as lipid metabolism and protein homeostasis were generally activated in PYTC under moderate drought (Figure 5C). Similarly, these pathways were also activated in QZ under moderate drought, but the activation degree is much higher than that in PYTC, with a greater number of DEGs and a larger magnitude of gene upregulation (Figure 5D). Moreover, in addition to ETH, auxin, ABA and CTK pathways, genes involved in GA pathways were distinctly induced in QZ under moderate drought (Figure 5D). Combining to the reactions of PYTC and QZ under mild and moderate drought, it seems that genes involved these pathways were sensed earlier and stronger under mild and moderate drought in QZ than that in PYTC, suggesting that this might be the one of reasons for QZ as the drought-resistance germplasm.
For the apple roots under severe drought stress, two apple accessions roots mobilized a wide range of genes involved in various biological pathways to cope with drought, including hormone pathways (ETH, BR, SA, JA, Auxin, BR, CTK, GA, and ABA), primary metabolism (amino acid), secondary metabolism (Phenolic biosynthesis, Terpenoid and Lipid metabolism), protein homeostasis, and abundant transcriptional factors (Figure 5E,F). Most of genes were generally up-regulated under S10d vs. S5d (Figure 5E,F). Interestingly, the severe drought stage activated more hormone pathways. For example, the mild drought only disturbed the ABA pathway in the QZ, and the moderate drought modulate a small amount of the gene expression in ETH, CTK, Auxin, GA (only in QZ). However, severe drought activated abundant genes involved in known hormone pathways, implying that the apple plants were struggled from the damage of severe drought. Notably, it was obvious that the numbers of DEGs in PYTC under S10d vs. S5d (Figure 5E) were much more than that in QZ under S10d vs. S5d (Figure 5F). This result was contrary to the mild and moderate drought among PYTC and QZ, which QZ had more DEGs than that of PYTC under mild and moderate drought (Figure 5A–D). These results reflected that QZ responded drought signal earlier and mobilized more genes to resist drought at early period than that in PYTC. When severe drought was coming, the gene perturbations caused by drought in QZ were fewer than those in PYTC, resulting in greater stability for the vital activities. This might be the reason of QZ as the drought-resistance germplasm.

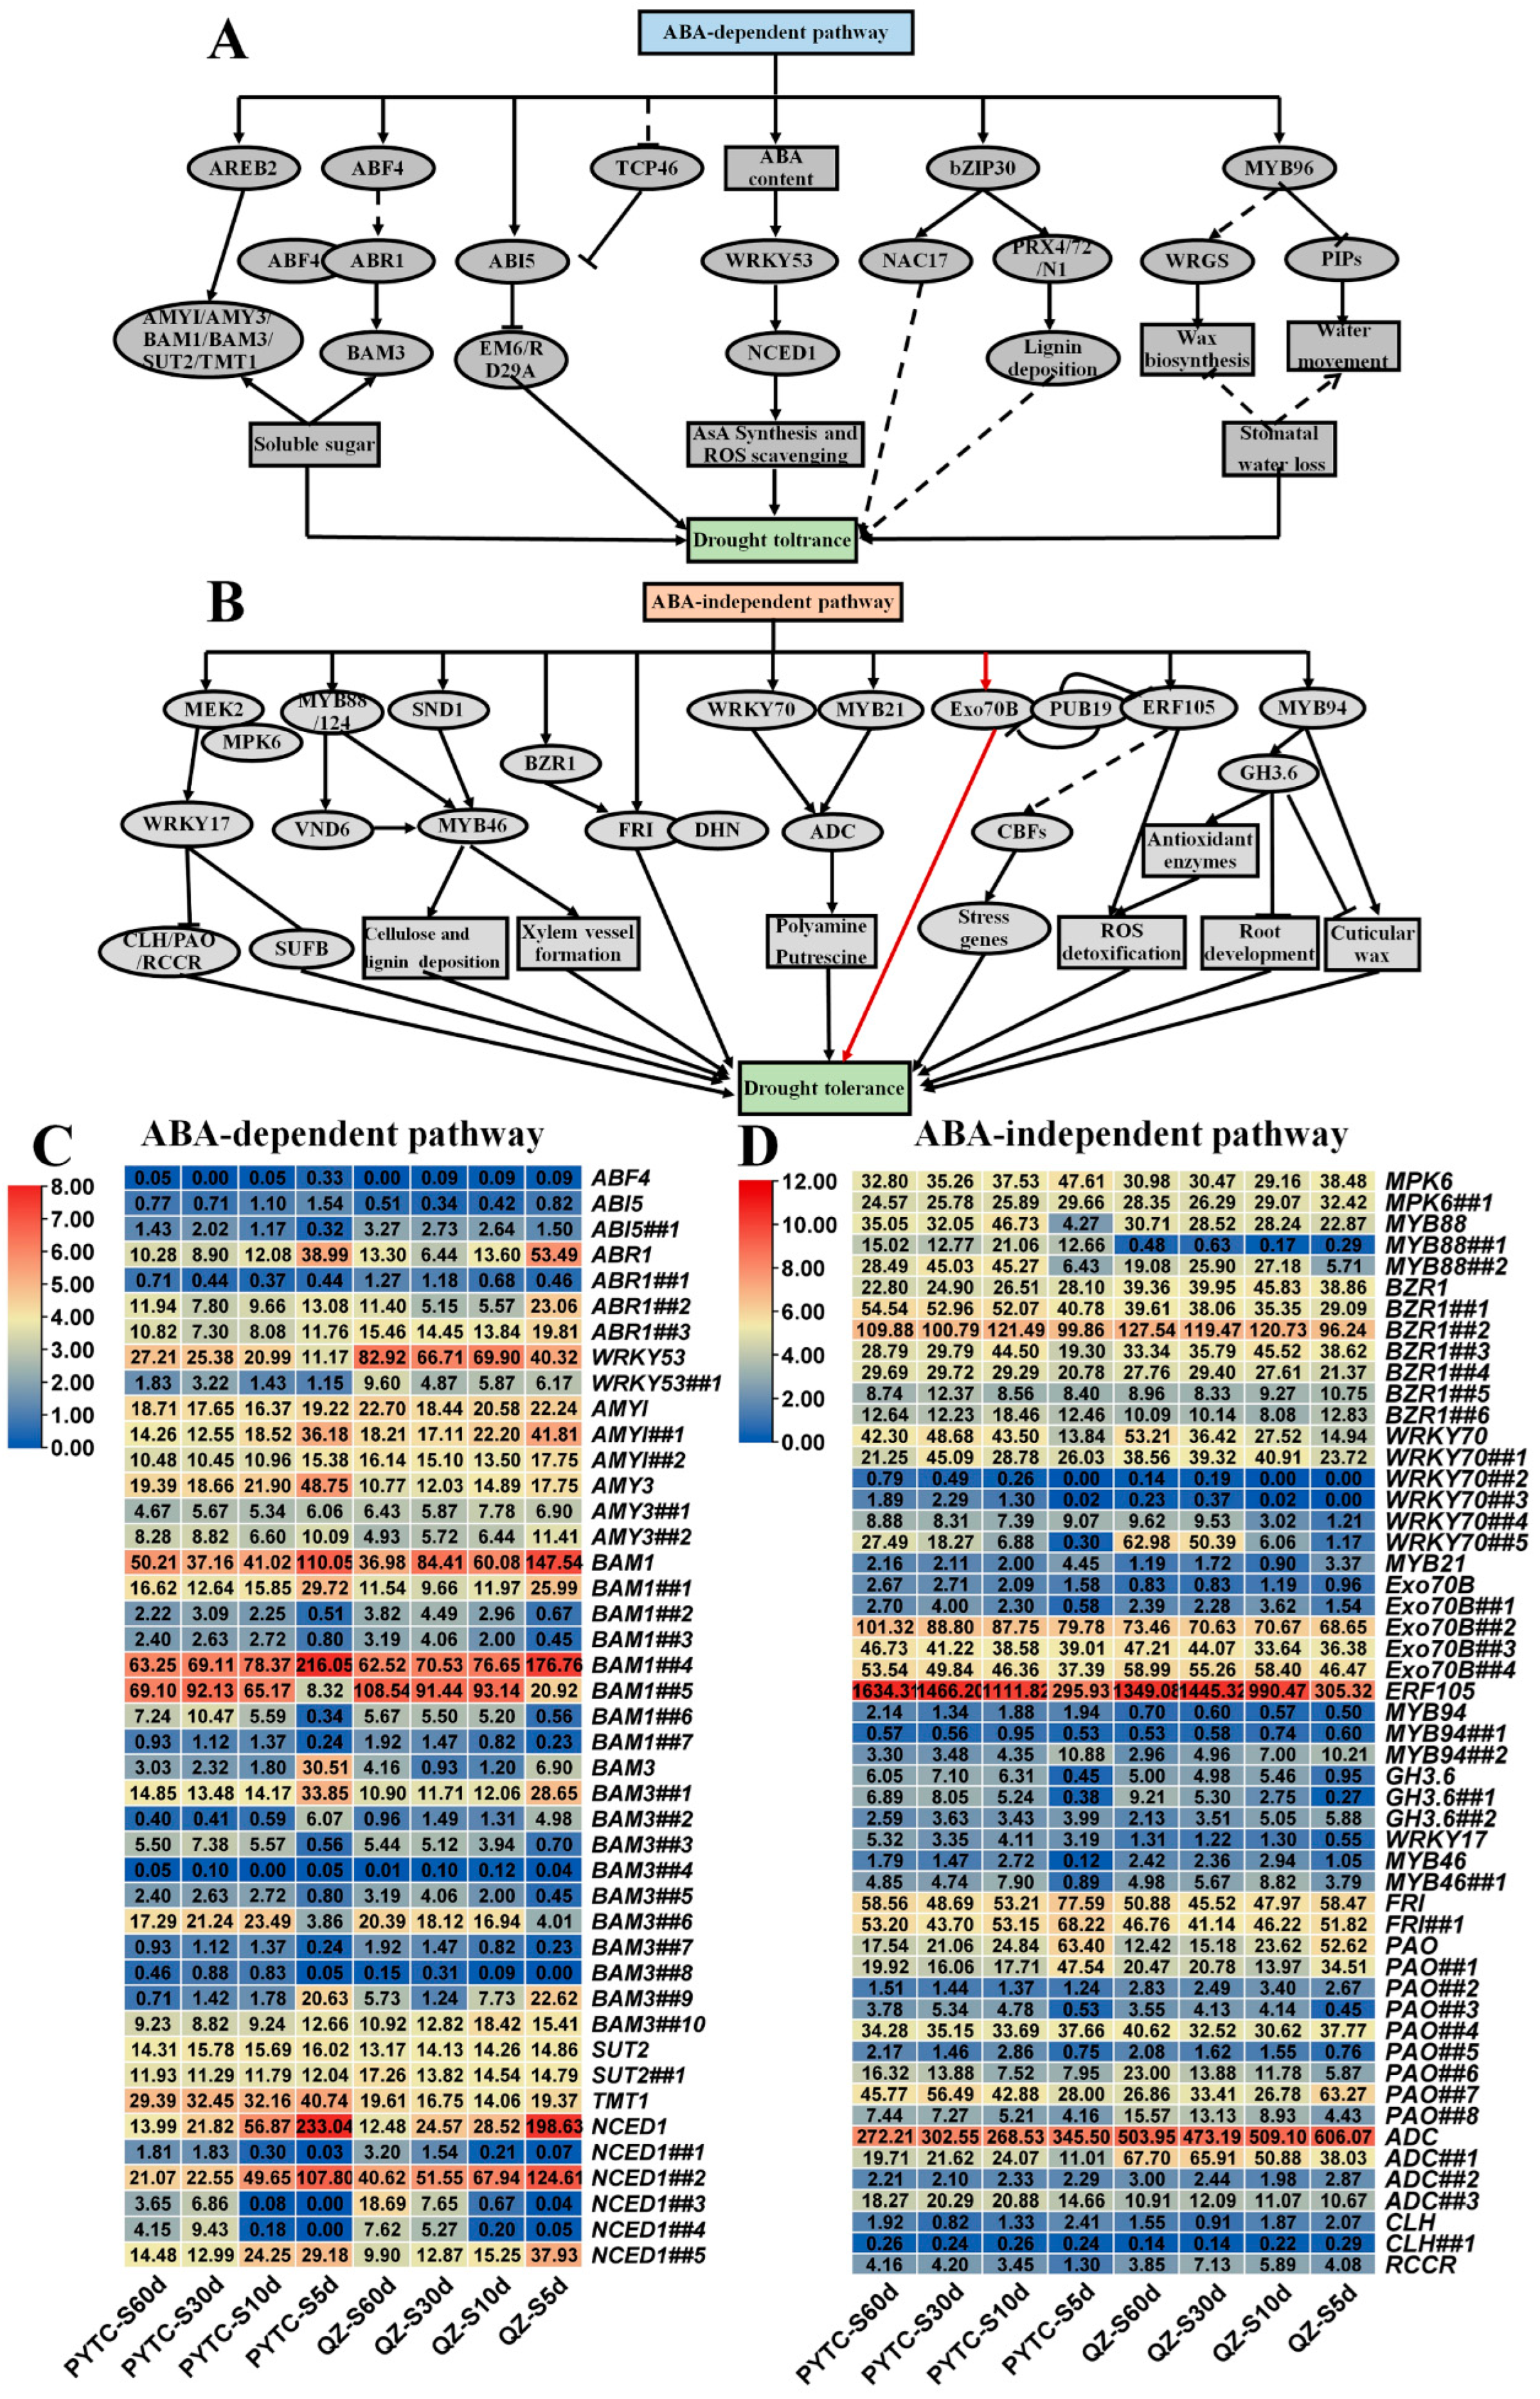
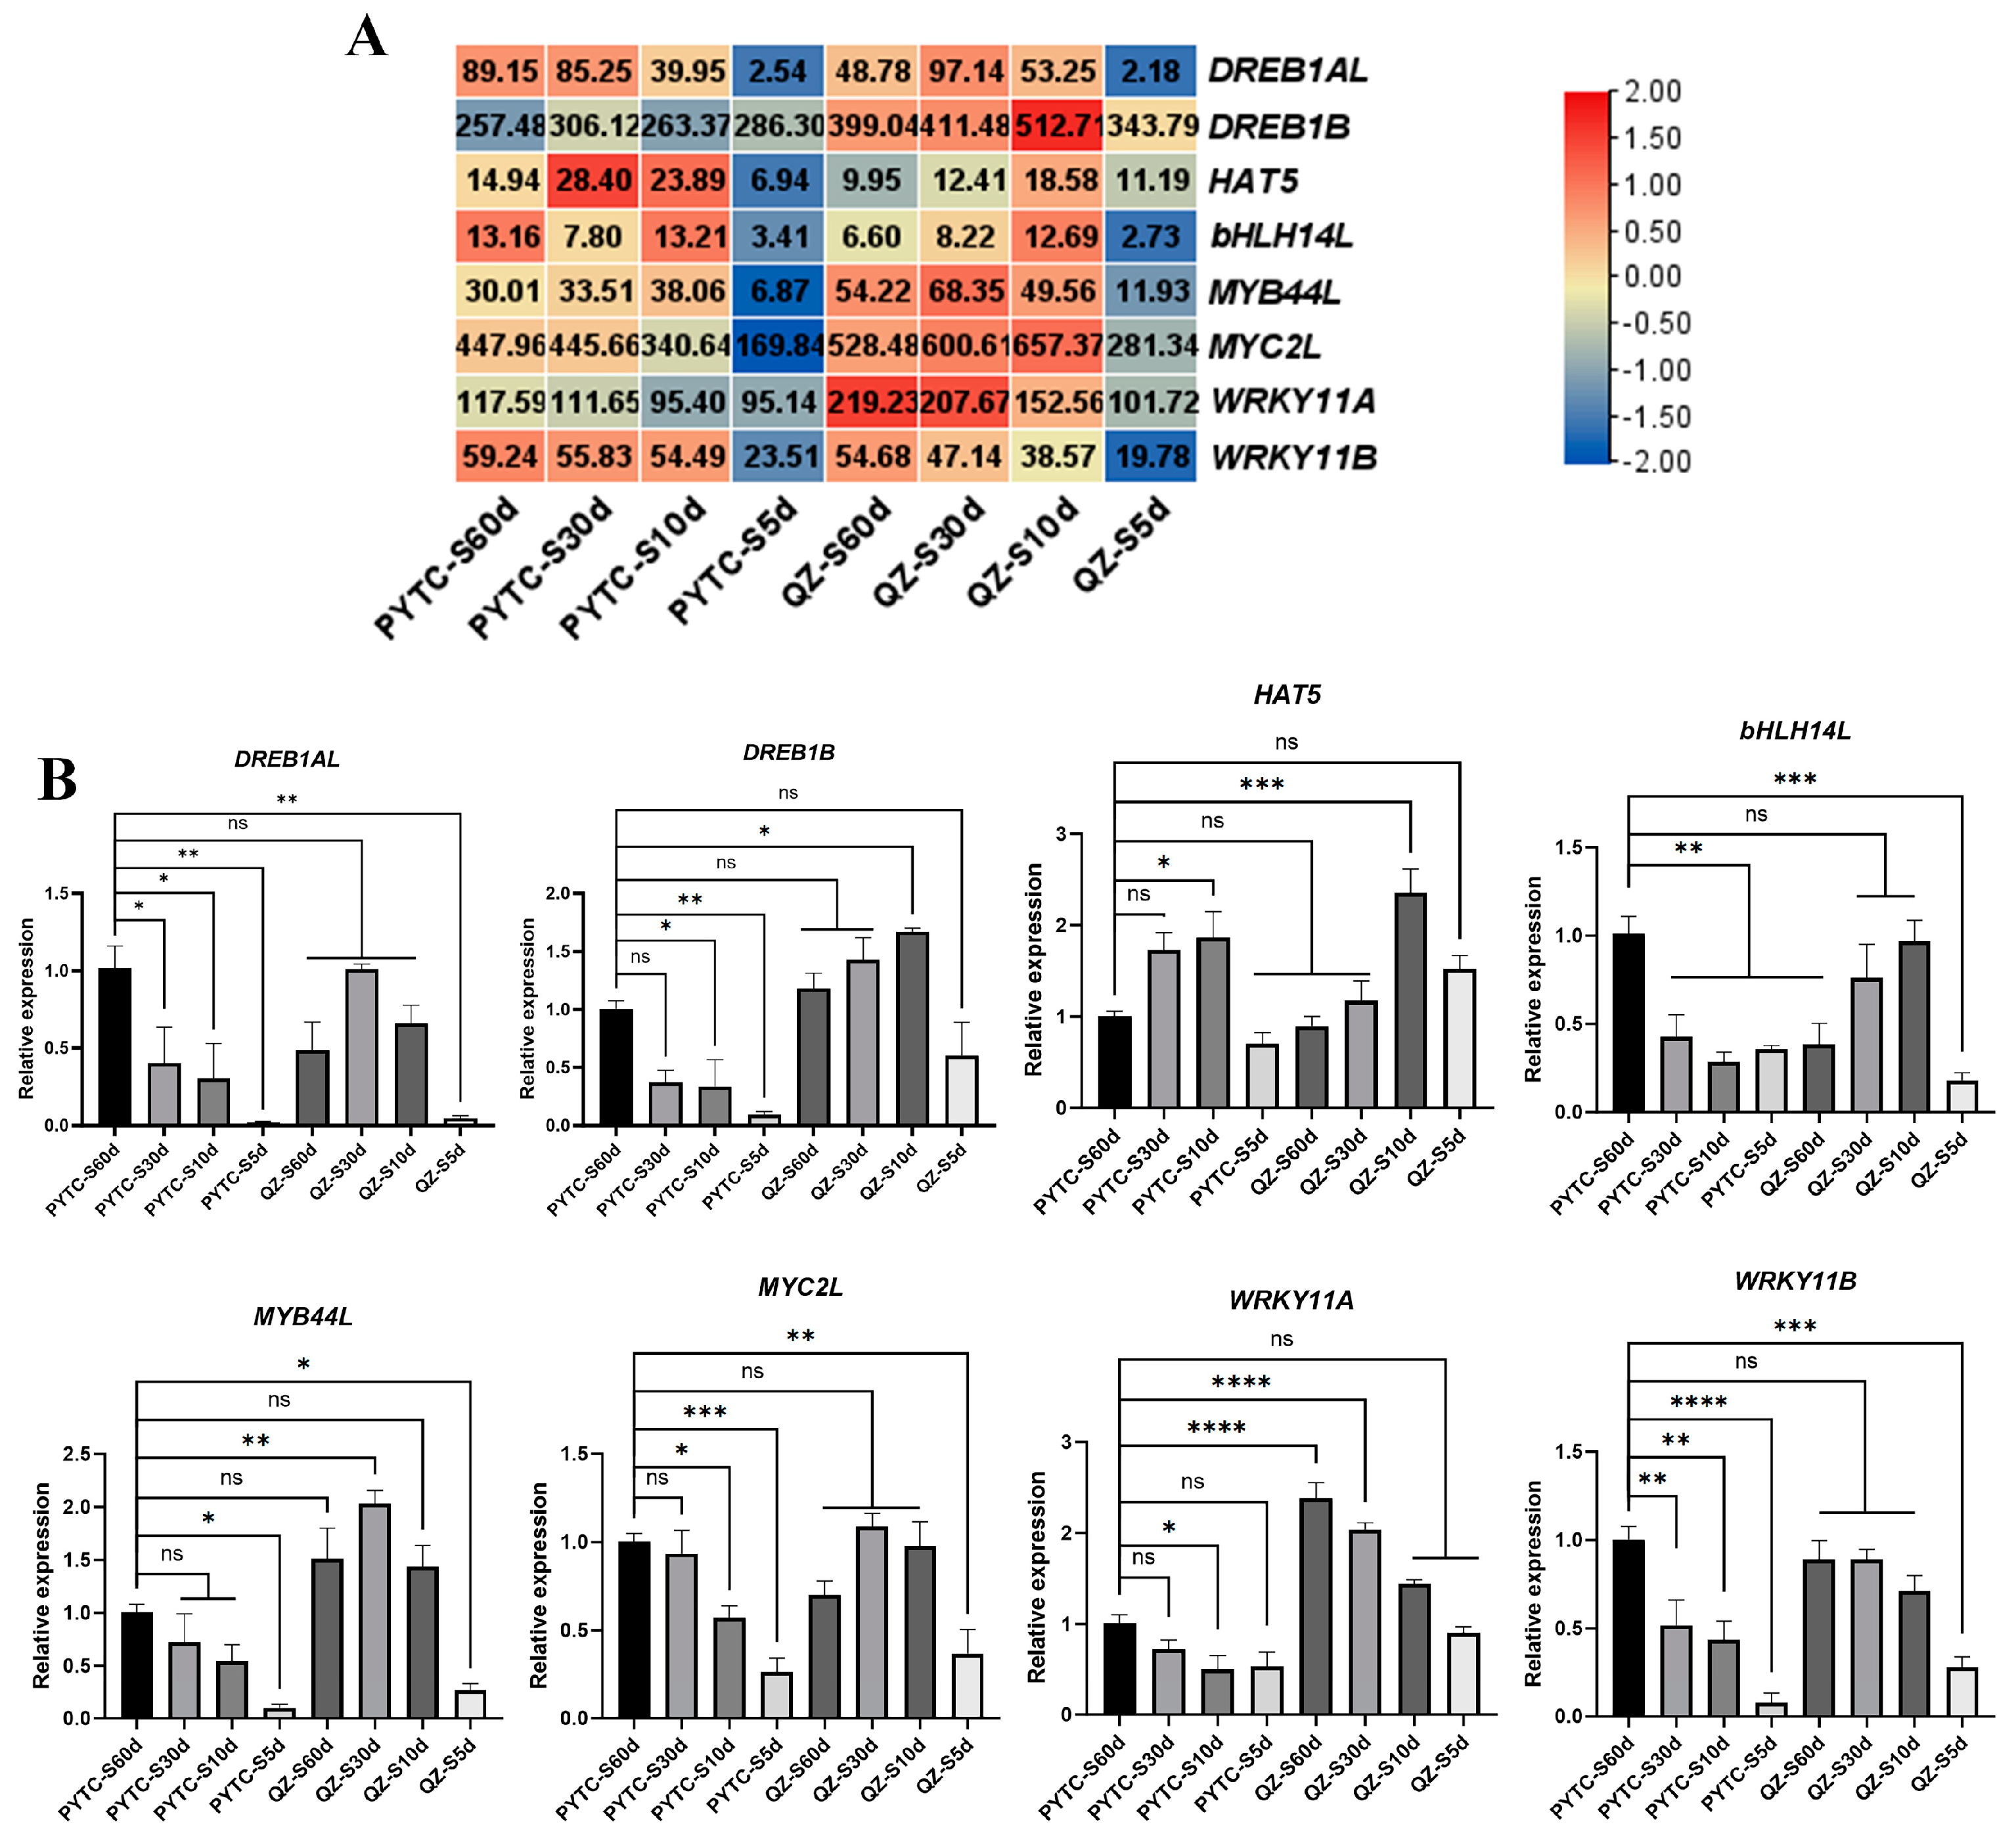
3.5. Gene Expression Alterations in Drought-Responsive Pathways

To further explore the expression changes of known drought-responsive genes in two apple accessions under drought, we have compiled the known drought-responsive genes involved in ABA-dependent (Figure 6A) and ABA-independent pathways (Figure 6B) [3]. Then, we investigated these gene expression alterations among apple roots samples under drought. As shown in Figure 6C, abundant genes were activated in response to drought, such as ABR genes, AMY genes, as well as most of BAM genes, especially ABR1, AMY1##1, AMY3, BAM1, BAM1##4, BAM3##1 and BAM3##9 (Figure 6C). ABR is the abbreviation of “ABA responsive” and involved in ABA response pathway. AMYs are the amylase genes which are the targets of the MdAREB [7]. The BAM (BARELY ANY MERISTEM) is the receptor proteins of drought-induced peptide CLE25, which generates in roots under drought and transfers to the vasculature and the leaves. The combination of CLE25-BAM activated the expression of NCED3 (9-cis-epoxycarotenoid dioxygenase 3), the key gene of ABA biosynthesis, resulting in the increase of ABA contents and closure of stomatal in response to drought [35]. Our results also showed that the distinct up-regulation of BAM genes were activated the expression of NCED genes (Figure 6C). For example, the expression levels of NCED1, NCED1##2 and NCED1##5 were extremely up-regulated under drought, especially under severe drought stress (Figure 6C).
However, concerning the ABA-independent pathway, a considerable proportion of genes involved in ABA-independent pathway are down-regulated its expression under drought, such as MYB88, BZR1##2, WRKY70, WRKY70##5, ERF105, ADC##1, especially ERF105 (Figure 6D). Previous study indicated that grapevine ERF105 promotes tolerance to abiotic stress and is degraded by the E3 ubiquitin ligase VviPUB19 [36]. Maybe ERF105 in our study has different functions in apple roots under drought. On the contrary, the expression level of FRI, and PAO gene members were activated under drought (Figure 6D). FRI (FRIGIDA) is a key regulator of flowering time and drought tolerance and overexpression of CiFRI enhanced the ability of ROS detoxification in transgenic lines under drought [37]. PAO (pheophorbide a oxygenase) was involved in chlorophyll degradation, so the up-regulated PAO genes might induce the chlorophyll degradation to against drought stress.
To further validate the expression changes of the drought-responsive genes in roots, we selected eight candidate genes to analyze their expression changes by qRT-PCR technology. As shown in Figure 7, the expression levels of these eight genes were generally decreased at the server drought stress, corresponding to the RNA-seq data (Figure 7). Moreover, to explore the epigenetic regulations of apple root in response to drought, we firstly identified genes involved in histone modifications and DNA methylation and then investigated their gene expression alterations according to the RNA-seq data (Supplementary Table S2). The results showed that most of the DNA methyltransferase genes were differentially expressed under the drought stress in both PYTC and QZ, including MET1, DRM1-3, and CMT1-3, as well as several DNA demethylase genes, suggesting the involvements of epigenetic regulations in apple roots response to drought stress.

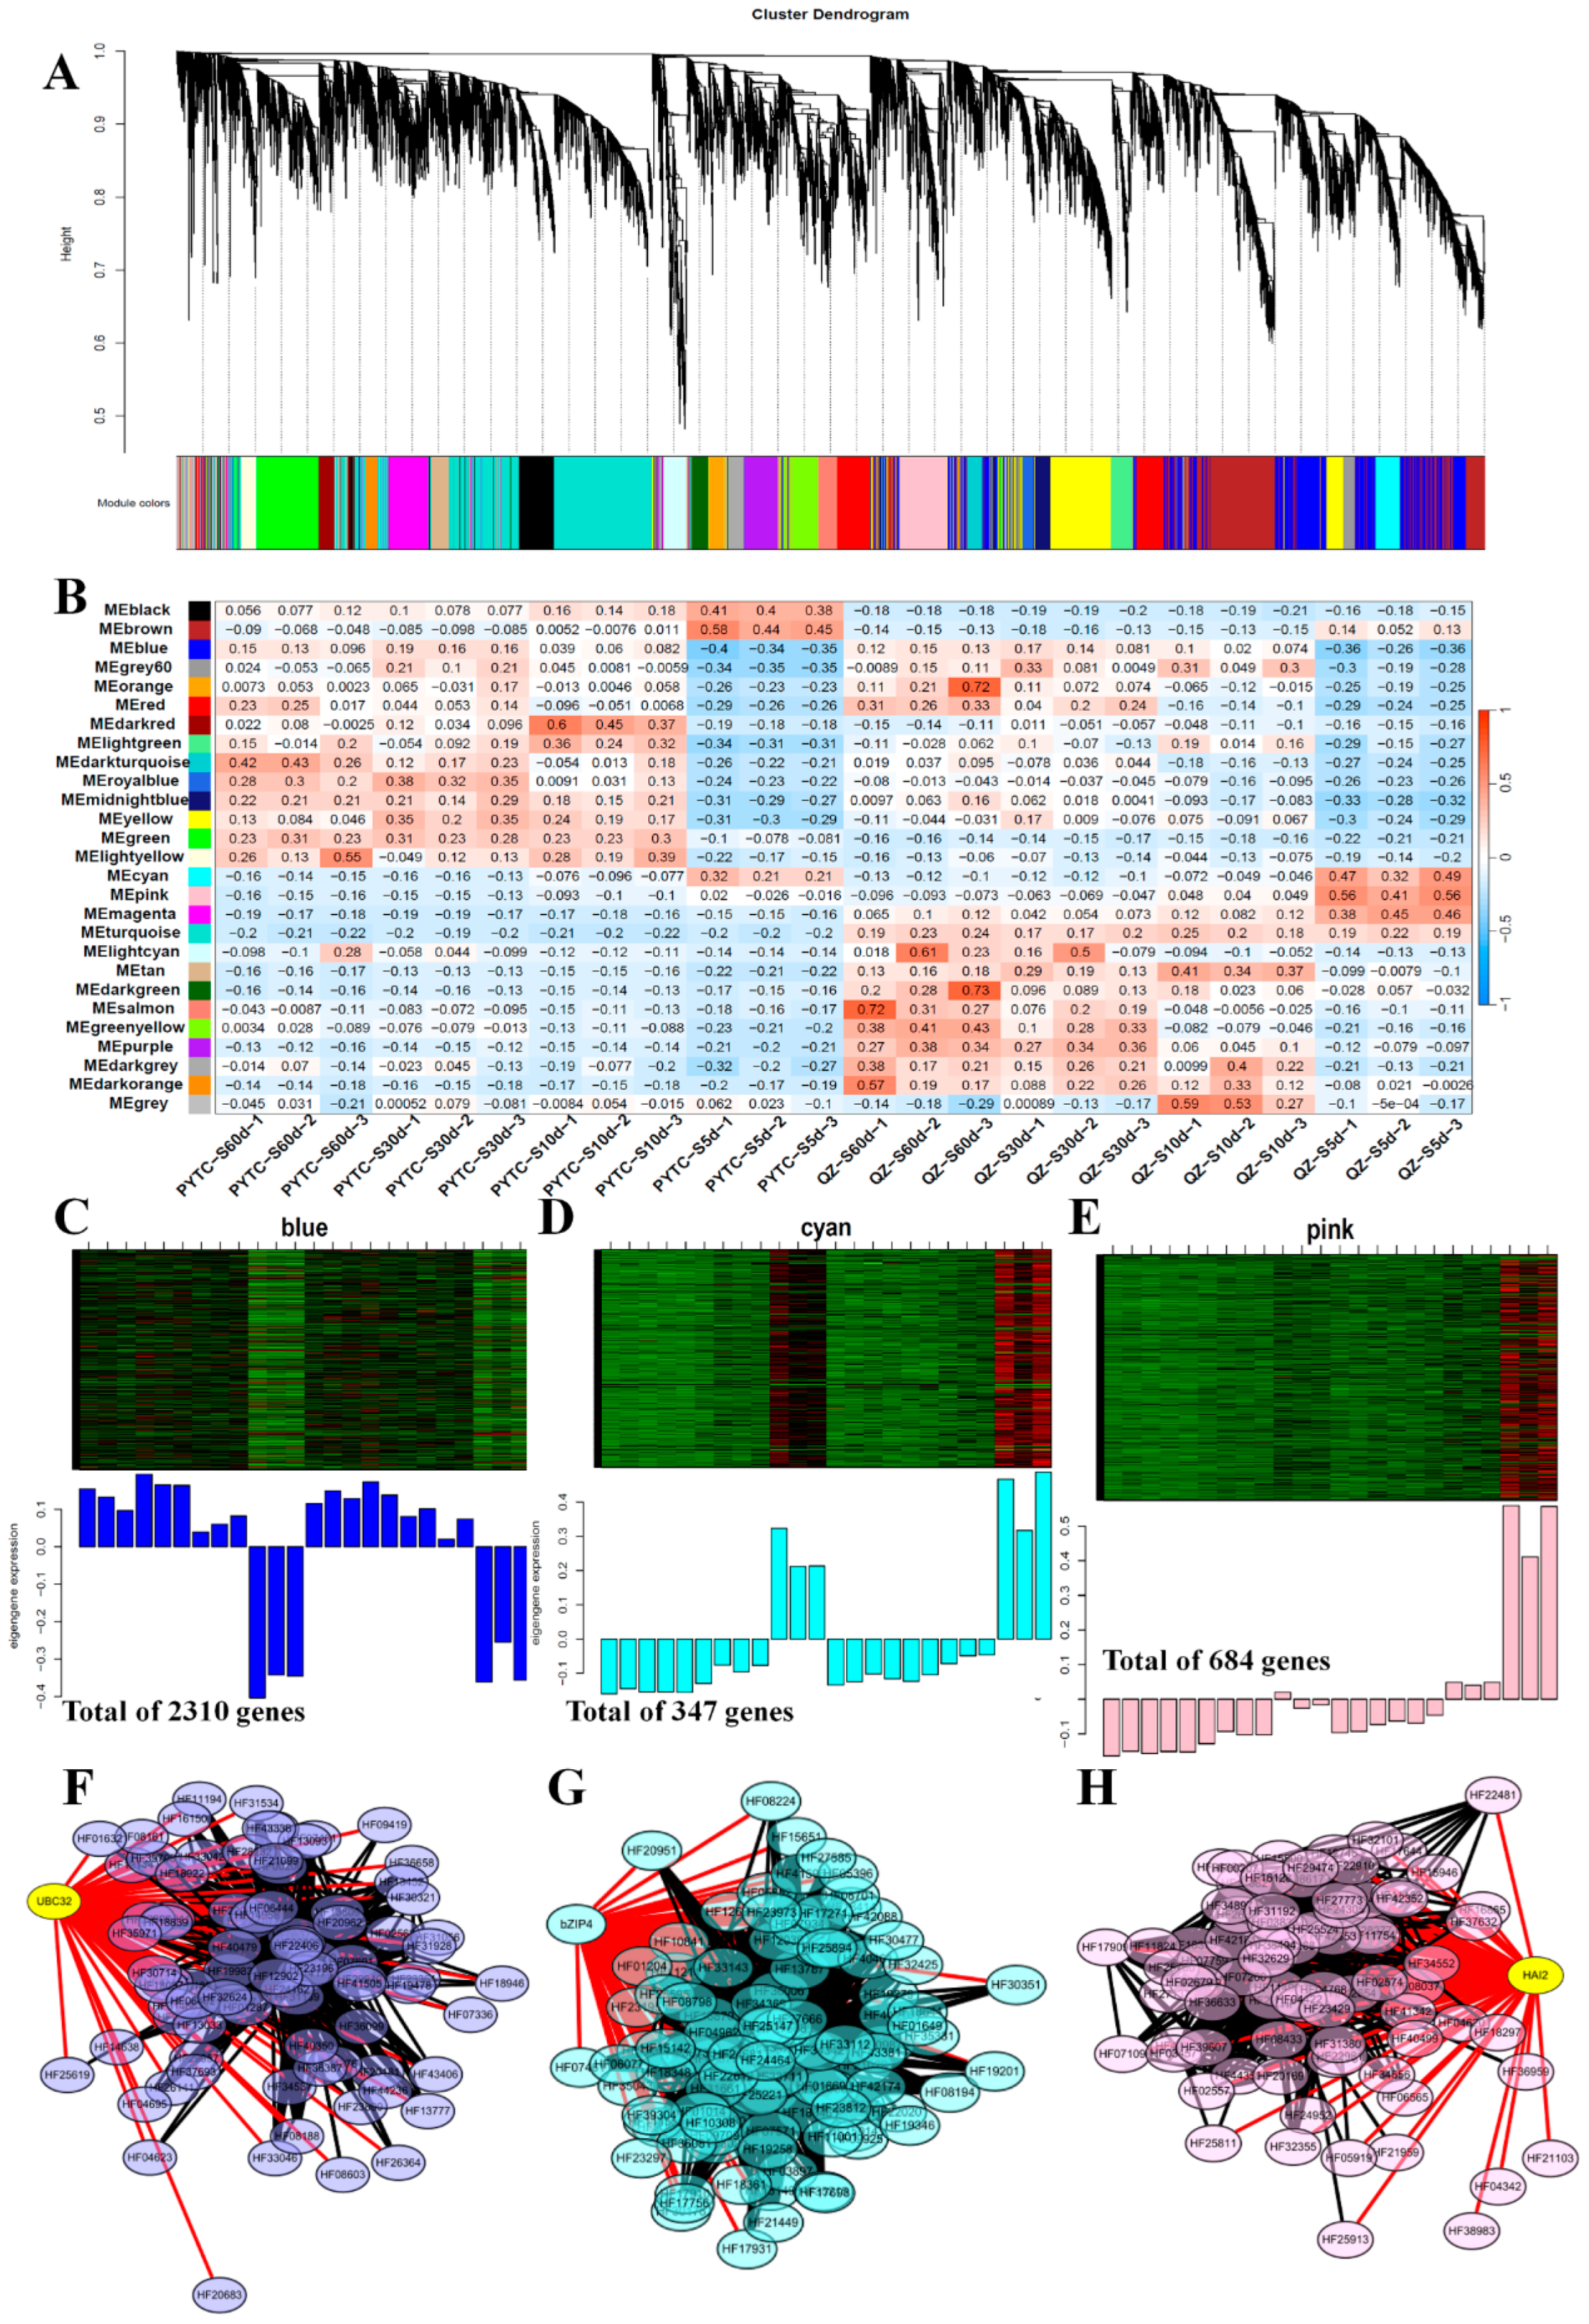
3.6. Weighted Gene Co-Expression Network Analysis (WGCNA) of DEGs Among Apple Root Samples

Weighted Gene Co-expression Network Analysis (WGCNA) was widely applied for identify co-expressed gene modules and discover hub genes. So, we adopted the Weighted Gene Co-expression Network Analysis (WGCNA) to classify 17,768 DEGs among 24 apple roots samples. As shown in Figure 8A, a total of 27 co-expression gene modules with different colors were presented. They included black (703 genes), blue (2310), brown (2310), cyan (2310), darkgreen (2310), darkgrey (2310), darkorange (2310), darkred (2310), darkturquoise (2310), green (2310), greenyellow (2310), grey (2310), grey60 (2310), lightcyan (2310), lightgreen (2310), lightyellow (2310), magenta (2310), midnightblue (2310), orange (2310), pink (2310), purple (2310), red (2310), royalblue (2310), salmon (2310), tan (2310), turquoise (2310), and yellow (2310). Based on the correlation among the different samples with heatmap (Figure 8B), we selected three representative modules with blue (Figure 8C), cyan (Figure 8D), and pink color (Figure 8E). For the blue and cyan modules, the genes assigned in severe drought (S5d) showed opposite correlations with the genes in control, mild, and moderate drought samples, suggesting that genes in these modules were in response to severe drought signal in both PYTC and QZ. Then, we further analyzed these gene functions in these two modules by GO enrichment (Supplementary Figure S2A,B). Given their high frequency of occurrence in the blue gene module, we select two node genes encoding ubiquitin-conjugating enzyme 32 (UBC32, HF26488) (Figure 8F) and basic leucine-zipper 4 (bZIP4, HF21488) (Figure 8G) by Cytoscape software v3.8.2. This result implied that these two genes play important roles in responding to severe drought. Additionally, the pink module was presented high positive correlations with genes in QZ_S5d sample, but negative correlations with genes in other samples, indicating that genes in pink module might contribute the resistance of QZ germplasm (Figure 8E). The GO analysis was showed that the pink module genes were involved in “response to heat”, “response to oxygen level”, “response to hydrogen peroxide” and so on (Supplementary Figure S2C). Then, we also selected a node gene encoding highly ABA-induced PP2C gene 2 (HAI2, HF25991) to illustrate the gene network (Figure 8H).

4. Discussion

Drought stress is one of the important abiotic factors that affects crops growth and productivity [38]. Apple, as an important economic fruit crops around the world, the apple orchards were always suffered from short-term and long-term drought stress because of the water deficit. With the rapid development of molecular technologies, there are emerging many molecular breeding strategies for the crop improvement. Therefore, understanding the molecular mechanisms underlying drought response in apple plants is crucial for developing drought resistant apple germplasm. In this study, we conducted a comparative transcriptomic analysis of the roots from two apple genotypes with different drought resistance abilities under different drought conditions. We used the drought resistance germplasm “Malus prunifolia Fupingqiuzi” (QZ) which was the commonly used apple rootstock in China due to its known tolerances to abiotic and biotic stresses, especially drought stress [20]. The drought susceptible germplasm was used “Malus hupehensis Pingyitiancha” (PYTC), which was considered as drought susceptible germplasm according to the previous study [21]. Our results provide insight into the difference of molecular mechanisms underlying the differential drought tolerance among these two genotypes, and highlight key genes and pathways involved in the early stress sensing, transcriptional regulation, and dynamic pathway activation in shaping drought resistance.
Indeed, the PYTC and QZ apple roots showed a different drought-response manner under mild, moderate and server drought conditions. Based on the numbers of DEGs, the DEGs number in PYTC under severe drought (S5d) was much larger than that in QZ under severe drought (Figure 2E,H). This result suggested that PYTC needed to arouse much more genes to against severe drought than that in QZ, which also explained that PYTC was more sensitive to drought than that of QZ. Moreover, we further assigned DEGs into Mapman bins to investigate involved stress-responsive pathways. The results showed that a key distinction between QZ and PYTC lied in their transcriptional responses during early drought stages (Figure 5). As shown in Figure 5A–D, QZ exhibited a broader activation of ABA biosynthesis (NCED) and signaling (ABI1, PYL) genes. NCEDs are the key genes of ABA biosynthesis involved in carotenoid pathway [39,40]. PYLs are encoding the ABA receptors and Arabidopsis mutant pyl8-1 showed reduced inhibition of root growth. Also, PYL8 promotes LR growth by increasing the activities of MYB77 and MYB44 to augment auxin signaling [41]. ABI1 is the PP2C co-receptor phosphatase and Arabidopsis mutant abi1-1 displayed discontinuous metaxylem phenotype [42]. Interestingly, we could deduce the possible mechanism: maybe QZ accumulated more ABA in the early stage of drought response by up-regulating NCED and the ABA receptors PYLs bound to the ABA, then released the PP2C to activated the down-stream genes, resulting the initiation of drought resistance process. This rapid response may lead to the greater drought resistance in QZ. Previous results also showed that these early drought-responsive genes involved in ABA pathway not only participated drought response but also regulated root architecture, which might also affect water uptakes. Moreover, a larger cohort of transcription factors (TFs) such as NAC, WRKY, and MYB also generally activated by the drought stress and these TFs can orchestrate downstream stress-responsive genes to against drought, such as genes involved in osmoprotectant synthesis and antioxidant defense [9,11]. However, the PYTC showed delayed and weaker transcriptional activation under the mild and moderate drought stress. Maybe QZ has the stronger ability to idly mobilize ABA-dependent pathways and TF networks than that of PYTC, which contributes to the QZ with enhancer drought tolerance. Previous studies had also demonstrated that early ABA signaling response primes the plants for the subsequent server stress challenges [1,17]. Furthermore, GA-related genes were induced only in QZ but not in PYTC under moderate drought (Figure 5D). The activation of GA-related genes may enhance the cell elongation and resource allocation to roots, which is benefit for drought tolerance [5]. Also, the severe drought (S10d vs. S5d) triggered a surge in DEGs in PYTC (7660 DEGs) compared to QZ (5191 DEGs) (Figure 2E,H), indicating that PYTC’s transcriptional instability under extreme stress exacerbates physiological damage. Previous study also found that Arabidopsis plants excessive transcriptional perturbation correlates with stress susceptibility [43]. In addition to the transcriptional regulation, epigenetic regulations had also involved in drought response in apple. For example, whole genome bisulfite sequencing was applied to uncover the regulations of DNA methylation in drought-tolerance and drought-sensitive apple germplasms under water deficit [44]. Also, key genes involved in DNA methylation and histone modifications also play an important role in drought response in apple [4,44,45]. Also, the Chromatin Accessibility and N6-methyladenosine RNA modification also associated with drought resistance in apple [23,46].
Moreover, the WGCNA analysis of co-expression networks identified two selected modules (blue and cyan) which was both in response to severe drought and they might play a role in apple root resisting to drought. For the candidate gene MdUBC32, Arabidopsis ERAD component ubiquitin-conjugating enzyme UBC32 positively regulates drought tolerance by targeting the aquaporins of PIP2;1 and PIP2;2 for degradation [47]. The other UCB members also involved in plant responses to multiple stress conditions in Arabidopsis including UBC7, UBC13, and UBC714 [48]. In potato, the StUBC13 can positively regulated osmotic and salt stresses [49]. Additionally, the UBC proteins in rice [50], peanut [51], soybean [52], indicating that UBC proteins play a vital role in drought response. For the cyan module, bZIP4 was selected for the severe drought-responsive gene. Previous studies had revealed that bZIP4 is a stress-responsive CaM-binding TF and confers abiotic stress resistance in Arabidopsis [53]. In Paeonia ostii, the expression levels of ProbZIP4 was induced by drought stress and further experiments showed it enhanced drought tolerances in plants by scavenging ROS [54]. It suggested that bZIP4 also positively contributed to the apple roots in response to drought. However, genes in pink module were specifically expressed in QZ under severe drought but not in PYTC, which we think these genes play a role in drought-resistance establishment. We selected a node gene, HAI2 (a PP2C phosphatase, known as AIP1), which were involved in ABA desensitization and ROS detoxification. Previous study had demonstrated that HAI2 was negative regulators of low Ψw-induced proline and Osmoregulatory Solute accumulation [55]. In cotton, GhHAI2 plays a negative role in regulating osmotic stress tolerance through ABA-dependent pathway [56]. These results implied that HAI2 also participate in the ABA pathway and drought response. In summary, our results not only present the global expression alterations in drought-resistance and susceptible germplasms under different drought conditions, but also identify some key genes involved in drought response, which is helpful for drought-resistant apple breeding.

5. Conclusions

Our study conducted a comparative transcriptomic analysis of roots from drought-resistant (Malus prunifolia) and drought-susceptible (Malus hupehensis) apple genotypes under four different water deficit conditions. Then, we performed the differentially expressed genes (DEGs) analysis among the two apple genotypes under drought stress. The results showed that the drought-resistant apple plants exhibited more rapid activation of abscisic acid (ABA) biosynthesis (NCED, PYL) and signaling pathway, as well as the induction of transcription factors (NAC, WRKY, MYB) compare to the drought-susceptible apple plants under early stages of drought stress. The GO and Manman pathway analyses were applied to characterized the potential functions and biological pathways involvements of DEGs. Furthermore, based on the WGCNA analysis, we identified three candidate drought-responsive genes, ubiquitin-conjugating enzyme 32 (UBC32), basic leucine-zipper 4 (bZIP4), and highly ABA-induced PP2C gene 2 (HAI2), which were selected from the WGCNA different modules and might play the vital roles in drought response. Taken together, our results gain insights into the global expression alterations in drought-resistance and susceptible germplasms under different drought conditions and identify some key genes involved in drought response, providing basis of drought-resistant apple breeding in future.

Supplementary Materials

The following supporting information can be downloaded at: https://www.mdpi.com/article/10.3390/agronomy15030748/s1, Table S1 Pearson correlations of 24 root samples based on the read counts. Table S2 The expression changes of genes involved in DNA methylation and histone modifications according to the RNA-seq data. Figure S1 Pearson correlations of 24 root samples based on the read counts. Figure S2 Gene Ontology (GO) analysis of differentially expressed genes from blue (A), cyan (B), and pink (C) modules according to the Weighted Gene Co-expression Network Analysis (WGCNA).

Author Contributions

J.Y.: writing-original draft, visualization, data curation. S.W.: visualization, data curation. D.X.: methodology, data curation. M.Y.: validation, data curation. B.M.: validation, data curation. B.N.: resources. J.W. (Jiangbo Wang): supervision, investigation. J.W. (Jie Wei): conceptualization, investigation, supervision. F.M.: resources, supervision, methodology, conceptualization, project administration. J.X.: conceptualization, writing-review & editing, investigation, supervision, project administration, funding acquisition. All authors have read and agreed to the published version of the manuscript.

Funding

This work was funded by the Natural Science Foundation of Shaanxi Province (2024JC-YBQN-0166), the Major Science and Technology projects of Shaanxi Province (2020zdzx03-01-02).

Data Availability Statement

The raw data supporting the conclusions of this article will be made available by the authors on request.

Conflicts of Interest

The authors declare no conflict of interest.

References

  1. Gupta, A.; Rico-Medina, A.; Caño-Delgado, A.I. The physiology of plant responses to drought. Science 2020, 368, 266–269. [Google Scholar] [CrossRef] [PubMed]
  2. Chen, X.X.; Ding, Y.L.; Yang, Y.Q.; Song, C.P.; Wang, B.S.; Yang, S.H.; Guo, Y.; Gong, Z.Z. Protein kinases in plant responses to drought, salt, and cold stress. J. Integr. Plant Biol. 2021, 63, 53–78. [Google Scholar] [CrossRef] [PubMed]
  3. Liu, X.; Gao, T.; Liu, C.; Mao, K.; Gong, X.; Li, C.; Ma, F. Fruit crops combating drought: Physiological responses and regulatory pathways. Plant Physiol. 2023, 192, 1768–1784. [Google Scholar] [CrossRef]
  4. Li, W.J.; Deng, M.T.; Wang, S.C.; Wang, C.X.; Guo, M.M.; Song, Y.; Guo, J.X.; Yan, J.J.; Ma, F.W.; Guan, Q.M.; et al. HISTONE DEACETYLASE 6 interaction with ABSCISIC ACID-INSENSITIVE 5 decreases apple drought tolerance. Plant Physiol. 2023, 193, 2711–2733. [Google Scholar] [CrossRef] [PubMed]
  5. Ma, X.; Sheng, L.; Li, F.; Zhou, T.; Guo, J.; Chang, Y.; Yang, J.; Jin, Y.; Chen, Y.; Lu, X. Seasonal drought promotes citrate accumulation in citrus fruit through the CsABF3-activated pathway. New Phytol. 2024, 242, 1131–1145. [Google Scholar] [CrossRef]
  6. Liu, Y.J.; An, J.P.; Gao, N.; Wang, X.; Chen, X.X.; Wang, X.F.; Zhang, S.; You, C.X. MdTCP46 interacts with MdABI5 to negatively regulate ABA signalling and drought response in apple. Plant Cell Environ. 2022, 45, 3233–3248. [Google Scholar] [CrossRef]
  7. Ma, Q.-J.; Sun, M.-H.; Lu, J.; Liu, Y.-J.; Hu, D.-G.; Hao, Y.-J. Transcription factor AREB2 is involved in soluble sugar accumulation by activating sugar transporter and amylase genes. Plant Physiol. 2017, 174, 2348–2362. [Google Scholar] [CrossRef]
  8. Zhang, T.T.; Lin, Y.J.; Liu, H.F.; Liu, Y.Q.; Zeng, Z.F.; Lu, X.Y.; Li, X.W.; Zhang, Z.L.; Zhang, S.; You, C.X.; et al. The AP2/ERF transcription factor MdDREB2A regulates nitrogen utilisation and sucrose transport under drought stress. Plant Cell Environ. 2024, 47, 1668–1684. [Google Scholar] [CrossRef]
  9. Mei, F.M.; Chen, B.; Du, L.Y.; Li, S.M.; Zhu, D.H.; Chen, N.; Zhang, Y.F.; Li, F.F.; Wang, Z.X.; Cheng, X.X.; et al. A gain-of-function allele of a DREB transcription factor gene ameliorates drought tolerance in wheat. Plant Cell 2022, 34, 4472–4494. [Google Scholar] [CrossRef]
  10. Kim, J.-S.; Kidokoro, S.; Yamaguchi-Shinozaki, K.; Shinozaki, K. Regulatory networks in plant responses to drought and cold stress. Plant Physiol. 2024, 195, 170–189. [Google Scholar] [CrossRef]
  11. Hu, Y.; Chen, X.; Shen, X. Regulatory network established by transcription factors transmits drought stress signals in plant. Stress. Biology 2022, 2, 26. [Google Scholar] [CrossRef] [PubMed]
  12. Geng, D.L.; Chen, P.X.; Shen, X.X.; Zhang, Y.; Li, X.W.; Jiang, L.J.; Xie, Y.P.; Niu, C.D.; Zhang, J.; Huang, X.H.; et al. MdMYB88 and MdMYB124 Enhance Drought Tolerance by Modulating Root Vessels and Cell Walls in Apple. Plant Physiol. 2018, 178, 1296–1309. [Google Scholar] [CrossRef]
  13. Chen, K.; Guo, Y.; Song, M.; Liu, L.; Xue, H.; Dai, H.; Zhang, Z. Dual role of MdSND1 in the biosynthesis of lignin and in signal transduction in response to salt and osmotic stress in apple. Hortic. Res. 2020, 7, 204. [Google Scholar] [CrossRef]
  14. Jiang, L.; Zhang, D.; Liu, C.; Shen, W.; He, J.; Yue, Q.; Niu, C.; Yang, F.; Li, X.; Shen, X. MdGH3. 6 is targeted by MdMYB94 and plays a negative role in apple water-deficit stress tolerance. Plant J. 2022, 109, 1271–1289. [Google Scholar] [CrossRef]
  15. Shan, D.; Wang, C.; Song, H.; Bai, Y.; Zhang, H.; Hu, Z.; Wang, L.; Shi, K.; Zheng, X.; Yan, T. The MdMEK2–MdMPK6–MdWRKY17 pathway stabilizes chlorophyll levels by directly regulating MdSUFB in apple under drought stress. Plant J. 2021, 108, 814–828. [Google Scholar] [CrossRef] [PubMed]
  16. Zhai, Z.K.; Ao, Q.Q.; Yang, L.Q.; Lu, F.X.; Cheng, H.K.; Fang, Q.X.; Li, C.; Chen, Q.Q.; Yan, J.L.; Wei, Y.S.; et al. Rapeseed PP2C37 Interacts with PYR/PYL Abscisic Acid Receptors and Negatively Regulates Drought Tolerance. J. Agr. Food Chem. 2024, 72, 12445–12458. [Google Scholar] [CrossRef] [PubMed]
  17. Zhang, Q.Y.; Ma, C.N.; Gu, K.D.; Wang, J.H.; Yu, J.Q.; Liu, B.; Wang, Y.; He, J.X.; Hu, D.G.; Sun, Q. The BTB-BACK-TAZ domain protein MdBT2 reduces drought resistance by weakening the positive regulatory effect of MdHDZ27 on apple drought tolerance via ubiquitination. Plant J. 2024, 119, 283–299. [Google Scholar] [CrossRef]
  18. Hou, N.; Li, C.S.; He, J.Q.; Liu, Y.; Yu, S.S.; Malnoy, M.; Tahir, M.M.; Xu, L.F.; Ma, F.W.; Guan, Q.M. MdMTA-mediated m(6)A modification enhances drought tolerance by promoting mRNA stability and translation efficiency of genes involved in lignin deposition and oxidative stress. New Phytol. 2022, 234, 1294–1314. [Google Scholar] [CrossRef]
  19. Shen, X.X.; He, J.Q.; Ping, Y.K.; Guo, J.X.; Hou, N.; Cao, F.G.; Li, X.W.; Geng, D.L.; Wang, S.C.; Chen, P.X.; et al. The positive feedback regulatory loop of miR160-Auxin Response Factor 17-HYPONASTIC LEAVES 1 mediates drought tolerance in apple trees. Plant Physiol. 2022, 188, 1686–1708. [Google Scholar] [CrossRef]
  20. Li, Z.; Wang, L.; He, J.; Li, X.; Hou, N.; Guo, J.; Niu, C.; Li, C.; Liu, S.; Xu, J.; et al. Chromosome-scale reference genome provides insights into the genetic origin and grafting-mediated stress tolerance of Malus prunifolia. Plant Biotechnol. J. 2022, 20, 1015–1017. [Google Scholar] [CrossRef]
  21. Ye, N.H.; Zhai, H.; Du, Z.J.; Xu, H. Evaluation of drought resistance of ten apple rootstocks. J. Fruit Sci. 2004, 21, 395–398. [Google Scholar]
  22. Wang, S.; Liang, D.; Li, C.; Hao, Y.; Ma, F.; Shu, H. Influence of drought stress on the cellular ultrastructure and antioxidant system in leaves of drought-tolerant and drought-sensitive apple rootstocks. Plant Physiol. Biochem. 2012, 51, 81–89. [Google Scholar] [CrossRef] [PubMed]
  23. Wang, S.; He, J.; Deng, M.; Wang, C.; Wang, R.; Yan, J.; Luo, M.; Ma, F.; Guan, Q.; Xu, J. Integrating ATAC-seq and RNA-seq Reveals the Dynamics of Chromatin Accessibility and Gene Expression in Apple Response to Drought. Int. J. Mol. Sci. 2022, 23, 11191. [Google Scholar] [CrossRef]
  24. Zhang, L.Y.; Hu, J.; Han, X.L.; Li, J.J.; Gao, Y.; Richards, C.M.; Zhang, C.X.; Tian, Y.; Liu, G.M.; Gul, E.A.; et al. A high-quality apple genome assembly reveals the association of a retrotransposon and red fruit colour. Nat. Commun. 2019, 10, 1494. [Google Scholar] [CrossRef]
  25. Daccord, N.; Celton, J.M.; Linsmith, G.; Becker, C.; Choisne, N.; Schijlen, E.; van de Geest, H.; Bianco, L.; Micheletti, D.; Velasco, R.; et al. High-quality de novo assembly of the apple genome and methylome dynamics of early fruit development. Nature Genet. 2017, 49, 1099–1106. [Google Scholar] [CrossRef] [PubMed]
  26. Langmead, B.; Salzberg, S.L. Fast gapped-read alignment with Bowtie 2. Nat. Methods 2012, 9, 357–359. [Google Scholar] [CrossRef]
  27. Li, H.; Handsaker, B.; Wysoker, A.; Fennell, T.; Ruan, J.; Homer, N.; Marth, G.; Abecasis, G.; Durbin, R.; 1000 Genome Project Data Processing Subgroup. The Sequence Alignment/Map format and SAMtools. Bioinformatics 2009, 25, 2078–2079. [Google Scholar] [CrossRef]
  28. Anders, S.; Pyl, P.T.; Huber, W. HTSeq-a Python framework to work with high-throughput sequencing data. Bioinformatics 2015, 31, 166–169. [Google Scholar] [CrossRef]
  29. Love, M.I.; Huber, W.; Anders, S. Moderated estimation of fold change and dispersion for RNA-seq data with DESeq2. Genome Biol. 2014, 15, 550. [Google Scholar] [CrossRef]
  30. Yu, G.C.; Wang, L.G.; Han, Y.Y.; He, Q.Y. clusterProfiler: An R Package for Comparing Biological Themes Among Gene Clusters. Omics 2012, 16, 284–287. [Google Scholar] [CrossRef]
  31. Lyu, F.; Han, F.; Ge, C.; Mao, W.; Chen, L.; Hu, H.; Chen, G.; Lang, Q.; Fang, C. OmicStudio: A composable bioinformatics cloud platform with real-time feedback that can generate high-quality graphs for publication. Imeta 2023, 2, e85. [Google Scholar] [CrossRef] [PubMed]
  32. Chen, C.J.; Chen, H.; Zhang, Y.; Thomas, H.R.; Frank, M.H.; He, Y.H.; Xia, R. TBtools: An Integrative Toolkit Developed for Interactive Analyses of Big Biological Data. Mol. Plant 2020, 13, 1194–1202. [Google Scholar] [CrossRef] [PubMed]
  33. Langfelder, P.; Horvath, S. WGCNA: An R package for weighted correlation network analysis. BMC Bioinf. 2008, 9, 559. [Google Scholar] [CrossRef] [PubMed]
  34. Saito, R.; Smoot, M.E.; Ono, K.; Ruscheinski, J.; Wang, P.L.; Lotia, S.; Ideker, T. A travel guide to Cytoscape plugins. Nat. Methods 2012, 9, 1069–1076. [Google Scholar] [CrossRef]
  35. Takahashi, F.; Suzuki, T.; Osakabe, Y.; Betsuyaku, S.; Kondo, Y.; Dohmae, N.; Fukuda, H.; Yamaguchi-Shinozaki, K.; Shinozaki, K. A small peptide modulates stomatal control via abscisic acid in long-distance signalling. Nature 2018, 556, 235–238. [Google Scholar] [CrossRef]
  36. Wang, L.; Zhang, X.; Qu, Z.; Guo, W.; van Nocker, S.; Zhang, C. Grapevine VviERF105 promotes tolerance to abiotic stress and is degraded by the E3 ubiquitin ligase VviPUB19. Environ. Exp. Bot. 2022, 201, 105001. [Google Scholar] [CrossRef]
  37. Xu, Y.-Y.; Zeng, R.-F.; Zhou, H.; Qiu, M.-Q.; Gan, Z.-M.; Yang, Y.-L.; Hu, S.-F.; Zhou, J.-J.; Hu, C.-G.; Zhang, J.-Z. Citrus FRIGIDA cooperates with its interaction partner dehydrin to regulate drought tolerance. Plant J. 2022, 111, 164–182. [Google Scholar] [CrossRef]
  38. Seleiman, M.F.; Al-Suhaibani, N.; Ali, N.; Akmal, M.; Alotaibi, M.; Refay, Y.; Dindaroglu, T.; Abdul-Wajid, H.H.; Battaglia, M.L. Drought stress impacts on plants and different approaches to alleviate its adverse effects. Plants 2021, 10, 259. [Google Scholar] [CrossRef]
  39. Mukherjee, A.; Dwivedi, S.; Bhagavatula, L.; Datta, S. Integration of light and ABA signaling pathways to combat drought stress in plants. Plant Cell Rep. 2023, 42, 829–841. [Google Scholar] [CrossRef]
  40. Muhammad Aslam, M.; Waseem, M.; Jakada, B.H.; Okal, E.J.; Lei, Z.; Saqib, H.S.A.; Yuan, W.; Xu, W.; Zhang, Q. Mechanisms of Abscisic Acid-Mediated Drought Stress Responses in Plants. Int. J. Mol. Sci. 2022, 23, 1084. [Google Scholar] [CrossRef]
  41. Antoni, R.; Gonzalez-Guzman, M.; Rodriguez, L.; Peirats-Llobet, M.; Pizzio, G.A.; Fernandez, M.A.; De Winne, N.; De Jaeger, G.; Dietrich, D.; Bennett, M.J.; et al. PYRABACTIN RESISTANCE1-LIKE8 Plays an Important Role for the Regulation of Abscisic Acid Signaling in Root. Plant Physiol. 2013, 161, 931–941. [Google Scholar] [CrossRef] [PubMed]
  42. Ramachandran, P.; Wang, G.; Augstein, F.; de Vries, J.; Carlsbecker, A. Continuous root xylem formation and vascular acclimation to water deficit involves endodermal ABA signalling via miR165. Development 2018, 145, dev159202. [Google Scholar] [CrossRef] [PubMed]
  43. Sato, H.; Mizoi, J.; Shinozaki, K.; Yamaguchi-Shinozaki, K. Complex plant responses to drought and heat stress under climate change. Plant J. 2024, 117, 1873–1892. [Google Scholar] [CrossRef] [PubMed]
  44. Xu, J.; Zhou, S.; Gong, X.; Song, Y.; van Nocker, S.; Ma, F.; Guan, Q. Single-base methylome analysis reveals dynamic epigenomic differences associated with water deficit in apple. Plant Biotechnol. J. 2018, 16, 672–687. [Google Scholar] [CrossRef]
  45. Wang, C.; Yan, J.; Hu, B.; Wang, R.; Miao, B.; Zeng, F.; Ma, F.; Guan, Q.; Xu, J. Genome-wide analysis of histone deacetylases in Apple and functional analysis of MdHDA6 in drought and salt stress responses. Sci. Hortic. 2023, 320, 112196. [Google Scholar] [CrossRef]
  46. Xu, J.; He, J.; Hu, B.; Hou, N.; Guo, J.; Wang, C.; Li, X.; Li, Z.; Zhai, J.; Zhang, T.; et al. Global hypermethylation of the N6-methyladenosine RNA modification associated with apple heterografting. Plant Physiol. 2023, 193, 2513–2537. [Google Scholar] [CrossRef] [PubMed]
  47. Chen, Q.; Liu, R.; Wu, Y.; Wei, S.; Wang, Q.; Zheng, Y.; Xia, R.; Shang, X.; Yu, F.; Yang, X.; et al. ERAD-related E2 and E3 enzymes modulate the drought response by regulating the stability of PIP2 aquaporins. Plant Cell 2021, 33, 2883–2898. [Google Scholar] [CrossRef]
  48. Feng, H.; Wang, S.; Dong, D.; Zhou, R.; Wang, H. Arabidopsis Ubiquitin-Conjugating Enzymes UBC7, UBC13, and UBC14 Are Required in Plant Responses to Multiple Stress Conditions. Plants 2020, 9, 723. [Google Scholar] [CrossRef]
  49. Fu, X.; Tang, X.; Zhang, N.; Si, H. StUBC13, a Ubiquitin-Conjugating Enzyme, Positively Regulates Salt and Osmotic Stresses in Potato. Int. J. Mol. Sci. 2024, 25, 13197. [Google Scholar] [CrossRef]
  50. Zhiguo, E.; Zhang, Y.; Li, T.; Wang, L.; Zhao, H. Characterization of the Ubiquitin-Conjugating Enzyme Gene Family in Rice and Evaluation of Expression Profiles under Abiotic Stresses and Hormone Treatments. PLoS ONE 2015, 10, e0122621. [Google Scholar]
  51. Wan, X.; Mo, A.; Liu, S.; Yang, L.; Li, L. Constitutive expression of a peanut ubiquitin-conjugating enzyme gene in Arabidopsis confers improved water-stress tolerance through regulation of stress-responsive gene expression. J. Biosci. Bioeng. 2011, 111, 478–484. [Google Scholar] [CrossRef] [PubMed]
  52. Zhou, G.-A.; Chang, R.-Z.; Qiu, L.-J. Overexpression of soybean ubiquitin-conjugating enzyme gene GmUBC2 confers enhanced drought and salt tolerance through modulating abiotic stress-responsive gene expression in Arabidopsis. Plant Mol. Biol. 2009, 72, 357–367. [Google Scholar] [CrossRef] [PubMed]
  53. Noh, M.; Huque, A.K.M.M.; Jung, K.W.; Kim, Y.Y.; Shin, J.S. A Stress-Responsive CaM-Binding Transcription Factor, bZIP4, Confers Abiotic Stress Resistance in Arabidopsis. J. Plant Biol. 2021, 64, 359–370. [Google Scholar] [CrossRef]
  54. Chen, Z.; Luan, Y.; Zhao, D.; Tao, J. Isolation and functional analysis of drought related PobZIP4 transcription factor in Paeonia ostii. Sci. Hortic. 2024, 332, 113187. [Google Scholar] [CrossRef]
  55. Bhaskara, G.B.; Nguyen, T.T.; Verslues, P.E. Unique Drought Resistance Functions of theHighly ABA-InducedClade A Protein Phosphatase 2Cs. Plant Physiol. 2012, 160, 379–395. [Google Scholar] [CrossRef]
  56. Shazadee, H.; Khan, N.; Wang, L.; Wang, X. GhHAI2, GhAHG3, and GhABI2 Negatively Regulate Osmotic Stress Tolerance via ABA-Dependent Pathway in Cotton (Gossypium hirsutum L.). Front. Plant Sci. 2022, 13, 905181. [Google Scholar] [CrossRef]
Figure 1. The phenotypes of Malus hupehensis (Pingyitiancha-PYTC) apple plants and roots under different soil water contents with 60% (control) (A), 30% (mild) (B), 10% (moderate) (C), and 5% (severe) (D). The phenotypes of Malus prunifolia (Qiuzi-QZ) apple plants and roots under different soil water contents with 60% (control) (E), 30% (mild) (F), 10% (moderate) (G), and 5% (severe) (H). The soil water contents of Malus hupehensis (I) and Malus prunifolia (J) under different drought conditions. Data were expressed as the mean ± SD. SPSS (Version 24.0) was used for one-way ANOVA (Tukey’s test) analysis to determine the statistical significance. The different letters on the top of columns indicated they had significant differences.
Agronomy 15 00748 g001
Figure 2. The transcriptomic analysis of Malus hupehensis (Pingyitiancha-PYTC) and Malus prunifolia (Qiuzi-QZ) under four drought conditions. (A) the Principal Component Analysis (PCA) of 24 RNA-seq samples. (B) The differentially expressed genes (DEGs) among PYTC and QZ in response to different drought conditions. (C) Volcano plot of 60% soil water content (S60d) compare with 30% soil water content (S30d) in PYTC. (D) Volcano plot of 30% soil water content (S30d) compare with 10% soil water content (S10d) in PYTC. (E) Volcano plot of 10% soil water content (S10d) compare with 5% soil water content (S5d) in PYTC. (FH) Volcano plots of S60d vs. S30d (F), S30d vs. S10d (G), S10d vs. S5d (H) in QZ. (IL) Volcano plots of PYTC_S60d vs. QZ_S60d (I), PYTC_S30d vs. QZ_S30d (J), PYTC_S10d vs. QZ_S10d (K), and PYTC_S5d vs. QZ_S5d (L).
Agronomy 15 00748 g002
Figure 3. (A) Clustering the expression alterations among different samples. The red line represented the “0” line, the bule line represented the trend line. (B) Veen maps of PYTC_S60d vs. QZ_S60d, PYTC_S30d vs. QZ_S30d, PYTC_S10d vs. QZ_S10d, and PYTC_S5d vs. QZ_S5d. (C) Veen maps of PYTC_S60d vs. S30d, PYTC_S30d vs. S10d, PYTC_S10d vs. S5d. (D) Veen maps of PYTC_S60d vs. S5d, PYTC_S30d vs. S5d, PYTC_S10d vs. S5d. (E) Veen maps of QZ_S60d vs. S30d, QZ_S30d vs. S10d, QZ_S10d vs. S5d. (F) Veen maps of QZ_S60d vs. S5d, QZ_S30d vs. S5d, QZ_S10d vs. S5d.
Agronomy 15 00748 g003
Figure 4. Gene Ontology (GO) analysis of differentially expressed genes among PYTC_S60d vs. S30d (A), PYTC_S30d vs. S10d (B), PYTC_S10d vs. S5d (C), QZ_S60d vs. S30d (D), QZ_S30d vs. S10d (E), QZ_S10d vs. S5d (F). PYTC_S5d vs. QZ_S5d (G). (H) The proportions of genes involved in different GO terms.
Agronomy 15 00748 g004
Figure 5. Mapman pathway assignments of differentially expressed genes among PYTC_S60d vs. S30d (A), QZ_S60d vs. S30d (B), PYTC_S30d vs. S10d (C), QZ_S30d vs. S10d (D), PYTC_S10d vs. S5d (E), QZ_S10d vs. S5d (F). Each square represented one gene involved in the corresponding pathways. The red color represented up-regulation and the blue color represented down-regulation.
Agronomy 15 00748 g005
Figure 6. (A,B) The known ABA-dependent (A) and ABA-independent (B) pathways involved in drought response among fruit crops [3]. (C,D) The expression changes of genes involved in ABA-dependent (C) and ABA-independent (D) pathways. The deeper the red color, the higher the expression level; the deeper the blue color, the lower the expression level.
Agronomy 15 00748 g006
Figure 7. (A) The expression alterations of selected candidate genes including MdDREB1AL, MdDREB1B, MdHAT5, MdbHLH14L, MdMYB44L, MdMYC2L, MdWRKY11A, and MdWRKY11B in the roots of drought-tolerance Malus prunifolia and drought-sensitive Malus hupehensis under different drought periods based on the RNA-seq data. (B) The qRT-PCR analysis of these eight selected genes. MdMDH was used as the internal reference gene. Error bars indicate SD (n = 3). *, **, ***, **** and ns represent p < 0.05, p < 0.01, p < 0.001, p < 0.0001 and no significance, respectively.
Agronomy 15 00748 g007
Figure 8. Weighted Gene Co-expression Network Analysis (WGCNA) of differentially expressed genes (DEGs) among apple root samples. (A) The cluster profiling of WGCNA modules (Each color represented one module); (B) The correlation relationships among different samples based on the different modules; (CF) Three modules including blue (C), cyan (D), and pink (E) were selected to the following analysis. Each color represented one module based on the WGCNA analysis; (FH) The networks of node genes from blue (F), cyan (G), and pink (H) were displayed by the Cytoscape software v3.8.2.
Agronomy 15 00748 g008
Disclaimer/Publisher’s Note: The statements, opinions and data contained in all publications are solely those of the individual author(s) and contributor(s) and not of MDPI and/or the editor(s). MDPI and/or the editor(s) disclaim responsibility for any injury to people or property resulting from any ideas, methods, instructions or products referred to in the content.

