Article

Soil Organic Matter Quality and Glomalin-Related Soil Protein Content in Cambisol

Department of Agro—Environmental Chemistry and Plant Nutrition, Faculty of Agrobiology, Food and Natural Resources, Czech University of Life Sciences Prague, 16500 Prague, Czech Republic
*
Author to whom correspondence should be addressed.
Agronomy 2025, 15(3), 745; https://doi.org/10.3390/agronomy15030745
Submission received: 4 February 2025 / Revised: 7 March 2025 / Accepted: 17 March 2025 / Published: 19 March 2025
(This article belongs to the Section Soil and Plant Nutrition)

Abstract

:
The influence of different mineral and organic fertiliser applications on the soil organic matter (SOM) content and quality was monitored in long-term field trials. We used long-term field experiments (27 years) with a crop rotation of potatoes, winter wheat, and spring barley on cambisol soil. The treatments were as follows: an unfertilised control (Cont), sewage sludge in normal and triple doses (SS1 and SS3, respectively), farmyard manure (F1) in a conventional dose, a half dose of farmyard manure with a half dose of mineral nitrogen (F1/2 + N1/2), straw with mineral nitrogen fertiliser (N + St), and mineral nitrogen without any organic fertiliser (N). This study focused on the ability of the total and easily extractable glomalin-related soil protein (T-GRSP and EE-GRSP, respectively) and the water stability of aggregates (WSA) as indicators of long-term SOM quality changes. The results were compared with the content of humic substance fractions and the carbon in humic substances (CHS), humic acids (CHA), and fulvic acids (CFA). The lowest SOM content and quality were observed in the control treatment. The highest overall SOM quality, including the degree of polymerisation (HA) and the GRSP content, was found in the F1 treatment. The organic matter in sewage sludge contributed less to the formation of stable SOM than straw. A significant correlation was found between both the EE-GRSP and the T-GRSP and the content of the CSOM, CHS, CHA, and HA, but not with the CFA. The influence of fertiliser on the GRSP content was demonstrated. However, no relationship was observed between the WSA and SOM quality, the EE-GRSP, or the T-GRSP content.

1. Introduction

It is necessary to pay maximum attention to the sustainability of agricultural systems due to the increasing need for food production, especially concerning ongoing climate changes [1]. Soil fertility, a key element of sustainable agriculture, can be improved by carbon sequestration through (a) improving soil structure, (b) decreasing the risk of erosion-induced soil degradation, (c) adding nutrients to the soil, and (d) adding energy to the soil for microorganisms [2]. Arbuscular mycorrhizal fungi (AMF) form symbiotic relationships with over 80% of terrestrial plants and can effectively improve soil carbon sequestration. Wright et Upadhyaya [3] first described a thermally stable glycoprotein called glomalin, produced by AMF. In their pioneering work, Wright et Upadhyaya [3] identified two fractions of glomalin: easily extractable and total glomalin. A high-temperature extraction with sodium citrate is used to extract the glomalin fractions. This method is non-specific to glomalin (the product of AMF) as it extracts additional stable proteins (products of plants, bacteria, and other autotrophs) as well as organic compounds like lipids, fatty acids, and humic acids [4,5,6]. These co-extracted compounds can interfere with the Bradford assay and decrease the precision of glomalin determination [7,8]. In this regard, the term glomalin-related soil protein (GRSP) is used for the product of extraction. It describes the blend of proteins of both AMF and non-mycorrhizal origin [9]. In turn, the two glomalin fractions, which are the easily extractable and total glomalin fractions, are abbreviated as the EE-GRSP and T-GRSP, respectively.
In general, soils fertilised with mineral and organic fertilisers have a higher GRSP content than that of non-fertilised ones [10,11,12]. The GRSP content increases after the application of manure [10,11,13], compost [11,13,14], sewage sludge [15], and straw [16,17]. The GRSP content is usually correlated with the soil organic matter carbon (CSOM) content [18]. Furthermore, Černý et al. [19] established a positive correlation between the carbon content in humic and fulvic acids (CHA and CFA, respectively). The production of the GRSP and its accumulation in the soil depend on the type of crop produced, its AMF, and soil characteristics [10,20].
Once the GRSP is produced in hyphal cell walls and released into the environment, it can create a protective, water-stable film that covers the surface of soil aggregates [21,22]. The GRSP has a high concentration of aromatic and alkyl carbon. This contributes to its stable character [23,24]. The hydrophobic nature of the GRSP contributes to slower mineralisation as well as higher soil carbon sequestration and the greater stability of soil fertility [23]. The glycosylated nature of the GRSP is considered a key factor in the micro- and macroaggregation of soil [8]. Higher aggregation increases porosity and enhances the infiltration of precipitation. It also reduces surface runoff and soil erosion [8,25]. The hydrophobicity of the GRSP is attributed to the presence of disulphide bridges [26,27]. The formation of other disulphide covalent bonds increases both intra- and intermolecular bonding, which in turn enhances the thermal stability of the protein [28]. In principle, the formation of water-stable macroaggregates due to the influence of the GRSP occurs as follows: (a) The disulphide bonds in the GRSP help create a sticky, insoluble, hydrophobic film around the aggregate. (b) N-glycosylation within glomalin not only expands the reaction sites for cation and heavy metal adsorption but also binds soil organic matter, microaggregates, and soil particles, producing a water-stable aggregate [29].
Changes in the content and quality of soil organic matter are long-term processes and require extended experiments to observe. This work aimed to (a) determine the influence of mineral and organic fertilisers on the content and quality of soil organic matter, (b) assess the changes in the GRSP content caused by fertilisation, (c) examine the influence of fertilisation on soil aggregate stability and evaluate the role of the GRSP in this process.
We used 27-year-old field trials with crop rotation on cambisol soil. In temperate climate zones, cambisols characterised by high-base saturation are recognised as some of the most fertile and productive soils on Earth. This soil type covers an area of 15 million km2 worldwide [30].

2. Materials and Methods

The impact of fertilisation on soil glomalin content was investigated through long-term field trials initiated in 1996 at the experimental site in Lukavec. The site’s soil type is stagnic cambisol (Table 1). The levels of available phosphorus and potassium in the soil, as estimated by the Mehlich 3 method, were adequate for crop cultivation. The trial followed a crop rotation system comprising potatoes, winter wheat, and spring barley. These crops represent some of the most common crops produced in the Czech Republic. They cover 39.7% of the total arable soil [31]. The planting of crops happened as follows: potatoes in the second half of April, winter wheat at the beginning of October, and spring barley usually at the end of March. After the harvest, the soil was left untouched until the preparation of the soil for the next crop was necessary. The experiment was set up in a randomised complete block design. Four blocks comprised the experiment. Each block included all treatments. The area of each plot in a block was 20 m2. The total area of treatment was 80 m2. The trial involved seven treatments: (1) an unfertilised control (Cont), (2) sewage sludge (SS1), (3) high-dose sewage sludge (SS3), (4) farmyard manure (F1), (5) half-dose farmyard manure combined with mineral nitrogen fertiliser (F1/2 + N1/2), (6) mineral nitrogen fertiliser (N), and (7) spring barley straw combined with mineral nitrogen fertiliser (N + St) (Table 2). The experiment is based on a uniform dose of 330 kg N.ha−1 per 3 years applied to all fertiliser treatments. The SS3 treatment is a potential treatment based on the triple dose of nitrogen (990 kg N.ha−1 per 3 years) in comparison with other fertiliser treatments. The mineral nitrogen dose in the N and N + St treatments was the same; straw incorporation caused additional nitrogen inputs (27 kg N.ha−1 per 3 years) (Table 2). More information about the quality of organic fertilisers is in Table 3. Organic fertilisers (farmyard manure, sewage sludge, and straw) were consistently applied in October to potatoes and incorporated into the soil to a depth of approximately 25 cm using ploughing. The other treatments were ploughed to the same depth and at the same time.
Mineral nitrogen fertiliser, in the form of calcium ammonium nitrate, was applied to spring barley in spring before crop establishment. For winter wheat, the nitrogen dose was split, with the first half applied at BBCH 21 and the second half at BBCH 31–32. The nitrogen application rates were 140 kg N.ha−1 for wheat and 70 kg N.ha−1 for spring barley. For the F1/2 + N1/2 treatment, 115 kg N.ha−1 (50 + 65 kg split) was applied to wheat and 50 kg N.ha−1 to spring barley.

2.1. Soil Sampling

The top 30 cm layer of the soil was sampled right after the spring barley harvest. Each plot was sampled seven times. The samples were pooled to produce a representative sample from the plot. This way, four representative samples from each treatment were produced. The soil samples were later dried in a force-air drier at 40 °C until the constant weight. Once dry, samples were sieved for <2 mm particles for all analyses. A portion of the sample was also sieved for <0.4 mm particles for the CNS elemental analyser.
Table 1. Characteristics of experimental fields.
SiteLukavec
Location49°33′23″ N 14°58′39″ E
Altitude (metres above sea level)610
Mean annual temperature (°C)7.7
Mean annual precipitation (mm)666
Soil type 1Stagnic cambisol
Soil texture 1Sandy loam
Clay (%) (<0.002 mm)3.2
Silt (%) (0.002–0.05 mm)37.1
Sand (%) (0.05–2 mm)59.7
Bulk density (g.cm−3)1.27
pH (CaCl2) 25.3
P in Mehlich 3 (mg.kg−1) 3138
K in Mehlich 3 (mg.kg−1) 3149
Al in Aqua regia 4 (in HNO3 5) (mg.kg−1)40,284 (11,682)
Fe in Aqua regia 4 (in HNO3 5) (mg.kg−1)28,149 (15,663)
CEC (mmol(+).kg−1)45
CEC—cation exchange capacity. 1 According to the national resource conservation services—United States department of agriculture [32]; 2 Minasny et al. [33]; 3 plant available content extracted using Mehlich [34]; 4 pseudototal content using the aqua regia digestion ISO: 11466 1995 [35]; 5 nitric acid extraction according to Sparks et al. [36].

2.2. Soil Analysis

The carbon in soil organic matter (CSOM) content was determined via oxidation using the CNS Analyzer Elementar Vario Macro (Elementar Analysensysteme, Hanau, near Frankfurt am Main, Germany) [37] after the removal of carbonates from samples by HCl.
The fractionation of humic substances (CHS) was conducted following the method outlined by Kononova [38] to obtain the pyrophosphate-extractable fraction, representing the combined carbon in humic acids (CHA) and fulvic acids (CFA). The procedure is summarised as follows:
A 5 g soil sample was extracted using a mixed solution of 0.10 mol.L−1 NaOH (P-Lab, Prague, Czechia) and 0.10 mol.L−1 Na4P2O7 (1:20 w/v). This process separated the CHA and CFA fractions. The CFA fraction was obtained by acidifying the solution with dilute H2SO4 (P-Lab, Prague, Czechia) to a pH of 1.0–1.5, leaving the solution undisturbed for 24 h. The CHA fraction was retrieved by dissolving the precipitate formed during acidification in hot 0.05 mol.L−1 NaOH.
Before iodometric titration, the dry matter from each sample, produced through evaporation, was dissolved in a mixture of 0.067 mol.L−1 K2Cr2O7 (P-Lab, Prague, Czechia) and concentrated H2SO4 under elevated temperatures. Humification indices were calculated following the methodologies of Raiesi [39] and Iqbal et al. [40]:
Degree of polymerisation: HA = CHA/CFA
Humification rate: HR = (CFA + CHA)/CSOM
Humification index: HI = CHA/CSOM
The easily extractable glomalin-related soil protein (EE-GRSP) and total glomalin-related soil protein (T-GRSP) were analysed following the method described by Wright et Upadhyaya [41]. Briefly, 1.00 g of air-dried soil (<2 mm) was mixed with 8 mL of sodium citrate solution (20 mmol.L−1 at pH 7.0 for EE-GRSP and 50 mmol.L−1 at pH 8.0 for T-GRSP) (P-Lab, Prague, Czechia). The mixture was autoclaved at 121 °C for 30 min for the EE-GRSP and 60 min for the T-GRSP, allowed to cool, and centrifuged at 5000 rpm for 10 min for the EE-GRSP and 15 min for the T-GRSP.
For the T-GRSP, the extraction was repeated five times until the characteristic red-brown colour, typical of glomalin, was no longer visible. Both the EE-GRSP and T-GRSP were quantified colourimetrically using bovine serum albumin (BSA) as the standard and the Bradford protein assay (Bio-Rad, Hercules, CA, USA) to monitor the colour change. The glomalin content in the extracts was measured using the Tecan Infinite M Plex multimode microplate reader (Tecan Infinite, Männedorf, Switzerland) at 595 nm.
Water aggregate stability (WSA) was assessed using the WSA index following the method outlined by Nimmo et Perkins [42]. Four grams of air-dried soil aggregates (2–5 mm in diameter) were sieved for 3 min in distilled water using a 0.25 mm sieve, operating at a frequency of 35 cycles per minute and a vertical amplitude of 1.3 cm.
The aggregates retained on the sieve were then sieved again under the same conditions in a sodium hexametaphosphate solution (2 g.L−1) until only sand particles remained on the sieve. Aggregates that disintegrated during wetting in water or the hexametaphosphate solution were collected, dried at 105 °C, and weighed. The WSA index was calculated using the following formula:
WSA = Wds/(Wds + Wdw)
where Wds is the weight of aggregates dispersed in a sodium hexametaphosphate solution (P-Lab, Prague, Czechia), and Wdw is the weight of aggregates dispersed in distilled water. An increase in the WSA value indicates an increase in soil aggregate stability.
Table 2. Application rates of nitrogen (kg.ha−1).
TreatmentPotatoesWheatBarleyTotal N Dose in Three Years
NNN
Cont.----
SS1330 100330
SS3990 100990
F1330 100330
F1/2 + N1/2165 1115 250 2330
N120 2140 270 2330
N + St120 2 + 27 3140 270 2357
1 Nitrogen as the total nitrogen in sewage sludge and farmyard manure, 2 mineral nitrogen supplied in the calcium ammonium nitrate (27% N), and 3 N in straw.

2.3. Statistical Analysis

First, the analysis results were evaluated by principal component analysis (PCA) to determine the number and influence of the most important indicators and their relationships to individual principal components. Furthermore, the results were analysed using one-way ANOVA to evaluate the effects of treatments, with Tukey’s test (p < 0.05) used for post hoc comparisons following the Shapiro–Wilk normality test. Linear regression was performed to examine relationships among selected variables. A significance level of p < 0.05 was regarded as statistically significant. All statistical analyses were conducted using Statistica software, version 12.3 (TIBCO, Palo Alto, CA, USA).
Table 3. Organic fertilisers’ dose and quality.
Quality of Fertiliser/SiteDry Matter (t per 3 Years)∑DM per 27 Years (t)OM Content 1 (%)% C in DM 2% N in DM 1% P in DM 3% K in DM 3Total Supplied C (t per 27 Years)
F18.77168.9371.228.21.760.221.8247.64
SS9.0981.8164.125.83.632.370.4821.11
St54595.342.80.540.090.9619.26
F—farmyard manure; SS—sewage sludge; St—straw. Organic fertilisers were applied 9 times during the entire experiment. DM—dry matter. OM—organic matter. C/N ratios were 16.0, 7.1, and 79.3 for F, SS, and St, respectively. 1 OM and N content determined according to the national reference laboratory [43]. 2 Using the CHNS analyser method [37] described in 2.2 soil analysis; 3 P and K determined according to the national reference laboratory [44].

3. Results

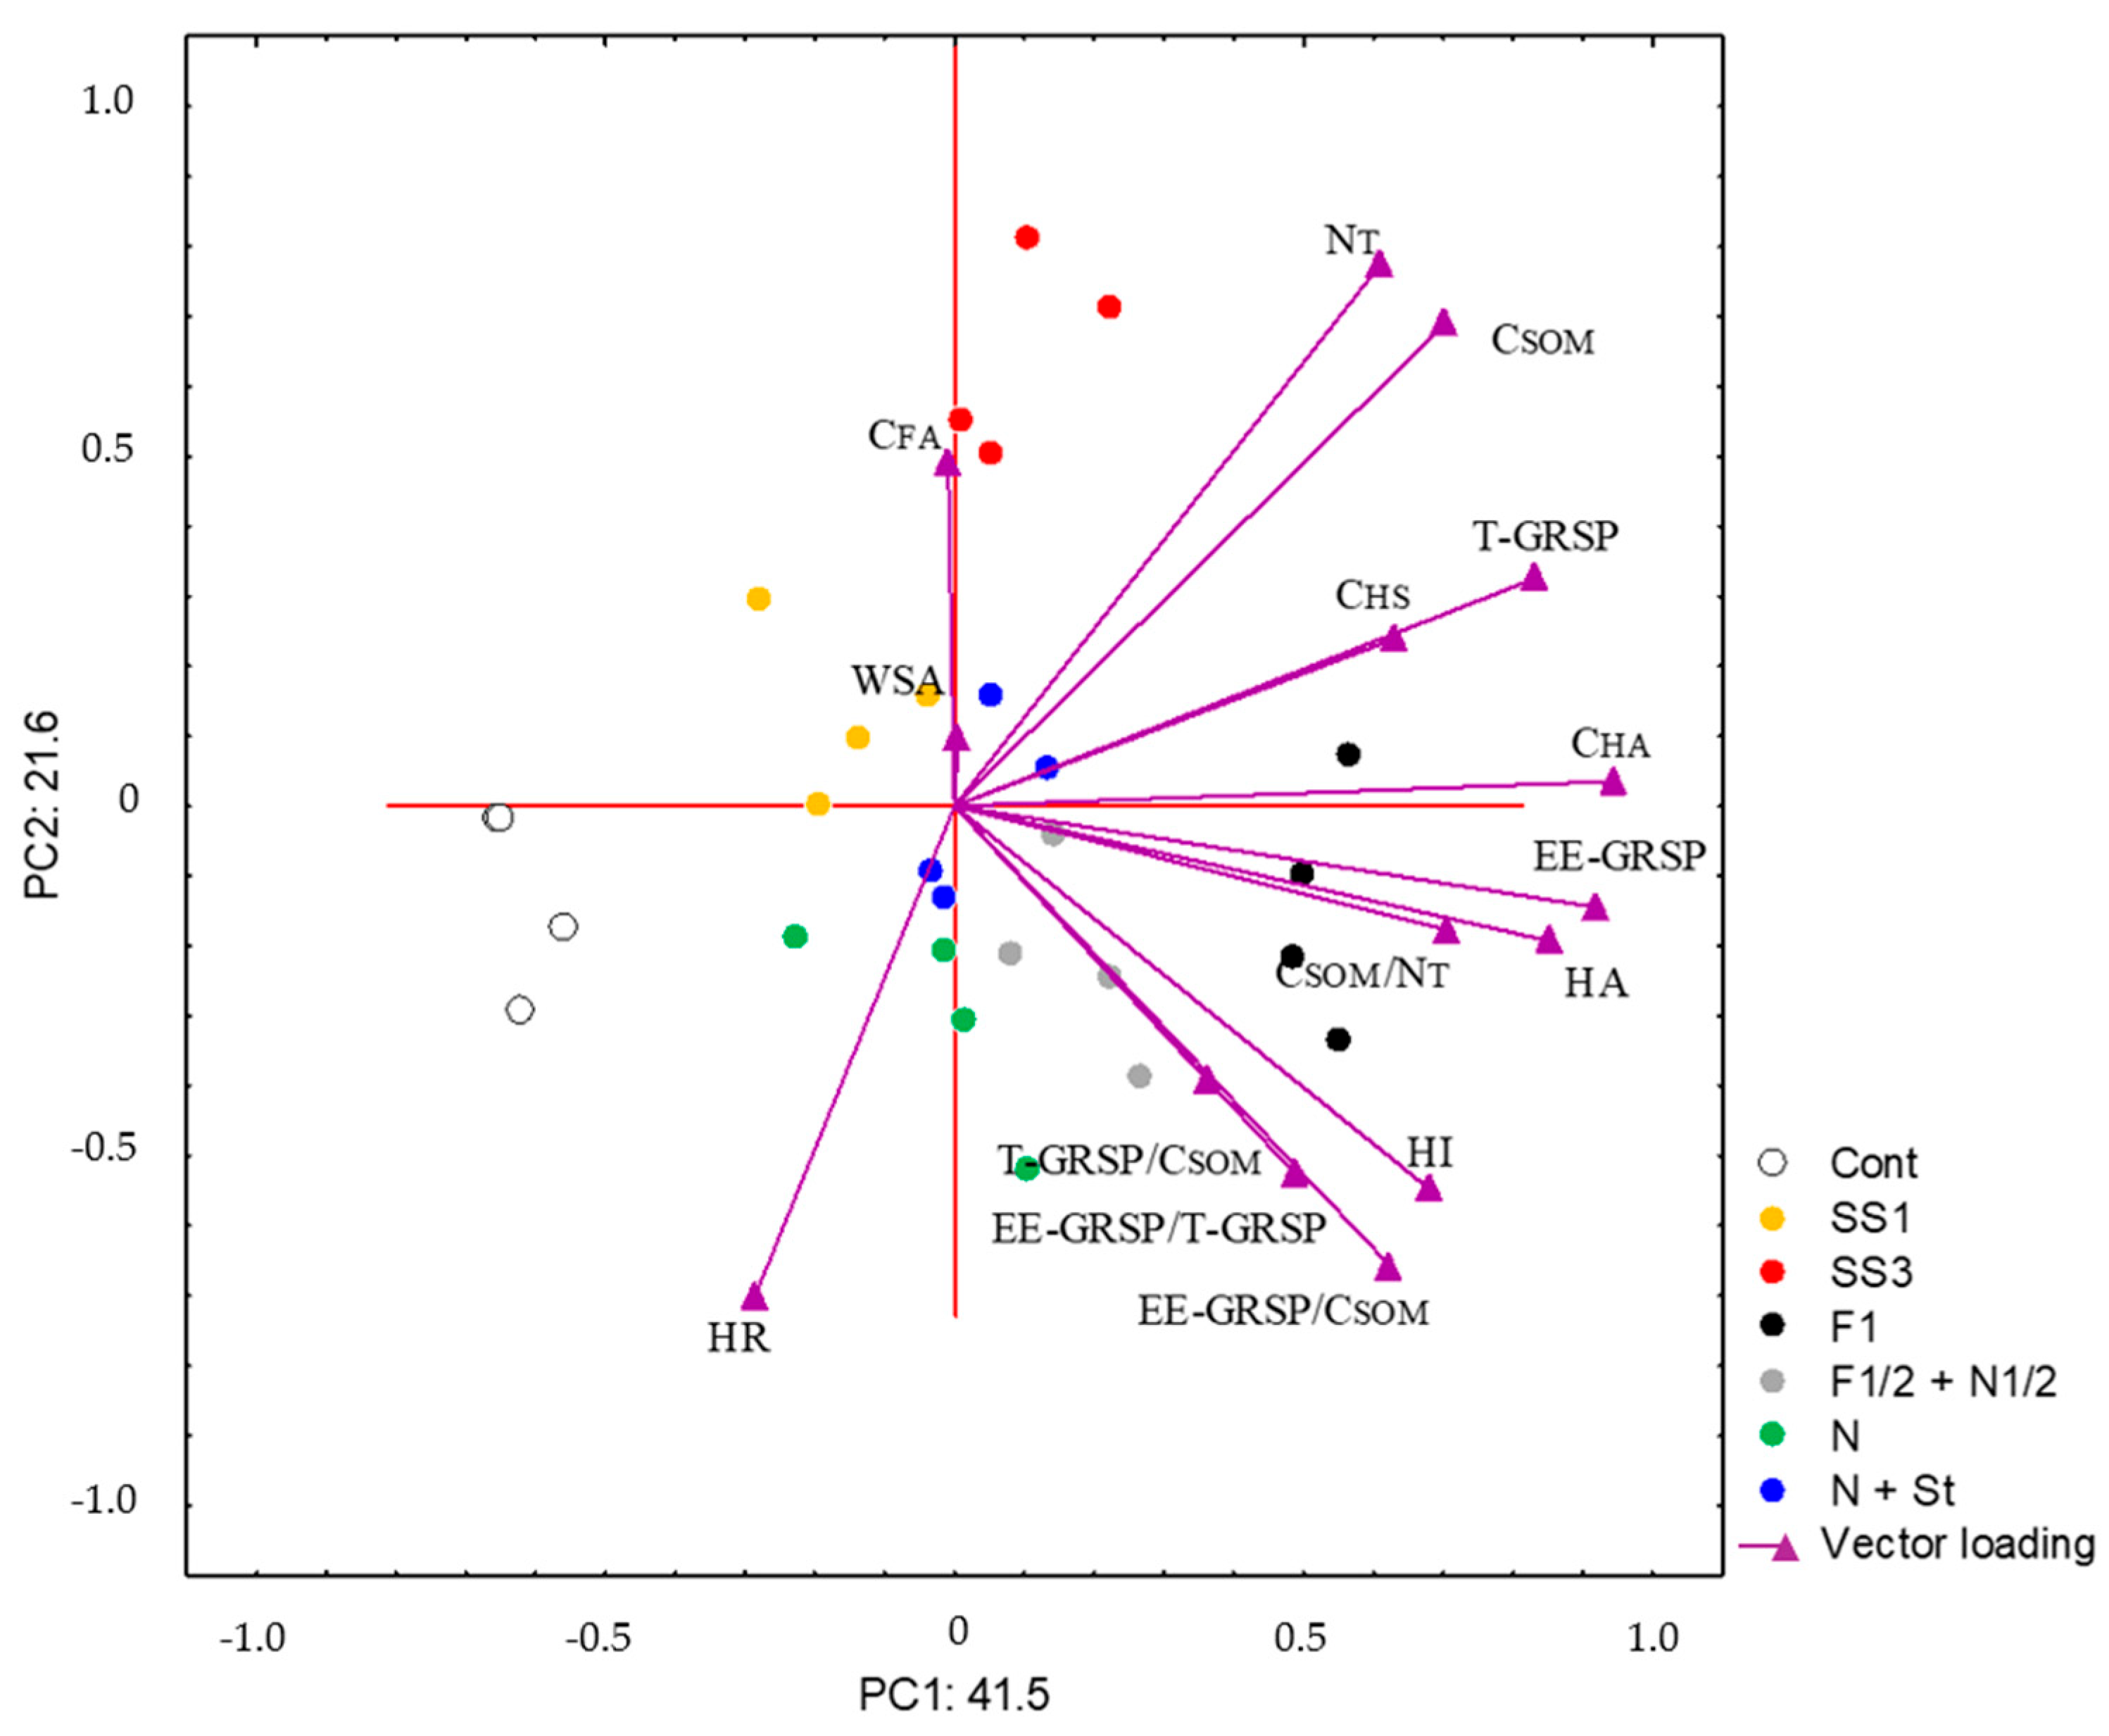
3.1. Principal Component Analysis

Principal component analysis (PCA) was performed to evaluate the most important indicators of the SOM content and quality (Table 4). Several criteria were used to select the appropriate number of PCs. Firstly, the Kaiser criterion (eigenvalue > 0.1) and cumulative variance exceeding 70% were applied. This resulted in three principal components (PCs). We will focus only on PC1 and PC2 as no indicator is correlated with PC3 by a coefficient higher than 0.7 or lower than −0.7. The CSOM, CHA, EE-GRSP, T-GRSP, and CSOM/NT correlate most with PC1. The HR and NT correlate most with PC2. Additionally, PC1 accounts for 41.5% of the total variance in the dataset, while PC2 contributes an additional 21.6%. Together, these two components explain 63.1% of the variability in the SOM quality and content indicators, underlining their relevance for further interpretation.
Figure 1 shows the projection of cases and variables on the factor plane considering PC1 and PC2. The F1 treatment is most positively related to PC1 (CSOM, CHA, EE-GRSP, T-GRSP, and CSOM/NT). The F1/2 + N1/2 treatment also influenced several SOM quality indicators, such as T-GRSP/CSOM, EE-GRSP/T-GRSP, and EE-GRSP/CSOM. Regarding the sewage sludge application, the SS3 treatment is related well to PC2 (CFA and NT), while the SS1 treatment does not exhibit such a relation. The unfertilised control treatment is negatively related to PC1. The mineral N, N + St, and SS1 treatments do not seem to be associated with any of the PCs. Interestingly, the lack of a strong association for these treatments with any principal component suggests that their effect on the SOM quality is minimal and less consistent compared to other treatments. These treatments are clustered near the WSA, but the WSA does not exhibit any substantial link to either of the PCs and does not explain much of the variance of the data (Table 4).

3.2. The Influence of Mineral and Organic Fertiliser on Some Selected Indicators of SOM Content and Quality

The influence of treatments on the content and quality of SOM is presented in Table 5. The lowest CSOM content was present in the control treatment. The lowest quality of SOM was also present in this treatment (lowest CHS, CHA, and HA values).
The application of a triple sewage sludge dose (SS3) significantly contributed to the increase in the CSOM content (2.03%) throughout the experiment (27 years), and a total C dose of 63.33 t.ha−1. The increase in the CSOM content and without the appropriate increase in the SOM quality in the SS3 treatment is due to the high nitrogen dose of the fertiliser (990 kg N.ha−1), the low C/N ratio, and the low quality of organic matter in the fertiliser. This is supported by the relatively low CSOM/NT ratio of the treatment. The increase in the CSOM also led to an increase in the CHA content but also to a much greater increase in the CFA. The lower quality of SOM can be documented by the values of the degree of polymerisation (HA), humification rate (HR), and humification index (HI).
An increase in the CSOM content of the mineral nitrogen treatment in comparison with that of the control was determined. The increase in the aboveground biomass caused by nitrogen fertiliser led, in turn, to an increase in the root biomass and SOM content. An increase in the CHA content, even in comparison with the SS1 treatment, was determined. The mineral nitrogen dose was not high in this treatment (110 kg N.ha−1.year−1), and in the long-term balance, it is roughly equal to the uptake of plants. This helps explain the almost positive effect of nitrogen fertiliser on the SOM quality in this treatment, as well as the high CSOM/NT ratio.

3.3. The Changes in the GRSP Content Caused by the Fertiliser

The GRSP content was influenced by the fertiliser. The significantly lowest content of the EE-GRSP and T-GRSP was present in the control treatment, which is in line with the low SOM content and quality in this treatment. The high SOM quality in the F1 treatment was characterised by the significantly highest EE-GRSP and T-GRSP content. Based on the treatment, the EE-GRSP/T-GRSP ratio was in the interval of 38.3 to 48.2%. These high values prove that the first extraction releases the determinative content of the GRSP from the soil. Indirectly, these values point to a lower SOM quality on this site.
The F1 increased the EE-GRSP/CSOM ratio. No significant effect of fertiliser was observed concerning the T-GRSP/CSOM ratio.

3.4. The Influence of the Fertiliser on the Soil Aggregate Stability and the Influence of the GRSP in This Process

No significant effect of the fertiliser on the water stability of soil aggregates (WSA) value was observed, despite the effect of the fertiliser on the SOM content and quality. The WSA is a result of a group of different factors. In addition to the SOM content and quality, these factors also include the quality of secondary aluminosilicates and in particular the iron and aluminium oxide content.

3.5. The Relationship Between the SOM Content and Quality Indicators

The regression equations between the individual SOM content and quality indicators are presented in Table 6. There is a distinct, significant positive relation between the GRSP (both EE-GRSP and T-GRSP) content and the CSOM, CHS, and CHA (p < 0.01 or lower). On the other hand, there was no relation of the GRSP to the CFA. Additionally, there was no significant relation between the WSA and any other indicator of the SOM content and quality (including the GRSP), which is in agreement with the results in Table 5.

4. Discussion

4.1. The Influence of Fertilisers on the SOM Content and Quality

An increase in the SOM content and quality was observed in the F1 treatment. This is consistent with our results from a maize monoculture, where manure application significantly increased the CSOM content and HA. A similar influence of manure on the SOM quality (including an increase in the CHA content) has been reported in the studies by Menšík et al. [45] and Liang et al. [46]. Organic matter in the farmyard manure fertiliser is stabilised before the application [47]. Therefore, this stabilised organic matter contributes to the increase in the HA value, according to Equation (1). Positive results of farmyard manure applications have also been reported by Voltr et al. [48], Naikwade et al. [49], and Macholdt et al. [50].
The extremely high dose of sewage sludge in the SS3 treatment significantly increased the CSOM, CHA, and particularly the CFA content. An increase in the HA was also observed in comparison with the unfertilised control or even the SS1 treatment. However, the HA value for the SS3 treatment was lower than for the F1 treatment. A positive effect of the appropriate dose of sludge in the SS1 treatment, compared with the unfertilised control, was previously also observed on luvisol (maize monoculture) [51]. It can be concluded that the organic matter from sewage sludge is less stable and contributes less to soil C sequestration compared to farmyard manure. Furthermore, the same conclusion can be drawn regarding the straw application. The CSOM content in the N + St treatment was higher than that in SS1, along with better quality indicators (such as a higher HA value). Similar findings were reported in our work on luvisol [52].
The nitrogen fertiliser application can have both positive and negative impacts, depending on factors such as the nitrogen dose, crop rotation, and soil–climate conditions. A significant negative influence of high doses of mineral nitrogen on the SOM content and quality was established [52]. The applied nitrogen substantially increased the microbial biomass in the soil, which in turn boosted enzymatic activity, leading to enhanced organic matter mineralisation. On the other hand, using a smaller mineral nitrogen dose in a system with multiple crops resulted in an appropriate increase in crop biomass (including roots) and, consequently, an increase in the CSOM content [53]. In comparison with the control, the nitrogen fertiliser application improved the SOM quality in this experiment.

4.2. The Changes in the GRSP Content

We observed a significant influence of the fertiliser treatments on the EE-GRSP and T-GRSP content. The highest values of the EE-GRSP were found in both farmyard manure treatments (F1 and F1/2 + N1/2), while the other fertilised treatments (SS1, SS3, N, and N + St) showed similar values. The highest T-GRSP content was observed in the F1 treatment. An increase in the T-GRSP content following farmyard manure application was also noted in our studies on luvisol [54] and cambisol [55]. Similarly, Bertagnoli et al. [17] and Zhang et al. [16] observed an increase in the T-GRSP content after the manure applications by 20 to 25%. The application of farmyard manure increases glomalin content in several ways: (i) Due to decreased bulk density and increased soil porosity [56], which provide AMF with adequate oxygen and water [57]. This enables AMF hyphae to spread more easily in porous soils [58], thereby supporting AMF development [59]. (ii) The AMF biomass content is correlated with glomalin content in the soil and in macroaggregates [60]. Soil aggregates (diameter > 250 μm) provide suitable sites for microorganisms, and the application of farmyard manure supports the growth and metabolism of various AMF species [61,62]. (iii) The adjustment of soil pH [63] and the availability of nutrients [64] reduce competition between AMF and their host plant [65].
An increase in the EE-GRSP and T-GRSP was observed in the sewage sludge treatments (SS1 and SS3). A similar effect was also observed in our experiments with the maize monoculture [51] and crop rotation on luvisol [52], which is consistent with the results of Sandeep et al. [14]. An increase in the GRSP fraction content was determined in the N and N + St treatments, which aligns with the findings in the studies of Nie et al. [66], Liang et al. [46], and Balík et al. [15]. Long-term fertiliser application influences the accumulation of the GRSP in the soil, both directly and indirectly, by regulating AMF species diversity or increasing AMF biomass [67]. However, the influence of AMF may not be the only factor affecting the GRSP content. According to Cissé et al. [68], certain proteins, which are similar to glomalin in character, can continually form in the soil during the transformations of SOM. These proteins are also extracted during GRSP content determination. The authors make this conclusion based on the evaluation of their 80-year-old field experiments.
In general, the results can be influenced by several factors, including the crop, cultivation practices [69], fertiliser type and dose, and soil–climate conditions. In our studies with a maize monoculture on luvisol [51] and chernozem [52], we did not observe significant differences between the fertiliser treatments and the unfertilised control. However, a significant increase in the GRSP content was observed in our work with crop rotation [15]. It is important to note a simple three-crop rotation was used in that study. When using a more diverse crop rotation (more diverse species including forage crops), a significant increase in the EE-GRSP and T-GRSP content following NPK fertiliser application on luvisol [54] and cambisol [55] was observed. Fertiliser treatment also influenced the EE-GRSP/T-GRSP ratio (Table 5). The lowest proportion was observed in the N + St treatment (38.3%), while the highest was found in the F1 treatment (48.2%). It appears that this ratio is primarily determined by the soil texture and soil type, as indicated by our previous studies. The EE-GRSP/T-GRSP ratio was 29.8% on sandy soils, 18.1% on clayey soils, 14.4% on chernozem, and 25.4% on cambisol [19]. For comparison, Cissé et al. [68] reported a value of 28.3%. A relatively higher value of the EE-GRSP/T-GRSP ratio suggests that the SOM quality is suboptimal at this site, though the general validity of this observation requires further investigation.
The proportion of the EE-GRSP in the CSOM ranged from 3.48% to 4.67%, with the highest proportion observed in the F1 and F1/2 + N1/2 treatments. This is consistent with cambisol monitoring in the Czech Republic, where the average value was 3.8% [19]. The ratio was higher in sandy soils, reaching up to 5%, while clayey soils had a lower proportion, averaging 3.7%. The results in Table 5 indicate that the application of farmyard manure provides the SOM with more stable components compared to sewage sludge.
The proportion of the T-GRSP in the CSOM ranged from 8.88% to 9.97%, which is relatively low in comparison. For instance, Comis [70] and Yang et al. [71] reported values of 27%, while Singh et al. [20] found 25%. The values observed in the current study are low even compared to those in our previous work. The average value for cambisol samples collected across the Czech Republic was 16.9% [19], and the proportion of the T-GRSP in the CSOM from long-term field experiments at four different cambisol sites was 18.6% [55]. The lower values in the present study are likely attributed to the lower SOM quality specific to the Lukavec site. The HA ratio at this site was between 0.46% and 0.87%, compared to an average of 0.93% for cambisol samples across the country [19]. It can be concluded that a higher proportion of the T-GRSP in the CSOM is generally associated with higher SOM quality, as demonstrated by a 27% proportion in chernozem and 16.9% in cambisol [19]. Although no significant differences were observed among the treatments in the current study, there was a decreasing trend in the unfertilised control and SS1 and SS3 treatments.

4.3. The Soil Aggregate Stability and the Influence of the GRSP in This Process

No significant influence of the fertiliser treatment on the WSA value, calculated according to Equation (4), was observed (Table 5). This result is unexpected, considering the significant effect of fertiliser in increasing the CSOM content and SOM quality. For example, fertiliser application led to an increase in the EE-GRSP and T-GRSP content, and the ability of glomalin to influence soil aggregation is well documented [8,23,71]. Glomalin is a glycoprotein with naturally sticky and adhesive properties, binding soil particles and organic matter, thus aiding in the aggregation of soil particles.
Stehlíková et al. [72] mention that the Lukavec cambisol site was characterised by the relatively high stability of soil aggregates. This is likely due to a high content of iron and aluminium oxides. The content of Fe and Al in the current study is presented in Table 1 as a “pseudo-total” (via aqua regia digestion) or HNO3 extraction. The values in the study of Stehlíková et al. [72] are more precise, as they measured the Fe and Al oxides at 4537 mg.kg−1 and 2607 mg.kg−1, respectively. The high aggregate stability is probably also supported by a higher content of aliphatic hydrophobic components in the SOM, which provides additional protection for the soil aggregates [72].
The positive effect of the Fe and Al oxides’ content on the soil aggregate stability likely explains why mineral nitrogen fertiliser did not decrease aggregate stability. This finding is not consistent with our previous work on a maize monoculture on chernozem [52]. While mineral fertiliser application can lower pH, leading to elevated levels of NH4+ in the soil, it may not necessarily have a detrimental effect on soil aggregates. In contrast, mineral fertiliser can have negative impacts on soil aggregates through the increased mineralisation of SOM (known as the priming effect) [73].

4.4. The Relationship Between the SOM Content and Quality Indicators

The regression equations between the individual SOM content and quality indicators are presented in Table 6. A clear relationship is evident between the CSOM content and EE-GRSP and T-GRSP. These results are consistent with our studies on cambisol [55], luvisol [54], and chernozem [52]. Other authors also report a strong relationship between these variables [3,41,74]. However, some studies show a negative correlation between the GRSP content and CSOM content [75]. In most cases, only one fraction of the GRSP correlates with the CSOM content. For example, Stehlíková et al. [72] found a significant relationship only between the EE-GRSP and CSOM at the same site (Lukavec). Similarly, the strong relationship between the EE-GRSP and CSOM (but not T-GRSP and CSOM) is demonstrated in the works of Řezáčová et al. [76] and Balík et al. [15]. Conversely, Černý et al. [19] observed a positive correlation between the T-GRSP and CSOM, but not between the EE-GRSP and CSOM, when evaluating samples from across the entire Czech Republic. It can be concluded that while correlations between the GRSP and CSOM do exist, the strength of the correlation between individual fractions (EE-GRSP or T-GRSP) depends on specific conditions.
Many studies assess organic matter quality by fractionating it into humic and fulvic acids, as described by Stevenson [77] and Wang et al. [78]. In this study, we present the CHS, CHA, and CFA content, along with the value of the HA, as indicators of the SOM quality. Notably, both the CHA content and HA value are considered critical indicators of SOM quality.
Our results (Table 6) demonstrate a strong relationship between the GRSP content (both fractions) and the CHS, CHA content, and HA, but no such correlation was observed with the CFA content. A similar strong correlation between the GRSP (both fractions) and CHA content was found on cambisol in experiments involving diverse crop rotation and mineral fertilisation combined with farmyard manure [55] and on luvisol [54]. However, no relationship with the HA was identified in these studies. The relationship between both GRSP fractions and the CHA content (but not CFA content) was also established in long-term field experiments with a maize monoculture on luvisol. In this context, the HA value correlated only with the EE-GRSP [51]. We observed a correlation solely between the EE-GRSP and CFA in our study on the maize monoculture on chernozem [52]. Moreover, in an experiment with a short crop rotation on luvisol, a correlation was also observed between the T-GRSP and both the CHA and CFA, but not with the HA [15]. It can be concluded that there is a relationship between the GRSP content (EE-GRSP and T-GRSP) and the CHA and CFA content and the HA ratio. The strength of this relationship is influenced by site characteristics and the fertilisation system. The experimental results highlight the significant role of farmyard manure in this relationship. The application of farmyard manure markedly influences the SOM content, SOM quality, EE-GRSP, and T-GRSP and also enhances their correlation. The effects of fertiliser application are more pronounced on soil types with lower SOM quality (e.g., cambisol) compared to soils with higher SOM quality (e.g., chernozem). More “robust” indicators of SOM quality (such as the HA value) tend to prevail in the evaluation of diverse site sets. In terms of the baseline monitoring of soils across the Czech Republic, only the T-GRSP showed a correlation with the HA ratio [19].
The effort to further evaluate the relationship between the GRSP (EE-GRSP and T-GRSP) and other SOM quality indicators is essential, particularly for the objective assessment of glomalin itself. For instance, Stehlíková et al. [72] found a positive correlation between the GRSP (both EE-GRSP and T-GRSP) and the content of SOM aromatic compounds. It is also possible to focus on the relationship between the GRSP content and aggregate stability. A positive relationship between these factors was determined in studies by Řezáčová et al. [76] and Wright et Anderson [79]. We determined that there was no significant relationship between the soil aggregate stability (using the WSA as an indicator) and both GRSP fractions’ content. Additionally, no significant relationship between the WSA and CSOM content or SOM quality indicators (CHS, CHA, CFA, HA) was present. This is in agreement with the results of Stehlíková et al. [72]. It is important to note that their study was also conducted on the Lukavec site, the same site we selected for the current work. Our results and those of Stehlíková et al. [72] are contrary to the results of Řezáčová et al. [76] and Wright et Anderson [79], highlighting the complexity of this topic.

5. Conclusions

Based on our results from the long-term field experiment with crop rotation and different mineral and organic fertilisers on cambisol, we can state the following:
(1)
The lowest soil organic matter (SOM) content and quality were determined on unfertilised control treatment. Additionally, there was also the lowest degree of polymerisation (HA) and GRSP content (EE-GRSP and T-GRSP).
(2)
High sewage sludge doses significantly increased the SOM content. The response in the SOM quality was smaller, which is proven by a lower degree of polymerisation, the humification index (HI), and the humification rate (HR).
(3)
The high CSOM content and highest SOM quality were determined in the farmyard manure treatment. The HA value and the content of the GRSP (EE-GRSP and T-GRSP) were the highest.
(4)
The positive effect of mineral N fertiliser in combination with straw on the SOM content and quality was observed.
(5)
Significant relationships between the GRSP content (EE-GRSP and T-GRSP) and the CSOM content, CHS, CHA, and HA were determined. On the other hand, there was no relationship between the GRSP content (EE-GRSP and T-GRSP) and CFA content.
(6)
The relationship between the stability of soil aggregates (WSA) and SOM content and quality was not confirmed. The relationship between the WSA and GRSP (both EE-GRSP and T-GRSP) was not observed either.
(7)
There was a significant influence of the fertiliser treatment on the EE-GRSP and T-GRSP content.

Author Contributions

Conceptualisation, J.B.; data curation, P.S., J.Č. and O.S.; methodology, O.S., J.Č. and S.P.; validation, M.K.; writing—original draft, J.B. and P.S. All authors have read and agreed to the published version of the manuscript.

Funding

This manuscript was funded by the following sources: Ministerstvo Zemědělství (the Ministry of Agriculture of the Czech Republic), grant numbers QK21010124 and QK23020056.

Data Availability Statement

Data used to create this manuscript are available from the corresponding author without any reservations.

Conflicts of Interest

The authors declare no conflicts of interest.

References

  1. Food Agriculture Organization of United Nations. FAO’S Work on Climate Change. 2018. Available online: https://openknowledge.fao.org/server/api/core/bitstreams/7b68d197-abcf-49a2-ad5a-48e7b9141d86/content (accessed on 31 May 2024).
  2. Lal, R. Soil carbon sequestration impacts on global climate change and food security. Science 2004, 304, 1623–1627. [Google Scholar] [CrossRef] [PubMed]
  3. Wright, S.F.; Upadhyaya, A. Extraction of an abundant and unusual protein from soil and comparison with hyphal protein of arbuscular mycorrhizal fungi. Soil Sci. 1996, 161, 575–586. [Google Scholar] [CrossRef]
  4. Bolliger, A.; Nalla, A.; Magid, J.; de Neergaard, A.; Dole Nalla, A.; Bøghansen, T.C. Reexamining the glomalin-purity of glomalin-related soil protein fractions through immunochemical, lectin-affinity and soil labelling experiments. Soil Biol. Biochem. 2008, 40, 887–893. [Google Scholar] [CrossRef]
  5. Gillespie, A.W.; Farrell, R.E.; Walley, F.L.; Ross, A.R.S.; Leinweber, P.; Eckhardt, K.U.; Regier, T.Z.; Blyth, R.I. Glomalin-related soil protein contains non-mycorrhizal-related heat-stable proteins, lipids and humic materials. Soil Biol. Biochem. 2011, 43, 766–777. [Google Scholar] [CrossRef]
  6. Walley, F.L.; Gillespie, A.W.; Adetona, A.B.; Germida, J.J.; Farrell, R.E. Manipulation of rhizosphere organisms to enhance glomalin production and C sequestration: Pitfalls and promises. Can. J. Plant Sci. 2014, 94, 1025–1032. [Google Scholar] [CrossRef]
  7. Rosier, C.L.; Hoye, A.T.; Rillig, M.C. Glomalin-related soil protein: Assessment of current detection and quantification tools. Soil Biol. Biochem. 2006, 38, 2205–2211. [Google Scholar] [CrossRef]
  8. Irving, T.B.; Alptekin, B.; Kleven, B.; Ané, J.M. A critical review of 25 years of glomalin research: A better mechanical understanding and robust quantification techniques are required. New Phytol. 2021, 232, 1572–1581. [Google Scholar] [CrossRef] [PubMed]
  9. Rillig, M.C. Arbuscular mycorrhizae, glomalin, and soil aggregation. Can. J. Soil Sci. 2004, 80, 355–363. [Google Scholar] [CrossRef]
  10. Wu, Q.S.; Cao, M.Q.; Zou, Y.N.; He, X.H. Direct and indirect effects of glomalin, mycorrhizal hyphae, and roots on aggregate stability in rhizosphere of trifoliate orange. Sci. Rep. 2014, 4, 5823. [Google Scholar] [CrossRef]
  11. Dai, J.; Hu, J.; Zhu, A.; Lin, X. No-tillage with half-amount residue retention enhances microbial functional diversity, enzyme activity and glomalin-related soil protein content within soil aggregates. Soil Use Manag. 2017, 33, 153–162. [Google Scholar] [CrossRef]
  12. Saikia, R.; Sharma, S.; Thind, H.S.; Sidhu, H.S.; Yadvinder, S. Temporal changes in biochemical indicators of soil quality in response to tillage, crop residue and green manure management in a rice-wheat system. Ecol. Indic. 2019, 103, 383–394. [Google Scholar] [CrossRef]
  13. Turgay, O.C.; Buchan, D.; Moeskops, B.; De Gusseme, B.; Ortas, I.; De Neve, S. Changes in soil ergosterol content, glomalin-related soil protein, and phospholipid fatty acid profile as affected by long-term organic and chemical fertilization practices in Mediterranean Turkey. Arid Land Res. Manag. 2015, 29, 180–198. [Google Scholar] [CrossRef]
  14. Sandeep, S.; Manjaiah, K.M.; Pal, S.; Singh, A.K. Soil carbon fractions under maize-wheat system: Effect of tillage and nutrient management. Environ. Monit. Assess. 2016, 188, 14. [Google Scholar] [CrossRef] [PubMed]
  15. Balík, J.; Sedlář, O.; Kulhánek, M.; Černý, J.; Smatanová, M.; Suran, P. Effect of organic fertilisers on glomalin content and soil organic matter quality. Plant Soil Environ. 2020, 66, 590–597. [Google Scholar] [CrossRef]
  16. Zhang, X.; Wu, X.; Zhang, S.; Xing, Y.; Wang, R.; Liang, W. Organic amendment effects on aggregate-associated organic C, microbial biomass C and glomalin in agricultural soils. Catena 2014, 123, 188–194. [Google Scholar] [CrossRef]
  17. Bertagnoli, B.G.P.; Oliveira, J.F.; Barbosa, G.M.C.; Filho, A.C. Poultry Litter and Liquid Swine Slurry Applications Stimulate Glomalin, Extraradicular Mycelium Production, and Aggregation in Soils. Soil Till. Res. 2020, 202, 104657. [Google Scholar] [CrossRef]
  18. Li, X.; Han, S.; Luo, X.S.; Chen, W.L.; Huang, Q.Y. Arbuscular mycorrhizal-like fungi and glomalin-related soil protein drive the distributions of carbon and nitrogen in a large scale. J. Soils Sediments 2020, 20, 963–972. [Google Scholar] [CrossRef]
  19. Černý, J.; Balík, J.; Suran, P.; Sedlář, O.; Procházková, S.; Kulhánek, M. The Content of Soil Glomalin Concerning Selected Indicators of Soil Fertility. Agronomy 2024, 14, 1731. [Google Scholar] [CrossRef]
  20. Singh, A.K.; Rai, A.; Singh, N. Effect of long-term land use systems on fractions of glomalin and soil organic carbon in the Indo-Gangetic plain. Geoderma 2016, 277, 41–50. [Google Scholar] [CrossRef]
  21. Driver, J.D.; Holben, W.E.; Rillig, M.C. Characterization of glomalin as a hyphal wall component of arbuscular mycorrhizal fungi. Soil Biol. Biochem. 2005, 37, 101–106. [Google Scholar] [CrossRef]
  22. Rillig, M.C. A connection between fungal hydrophobins and soil water repellency? Pedobiologia 2005, 49, 395–399. [Google Scholar] [CrossRef]
  23. Schindler, F.V.; Mercer, E.J.; Ricc, A.J. Chemical characteristics of glomalin-related soil protein (GRSP) extracted from soil of varying organic matter. Soil Biol. Biochem. 2007, 39, 320–329. [Google Scholar] [CrossRef]
  24. Zhang, J.; Tang, X.; Zhong, S.; Yin, G.; Gao, Y.; He, X. Recalcitrant carbon components in glomalin-related soil protein facilitate soil organic carbon preservation in tropical forests. Sci. Rep. 2017, 7, 2391. [Google Scholar] [CrossRef]
  25. Singh, A.K.; Zhu, X.; Chen, C.; Wu, J.; Yang, B.; Zakari, S.; Jiang, X.J.; Singh, N.; Liu, W. The role of glomalin in mitigation of multiple soil degradation problems. Crit. Rev. Environ. Sci. Technol. 2022, 52, 1604–1638. [Google Scholar] [CrossRef]
  26. Feige, M.J.; Braakman, I.; Hendershot, L.M. CHAPTER 1.1 disulfide bonds in protein folding and stability. In Oxidative Folding of Proteins: Basic Principles, Cellular Regulation and Engineering; Feige, M.J., Braakman, I., Hendershot, L.M., Eds.; Springer: Berlin/Heidelberg, Germany, 2018; pp. 1–33. [Google Scholar] [CrossRef]
  27. Wedemeyer, W.J.; Welker, E.; Narayan, M.; Scheraga, H.A. Disulfide bonds and protein folding. Biochemistry 2000, 39, 4207–4216. [Google Scholar] [CrossRef] [PubMed]
  28. Liu, T.; Wang, Y.; Luo, X.; Li, J.; Reed, S.A.; Xiao, H.; Young, T.S.; Schultz, P.G. Enhancing protein stability with extended disulfide bonds. Proc. Natl. Acad. Sci. USA 2016, 113, 5905–5910. [Google Scholar] [CrossRef]
  29. Son, Y.; Martinez, C.E.; Kao-Kniff, J. Three important roles and chemical properties of glomalin-related soil protein. Front. Soil Sci. 2024, 4, 1418072. [Google Scholar] [CrossRef]
  30. Food and Agriculture Organization of the United Nations. International Soil Classification System for Naming and Creating Legends for Soil Maps; Food and Agriculture Organization of the United Nations: Rome, Italy, 2015; Available online: http://www.fao.org/3/i3794en/I3794en.pdf (accessed on 1 September 2020).
  31. National Resource Conservation Service United States Department of Agriculture. Soil Taxonomy. 1999. Available online: https://www.nrcs.usda.gov/sites/default/files/2022-06/Soil%20Taxonomy.pdf (accessed on 16 December 2023).
  32. Sown Areas of Crops as at 31 May. Czech Statistical Ofiice. 2025. Available online: https://vdb.czso.cz/vdbvo2/faces/en/index.jsf?page=vystup-objekt&pvo=ZEM02A&z=T&f=TABULKA&skupId=346&katalog=30840&pvo=ZEM02A&evo=v2369_!_ZEM02A-2024T_1 (accessed on 27 February 2025).
  33. Minasny, B.; Mcbratney, A.B.; Brough, D.M.; Jacquier, D. Models relating soil pH measurements in water and calcium chloride that incorporate electrolyte concentration. Eur. J. Soil Sci. 2011, 62, 728–732. [Google Scholar] [CrossRef]
  34. Mehlich, A. Mehlich 3 soil test extractant: A modification of Mehlich 2 extractant. Commun. Soil Sci. Plant Anal. 1984, 15, 1409–1416. [Google Scholar] [CrossRef]
  35. ISO Standard No. 11466:1995; Soil Quality—Extraction of Trace Elements Soluble in Aqua Regia. International Organization for Standardization: Geneva, Switzerland, 1995. Available online: https://www.iso.org/standard/19418.html (accessed on 20 December 2022).
  36. Sparks, D.L.; Page, A.L.; Helmke, P.A.; Loeppert, R.H. Methods of Soil Analysis Part 3. Chemical Methods; ACSESS: Madison, WI, USA, 2020; p. 1424. [Google Scholar]
  37. Johnson, A.; Ruppenthal, M.; Kraus, S.; Szuppa, T.; Schmidt, C.; Sieper, H. Elemental Analysis of Macro Samples of Biomass. In Proceedings of the EUBCE 2016, Amsterdam, The Netherlands, 6–9 June 2016. [Google Scholar] [CrossRef]
  38. Kononova, M.M. Soil Organic Matter: Nature, Properties and Methods of Study; Pergamon Press Ltd.: Oxford, UK, 1966. [Google Scholar]
  39. Raiesi, F. The quantity and quality of soil organic matter and humic substances following dry-farming and subsequent restoration in an upland pasture. Catena 2021, 202, 105249. [Google Scholar] [CrossRef]
  40. Iqbal, M.K.; Shafiq, T.; Hussain, A.; Ahmed, K. Effect of enrichment on chemical properties of MSW compost. Bioresour. Technol. 2010, 101, 5969–5977. [Google Scholar] [CrossRef] [PubMed]
  41. Wright, S.F.; Upadhyaya, A. A survey of soils for aggregate stability and glomalin, a glycoprotein produced by hyphae of arbuscular mycorrhizal fungi. Plant Soil. 1998, 198, 97–107. [Google Scholar] [CrossRef]
  42. Nimmo, J.R.; Perkins, K.S. Aggregate stability and size distribution. In Methods of Soil Analysis: Part 4 Physical Methods, 5.4. Soil Science Society of America; Dane, J.H., Topp, G.C., Eds.; Soil Science Society of America, Inc.: Madison, WI, USA, 2002; pp. 317–327. [Google Scholar] [CrossRef]
  43. National Reference Laboratory. 20321.1—Determination of Combustible Compounds Based on the Calculation from the CN-Analyser Data. 2022; (In Czech). Available online: https://ukzuz.gov.cz/public/portal/ukzuz/-q420773---gMWMEbuG/jpp-zkouseni-hnojiv-dalsi-postupy-20321 (accessed on 27 February 2025).
  44. National Reference Laboratory. 20070.3—Stanovení Obsahu Al, As, B, Be, Ca, Cd, Co, Cr, Cu, Fe, K, Mg, Mn, Mo, Na, Ni, P, Pb, S, V a Zn Metodou ICP-OES. 2022; (In Czech). Available online: https://ukzuz.gov.cz/public/portal/ukzuz/laboratore/dokumenty-a-publikace/jednotne-pracovni-postupy/hnojiva-prilohy/20070.3-stanoveni-prvku-metodou-icp-oes-vyd1-rev4/20070.3_Stanoven%c3%ad_prvk%c5%af_metodou_ICP_OES_vyd1_rev4.pdf (accessed on 27 February 2025).
  45. Menšík, L.; Hlisnikovský, L.; Pospíšilová, L.; Kunzová, E. The effect of application of organic manures and mineral fertilizers on the state of soil organic matter and nutrients in the long-term field experiment. J. Soils Sediments 2018, 18, 2813–2822. [Google Scholar] [CrossRef]
  46. Liang, G.; Wu, H.; Houssou, A.A.; Cai, D.; Wu, X.; Gao, L.; Wang, B.; Li, S. Soil respiration, glomalin content, and enzymatic activity response to straw application in a wheat-maize rotation system. J. Soils Sediments 2017, 18, 697–707. [Google Scholar] [CrossRef]
  47. Li, Y.; Li, J.; Chang, Y.; Li, R.; Zhou, K.; Zhan, Y.; Wei, R.; Wei, Y. Comparing bacterial dynamics for the conversion of organics and humus components during manure composting from different sources. Front. Microbiol. 2023, 14, 1281633. [Google Scholar] [CrossRef]
  48. Voltr, V.; Menšík, L.; Hlisnikovský, L.; Hruška, M.; Pokorný, E.; Pospíšilová, L. The Soil Organic Matter in Connection with Soil Properties and Soil Inputs. Agronomy 2021, 11, 779. [Google Scholar] [CrossRef]
  49. Naikwade, P.V. Soil Organic Carbon Sequestration by Long-Term Application of Manures Prepared from Trianthema portulacastrurm Linn. Comm. Soil Sci. Plant Anal. 2019, 50, 2579–2592. [Google Scholar] [CrossRef]
  50. Macholdt, J.; Piepho, H.P.; Honermeier, B. Mineral NPK and manure fertilisation affecting the yield stability of winter wheat: Results from a long-term field experiment. Eur. J. Agron. 2019, 102, 14–22. [Google Scholar] [CrossRef]
  51. Balík, J.; Kulhánek, M.; Černý, J.; Sedlář, O.; Suran, P.; Asrade, D.A. The Influence of organic and mineral fertilizers on the quality of soil organic matter and glomalin content. Agronomy 2022, 12, 1375. [Google Scholar] [CrossRef]
  52. Balík, J.; Kulhánek, M.; Černý, J.; Sedlář, O.; Suran, P.; Procházková, S.; Srade, D.A. The impact of the long-term application of mineral nitrogen and sewage sludge fertilizers on the quality of soil organic matter. Chem. Biol. Technol. Agric. 2022, 9, 86–97. [Google Scholar] [CrossRef]
  53. Balík, J.; Kulhánek, M.; Černý, J.; Sedlář, O.; Suran, P. Soil organic matter degradation in long-term maize cultivation and insufficient organic fertilization. Plants 2020, 9, 1217. [Google Scholar] [CrossRef] [PubMed]
  54. Balík, J.; Suran, P.; Sedlář, O.; Černý, J.; Kulhánek, M.; Procházková, S.; Asrade, D.A.; Smatanová, M. Long-term application of manure and different mineral fertilization in relation to the soil organic matter quality of luvisols. Agronomy 2023, 13, 2678. [Google Scholar] [CrossRef]
  55. Balík, J.; Suran, P.; Sedlář, O.; Černý, J.; Kulhánek, M.; Procházková, S.; Asrade, D.A.; Smatanová, M. The effect of long-term farmyard manure and mineral fertilizer application on the increase in soil organic matter quality of Cambisols. Agronomy 2023, 13, 2960. [Google Scholar] [CrossRef]
  56. Ozlu, E.; Sandhu, S.S.; Kumar, S.; Arriaga, F.J. Soil health indicators impacted by long-term cattle manure and inorganic fertilizer application in a corn-soybean rotation of South Dakota. Sci. Rep. 2019, 9, 11776. [Google Scholar] [CrossRef]
  57. Wang, H.; Parent, S.; Gosselin, A.; Desjardins, Y. Vesicular-arbuscular mycorrhizal peat-based substrates enhance symbiosis establishment and growth of three micropropagated species. J. Am. Soc. Hortic. Sci. 1993, 118, 896–901. [Google Scholar] [CrossRef]
  58. Ma, N.; Yokoyama, K.; Marumoto, T. Promotion of host plant growth and infection of roots with arbuscular mycorrhizal fungus Gigaspora margarita by the application of peat. Soil. Sci. Plant Nutr. 2006, 52, 162–167. [Google Scholar] [CrossRef]
  59. Delavaux, C.S.; Smith-Ramesh, L.M.; Kuebbing, S.E. Beyond nutrients: A meta-analysis of the diverse effects of arbuscular mycorrhizal fungi on plants and soils. Ecology 2017, 98, 2111–2119. [Google Scholar] [CrossRef]
  60. Yang, H.; Cai, Z.; De Clerk, C.; Meersmans, J.; Colinet, G.; Zhang, W. Long-Term Manuring Enhanced Compositional Stability of Glomalin-Related Soil Proteins through Arbuscular Mycorrhizal Fungi Regulation. Agriculture 2024, 14, 1510. [Google Scholar] [CrossRef]
  61. Huo, W.; Chai, X.; Wang, X.; Batchelor, W.D.; Kafle, A.; Gu, F. Indigenous arbuscular mycorrhizal fungi play a role in phosphorus depletion in organic manure amended high fertility. soil. J. Integr. Agric. 2022, 21, 3051–3066. [Google Scholar] [CrossRef]
  62. Liu, W.; Ma, K.; Wang, X.; Wang, Z.; Negrete-Yankelevich, S. Effects of no-tillage and biologically-based organic fertilizer on soil arbuscular mycorrhizal fungal communities in winter wheat field. Appl. Soil Ecol. 2022, 178, 104564. [Google Scholar] [CrossRef]
  63. Balík, J.; Kulhánek, M.; Černý, J.; Sedlář, O.; Suran, P. Impact of organic and mineral fertilising on aluminium mobility and extractability in two temperate Cambisols. Plant Soil Environ. 2019, 65, 581–587. [Google Scholar] [CrossRef]
  64. Asrade, D.A.; Kulhánek, M.; Balík, J.; Černý, J.; Sedlář, O. Side effect of organic fertilizing on the phosphorus transformation and balance over 27 years of maize monoculture. Field. Crops Res. 2023, 291, 108902. [Google Scholar] [CrossRef]
  65. Johnson, N.C. Resource stoichiometry elucidates the structure and function of arbuscular mycorrhizas across scales. New Phytol. 2010, 185, 631–647. [Google Scholar] [CrossRef] [PubMed]
  66. Nie, J.; Zhou, J.M.; Wang, H.Y.; Chen, X.Q.; Du, C.W. Effect of long-term rice straw return on soil glomalin, carbon and nitrogen. Pedosphere 2007, 17, 295–302. [Google Scholar] [CrossRef]
  67. Agnihotri, R.; Sharma, M.P.; Prakash, A.; Ramesh, A.; Bhattacharjya, S.; Patra, A.K.; Manna, M.C.; Kurganova, I.; Kuzyakov, Y. Glycoproteins of arbuscular mycorrhiza for soil carbon sequestration: Review of mechanisms and controls. Sci. Total Environ. 2022, 806, 150571. [Google Scholar] [CrossRef]
  68. Cissé, G.; Essi, M.; Kedi, B.; Mollier, A.; Staunton, S. Contrasting effects of long term phosphorus fertilization on glomalin-related soil protein (GRSP). Eur. J. Soil Biol. 2021, 107, 103363. [Google Scholar] [CrossRef]
  69. Wojewódzki, P.; Ciescinska, B. Effect of crop rotation and long term fertilization on the carbon and glomalin content in the soil. J. Cent. Eur. Agric. 2012, 13, 814–821. [Google Scholar] [CrossRef]
  70. Comis, D. Glomalin: Hiding place for a third of the world’s stored soil carbon. Agric. Res. 2002, 50, 4–7. [Google Scholar]
  71. Yang, Y.; He, C.; Huang, L.; Ban, Y.; Tang, M. The effects of arbuscular mycorrhizal fungi on glomalin-related soil protein distribution, aggregate stability and their relationships with soil properties at different soil depths in lead-zinc contaminated area. PLoS ONE 2017, 12, e0182264. [Google Scholar] [CrossRef]
  72. Stehlíková, I.; Kodešová, R.; Kunzová, E.; Czakó, A.; Mayerová, M.; Madaras, M. Sixty-year impact of manure and NPK on soil aggregate stability. Geoderma Reg. 2024, 39, e00858. [Google Scholar] [CrossRef]
  73. Guo, Z.; Zhang, J.; Fan, J.; Yang, X.; Han, X.; Wang, D.; Zhu, P.; Peng, X. Does animal manure application improve soil aggregation? Insights from nine long-term fertilization experiments. Sci. Total Environ. 2019, 600, 1029–1037. [Google Scholar] [CrossRef] [PubMed]
  74. Xie, H.T.; Li, J.W.; Zhang, B.; Wang, L.F.; He, H.B.; Zhang, X.D. Long-term manure amendments reduced soil aggregate stability via redistribution of the glomalin-related soil protein in macroaggregates. Sci. Rep. 2015, 5, 14687. [Google Scholar] [CrossRef] [PubMed]
  75. Galazka, A.; Gawryjolek, K.; Grzadziel, J.; Ksiezak, J. Effect of different agricultural management practices on soil biological parameters including glomalin fraction. Plant Soil Environ. 2017, 63, 300–306. [Google Scholar] [CrossRef]
  76. Řezáčová, V.; Czakó, A.; Stehlík, M.; Mayerová, M.; Šimon, T.; Smatanová, M.; Madaras, M. Organic fertilization improves soil aggregation through increases in abundance of eubacteria and products of arbuscular mycorrhizal fungi. Sci. Rep. 2021, 11, 12548. [Google Scholar] [CrossRef]
  77. Stevenson, F.J. Humus Chemistry, Genesis, Composition, Reactions; John Wiley and Sons: New York, USA, 1994; p. 512. [Google Scholar]
  78. Wang, R.; Li, D.; Zheng, G.; Gao, Z.; Deng, F. Co-production of water-soluble humic acid fertilizer and crude cellulose from rice straw via urea assisted artificial humification under room temperature. Chem. Eng. J. 2023, 455, 140916. [Google Scholar] [CrossRef]
  79. Wright, S.F.; Anderson, R.L. Aggregate stability and glomalin in alternative crop rotations for the central Great Plains. Biol. Fertil. Soils. 2000, 3, 249–253. [Google Scholar] [CrossRef]
Figure 1. Projection of cases and variables on factor plane (PC1 vs. PC2).
Agronomy 15 00745 g001
Table 4. Correlation of principal components and individual indicators of SOM content and quality.
IndicatorPC1PC2
CSOM0.7050.691
CHS0.6330.240
CFA−0.0090.489
CHA0.9440.035
HA0.852−0.193
HR−0.286−0.701
HI0.682−0.549
EE-GRSP0.919−0.145
T-GRSP0.8310.325
EE-GRSP/T-GRSP0.488−0.526
EE-GRSP/CSOM0.625−0.659
T-GRSP/CSOM0.364−0.394
NT0.6090.772
CSOM/NT0.707−0.178
WSA0.0050.097
Eigenvalue6.233.24
Variance (%)41.521.6
Cumulative variance (%)41.563.1
Bold values indicate results either >0.7 or <−0.7; n = 28. HA is the degree of polymerisation (CHA/CFA); HR is the humification rate [(CFA + CHA)/CSOM]; HI is the index of humification (CHA/CSOM).
Table 5. The influence of the fertiliser treatment over the SOM quality and content indicators.
Treatment/IndicatorContSS1SS3F1F1/2 + N1/2NN + ST
CSOM (%)1.41 a1.67 b2.03 d1.87 cd1.71 c1.56 ab1.69 b
CHS (%)0.360 a0.434 b0.441 b0.438 b0.410 ab0.406 ab0.442 b
CFA (%)0.211 ab0.203 ab0.241 c0.200 a0.229 bc0.202 a0.206 ab
CHA (%)0.098 a0.117 b0.147 cd0.174 e0.144 cd0.137 c0.152 d
HA0.462 a0.580 b0.610 bc0.868 e0.627 bc0.691 cd0.737 d
HR0.219 b0.192 a0.191 a0.200 ab0.218 b0.217 b0.212 ab
HI0.070 a0.070 a0.072 a0.093 c0.084 b0.088 bc0.090 bc
EE-GRSP
(mg.kg−1)
491 a633 b687 b873 c806 c656 b612 b
T-GRSP
(mg.kg−1)
1252 a1536 abc1771 bc1813 c1705 bc1513 ab1596 bc
EE-GRSP/
T-GRSP (%)
39.2 ab41.2 ab38.8 ab48.2 b47.3 ab43.4 ab38.3 a
EE-GRSP/
CSOM (%)
3.48 a3.79 ab3.38 a4.67 c4.71 c4.21 bc3.62 ab
T-GRSP/
CSOM (%)
8.889.208.729.709.979.709.44n/s
N (%)0.160 a0.185 bc0.255 e0.201 d0.184 bc0.171 ab0.188 cd
CSOM/NT8.79 a8.93 ab9.00 ab9.30 b9.25 b9.11 ab9.00 ab
WSA0.6860.6870.7410.7620.7200.7680.745n/s
Tukey’s HSD post hoc test. p < 0.05. n = 16; n/s describes statistically insignificant differences among treatments. Different letters describe statistically significant differences. HA is the degree of polymerisation (CHA/CFA); HR is the humification rate [(CFA + CHA)/CSOM]; HI is the index of humification (CHA/CSOM).
Table 6. Regression of selected SOM quality indicators with glomalin content, water stability of aggregates, and potential wettability index.
XYRegressionR2
CSOMEE-GRSPy = 360.19x + 65.2350.327 **
CSOMT-GRSPy = 828.59x + 185.120.608 ***
CHSEE-GRSPy = 1818.7x − 81.9720.245 **
CHST-GRSPy = 3272.5x + 228.050.279 **
CHAEE-GRSPy = 4111.1x + 110.860.601 ***
CHAT-GRSPy = 6738.2x + 666.230.567 ***
CFAEE-GRSPy = 519.07x + 568.970.006
CFAT-GRSPy = 1881x + 1197.50.026
HAEE-GRSPy = 649.63x + 255.040.440 ***
HAT-GRSPy = 993.84x + 948.920.362 ***
CSOM/NTEE-GRSPy = 391.85x − 2867.60.478 ***
CSOM/NTT-GRSPy = 422.35x − 2224.90.195 *
CSOMWSAy = 0.0163x + 0.68790.002
CHSWSAy = 0.1199x + 0.66550.003
CHAWSAy = 0.2028x + 0.68760.004
CFAWSAy = 0.2643x + 0.65930.004
HAWSAy = 0.0228x + 0.70070.002
EE-GRSPWSAy = −0.00006x + 0.7570.011
T-GRSPWSAy = 0.00002x+ 0.68270.004
EE-GRSP/T-GRSPWSAy = −0.0027x + 0.82950.037
CSOMEE-GRSP/T-GRSPy = 1.2563x + 40.3550.002
CHSEE-GRSP/T-GRSPy = 29.669x + 30.0740.037
CHAEE-GRSP/T-GRSPy = 80.709x + 31.3320.131
CFAEE-GRSP/T-GRSPy = −13.861x + 45.4530.002
HAEE-GRSP/T-GRSPy = 14.438x + 33.0620.123
* significant at p < 0.05; ** p < 0.01; *** p < 0.001. n = 64.
Disclaimer/Publisher’s Note: The statements, opinions and data contained in all publications are solely those of the individual author(s) and contributor(s) and not of MDPI and/or the editor(s). MDPI and/or the editor(s) disclaim responsibility for any injury to people or property resulting from any ideas, methods, instructions or products referred to in the content.

