Article

A Rotational Cultivation System for Indoor-Grown Lettuce: Feasibility in Terms of Yields, Resource Efficiency, Quality, and Postharvest Storage Capacity

by
Cédric Dresch
1,2,3,*,
Véronique Vidal
1,2,
Séverine Suchail
2,4,
Olivier Chevallier
2,5,6,
Huguette Sallanon
1,2,
Vincent Truffault
3 and
Florence Charles
1,2,7
1
QualiSud UMR95, CIRAD, Montpellier Université, InstitutAgro, F-34000 Montpellier, France
2
Campus Jean-Henri Fabre, Avignon Université, Pôle Agrosciences, 301 rue Baruch de Spinoza, F-84916 Avignon, France
3
Futura Gaïa Technologies, Mas de Polvelière, Chemin du Pont des Îles, F-30230 Rodilhan, France
4
Institut Méditerranéen de la Biodiversité et d’Écologie Marine et Continentale (IMBE) UMR 7263, F-84916 Avignon, France
5
Direct d’Appui à la Recherche et à l’Innovation (DARI), Avignon Université, F-84916 Avignon, France
6
Agilent Technologies Inc., 5301 Stevens Creek Boulevard, Santa Clara, CA 95051, USA
7
UMR Sécurité et Qualité des Produits d’Origine Végétale (SQPOV), F-84916 Avignon, France
*
Author to whom correspondence should be addressed.
Agronomy 2025, 15(3), 744; https://doi.org/10.3390/agronomy15030744
Submission received: 11 February 2025 / Revised: 4 March 2025 / Accepted: 9 March 2025 / Published: 19 March 2025

Abstract

:
Indoor farming in plant factories with artificial lighting (PFAL) offers optimized growing conditions and higher water, light, and land surface use efficiencies compared to greenhouses or open field agriculture but faces challenges related to energy consumption. The objective of this work is to evaluate the feasibility of using a rotational cultivation system for indoor-grown lettuce production. We compare a rotational cultivation system to a horizontal control cultivation system in terms of yields, resource efficiency, quality at harvest, and postharvest storage capacity. No significant differences were observed in yields, water use efficiency, light use efficiency, or postharvest storage capacity between the systems. Energy and land surface use efficiencies were higher in the rotational cultivation system compared to the control and consistent with the literature. However, a slight trend toward lower fresh and dry weights throughout the cultivation period in the rotational system was noted, correlating with reduced net photosynthesis during the first two hours and at the end of the lighting period. This effect was attributed to decreased stomatal conductance and photosystem II efficiency. Furthermore, the rotational cultivation system modified the quality by modifying the global polyphenol profile of the lettuce compared to the control. Based on yields and efficiencies, we show the feasibility of using a rotational cultivation system for indoor lettuce production.

1. Introduction

Indoor farming is an alternative method of agriculture that complements conventional agriculture in addressing the challenges of feeding a constantly growing and increasingly urbanized population in the context of global warming [1,2]. Indoor farming occurs in plant factories with artificial lighting (PFAL), in which climatic parameters are controlled, and the light is provided by lamps, i.e., independent from natural sunlight. Those conditions are optimal for plant growth, explaining why indoor-grown plants have higher light, water, and land surface use efficiencies (LUE, WUE, LSUE, respectively) than plants grown in greenhouses or open-field productions [3,4,5]. However, the main challenge of indoor farming is energy consumption. For example, it has been reported that hydroponic indoor production needs eighty-two times more kJ kg−1 an−1 than conventional agriculture [6]. The cost of indoor production is three to five times higher than open-field [7] and, at an industrial scale, electricity costs represent 25% of the total cost of lettuce produced indoors [8,9]. Among parameters, lighting plays a key role in energy consumption, as it represents from 50 to 80% of the total electricity consumption of a PFAL [4,8,10,11].
It seems challenging to reduce energy consumption in indoor farming by reducing the lighting without compromising yields. Indeed, lettuce dry weight correlates with the daily light integral (DLI) in the range of 250 to 650 µmol photons m−2 [12,13,14,15]. Moreover, extensive research has already optimized lighting parameters, with optimal light quality between 400 and 700 nm, far-red supplementation (700–800 nm), optimal light intensity of 250 µmol photons m−2 s−1, and an optimal photoperiod of 16 h resulting in 14.4 mol of photons m−2 d−1 [14,16,17,18,19]. Another way to reduce energy consumption could be to decrease the number of lamps used, while keeping other lighting parameters constant. In standard horizontal cultivation systems, this is challenging in terms of light homogeneity. However, light homogeneity is a key parameter in indoor farming, as one of its advantages is to provide consistent, uniform, and stable production throughout the year.
A promising approach to reducing energy consumption without compromising yields or lighting uniformity is to optimize standard horizontal cultivation layers. One solution is to replace two-dimensional horizontal layers with a three-dimensional rotational system, where plants rotate around centrally positioned lamps. This ensures uniform light distribution with fewer lamps and integrates centralized air ventilation, which is necessary to optimize yields and production quality [20,21,22,23].
To our knowledge, only one recent study has examined the feasibility of indoor production in a rotational cultivation system [24]. However, this study did not assess efficiency, energy consumption, or quality and postharvest indicators. The objective of this work is thus to compare lettuce grown in a rotational cultivation system and in a horizontal control one in terms of yields, water use, light use, energy use, and land surface use efficiency, as well as quality at harvest and postharvest storage capacity. The GiGrow® rotational cultivation system was used, as it was designed for and is used at an industrial scale. The rotational cultivation system used rotates at a speed of 50 min per revolution, which induces a constant perturbation of plant gravity perception. Thus, to provide insights into the effects of continuous rotation on plant physiology, we also studied photosynthesis. The plant matrix used was Lactuca sativa, as it is one of the most widely consumed vegetables globally [25], commonly consumed in France (7 kg per year per inhabitant), and a standard crop in indoor farming facilities.

2. Materials and Methods

The two experiments were conducted in controlled environment agriculture, in May 2022.

2.1. Plant Material and Germination

Butterhead lettuce (Lactuca sativa L. var. fairly, ‘Enza Zaden’, The Netherlands) seeds were sown in 144 (16 × 9) holes germination trays filled with potting soil (TBSP, ‘Florentaise’, Saint-Mars-du-Désert, France). The photoperiod was 16/8 (16 h of light, 8 h of darkness) with corresponding temperatures of 24 and 19 °C, and relative humidity of 65%. Irrigation was performed every three days through sub-irrigation until saturation, using a germination solution containing nitrogen (3.2 mmol L−1), phosphorus (0.6 mmol L−1), potassium (0.9 mmol L−1), calcium (1.3 mmol L−1), magnesium (0.8 mmol L−1), and sulfur (0.1 mmol L−1). The nutrient solution had an electrical conductivity (EC) of 0.5 mS cm−1 and a pH of 5.6. Light was supplied by LED lamps (T10 LED Grow Tube Light, HW-GL-T10-1200-36W-3Y, ‘Guangzhou Haway Lighting Co., Ltd.’, Guangzhou, China) at an intensity of 130 µmol m−2 s−1, with a red:blue ratio of 3:1 and approximately 17% white light.

2.2. Plant Growth

After 14 days of germination, plants were transplanted in two different cultivation systems:
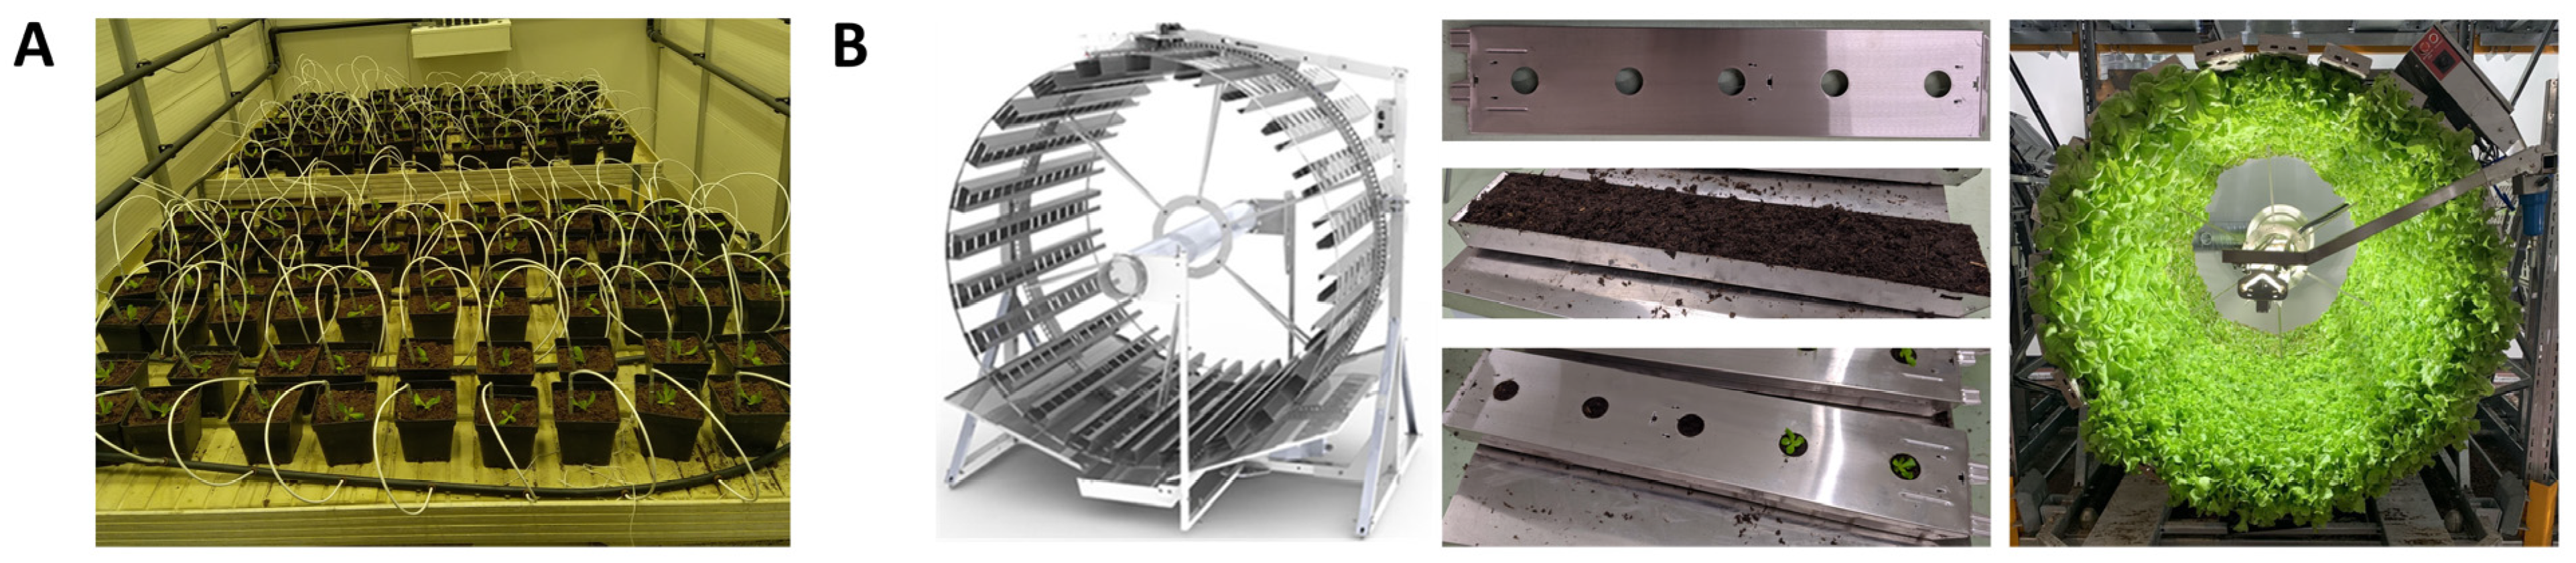
  • A control cultivation system, horizontal (Figure 1A). Lettuce grown in this cultivation system is referred to as CT lettuce. Cultivation frames (140 × 210 cm) were installed in a growth chamber and equipped with a drip irrigation system and white light LED lamps (LO250 Floodlight, LO250-PSHW06040, ‘Vegeled’, Ghent, Belgium). Lettuce was cultivated in pots (2113 cm3) filled with potting soil (VER4, ‘Florentaise’, Saint-Mars-du-Désert, France), with a density of 30 plants m−2.
  • A Gigrow® rotational cultivation system from Futura Gaïa Technologies, Rodilhan, France (Figure 1B). Lettuce grown in this cultivation system is referred to as ROT lettuce. The lettuce was transplanted in five-hole stainless steel trays (72 × 15 × 4.5; l × w × h, in cm) filled with potting soil (VER4, ‘Florentaise’, Saint-Mars-du-Désert, France), with a density of 30 plants m−2. Plants were rotating according to a horizontal rotation axis at a speed of 50 min per revolution, such a speed providing a centrifugal force of 1.33 × 10⁻⁵ Newton, considered neglectable. Light was provided using ceramic metal-halide lamps with a 4200 K color temperature (630 W double ended, ‘Lumatek Ltd.’, Saint Julian’s, Malta).
In both cultivation systems, the light intensity was 370 ± 20 µmol of photons m−2 s−1, with a red:green:blue ratio of 1:0.8:0.4. Light intensity was measured directly after transplantation at the leaf level to ensure that plants in both conditions received the same amount of light. Temperature was equal to 24 ± 0.1 °C during the light periods and 18.5 ± 0.5 °C during the darkness period in both cultivation systems. The vapor pressure deficit was equal to 1 ± 0.1 and 0.6 ± 0.1 during the light and darkness periods, respectively, in both cultivation systems. Irrigation solutions were made with NutrimixTM of Futura Gaïa Technologies. Water supply was managed to saturate the soil and avoid water deficiency effects (2.5 L plant−1 for 31 days). The fertilization solution was composed of 29.3, 1.8, 12.5, 10, 7.5 mmol L−1 of nitrogen, phosphorus, potassium, calcium, and magnesium, respectively, with an electroconductivity (EC) of 4 mS cm−1 and a pH of 6.5. The cultivation time was set to 31 days.

2.3. Measurement and Calculation Methods of Agronomic Parameters

Fresh weight, dry weight, and leaf area were studied at 0, 8, 14, 19, 24, 28, and 31 days after transplantation (DAT). Whole plants were harvested, weighed, and all leaves were arranged on a blank surface to take a picture. Leaf area was determined using ImageJ, version 1.54p [26]. The dry weight of the whole plants was determined by placing at least two representative leaves in an oven at 80 °C for seven days.
Yields and efficiencies were calculated based on fresh and dry weights at harvest, after 31 DAT. Fresh and dry yields were calculated in kilograms of fresh or dry weight, respectively, per square meter. Efficiencies were calculated according to [27], as follows. Light use efficiency (LUE) was calculated in grams of fresh or dry weight per mole of photons by summing the daily light integral (DLI) of each day of cultivation. Water use efficiency (WUE) was calculated in grams of fresh or dry weight per liter of irrigation solution provided throughout the cultivation. Energy use efficiency (EUE) was calculated in milligrams of fresh or dry weight per kilowatt consumed. For the control cultivation system, kilowatt consumption was measured using an electricity meter (CONTAX D TRI 80A LCD, MCI, Bondy, France). For the rotational cultivation system, kilowatt consumption was also measured using an electricity meter (PowerTag Vigi DT40/iC60 3P+N 63A, Schneider Electric, Rueil-Malmaison, France). For one day of cultivation, the control cultivation system consumed 203 kWh, and the rotational cultivation system consumed 43 kWh of electricity. Land surface use efficiency (LSUE) was calculated in grams of fresh or dry weight per square meter of land surface used by the cultivation system per day. For the control, the land surface used was equal to the cultivation area, while, for the rotational cultivation, a production area of 8 m2 can fit into a land surface of 2.3 m2 (1.75 m × 1.3 m).

2.4. Glucose, Fructose, and Sucrose Contents by HPAEC

Glucose, fructose, and sucrose levels were analyzed using high-performance anion-exchange chromatography (HPAEC). Lettuce leaves, after core removal, were frozen in liquid nitrogen, ground, and freeze-dried using a Cryotec Cosmos freeze-dryer (Cryotec®, Lunel-Viel, France). Dried samples (15–20 mg) were dissolved in ultra-pure water (10 mg DW mL−1), homogenized, and centrifuged at 15,000× g for 4 min at 4 °C (Merck 3-16KL, KGaA®, Darmstadt, Germany). The supernatant was filtered through a PTFE membrane filter (0.2 μm, IC Millex®-LG, Merck KGaA®, Darmstadt, Germany) and injected (5 μL) into a HPAEC (Dionex® ICS-3000, Sunnyvale, CA, USA) for sugar separation using an anion-exchange column (IC Dionex CarboPacTM PA1 analytical anion-exchange column, 10 μm, 4 × 250 mm, Dionex®, Sunnyvale, CA, USA). The mobile phase was a solution of H2O (eluent A) and 250 mM NaOH with 4 mM sodium acetate (eluent B) with an A/B ratio of 35:65 (v/v). An isocratic elution mode at a constant flow rate of 0.7 mL min−1 was performed. Detection was performed via pulsed amperometric detection (PAD) at 254 nm. Calibration curves were established with sugar standards (concentration of 2.5, 5, 7.5, 10, 12.5, 15, and 20 nmol, respectively). The CHROMELEON software v.6.7. was used to analyze the concentration of sugars. The limit of quantification was calculated according to a previous study [28]. The total soluble sugar (TSS) content was calculated by summing glucose, fructose, and sucrose contents.

2.5. Photosynthetic and Chlorophyll Fluorescence Parameters

Net photosynthesis (µmol CO2 m−2 s−1), stomatal conductance (mmol H2O m−2 s−1), and the quantum yield of PSII electron transport (ΦPSII), which represents photosystem II efficiency, were assessed using a portable photosynthesis analyzer (Head version 1.4.7, LI-COR® 6800, Li-Cor, Inc., Lincoln, NE, USA) equipped with a LI-COR® 6800-01 chamber. ΦPSII was calculated as (Fm′ − Fs)/Fm′), where Fs represents the steady-state chlorophyll fluorescence, and Fm′ is the maximum fluorescence in the same state. Measurements were conducted under a light intensity of 400 µmol photons m−2 s−1 (red:blue ratio of 9:1) with a CO2 concentration of 420 ppm. The temperature and vapor pressure deficit (VPD) were not regulated and remained at the same level as in the cultivation chamber (24/18.5 °C and 1.0/0.6 kPa for light/dark cycles). Plants from the rotational cultivation system were placed horizontally to allow for analysis and were placed under lighting conditions similar to those in the cultivation system. To avoid bias due to water stress, all plants were rehydrated hourly. Measurements were carried out after 15 days of cultivation on 10 plants, with two leaves per plant, so that each leaf was measured every hour. Net photosynthesis and stomatal conductance were monitored over the full 16 h light period, while ΦPSII was measured during the first six hours, when it reaches its peak. Measurements were taken manually every 3 to 5 min, and data were recorded once values remained stable.

2.6. Untargeted Liquid Chromatography Analysis

2.6.1. Sample Extraction

At 31 DAT, 10 ± 0.5 mg of freeze-dried lettuce was weighed out in a microcentrifuge tube and extracted with 1.5 mL of MeOH:H2O (1:1, v:v). Samples were mixed for 10 min at 20 °C, followed by centrifugation for 5 min at 15,000× g and 4 °C (Sigma 1-16K centrifuge, Osterode am Harz, Germany). Then, 300 µL of supernatant was collected and dried overnight in a miVac Duo Concentrator (Genevac, Ipswich, UK). The dry extracts were resuspended in 200 µL of ultra-pure water and filtered through a 0.22 µm PTFE filter by centrifugation at 10,000× g and 4 °C for 2 min.

2.6.2. Untargeted UPLC-ESI-QTOF-MSE Profiling

Ultra performance liquid chromatography–electrospray ionization–quadruple time-of-flight–mass spectrometryE (UPLC-ESI-QTOF-MSE) analyses were carried out on an Acquity UPLC I-Class system (Waters®, Milford, MA, USA), hyphenated to a Synapt G2-Si quadrupole time-of-flight (Q-TOF) mass spectrometer (Waters®, Milford, MA, USA). The untargeted profiling was conducted with the chromatographic and mass spectrometry conditions as described in [29]. Each sample was injected three times.

2.6.3. Data Processing and Data Analysis

Principal components analysis (PCA), an unsupervised technique, and orthogonal partial least squares discriminate analysis (OPLS-DA), a supervised technique, were used for building the qualitative models in this investigation, following the data processing and curation described by [29]. The analyzed spectral data with a coefficient of variation inferior to 30%, a significant difference with ANOVA (α = 0.05), a max abundance of at least 750, and a fold change superior to 2 were then studied with a PCA using Rstudio, version 2024.12.0 + 467 [30]. All data were mean centered and Pareto scaled prior to OPLS-DA. S-plot representation was performed to differentiate discriminant molecules between CT and ROT lettuce.

2.7. Postharvest Processing and Measurements

At 31 DAT, at harvest, the lettuce was minimally processed. Leaves were cut into pieces (approximately 3 × 3 cm), washed in chlorinated water (80 ppm) for 3 min, rinsed with tap water for 1 min, and then dried. The leaves were packaged in propylene trays covered with oriented polypropylene film using TOP SEAL 160 heat-sealer and stored in standard climatic chambers. The temperature was equal to 5.2 ± 0.5 °C, measured with a Kistock KH 110 sensor. Samples were analyzed after 0, 3, 7, and 10 days of storage. O2 and CO2 content was recorded using Gas CheckMate3 (Dansensor, Cambridge, UK). The respiration rate was measured with a static system and calculated using the following formula, with Vs representing the volume of the static system in milliliters and FW representing the fresh weight in grams.
Respiratory rate (mmol CO2 h−1 kg−1 FW) = (slope of CO2 100−1) × ((Vs − FW) × 273) × ((273 + T°C) × 22.4 × (FW 1000−1))−1.
Overall visual quality (OVQ) was scored by a three-member trained panel. Quality was evaluated considering wilting severity and overall visual aspect according to a three-point hedonic scale running from 3 = absence of wilting and marketable aspect to 0 = severe wilting and unmarketable aspect.

2.8. Statistical Analyses

Statistical analyses were conducted using RStudio version 2024.12.0 + 467 [30]. The following packages were used for data analysis and visualization: circlize, ComplexHeatmap, cowplot, dplyr, factoextra, FactoMineR, gdata, ggpattern, ggplot2, ggplotify, ggpubr, ggrepel, grid, gridExtra, multcompView, PMCMRplus, rcompanion, ropls, sf, and tidyr. The non-parametric Wilcoxon–Mann–Whitney test was used to determine if the differences observed were significant. The details of the obtained p-values not presented in the figures are provided in the Supplementary Data.

3. Results

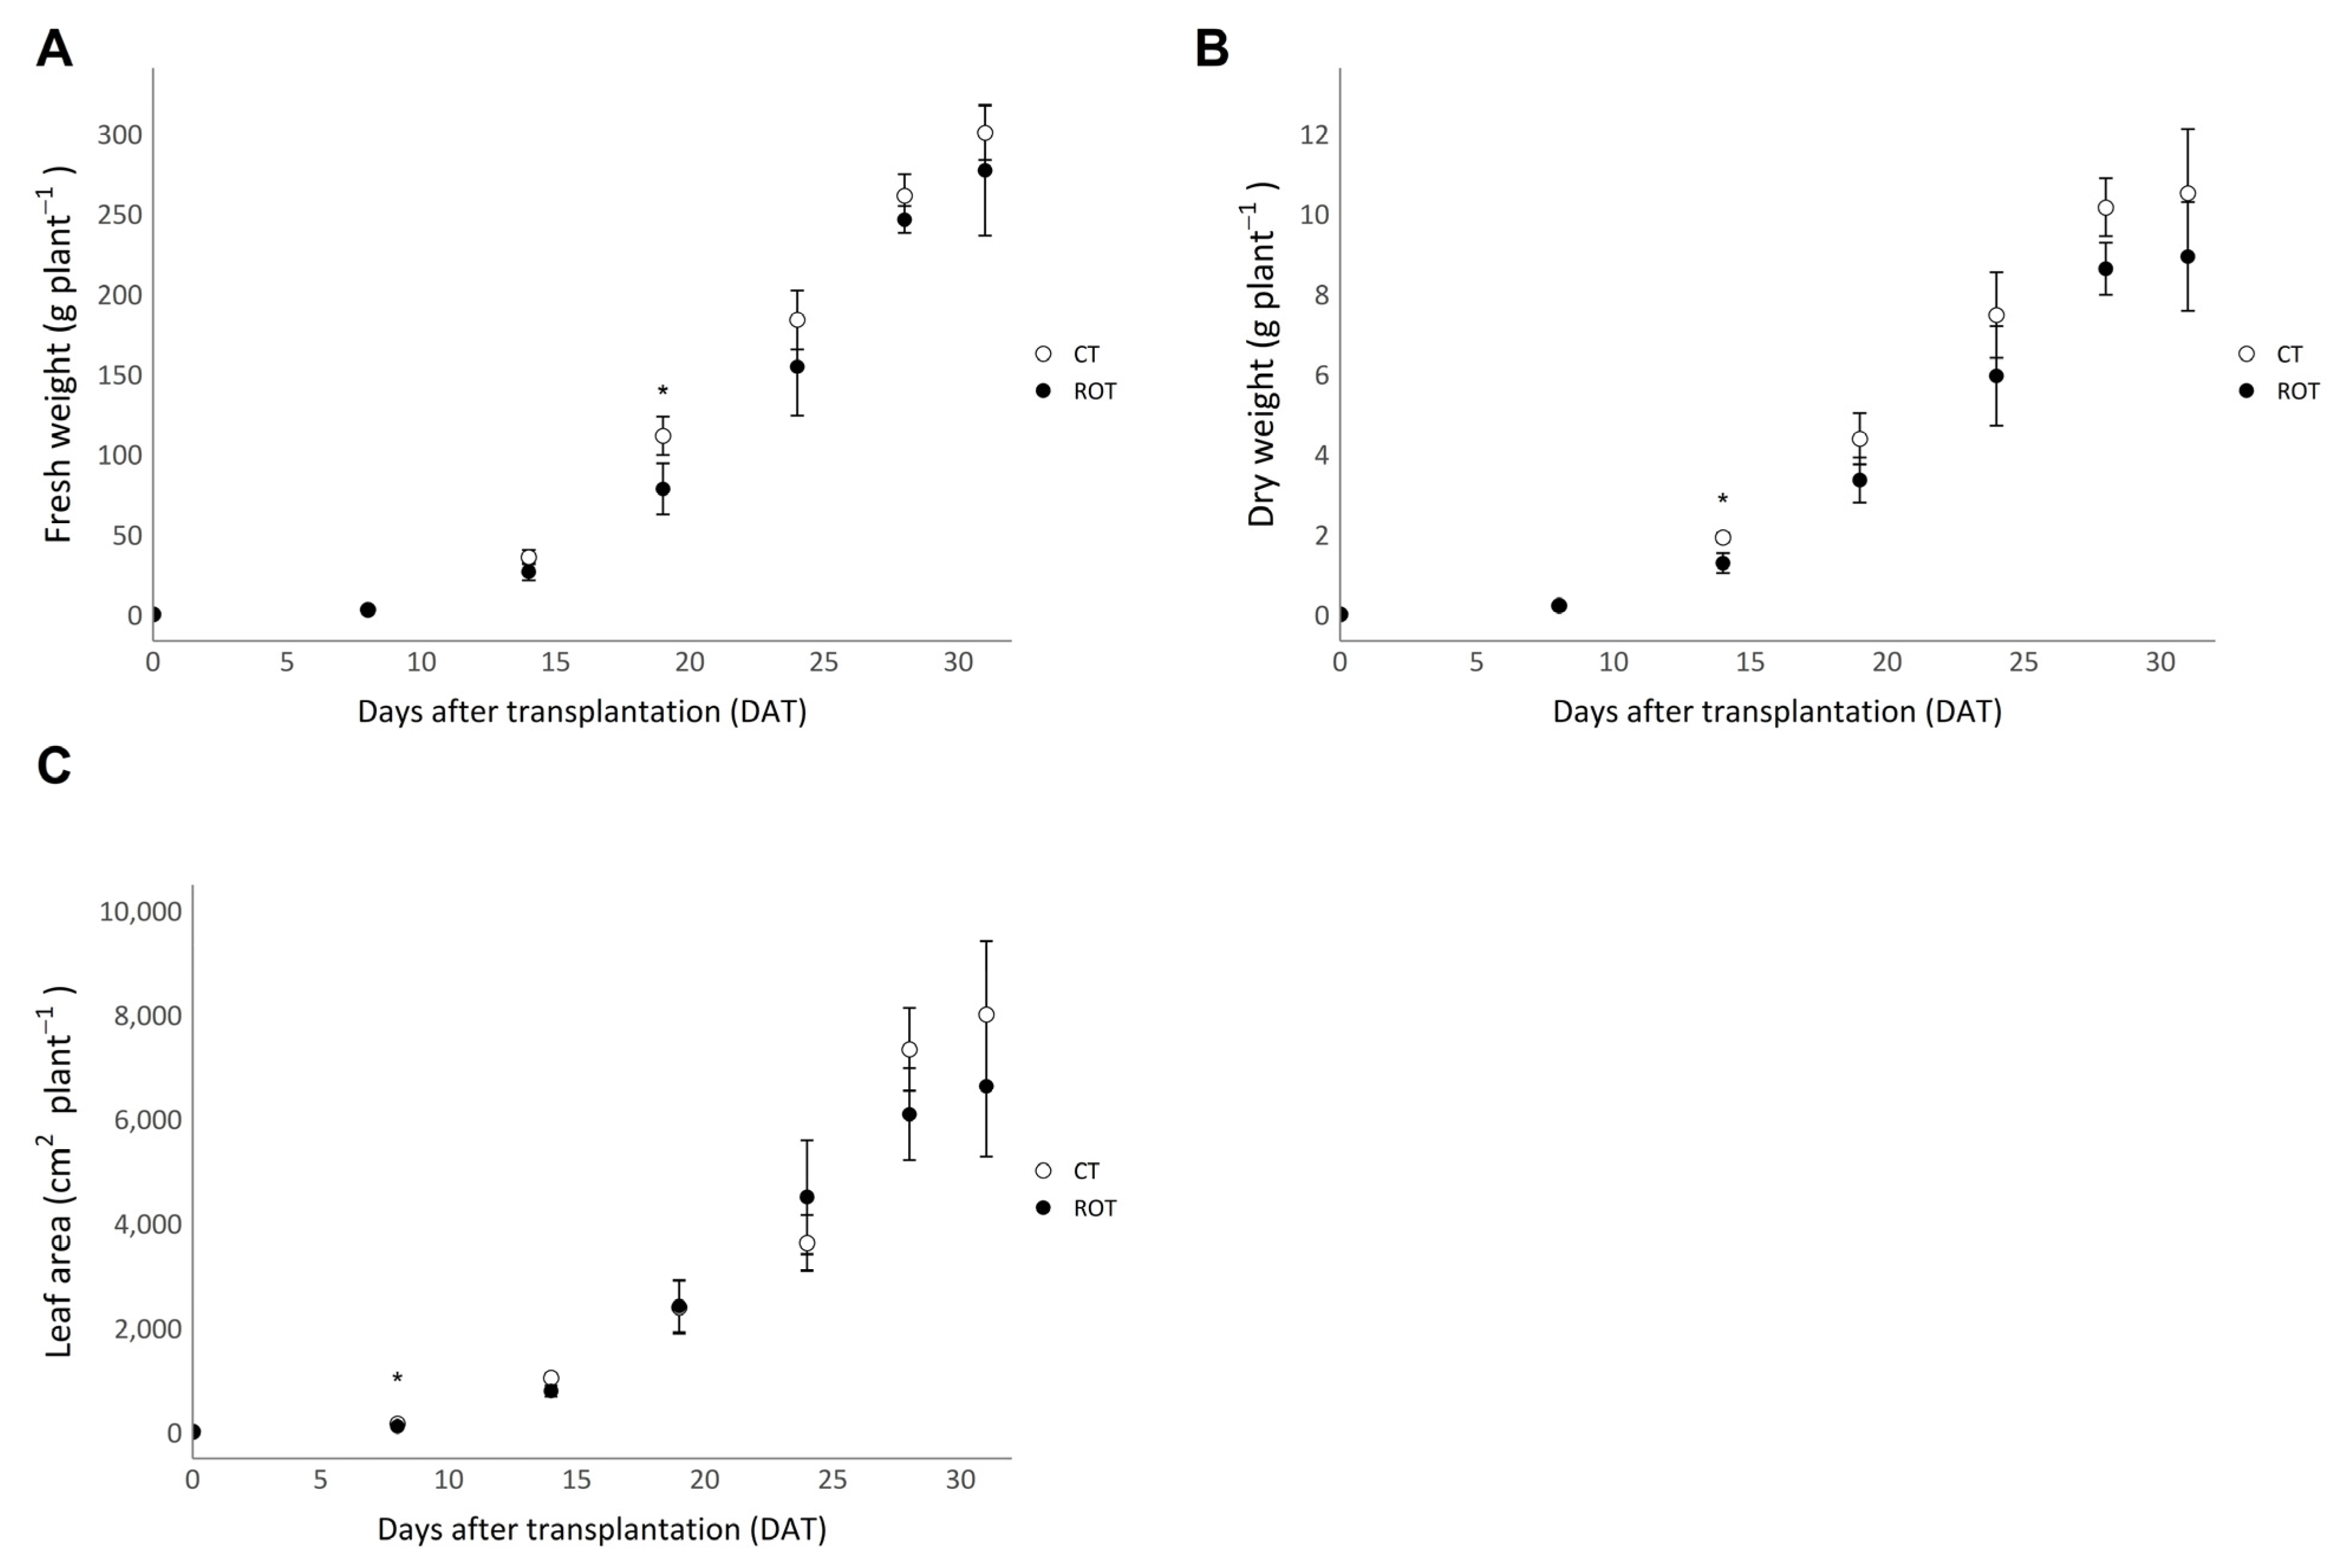
3.1. Yields, Efficiencies, and Agronomic Parameters

The yields and water, light, energy, and land surface use efficiencies (WUE, LUE, EUE, and LSUE, respectively) of CT and ROT lettuce are presented in Figure 2. No significant differences in fresh and dry yield, WUE or LUE were observed. EUE of ROT lettuce were equal to 50 g of FW kWh−1 and 1.6 g of DW kWh−1, six and five times higher than that of CT lettuce, respectively. LSUE of ROT lettuce were equal to 975 g of FW m−2 d−1 and 31 g of DW m−2 d−1, three times higher than that of CT lettuce, respectively.
The details of fresh weight per plant, dry weight per plant, and leaf area per plant of CT and ROT lettuce are presented in Figure 3. The mean fresh weights of ROT lettuce were always slightly lower than those of the control, with mean fresh weights 25%, 29%, 16%, 6%, and 8% lower than those of the control at 14, 19, 24, 28, and 31 DAT, respectively. However, the fresh weight of ROT lettuce was only significantly lower than that of CT lettuce at 19 DAT. The same trend can be observed for the dry weight, and the dry weight of ROT lettuce was only significantly lower than that of the control at 14 DAT. At harvest (31 DAT), no significant differences in fresh weight, dry weight, and leaf area were observed between ROT and CT lettuce.

3.2. Glucose, Fructose, Sucrose, and Total Soluble Sugar (TSS) Contents

Glucose, fructose, sucrose, and TSS contents are presented in Table 1. At 18 DAT, the glucose, fructose, and TSS contents of ROT lettuce were significantly lower than those of CT lettuce. Moreover, at 31 DAT, the glucose, fructose, and TSS contents of ROT lettuce were lower than those of CT lettuce, but no significant difference was observed.

3.3. Photosynthetic Parameters

The values of net photosynthesis, stomatal conductance, and efficiency of the photosystem II (ΦPSII) are presented in Figure 4.
Net photosynthesis and stomatal conductance values decreased throughout the light period (Figure 4A,B). The net photosynthesis and stomatal conductance of ROT lettuce were significantly lower than those of CT lettuce during the first two hours of the light period. The values for net photosynthesis were 8.6 ± 1.6 and 11.7 ± 0.9 µmol CO2 m−2 s−1, and for stomatal conductance, they were 0.15 ± 0.04 and 0.22 ± 0.04 mmol H2O m−2 s−1 for ROT and CT lettuce, respectively. The net photosynthesis and stomatal conductance of ROT lettuce were also significantly lower than those of CT lettuce at the end of the light period, after 10 to 14 h of light. Only the net photosynthesis of ROT lettuce was significantly lower than that of CT lettuce after 14 to 16 h of light, as no difference in stomatal conductance was observed. Intercellular CO2 content and transpiration rate values were consistent with those of net photosynthesis and stomatal conductance, respectively, and can be found in Figure S1. The mean efficiency of the photosystem II (ΦPSII) of ROT lettuce during the first 6 h of light was 10% lower than that of the control.

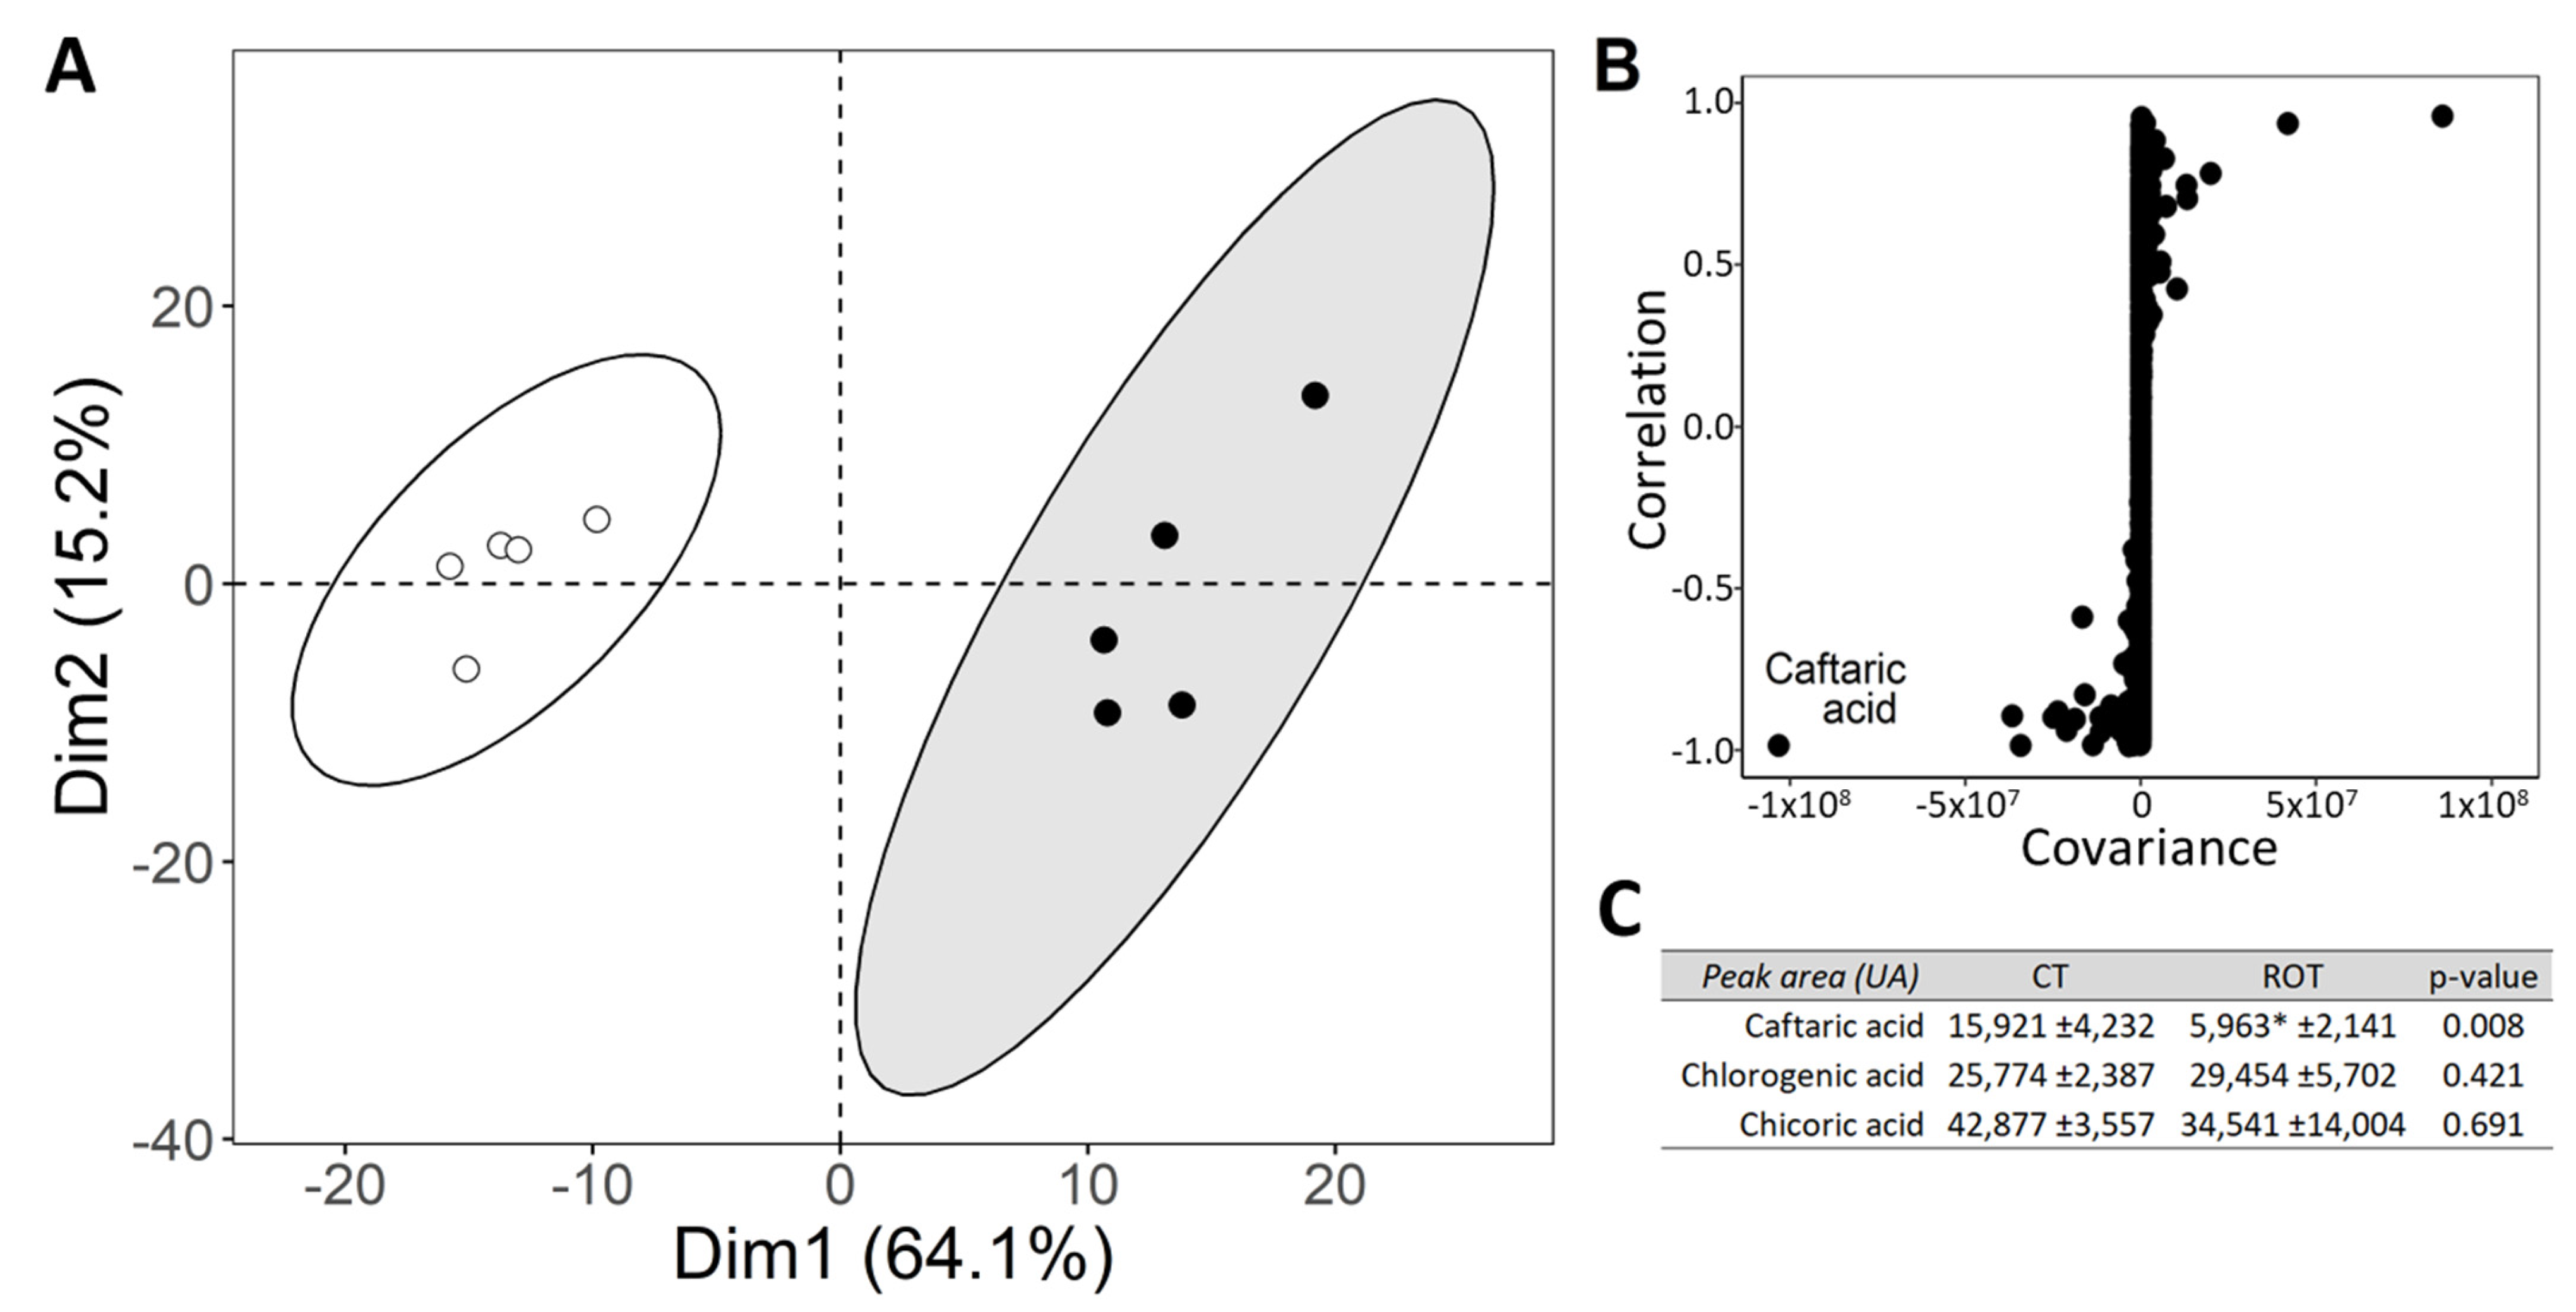
3.4. Untargeted Liquid Chromatography Profiling and Main Polyphenols Content at Harvest

The PCA analysis, the S-plot derived from the supervised OPLS-DA model, and the peak areas of caftaric acid, chlorogenic acid, and chicoric acid are presented in Figure 5.
In the biplot representation of the PCA (Figure 5A), we observe that samples from ROT lettuce are well separated from those of CT lettuce, as the ellipses representing the groups do not overlap. The first dimension on the x-axis accounts for 64.1% of the total variation across the samples, while the second dimension on the y-axis accounts for 15.2% of the total variation across the samples.
The S-plot from the supervised OPLS-DA model shows a strong involvement of caftaric acid in the differentiation of samples from ROT and CT lettuce (Figure 5B). The caftaric acid peak area was approximately three times lower in samples from ROT lettuce compared to those from CT lettuce (Figure 5C). No significant differences in chlorogenic and chicoric acid peak areas were observed between the two modalities.

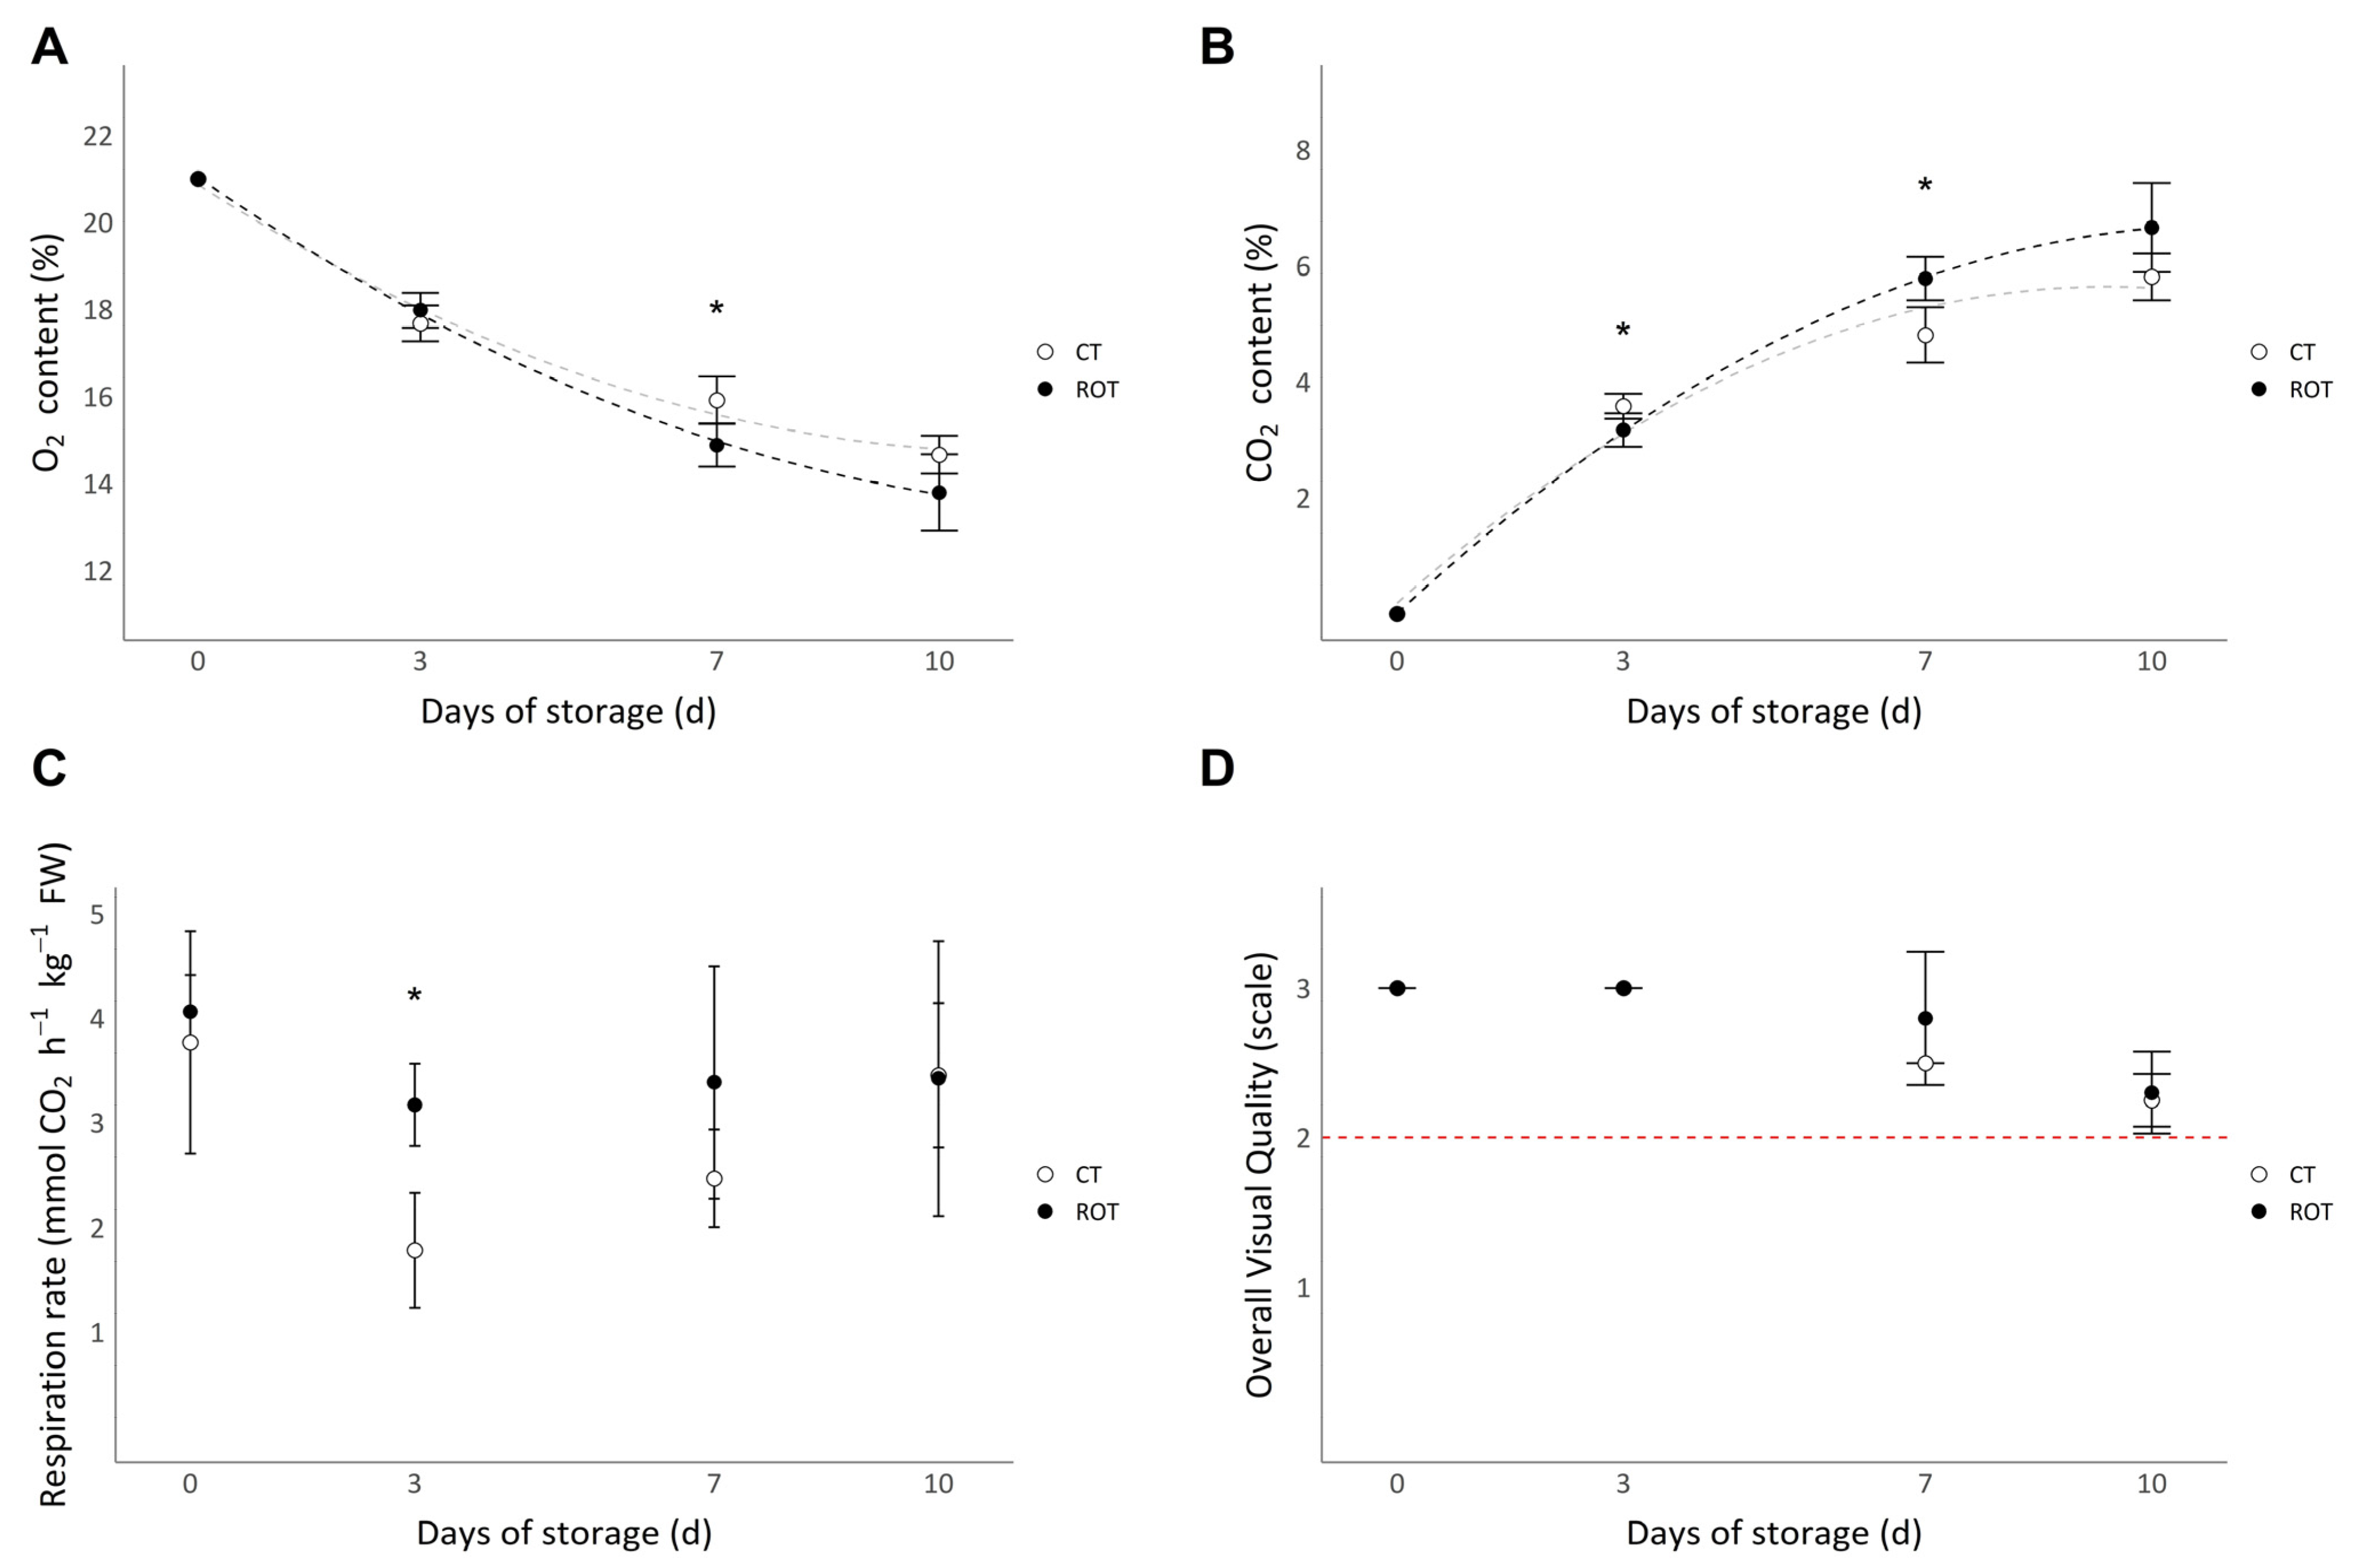
3.5. Postharvest Analyses

CO2 and O2 packaging content, respiration rates, and the overall visual quality (OVQ) of ROT and CT lettuce from harvest until after 10 days of storage are presented in Figure 6.
The O2 content inside the packaging of both ROT and CT lettuce decreased throughout the storage period (Figure 6A). Inversely, the CO2 content inside the packaging of the two modalities increased throughout the storage period (Figure 6B).
Respiration rates of the two modalities decreased from harvest to the third day of storage and then slightly increased until the tenth day of storage (Figure 6C). The respiration rate of ROT lettuce was significantly higher than that of CT lettuce after 3 days of storage, but no significant differences were observed after 7 and 10 days of storage.
Overall visual quality (OVQ) was assessed using a predefined scale, with lettuce graded as non-marketable under a grade of 2 (Figure 6D). No significant differences between ROT and CT lettuce were observed at harvest or throughout the storage period. After 10 days of storage, the grades of ROT and CT lettuce were both above the marketability threshold.

4. Discussion

4.1. The Yields in Control or the Rotational Cultivation Systems Were Similar

In this work, we compared the fresh and dry weights and yields of lettuce grown into two cultivation systems. The first was a control horizontal cultivation system, while the second was a rotational cultivation system, used for indoor production at an industrial scale. Fresh yields obtained in both cultivation systems were similar and equal to 9 and 8.3 kg m−2, for CT and ROT lettuce respectively. Those data are consistent with a previous meta-analysis reporting that vertical farming systems can yield up to 6.9 kg of lettuce m−2 [31]. Moreover, fresh and dry weights obtained at harvest (31 DAT) were consistent with weights of lettuce cultivated in horizontal systems previously described [32].
Similar values in fresh and dry yields are consistent with the fact that there were no significant differences in fresh and dry weights between the two cultivation systems at harvest (31 DAT). It can be specified that the mean coefficient of variation (CV) for the agronomic parameters of CT and ROT lettuce at 31 DAT were 11.8 ± 5.4% and 15.8 ± 3.2%, respectively, and were not statistically different (p-value = 0.56). This suggests that the rotational cultivation system did not increase variability in plant growth. However, the mean fresh and dry weights of ROT lettuce were always slightly lower than those of the control, even if significant differences were only found at 19 DAT and 14 DAT for fresh weight and dry weight, respectively. Moreover, the mean glucose, fructose, and total soluble sugar contents were lower in the lettuce grown in the rotational cultivation system compared to the control ones. Those trends and differences in weights and sugar contents can be explained by net photosynthesis, as the net photosynthesis of lettuce grown in the rotational cultivation system was significantly lower than that of the control in the first two hours of light and after ten hours of light until the end of the light period. Nevertheless, the differences in net photosynthesis were too small to induce significant differences in yields at harvest. It should be noted that, in this study, we were unable to analyze root growth, development, architecture, or physiology due to the use of potting soil. However, among gravity sensors, roots play a key role in a plant’s response to gravity [33,34,35]. Therefore, further studies are needed to better understand the effects of disrupted gravity perception on roots in the rotational cultivation system and its potential drawbacks on plant growth and development.

4.2. The Observed Decrease in Net Photosynthesis Can Be Attributed to the Perturbation of Plant Gravity Perception

To better describe the differences in net photosynthesis between lettuce grown in the rotational cultivation system and the control, we studied the stomatal conductance and the efficiency of the photosystem II. The decrease in photosynthetic activity was synchronous with that in stomatal conductance, a phenomenon which is consistent with the link between the net photosynthesis and the stomatal conductance previously described [36,37,38]. Furthermore, the efficiency of the photosystem II (ΦPSII) during the first 6 h of light was 10% lower in ROT lettuce compared to that of CT lettuce. Thus, the observed decrease in net photosynthesis is the consequence of the loss of stomatal conductance and photosystem II efficiency.
The rotational cultivation system rotates with a speed of 50 min per revolution, which induces a constant perturbation of plant gravity perception. In Arabidopsis thaliana, gravity perception occurs in the columella of the root cap, as well as in stem cells and leaf cells [33,34,35]. Perturbation of gravity perception has already been shown to decrease the net photosynthetic activity in Triticum aestivum (wheat) by 25% [39]. Moreover, it is likely to alter stomatal conductance [39,40], as a decrease in stomatal conductance has been observed under conditions of perturbed gravity perception, as described in a previous study by Kirkham (2008) [40]. The link between stomatal conductance and gravity perception needs further investigation, and we propose that they could interact through abscisic acid content, as this phytohormone is involved in both the plant’s response to gravity and stomatal conductance [41,42,43].
The activity of the photosystem II of Triticum aestivum has also been described to decrease by approximately 10% when the gravity perception of plants is perturbated [44,45]. The core of the photosystem II is composed of the D1 and D2 protein dimer [46], and it has been reported that the D1/D2 dimer is absent in Brassica rapa under perturbed graviperception, even though the levels of D1 and D2 proteins are almost similar [44]. The link between photosystem II efficiency and gravity perception requires further investigation, but it is likely related to the D1 and D2 proteins’ dimerization process. Interestingly, photosystem I efficiency has also been shown to be altered by perturbed graviperception [39,44,45]. Further research is needed to determine the relative contributions of the decreases in photosystem II and photosystem I efficiencies to the decline in net photosynthesis.
Based on this literature, it is reasonable to assume that stomatal conductance, photosystem II efficiency, and, in turn, net photosynthesis decreased because of the perturbation in plant gravity perception. The decrease in stomatal conductance likely explains the reduction in the net photosynthesis of ROT lettuce during the first two hours of the light period, while a combined effect of stomatal conductance and photosystem II efficiency could account for the decrease at the end of the lighting period. However, studies on gravity perception are generally focusing on microgravity conditions, due to the high interest in space missions, and that condition of gravity perception might differ from these induced by the rotational cultivation system. Thus, as changes in gravity perception induce drastic and holistic changes in plants [47,48], further research is needed to better define and describe the nature and consequences of the perturbation in gravity perception on plant physiology in the rotational cultivation system.

4.3. Energy and Land Surface Use Efficiencies Were Higher in the Rotational Cultivation System but Still Need to Be Maximized

In this experiment, we compared water, light, energy, and land surface use efficiencies (WUE, LUE, EUE, and LSUE, respectively) of lettuce grown in a rotational cultivation system (ROT) and a control, in a horizontal cultivation system (CT).
The WUE of ROT and CT lettuce was similar and 1.3 and 1.4 times higher than the higher range value presented for lettuce in vertical farming, respectively [27]. Moreover, the LUE of ROT and CT lettuce was similar. A meta-analysis on Light Use Efficiency of lettuce in vertical farms presented an average LUE based on fresh weight of 11.6 g mol−1 and an average LUE based on dry weight of 0.55 g mol−1 [49]. In this experiment, we found that LUE based on fresh weight was equal to 13.7 and 13.3 g mol−1 of photons, while that based on dry weight was equal to 0.48 and 0.43 g mol−1 of photons for CT and ROT lettuce, respectively. Thus, the obtained values are consistent with those in the literature.
The EUE based on fresh and dry weights of ROT lettuce was approximately six and five times higher, respectively, than that of the control. Two lamps were needed for the rotational cultivation system, while a ceiling lamp was necessary to provide homogenous lighting conditions for the control horizontal cultivation system. Indeed, as lamps are positioned in the center of the rotational cultivation systems, more plants can be illuminated with one lamp. This difference in lamp number might explain most of the differences. Indeed, in indoor vertical farming with standard horizontal cultivation systems, energy consumption is primarily driven by lighting, accounting for 60% to 80% [4,8,10,11]. In contrast, lighting represents only 37% of the total electricity consumption in the pilot farm of Futura Gaïa Technologies (Tarascon, France), which uses rotational cultivation systems (with ~37% attributed to cooling and ventilation and 25% to other uses) (internal data).
The EUE obtained for lettuce grown in the rotational cultivation system was consistent but within the lower range of that reported in recent studies on lettuce. Orsini et al. (2020) reported an EUE range in PFALs from 1 to 140 g of FW kWh−1, while Pennisi et al. (2019) reported values ranging from 60 to 100 g of FW kWh−1 [27,50]. The EUE obtained in the pilot farm of Futura Gaïa Technologies at a pre-industrial scale is close to that obtained in this experiment and is also on the lower end of the values reported in the literature, at 48 ± 5 g of FW kWh−1 (internal data). The energy consumption of lettuce grown in the rotational cultivation system was equal to 20 ± 3.0 kWh kg−1 of FW, which aligns with previously reported energy consumption estimates ranging from 6.2 to 12.0 kWh kg−1 of FW for lettuce produced in PFALs [51]. It must be noted that, for the control, all data related to energy efficiency are lower and all data related to energy consumption are higher (119 ± 6.3 kWh kg−1 of FW) than those reported in the literature.
The LSUE has been determined to range from 1300 to 3300 g of FW m−2 d−1 in plant factories with artificial lighting [27]. In this experiment, the land surface use efficiency in the control and rotation cultivation systems was lower than that cited in the literature, as the efficiency values were equal to 301 and 975 g of FW m−2 d−1, respectively. Low LSUE can be attributed to the single cultivation layer used in this experiment. In contrast, indoor vertical farming benefits from the ability to multiply cultivation layers. To date, up to three rotational cultivation systems can be stacked on top of each other at an industrial scale, leading to an increase in LSUE. Indeed, the LSUE obtained in the pilot farm of Futura Gaïa Technologies is equal to 1252 ± 128 g of FW m−2 d−1 (internal data), which is more consistent with the literature previously cited.
In this experiment, WUE and LUE were similar in both systems and consistent with values reported in the literature. This suggests that the resource use efficiency of lettuce in the rotational cultivation system is near optimal. However, the EUE and LSUE values obtained in this experiment and reported from the pilot farm of Futura Gaïa Technologies were on the lower end of those reported in the literature.
Based on data from the pilot farm of Futura Gaïa Technologies, we can assess the economic feasibility of rotational cultivation systems on an industrial scale. We chose a realistic case study of an infrastructure covering 2100 m2, containing 216 high-tech rotational cultivation systems within 900 m2, with the systems stacked in three layers. In the literature, lighting is identified as one of the main capital expenditures (CAPEX) categories, often accounting for more than 60%, while cultivation systems typically represent 25% of CAPEX [52,53]. As expected, due to the reduced number of lamps, lighting accounts for only 9% of CAPEX in a PFAL with 216 rotational cultivation systems. However, the high technology required for these systems results in cultivation systems representing approximately 60% of CAPEX. An absolute CAPEX cost in euros cannot be provided, as costs are highly variable and depend on numerous factors, which introduce biases and make direct comparisons difficult.
Regarding operating expenditures (OPEX), a recent review compiles data from 26 PFALs across 14 sources between 2011 and 2021. It details OPEX values for labor, electricity, seeds and nutrients, water, packaging, logistics, and other expenses, expressed in USD m−2 year−1 [54]. For lettuce, labor and electricity are identified as the primary OPEX components, with costs of USD 279 and USD 166 m−2 year−1, respectively. In a PFAL with 216 rotational cultivation systems, labor and electricity OPEX values are USD 76 and USD 83 m−2 year−1, respectively. The electricity OPEX could still be reduced by adopting more efficient LED lighting. The average total OPEX reported in the literature for PFALs is USD 700 m−2 year−1, whereas the total OPEX for the PFAL with rotational cultivation systems is USD 218 m−2 year−1.
These findings highlight the agronomic and economic feasibility of rotational cultivation systems compared to standard horizontal cultivation systems. Despite lower OPEX values, further improvements in energy use efficiency and land surface use efficiency are still necessary to enhance the competitiveness of rotational cultivation systems. This could be achieved through optimized space management, increased system stacking, improved lighting efficiency, the adoption of high-efficiency LED lamps, and advanced climate control strategies.

4.4. The Rotational Cultivation System Induced Changes in the Plant’s Quality Without Altering the Postharvest Storage Capacity

In the biplot PCA, we observed a clear separation of the samples coming from lettuce grown in the rotational cultivation system from the control. The conducted analysis focused on polyphenols, and the outputs are consistent with the literature, as it has been reviewed that the growing conditions have an impact on the polyphenol content [25]. Polyphenols play a key role in lettuce quality, as they are the most abundant phytochemicals in lettuce known to have antioxidant properties with potential health benefits. They are also involved in color, bitterness, astringent taste, flavor, and odor in plants [55,56,57]. Using rotational cultivation systems may induce changes in plants’ color and taste. To provide initial insights into changes in polyphenols, we studied chicoric, caftaric, and chlorogenic acids. Chicoric acid, which is biosynthesized from caftaric and chlorogenic acids, is of particular interest, as it can represent more than 55% of the total caffeic acid derivatives [58,59]. No significant differences in chicoric acid were found, but we measured a content of caftaric acid which was three times lower in ROT lettuce compared to the control. Further research is needed to better characterize the taste and quality of lettuce grown in the rotational cultivation system. Moreover, it is of interest to determine if the observed changes are directly linked with the perturbation in plant gravity perception.
A higher respiration rate in the lettuce grown under the rotational cultivation system compared to the control was observed at three days of storage. This was consistent with a slight decrease in O2 content and a slight increase in CO2 content in ROT lettuce packaging compared to the control. Those differences may be linked to changes in cell size, shape, or structure [44], but it could also be explained by an increase in the number or activity of mitochondria, as previously reported under conditions of perturbed gravity perception in Brassica rapa and Chlorella [44,60,61,62]. In fact, perturbations in plant gravity perception have been associated with changes in mitochondrial ultrastructure and organization [60,61,62]. In this experiment, plant respiration rate after three days of storage cannot be directly linked to storage capacity, as lettuce from both conditions remained above the marketability threshold after ten days of storage. However, we did not study mitochondria numbers, activity, or structure, and further research is needed to better characterize the link between mitochondria and gravity perception, as well as the potential impact of this link on plants’ postharvest storage capacity.

5. Conclusions

This study compares lettuce grown in a rotational cultivation system with that grown in a horizontal control system, evaluating yields, water use efficiency (WUE), light use efficiency (LUE), energy use efficiency (EUE), land surface use efficiency (LSUE), and postharvest storage capacity. No significant differences were found in yields, WUE, LUE, fresh or dry weights at harvest, or postharvest storage capacity between the two systems. These findings indicate that rotational cultivation is feasible in terms of agronomic parameters. However, a slight trend toward lower fresh and dry weights in the rotational system was observed during cultivation, correlating with a decrease in net photosynthesis during certain light hours. This phenomenon can be explained by reduced stomatal conductance and photosystem II efficiency. Thus, further research is needed to ensure that yields of production grown in the rotational cultivation system remain competitive.
The rotational system modified the polyphenol profile and decreased the caftaric acid content of lettuce compared to the control. More research is required to better understand the changes in plant secondary metabolism, as some of these changes could be relevant. This research should focus on different plant species with higher nutritional and health value than lettuce. Since PFALs can be used to grow complex plants, flowering species with challenging growth requirements could be of significant interest.
We show that indoor production using rotational cultivation systems is feasible in terms of yield, agronomic parameters, and economic data. However, improvements are needed to optimize energy use efficiency (EUE) and land surface use efficiency (LSUE). This could be achieved through optimized space management, increased system stacking, improved lighting efficiency, the adoption of high-efficiency LED lamps, and advanced climate control strategies. It should be noted that efficiencies and economic data at an industrial scale depend on the crop produced, the organization of PFAL components, and the targeted market, and should be considered with caution. Additional data are needed to better assess the limitations and opportunities associated with using a rotational cultivation system for plant production at an industrial scale in PFAL.

Supplementary Materials

The following supporting information can be downloaded at: www.mdpi.com/article/10.3390/agronomy15030744/s1, Supplemental Data: Photosynthetic parameters—Wilcoxon-Mann-Whitney test, Postharvest data—Wilcoxon-Mann-Whitney test. Figure S1: Additional photosynthetic parameters of lettuces grown in control and rotational cultivation systems (CT and ROT lettuces, respectively). (A) Intercellular CO2. (B) Transpiration. Data are expressed according to the 16 daily hours of lighting (h), where 0 represents the beginning of the lighting period and 16 represents the end. Each point represents the mean value of all measurements taken over the previous 2 h (for each point, 41 ≥ n ≥ 17). Standard deviations are presented as error bars. Significant differences were tested using the non-parametric pairwise Wilcoxon-Mann-Whitney test (α = 0.01). Significant differences are indicated by an asterisk.

Author Contributions

Conceptualization, C.D., V.T., H.S. and F.C.; methodology, C.D., V.V., S.S., O.C. and V.T.; software, C.D.; validation, C.D. and V.T.; formal analysis, C.D., V.T., H.S. and F.C.; investigation, C.D.; resources, O.C., S.S., V.V. and V.T.; data curation, C.D.; writing—original draft preparation, C.D.; writing—review and editing, C.D., V.T., H.S. and F.C.; visualization, C.D. and V.T.; supervision, V.T., H.S. and F.C.; project administration, C.D.; funding acquisition, V.T. and F.C. All authors have read and agreed to the published version of the manuscript.

Funding

This research was funded by the National Association for Research in Technology (ANRT, n°2020/0819).

Data Availability Statement

The data presented in this study are all available on demand, in Zenodo, https://doi.org/10.5281/zenodo.14845914.

Acknowledgments

This study was conducted with the financial support of the European Regional Development Fund, the French Government, the Sud Provence-Alpes-Côte d’Azur Region, the Departmental Council of Vaucluse, and the Urban Community of Avignon. We would like to thank Louis Ramade for his assistance during the experiments.

Conflicts of Interest

Authors Cédric Dresch and Vincent Truffault were employed by Futura Gaïa Technologies. Author Olivier Chevallier was employed by the company Agilent Technologies Inc. The remaining authors declare that the research was conducted in the absence of any commercial or financial relationships that could be construed as a potential conflict of interest.

Abbreviations

The following abbreviations are used in this manuscript:
LUELight use efficiency
WUEWater use efficiency
EUEEnergy use efficiency
LSUELand surface use efficiency

References

  1. Gu, D.; Andreev, K.; Dupre, M.E. Major Trends in Population Growth Around the World. China CDC Wkly. 2021, 3, 604–613. [Google Scholar] [CrossRef] [PubMed]
  2. Mempel, H.; Jüttner, I.; Wittmann, S. The Potentials of Indoor Farming for Plant Production. Automatisierungstechnik 2021, 69, 287–296. [Google Scholar] [CrossRef]
  3. Graamans, L.; Baeza, E.; van den Dobbelsteen, A.; Tsafaras, I.; Stanghellini, C. Plant Factories versus Greenhouses: Comparison of Resource Use Efficiency. Agric. Syst. 2018, 160, 31–43. [Google Scholar] [CrossRef]
  4. Kozai, T.; Niu, G. Chapter 4—Plant Factory as a Resource-Efficient Closed Plant Production System. In Plant Factory; Kozai, T., Niu, G., Takagaki, M., Eds.; Academic Press: San Diego, CA, USA, 2016; pp. 69–90. ISBN 978-0-12-801775-3. [Google Scholar]
  5. Righini, I.; Stanghellini, C.; Hemming, S.; Graamans, L.; Marcelis, L.F.M. Resources for Plant-Based Food: Estimating Resource Use to Meet the Requirements of Urban and Peri-Urban Diets. Food Energy Secur. 2023, 12, e462. [Google Scholar] [CrossRef]
  6. Barbosa, G.L.; Gadelha, F.D.A.; Kublik, N.; Proctor, A.; Reichelm, L.; Weissinger, E.; Wohlleb, G.M.; Halden, R.U. Comparison of Land, Water, and Energy Requirements of Lettuce Grown Using Hydroponic vs. Conventional Agricultural Methods. Int. J. Environ. Res. Public. Health 2015, 12, 6879–6891. [Google Scholar] [CrossRef]
  7. Tasgal, P. The Economics of Local Vertical & Greenhouse Farming Are Getting Competitive. Available online: https://agfundernews.com/the-economics-of-local-vertical-and-greenhouse-farming-are-getting-competitive (accessed on 13 January 2025).
  8. Avgoustaki, D.D.; Xydis, G. How Energy Innovation in Indoor Vertical Farming Can Improve Food Security, Sustainability, and Food Safety? In Advances in Food Security and Sustainability; Elsevier: Amsterdam, The Netherlands, 2020; Volume 5, pp. 1–51. ISBN 978-0-12-820711-6. [Google Scholar]
  9. Kozai, T. Resource Use Efficiency of Closed Plant Production System with Artificial Light: Concept, Estimation and Application to Plant Factory. Proc. Jpn. Acad. Ser. B Phys. Biol. Sci. 2013, 89, 447–461. [Google Scholar] [CrossRef]
  10. Avgoustaki, D.; Xydis, G. Plant Factories in the Water-Food-Energy Nexus Era: A Systematic Bibliographical Review. Food Secur. 2020, 12, 253–268. [Google Scholar] [CrossRef]
  11. Harbick, K.; Albright, L.D. Comparison of Energy Consumption: Greenhouses and Plant Factories. Acta Hortic. 2016, 1134, 285–292. [Google Scholar] [CrossRef]
  12. Kelly, N.; Choe, D.; Meng, Q.; Runkle, E.S. Promotion of Lettuce Growth under an Increasing Daily Light Integral Depends on the Combination of the Photosynthetic Photon Flux Density and Photoperiod. Sci. Hortic. 2020, 272, 109565. [Google Scholar] [CrossRef]
  13. Palmer, S.; van Iersel, M.W. Increasing Growth of Lettuce and Mizuna under Sole-Source LED Lighting Using Longer Photoperiods with the Same Daily Light Integral. Agronomy 2020, 10, 1659. [Google Scholar] [CrossRef]
  14. Pennisi, G.; Pistillo, A.; Orsini, F.; Cellini, A.; Spinelli, F.; Nicola, S.; Fernandez, J.A.; Crepaldi, A.; Gianquinto, G.; Marcelis, L.F.M. Optimal Light Intensity for Sustainable Water and Energy Use in Indoor Cultivation of Lettuce and Basil under Red and Blue LEDs. Sci. Hortic. 2020, 272, 109508. [Google Scholar] [CrossRef]
  15. Zhang, X.; He, D.; Niu, G.; Yan, Z.; Song, J. Effects of Environment Lighting on the Growth, Photosynthesis, and Quality of Hydroponic Lettuce in a Plant Factory. Int. J. Agric. Biol. Eng. 2018, 11, 33–40. [Google Scholar] [CrossRef]
  16. Lee, M.-J.; Son, K.-H.; Oh, M.-M. Increase in Biomass and Bioactive Compounds in Lettuce under Various Ratios of Red to Far-Red LED Light Supplemented with Blue LED Light. Hortic. Environ. Biotechnol. 2016, 57, 139–147. [Google Scholar] [CrossRef]
  17. Liu, J.; van Iersel, M.W. Far-Red Light Effects on Lettuce Growth and Morphology in Indoor Production Are Cultivar Specific. Plants 2022, 11, 2714. [Google Scholar] [CrossRef]
  18. Pennisi, G.; Orsini, F.; Landolfo, M.; Pistillo, A.; Crepaldi, A.; Nicola, S.; Fernández, J.A.; Marcelis, L.F.M.; Gianquinto, G. Optimal Photoperiod for Indoor Cultivation of Leafy Vegetables and Herbs. Eur. J. Hortic. Sci. 2020, 85, 329–338. [Google Scholar] [CrossRef]
  19. Pinho, P.; Jokinen, K.; Halonen, L. The Influence of the LED Light Spectrum on the Growth and Nutrient Uptake of Hydroponically Grown Lettuce. Light. Res. Technol. 2017, 49, 866–881. [Google Scholar] [CrossRef]
  20. Agati, G.; Franchetti, B.; Rispoli, F.; Venturini, P. Thermo-Fluid Dynamic Analysis of the Air Flow inside an Indoor Vertical Farming System. Appl. Therm. Eng. 2024, 236, 121553. [Google Scholar] [CrossRef]
  21. Despommier, D. The Vertical Farm: Controlled Environment Agriculture Carried out in Tall Buildings Would Create Greater Food Safety and Security for Large Urban Populations. J. Für Verbraucherschutz Und Leb. 2011, 6, 233–236. [Google Scholar] [CrossRef]
  22. Lee, J.G.; Choi, C.S.; Jang, Y.A.; Jang, S.W.; Lee, S.G.; Um, Y.C. Effects of Air Temperature and Air Flow Rate Control on the Tipburn Occurrence of Leaf Lettuce in a Closed-Type Plant Factory System. Hortic. Environ. Biotechnol. 2013, 54, 303–310. [Google Scholar] [CrossRef]
  23. Naranjani, B.; Najafianashrafi, Z.; Pascual, C.; Agulto, I.; Chuang, P.-Y.A. Computational Analysis of the Environment in an Indoor Vertical Farming System. Int. J. Heat Mass Transf. 2022, 186, 122460. [Google Scholar] [CrossRef]
  24. Paquet, G.; Nguyen, T.T.A.; Brégard, A.; Barrada, A.; Poirier, G.; Dorais, M. The Agronomic Potential of a New Vertical Growing Farming System Using Biofertilizers and Peat-Based Wood Fibre Growing Medium: Lettuce as a Case Study. Acta Hortic. 2022, 1355, 455–462. [Google Scholar] [CrossRef]
  25. Yang, X.; Gil, M.I.; Yang, Q.; Tomás-Barberán, F.A. Bioactive Compounds in Lettuce: Highlighting the Benefits to Human Health and Impacts of Preharvest and Postharvest Practices. Compr. Rev. Food Sci. Food Saf. 2022, 21, 4–45. [Google Scholar] [CrossRef] [PubMed]
  26. Schneider, C.A.; Rasband, W.S.; Eliceiri, K.W. NIH Image to ImageJ: 25 Years of Image Analysis. Nat. Methods 2012, 9, 671–675. [Google Scholar] [CrossRef] [PubMed]
  27. Orsini, F.; Pennisi, G.; Zulfiqar, F.; Gianquinto, G. Sustainable Use of Resources in Plant Factories with Artificial Lighting (PFALs). Eur. J. Hortic. Sci. 2020, 85, 297–309. [Google Scholar] [CrossRef]
  28. Rusch, A.; Suchail, S.; Valantin-Morison, M.; Sarthou, J.-P.; Roger-Estrade, J. Nutritional State of the Pollen Beetle Parasitoid Tersilochus Heterocerus Foraging in the Field. BioControl 2013, 58, 17. [Google Scholar] [CrossRef]
  29. Black, C.; Haughey, S.A.; Chevallier, O.P.; Galvin-King, P.; Elliott, C.T. A Comprehensive Strategy to Detect the Fraudulent Adulteration of Herbs: The Oregano Approach. Food Chem. 2016, 210, 551–557. [Google Scholar] [CrossRef]
  30. R Core Team. R: A Language and Environment for Statistical Computing. In Computing; R Core Team: Vienna, Austria, 2022. [Google Scholar]
  31. Gargaro, M.; Murphy, R.J.; Harris, Z.M. Let-Us Investigate; A Meta-Analysis of Influencing Factors on Lettuce Crop Yields within Controlled-Environment Agriculture Systems. Plants 2023, 12, 2623. [Google Scholar] [CrossRef]
  32. Matysiak, B.; Ropelewska, E.; Wrzodak, A.; Kowalski, A.; Kaniszewski, S. Yield and Quality of Romaine Lettuce at Different Daily Light Integral in an Indoor Controlled Environment. Agronomy 2022, 12, 1026. [Google Scholar] [CrossRef]
  33. Moore, R.; Evans, M.L. How Roots Perceive and Respond to Gravity. Am. J. Bot. 1986, 73, 574–587. [Google Scholar] [CrossRef]
  34. Masson, P.H.; Tasaka, M.; Morita, M.T.; Guan, C.; Chen, R.; Boonsirichai, K. Arabidopsis thaliana: A Model for the Study of Root and Shoot Gravitropism. Arab. Book 2002, 1, e0043. [Google Scholar] [CrossRef]
  35. Mano, E.; Horiguchi, G.; Tsukaya, H. Gravitropism in Leaves of Arabidopsis thaliana (L.) Heynh. Plant Cell Physiol. 2006, 47, 217–223. [Google Scholar] [CrossRef]
  36. Gago, J.; Daloso, D.D.M.; Figueroa, C.M.; Flexas, J.; Fernie, A.R.; Nikoloski, Z. Relationships of Leaf Net Photosynthesis, Stomatal Conductance, and Mesophyll Conductance to Primary Metabolism: A Multispecies Meta-Analysis Approach. Plant Physiol. 2016, 171, 265–279. [Google Scholar] [CrossRef] [PubMed]
  37. Gorton, H.L.; Williams, W.E.; Binns, M.E.; Gemmell, C.N.; Leheny, E.A.; Shepherd, A.C. Circadian Stomatal Rhythms in Epidermal Peels from Vicia Faba. Plant Physiol. 1989, 90, 1329–1334. [Google Scholar] [CrossRef] [PubMed]
  38. Hennessey, T.L.; Field, C.B. Oscillations in Carbon Assimilation and Stomatal Conductance under Constant Conditions. Plant Physiol. 1991, 96, 6. [Google Scholar] [CrossRef] [PubMed]
  39. Tripathy, B.C.; Brown, C.S.; Levine, H.G.; Krikorian, A.D. Growth and Photosynthetic Responses of Wheat Plants Grown in Space. Plant Physiol. 1996, 110, 801–806. [Google Scholar] [CrossRef]
  40. Kirkham, M.B. Horizontal Root Growth: Water Uptake and Stomatal Resistance under Microgravity. Vadose Zone J. 2008, 7, 1125–1131. [Google Scholar] [CrossRef]
  41. Chater, C.C.C.; Oliver, J.; Casson, S.; Gray, J.E. Putting the Brakes on: Abscisic Acid as a Central Environmental Regulator of Stomatal Development. New Phytol. 2014, 202, 376–391. [Google Scholar] [CrossRef]
  42. Han, W.; Rong, H.; Zhang, H.; Wang, M.-H. Abscisic Acid Is a Negative Regulator of Root Gravitropism in Arabidopsis thaliana. Biochem. Biophys. Res. Commun. 2009, 378, 695–700. [Google Scholar] [CrossRef]
  43. Walton, D.C. Biochemistry and Physiology of Abscisic Acid. Annu. Rev. Plant Physiol. 1980, 31, 453–489. [Google Scholar] [CrossRef]
  44. Jiao, S.; Hilaire, E.; Paulsen, A.Q.; Guikema, J.A. Brassica Rapa Plants Adapted to Microgravity with Reduced Photosystem I and Its Photochemical Activity. Physiol. Plant. 2004, 122, 281–290. [Google Scholar] [CrossRef]
  45. Stutte, G.W.; Monje, O.; Goins, G.D.; Tripathy, B.C. Microgravity Effects on Thylakoid, Single Leaf, and Whole Canopy Photosynthesis of Dwarf Wheat. Planta 2005, 223, 46–56. [Google Scholar] [CrossRef]
  46. Yamamoto, Y. Quality Control of Photosystem II. Plant Cell Physiol. 2001, 42, 121–128. [Google Scholar] [CrossRef] [PubMed]
  47. Halstead, T.W.; Dutcher, F.R. Plants in Space. Annu. Rev. Plant Physiol. 1987, 38, 317–345. [Google Scholar] [CrossRef] [PubMed]
  48. Stutte, G.W.; Monje, O.; Hatfield, R.D.; Paul, A.-L.; Ferl, R.J.; Simone, C.G. Microgravity Effects on Leaf Morphology, Cell Structure, Carbon Metabolism and mRNA Expression of Dwarf Wheat. Planta 2006, 224, 1038–1049. [Google Scholar] [PubMed]
  49. Jin, W.; Formiga Lopez, D.; Heuvelink, E.; Marcelis, L.F.M. Light Use Efficiency of Lettuce Cultivation in Vertical Farms Compared with Greenhouse and Field. Food Energy Secur. 2022, 12, e391. [Google Scholar] [CrossRef]
  50. Pennisi, G.; Orsini, F.; Blasioli, S.; Cellini, A.; Crepaldi, A.; Braschi, I.; Spinelli, F.; Nicola, S.; Fernandez, J.A.; Stanghellini, C.; et al. Resource Use Efficiency of Indoor Lettuce (Lactuca sativa L.) Cultivation as Affected by Red:Blue Ratio Provided by LED Lighting. Sci. Rep. 2019, 9, 14127. [Google Scholar] [CrossRef]
  51. Eaton, M.; Shelford, T.; Cole, M.; Mattson, N. Modeling Resource Consumption and Carbon Emissions Associated with Lettuce Production in Plant Factories. J. Clean. Prod. 2023, 384, 135569. [Google Scholar] [CrossRef]
  52. Avgoustaki, D.D.; Xydis, G. Indoor Vertical Farming in the Urban Nexus Context: Business Growth and Resource Savings. Sustainability 2020, 12, 1965. [Google Scholar] [CrossRef]
  53. Xu, D.; Ahmed, H.A.; Tong, Y.; Yang, Q.; van Willigenburg, L.G. Optimal Control as a Tool to Investigate the Profitability of a Chinese Plant Factory–Lettuce Production System. Biosyst. Eng. 2021, 208, 319–332. [Google Scholar] [CrossRef]
  54. Zhuang, Y.; Lu, N.; Shimamura, S.; Maruyama, A.; Kikuchi, M.; Takagaki, M. Economies of Scale in Constructing Plant Factories with Artificial Lighting and the Economic Viability of Crop Production. Front. Plant Sci. 2022, 13, 992194. [Google Scholar] [CrossRef]
  55. Kartika, H.; Li, Q.X.; Wall, M.M.; Nakamoto, S.T.; Iwaoka, W.T. Major Phenolic Acids and Total Antioxidant Activity in Mamaki Leaves, Pipturus Albidus. J. Food Sci. 2007, 72, S696–S701. [Google Scholar] [CrossRef] [PubMed]
  56. Khanam, U.K.S.; Oba, S.; Yanase, E.; Murakami, Y. Phenolic Acids, Flavonoids and Total Antioxidant Capacity of Selected Leafy Vegetables. J. Funct. Foods 2012, 4, 979–987. [Google Scholar] [CrossRef]
  57. Carotti, L.; Potente, G.; Pennisi, G.; Ruiz, K.B.; Biondi, S.; Crepaldi, A.; Orsini, F.; Gianquinto, G.; Antognoni, F. Pulsed LED Light: Exploring the Balance between Energy Use and Nutraceutical Properties in Indoor-Grown Lettuce. Agronomy 2021, 11, 1106. [Google Scholar] [CrossRef]
  58. Romani, A.; Pinelli, P.; Galardi, C.; Sani, G.; Cimato, A.; Heimler, D. Polyphenols in Greenhouse and Open-Air-Grown Lettuce. Food Chem. 2002, 79, 337. [Google Scholar]
  59. Yang, M.; Wu, C.; Zhang, T.; Shi, L.; Li, J.; Liang, H.; Lv, X.; Jing, F.; Qin, L.; Zhao, T.; et al. Chicoric Acid: Natural Occurrence, Chemical Synthesis, Biosynthesis, and Their Bioactive Effects. Front. Chem. 2022, 10, 888673. [Google Scholar] [CrossRef]
  60. Popova, A.F. Comparative Characteristic of Mitochondria Ultrastructural Organization in Chlorella Cells under Altered Gravity Conditions. Adv. Space Res. 2003, 31, 2253–2259. [Google Scholar] [CrossRef] [PubMed]
  61. Sytnik, K.M.; Popova, A.F.; Nechitailo, G.S.; Mashinsky, A.L. Peculiarities of the Submicroscopic Organization of Chlorella Cells Cultivated on a Solid Medium in Microgravity. Adv. Space Res. 1992, 12, 103–107. [Google Scholar] [CrossRef]
  62. Vasilenko, A.; Popova, A.F. Energetic Metabolism Response in Algae and Higher Plant Species from Simulation Experiments with the Clinostat. Adv. Space Res. Off. J. Comm. Space Res. COSPAR 1996, 17, 103–106. [Google Scholar] [CrossRef]
Figure 1. Representation of the control cultivation system (A) (CT lettuce) and the rotational cultivation system Gigrow® from Futura Gaïa Technologies (B) (ROT lettuce). In the rotational cultivation system, plants were grown in stainless steel trays containing potting soil similar to that of the control.
Agronomy 15 00744 g001
Figure 2. Yields and efficiencies of lettuce grown in control or rotational cultivation systems (CT and ROT lettuce, respectively). (A) Fresh and dry yield per square meter. (B) Water use efficiency (WUE). (C) Light use efficiency (LUE). (D) Energy use efficiency (EUE). (E) Land surface use efficiency (LSUE). Efficiencies were calculated according to Orsini et al., 2020 [27]. The mean values for CT and ROT lettuce are noted on top of each corresponding bar. Standard deviations are represented as error bars. Significant differences were tested using the non-parametric pairwise Wilcoxon–Mann–Whitney test (n = 5, α = 0.01). The p-values are shown above each bar in italics. Significant differences are indicated by an asterisk.
Agronomy 15 00744 g002
Figure 3. Weights and leaf area of lettuce grown in control and rotational cultivation systems (CT and ROT lettuce, respectively). (A) Fresh weight. (B) Dry weight. (C) Leaf area. Data are expressed according to the days after transplantation (DAT). Each point represents the mean value of five plants. Standard deviations are represented as error bars. Significant differences were tested using the non-parametric pairwise Wilcoxon–Mann–Whitney test (α = 0.01). Significant differences are indicated by an asterisk.
Agronomy 15 00744 g003
Figure 4. Photosynthetic parameters of lettuce grown in control and rotational cultivation systems (CT and ROT lettuce, respectively). (A) Net photosynthesis, i.e., net carbon assimilation. (B) Stomatal conductance. For (A,B), data are expressed according to the 16 daily hours of light (h), where 0 represents the beginning of the light period and 16 represents the end. Each point represents the mean value of all measurements taken over the previous 2 h (for each point, 41 ≥ n ≥ 17). Standard deviations are presented as error bars. Significant differences were tested using the non-parametric pairwise Wilcoxon–Mann–Whitney test (α = 0.01). Significant differences are indicated by an asterisk. (C) Efficiency of photosystem II (ΦPSII), measured during the first 6 h of light. The mean values for CT and ROT lettuce are noted on top of each corresponding bar. Standard deviations are represented as error bars. Significant difference was tested using the non-parametric pairwise Wilcoxon–Mann–Whitney test (n ≥ 50, α = 0.01). The p-value is shown, and significant differences are indicated by an asterisk.
Agronomy 15 00744 g004
Figure 5. Quality analyses of lettuce grown in control or rotational cultivation systems (CT and ROT lettuces, respectively). (A) Principal component analysis (PCA) of the metabolite profiles from untargeted UPLC-ESI-QTOF-MSE. (B) S-plot from the supervised OPLS-DA model, highlighting caftaric acid as a differentiating metabolite between CT and ROT lettuce. (C) Caftaric, chlorogenic, and chicoric acid contents. Significant differences were tested using the non-parametric Wilcoxon–Mann–Whitney test (n = 5, α = 0.01). The p-values are shown, and significant differences are indicated by an asterisk.
Agronomy 15 00744 g005
Figure 6. Postharvest parameters of lettuce grown in control and rotational cultivation systems (CT and ROT lettuce, respectively). (A) O2 content. (B) CO2 content. For (A,B), the dashed lines represent the fitting of a second-degree polynomial regression. (C) Respiration rates. (D) Overall visual quality, with the limit of marketability represented by a dashed red line. Data are represented according to the days of storage. Each point represents the mean value of 10 plants for (A,B) and five plants for (C,D). Standard deviations are represented as error bars. Significant differences were tested using the non-parametric pairwise Wilcoxon–Mann–Whitney test (α = 0.01). Significant differences are indicated by an asterisk.
Agronomy 15 00744 g006
Table 1. Glucose, fructose, sucrose, and total soluble sugar (TSS) contents of lettuce grown in control and rotational cultivation systems (CT and ROT lettuce, respectively), measured at 18 and 31 days after transplantation (DAT). Data are presented as the mean ± standard deviation (sd). Significant differences were tested using the non-parametric pairwise Wilcoxon–Mann–Whitney test (n = 5 at 18 DAT, n = 4 at 31 DAT, α = 0.01). The p-values are shown, and significant differences are indicated by an asterisk.
Glucose (mg g−1 of DW)Fructose (mg g−1 of DW)Sucrose (mg g−1 of DW)Total Soluble Sugars (mg g−1 of DW)
CT ROT CT ROT CT ROT CT ROT
DATMeansdMeansdp-ValueMeansdMeansdp-ValueMeansdMeansdp-ValueMeansdMeansdp-Value
18108±19.881 *±6.40.0079161±23.2101 *±10.20.0079114±21.399±10.10.1508383±23.2281 *±15.70.0079
31129±14.895±19.20.0635130±16.5101±19.70.111113±219±8.50.2857273±33.2214±32.80.0635
Disclaimer/Publisher’s Note: The statements, opinions and data contained in all publications are solely those of the individual author(s) and contributor(s) and not of MDPI and/or the editor(s). MDPI and/or the editor(s) disclaim responsibility for any injury to people or property resulting from any ideas, methods, instructions or products referred to in the content.

