Article

Temporal–Spatial Patterns of the Water Deficit in the Main Maize-Cropping Regions of China

College of Resources and Environmental Sciences, China Agricultural University, No. 2 Yuanmingyuan West Rd., Haidian District, Beijing 100193, China
*
Author to whom correspondence should be addressed.
Agronomy 2025, 15(3), 728; https://doi.org/10.3390/agronomy15030728
Submission received: 3 December 2024 / Revised: 11 March 2025 / Accepted: 12 March 2025 / Published: 18 March 2025
(This article belongs to the Section Water Use and Irrigation)

Abstract

:
Understanding the imbalance between precipitation and crop-water requirements (water deficits) is vital for adaptive water management and ensuring food security. This study examines the water deficits in China’s three main maize-cropping regions—the Northern Spring Maize Region (NS), the Huanghuaihai Summer Maize Region (HS), and the Southwest Mountain Maize Region (SWM). Using meteorological and crop data from 1981 to 2017, effective precipitation, water requirements, and water deficit rates are calculated. The results show that the average water deficit rate across all regions was 33%, with only 15.4% of precipitation meeting maize-water needs. NS had the highest deficits, especially during the jointing–tasseling stage (average: 54%), while HS had the lowest deficits, with sufficient precipitation at 54% of stations. In drought years, water deficits were significant across all regions, with NS experiencing the most severe challenges (average: 63%). Trends indicate declining effective precipitation in NS and SWM, while water requirements in NS have increased. These findings reveal critical regional disparities in the maize-water supply–demand balance and emphasize the need for targeted water management strategies to enhance the resilience of maize production to climate change.

1. Introduction

Since the beginning of the 21st century, the frequency, intensity, scope, and duration of extreme meteorological events have increased significantly [1,2]. In particular, changing precipitation patterns lead to more frequent and intensified extreme events, and the risk of water-related meteorological disasters increases significantly. In China, 577 disasters occurred between 2000 and 2019, ranking first in the world. As the world’s most populous country, China’s agricultural production is crucial to global food security, while agriculture is the most sensitive to meteorological disasters. Extreme heavy precipitation and drought events in China showed an increasing trend from 1961 to 2021 (China Meteorological Administration, 2022).
In China, maize (Zea mays L.) is the largest staple crop, and it accounts for about 41.5% of the total grain production [3]. However, maize is mainly rainfed across the country, and precipitation is the main water source [4]. Precipitation is not evenly distributed throughout the whole season, and the yield decline caused by water stress depends not only on severity but also on the growth stage [5]. In addition, climate change leads to increased inter-annual fluctuations in precipitation, which seriously affects the balance between water requirements and the water supply and gradually becomes the main limit for the high and stable yield of maize in the main cropping regions in China [6,7,8,9,10]. Therefore, it is of great significance to determine the water deficit caused by precipitation and water requirements at different growth stages to improve water management strategies under climate change.
The water deficit, which refers to the imbalance between precipitation and crop-water requirement, during the growing season is often used as a reference for rainfed farmland water management [11,12,13,14,15] and cropping-system optimization [15,16,17,18,19,20]. Qu et al. [11] optimized the cropping system in Hunan Province to adapt to drought based on the water deficit rate. Wang et al. [12] optimized the crop coefficient in Sichuan Province using an ensured index of precipitation and crop-water requirements. Zuo et al. [13] optimized the planting structure by using the water deficit rate between water requirements and precipitation for the main crops at different growth stages. Hou et al. [8] and Gong et al. [9] used the principle of fuzzy mathematics to build climate suitability models for maize in Northeast China and analyzed the suitability of precipitation at different growth stages.
Effective precipitation is the fraction of the total precipitation that is available to the crop and does not run off [7]. Effective precipitation can better reflect the impact of precipitation on crop growth from the perspective of the internal mechanism of crop growth and development [10]. The imbalance between effective precipitation and crop-water requirements in a specified period can more scientifically and accurately describe the water deficit rate of local natural precipitation on crop-water requirements [21,22], which is more useful as a guide for agricultural water management [23]. However, effective precipitation has seldom been used. Regional assessments in the Northeast and North China Plain employed coupled crop-hydrology models to simulate soil–crop–water interactions, revealing that 40–60% of yield losses were attributable to jointing-stage droughts [24,25]. Meanwhile, machine learning approaches [26] have been adopted to predict drought risks under climate scenarios, achieving > 80% accuracy in the Huang-Huai-Hai region. These studies rely on employed standardized precipitation evapotranspiration index (SPEI) [27,28,29]. However, SPEI is designed to measure imbalances between the water supply and atmospheric demand using reference evapotranspiration (ETo), rather than crop-specific evapotranspiration (ETc). The index is typically calculated using daily meteorological data, but it is analyzed over multi-month scales (e.g., 3, 6, 9, or 12 months) to monitor drought conditions and support early warning systems. Compared to SPEI-based assessments, our Pe and ETc-driven water deficit index (K) offers a physiologically grounded framework for stage-specific irrigation planning, avoiding the confounding effects of non-agricultural water use and addressing a key gap in adaptive management.
To address these limitations, based on the meteorological and crop data of the three main maize-cropping regions in China (the Northern Spring Maize Region (NS), the Huanghuaihai Summer Maize Region (HS), and the Southwest Mountain Maize Region (SWM)), this study calculated the effective precipitation and water requirement during the growth period (i.e., sowing to jointing, jointing to tasseling, and tasseling to maturity), and it analyzed the temporal–spatial patterns of the water deficit rate. Focusing on China’s three main maize-cropping regions (NS, HS, and SWM) provides a strategic lens for addressing climate adaptation. These regions encapsulate key agroclimatic gradients—from arid temperate (NS) to humid subtropical (HS) and mountainous tropics (SWM)—that are globally representative of maize-growing zones under climate stress. The analysis could inform adaptation policies in analogous regions (e.g., Sub-Saharan Africa’s maize belts), where balancing water deficits and food security remains a pressing challenge [30].
This study hypothesized that regional disparities in maize-water deficits are primarily driven by climatic variability and differences in crop-water demand across growth stages. Our objectives were as follows: (1) to quantify the temporal-spatial patterns of effective precipitation and water requirements in China’s main maize-cropping regions; (2) to identify critical growth stages with the most severe water deficits. These findings aim to provide a reference for maize production to cope with climate change and optimize water management strategies.

2. Materials and Methods

2.1. Study Area

The study area is the potential planting area of the three main maize-cropping regions in China (Figure 1). According to previous studies [31], maize can be planted in an area where the air temperature is ≥10 °C and the accumulated temperature is >2100 °C·d. With the 5-day moving average method [32], the ≥10 °C accumulated temperature at meteorological stations from 1981 to 2017 was calculated. By using the inverse distance weighting (IDW) method in ArcGIS 10.0, we interpolated the accumulated temperature ≥ 10 °C under an 80% guarantee rate, and the area with ≥2100 °C d was regarded as the potential planting area.

2.2. Meteorological Data

Meteorological data from the China Meteorological Administration data sharing service network “http://www.cma.gov.cn/en/ (assessed on 1 December 2024)”, including 331 meteorological stations in the study regions with daily meteorological data from 1981 to 2017. Meteorological elements include the daily average temperature, daily maximum temperature, daily minimum temperature, average relative humidity, minimum relative humidity, wind speed, total daily precipitation, net radiation of the surface, soil heat flux, saturated vapor pressure, actual water vapor pressure, and sunshine hours.

2.3. Crop Data

The crop data from 1981 to 2017, including key maize growth stages (sowing, jointing, tasseling, and maturity) and yield measurements, were collected from 14 agricultural meteorological observation and experiment stations across the three regions (6 in NS, 5 in HS, and 3 in SWM), all of which are operated under the supervision of the China Meteorological Administration. All data were recorded in accordance with the “Agro-Meteorological Observation Rules”. Depending on the availability of data, the sowing dates and growth stages at the closest station were used in the meteorological data calculations.

2.4. Meteorological Factors

(1)
Reference crop evapotranspiration (ETo).
In this paper, the Penman–Monteith equation recommended by the Food and Agriculture Organization of the United Nations (FAO, Rome, Italy, 1998) was used to calculate the ETo of reference crops [33]. The calculation formula is as follows:
E T o = 0.408 Δ ( R n G ) + 900 γ × u 2 ( e s e a ) / ( T + 273 ) Δ + γ ( 1 + 0.34 u 2 )
where Rn is the net radiation of the surface (MJ∙m−2∙d−1), G is soil heat flux (MJ∙m−2∙d−1), es is saturated vapor pressure (kPa), ea is the actual water vapor pressure (kPa), T is the average daily temperature (°C), and Δ is the slope of the saturation water vapor pressure curve (kPa∙°C−1). γ is the psychrometric constant (kPa∙°C−1); u2 is the wind speed at 2 m altitude (m∙s−1). Rn, Δ, and γ can be calculated using formulas [33], while G can sometimes be ignored. T, u2, ea, and es are observed data of meteorological stations.
(2)
Crop-water requirement (ETc).
In this paper, the standard method for calculating crop-water requirements recommended by [33] is adopted. The formula is as follows:
E T c = K c × E T o
where ETc is the crop-water requirement under the condition of full water supply (mm·d−1), and Kc is the crop coefficient, obtained via interpolation. ETo is the reference crop evapotranspiration (mm·d−1). The crop coefficient (Kc) is calculated based on FAO recommendation, with 3 standard crop coefficients of early, middle, and later stages of maize growth: Kcini(Tab) = 0.3 (sowing to jointing), Kcmid(Tab) = 1.2 (jointing to tasseling), Kcend(Tab) = 0.6 (tasseling to maturity). In addition, the Kc in the middle and late growing period of maize was revised using meteorological data and field-measured data [33], and the revised formula was as follows:
K c m i d = K c m i d T a b + 0.04 u 2 2 0.004 R H min 45 h 3 0.3
K c e n d = K c e n d T a b + 0.04 u 2 2 0.004 R H min 45 h 3 0.3
where Kcmid(Tab) is the standard crop coefficient in the middle growth period; Kcend(Tab) is the standard crop coefficient of a late growth period. u2 is the daily average wind speed at 2 m in altitude during the growth stage (m·s−1). RHmin is the average value (%) of the lowest daily relative humidity during the growth stage. h is the average height (m) of the crop during this growing stage.
(3)
Effective precipitation (Pe).
The effective precipitation was calculated using the soil conservation method of the United States Department of Agriculture (USDA) [34,35]:
P e = P 4.17 0.2 P / 4.17   for   P < 8.3   mm / d
P e = 4.17 + 0.1 P   for   P 8.3   mm / d
where Pe is the daily effective precipitation in mm/d; P is the total daily precipitation in mm/d. The sum of daily effective precipitation in each growth stage of maize is the effective precipitation.
The USDA soil conservation method (Equations (5) and (6)) was selected for its simplicity and widespread application in rainfed agricultural systems [35]. Compared to the FAO dual crop coefficient method, this approach avoids overestimating soil evaporation in regions with frequent light rainfall.
(4)
Trends in the growing season (k).
Linear regression analysis was used to calculate the trends in the climatological sowing and harvest dates of effective precipitation (mm/10a). Statistical significance was determined through two-tailed t-tests after normality testing using the Kolmogorov–Smirnov (K-S) model [36].
k = d y ( t ) d t × 10
(5)
Water deficit rate (K)
To clarify the supply and requirement between the domestic water requirement and the water supply of crops in the growth stage, the ratio of the difference between the crop-water requirement and precipitation and the water requirement is defined as the water deficit rate, and the calculation formula is as follows [37]:
K = E T c P e E T c × 100 %
where K is the water deficit rate, ETc is the crop-water requirement (mm), and Pe is the effective precipitation in the growing season (mm). The values of K were estimated during the whole growing season and each growing period, including sowing to jointing, jointing to tasseling, and tasseling to maturity. When K < 0, it indicates that precipitation is sufficient to meet the water requirements of maize, with a surplus during the growth period. When K > 0, it means that precipitation is inadequate to meet the water requirements of maize, leading to the water deficit during the growth period.

3. Result

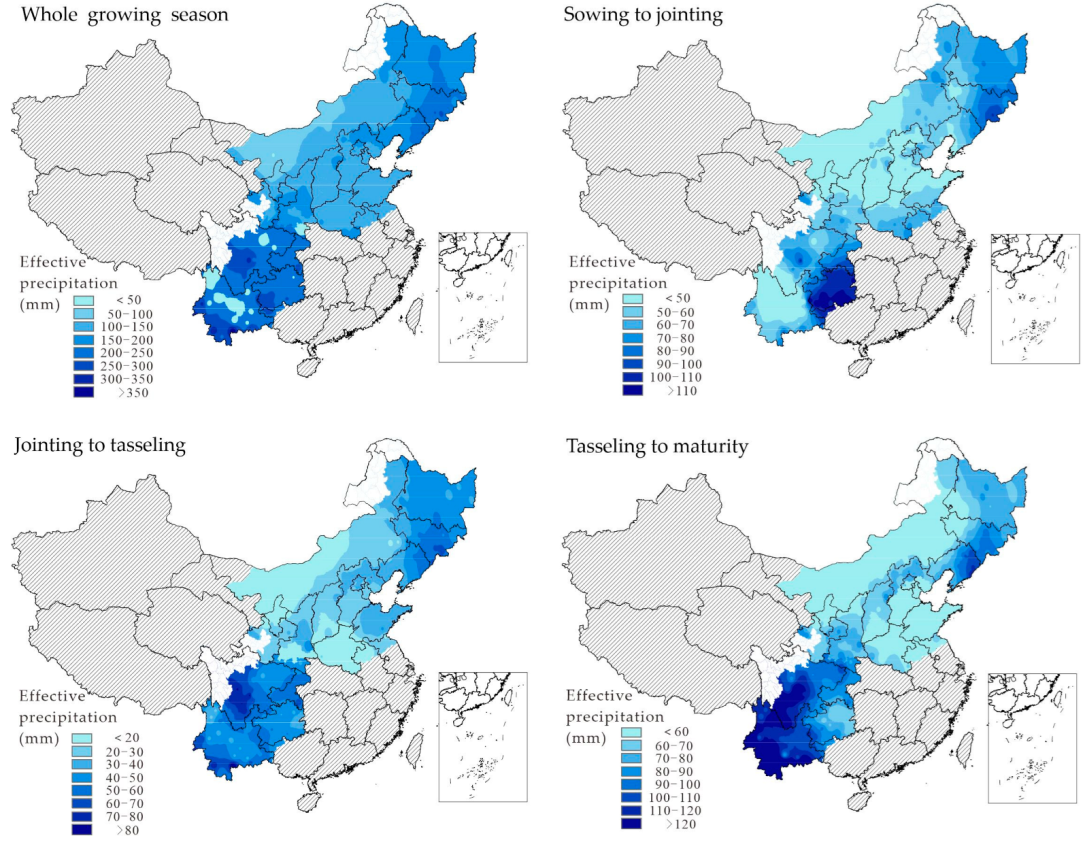
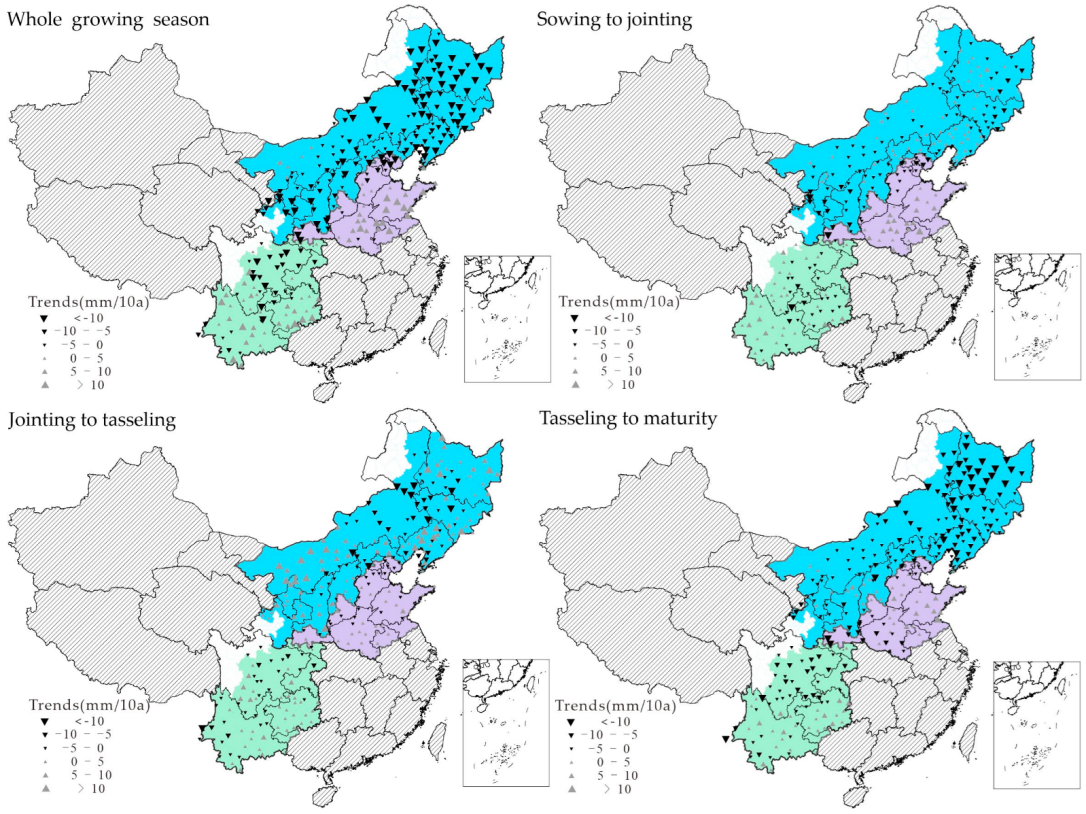
3.1. Temporal and Spatial Characteristics of Effective Precipitation

The temporal and spatial characteristics of effective precipitation in the three main maize-cropping regions from 1981 to 2017 are shown in Figure 2 and Figure 3.
The effective precipitation during the whole growing was 46–396 mm, with an average of 173 mm. In NS, the effective precipitation was between 46 and 260 mm, showing a spatial distribution characteristic that gradually increased from west to east. In HS, the effective precipitation was between 103 and 186 mm. The effective precipitation in SWM was between 167 and 396 mm, and the effective precipitation was higher than 200 mm except for 21.1% for the stations in Yunnan and Sichuan.
From sowing to jointing, the spatial characteristics of effective precipitation in NS were similar to those in the whole growth period, gradually increasing from west to east and ranging from 18 to 102 mm, with an average of 57 mm. The effective precipitation in HS increased gradually from north to south, ranging from 34 mm to 77 mm, with an average of 54 mm. In SWM, it increased from west to east, ranging from 28 mm to 123 mm, with an average of 71 mm. Most of Yunnan and southwest Sichuan are lower than 60 mm, and most of Guizhou is higher than 90 mm.
The spatial distribution of effective precipitation in NS shows a west-to-east increase, from 5 mm to 65 mm (average 33 mm) during jointing–tasseling, and it resembles the tasseling–maturity period with values ranging from 22 mm to 117 mm (average: 66 mm). In contrast, HS showed a decline in precipitation from north to south, with levels during the jointing phase between 11 mm and 41 mm (average: 23 mm) and between 29 mm and 84 mm (average: 49 mm) in the tasseling phase. SWM recorded higher effective precipitation, from 28 mm to 93 mm (average 53 mm) in the early phase and from 60 mm to 209 mm (average 106 mm) in the tasseling phase, with central Sichuan exceeding 80 mm in both phases.
The average climatic tendency rate for effective precipitation in China’s main maize-cropping regions showed a decline of −4.1 mm/10a during the entire growing period, with only 28.8% of stations experiencing an increase trend. NS underwent a significant decline of 8.1 mm/10a, while 60% of sites in the HS saw an average increase of 1.4 mm/10a. SWM exhibited a slight average decrease of −0.1 mm/10a, with 46.5% of sites in northern Sichuan reflecting a downward trend. Similar patterns persisted from sowing to jointing, with declines in both the NS and SWM. From jointing to tasseling, NS averaged a decrease of 2.2 mm/10a, while HS increases at 54% of stations, resulting in a minimal average rise of 0.2 mm/10a. From tasseling to maturity, all regions indicated declines, with NS at −5.1 mm/10a, HS at −0.4 mm/10a, and the SWM at −1.3 mm/10a.

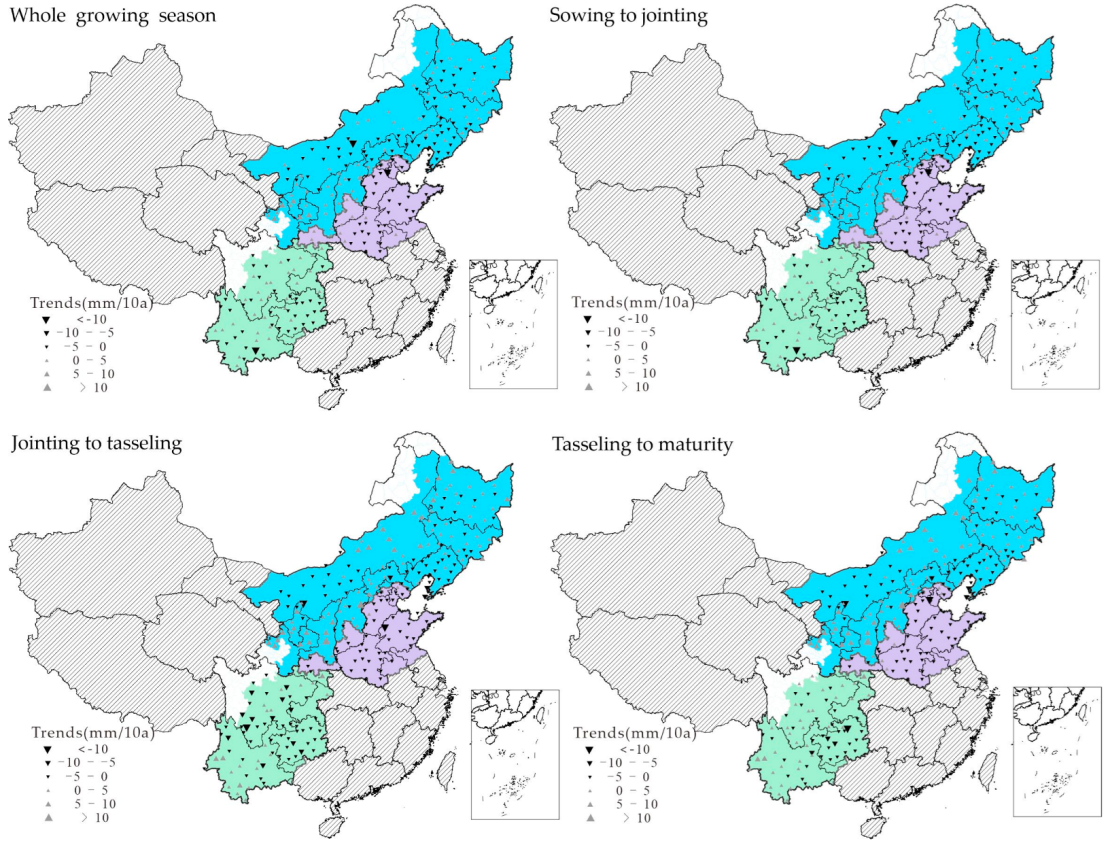
3.2. Temporal and Spatial Characteristics of Water Requirement
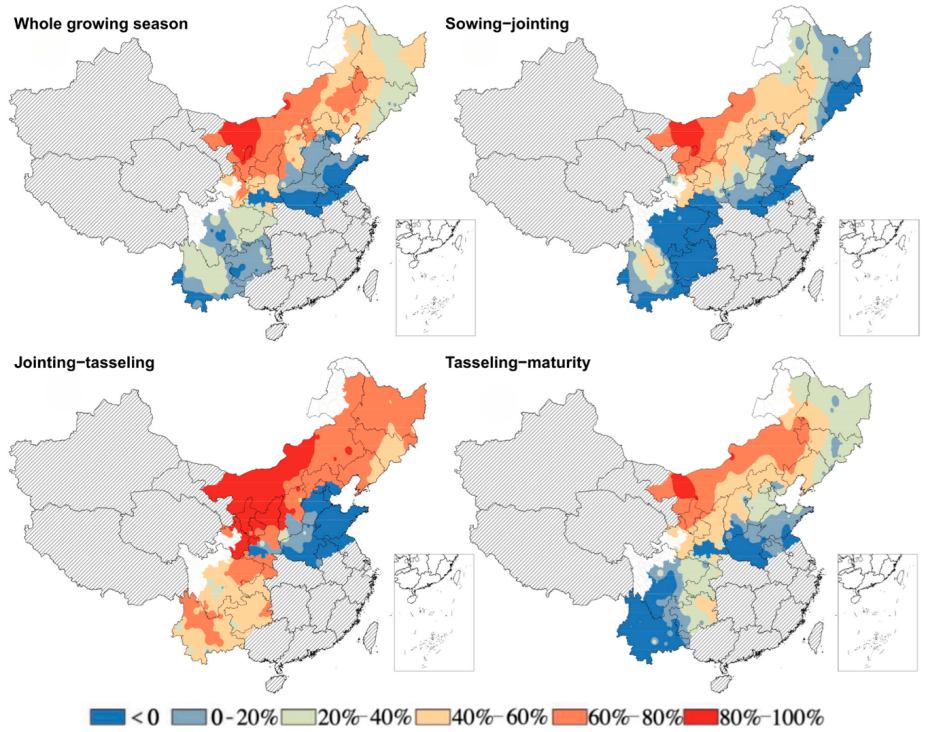
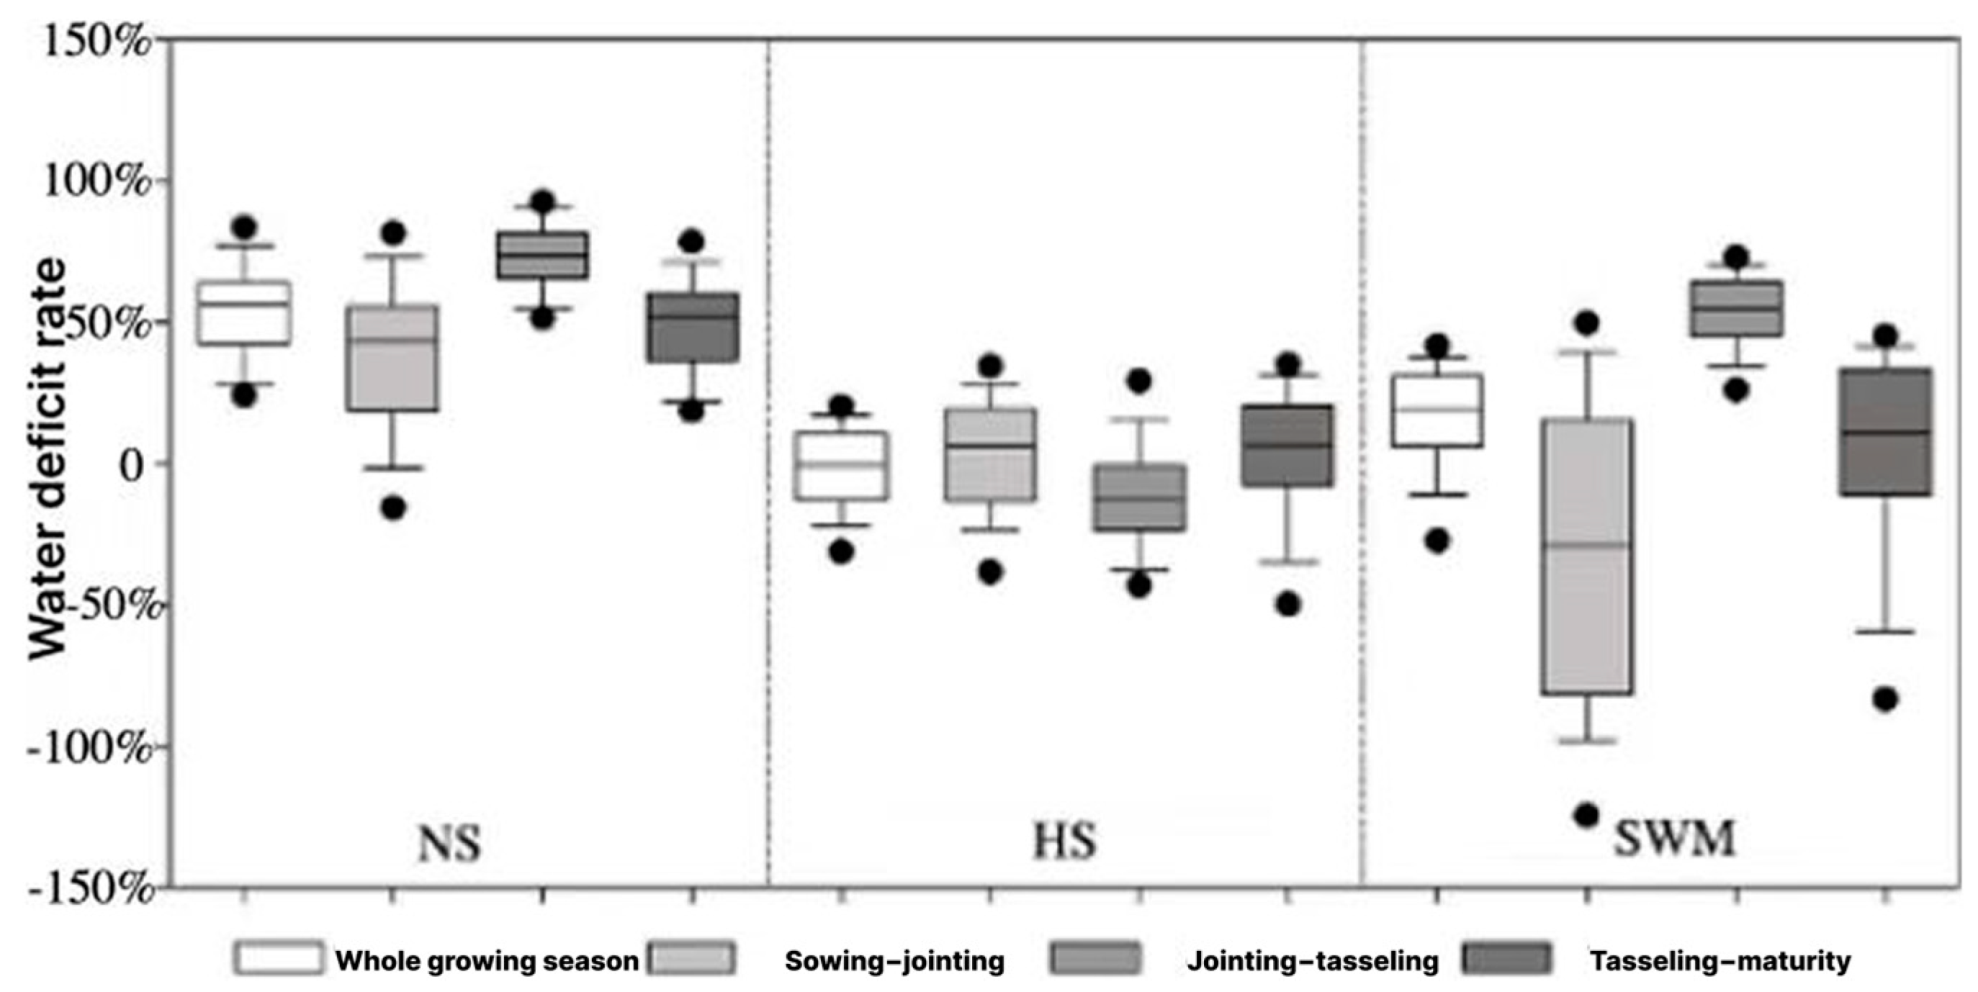
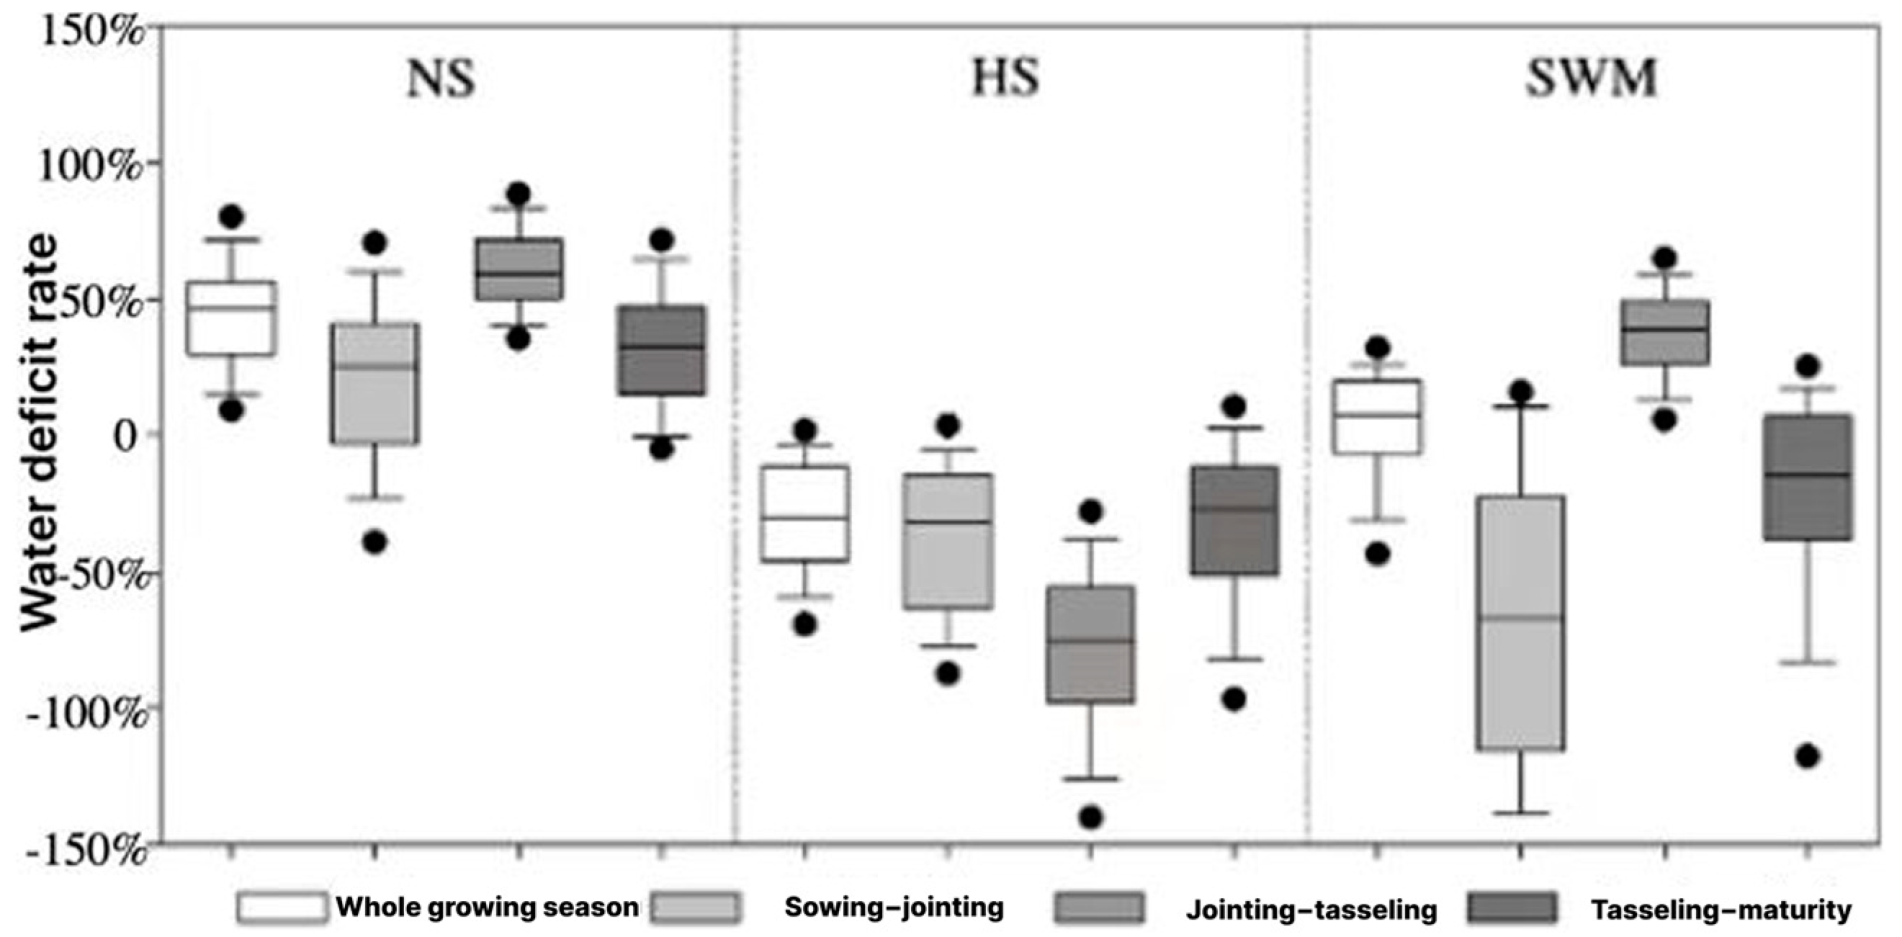
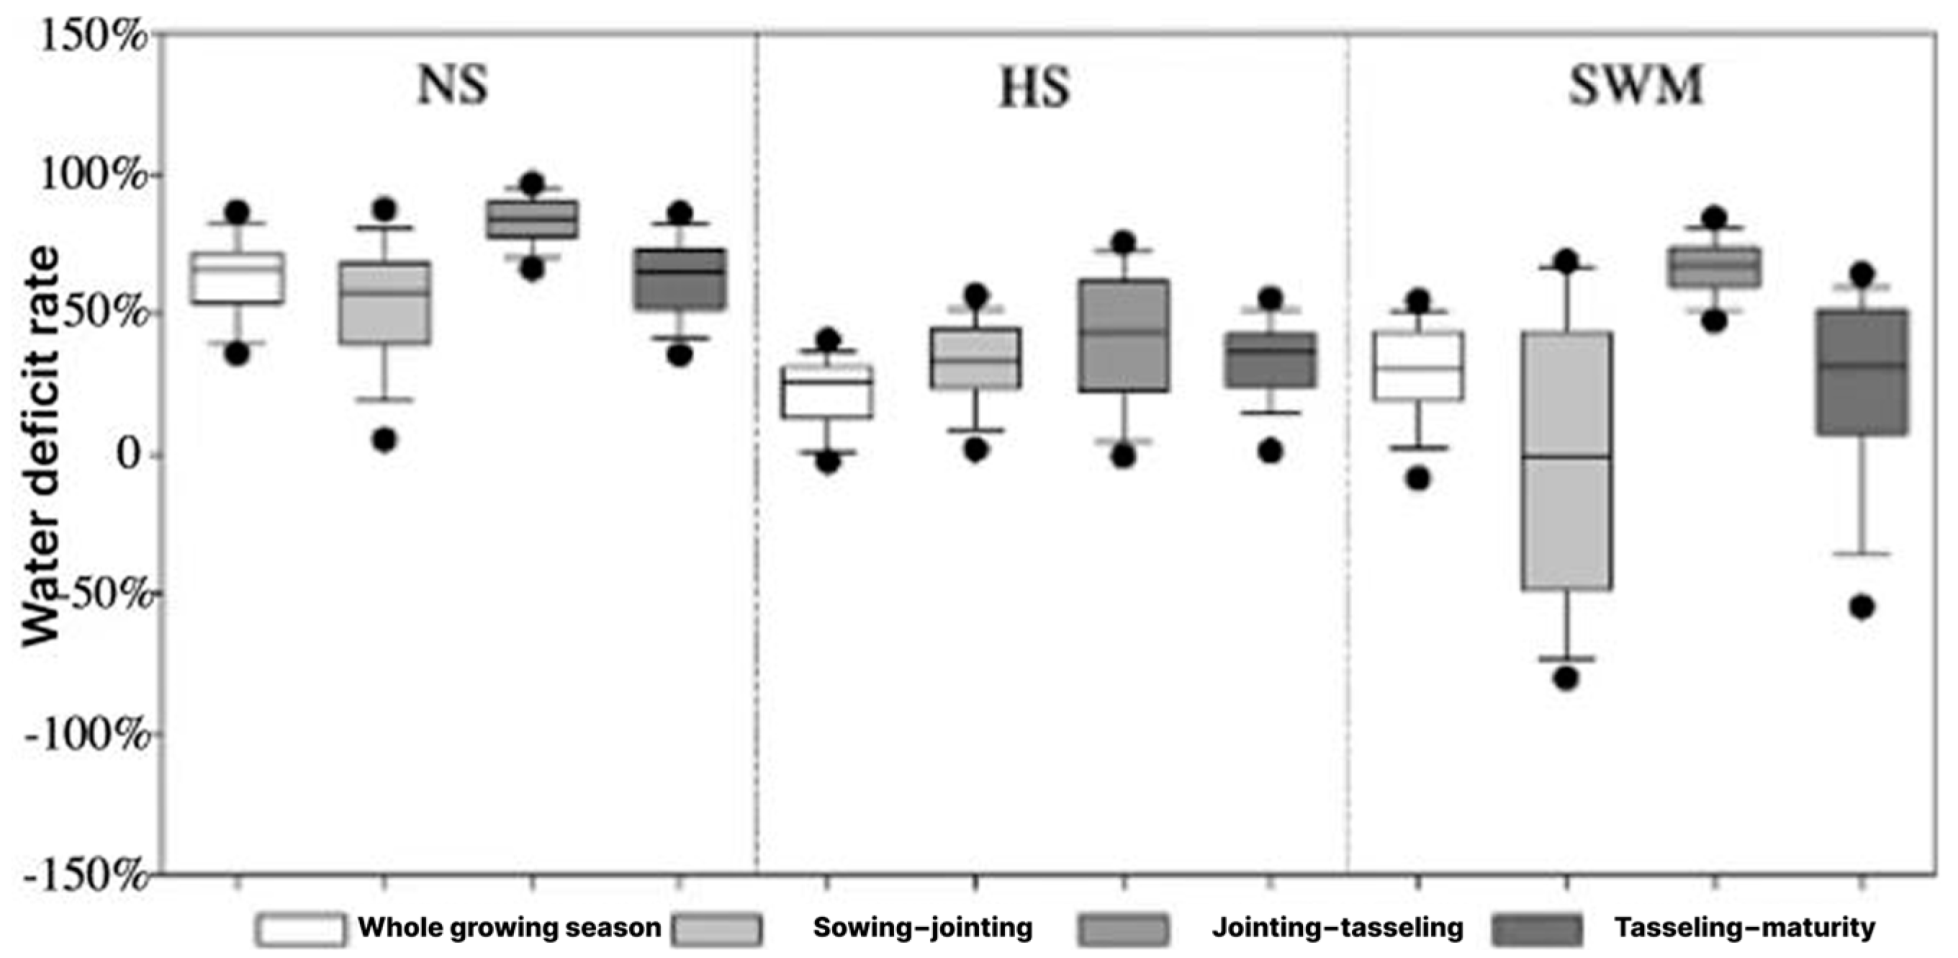
The temporal and spatial characteristics of the average water requirement in the three main maize-cropping regions from 1981 to 2017 are shown in Figure 4 and Figure 5.
The water requirement for maize ranged from 105 to 486 mm, averaging 292 mm, with NS requiring significantly more water (234–486 mm; average: 356 mm) than the other regions. Spatial distribution shows higher requirements in western Inner Mongolia, Ningxia, and Shaanxi, while the eastern northeastern provinces have lower requirements. HS requires less water (105–142 mm; average: 128 mm) compared to SWM (211–367 mm; average: 283 mm). From sowing to jointing, the average water requirement is 94 mm, decreasing from west to east, with the NS (56 mm for HS and 53 mm for the SWM). During jointing to tasseling, the average requirement is 104 mm, the highest in NS, while HS shows a significantly lower average of 21 mm. From tasseling to maturity, the average water requirement is 112 mm, with NS requiring 133 mm, significantly more than HS, indicating overall higher requirements in the north and western regions.
From 1981 to 2017, the trends in water requirement varied throughout the growing season, with an overall average tendency rate of 0.6 mm/10a, where 45.4% of stations exhibited an increase and 54.6% a decrease. In HS and SWM, water requirement decreased notably, with average rates of −2.5 mm/10a and 1.8 mm/10a, respectively, reflecting complex regional responses to climate conditions. From sowing to jointing, 55.8% of regions showed a decrease in water requirements, particularly in the HS at −0.7 mm/10a. During jointing–tasseling, 59.2% of stations continued to show declines, though eastern Inner Mongolia, Ningxia, northern Shaanxi, and western Yunnan showed increases, with the steepest decline in the SWM at −1.7 mm/10a. From tasseling to maturity, 51.2% of stations showed a decreasing water requirement, although the average tendency was 0.6 mm/10a. The NS showed a slight increase of 1.4 mm/10a, while the HS and SWM experienced reductions of −1.0 mm/10a and −0.1 mm/10a, respectively. These trends indicate that climate change has led to complex, region-specific variations in water requirements across different growth stages.

3.3. Water Deficit

Figure 6 and Figure 7 show that, from 1981 to 2017, the average water deficit rate across all stages was 33%, with only 15.4% of natural precipitation meeting maize-water needs. NS had the highest deficit during the growing period, averaging 54%, with western Inner Mongolia, Ningxia, and northern Shaanxi exceeding 60%. In HS, 54% of sites had adequate precipitation to meet maize requirements, mainly in southern Shaanxi, Henan, Shandong, Jiangsu, and northern Anhui. In SWM, 82.7% of sites had a deficit, averaging 16%. From sowing to jointing, the average deficit rate was 11%. During jointing to tasseling, the average deficit was 52%, with peak values in NS, while only 24% of HS experienced deficits, averaging −11%. From tasseling to maturity, the average deficit was 27%, which was particularly severe in NS (49%), decreasing from west to east. In HS and SWM, deficits averaged 3% and 2%, affecting 62–63% of sites in regions like Hebei, Shandong, Henan, Anhui, Sichuan, Chongqing, and Guizhou.
Figure 8 shows that, in years with abundant precipitation, the water deficit rate in NS ranged from −8% to 87% during the entire growing period, with an average of 44%. Water deficit rates averaged 61% from jointing to tasseling, 20% from sowing to jointing, and 31% from tasseling to maturity. In general, abundant precipitation could meet maize-water needs across all stages, with a near-zero average deficit in the SWM. There, the highest average deficit was 37% from jointing to tasseling, while deficits from sowing to jointing and from tasseling to maturity were less than 0, indicating sufficient natural precipitation for maize growth.
Under the poor-precipitation year type, the water deficit rate of the three main maize-cropping regions during the whole growing period was greater than 0, and the average water deficit rate of the NS, the summer maize sowing region in HS and SWM, during the whole growing period was 63%, 22%, and 28%, respectively (Figure 9). Among them, the water deficit rate was the highest during jointing to tasseling, and the average water deficit rate was 83%, 42%, and 66%, respectively. The average water deficit rate from sowing to jointing stage was the lowest in SWM (−5%), and the average water deficit rate from sowing to jointing stage in NS and HS was 52% and 32%, respectively. The water deficit rates at tasseling–maturity were 63%, 33%, and 23%, respectively.

4. Discussion

Previous studies, using natural precipitation directly to calculate the effect of precipitation on maize, showed an increasing trend in natural precipitation at most stations of spring maize and summer maize during 1988–2017. For natural precipitation, the average Sen trend at each station of spring maize and summer maize (Sen’s slope statistically quantifies the overall trend rate in the time series, and the median value of the series can be calculated; it is not affected by outliers, and it is more stringent than the linear slope of time series) was 0.46 and 0.57 mm/a [38]. The effective precipitation was calculated using the soil conservation method of the USDA [34,35]; the calculated results showed that the average trend of effective precipitation during the whole growing period of China’s main maize-cropping regions (Figure 3) was −4.1 mm/10a, indicating a downward trend, and it only showed an increasing trend at 28.8% stations. Compared with the above studies, the decline rate calculated using effective precipitation is lower.
Moreover, the water deficit index K advances drought management by translating climatic stressors into actionable irrigation strategies. While SPEI effectively captures regional meteorological anomalies [29], it cannot resolve short-term crop-water mismatches during critical growth stages. Our study distinguishes itself by directly calculating K, which quantifies the specific imbalance between Pe and crop-water requirements at each maize growth stage. This granularity enables a more stage-specific analysis, especially during key periods such as jointing to tasseling, when water deficits are most pronounced in regions like NS. In contrast, K identified that 72% of SWM sites faced severe jointing–tasseling deficits (K = 66%), directly correlating with 30–40% yield losses in field trials [24]. This result aligns with the findings of other studies but provides more precise estimates that can be used to develop targeted irrigation interventions: pilot projects in NS demonstrated that applying 50–70 mm of irrigation during jointing–tasseling (where K > 60%) reduced yield gaps by 25% [39]. Such precision is unattainable with SPEI’s multi-month aggregation, underscoring K’s utility for climate-resilient farming.
In this paper, the determination of water requirements is based on average meteorological conditions, and the difference in the water requirements of different varieties is not fully taken into account. For example, some maize varieties may be more drought-tolerant, while others require more water to maintain normal growth. Therefore, irrigation management based solely on a uniform water requirement model may result in water waste or poor crop growth in some regions. Management practices such as irrigation scheduling and mulching can modulate water deficits. For instance, regulated deficit irrigation (RDI) during non-critical stages (e.g., sowing–jointing) reduced water use by 20% in NS without a yield loss [40]. Conversely, plastic film mulching in SWM increased soil moisture retention by 15–30%, mitigating deficits during drought years [41]. These practices highlight the need for adaptive strategies tailored to regional water availability and crop phenology. Future research should focus on quantifying the impact of these factors on water deficits to improve the accuracy of water management strategies.
In addition, while this study quantified the climatic water deficit (CWD) based on effective precipitation and crop-water requirements, it is important to note that actual crop-water supply is modulated by soil water storage capacity. Root-zone soil moisture dynamics, influenced by soil type (e.g., sandy vs. clay soils), can buffer short-term precipitation variability [42]. For instance, clay soils with a higher field capacity may reduce CWD by 15–30% through water retention [34]. However, our model did not explicitly incorporate soil hydraulic properties due to data limitations. Future studies should integrate soil–crop–atmosphere continuum (SPAC) models (e.g., HYDRUS-1D) to improve deficit estimation accuracy.
Regional disparities in water deficits demand tailored policy responses. In NS, where jointing–tasseling deficits exceed 60% in 85% of stations during droughts, targeted subsidies for drip irrigation systems could reduce water use by 20–30% while stabilizing yields, as demonstrated in Inner Mongolia [39]. Conversely, HS—where 54% of stations exhibit water surpluses—should prioritize rainwater harvesting to buffer interannual variability, a strategy proven effective in Shandong Province [43]. For SWM, promoting drought-tolerant hybrids in Yunnan and terracing in Guizhou to retain runoff would address spatial heterogeneity [44,45]. Integrating these region-specific measures into national extension programs, as seen in India’s climate adaptation frameworks [46], could bridge the gap between scientific insights and farmer practices.
Finally, the multi-cropping system is an important feature in China’s agricultural production, aiming to improve the utilization rate of land and crop yield by arranging the sowing time and sowing combination reasonably. In this system, maize, as the main food crop, usually needs to be combined with other crops to achieve the optimal allocation of resources and the improvement of ecological benefits. Different crops have significant differences in water requirement, so in future studies, climate characteristics, soil conditions, and water availability in different regions must be comprehensively considered to optimize the water management of the entire crop planting system.
This study faced several limitations. Firstly, the water deficit rate was calculated using the average meteorological conditions and did not fully account for variations in crop-water requirements across different maize varieties, which may have differing drought tolerance levels. This could lead to uncertainties, especially in regions with diverse farming systems. Secondly, the estimation did not incorporate soils’ water retention capacity, which can significantly influence water availability. Soils with a higher field capacity, such as clay, can buffer short-term precipitation variability and reduce climatic water deficits, a factor not accounted for in our study. Additionally, while localized management practices like irrigation scheduling, mulching, and drought-tolerant hybrids were mentioned, their impact on water deficits was not explicitly modeled or quantified. Finally, the absence of post-2017 data limited the ability to capture the latest climatic trends and agricultural adaptations. These limitations highlight the need for future research that integrates soil properties, crop variety differences, and the latest climate data to improve water management strategies.

5. Conclusions

This study has analyzed the spatial and temporal patterns of water deficits in China’s main maize-cropping regions, highlighting significant regional disparities in effective precipitation, crop-water requirements, and water deficit trends. The findings confirm that NS faces the most severe water deficits, particularly during the jointing–tasseling stage, while HS experiences the least water stress, with more than half of the stations receiving sufficient precipitation. SWM exhibits moderate deficits, with variations influenced by local topography and rainfall distribution.
These results emphasize the need for targeted water management strategies. In NS, strategic irrigation during critical growth stages could significantly enhance water-use efficiency, while HS should focus on rainwater harvesting and storage infrastructure to buffer against precipitation variability. In SWM, adopting drought-resistant maize varieties and soil moisture conservation techniques could improve resilience.
Future research should integrate soil-crop-atmosphere models to better quantify the role of soil moisture storage in mitigating water deficits. Additionally, expanding phenological monitoring networks and incorporating high-resolution climate projections could enhance the precision of water management strategies. Strengthening data-driven approaches in precision agriculture will be essential for sustaining maize production under increasing climate variability.

Author Contributions

Conceptualization, J.Z.; data curation and formal analysis, J.Z. and Y.W.; funding acquisition and supervision, J.Z.; writing—original draft, Y.W. All authors have read and agreed to the published version of the manuscript.

Funding

This work was supported by the National Key Research and Development Program of China (2022YFD1500600), the National Natural Science Foundation of China (42205192 and 42475199), the 2115 Talent Development Program of China Agricultural University, and the Youth Innovation Team of China Meteorological Administration (CMA2023QN15).

Data Availability Statement

The data that support the findings of this study are available from the corresponding author upon reasonable request.

Conflicts of Interest

The authors have no relevant financial or non-financial interests to disclose.

References

  1. Michelozzi, P.; De’Donato, F. IPCC Sixth Assessment Report: Stopping climate change to save our planet. Epidemiol. Prev. 2021, 45, 227–229. [Google Scholar] [PubMed]
  2. Schaubroeck, T. IPCC: Expand into a panel on sustainability. Nature 2023, 616, 661. [Google Scholar] [CrossRef] [PubMed]
  3. Tong, P.Y. Achievements and prospects of corn production in China. Seed World 1989, 2, 5–7. [Google Scholar]
  4. Liu, B.; Chen, X.; Meng, Q.; Yang, H.; van Wart, J. Estimating maize yield potential and yield gap with agro-climatic zones in China—Distinguish irrigated and rainfed conditions. Agric. For. Meteorol. 2017, 239, 108–117. [Google Scholar] [CrossRef]
  5. Dong, C.Y.; Liu, Z.J.; Yang, X.G. Effects of different grade drought on grain yield of spring maize in Northern China. Trans. Chin. Soc. Agric. Eng. 2015, 31, 157–164. [Google Scholar]
  6. Meng, Q.; Chen, X.; Lobell, D.B.; Cui, Z.; Zhang, Y.; Yang, H.; Zhang, F. Growing sensitivity of maize to water scarcity under climate change. Sci. Rep. 2016, 6, 19605. [Google Scholar] [CrossRef]
  7. Department of International Cooperation. Ministry of Water Resources. American National Irrigation Engineering Manual; China Water Resources and Hydropower Press: Beijing, China, 1998; pp. 172–173. [Google Scholar]
  8. Hou, Y.Y.; Zhang, Y.H.; Wang, L.Y.; Lü, H.Q.; Song, Y.B. Climatic suitability model for spring maize in northeast China. Chin. J. Appl. Ecol. 2013, 24, 3207–3212. [Google Scholar]
  9. Gong, L.J.; Wang, C.; Wang, P.; Lv, S.; Wang, J.; Dai, S. Variation of climate suitability of maize in northeast of China. J. Maize Sci. 2013, 21, 140–146. [Google Scholar]
  10. Zhao, J.; Yang, X. Average Amount and Stability of Available Agro-Climate Resources in the Main Maize Cropping Regions in China during 1981–2010. J. Meteorol. Res. 2018, 32, 146–156. [Google Scholar] [CrossRef]
  11. Qu, H.H.; Yang, X.G.; Zhang, X.Y.; Huang, W.H.; Li, M.S.; Li, J.Y. Optimized cropping systems to prevent and avoid the drought disaster based on the adaptation between precipitation and crop water requirement in Hunan Province. Acta Ecol. Sin. 2010, 30, 4257–4265. [Google Scholar]
  12. Wang, M.T.; Qu, H.H.; Yang, X.G.; Zhang, X.Y.; Li, M.S. Optimized cropping systems based on ensure index of precipitation in Sichuan Province. J. Northwest A F Univ. (Nat. Sci. Ed.) 2012, 40, 82–92. [Google Scholar]
  13. Zuo, Y.B.; Tang, J.W.; Tian, C.Y.; Lv, S.Y.; Wei, B.; Yang, X.Q.; Gao, Q. Suitability of Water Requirement and Precipitation in Whole Growth Period for Main Crops and Adjustment of Crop Planting Structure in Dezhou. J. Water Resour. Archit. Eng. 2008, 6, 33–34, 42. [Google Scholar]
  14. Yan, P.; Ji, S.T.; Sun, Y.K.; Jiang, L.X.; Wang, Q.J.; Lv, J.J.; Wang, P. Change characteristics of farmland soil moisture in Fuyu County and their effects on development period and yield of Maize. J. Meteorol. Environ. 2020, 36, 74–82. [Google Scholar]
  15. Wei, Z.B.; Bian, D.H.; Du, X.; Raj, P.; Cui, Y.H. Characteristics of spatial-temporal distribution ofprecipitation, water requirement and drought forsummer maize growth period in Heilonggang Basin. Trans. Chin. Soc. Agric. Eng. 2020, 36, 124–133. [Google Scholar]
  16. Cui, R.X.; Fu, J.D. Spatial and Temporal Variation of Coupling between Rainfall and Crop Water Requirements of Cotton in Shandong. Cotton Sci. 2014, 26, 49–57. [Google Scholar]
  17. Zhang, Q.P.; Yang, X.G.; Xue, C.Y.; Yan, W.X.; Yang, J.; Zhang, T.Y.; Wang, H.Q.; Bauman, B.A.M. Analysis of coupling degree between crop water requirement of aerobic rice and rainfall in Beijing areas. Trans. Chin. Soc. Agric. Eng. 2007, 23, 51–56. [Google Scholar]
  18. Wang, W.J.; Feng, H. Water requirement and irrigation systems of winter wheat: CROPWAT-DSSAT model solution in Guanzhong District. Chin. J. Eco-Agric. 2012, 20, 795–802. [Google Scholar] [CrossRef]
  19. Zhang, H.; Wang, H.; Xu, C.G. Spatial and temporal characteristics of water requirement and water deficit of maize in Gansu Province from 1967 to 2017. Acta Ecol. Sin. 2020, 40, 1718–1730. [Google Scholar]
  20. Yao, D.L.; Gao, F.; Li, Z.J.; Hu, T.T. Water supply and requirement of winter wheat and summer maize in Yangling. Agric. Res. Arid. Areas 2018, 36, 115–120, 163. [Google Scholar]
  21. Liu, Y.; Wang, L.; Ni, G.; Cong, Z. Spatial distribution characteristics of irrigation water requirement for main crops in China. Trans. Chin. Soc. Agric. Eng. 2009, 25, 6–12. [Google Scholar]
  22. Hu, W.; Yan, C.R.; Li, Y.C.; Liu, Q. Impacts of climate change on winter wheat growing period and irrigation water requirements in the north China plain. Acta Ecol. Sin. 2014, 34, 2367–2377. [Google Scholar]
  23. Qu, H.H.; Wang, D.D.; Yan, M.H.; Zhai, M.; Liu, D.; Yan, P.; Wang, X.M.; Jiang, L.X. The evolution characteristics of coupling degree between maize water need and effective precipitation in Heilongjiang province. J. Meteorol. Environ. 2022, 38, 81–82. [Google Scholar]
  24. Liu, Y.; Chen, X.; Zhang, W.; Li, Z. Drought-tolerant maize hybrids reduce yield losses under water stress in Northeast China. Field Crops Res. 2019, 244, 107623. [Google Scholar]
  25. Zhang, Y.; Li, H.; Wang, J.; Liu, M. Modeling maize water deficits in the North China Plain using SWAT: Impacts of climate variability and irrigation. Agric. Syst. 2018, 166, 1–12. [Google Scholar]
  26. Li, X.; Zhang, X.; Wang, X.; Liu, Y.; Huang, M. Predicting maize drought risks in China using machine learning and multisource data. Environ. Res. Lett. 2020, 15, 074021. [Google Scholar]
  27. Vicente-Serrano, S.M.; Beguería, S.; López-Moreno, J.I. A Multiscalar Drought Index Sensitive to Global Warming: The Standardized Precipitation Evapotranspiration Index. J. Clim. 2010, 23, 1696–1718. [Google Scholar] [CrossRef]
  28. Lobell, D.B.; Hammer, G.L.; McLean, G.; Messina, C.; Roberts, M.J.; Schlenker, W. The critical role of extreme heat for maize production in the United States. Nat. Clim. Change 2013, 3, 497–501. [Google Scholar] [CrossRef]
  29. Chen, J.; Huang, M.; Liu, Y.; Tao, F. Increasing drought risks for maize in Southwest China under 1.5 °C and 2 °C global warming. Agric. For. Meteorol. 2021, 308–309, 108558. [Google Scholar]
  30. Cairns, J.E.; Hellin, J.; Sonder, K.; Araus, J.L.; MacRobert, J.F.; Thierfelder, C.; Prasanna, B.M. Adapting maize production to climate change in sub-Saharan Africa. Glob. Food Secur. 2013, 5, 345–360. [Google Scholar] [CrossRef]
  31. Liu, Z.J.; Yang, X.; Wang, W.; Zhao, J.; Zhang, H.; Chen, F. The possible effects of global warming on cropping systems in China: IV. The possible impact of future climatic warming on the northern limits of spring maize in three provinces of Northeast China. Sci. Agric. Sin. 2010, 43, 2280–2291. [Google Scholar]
  32. Qu, M. Agro-Climatic Internship Guide; Beijing Agricultural University Press: Beijing, China, 1990. [Google Scholar]
  33. Allen, R.; Pereira, L.; Raes, D.; Smith, M. Crop Evapotranspiration; FAO Irrigation and Drainage Paper 56; Food and Agriculture Organization of the United Nations: Rome, Italy, 1998. [Google Scholar]
  34. Döll, P.; Siebert, S. Global modeling of irrigation water requirements. Water Resour. Res. 2002, 38, 8-1–8-10. [Google Scholar] [CrossRef]
  35. Ye, Q.; Yang, X.; Dai, S.; Chen, G.; Li, Y.; Zhang, C. Effects of climate change on suitable rice cropping areas, cropping systems and crop water requirements in southern China. Agric. Water Manag. 2015, 159, 35–44. [Google Scholar] [CrossRef]
  36. Li, K.; Yang, X.; Liu, Z.; Zhang, T.; Lu, S.; Liu, Y. Low yield gap of winter wheat in the North China Plain. Eur. J. Agron. 2014, 59, 1–12. [Google Scholar] [CrossRef]
  37. Xue, Q.; Zhu, Z.; Musick, J.; Stewart, B.A.; Dusek, D.A. Root growth and water uptake in winter wheat under deficit irrigation. Plant Soil 2003, 257, 151–161. [Google Scholar] [CrossRef]
  38. Wang, T.X. Impacts of Climate Change on Spring and Summer Maize Yields of Main Planting Zone in China in Recent 30 Years. Master’s Thesis, Northwest A&F University, Shaanxi, China, 2021. [Google Scholar]
  39. Zhang, Y.; Li, H.; Wang, J.; Liu, M. Drip irrigation efficiency in arid Inner Mongolia: A case study of maize production under water scarcity. Agric. Water Manag. 2019, 213, 102–110. [Google Scholar]
  40. Chai, Q.; Zhang, J.; Wang, X.; Liu, Y. Deficit irrigation strategies for maize in arid regions: Water savings vs. yield trade–offs. Agric. Water Manag. 2021, 245, 106543. [Google Scholar]
  41. Li, R.; Wang, E.; Liu, Y. Plastic film mulching improves water use efficiency and spring maize yield in semiarid regions. Agric. Water Manag. 2019, 212, 364–372. [Google Scholar]
  42. Kumar, S.; Singh, R.D.; Mishra, S.K. Soil moisture dynamics and crop water stress assessment in rainfed maize systems using HYDRUS-1D model. Agric. Water Manag. 2020, 231, 106–185. [Google Scholar]
  43. Liu, J.; Wang, S.; Zhang, Q.; Chen, L. Rainwater harvesting for agricultural adaptation to drought in the North China Plain. J. Hydrol. 2017, 553, 231–243. [Google Scholar]
  44. Chen, X.; Li, Y.; Huang, J.; Zhang, W. Adoption barriers and opportunities for drought-tolerant maize hybrids in Southwest China. Field Crops Res. 2020, 256, 107927. [Google Scholar]
  45. Wang, L.; Zhang, G.; Shi, P.; Wei, X. Terracing effects on hydrological processes and soil erosion in Guizhou Province, China. Catena 2018, 170, 169–179. [Google Scholar]
  46. Singh, R.; Kumar, S.; Mishra, A. Integrating climate risk mapping into agricultural extension systems: Lessons from India. Clim. Risk Manag. 2016, 12, 1–12. [Google Scholar]
Figure 1. The locations of the three main maize-cropping regions in China and the distributions of the meteorological stations in each region.
Agronomy 15 00728 g001
Figure 2. Distributions of the effective precipitation during the whole growing season and different periods in the main maize-cropping regions in China during 1981–2017.
Agronomy 15 00728 g002
Figure 3. Trends of the effective precipitation during the whole growing season and different periods in the main maize-cropping regions in China during 1981–2017. Different colors indicated the three cropping regions.
Agronomy 15 00728 g003
Figure 4. Distributions of the water requirement during the whole growing season and different periods in the main maize-cropping regions in China during 1981–2017.
Agronomy 15 00728 g004
Figure 5. Trends of water requirements during the whole growing season and different periods in the main maize-cropping regions in China during 1981–2017. Different colors indicated the three cropping regions.
Agronomy 15 00728 g005
Figure 6. Spatial distributions of the average water deficit rate during the whole growing season and different periods in the main maize-cropping regions in China during 1981–2017.
Agronomy 15 00728 g006
Figure 7. The water deficit rate during the whole growing season and different periods in the main maize-cropping regions in China during 1981–2017.
Agronomy 15 00728 g007
Figure 8. The water deficit rate during the whole growing season and different periods in the main maize-cropping regions in China during the abundant-precipitation year.
Agronomy 15 00728 g008
Figure 9. The water deficit rate during the whole growing season and different periods in the main maize-cropping regions in China during the poor-precipitation year.
Agronomy 15 00728 g009
Disclaimer/Publisher’s Note: The statements, opinions and data contained in all publications are solely those of the individual author(s) and contributor(s) and not of MDPI and/or the editor(s). MDPI and/or the editor(s) disclaim responsibility for any injury to people or property resulting from any ideas, methods, instructions or products referred to in the content.

