Article

Sugarcane Responses to Water Deficit Are Modulated by Environmental CO2 Concentration in a Genotype and Scale Dependent-Manner

by
Zulma Catherine Cardenal-Rubio
1,†,
Elberth Hernando Pinzón-Sandoval
1,
Paulo Cássio Alves Linhares
1,
Antonia Almeida da Silva
1,
Claudia Rita de Souza
2,
Mewael Kiros Assefa
1,
João Paulo Rodrigues Alves Delfino Barbosa
1 and
Paulo Eduardo Ribeiro Marchiori
1,*
1
Department of Biology, Institute of Natural Sciences, Federal University of Lavras (UFLA), Lavras 37200-900, MG, Brazil
2
Agricultural Research Agency of the State of Minas Gerais (EPAMIG), Technological Center of Grape and Wine Research, Caldas 37780-000, MG, Brazil
*
Author to whom correspondence should be addressed.
This study was related to the Doctor’s Thesis of Zulma Catherine Cardenal-Rubio under the supervision of Paulo Eduardo Ribeiro Marchiori, presented at the Federal University of Lavras (UFLA), Brazil.
Agronomy 2025, 15(3), 726; https://doi.org/10.3390/agronomy15030726
Submission received: 14 February 2025 / Revised: 11 March 2025 / Accepted: 13 March 2025 / Published: 18 March 2025

Abstract

:
Events by changes in climate alter the growth and physiology of sugarcane. In this context, the study aimed to investigate the morphological, anatomical, and physiological responses of two different sugarcane varieties under a condition of high carbon dioxide (CO2) associated with water deficit, testing the hypothesis that sugarcane responses to drought are modulated by high (CO2) in different plant scales. Thirty days after sprouting, the plants were grown under two (CO2) in the atmosphere (400 and 680 μmol CO2 mol−1 of air) and under water restriction conditions. At the morphological level, we assessed total biomass, plant height, stem diameter, leaf area, and root-shoot ratio; at the physiological level, relative water content, water use efficiency, in vivo maximum rate of Rubisco, and PEPC carboxylation, photosynthesis, total organic carbon, and nitrogen, and carbon-nitrogen ratio. At the anatomical level, we assessed stomatal density at adaxial and abaxial surfaces and wall thickness bundle sheath cells. The results indicate that at all levels, the response of sugarcane plants exposed to high CO2 concentration and drought is genotype-dependent. In general, variety RB855536 showed greater physiological responses: a better water use efficiency and alteration in the carboxylation rate of Rubisco enzyme, while variety RB867515 showed a greater morphological response determined by changes in biomass allocation and anatomical alterations of stomatal densities and functionality. The sugarcane varieties exposed to water deficit and high CO2 concentration developed different strategies based on morphological, physiological, and/or anatomical changes that are useful for facing climate change scenarios, and the effects of drought can be mitigated by the high (CO2) in the air.

1. Introduction

Climate change and agriculture are strongly connected since variations in temperature, atmospheric carbon dioxide concentrations, and precipitation regime impact agroecosystems and, therefore, crop productivity [1]. Elevated temperatures cause a substantial decrease in sugarcane yield, with reductions of 3%, 5%, and 9% under temperature increases of 2 °C, 3 °C, and 4 °C, respectively. At the same time, the water requirement for sugarcane increased by 13% with a 4 °C temperature rise [2]. Studies, such as Da Cruz et al. [3], indicate that changes in precipitation patterns and the increased frequency of droughts affect water availability for sugarcane cultivation, exacerbating water stress and reducing productivity. Considering cereal production alone, approximately 1.8 billion tons have been lost due to drought over the past four decades [4]. In the last 50 years, temperature and (CO2) increased at a rate of 0.2 °C and 25 μmol·mol−1 per decade, respectively [5]. The Intergovernmental Panel on Climate Change [6], based on the Coupled Model Intercomparison Project (CMIP), estimates that the (CO2) concentration will reach 750 μmol·mol⁻¹ and global warming will range between 3 and 5 °C by the end of the century.
The increase in atmospheric (CO2), along with potential global warming and changes in precipitation patterns, undoubtedly has a significant economic and ecological impact on many agriculturally important species [7]. Among the environmental constraints caused by alterations in climatic patterns, water deficit has become a recurrent issue in agricultural production areas, where the occurrence of prolonged dry periods and irregular precipitation destabilize and compromise crop production cycles, particularly those of long-cycle crops such as sugarcane [8,9]. Besides the climate changes, the alterations in (CO2) affect plant growth and development, primarily due to changes in photosynthetic carbon assimilation and reduction in transpiration [10]. The elevated carbon dioxide (eCO2) affects photosynthesis, respiration, nutritional quality, and plant stress responses [11,12,13].
Although C4 plants represent a small portion of plant species in the world, maize (Zea mays L.), sorghum (Sorghum sp.), and sugarcane (Saccharum spp.) show substantial economic importance, as they are the main source of biomass production for food and renewable energy production [14,15]. Recent data indicates a steady increase in global sugarcane production and the area under cultivation. Between 2008 and 2020, global sugarcane production grew from approximately 1.71 billion tonnes to 1.87 billion tonnes, cultivated over 26 million hectares [16]. Looking ahead, projections suggest that global sugarcane production will reach 21.1 billion metric tons by 2026, marking a 0.9% annual increase since 2021. In this context, the world’s interest in sugarcane production has increased significantly in recent years due to its importance as a source of renewable energy [17,18,19]. Considering the response presented by these plants under climate change scenarios, contrary to what has been generally reported for C4 plants, sugarcane plants may respond to eCO2 [20], since this crop increased up to 26% in total soluble sugar content [21], showed high photosynthesis [22,23], improved the nitrogen use efficiency [24], increased yield [25] and showed better response to drought stress [26]. However, there is no available information about the scales (morphological, physiological, and anatomical) that induce the tolerance responses in sugarcane grown under combined eCO2 and water deficit conditions.
It is known there is a great variation in the morpho-physiological responses found in sugarcane; therefore, it is important to understand how sugarcane plants respond and/or acclimate to environmental variations and if these responses are associated with the genotype’s capacity to express phenotypic changes in response to different environmental conditions, i.e., the phenotypical plasticity [17,27,28,29,30]. In this context, we aimed to understand the morphological, anatomical, and physiological response of sugarcane varieties under eCO2 and drought conditions. We tested the hypothesis of the existence of a differential response at the morphological, anatomical, and physiological levels associated with the concept of phenotypic plasticity related to drought tolerance in sugarcane plants.

2. Materials and Methods

2.1. Plant Material and Experimental Conditions

The experiment was conducted in four 1.8 m height × 1.06 m diameter (1.30 m3) open-top chambers (OTCs) adapted from Drake et al. [31], kept inside a greenhouse. Two varieties of sugarcane, RB867515 and RB855536, were studied. RB855536 shows high agro-industrial productivity and is considered less tolerant to drought, whereas RB867515 is more rustic because it can be cultivated under low fertility and water restrictions conditions [32,33]; it is one of the most cultivated varieties in Brazil. Just after the harvest of mature plants, the stems, containing one bud, were sectioned in five-centimeter cuttings and planted in pots (5 dm3) filled with a mix of sandy soil. Nutritional correction was performed based on chemical analysis of the substrate (Table 1) according to Van Raij et al. [34]. At 20 days after sprouting (DAS), seedlings of both varieties were left for 10 days to acclimatize inside the OTCs. Each OTC had five plants of each variety cultivated in individual pots.
During the experimental period, the air temperature and relative humidity of the greenhouse and inside the OTCs were monitored every hour using an RHT10 thermohygrometer (Extech Instruments, Nashua, NH, USA). The mean temperature and the mean relative humidity inside the greenhouse during the experimental period were 25.1 ± 1.0 °C and 70.2 ± 1.3%. Inside the CO2 non-enriched OTCs, it was 26.4 ± 0.2 °C and 71.0 ± 0.5%, and inside the CO2 enriched OTCs, these parameters were 25.9 ± 0.2 °C and 69.7 ± 0.5%, respectively.

2.2. Treatment Imposition

The plants were subjected to two variation factors during the experiment: two CO2 concentrations and two water regimes. The carbon dioxide enrichment treatments started when seedlings reached 30 DAS, being exposed to ambient CO2 (aCO2; ~400 μmol·mol−1) or CO2 enriched ambient (eCO2; ~680 μmol·mol−1) concentration based on previous studies [35,36,37] as an intermediate concentration that has not been previously evaluated and aligns with climate change projections for the near future.; two OTCs were kept under eCO2 while other two chambers were maintained under aCO2 (Figure 1). The (CO2) concentration inside the OTCs was monitored every hour using an infrared gas analyzer (model SBA-5, PP Systems, Amesbury, MA, USA), allowing real-time monitoring of the ambient CO2 concentration. Preliminary tests confirmed that the CO2 concentration remained at 680 ± 30 μmol·mol−1 for a period of two hours. After this time, manual supplementation was performed using a CO2 cylinder.
The exposure time to CO2 enrichment occurred from 7:00 a.m. to 5:00 p.m., coinciding with the day length during which photosynthesis took place. Sugarcane plants were exposed to these (CO2) levels for 70 days. All plants of both varieties were maintained at 90% soil water-holding capacity until 60 days after sowing (DAS).
Considering that water deficit at this stage can negatively affect initial growth, reducing the plant’s ability to utilize available water during subsequent developmental phases, at 60 DAS, the water regimes (WR) were imposed: WR1—plants watered regarding ~90% of the evapotranspiration from the previous day, which means that plants were maintained at 80–90% of the soil water retention capacity; WR2—plants watered regarding ~50% of the evapotranspiration of the control plants. The imposition of WR2 occurred in a controlled and gradual manner, with the amount of water being reduced by 75% and 4 days after 50%. WR2 was maintained until the end of the experiment. The drought effects on the plants were also confirmed by the visual registration of the rolling of leaves. For the control of irrigation, a soil humidity sensor (ThetaProbe, type ML2x, Delta T, Cambridge, UK) was used, adding the necessary amount of water based on the soil moisture calibration curve.

2.3. Morphological Measurements

Growth measurements were carried out weekly after 30 DAS: The plant height (PH) from the stem base to apex, diameter of the stem (SD) at 5 cm above the ground, and leaf area (LA) were evaluated. At the end of the experimental period (100 DAS) the plants were separated into root and aerial parts (stem and leaves) and dried in an oven with forced air circulation at 70 °C until reaching a constant weight. For the determination of dry mass partitioning, the root-to-shoot ratio (R/S ratio) was calculated as the dry mass of the root divided by the dry mass of the aerial part.
The plant leaf area was calculated [38]:
L A = L L W 0.75 ( N + 2 )
where: LA = leaf area (cm2); L = leaf length (cm); LW = maximum leaf width (cm); N = number of green leaves (un.)

2.4. Physiologic Measurements

Leaf relative water content (RWC) was measured at the end of the experimental period (100 DAS), following the methodology proposed by Barrs & Weatherley [39]. The water use efficiency (WUE) was calculated by the ratio of net photosynthesis (PN) and transpiration (E), considering the entire canopy. For PN and E measurements, a 3.7 dm3 volume chamber was used in a closed system. The chamber was sealed with crystal plastic to allow light to pass through; measurements were performed with aCO2 (~400 μmol·mol1). A hose was attached to the side of the chamber and connected to an infrared gas analyzer (model SBA-5, PP Systems, Amesbury, MA, USA). The gas exchange system was connected to a computer to record CO2 concentration inside the chamber. Plants remained in the chamber for 3 min and the decay of the CO2 concentration and increase of water vapor was recorded according to its consumption and release, respectively. For the calculation, the CO2 and water vapor values of the first minute were disregarded to avoid interference from the initial adjustment when placing the plant in the chamber. The parameters considered for the calculation of PN and E are described in Equations (2) and (3) [32]:
P N = C 1 C 2 T 2 T 1 * V L
E = W 2 W 1 T 2 T 1 V L
where PN: net photosynthesis (μmol CO2 m−2 s−1), C1: initial (CO2) (μmol CO2 mol−1 air); C2, final (CO2) (μmol CO2 mol−1 air), T1: initial time (s), T2: final time (s), V: chamber volume (m3), L: leaf area (m2), E: transpiration (mmol H2O m−2 s−1), W1: initial (H2O) (mmol H2O mol−1 air) and W2: final (H2O) (mmol H2O mol−1 air).
The correction of PN and E values was performed considering the local atmospheric pressure (P) in MPa and temperature (T) in Kelvin, described in:
P N c = P N P T  
E c = E P T  
Two biochemical parameters (Vcmax and Vpmax) were calculated from the analytical solutions of the equations proposed by Collatz et al. [40] following the protocol proposed in Marchiori et al. [23].

2.5. Determination of Carbon and Organic Nitrogen

At the end of the experiment, the leaf +2 was collected. Subsequently, leaves were oven-dried and ground to a fine powder for analysis of carbon and organic nitrogen. The leaf samples were dried in an oven at 50 °C for 48 h and homogenized in a cryogenic mill (Geno/Grinder 2010—SPEX SamplePrep, LLC; Metuchen, NJ, USA) using liquid nitrogen. An aliquot of 7.0 mg of each sample was weighed in a tin capsule using a scale with a resolution of 1 μg (XP6—Mettler Toledo, Inc., Columbus, OH, USA) The homogenization of the samples increases the representativeness of the small aliquot of the sample. The capsules were analyzed in a continuous flow isotopic ratio mass spectrometry system (CF-IRMS) using an IRMS (Delta V, Thermo Fisher Scientific, Inc., Bremen, Germany) coupled to an Elemental Analyzer (EA, Flash 2000, Thermo Fisher Scientific, Inc., Bremen, Germany) through a gas interface (ConFlo IV, Thermo Fisher Scientific, Inc., Bremen, Germany). The EA determined the levels of total organic nitrogen (TON) and total organic carbon (TOC) expressed in percentage of dry mass.

2.6. Anatomic Measurements

At the end of the experimental period, 100 DAS, mid-region samples of one fully expanded leaf blade developed under the CO2 treatment of each plant were collected and fixed in 70% formaldehyde, glacial acetic acid, and ethanol (FAA) for 72 h and then transferred to 70% ethanol [41]. Paradermal sections from the abaxial epidermis (ABE) and adaxial epidermis (ADE) were taken from the median region of the leaf using a double-edged razor. The sections were clarified with 50% sodium hypochlorite, stained with 1% Safranin, and placed in slides with 50% glycerin. For cross sections, samples of 2 cm2 were taken from the middle section of the leaf. The material was sectioned with a microtome and stained using Safrablau (0.1% Astra Blue and 1% Safranine) and placed in slides with 50% glycerin [42].
The slides were photographed using a light microscope, Zeiss Scope, model AX10 (ZEISS, Oberkochen,Germany) coupled with a digital camera Canon Powershot, model G10 (Canon Inc., Huntington, NY, USA), and the images were analyzed using the ImageJ® software, version 1.53. For each anatomical characteristic, five replicates were composed of five sections of each slide, totaling 25 sections per treatment.
The anatomical characteristics evaluated were adaxial stomatal density (SD_AD) and abaxial stomatal density (SD_AB) (stomata mm⁻2), adaxial stomatal functionality (FUN_AD) as the ratio of polar diameter (µm) to equatorial diameter (µm) of stomata on the adaxial surface, abaxial stomatal functionality (FUN_AB) as the ratio of polar diameter (µm) to equatorial diameter (µm) of stomata on the abaxial surface, and bundle sheath cell wall thickness (CWT) (µm).

2.7. Experimental Design and Data Analysis

For each of the evaluated varieties, a completely randomized design with a factorial arrangement is used. A two o-level factorial scheme (2 × 2), with two CO2 concentrations (400 µmol mol−1 and 680 µmol mol−1), and two water regimes (WR1 and WR2) was used. Each experimental unit was composed of one plant per pot, with five replicates per treatment (n = 5). Data analysis was conducted using the software R Core Team [43]. The normality assumption was verified by analyzing the residuals of the ANOVA model through the Shapiro–Wilk test (p > 0.05) and the homogeneity of variance assumption through the Bartlett test (p > 0.05). Subsequently, in order to evaluate the hypotheses, a two-way ANOVA of factorial arrangement and Tukey’s multiple comparisons of means test (HSD test) (p < 0.05) was used through the “agricolae” package. Principal component analysis (PCA) was performed using the “FactoMineR” and “factoextra” packages to generate two-dimensional biplots.

3. Results

Morphological, Physiological, and Anatomic Response to Drought Stress and High CO2

Overall, it was evident that water restriction adversely affected the growth of both varieties. The increase in CO2 concentration by itself improved the height and leaf area of RB867515 but did not alter the growth of the RB855536 variety. Considering the interaction of the factors, only the stem diameter was not influenced in RB867515, while in RB855536, neither plant height nor R/S ratio was altered, indicating that the morphology of plants under drought and exposed to high (CO2) change. In both (CO2) conditions, the RB867515 variety was the highest, showing 171.8 ± 3.1 cm tall; under water stress, they showed differences of 14.7% and 16.7%, respectively, in aCO2 and eCO2. In water-stressed plants, the leaf area of RB867515 was 23% higher in plants of this variety under eCO2, compared to plants grown in aCO2. Additionally, alterations of biomass allocation were observed: plants grown under eCO2 and water stress allocated more biomass for root formation, whereas the leaf biomass was reduced when compared to water-stressed plants under aCO2 condition (Table 2). In RB867515, total biomass accumulation was reduced by only 2.6% between plants subjected to water deficit with ambient and high (CO2).
Regarding variety RB855536, the plant height presented values of 134.2 ± 5.3 cm and 134.4 ± 1.6 cm tall under water deficit with aCO2 and eCO2. The stem diameter in plants under water deficit and eCO2 was similar to plants under water deficit and aCO2 (9.9 ± 0.4 and 9.6 ± 0.6 mm). Plants under eCO2 and water deficit presented a leaf area of 0.17 ± 0.01 m2 with a decrease of 61% compared to well-watered plants under eCO2. The R/S ratio in plants under a water deficit and eCO2 presented the highest value, of 0.51 ± 0.02, compared to control plants with aCO2 and eCO2, which presented 0.43 ± 0.04 and 0.48 ± 0.02, respectively (Table 2).
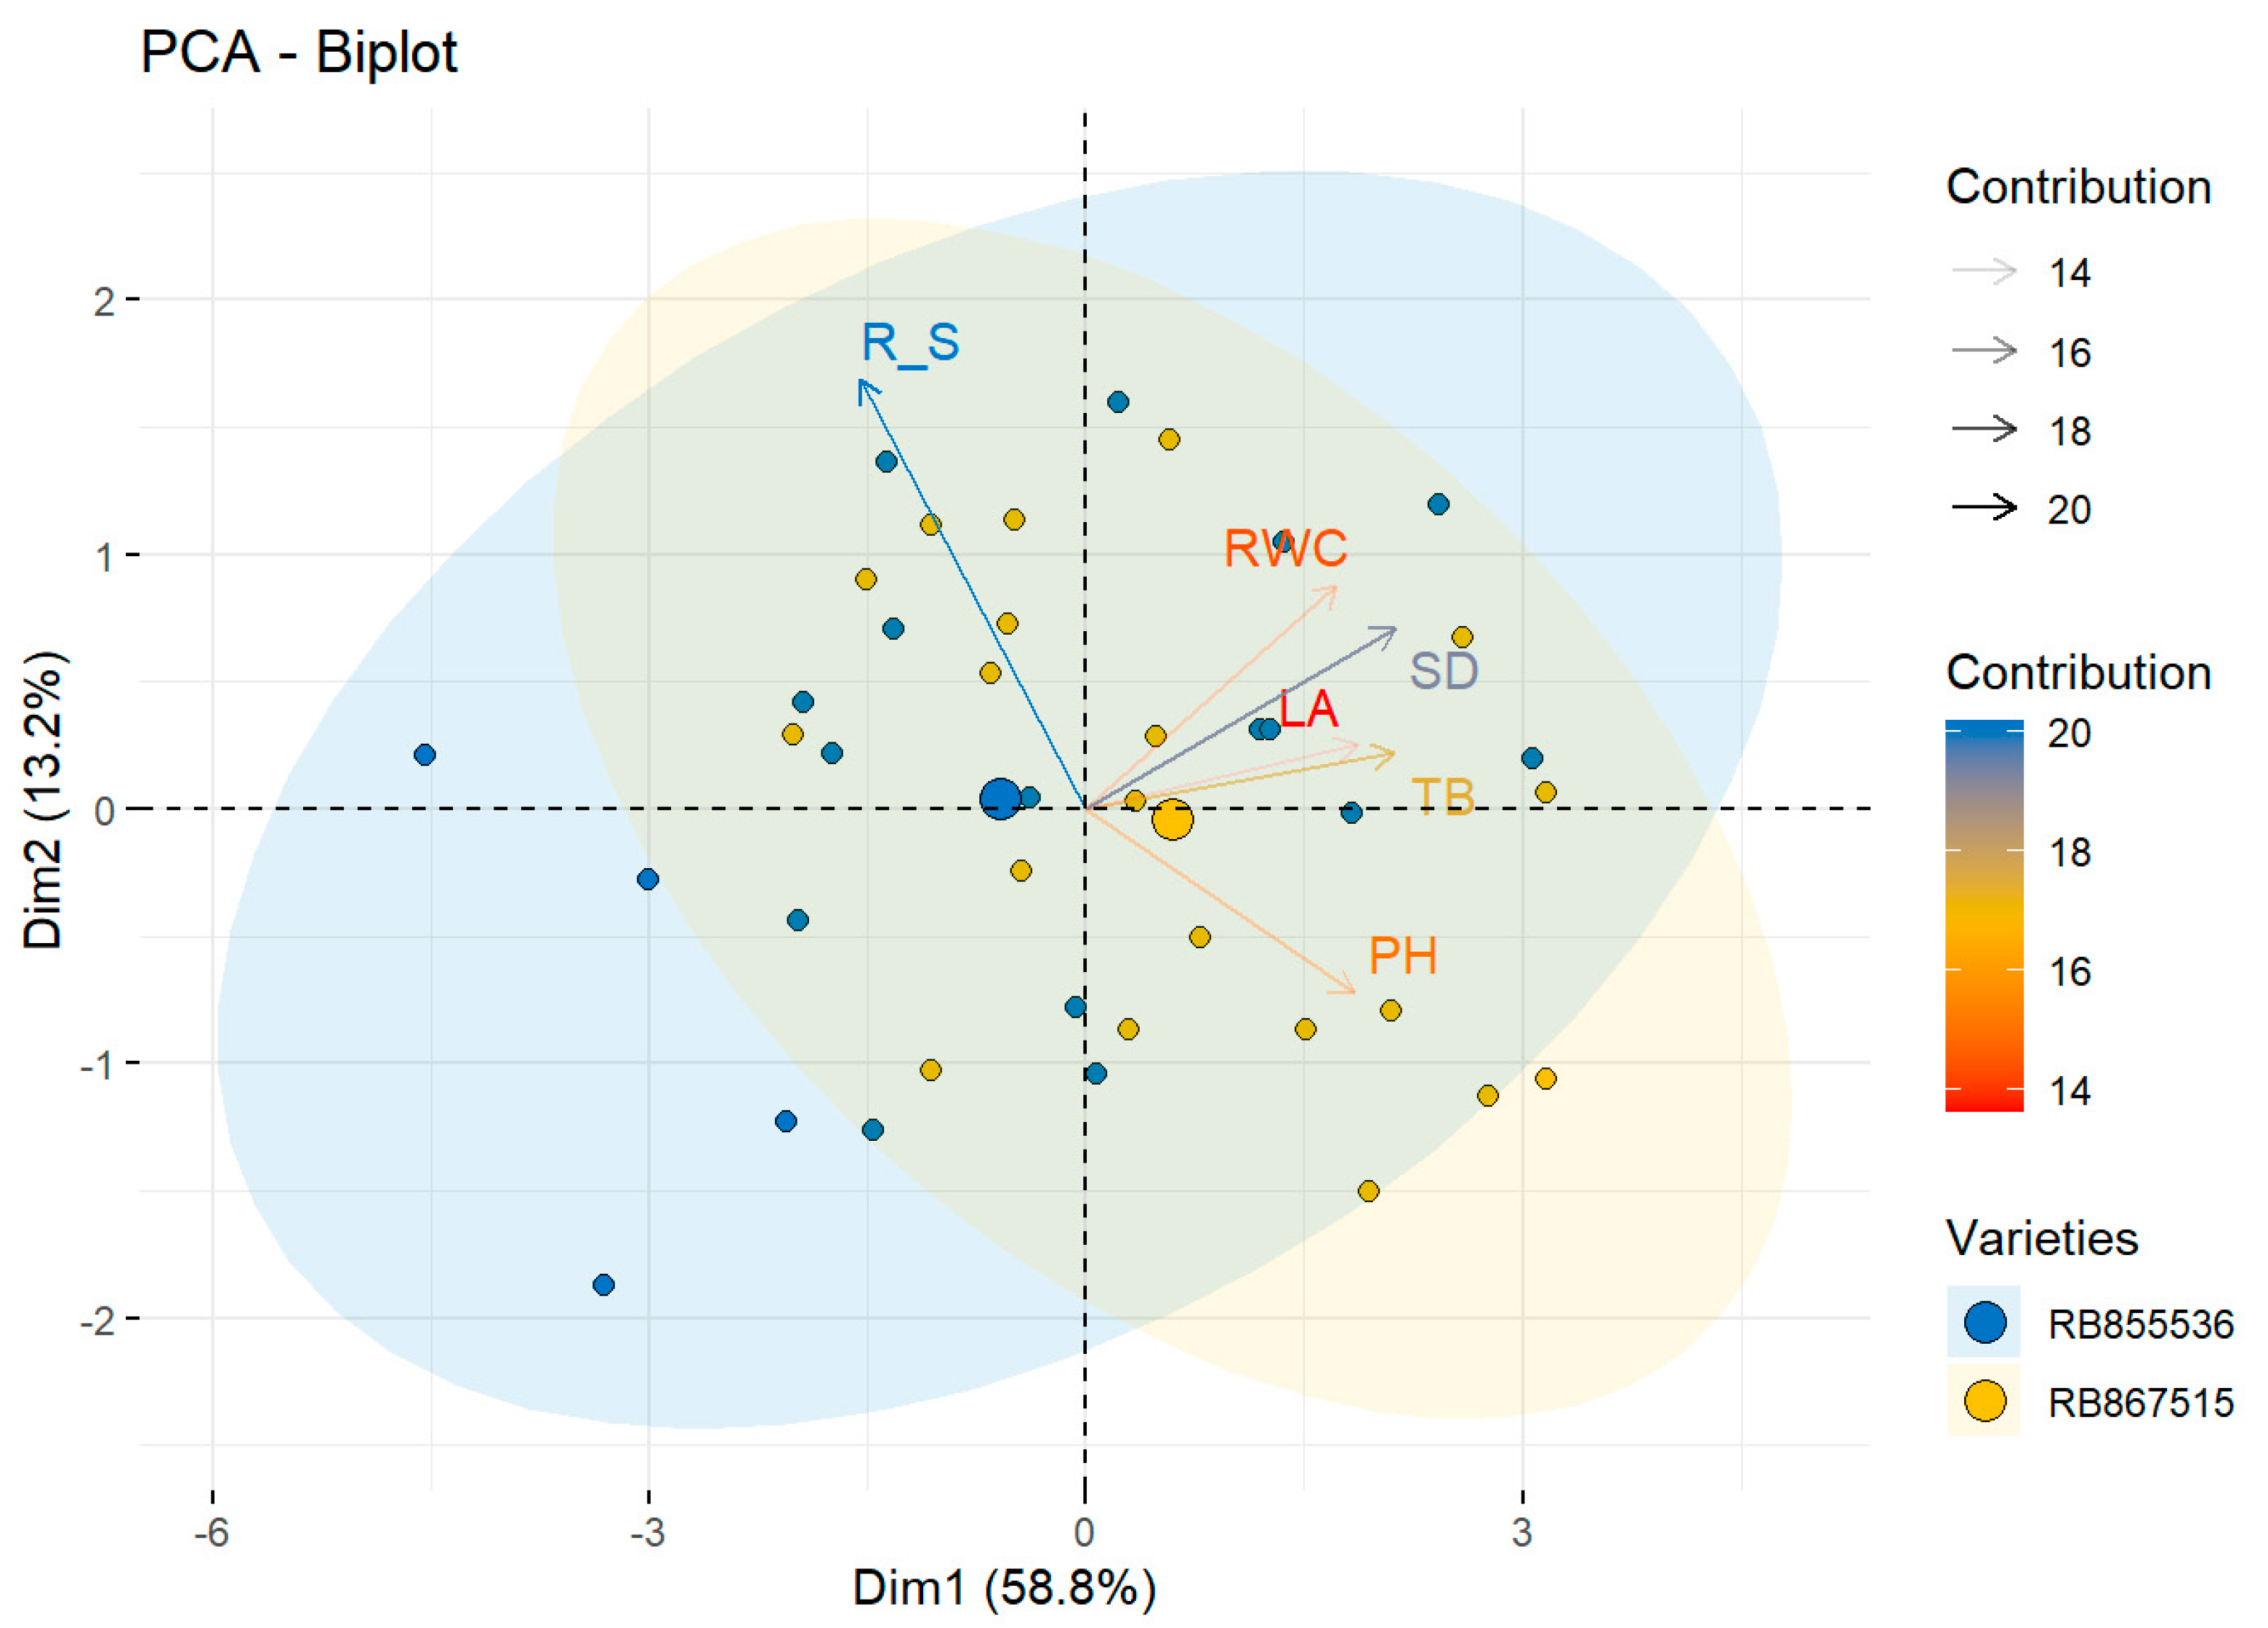
The contribution of each of the morphological variables in both cultivars was evaluated through principal components analysis (PCA). It was observed that total variability was explained by the first component at 58.8%, in which the most important variables were the total biomass (TB) and stem diameter (SD), with a contribution of 20% and 18%, respectively. The second component explained 13.2% of the total variability, in which the root/shoot ratio was the variable that presented the greater contribution, representing 20%. In the biplot, the centroids for each variety are observed, which are located along the axis of the first dimension, observing that the centroid for the variety RB867515 is closest to the vectors of the TB and SD variables due to the fact that it presented the greatest values for these variables (Figure 2). Considering the RB855536, the highest values were observed for R/S, which was located close to this vector, differentiating itself from the variety RB867515. Therefore, the variety RB867515 presented a better response in terms of the biometric variables evaluated under conditions of water deficit and eCO2 concentration (Figure 2).
The RB867515 presented a relative water content of 84.4 ± 1.4% when subjected to a water deficit and eCO2 environment, which was 7.3% higher than the water deficit and aCO2 treatment. Meanwhile, the variety RB855536 presented RWC under water deficit with eCO2 of 77.3 ± 3.3%. It was observed that the WUE was improved in plants growing under eCO2, especially under water-stress conditions. However, RB855536 stands out since it presented the highest WUE under drought and eCO2 conditions (Table 3).
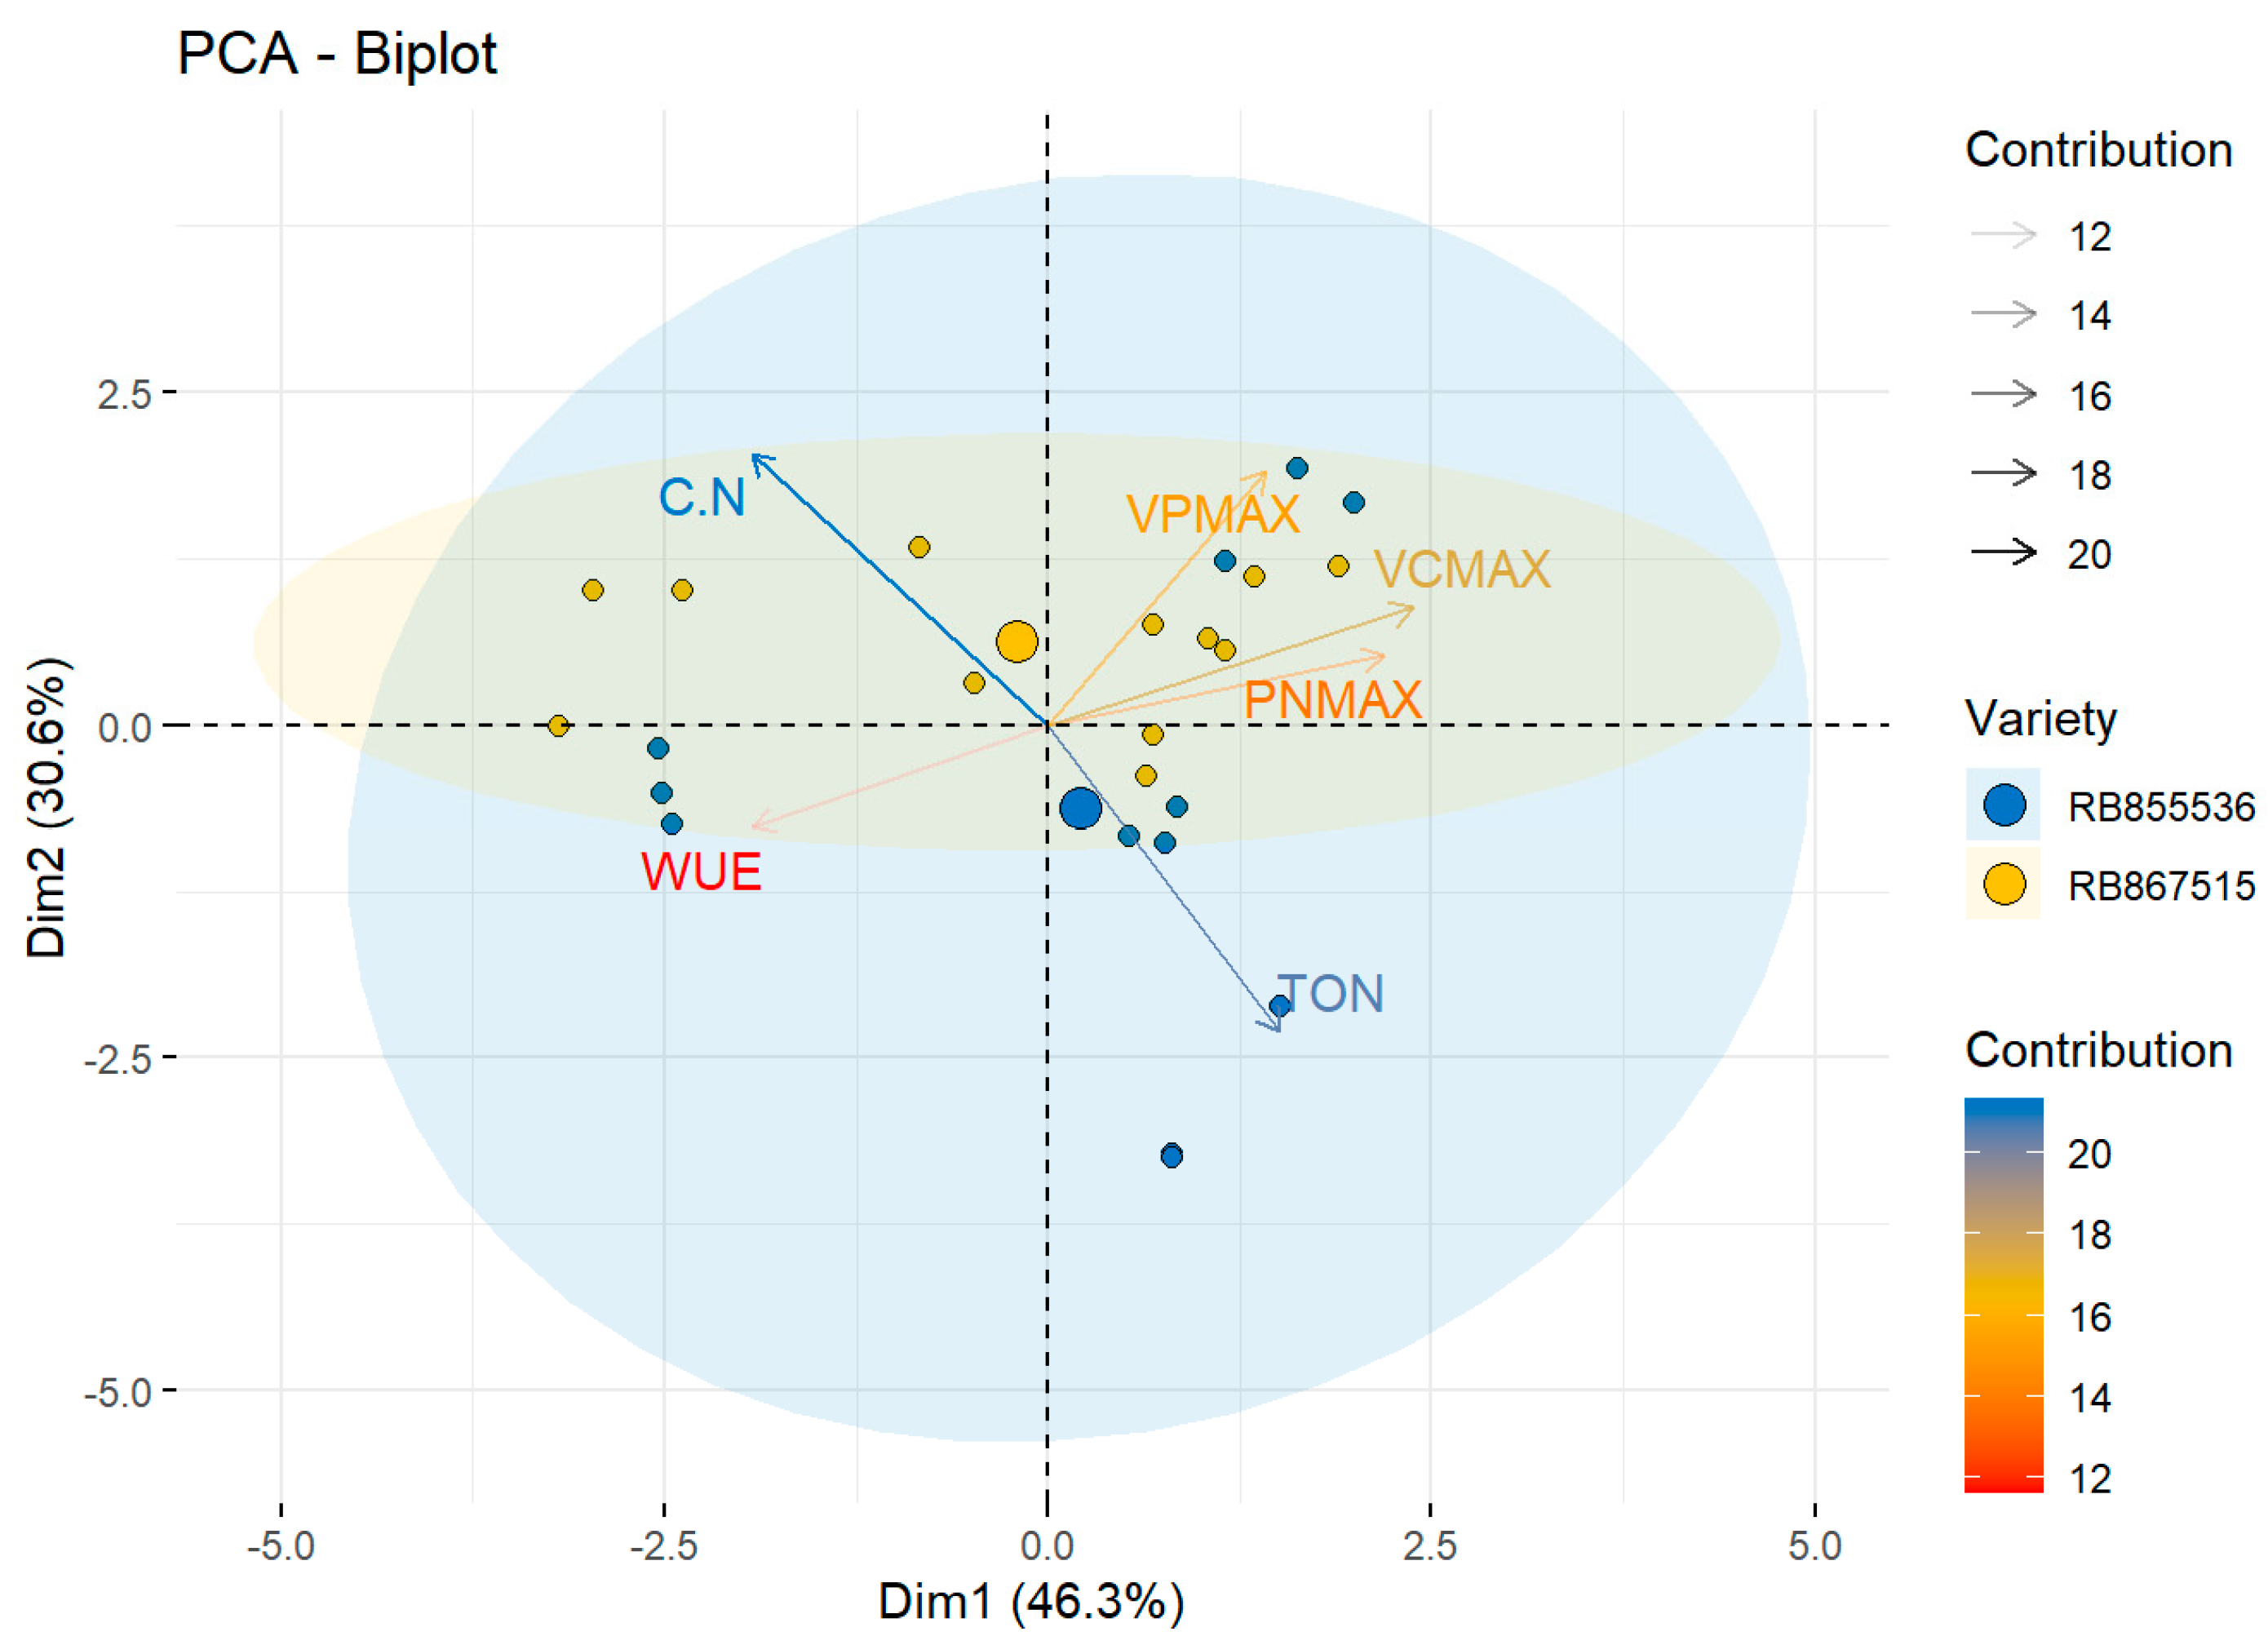
The total variability for the physiological variables was explained by the first component at 46.3%, with the maximum rate of carboxylation by Rubisco (Vcmax) as the greatest contributor at 18%. The second component explained 30.6% of the total variability in which the percentage of organic carbon and organic nitrogen (C/N) ratio presented the highest contribution, at 20%. On the biplot, the variety RB867515 presented the highest C/N value when grown under eCO2 and water stress and was located near this vector, differentiating itself from the variety RB855536 (Figure 3).
The variety RB867515 showed the highest stomatal density (SD) on the adaxial and abaxial surfaces with 120.9 ± 5.4 stomata mm−2 and 71.3 ± 4.6 stomata mm−2, respectively. RB855536 showed SD on the adaxial and abaxial surfaces of 109.1 ± 4.2 stomata mm−2 and 43.6 ± 3.1 stomata mm−2, respectively, when subjected to water deficit and eCO2 (Table 4).
Plants of the variety RB867515 subjected to water deficit and eCO2 showed higher adaxial and abaxial SD than well-watered plants with significant differences (p < 0.05), while plants of the variety RB855536 under the same condition did not differ statistically from the well-watered plants (Table 4). Stomatal functionality (FUN) did not present statistical differences (p > 0.05) in any of the varieties evaluated. The variety RB855536 subjected to water deficit and eCO2 presented values of 3.8 ± 0.4 and 3.9± 0.3 for the adaxial and abaxial surfaces, respectively, compared to values of 3.5 ± 0.2 and 3.2 ± 0.1 for RB867515 under the same conditions (Table 4). The RB855536 plants subjected to water deficit and eCO2 presented a lower cell wall thickness (2.3 ± 0.09 µm) compared to well-watered plants. Meanwhile, the variety RB867515 showed a cell wall thickness of 2.5 ± 0.06 µm, but with no statistical differences to well-watered plants (Table 4).
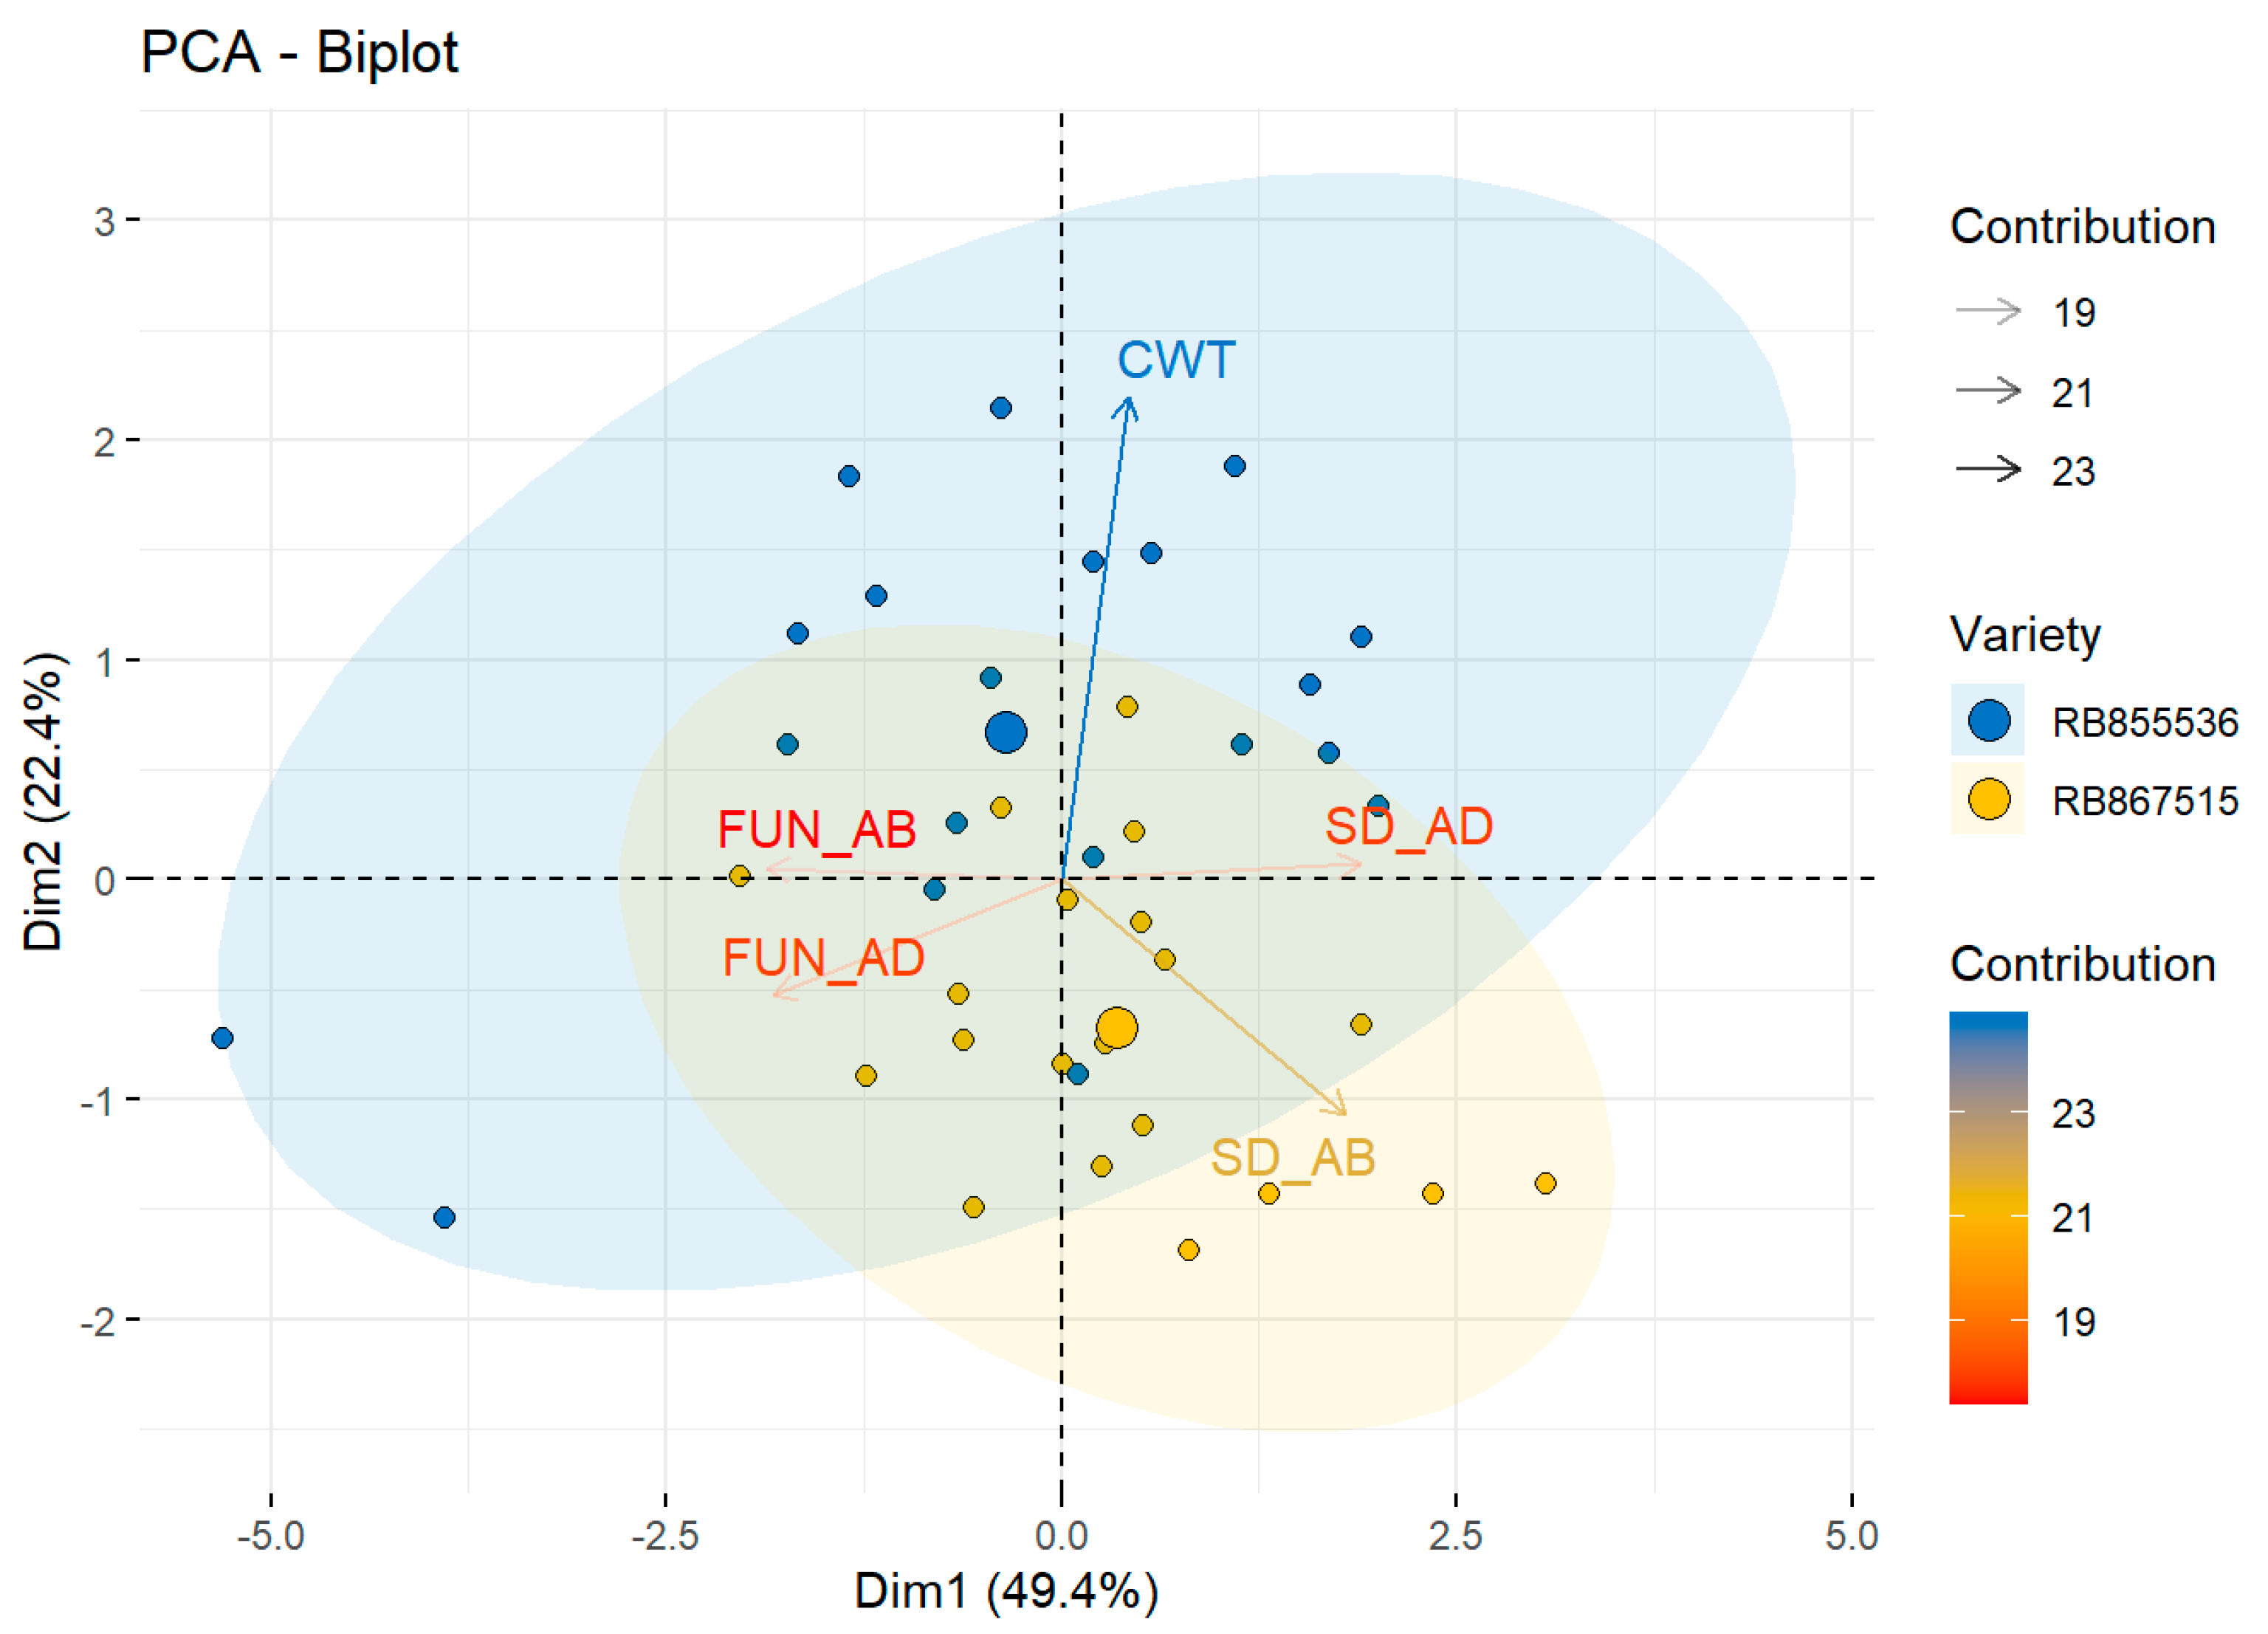
The PCA of the anatomical variables indicated that the total variability was explained by 49.4% of the first component, in which SD_AB variable generated the greatest contribution, 23%. The second component explained 22.4% of the total variability, in which CWT presented the greatest contribution of 23%. The centroid of the variety RB867515 was created close to the vector of the SD_AB, while the centroid of the variety RB855536 was located close to the vector of the CWT, associated with the dynamics that each variety showed regarding the anatomy responses (Figure 4).

4. Discussion

Through our study, we bring two important pieces of information: (i) sugarcane plants respond to increases in atmospheric CO2, improving total biomass production and photosynthesis when exposed to water stress; (ii) the drought responses of sugarcane varieties differ when they are grown under eCO2. In this last case, the expected decrease in total biomass accumulation was followed by a strong modulation in biomass allocation. Regarding this, it was observed the RB867515 variety under eCO2 and drought conditions showed a preferential allocation of biomass for root over leaves (Table 2). This response may be considered a strategy to avoid water deficit, improve root–soil exploration, and potentially act as carbohydrate storage, which is associated with reductions in transpiration’s area [17]. However, this improvement in root biomass is only possible at carbohydrate’s expense, which is more produced in plants grown under eCO2 since the diffusive limitation of photosynthesis is lower under an eCO2 environment.
In a sugarcane crop, traits such as plant height and stem diameter largely depend on the plant’s genetic potential [44] and are affected by limitations in metabolism leading to changes in growth and biomass accumulation [33,45]. According to Lima et al. [46], the interaction with the environment determines morphological and growth responses. Marchiori et al. [17] demonstrated that sugarcane plants exhibit genotype sensitivity to drought, as morphological and physiological variables are differently affected by the intensity of water deficit. The occurrence of leaf anatomy changes reflects the plant’s plasticity under climatic variations, being associated with the physiological performance under a determined climate [47]. The stomatal pores act as an interface between the plant and the atmosphere, regulating the absorption of CO2 for photosynthesis (PN) and the loss of water through transpiration [48]. In general, it was observed that RB867515 plants showed higher stomatal density on the adaxial surface when subjected to water stress with aCO2 or eCO2, compared to the RB855536 variety (Table 4). The variation in SD is one of the indicators to determine the efficiency of the gas exchange diffusion carried out by the leaves [49] once the higher SD represents a better stomatal regulation.
Effective stomatal control through morphological changes in the number of stomata and physiological regulation of the stomatal aperture size allows for the optimal balance of CO2 absorption and water loss in genotypes subjected to both favorable and unfavorable growth conditions [50]. It has been indicated that control of the number of stomata is a protective mechanism that improves water use in the plant, and this response is considered a long-term acclimation mechanism that occurs only when leaves are fully mature and growing under an atmosphere enriched with CO2 [51,52].
Regarding stomatal functionality, it was observed that increased CO2 increased the values of this variable in variety RB855536 (Table 4). This response would represent an advantage for this genotype in future climate change scenarios, as drought events will be more frequent. This is due to lower transpiration rates in leaves with smaller stomata and differences in the size of the stomatal opening [53]. It is considered that the increase in atmospheric (CO2) has a beneficial effect on plants’ carbon balance and in reducing water loss through transpiration, generally associated with a lower stomatal conductance resulting in an increase in water use efficiency [54].
Phenotypic plasticity represents changes in the phenotype (in the same genotype) in response to changes in environmental conditions [29]. In this sense, at the morphological level, the RB867515 variety presents a better capacity to optimize root system biomass for the acquisition and storage of resources in response to the limiting condition to the detriment of leaf area. Phenotypic plasticity is associated with regulated changes that often involve stress response pathways and changes in the phenotype in response to changes in environmental conditions due solely to the imposition or removal of a growth limiting factor. In this sense, and for the type of responses presented, the varieties evaluated show morphological and physiological plasticity; once in the stress condition and making use of the resources available (eCO2), they increased the water use efficiency, slow down their growth, alter their biomass allocation and modify their leaf anatomy as a strategy that allows them to maintain their metabolism during the limiting condition.
Plants exposed to elevated CO2 have shown three types of response: (i) increased photosynthesis and biomass through optimization of the diffusive and biochemical phases, (ii) acclimation leading to improved efficiency in water use [55], and (iii) maintenance of the metabolism indifferent to gas enrichment [5]. In this case, an acclimation response was recorded since plants grown in eCO2 showed a better WUE, with this response being more accentuated for the RB855536 variety (Table 3). However, for this variety, an improvement in water use efficiency (WUE) was not reflected in an increase in biomass, possibly as a trade-off between WUE and biomass accumulation in response to water limitation as a fundamental resource for growth [56].
The acclimation of plants refers to morphophysiological adaptations to return to the initial equilibrium [27]. Acclimation responses under eCO2 are related to decreases in the number of enzymes following the theory of least cost, where the relative investment in photosynthetic capacity and water transport is optimized so that a given photosynthetic rate is achieved with the least cost [57]. In this sense, it has been reported that increases in the atmospheric CO2 concentration in C4 plants under drought stress generate a positive effect due to the partial closure of the stomata, which reduces transpiration and optimizes the capacity to assimilate carbon even when there is stomatal limitation [58], this is reflected in biomass accumulation with lower water consumption, thus presenting higher WUE values [59]. According to Silva et al. [60], sugarcane varieties that exhibit high values of RWC and high efficiency in the use of photosynthetic radiation under water restriction conditions should be considered in breeding programs for drought-prone environments.
The above can also be supported once the net CO2 assimilation rate did not increase under high CO2 conditions. Water restriction periods lead to the loss of Rubisco enzyme function since proteins involved in photosynthesis are the main targets of oxidation, which in turn results in post-translational modulation of this enzyme, thus limiting photosynthesis and, consequently, the availability of carbohydrates for sucrose and starch biosynthesis. In this case, the elevated CO2, along with the stress condition, seems to negatively affect the carboxylation rate of Rubisco for the two evaluated varieties.
The C/N ratio in plants of the RB855536 variety grown under ambient CO2 and subjected to water deficit was significantly affected (Table 3). Water restriction in plants leads to a decrease in the carbon assimilation process due to low CO2 availability caused by stomatal limitations (stomatal functionality and density) and/or non-stomatal limitations (photochemical and enzymatic limitations) [61,62,63]. According to Xiong et al. [64], N is important in CO2 diffusion, attributed to a strong positive correlation between N and stomatal conductance (gs). Water stress leads to a reduction in photosynthesis associated with a decrease in N metabolism, as enzymes such as glutamine synthetase (GS) and glutamate synthase (GOGAT), which are crucial for incorporating inorganic N into amides and amino acids, decrease in activity, directly affecting the relationship between carbon and nitrogen metabolism [65,66]. It is indicated that water deficit reduces the activity of the enzyme nitrate reductase, fundamental in the nitrogen assimilation process in its nitric form, thus affecting N absorption and nitrogenous compound content in leaves [67]. However, it was also observed that plants of this variety subjected to water deficit but under eCO2 conditions showed a better response with higher C/N values and WUE (Table 3).

5. Conclusions

The sugarcane plants, under water stress, respond to eCO2 by improving total biomass and photosynthesis. In general, the RB855536 variety showed higher physiological plasticity represented in better water use efficiency and variations in the carboxylation rates of the Rubisco and PEPC enzymes, while the RB867515 variety showed greater morphological plasticity determined by changes in biomass allocation, total biomass, leaf area and stem diameter, and anatomical with a higher stomatal density. The sugarcane varieties evaluated, when subjected to water deficit and high CO2 concentration, developed different strategies based on morphological, physiological, or anatomical changes, being these strategies useful to face upcoming climate change scenarios.

Author Contributions

Conceptualization, Z.C.C.-R. and P.E.R.M.; methodology, Z.C.C.-R., P.C.A.L., and A.A.d.S.; formal analysis, Z.C.C.-R., E.H.P.-S., and J.P.R.A.D.B.; investigation, Z.C.C.-R., P.C.A.L., A.A.d.S., and C.R.d.S.; data curation, E.H.P.-S. and M.K.A.; writing—original draft preparation, Z.C.C.-R., E.H.P.-S., M.K.A., and P.E.R.M.; writing—review and editing, Z.C.C.-R., E.H.P.-S., J.P.R.A.D.B., and P.E.R.M.; visualization, E.H.P.-S.; resources, P.E.R.M.; project administration, P.E.R.M.; funding acquisition, P.E.R.M. All authors have read and agreed to the published version of the manuscript.

Funding

The authors acknowledge the financial support of Fundação de Amparo a Pesquisa de Minas Gerais (FAPEMIG; PPM-00285-18), from The Brazilian National Council for Scientific and Technological Development (CNPq; 402950/2016-0) and National Institute of Science and Technology in Plant Physiology under Stress Conditions—406455/2022-8). The scholarships for Z.C.C.R., P.C.A.L. and A.A.d.S. (Finance Code-001), E.H.P.S. (88887.805044/2023-00), and MKA (88887.928063/2023-00) from CAPES, and fellowships from CNPq for PERM (312663/2021-8) and J.P.R.A.D.B. (312488/2022-0)

Data Availability Statement

The original contributions presented in this study are included in the article. Further inquiries can be directed to the corresponding author.

Acknowledgments

To the Organization of American States and the Coimbra Group of Brazilian Universities (GCUB) through the program “Alianzas para la educación y la capacitación Becas—Brasil PAEC OEA-GCUB 2017”.

Conflicts of Interest

The authors declare no conflict of interest.

References

  1. Malhi, G.S.; Kaur, M.; Kaushik, P. Impact of climate change on agriculture and its mitigation strategies: A review. Sustainability 2021, 13, 1318. [Google Scholar] [CrossRef]
  2. Guhan, V.; Annadurai, K.; Easwaran, S.; Marimuthu, M.; Balu, D.; Vigneswaran, S.; Navinkumar, C. Assessing the impact of climate change on water requirement and yield of sugarcane over different agro-climatic zones of Tamil Nadu. Sci. Rep. 2024, 14, 8239. [Google Scholar] [CrossRef]
  3. Da Cruz, T.V.; Machado, R.L. Measuring climate change’s impact on different sugarcane varieties production in the South of Goiás. Sci. Rep. 2023, 13, 11637. [Google Scholar] [CrossRef]
  4. Baslam, M.; Mitsui, T.; Hodges, M.; Priesack, E.; Herritt, M.T.; Aranjuelo, I.; Sanz-Sáez, Á. Photosynthesis in a changing global climate: Scaling up and scaling down in crops. Front. Plant Sci. 2020, 11, 882. [Google Scholar] [CrossRef]
  5. Walia, S.; Rathore, S.; Kumar, R. Elucidating the Mechanisms, Responses and future prospects of medicinal and aromatic plants to elevated CO2 and elevated temperature. J. Appl. Res. Med. Aromat. Plants 2022, 26, 100365. [Google Scholar] [CrossRef]
  6. IPCC. A Report of the Intergovernmental Panel on Climate Change. In Climate Change 2023: Synthesis Report; Lee, H., Romero, J., Eds.; IPCC: Geneva, Switzerland, 2023; p. 36. ISBN 9789291691432. [Google Scholar]
  7. Vaughan, M.M.; Huffaker, A.; Schmelz, E.A.; Dafoe, N.J.; Christensen, S.A.; McAuslane, H.J.; Alborn, H.T.; Allen, L.H.; Teal, P.E.A. Interactive effects of elevated [CO2] and drought on the maize phytochemical defense response against Mycotoxigenic Fusarium verticillioides. PLoS ONE 2016, 11, e0159270. [Google Scholar] [CrossRef] [PubMed]
  8. Balting, D.F.; AghaKouchak, A.; Lohmann, G.; Ionita, M. Northern hemisphere drought risk in a warming climate. NPJ Clim. Atmos. Sci. 2021, 4, 61. [Google Scholar] [CrossRef]
  9. De Menezes, S.M.; da Silva, G.F.; da Silva, M.M.; de Oliveira Filho, R.A.; Jardim, A.M.d.R.F.; Silva, J.R.I.; Silva, Ê.F.d.F.; Silva, J.V.; dos Santos, M.A.L. Pulse drip irrigation improves yield, physiological responses, and water-use efficiency of sugarcane. Water Conserv. Sci. Eng. 2024, 9, 25. [Google Scholar] [CrossRef]
  10. Bhargava, S.; Mitra, S. Elevated atmospheric CO2 and the future of crop plants. Plant Breed. 2021, 140, 1–11. [Google Scholar] [CrossRef]
  11. Dusenge, M.E.; Duarte, A.G.; Way, D.A. Plant carbon metabolism and climate change: Elevated CO2 and temperature impacts on photosynthesis, photorespiration and respiration. New Phytol. 2019, 221, 32–49. [Google Scholar] [CrossRef]
  12. Gonçalves, R.; Alves, R.D.C.; Zingaretti, S.M. Increased [CO2] causes changes in physiological and genetic responses in C4 crops: A brief review. Plants 2020, 9, 1567. [Google Scholar] [CrossRef]
  13. Clemens, M.E.; Zuniga, A.; Oechel, W. Effects of elevated atmospheric carbon dioxide on the vineyard system of Vitis vinifera: A review. Am. J. Enol. Vitic. 2022, 73, 1–10. [Google Scholar] [CrossRef]
  14. Vu, J.C.V.; Allen, L.H. Stem juice production of the C4 sugarcane (Saccharum officinarum) is enhanced by growth at double-ambient CO2 and high temperature. J. Plant Physiol. 2009, 166, 1141–1151. [Google Scholar] [CrossRef]
  15. De Souza, A.P.; Grandis, A.; Leite, D.C.C.; Buckeridge, M.S. Sugarcane as a bioenergy source: History, performance, and perspectives for second-generation bioethanol. Bioenergy Res. 2014, 7, 24–35. [Google Scholar] [CrossRef]
  16. Voora, V.; Bermúdez, S.; Le, H.; Larrea, C.; Luna, E. Global Market Report: Sugar Cane Prices and Sustainability. International Institute of Sustainable Development. 2023. Available online: https://www.iisd.org/publications/report/2023-global-market-report-sugar-cane (accessed on 1 March 2025).
  17. Marchiori, P.E.R.; Machado, E.C.; Sales, C.R.G.; Espinoza-Núñez, E.; Magalhães Filho, J.R.; Souza, G.M.; Pires, R.C.M.; Ribeiro, R.V. Physiological plasticity is important for maintaining sugarcane growth under water deficit. Front. Plant Sci. 2017, 8, 2148. [Google Scholar] [CrossRef]
  18. Grandis, A.; Fortirer, J.S.; Navarro, B.V.; de Oliveira, L.P.; Buckeridge, M.S. Biotechnologies to improve sugarcane productivity in a climate change scenario. Bioenergy Res. 2023, 17, 1–26. [Google Scholar] [CrossRef]
  19. De Oliveira, H.F.E.; Arriel, F.H.; Soares, F.A.L.; da Silva, E.C.; Mesquita, M.; Silva, T.D.; da Silva, J.L.B.; Sousa, C.M.; da Silva, M.V.; de Carvalho, A.A.; et al. Agronomic performance and technological attributes of sugarcane cultivars under split-irrigation management. Agriengineering 2024, 6, 4337–4352. [Google Scholar] [CrossRef]
  20. Marin, F.R.; Ribeiro, R.V.; Marchiori, P.E.R. How can crop modeling and plant physiology help to understand the plant responses to climate change? A case study with sugarcane. Theor. Exp. Plant Physiol. 2014, 26, 49–63. [Google Scholar] [CrossRef]
  21. Vu, J.C.V.; Allen, L.H.; Gesch, R.W. Up-regulation of photosynthesis and sucrose metabolism enzymes in young expanding leaves of sugarcane under elevated growth CO2. Plant Sci. 2006, 171, 123–131. [Google Scholar] [CrossRef]
  22. De Souza, A.P.; Gaspar, M.; Da Silva, E.A.; Ulian, E.C.; Waclawovsky, A.J.; Nishiyama, M.Y.; Dos Santos, R.V.; Teixeira, M.M.; Souza, G.M.; Buckeridge, M.S. Elevated CO2 increases photosynthesis, biomass and productivity, and modifies gene expression in sugarcane. Plant Cell Environ. 2008, 31, 1116–1127. [Google Scholar] [CrossRef]
  23. Marchiori, P.E.R.; Machado, E.C.; Ribeiro, R.V. Photosynthetic limitations imposed by self-shading in field-grown sugarcane varieties. Field Crop. Res. 2014, 155, 30–37. [Google Scholar] [CrossRef]
  24. Sage, R.F.; Kubien, D.S. Quo vadis C4? An ecophysiological perspective on global change and the future of C4 plants. Photosynth. Res. 2003, 77, 209–225. [Google Scholar] [CrossRef] [PubMed]
  25. Da Silva, F.C.; Diaz-Ambrona, C.G.H.; Buckeridge, M.S.; Souza, A.; Barbieri, V.; Dourado Neto, D. Sugarcane and climate change: Effects of CO2 on potential growth and development. Acta Hortic. 2008, 802, 331–336. [Google Scholar] [CrossRef]
  26. Misra, V.; Shrivastava, A.K.; Mall, A.K.; Solomon, S.; Singh, A.K.; Ansari, M.I. Can sugarcane cope with increasing atmospheric CO2 concentration? Aust. J. Crop Sci. 2019, 13, 780–784. [Google Scholar] [CrossRef]
  27. Walter, L.C.; Rosa, H.T.; Streck, N.A. Mecanismos de aclimatação das plantas à elevada concentração de CO2. Ciência Rural 2015, 45, 1564–1571. [Google Scholar] [CrossRef]
  28. Sales, C.R.G.; Wang, Y.; Evers, J.B.; Kromdijk, J. Improving C4 photosynthesis to increase productivity under optimal and suboptimal conditions. J. Exp. Bot. 2021, 72, 5942–5960. [Google Scholar] [CrossRef]
  29. Brooker, R.; Brown, L.K.; George, T.S.; Pakeman, R.J.; Palmer, S.; Ramsay, L.; Schöb, C.; Schurch, N.; Wilkinson, M.J. Active and adaptive plasticity in a changing climate. Trends Plant Sci. 2022, 27, 717–728. [Google Scholar] [CrossRef]
  30. Khonghintaisong, J.; Onkaeo, A.; Songsri, P.; Jongrungklang, N. Water use efficiency characteristics and their contributions to yield in diverse sugarcane genotypes with varying drought resistance levels under different field irrigation conditions. Agriculture 2024, 14, 1952. [Google Scholar] [CrossRef]
  31. Drake, B.; Leadley, P.; Arp, W.; Nassiry, D.; Curtis, P. An open top chamber for field studies of elevated atmospheric CO2 concentration on saltmarsh vegetation. Funct. Ecol. 1989, 3, 363. [Google Scholar] [CrossRef]
  32. Daros, E.; Oliveira, R.A.d.; Barbosa, G.V.d.S. 45 Anos de Variedades Ridesa Brasil de Cana-de-Açúcar, Editora Graciosa, 1st ed.; 2015; Volume 1, ISBN 978-85-66456-08-0. Available online: https://www.ridesa.com.br/variedades?lightbox=dataItem-ivvjh9l61 (accessed on 20 January 2025).
  33. Vital, C.E.; Giordano, A.; de Almeida Soares, E.; Rhys Williams, T.C.; Mesquita, R.O.; Vidigal, P.M.P.; de Santana Lopes, A.; Pacheco, T.G.; Rogalski, M.; de Oliveira Ramos, H.J.; et al. An integrative overview of the molecular and physiological responses of sugarcane under drought conditions. Plant Mol. Biol. 2017, 94, 577–594. [Google Scholar] [CrossRef]
  34. Van Raij, B.; Cantarella, H.; Quaggio, J.A.; Furlani, A.M.C. Fertilization and liming recommendation for the state of São Paulo. In Recomendações de Adubação e Calagem para o Estado de São Paulo; Instituto Agronômico and Fundação IAC: Campinas, Brazil, 1997; p. 262. [Google Scholar]
  35. Vu, J.C.V.; Allen, L.H. Growth at elevated CO2 delays the adverse effects of drought stress on leaf photosynthesis of the C4 sugarcane. J. Plant Physiol. 2009, 166, 107–116. [Google Scholar] [CrossRef]
  36. Stokes, C.J.; Inman-Bamber, N.G.; Everingham, Y.L.; Sexton, J. Measuring and modelling CO2 effects on sugarcane. Environ. Model. Softw. 2016, 78, 68–78. [Google Scholar] [CrossRef]
  37. Singels, A.; Jones, M.; Marin, F.; Ruane, A.; Thorburn, P. Predicting climate change impacts on sugarcane production at sites in Australia, Brazil and South Africa using the canegro model. Sugar Tech 2014, 16, 347–355. [Google Scholar] [CrossRef]
  38. Hermann, E.R.; Câmara, G.M.S. Um método simples para estimar a área foliar da cana-de-açúcar. Rev. Da Soc. Dos Técnicos Açucareiros e Alcool. Do Bras. 1999, 17, 32–34. [Google Scholar]
  39. Barrs, H.; Weatherley, P. A re-examination of the relative turgidity technique for estimating water deficits in leaves. Aust. J. Biol. Sci. 1962, 15, 413. [Google Scholar] [CrossRef]
  40. Collatz, G.; Ribas-Carbo, M.; Berry, J. Coupled photosynthesis-stomatal conductance model for leaves of C4 plants. Aust. J. Plant Physiol. 1992, 19, 519–538. [Google Scholar] [CrossRef]
  41. Johansen, D. Plant Microtechnique; Mcgraw-Hill: New York, NY, USA, 1940. [Google Scholar]
  42. Rodrigues, F.A.; Soares, J.D.R.; Silva, R.A.L.; Penoni, E.D.S.; Pasqual, M.; Pereira, F.J.; de Castro, E.M. Anatomy of vegetative organs and seed histochemistry of Physalis peruviana L. Aust. J. Crop Sci. 2014, 8, 895–900. [Google Scholar]
  43. R Core Team. R: A Language and Environment for Statistical Computing; R Foundation for Statistical Computing: Vienna, Austria, 2022. [Google Scholar]
  44. Silva, A.A.d.; Rubio, Z.C.C.; Linhares, P.C.A.; Silva, K.R.E.; Pimentel, G.V.; Marchiori, P.E.R. Genotypic variation of sugarcane for salinity tolerance: Morphological and physiological responses. Ciência e Agrotecnologia 2022, 46, e000122. [Google Scholar] [CrossRef]
  45. Ding, L.; Lu, Z.; Gao, L.; Guo, S.; Shen, Q. Is nitrogen a key determinant of water transport and photosynthesis in higher plants upon drought stress? Front. Plant Sci. 2018, 9, 1143. [Google Scholar] [CrossRef]
  46. Lima, W.; Calgaro, M.; Coelho, D.S.; dos Santos, D.B.; de Souza, M.A. Growth of sugar cane varieties under salinity. Rev. Ceres 2016, 63, 265–271. [Google Scholar]
  47. Taratima, W.; Ritmaha, T.; Jongrungklang, N.; Raso, S.; Maneerattanarungroj, P. Leaf anatomical responses to drought stress condition in hybrid sugarcane leaf (Saccharum officinarum ‘KK3’). Malaysian Appl. Biol. 2019, 48, 181–188. [Google Scholar]
  48. Haworth, M.; Killi, D.; Materassi, A.; Raschi, A.; Centritto, M. Impaired stomatal control is associated with reduced photosynthetic physiology in crop species grown at elevated [CO2]. Front. Plant Sci. 2016, 7, 1568. [Google Scholar] [CrossRef]
  49. Haworth, M.; Marino, G.; Materassi, A.; Raschi, A.; Scutt, C.P.; Centritto, M. The functional significance of the stomatal size to density relationship: Interaction with atmospheric [CO2] and role in plant physiological behaviour. Sci. Total Environ. 2023, 863, 160908. [Google Scholar] [CrossRef]
  50. Haworth, M.; Killi, D.; Materassi, A.; Raschi, A. Coordination of stomatal physiological behavior and morphology with carbon dioxide determines stomatal control. Am. J. Bot. 2015, 102, 677–688. [Google Scholar] [CrossRef]
  51. Daszkowska-Golec, A.; Szarejko, I. Open or close the gate—Stomata action under the control of phytohormones in drought stress conditions. Front. Plant Sci. 2013, 4, 138. [Google Scholar] [CrossRef] [PubMed]
  52. Driesen, E.; Van den Ende, W.; De Proft, M.; Saeys, W. Influence of environmental factors light, CO2, temperature, and relative humidity on stomatal opening and development: A review. Agronomy 2020, 10, 1975. [Google Scholar] [CrossRef]
  53. Drake, P.; Froend, R.; Franks, P. Smaller, Faster stomata: Scaling of stomatal size, rate of response, and stomatal conductance. J. Exp. Bot. 2013, 64, 495–505. [Google Scholar] [CrossRef] [PubMed]
  54. Wullschleger, S.D.; Tschaplinski, T.J.; Norby, R.J. Plant water relations at elevated CO2—Implications for water-limited environments. Plant Cell Environ. 2002, 25, 319–331. [Google Scholar] [CrossRef]
  55. Leakey, A.D.B.; Lau, J.A. Evolutionary context for understanding and manipulating plant responses to past, present and future atmospheric [CO2]. Philos. Trans. R. Soc. B: Biol. Sci. 2012, 367, 613–629. [Google Scholar] [CrossRef]
  56. Valliere, J. Tradeoffs between growth rate and water-use efficiency in seedlings of native perennials but not invasive annuals. Plant Ecol. 2019, 220, 361–369. [Google Scholar] [CrossRef]
  57. Smith, N.G.; Keenan, T.F. Mechanisms underlying leaf photosynthetic acclimation to warming and elevated CO2 as inferred from least-cost optimality theory. Glob. Chang. Biol. 2020, 26, 5202–5216. [Google Scholar] [CrossRef] [PubMed]
  58. Lopes, M.S.; Araus, J.L.; van Heerden, P.D.R.; Foyer, C.H. Enhancing drought tolerance in C4 crops. J. Exp. Bot. 2011, 62, 3135–3153. [Google Scholar] [CrossRef]
  59. Hatfield, J.L.; Dold, C. Water-Use Efficiency: Advances and challenges in a changing climate. Front. Plant Sci. 2019, 10, 103. [Google Scholar] [CrossRef]
  60. Silva, M.; Jifon, J.L.; da Silva, J.; dos Santos, C.M.; Sharma, V. Relationships between physiological traits and productivity of sugarcane in response to water deficit. J. Agric. Sci. 2014, 152, 104–118. [Google Scholar] [CrossRef]
  61. Flexas, J.; Ribas-Carbó, M.; Bota, J.; Galmés, J.; Henkle, M.; Martínez-Cañellas, S.; Medrano, H. Decreased rubisco activity during water stress is not induced by decreased relative water content but related to conditions of low stomatal conductance and chloroplast CO2 concentration. New Phytol. 2006, 172, 73–82. [Google Scholar] [CrossRef]
  62. Varone, L.; Ribas-Carbo, M.; Cardona, C.; Gallé, A.; Medrano, H.; Gratani, L.; Flexas, J. Stomatal and non-stomatal limitations to photosynthesis in seedlings and saplings of mediterranean species pre-conditioned and aged in nurseries: Different response to water stress. Environ. Exp. Bot. 2012, 75, 235–247. [Google Scholar] [CrossRef]
  63. Perlikowski, D.; Czyżniejewski, M.; Marczak, Ł.; Augustyniak, A.; Kosmala, A. Water deficit affects primary metabolism differently in two lolium multiflorum/festuca arundinacea introgression forms with a distinct capacity for photosynthesis and membrane regeneration. Front. Plant Sci. 2016, 7, 1063. [Google Scholar] [CrossRef] [PubMed]
  64. Xiong, D.; Yu, T.; Liu, X.; Li, Y.; Peng, S.; Huang, J. Heterogeneity of photosynthesis within leaves is associated with alteration of leaf structural features and leaf N content per leaf area in rice. Funct. Plant Biol. 2015, 42, 687–696. [Google Scholar] [CrossRef] [PubMed]
  65. Singh, K.K.; Ghosh, S. Regulation of glutamine synthetase isoforms in two differentially drought-tolerant rice (Oryza sativa L.) Cultivars under water deficit conditions. Plant Cell Rep. 2013, 32, 183–193. [Google Scholar] [CrossRef]
  66. Zhong, C.; Cao, X.; Hu, J.; Zhu, L.; Zhang, J.; Huang, J.; Jin, Q. Nitrogen metabolism in adaptation of photosynthesis to water stress in rice grown under different nitrogen levels. Front. Plant Sci. 2017, 8, 1079. [Google Scholar] [CrossRef]
  67. Singh, N.; Singh, D.; Singh, A. Biological seed priming mitigates the effects of water stress in sunflower seedlings. Physiol. Mol. Biol. Plants 2015, 21, 207–214. [Google Scholar] [CrossRef] [PubMed]
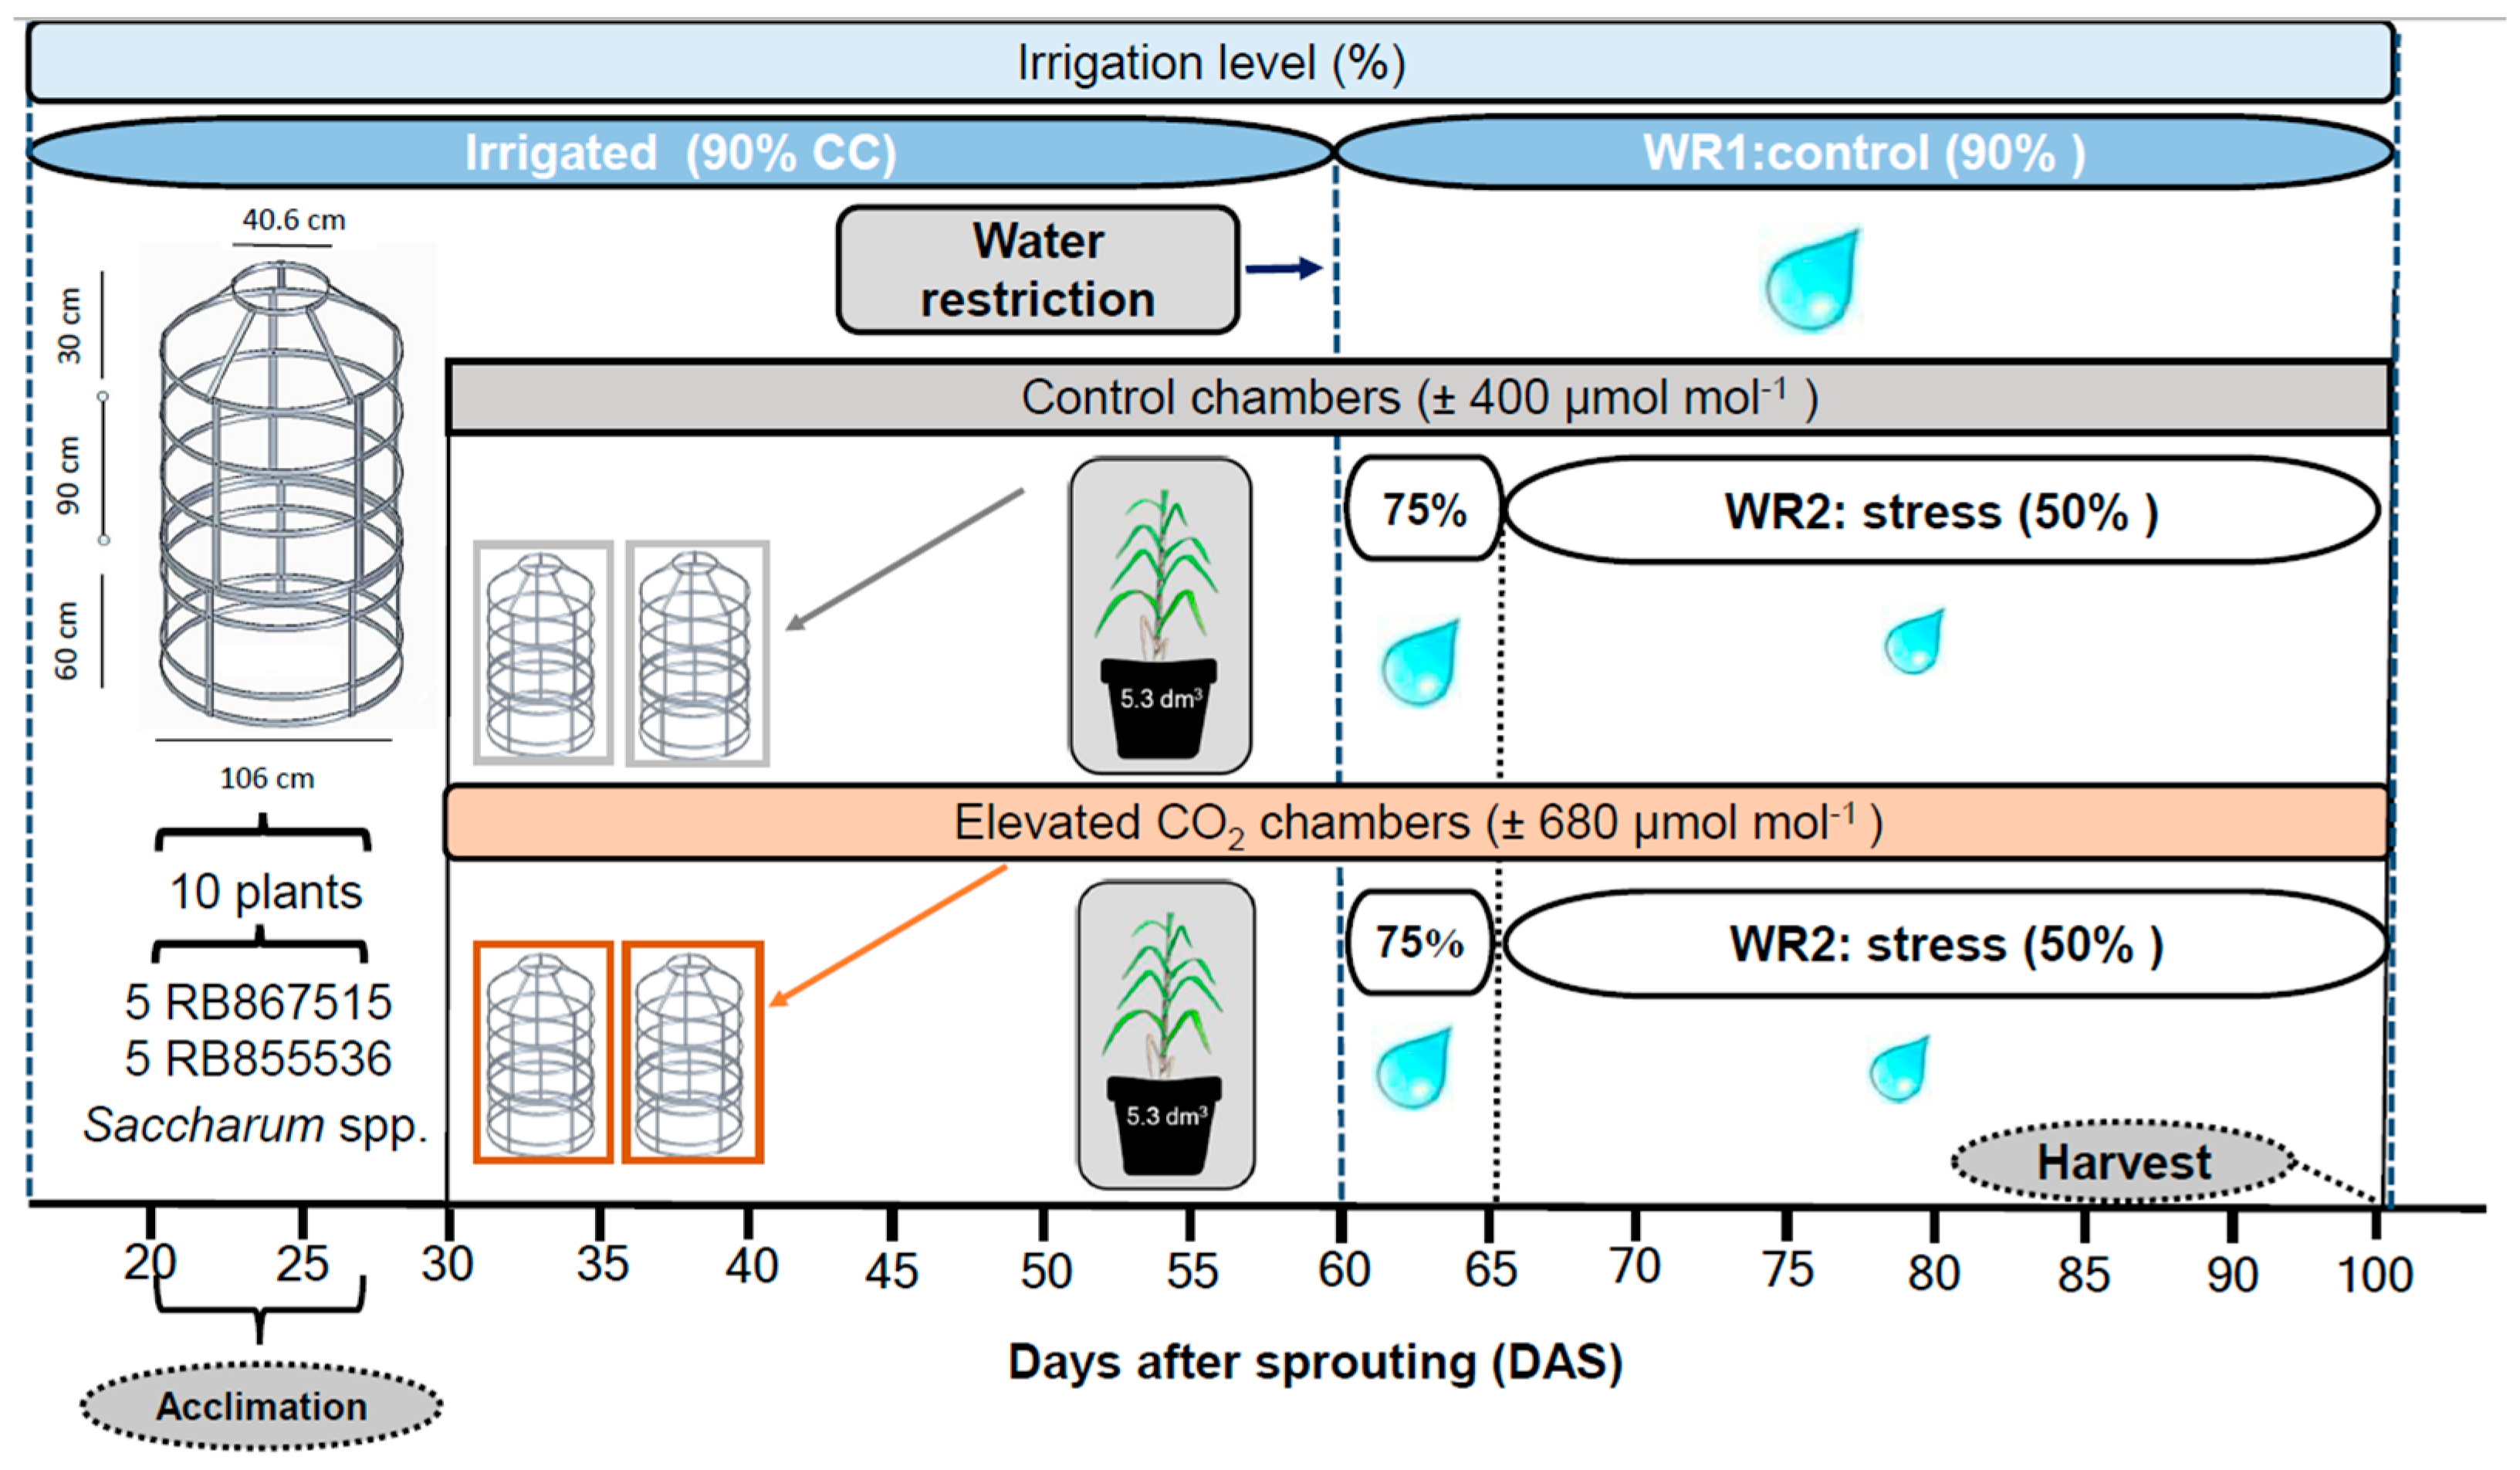
Figure 1. Experiment diagram of sugarcane plants grown under two CO2 concentrations and two water conditions. OTCs—open top chambers; WR—water regimes.
Agronomy 15 00726 g001
Figure 2. Observational PCA biplot in two sugar cane varieties. The PCA biplot shows the scores of the explanatory morphological variables as a vector (arrows in black lines) and individuals of each variety: RB855536 (blue circle), RB867515 (yellow circle); the colored ellipses (size determined by a probability level of 0.95) emphasize the individuals belonging to each variety. TB: total biomass (g); PH: plant height (cm); SD: stem diameter (mm); LA: leaf area (cm2); R_S: root:shoot ratio.
Agronomy 15 00726 g002
Figure 3. Observational PCA biplot in two sugar cane varieties. The PCA biplot shows the scores of the explanatory physiological variables as a vector (arrows in black lines) and individuals of each variety, RB855536 (blue circle), RB867515 (yellow circle), the colored ellipses (size determined by a probability level of 0.95) emphasize the individuals belonging to each variety. WUE: water use efficiency (mmol H2O µmol−1 CO2), PNmax: maximum photosynthesis (µmol CO2 m−2 s−1), Vcmax: maximum rate of Rubisco carboxylation (µmol CO2 m−2 s−1), Vpmax: maximum rate of PEPC carboxylation (µmol CO2 m−2 s−1), TON: total organic nitrogen (%), and C.N: organic carbon and organic nitrogen ratio.
Agronomy 15 00726 g003
Figure 4. Observational PCA biplot in two sugar cane varieties. The PCA biplot shows the scores of the explanatory anatomic variables as a vector (arrows in black lines) and individuals of each variety: RB855536 (blue circle), RB867515 (yellow circle), the colored ellipses (size determined by a probability level of 0.95) emphasize the individuals belonging to each variety. SD_AD: stomatal density in adaxial surface (stomata/mm2) SD_AB: stomatal density in abaxial surface (stomata/mm2), FUN_AD: stomatal functionality in adaxial surface, FUN_AB: stomatal functionality in abaxial surface, and CWT: cell wall thickness (μm).
Agronomy 15 00726 g004
Table 1. Initial chemical analysis of the substrate used for plant cultivation.
pH (KCl)KPNaCaMgAlH+ + AlZnFeMnCuBS
mg dm−3cmol dm−3mg dm−3
6.051.820.611.22.30.280.062.013.432.421.96.90.222.9
Table 2. Analysis of morphological variables of two varieties of sugarcane (Saccharum spp.) submitted to different concentrations of CO2 and drought. Different letters in rows indicate statistical differences for the interaction (Drought × (CO2)), according to the HSD test (p < 0.05). NS: no significant differences; *: significant differences (p < 0.05).
VarietyVariable400 μmol·mol−1680 μmol·mol−1F (p < 0.05)
ControlDroughtControlDroughtDrought(CO2)Drought × (CO2)
RB867515TB26.2 ± 1.2a19.7 ± 1.1b26.0 ± 1.7a22.3 ± 1.8ab*NS*
PH149.0 ± 3.1b146.6 ± 3.4b171.8 ± 2.8a143.2 ± 1.2b***
SD11.7 ± 0.3a10.6 ± 0.3a11.7 ± 0.7a11.6 ± 0.3aNSNSNS
LA43.9 ± 0.02b14.8 ± 0.01c53.1 ± 0.02a18.7 ± 0.01c***
R/S0.38 ± 0.3b0.53 ± 0.04a0.44 ± 0.05ab0.50 ± 0.02ab*NS*
RB855536TB23.6 ± 1.8a15.4 ± 1.8b23.7 ± 1.5a17.2 ± 2.7b*NS*
PH142.2 ± 5.5a134.2 ± 5.3a144.8 ± 4.1a134.4 ± 1.6a*NSNS
SD12.2 ± 0.6a9.6 ± 0.6b12 ± 0.3a9.9 ± 0.4b*NS*
LA43.7 ± 0.03a13.2 ± 0.01b42.9 ± 0.02a17.3 ± 0.01b*NS*
R/S0.43 ± 0.04a0.48 ± 0.05a0.48 ± 0.02a0.51 ± 0.02aNSNSNS
TB: total biomass (g), PH: plant height (cm), SD: stem diameter (mm), LA: leaf area (cm2), and R/S: root:shoot ratio.
Table 3. Analysis of physiological variables of two varieties of sugarcane (Saccharum spp.) submitted to different concentrations of CO2 and water stress. Different letters in rows indicate statistical differences for the interaction (Drought × (CO2)), according to the HSD test (p < 0.05). NS: no significant differences; *: significant differences (p < 0.05).
VarietyVariable400 μmol·mol−1680 μmol·mol−1 F (p < 0.05)
ControlDroughtControlDroughtDrought(CO2)Drought × (CO2)
RB867515RWC85.5 ± 2.4a78.7 ± 1.9b82.5 ± 1.7ab84.4 ± 1.4abNSNS*
WUE6.9 ± 0.6b7.6 ± 0.7b11.2 ± 0.6a12.9 ± 0.3aNS**
PNmax15.3 ± 0.2a10.6 ± 0.5b14.6 ± 0.6a6.4 ± 1.1c**
Vcmax23.3 ± 1.1a12.0 ± 1.4b21.1 ± 1.1a8.5 ± 0.7b***
Vpmax0.3 ± 0.03a0.28 ± 0.005a0.24 ± 0.02a0.18 ± 0.03aNSNSNS
TON0.56 ± 0.01ab0.57 ± 0.05a0.58 ± 0.01a0.44 ± 0.05b*NS*
C/N69.8 ± 1.8b72.3 ± 7.1b69.8 ± 1.9b91.4 ± 1.4a***
RB855536RWC81.1 ± 2.7ab72.1 ± 2.9b86.4 ± 2.7a77.3 ± 3.3ab*NS*
WUE6.3 ± 0.5b9.2 ± 0.4b12.8 ± 0.4b23.1 ± 3.1a***
PNmax16.7 ± 0.4a11.1 ± 0.8b16.5 ± 0.5a11.1 ± 1.4b*NS*
Vcmax21.6 ± 0.4a13.5 ± 0.7b20.2 ± 0.6a9.9 ± 0.1c***
Vpmax0.32 ± 0.02a0.17 ± 0.03b0.14 ± 0.05b0.15 ± 0.05b***
TON0.54 ± 0.08c0.88 ± 0.02a0.62 ± 0.08b0.50 ± 0.08c***
C/N73.5 ± 1.1b45.6 ± 0.9d63.5 ± 0.8c80.0 ± 1.6a***
RWC: relative water content (%), WUE: water use efficiency (mmol H2O µmol−1 CO2), PNmax: maximum photosynthesis (µmol CO2 m−2 s−1), Vcmax: maximum rate of Rubisco carboxylation (µmol CO2 m−2 s−1), Vpmax: maximum rate of PEPC carboxylation (µmol CO2 m−2 s−1), TON: total organic nitrogen (%), and C/N: organic carbon and organic nitrogen ratio.
Table 4. Analysis of anatomic variables of two varieties of sugarcane (Saccharum spp.) submitted to different concentrations of CO2 and water stress. Different letters in rows indicate statistical differences for the interaction (drought × (CO2)), according to the HSD test (p < 0.05). NS: no significant differences; *: significant differences (p < 0.05).
VarietyVariable400 μmol·mol−1 680 μmol·mol−1 F (p < 0.05)
ControlDroughtControlDroughtDrought(CO2)Drought X (CO2)
RB867515SD_AD115.4 ± 1.6a109.1 ± 4.2a86.9 ± 4.1b120.9 ± 5.4a*NS*
FUN_AD3.6 ± 0.08a3.7 ± 0.1a3.6 ± 0.09a3.5 ± 0.2aNSNSNS
SD_AB55.4 ± 0.9b62.2 ± 3.1ab50.1 ± 3.72c71.3 ± 4.6a*NS*
FUN_AB3.4 ± 0.1a3.5 ± 0.08a3.3 ± 0.2a3.2 ± 0.1aNSNSNS
CWT2.6 ± 0.1a2.2 ± 0.05b2.5 ± 0.09ab2.5 ± 0.06ab*NS*
RB855536SD_AD137.4 ± 2.4a98.4 ± 3.6b99.4 ± 5.2b84.7 ± 7.2b***
FUN_AD3.4 ± 0.08a3.5 ± 0.2a3.5 ± 0.07a3.8 ± 0.4aNSNSNS
SD_AB61.9 ± 3.9a53.5 ± 2.9ab41.7 ± 1.4b43.6 ± 3.1bNS**
FUN_AB3.4 ± 0.1a3.5 ± 0.2a3.6 ± 0.2a3.9 ± 0.3aNSNSNS
CWT3.2 ± 0.08a3.2 ± 0.1a3.0 ± 0.1a2.3 ± 0.09bNS**
SD_AD: Stomatal density in adaxial surface (stomata/mm2); FUN_AD: stomatal functionality in adaxial surface; SD_AB: stomatal density in abaxial surface (stomata/mm2); FUN_AB: stomatal functionality in abaxial surface; CWT: cell wall thickness (μm).
Disclaimer/Publisher’s Note: The statements, opinions and data contained in all publications are solely those of the individual author(s) and contributor(s) and not of MDPI and/or the editor(s). MDPI and/or the editor(s) disclaim responsibility for any injury to people or property resulting from any ideas, methods, instructions or products referred to in the content.