Article

Medicago Pasture Soil C:N:P Stoichiometry Mediated by N Fertilization in Northern China

1
State Key Laboratory of Efficient Utilization of Arable Land in China, The Institute of Agricultural Resources and Regional Planning, Chinese Academy of Agricultural Sciences, Beijing 100081, China
2
Hulunber Grassland Ecosystem National Observation and Research Station, The Institute of Agricultural Resources and Regional Planning, Chinese Academy of Agricultural Sciences, Beijing 100081, China
3
College of Resources and Environment, Qingdao Agricultural University, Qingdao 266109, China
4
Foreign Studies College, Northeastern University, Shenyang 110057, China
5
Hulunber Research Institute of Forestry and Grassland Science, Hulunber 021000, China
6
Hulunber Agricultural Reclamation Group Co., Ltd., Hulunber 021000, China
*
Authors to whom correspondence should be addressed.
Agronomy 2025, 15(3), 724; https://doi.org/10.3390/agronomy15030724
Submission received: 17 February 2025 / Revised: 12 March 2025 / Accepted: 13 March 2025 / Published: 17 March 2025
(This article belongs to the Section Grassland and Pasture Science)

Abstract

:
The degradation of black soil cropland has occurred to varying degrees in the northern agropastoral ecotone. Crop–forage rotation is an effective way to improve soil quality, with Medicago being the preferred perennial legume. The C, N, and P stoichiometric ratios are key indicators of soil quality and organic matter composition, reflecting the status of the internal C, N, and P cycles in soil. This study aims to investigate the ecological stoichiometric ratios of Medicago grassland soils with different planting durations, explore the regulatory effects of nitrogen fertilizer on soil organic carbon (SOC), total nitrogen (TN), and total phosphorus (TP) content, and assess the impacts of these changes on the Medicago grassland ecosystem. This study was conducted on the long-term cultivated grassland core experimental platform of the Hulunber National Field Station. Based on forage yield and soil nutrient measurements, field-based observations and laboratory analyses were carried out. Medicago × varia was the study subject, with different nitrogen fertilizer treatments: CK (0 kg N ha−1), N75 (75 kg N ha−1), and N150 (150 kg N ha−1). A randomized block design was adopted. Variance analysis, boxplot statistics, and scatterplot fitting methods were used to examine soil properties and assess the effects of nitrogen application on the C, N, and P stoichiometry of soils in established perennial Medicago grasslands. The results indicate that, based on the growth characteristics of alfalfa, soil nutrient dynamics, and its effectiveness in improving soil quality, the optimal rotation period for alfalfa in the northern agropastoral ecotone is 4–5 years, but it can also be shortened to 3 years. Soil carbon, nitrogen, and phosphorus contents are significantly influenced by the planting duration. As the planting years increase, soil carbon and nitrogen contents first increase and then decrease, while soil phosphorus content initially decreases followed by a slight increase. Soil pH gradually rises with both planting years and soil depth. Both low and high levels of nitrogen fertilizer application reduce soil organic carbon concentration (by 0.40% and 10.14%, respectively). Low nitrogen fertilizer application increases soil nitrogen concentration (by 1.50%), whereas high nitrogen fertilizer application decreases it (by 7.6%). Both nitrogen levels increase soil phosphorus concentration (by 36.67% and 35.26%, respectively). For soil from an alfalfa grassland planted for 8 years, the carbon-to-nitrogen ratio ranges from 9.08 to 9.76, the carbon-to-phosphorus ratio from 13.00 to 151.32, and the nitrogen-to-phosphorus ratio from 1.65 to 17.14. In summary, alfalfa yield is primarily influenced by the nitrogen fertilizer application rate, planting duration, stoichiometric ratios, and pH. Nitrogen fertilizer application has a positive regulatory effect on soil stoichiometric ratios. The annual yield can reach 8.94 to 10.07 tons per hectare., but phosphorus remains a limiting factor. These findings provide crucial data for understanding the impact of ecological stoichiometry on crop–forage rotation cycles, as well as optimal land use and quality improvement.

1. Introduction

The northern agropastoral ecotone is a semi-arid ecological transition zone in China, characterized by both agricultural and pastoral land use [1]. This region is also a critical area where traditional farming is transitioning to animal husbandry. In recent years, nearly 90% of China’s natural grasslands have been threatened by degradation [2], largely due to climate change and human activities. High-yield and high-quality cultivated grasslands can alleviate grazing pressure on natural grasslands, and crop–forage rotation plays a key role in improving soil quality on medium- and low-yield fields [3,4]. The soil carbon–nitrogen–phosphorus (C-N-P) stoichiometric ratio is an important parameter for assessing the balance of these elements in soil and serves as a primary indicator of the internal carbon–nitrogen–phosphorus cycle [5]. This ratio also reflects nutrient limitations within the soil [6].
  • Previous Research Progress
Both domestic and international studies have explored soil quality changes in various ecosystems, including forests, grasslands, and farmlands, using soil stoichiometry [7,8,9]. In the context of cultivated grasslands, research has primarily focused on the effects of fertilization on forage nutrient content, ecological stoichiometric characteristics [1,10,11], soil nutrients, enzyme activity [12,13], and microbial diversity [14]. Studies have also examined the relationship between plant growth, biomass allocation, and soil stoichiometric ratios across different temporal and spatial scales [15].
  • Research Entry Point
Most prior research has concentrated on how nitrogen fertilization affects plants and soil nutrients. However, fewer studies have analyzed the regulatory mechanisms of nitrogen application in the plant–soil grassland system using stoichiometry. More attention has been given to the relationship between the chemical stoichiometric characteristics of plants and their yields under fertilization and irrigation in major food crops [16]. The effects of carbon–nitrogen–phosphorus content, accumulation, distribution ratios, stoichiometric ratios, and nitrogen–phosphorus nutrient limitation have also been studied, along with the spatial variability in soil C-N-P stoichiometric characteristics [17]. This study focuses on Medicago as a perennial leguminous forage, analyzing the effects of fertilization on the C, N, and P stoichiometric characteristics of both plants and soil over different planting durations. The goal is to reveal the processes and patterns of C, N, and P exchange between plants and soil over time.
  • Key Issues to be Solved
This study aims to address several key issues: The impact of fertilization on Medicago biomass and soil nutrients, determining the optimal utilization period for Medicago based on production performance and soil nutrient stoichiometric ratios, and exploring the distribution patterns of soil C, N, and P in Medicago grassland soils.

2. Materials and Methods

2.1. Overview of the Experimental Site

The experiment was conducted at the Hulunber National Field Station, which serves as a long-term cultivated grassland core experimental platform (49°6′–49°32′ N, 119°32′–120°35′ E). The region experiences a mid-temperate semi-arid continental climate, with an average annual temperature of −2.4 °C and annual precipitation averaging 350 mm (Figure 1). The soil type is predominantly Kastanozems. The specific soil indicators are detailed in Table 1. Medicago varia, a highly adaptable, high-yielding, and palatable forage, was selected for this study. Experimental plots measured 7 m × 10 m, and the land was mechanically tilled before seeding. Seeds were sown in rows with a spacing of 20 cm, at a seeding rate of 0.015 t ha−1. Three nitrogen fertilization levels were applied: 0 kg N ha−1 (CK), 75 kg N ha−1 (N75), and 150 kg N ha−1 (N150). Urea (chemically pure) was used as the nitrogen fertilizer, applied once annually after the first cutting. Since the main objective of this experiment was to investigate the effects of nitrogen addition and forage type, no treatments involving phosphorus (P) and potassium (K) were conducted. Therefore, only nitrogen fertilizer was applied, without the addition of other nutrients such as potassium oxide (K2O) and phosphorus pentoxide (P2O5), and no topdressing was performed. A randomized block design was employed with four replicates.

2.2. Soil Sample Collection and Analysis

2.2.1. Soil Sample Collection

Soil samples were collected annually from 2016 to 2023 in mid-June. Before the mowing began, the alfalfa was in the early flowering stage, and the local rainfall was relatively low, making it an ideal time to collect soil samples with minimal interference. Samples were taken from the 0–10 cm, 10–20 cm, 20–40 cm, and 40–60 cm soil layers using the 5-point method. After natural air drying, the soil was mechanically ground and passed through a 2 mm sieve, then stored in self-sealing bags.

2.2.2. Soil Sample Detection

Organic Carbon: Determined using the external heating method with potassium dichromate [18].
Total Nitrogen: Measured using the H2SO4-H2O2 digestion–Kjeldahl nitrogen determination method [19].
Total Phosphorus (TP): Measured using the H2SO4-H2O2 digestion–molybdenum antimony resistance colorimetry method [20].
pH: Measured using a pH potentiometer [21].

2.2.3. Above- and Below-Ground Biomass Sampling

Above-Ground Biomass: The biomass was harvested twice a year. The first harvest takes place in late June, when the alfalfa is at the bud to early flowering stage. The second harvest occurs in late August, when the alfalfa is in the flowering to pod formation stage. Yield measurements are conducted concurrently during each harvest. In the first year of planting, only one measurement was taken in late August. To avoid edge effects, side rows were excluded. For each plot, three random sample squares of 100 cm × 100 cm were selected for mowing, leaving a stubble height of 8 cm. All samples were brought to the laboratory, weighed for fresh weight, placed in envelope bags, and then dried in an oven at 105 °C for 20 min, followed by 75 °C drying for 48 h to obtain dry weight.
Root Biomass: Collected in late August each year. The entire below-ground biomass within a 30 cm × 30 cm × 30 cm area was collected from each plot, placed in sieve bags, and washed to remove the soil attached to the roots. The samples were then dried at 65 °C for 48 h and weighed to obtain dry weight.

2.3. Data Processing and Methods

Data were processed using Excel 2019, and variance analysis was conducted using SPSS 27.0.1 software (p < 0.05). Maps were generated with Origin 2024.

3. Results Analysis

3.1. Medicago Yield

3.1.1. Above-Ground Biomass

The results (Table 2) show that nitrogen fertilization significantly impacts Medicago yield. As nitrogen fertilizer application increases, the yield tends to increase as well, with the average yield ranging between 8.94 and 10.07 t ha−1. Planting years significantly influence yield (p < 0.05), with an overall trend of yield increasing initially and then decreasing. After five years of establishment, the N150 treatment yielded the highest amount, reaching 14.15 t ha−1, which was 14.41% and 9.10% higher than the N75 and CK treatments, respectively.

3.1.2. Root Biomass

The results (Table 3) indicate that nitrogen fertilization has an effect on below-ground biomass, though it is not statistically significant. As nitrogen fertilizer increases from 0 to 150 kg N ha−1, and the average below-ground biomass first increases and then decreases. The N75 treatment produced the highest average below-ground biomass, reaching 6.54 t ha−1, which was 11.57% and 12.71% higher than the CK and N150 treatments, respectively. Planting years significantly affect biomass yield (p < 0.05), with a general trend of increasing and then decreasing biomass. After four years of establishment, the N75 treatment had the highest average below-ground biomass, reaching 7.81 t ha−1, which was 11.30% and 14.68% higher than the CK and N150 treatments, respectively.

3.2. Soil pH

The research results show (Figure 2) that the soil pH exhibits changes with the extension of Medicago varia planting years. In the 0–10 cm and 10–20 cm layers, the pH follows a trend of increase–decrease–increase, peaking in the sixth year after establishment. In the 0–40 cm and 40–60 cm layers, the pH fluctuates more significantly, with an overall upward trend and peaks occurring during the 7th to 8th year of planting. Notably, the pH in deeper layers is generally higher than in surface layers.
Under varying nitrogen fertilization levels, the differences in pH changes become more pronounced. Overall, the soil pH under the N150 treatment is higher compared to other controls and treatments. In the 0–10 cm layer, the pH change patterns for the control and N150 treatments are similar. In the 10–40 cm layers, the pH change trends for the control and N75 treatments are also similar. In the 40–60 cm layer, the fluctuations among different treatments across years are larger.
When comparing all treatments, the pH change rate for the N75 treatment relative to the control ranges from −4.68% to 0.49%, while the pH change rate for the N150 treatment relative to the control ranges from −0.13% to 5.00%. This suggests that different nitrogen fertilization levels influence the direction of soil pH regulation differently.

3.3. Effects of Nitrogen Application on Soil Nutrients in Grassland Across Different Planting Years

3.3.1. Soil Organic Carbon

Under different nitrogen fertilization treatments, the overall trend of soil organic carbon (SOC) was similar: SOC content in surface soil was higher than in deeper layers. In the 0–10 cm and 0–20 cm layers, the SOC content followed an “M”-shaped pattern, with the highest values observed under the control and N75 treatments. In the 20–40 cm and 40–60 cm layers, the SOC content exhibited a multi-peak trend, with no significant differences observed between nitrogen fertilization levels.
The SOC content was also significantly influenced by the planting years of Medicago (p < 0.05), showing an initial increase followed by a decrease. In the third year of planting, SOC content reached its highest value, ranging from 17.39 g·kg−1 to 19.24 g·kg−1, and then followed a decreasing–increasing trend. Another peak was observed in the eighth year of planting.
When comparing all treatments, the SOC change rate for the N75 treatment relative to the control ranged from −2.59% to 0.96%, while the N150 treatment showed a change rate from −19.85% to 3.79% (Table 4).

3.3.2. Total Nitrogen

Under different fertilization treatments, the overall trend in soil total nitrogen content followed a similar pattern: as the soil depth increased, the total nitrogen content gradually decreased. The effect of Medicago planting years on total nitrogen was not significant (p > 0.05).
In the 0–10 cm and 10–20 cm layers, the total nitrogen content initially increased and then decreased. Specifically, in the second year of planting, the total nitrogen reached its highest value, ranging from 1.96 g·kg−1 to 2.24 g·kg−1, after which it began to decline. In the 20–40 cm and 40–60 cm layers, total nitrogen content exhibited a multi-peak trend.
When comparing treatments, the total nitrogen change rate for the N75 treatment relative to the control ranged from 1.06% to 2.28%, while the N150 treatment showed a change rate from −15.72% to 3.20%. The N75 treatment had a more positive effect on increasing soil nitrogen content (Table 5).

3.3.3. Total Phosphorus

Under different fertilization treatments, soil total phosphorus exhibited varying trends across the years. In the control treatment, total phosphorus content followed a “U”-shaped pattern, with a sharp decline during the second to fourth years of cultivation, followed by an upward trend from the fifth year, and then a steady increase. In the N75 and N150 treatments, soil total phosphorus showed a multi-peak pattern. In the third year of cultivation, the total phosphorus content reached its maximum value of 0.46 g·kg−1 and 0.44 g·kg−1, respectively.
For the same cultivation year, the total phosphorus content gradually decreased with increasing soil depth. The soil total phosphorus was significantly affected by the planting years of Medicago varia (p < 0.05) compared to the control treatment.
When comparing all treatments, the total phosphorus change rate for the N75 treatment relative to the control ranged from 28.00% to 40.00%, while for the N150 treatment, it ranged from 32.00% to 40.00% (Table 6).

3.4. Soil C:N:P Ratios

3.4.1. C:N Ratio

As shown in Table 7, the changes in the soil C:N ratio under different fertilization treatments followed a similar pattern, generally showing an “M”-shaped trend, with peaks occurring in the 3rd and 5th years of Medicago cultivation. Over the 8-year period, there were no significant differences in C:N ratios among different soil layers. The C:N values in the 0–10 cm, 10–20 cm, 20–40 cm, and 40–60 cm layers were 9.14–9.56, 9.08–9.450, 9.29–9.76, and 9.11–9.48, respectively. Among these, the highest C:N ratio was observed in the 20–40 cm layer.
When comparing treatments, the C:N change rate for the N75 treatment relative to the control ranged from −4.82% to −0.61%, while for the N150 treatment, it ranged from −4.41% to 2.62% (Table 7).

3.4.2. C:P Ratio

Under different fertilization treatments, significant changes in the soil C:P ratio were observed. In the control treatment, the largest variation in soil C:P occurred in the 0–20 cm topsoil layer, displaying a pronounced “pyramid” distribution pattern. The C:P ratio showed an upward trend during the first three years, followed by a sharp decline, and then a gradual increase starting in the sixth year. From the sixth to the eighth year, the C:P ratio fluctuated between 15.91 and 52.50.
For the fertilized treatments, no significant differences were found among the treatments, and the change trends were generally similar, following an “M”-shaped pattern. The fluctuation range for soil C:P under these treatments was between 13.00 and 54.25 (Table 8).
When comparing treatments, the C:P change rate for the N75 treatment relative to the control ranged from −44.07% to −39.61%, while for the N150 treatment, it ranged from −52.54% to −44.71%.

3.4.3. N:P Ratio

Under different fertilization treatments, significant changes in the soil N:P ratio were observed. In the control treatment, the largest variation in soil N:P occurred in the top 0–10 cm layer. In the 10–20 cm layer, the ratio displayed a distinct “pyramid” distribution. After 1–2 years of cultivation, the N:P ratio increased, followed by a sharp decline, and then a gradual rise starting in the 5th year. In the 20–40 cm and 40–60 cm layers, the N:P ratio followed an “M”-shaped pattern. Over the 8-year cultivation period, the soil N:P values fluctuated between 1.65 and 17.14.
Under the different fertilization treatments, there were no significant differences among the treatments, and the trends remained largely similar, with a multi-peak pattern observed. The fluctuation range of soil N:P values was between 1.91 and 5.36 (Table 9).
Comparing the treatments, the N:P change rate for the N75 treatment relative to the control ranged from −42.08% to −38.25%, while for the N150 treatment, it ranged from −49.77% to −41.58% (Table 9).

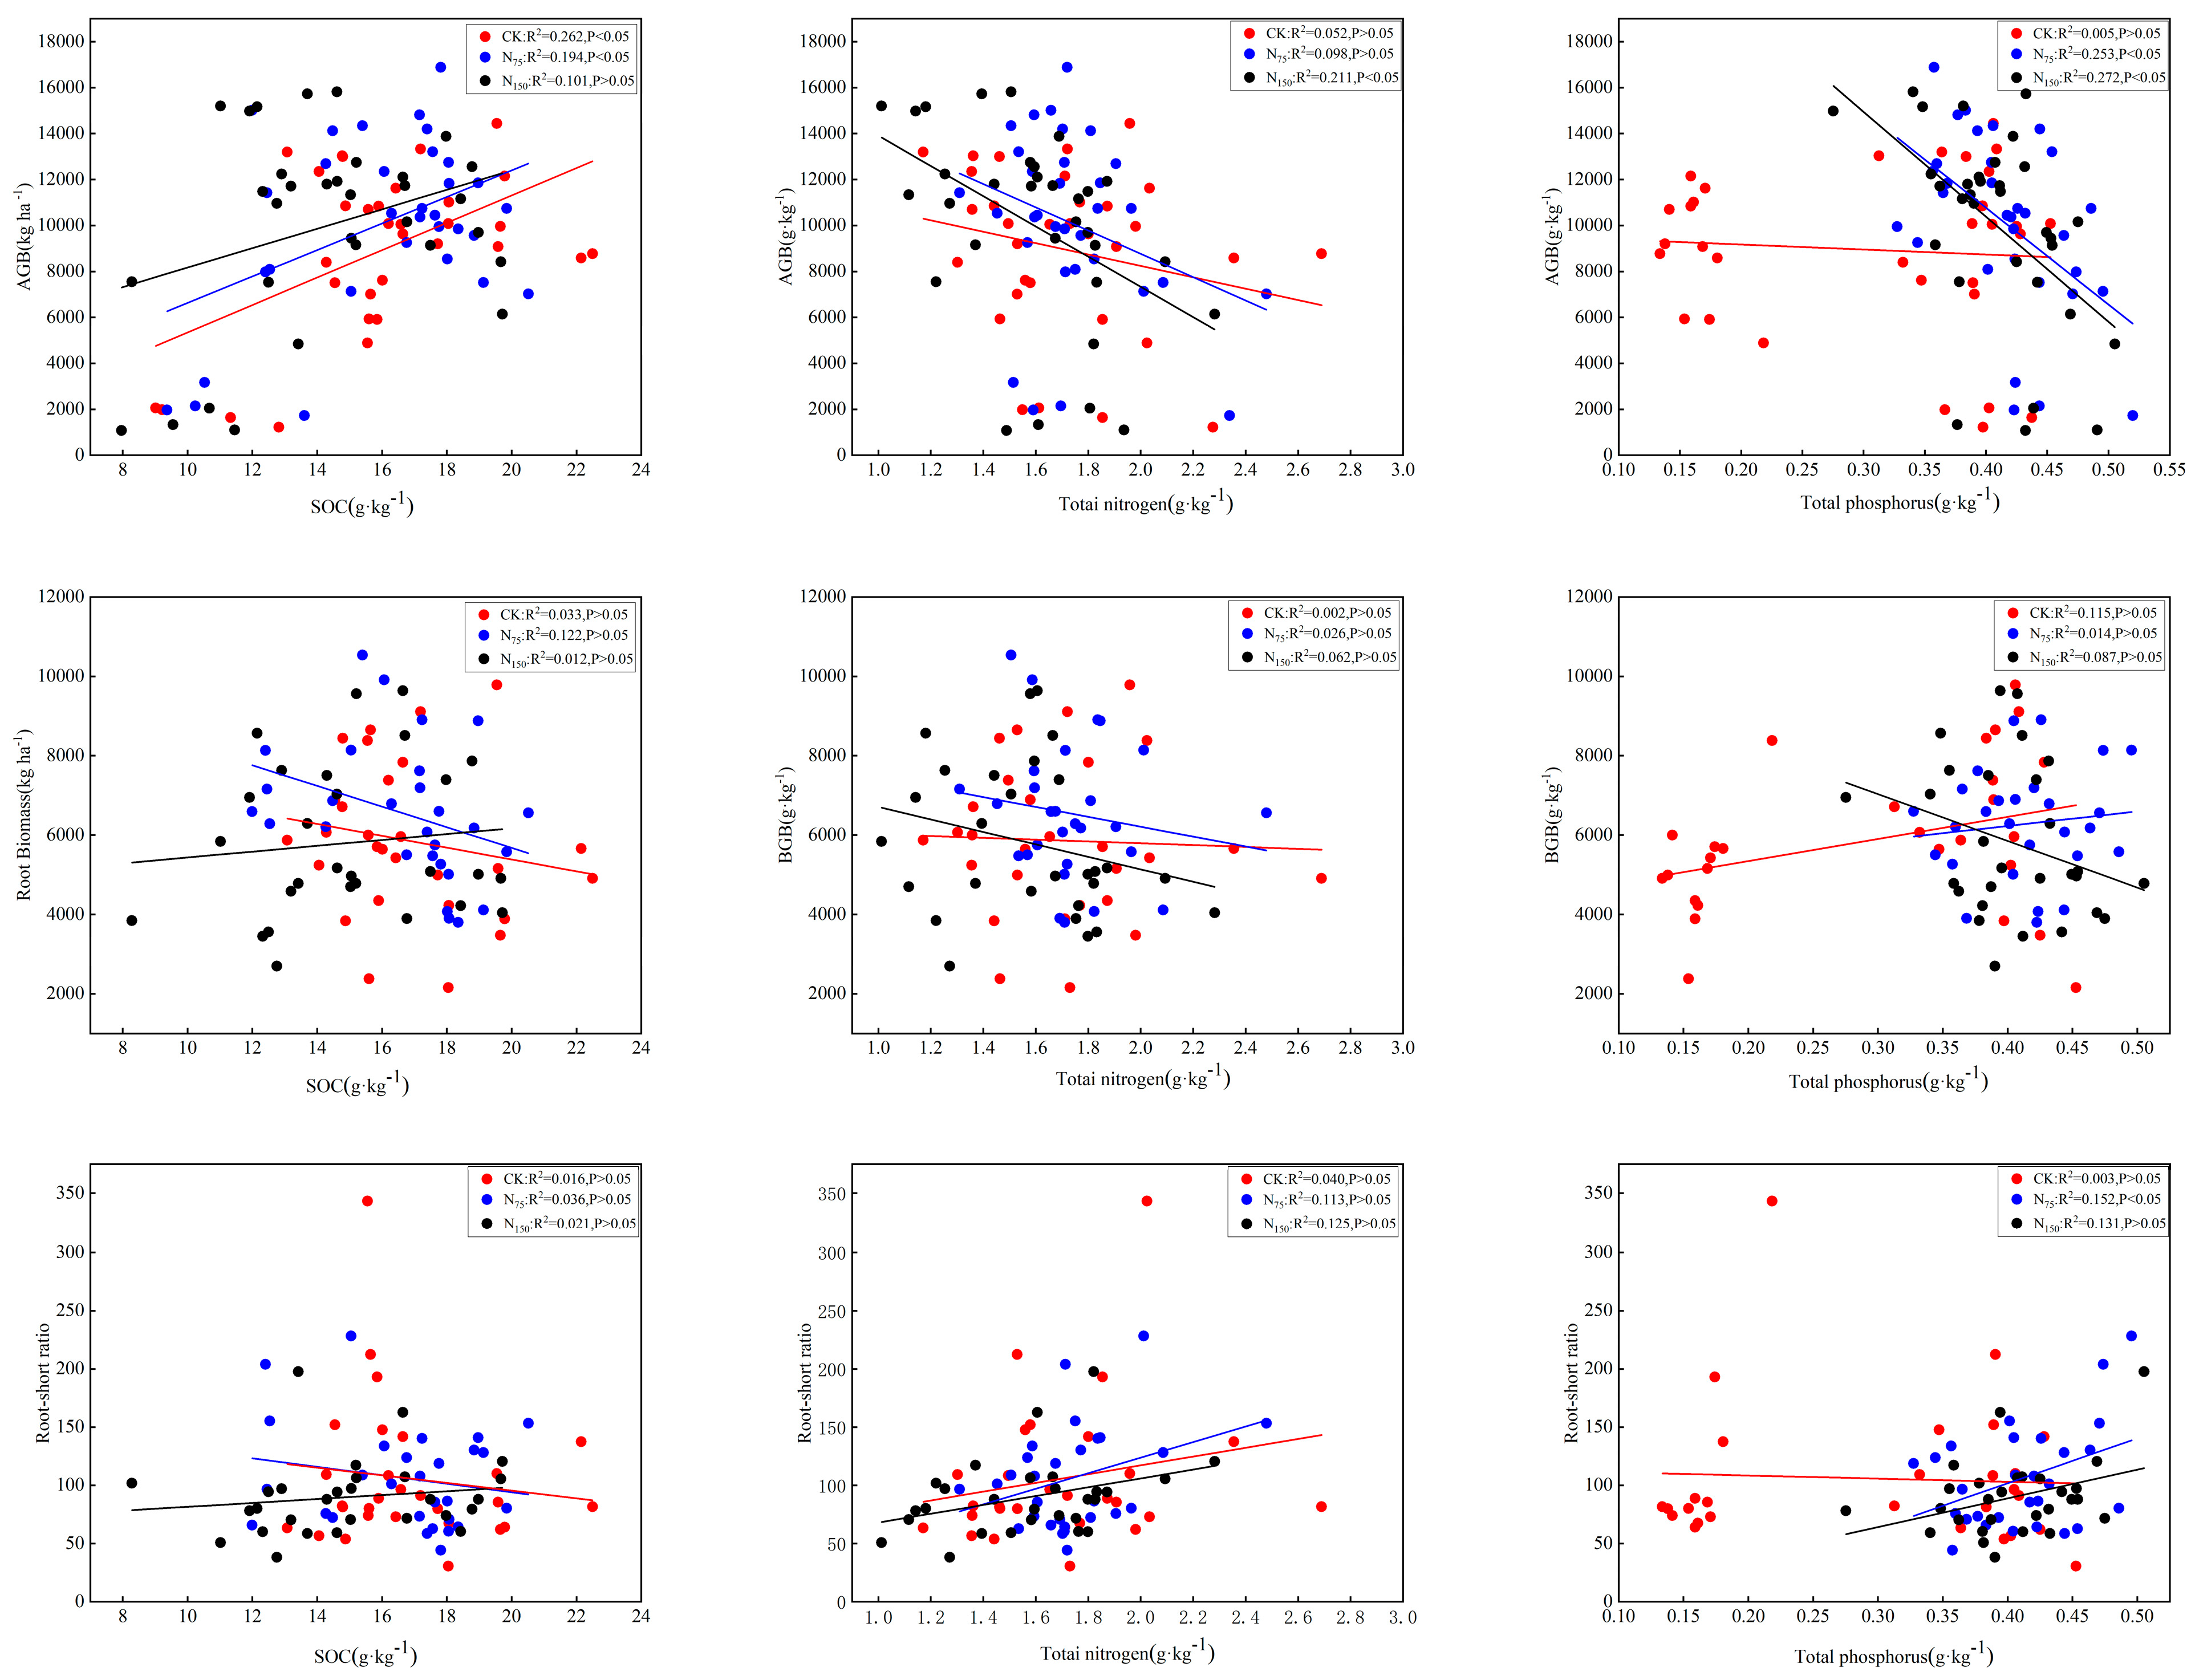
3.5. Relationships Between N Fertilization and Medicago Biomass

This study analyzed the effects of fertilization on the biomass of Medicago varia and soil nutrients. After 8 years of establishment, the relationships between above-ground biomass and soil nutrients varied across treatments:
In the CK treatment, the above-ground biomass was negatively correlated with soil C and N (p < 0.05), but positively correlated with P. Additionally, it was positively correlated with C:N and C:P, and negatively correlated with N:P. In the N75 treatment, the above-ground biomass was negatively correlated with soil C, N, and P, but positively correlated with C:N, C:P, and N:P. In the N150 treatment, the above-ground biomass was positively correlated with soil C and negatively correlated with N and P. It was also positively correlated with C:N and C:P and negatively correlated with N:P (Figure 3 and Figure 4).
As shown in Figure 3 and Figure 4, the underground biomass in the CK treatment was positively correlated with soil C (p < 0.05) and negatively correlated with soil N and P. Additionally, it showed a negative correlation with C:N, C:P, and N:P. In the N75 treatment, underground biomass was positively correlated with soil C (p < 0.05) but negatively correlated with soil N and P. It was also negatively correlated with C:N, C:P, and N:P. In the N150 treatment, the underground biomass was positively correlated with soil C and negatively correlated with soil N and P. It also showed positive correlations with C:N and C:P and a negative correlation with N:P.
As shown in Figure 3 and Figure 4, the root–shoot ratio in the CK treatment was negatively correlated with soil C and positively correlated with soil N and P. It was also negatively correlated with C:N, C:P, and N:P. In the N75 treatment, the root–shoot ratio was negatively correlated with soil C and positively correlated with soil N and P (p < 0.05). It was negatively correlated with C:N and C:P and positively correlated with N:P. In the N150 treatment, the root–shoot ratio was positively correlated with soil C, N, and P (p < 0.05) and negatively correlated with C:N, but positively correlated with both C:P and N:P.

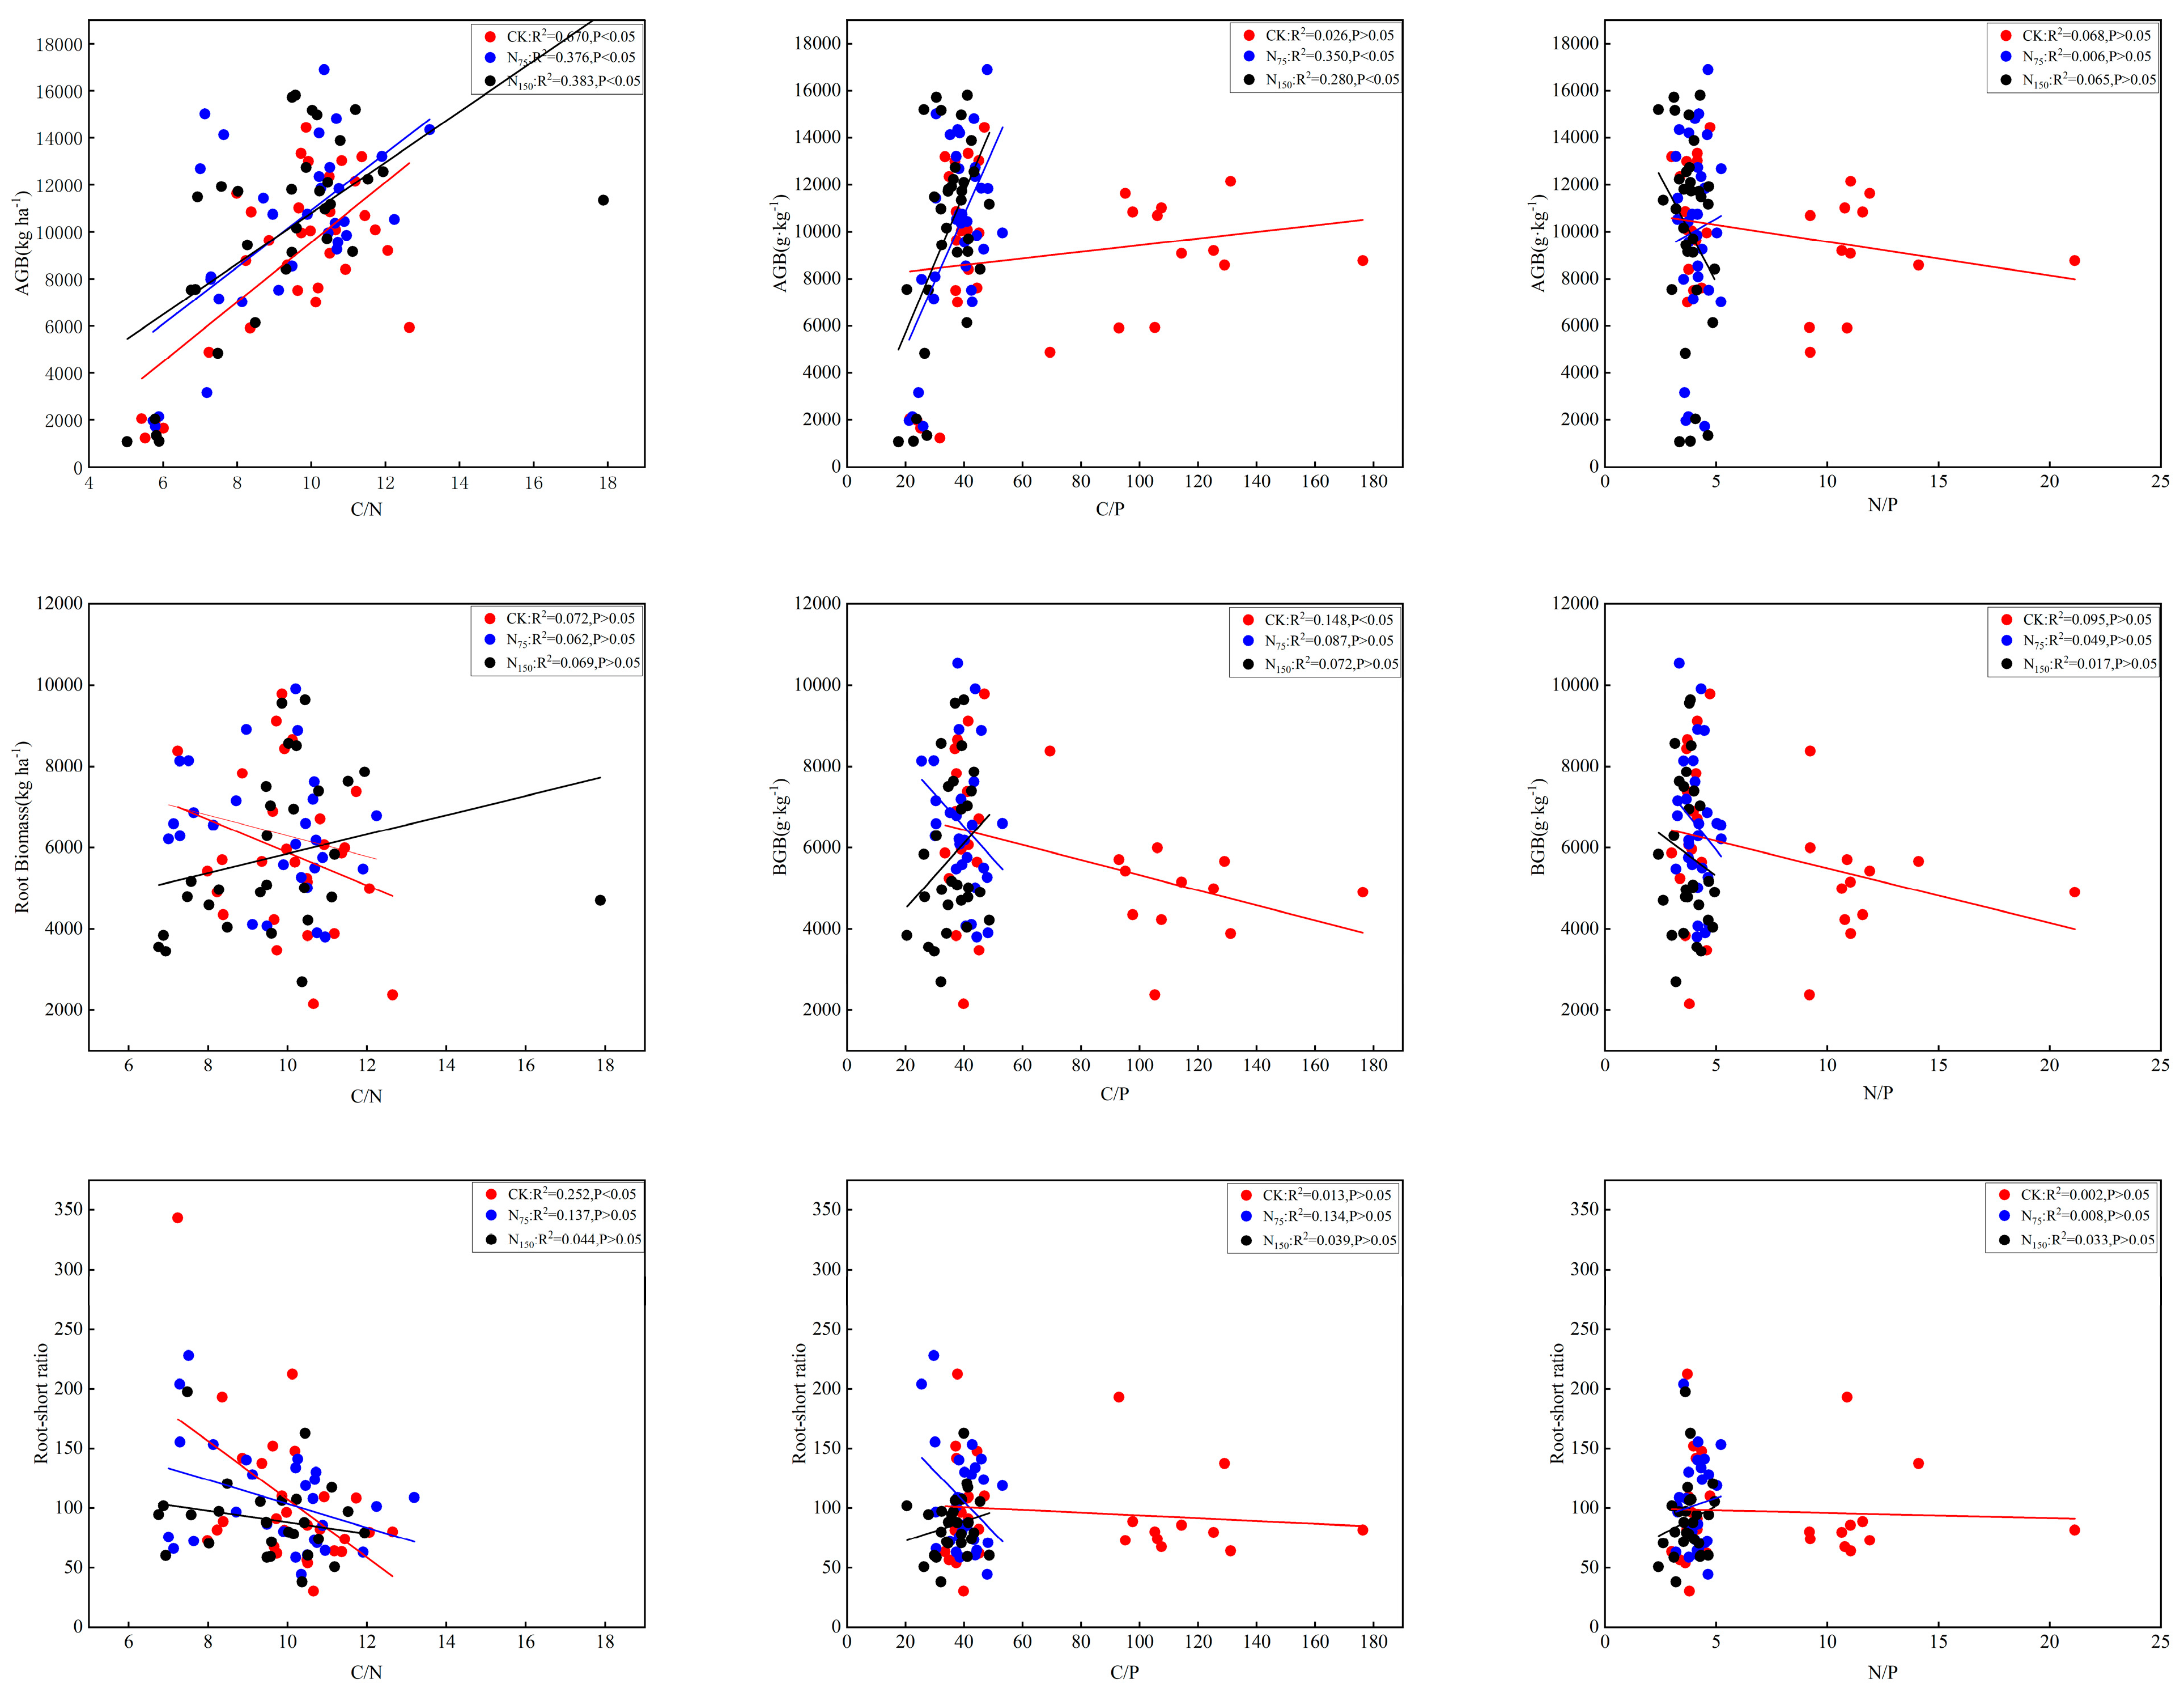
3.6. Relationships Between N Fertilization and Soil C:N:P Stoichiometry

As shown in Figure 5, the above-ground biomass of Medicago is significantly positively correlated with soil C:N, pH, and underground biomass, while it is significantly negatively correlated with C:P, N:P, and the root–shoot ratio.
The underground biomass is significantly positively correlated with year, C:N, and the root–shoot ratio and significantly negatively correlated with C:P and N:P.
The root–shoot ratio of Medicago is significantly negatively correlated with soil pH, C:N, and yield.
The redundancy analysis reveals the relationship between Medicago and soil C, N, and P stoichiometry. The results indicate that during the growth of Medicago, both above-ground and underground biomass are influenced by the nitrogen fertilizer application rate, year, C:N, C:P, N:P, pH, and the root–shoot ratio, with a combined explanatory value of 54.35%. Among these factors, the following applies:
Year, nitrogen fertilizer application rate, pH, and C:N have the greatest impact on yield.
Year, C:N, and the root–shoot ratio have the greatest impact on underground biomass.
Yield is significantly positively correlated with year, nitrogen fertilizer application rate, pH, and C:N and significantly negatively correlated with root–shoot ratio, C:P, and N:P.
Underground biomass is significantly positively correlated with year, C:N, and the root–shoot ratio and significantly negatively correlated with C:P and N:P.

4. Discussion

4.1. Effects of Soil C, N, P, and pH on Yield

The results indicate that in the Medicago grassland planted for 8 years, the planting duration significantly impacts the yield of Medicago (p < 0.05), with the yield showing an overall trend of increasing and then decreasing. After 4 years of establishment, the underground average biomass in the N75 treatment was the highest. This may be due to the accumulation and consumption of soil nutrients. As the planting duration increases, the nutrients in the soil are gradually absorbed and utilized by the plants. When soil nutrients become insufficient, plant growth is restricted. The nitrogen fertilizer treatment has an effect on underground biomass, though it is not statistically significant. When the nitrogen fertilizer application rate increases from 0 to 150 kg N ha−1, the mean underground biomass of Medicago first increases and then decreases, reaching its highest value under the N75 treatment. As the amount of fertilizer applied increases, the increase in plant biomass is relatively large; however, as the application rate continues to rise, the magnitude of biomass increase gradually diminishes, and even negative growth may occur. This is due to the limited capacity of the soil to absorb and convert nutrients, with excess nutrients being unable to be effectively utilized. In this study, the N75 treatment likely falls at or near the peak of the curve relating fertilizer application rate to biomass, resulting in the highest underground biomass of alfalfa at this fertilizer rate. These findings are consistent with previous research [22,23]. The appropriate addition of nitrogen fertilizer can promote plant growth, but excessive application may lead to nutrient waste and environmental pollution [24]. In this study, the N75 treatment appears to be the optimal nitrogen fertilizer application rate, as it increases underground biomass while avoiding excessive nutrient supply.
However, after 6–7 years of establishment, the yields of the CK, N75, and N150 treatments all began to decline, due to alfalfa degradation. With the increase in planting years, its botanical characteristics will decline significantly, mainly manifested as shorter plant height and decreased branch number. In addition, they are also affected by climate. The precipitation in the sixth year of establishment is mainly concentrated in July, while the precipitation in the first five years is mainly concentrated from August to September. The insufficient supply of nutrient elements in the soil is also the main reason for alfalfa degradation. Soil organic carbon not only influences the fertilizer supply performance of the soil but also indirectly affects and alters its physical properties [25]. Studies have shown [26,27] that plant litter is an important source of soil carbon in Medicago varia grassland. Soil organic carbon content increases with planting years, peaking at 3 years of establishment. This suggests that Medicago has a cumulative effect on soil organic carbon, improving soil structure and fertility. However, the decrease in soil organic carbon after 4 to 6 years of establishment may be due to the critical amounts of total nitrogen and total phosphorus required by alfalfa, which are 18.60 g per kilogram and 1.86 g per kilogram, respectively [28]. Due to the low initial contents of total nitrogen and total phosphorus in the soil at the experimental site, the total nitrogen and phosphorus levels in the soil remained below the critical values required for alfalfa growth even after fertilization. The degradation of Medicago germplasm and the decline in production performance have led to a decrease in the average coverage of Medicago, which in turn reduced the amount of litter returned to the soil. Additionally, the developed root system of Medicago promotes the decomposition of soil organic matter [29].
Soil total nitrogen content is a standard for measuring the nitrogen supply capacity of the soil. Increasing nitrogen fertilization can significantly enhance soil nitrogen content [30]. Changes in soil nitrogen content are strongly influenced by the nitrogen fixation ability of the rhizosphere soil of Medicago. Previous studies have found that nitrogen fixation in the rhizosphere soil of Medicago increases first and then decreases with the increase in planting years, peaking at year 3 [31]. This finding aligns with the results of the present study [29]. Phosphorus is important for stabilizing and enhancing the soil phosphorus pool [14]. In Medicago, phosphorus supports nitrogen fixation in the root nodules and serves as a structural component of key biochemical substances, including nucleic acids, coenzymes, nucleotides, phosphoproteins, phospholipids, and phosphate sugars [32]. As a crop that requires a large amount of phosphorus, the phosphorus content in the soil increases with planting years under fertilization. The reason for this may be that nitrogen fertilizer promotes the fixation and mineralization of phosphorus by soil microorganisms [33], which reduces the risk of phosphorus leaching and increases the total phosphorus content in the surface soil [12]. Additionally, plants prioritize the nutritional needs of their above-ground parts during growth [34], which leads to a certain degree of limitation on the growth and nutrient absorption of the below-ground parts. This may also explain why the contents of SOC and N decrease under fertilization treatments.
Studies have suggested that the ideal pH range for Medicago growth is between 6.0 and 8.0, as Medicago grows best in a neutral to slightly alkaline soil environment [35]. Long-term fertilization can lead to soil acidification [36]. In this study, as soil depth increased, the soil pH gradually rose, with the overall pH values exhibiting a trend of N150 > CK > N75 treatment, as shown in Section 3.2. Different fertilization treatments exhibited variability in their regulation of soil pH. This may be due to the application of more nitrogen fertilizer in the N150 treatment, leading to more intense nitrification in the surface soil, which generates more H+ ions and results in a lower pH. As the soil depth increases, the leaching of nitrate nitrogen carries away some H+ ions, causing the pH of deeper soil layers to be relatively higher. In the N75 treatment, less nitrogen fertilizer was applied, resulting in less H+ ion production from nitrification and a relatively higher pH in the surface soil. With increasing soil depth, the change in pH was less significant compared to the high-nitrogen treatment. The CK treatment, which did not receive nitrogen fertilizer, experienced minimal impact from nitrification on soil pH, resulting in a relatively gradual pH change [37]. Research has shown that the long-term cultivation of Medicago can increase organic carbon and nitrogen content in the soil, improving its fertility [38].

4.2. Soil C:N, C:P, and N:P Ratios Balance

The yield of Medicago is closely linked to the C:N, C:P, and N:P ratios in the soil. This study found that during the first four years of vigorous growth, the C:N ratio significantly increased. This increase may be due to Medicago absorbing large amounts of carbon from the soil during its early growth stages while simultaneously maintaining nitrogen levels in the soil through biological nitrogen fixation, leading to a higher C:N ratio. However, in the middle stages of growth (5–8 years), although soil organic carbon continued to increase, the efficiency of carbon sequestration decreased, and the C:N ratio began to decrease. This could be because, as the plant’s growth progresses, its root system expands, altering the absorption and utilization efficiency of soil nutrients, which in turn affects the soil C:N ratio.
At certain stages of this study, the soil C:P ratio exceeded 30, further indicating that phosphorus (P) has become one of the key limiting factors for the productivity of alfalfa during its growth process. This is because the main source of P in the soil is weathering with no atmospheric cycling [38], and as a result, the soil P content is heavily depleted without replenishment. Therefore, during the early establishment phase, the soil C:P and N:P ratios showed an increasing trend. However, as the alfalfa plants aged, entering the mid-stage of growth (5–8 years), they began to degrade, potentially weakening the root system’s ability to absorb P. Additionally, P in the soil may be increasingly competed for by other microorganisms or plants, leading to a relatively stable or slightly declining P content. Consequently, in the later stages of establishment, the C:P and N:P ratios gradually decreased.
Several studies have indicated [39,40] that during the long-term growth of plants, the C, N, and P elements in soil undergo a dynamic equilibrium process influenced by various factors such as plant root growth, microbial activity, and soil physicochemical properties. This process is crucial for maintaining the stability and productivity of soil ecosystems [41]. The global average C:N ratio in soil is 13.33, while the C:N ratio of organic matter in the topsoil layer of commonly cultivated soil in China ranges from 8:1 to 15:1 [42]. In this study, the average C:N ratio in the 0–60 cm soil layer ranged between 5.63 and 12.46, with a slightly narrower range attributed to inconsistent statistical depths. As the research results in Section 3.3.1 demonstrate, soil organic carbon content decreases significantly with increasing soil depth.
Therefore, during the cultivation of Medicago, it is important to manage planting years and systems effectively to maintain the balance of C:N, C:P, and N:P in the soil and improve soil ecosystem stability and productivity. Proper soil nutrient management, including reasonable fertilization and irrigation, should be implemented to supplement essential elements like C, N, and P, meeting the growth requirements of Medicago.

4.3. Biomass–C:N:P Relationships

This study found that during the eight-year establishment period, above-ground biomass showed a positive correlation with soil organic carbon (SOC) but a negative correlation with total nitrogen (TN) and total phosphorus (TP). Additionally, below-ground biomass and the root-to-shoot ratio exhibited a negative correlation with SOC under the control treatment (CK). This may be due to the contents of TN and TP in the soil being below the minimum growth requirements of alfalfa.
From a stoichiometric perspective, the changes in the C:N, C:P, and N:P ratios had a significant impact on the yield and growth of Medicago. Notably, the underground biomass of Medicago varia was significantly negatively correlated with both the soil C:P and N:P ratios. This suggests that as the biomass of the Medicago root system increases, it absorbs more phosphorus, which results in a decrease in the C:P and N:P ratios in the soil. Additionally, the N:P ratio in the plant body often reflects its growth rate [43]. In the early establishment stage, Medicago grows rapidly and absorbs phosphorus quickly, causing a marked depletion in soil phosphorus and a corresponding increase in the C:P and N:P ratios. However, as Medicago enters a stable growth phase (5–8 years), its growth rate slows, and its nutrient absorption declines, causing the C:P and N:P ratios to stabilize [41].
On the other hand, there was a positive correlation between the soil N:P ratio and the root–shoot ratio. During the early stages of growth, the rapid expansion of the root system increases the absorption and utilization of phosphorus, leading to an increase in the plant’s phosphorus content and a decrease in the soil N:P ratio. As the root system’s growth rate slows and its phosphorus absorption capacity decreases, the soil N:P ratio gradually stabilizes or slightly increases.
This study also found that during the first 4 years of vigorous Medicago growth, the C:N ratio significantly increased. However, by the mid-growth stage (5–8 years), although soil organic carbon continued to increase, the efficiency of soil carbon sequestration decreased, and the C:N ratio began to decrease. This could be due to changes in soil microbial biomass and activity as the planting period increased, which in turn affected the soil carbon–nitrogen ratio [44]. This change may also be linked to the dynamic balance of soil nutrients and the varying patterns of nutrient absorption and utilization by Medicago over time.

5. Conclusions

The interaction between plants and soil plays a vital role in shaping the processes and characteristics of various ecosystems. Ecological stoichiometry provides an effective framework for exploring the relationships among carbon (C), nitrogen (N), and phosphorus (P) in plants and soil, as well as the link between plant growth and nutrient supply.
The results of this study indicate that the above-ground and below-ground biomass of alfalfa reach their peak values 4–5 years after planting and then decline, suggesting an optimal utilization period of 4–5 years. However, for the purposes of crop rotation and soil improvement, this cycle can be shortened to 3 years, with an annual yield ranging from 8.94 to 10.07 t ha−1. The contents of soil C, N, and P are significantly influenced by the plant growth cycle. Specifically, soil C and N contents initially increase and then decrease over time, while soil P content initially decreases and then shows a slight increase. Soil pH gradually increases with both planting years and soil depth.
Under different treatment conditions, the soil C:N ratio ranges from 9.08 to 9.76, the C:P ratio from 13.00 to 151.32, and the N:P ratio from 1.65 to 17.14. Under N75 and N150 treatments, the change rates of C:N are −4.82% to −0.61% and −4.41% to 2.62%, respectively; the change rates of C:P are −44.07% to −39.61% and −52.54% to −44.71%, respectively; and the change rates of N:P are −42.08% to −38.25% and −49.77% to −41.58%, respectively.
Above-ground biomass is positively correlated with soil organic carbon C:N and C:P ratios, but negatively correlated with the N:P ratio. Root biomass is negatively correlated with total nitrogen (TN), C:P, and N:P ratios. The root-to-shoot ratio is positively correlated with TN and negatively correlated with the C:N ratio.
In summary, the growth of alfalfa is influenced by the nitrogen application rate, planting years, stoichiometric ratios, and soil pH. Fertilization significantly drives changes in soil CNP stoichiometry. In this study, both nitrogen and phosphorus availability were major limiting factors for alfalfa growth. Although nitrogen fertilizer is often given priority, it is recommended to address phosphorus limitation by increasing the application rate of nitrogen fertilizer or applying both nitrogen and phosphorus fertilizers simultaneously. This approach is an effective strategy for improving alfalfa biomass production.

Author Contributions

Conceptualization, B.Y., L.X. and X.L.; formal analysis, B.Y., J.W., M.C., H.Z., Y.N., M.G. and J.L.; investigation, B.Y., M.C., H.Z., Y.N., M.G. and J.L.; resources, L.X., X.L., M.G. and J.L.; data curation, B.Y., J.W., M.C., H.Z. and Y.N.; writing—original draft preparation, B.Y.; writing—review and editing, B.Y., J.W., M.C., H.Z., Y.N., M.G. and J.L.; investigation, B.Y., M.C., H.Z., Y.N., M.G. and J.L.; supervision, L.X. and X.L.; project administration, L.X., X.L., M.G. and J.L.; funding acquisition, L.X. All authors have read and agreed to the published version of the manuscript.

Funding

This study was funded by the National Natural Science Foundation of China, grant number 22378422; the National Nonprofit Institute Research Grant of CAAS, grant number G2024-01-14; and China Agriculture Research System, grant number CARS-34.

Data Availability Statement

The data presented in this study are available on request from the corresponding author due to that the data are derived from long-term experiments and will be used in ongoing studies.

Conflicts of Interest

Author Jinxia Li was employed by the company Hulunber Agricultural Reclamation Group Co., Ltd. The remaining authors declare that the research was conducted in the absence of any commercial or financial relationships that could be construed as potential conflicts of interest.

References

  1. Cuo, M.J.; Xu, L.J.; Yuan, B.; Nie, Y.Y.; Wei, J.Q. Pastureland Soil Organic Carbon Storage Regulated by Pasture Species and Age Under Nitrogen and Water Addition in Northern China. Agronomy 2025, 15, 399. [Google Scholar] [CrossRef]
  2. Nie, Y.Y.; Xu, L.J.; Xin, X.P.; Ye, L.M. Long-term grassland diversity-productivity relationship regulated by management regimes in northern China. Sci. Total Environ. 2024, 949, 175084. [Google Scholar] [CrossRef]
  3. Bi, Y.X.; Yang, G.W.; Wei, Y.Q.; Wilson, G.W.; Wei, B.; He, Y.J.; Yu, H.Q.; Liu, N.; Zhang, Y.J. Low legume-grass seeding ratio combined with phosphorus fertilization promotes forage yield and soil quality in managed grasslands. Agron. Sustain. Dev. 2024, 44, 36. [Google Scholar] [CrossRef]
  4. Yang, X.L.; Xiong, J.R.; Du, T.S.; Ju, X.T.; Gan, Y.T.; Li, S.; Xia, L.L.; Shen, Y.J.; Pacenka, S.; Steenhuis, T.S.; et al. Diversifying crop rotation increases food production, reduces net greenhouse gas emissions and improves soil health. Nat. Commun. 2004, 15, 198. [Google Scholar] [CrossRef]
  5. Xu, L.J.; Nie, Y.Y.; Chen, B.R.; Xin, X.P.; Yang, G.X.; Xu, D.W.; Ye, L.M. Effects of fence enclosure on vegetation community characteristics and productivity of a degraded temperate meadow steppe in northern China. Appl. Sci. 2020, 10, 2952. [Google Scholar] [CrossRef]
  6. Lu, J.; Tian, H.; Zhang, H.; Xiong, J.; Yang, H.; Liu, Y. Shoot-soil ecological stoichiometry of alfalfa under nitrogen and phosphorus fertilization in the Loess Plateau. Sci. Rep. 2021, 11, 15049. [Google Scholar] [CrossRef]
  7. Mencel, J.; Mocek-Plociniak, A.; Kryszak, A. Soil Microbial Community and Enzymatic Activity of Grasslands under Different Use Practices: A Review. Agronomy 2022, 12, 1136. [Google Scholar] [CrossRef]
  8. Wankmuller, F.J.P.; Delval, L.; Lehmann, P.; Baur, M.J.; Cecere, A.; Wolf, S.; Or, D.; Javaux, M.; Carminati, A. Global influence ofsoil texture on ecosystem water limitation. Nature 2024, 635, 631–638. [Google Scholar] [CrossRef]
  9. Sardans, J.; Penuelas, J. The Role of Plants in the Effects of Global Change on Nutrient Availability and Stoichiometry in the Plant-Soil System. Plant Physiol. 2012, 160, 1741–1761. [Google Scholar] [CrossRef]
  10. Zhao, F.Z.; Ren, C.J.; Han, X.H.; Yang, G.H.; Wang, J.; Doughty, R. Changes of soil microbial and enzyme activities are linked to soil C, N and p stoichiometry in afforested ecosystems. For. Ecol. Manag. 2018, 427, 289–295. [Google Scholar] [CrossRef]
  11. Huang, Y.P.; Wang, Q.Q.; Zhang, W.J.; Zhu, P.; Xiao, Q.; Wang, C.J.; Wu, L.; Tian, Y.F.; Xu, M.G.; Gunina, A. Stoichiometric imbalance of soil carbon and nutrients drives microbial community structure under long-term fertilization. Appl. Soil Ecol. 2021, 168, 104119. [Google Scholar] [CrossRef]
  12. Turner, B.L.; Lambers, H.; Condron, L.M.; Cramer, M.D.; Leake, J.R.; Richardson, A.E.; Smith, S.E. Soil microbial biomass and the fate of phosphorus during long-term ecosystem development. Plant Soil 2013, 367, 225–234. [Google Scholar] [CrossRef]
  13. Xu, L.J.; Li, D.; Wang, D.; Ye, L.M.; Nie, Y.Y.; Fang, H.J.; Xue, W.; Bai, C.L.; Ranst, E.V. Achieving the dual goals of biomass production and soil rehabilitation with sown pasture on marginal cropland: Evidence from a multi-year field experiment in Northeast Inner Mongolia. Front. Plant Sci. 2022, 13, 985864. [Google Scholar] [CrossRef]
  14. Chen, X.H.; Yan, X.J.; Wang, M.K.; Cai, Y.Y.; Weng, X.F.; Su, D.; Guo, J.X.; Wang, W.Q.; Hou, Y.; Ye, D.L.; et al. Long-term excessive phosphorus fertilization alters soil phosphorus fractions in the acidic soil of pomelo orchards. Soil Tillage Res. 2022, 215, 105214. [Google Scholar] [CrossRef]
  15. Xu, L.J.; Ye, L.M.; Nie, Y.Y.; Yang, G.X.; Xin, X.P.; Yuan, B.; Yang, X.F. Sown alfalfa pasture decreases grazing intensity while increasing soil carbon: Experimental observations and DNDC model predictions. Front. Plant Sci. 2022, 13, 1019966. [Google Scholar] [CrossRef] [PubMed]
  16. Poffenbarger, H.J.; Sawyer, J.E.; Barker, D.W.; Olk, D.C.; Six, J.; Castellano, M.J. Legacy effects of long-term nitrogen fertilizer application on the fate of nitrogen fertilizer inputs in continuous maize. Agric. Ecosyst. Environ. 2018, 265, 544–555. [Google Scholar] [CrossRef]
  17. Zheng, S.M.; Xia, Y.H.; Hu, Y.J.; Chen, X.B.; Rui, Y.C.; Gunina, A.; He, X.Y.; Ge, T.; Wu, J.H.; Su, Y.; et al. Stoichiometry of carbon, nitrogen, and phosphorus in soil: Effects of agricultural land use and climate at a continental scale. Soil Tillage Res. 2021, 209, 104903. [Google Scholar] [CrossRef]
  18. Ellert, B.H.; Janzen, H.H.; VandenBygaart, A.; Bremer, E. Measuring Change in Soil Organic Carbon Storage. In Soil Sampling and Methods of Analysis; Taylor Francis Group, LLC: Boca Raton, FL, USA, 2006. [Google Scholar]
  19. Nelson, D.W.; Sommers, L.E. Total Nitrogen Analysis of Soil and Plant Tissues. J. AOAC Int. 1980, 63, 770–778. [Google Scholar] [CrossRef]
  20. Zheng, Z.M.; Zhang, T.Q. Soil Phosphorus Tests and Transformation Analysis to Quantify Plant Availability: A Review. Soil Fertil. Improv. Integr. Nutr. Manag. A Glob. Perspect. 2012, 1, 19–36. [Google Scholar]
  21. Schofield, R.K.; Taylor, A.W. The Measurement of Soil pH. Soil Sci. Soc. Am. J. 1955, 19, 164. [Google Scholar] [CrossRef]
  22. Long, D.S.; McCallum, J.D.; Reardon, C.L.; Engel, R.E. Nitrogen Requirement to Change Protein Concentration of Spring Wheat in Semiarid Pacific Northwest. Agron. J. 2017, 3, 675–683. [Google Scholar] [CrossRef]
  23. Xu, L.J.; Cheng, S.L.; Fang, H.J.; Xin, X.P.; Xu, X.L.; Tang, H.J. Soil inorganic nitrogen composition and plant functional type determine forage crops nitrogen uptake preference in the temperate cultivated grassland, Inner Mongolia. Soil Sci. Plant Nutr. 2019, 65, 501–510. [Google Scholar] [CrossRef]
  24. Heichel, G.H.; Barnes, D.K.; Vance, C.P. Nitrogen fixation of alfalfa in the seeding year. Crop Sci. 1981, 21, 330–335. [Google Scholar] [CrossRef]
  25. Page, K.L.; Dang, Y.P.; Dalal, R.C. The Ability of Conservation Agriculture to Conserve Soil Organic Carbon and the Subsequent Impact on Soil Physical, Chemical, and Biological Properties and Yield. Front. Sustain. Food Syst. 2020, 4, 31. [Google Scholar] [CrossRef]
  26. Galantini, J.; Rosell, R. Long-term fertilization effects on soil organic matter quality and dynamics under different production systems in semiarid Pampean soils. Soil Tillage Res. 2006, 87, 72–79. [Google Scholar] [CrossRef]
  27. Sollins, P.; Homann, P.; Caldwell, B.A. Stabilization and destabilization of soil organic matter: Mechanisms and controls. Geoderma 1996, 74, 65–105. [Google Scholar] [CrossRef]
  28. Barber, L.D.; Joern, B.C.; Volenec, J.J.; Cunningham, S.M. Supplemental Nitrogen Effects on Alfalfa Regrowth and Nitrogen Mobilization from Roots. Crop Sci. 1996, 36, 1217–1223. [Google Scholar] [CrossRef]
  29. Ghimire, R.; Norton, J.B.; Pendall, E. Alfalfa-grass biomass, soil organic carbon, and total nitrogen under different management approaches in an irrigated agroecosystem. Plant Soil 2014, 374, 173–184. [Google Scholar] [CrossRef]
  30. Zhang, X.; Wang, H.; Hui, X.L.; Wang, Z.H.; Liu, J.S. Effects of Different Fertilization and Fallowing Practices on Soil Carbon and Nitrogen Mineralization in a Dryland Soil with Low Organic Matter. J. Soil Sci. Plant Nutr. 2019, 19, 108–116. [Google Scholar] [CrossRef]
  31. Qin, P.Y.; Hu, L.; Liu, Y.D.; Hu, X.; Zhang, X.K.; Rosado, A.S.; Wei, G.H.; Chen, C. Responses of soil microbial communities and nutrient dynamics under continuous alfalfa (Medicago sativa L.) cultivation. Appl. Soil Ecol. 2024, 197, 105356. [Google Scholar] [CrossRef]
  32. Mitran, T.; Meena, R.S.; Lal, R.; Layek, J.; Kumar, S.; Datta, R. Role of Soil Phosphorus on Legume Production. In Legumes for Soil Health and Sustainable Management; Springer: Berlin/Heidelberg, Germany, 2018; pp. 487–510. [Google Scholar]
  33. Wang, Y.; Huang, Q.; Gao, H.; Zhang, R.; Yang, L.; Guo, Y.; Li, H.; Awasthi, M.K.; Li, G. Long-term cover crops improved soil phosphorus availability in a rain-fed apple orchard. Chemosphere 2021, 275, 130093. [Google Scholar] [CrossRef] [PubMed]
  34. Ravikiran, K.B.; Santhi, R.; Meena, S.; Sumathi, P. Refinement of Soil Test Crop Response -Integrated Plant Nutrition System based Fertilizer Prescriptions for Pearl Millet Variety Grown Under Inceptisol. Madras Agric. J. 2018, 105, 165–169. [Google Scholar] [CrossRef]
  35. Guo, K.W.; Xu, Z.S.; Huo, Y.Z.; Sun, Q.; Wang, Y.; Che, Y.H.; Wang, J.C.; Li, W.; Zhang, H.H. Effects of salt concentration, pH, and their interaction on plant growth, nutrient uptake, and photochemistry of alfalfa (Medicago sativa) leaves. Plant Signal. Behav. 2020, 10, 1832373. [Google Scholar]
  36. Guo, J.H.; Liu, X.J.; Zhang, Y.; Shen, J.L.; Han, W.X.; Zhang, W.F.; Christie, P.; Guolding, K.W.T.; Vitousek, P.M.; Zhang, F.S. Significant Acidification in Major Chinese Croplands. Science 2010, 327, 1008–1010. [Google Scholar] [CrossRef] [PubMed]
  37. Sun, B.R.; Gao, Y.Z.; Wu, X.; Ma, H.M.; Zheng, C.C.; Wang, X.Y.; Zhang, H.L.; Li, Z.J.; Yang, H.J. The relative contributions of pH, organic anions, and phosphatase to rhizosphere soil phosphorus mobilization and crop phosphorus uptake in maize/alfalfa polyculture. Plant Soil 2019, 447, 117–133. [Google Scholar] [CrossRef]
  38. Van Eerd, L.L.; Congreves, K.A.; Hayes, A.; Verhallen, A.; Hooker, D.C. Long-term tillage and crop rotation effects on soil quality, organic carbon, and total nitrogen. Soil Sci. 2014, 5, 303–315. [Google Scholar]
  39. Vitousek, P.M.; Howarth, R.W. Nitrogen limitation on land and in the sea: How can it occur? Biogeochemistry 1997, 2, 87–115. [Google Scholar] [CrossRef]
  40. Elser, J.J.; Fagan, W.F.; Denno, R.F.; Dobberfuhl, D.R.; Folarin, A.; Huberty, A.; Interlandi, S.; Kilham, S.S.; McCauley, E.; Schulz, K.L.; et al. Nutritional constraints in terrestrial and freshwater food webs. Nature 2000, 408, 578–580. [Google Scholar] [CrossRef]
  41. Lu, M.; Zeng, F.; Lv, S.; Zhang, H.; Zeng, Z.; Peng, W.; Song, T.; Wang, K.; Du, H. Soil C:N:P stoichiometry and its influencing factors in forest ecosystems in southern China. Front. For. Glob. Change 2023, 6, 1142933. [Google Scholar] [CrossRef]
  42. Adeboye, M.K.A.; Bala, A.; Osunde, A.O.; Uzoma, A.O.; Odofin, A.J.; Lawal, B.A. Assessment of soil quality using soil organic carbon and total nitrogen and microbial properties in tropical agroecosystems. Agric. Sci. 2011, 2, 34–40. [Google Scholar] [CrossRef]
  43. Elser, J.J.; Bracken, M.E.S.; Cleland, E.E.; Gruner, D.S.; Harpole, W.S.; Hillebrand, H.; Ngai, J.T.; Seabloom, E.W.; Shurin, J.B.; Smith, J.E. Global analysis of nitrogen and phosphorus limitation of primary producers in freshwater, marine and terrestrial ecosystems. Ecology 2007, 10, 1135–1142. [Google Scholar] [CrossRef] [PubMed]
  44. Mcgroddy, M.E.; Daufresne, T.; Hedin, L.O. Scaling of C: N: P stoichiometry in forests worldwide: Implications of terrestrial redfield-type ratios. Ecology 2004, 85, 2390–2401. [Google Scholar] [CrossRef]
Figure 1. Monthly average temperature and precipitation from 2016 to 2021.
Agronomy 15 00724 g001
Figure 2. Soil pH values under different nitrogen fertilizer treatments of Medicago varia.
Agronomy 15 00724 g002
Figure 3. The correlation between above-ground and root biomass, as well as the root-to-shoot ratio of Medicago, and soil carbon, nitrogen, and phosphorus. Note: The red, blue, and black lines represent the fitted lines under CK, N75, and N150 treatments, respectively.
Agronomy 15 00724 g003
Figure 4. The correlation between above-ground and root biomass, as well as the root-to-shoot ratio of alfalfa, and the soil carbon, nitrogen, and phosphorus stoichiometric ratios. Note: The red, blue, and black lines represent the fitted lines under CK, N75, and N150 treatments, respectively.
Agronomy 15 00724 g004
Figure 5. Yield and stoichiometric RDA sequence of Medicago varia. Note: This diagram combines the explained variables and explanatory variables, namely the yield data (marked with asterisks *) and soil physicochemical property data (represented by arrows), to reveal the relationships between them. The length of the arrows in the diagram indicates the magnitude of the impact of each factor on the explained variables, and each point represents a sample.
Agronomy 15 00724 g005
Table 1. The basic physical and chemical properties of the soil of the pastureland in 2016.
Soil
Layers
SOC
(g kg−1)
TN
(g kg−1)
TP
(g kg−1)
TK
(g kg−1)
AHN
(mg kg−1)
AP
(mg kg−1)
AK
(mg kg−1)
PH
0–10 cm13.622.200.5225.76207.0416.25315.966.77
10–20 cm13.342.190.4925.59219.8811.95249.496.79
20–40 cm10.231.700.4224.49161.258.89192.367.34
40–60 cm5.081.020.3523.59104.787.68148.777.94
Note: TN stands for total nitrogen, TP stands for total phosphorus, TK stands for total potassium, AHN stands for alkali-hydrolyzed nitrogen, AP stands for available phosphorus, AK stands for available potassium.
Table 2. Significance analysis of above-ground biomass for different treatment methods.
Process ModeAbove-Ground Biomass (t ha−1)
2017201820192020202120222023
CK9.95 ± 1.31 aAB10.00 ± 0.86 aAB7.22 ± 2.88 aB9.32 ± 1.06 bB12.97 ± 0.38 aA10.72 ± 3.10 aAB9.63 ± 1.21 aAB
N7510.34 ± 3.12 aA10.99 ± 1.35 aA9.56 ± 3.17 aA12.09 ± 1.56 aA12.70 ± 1.86 aA10.85 ± 1.29 aA11.78 ± 3.17 aA
N1509.55 ± 2.41 aBC10.94 ± 1.11 aABC7.85 ± 2.37 aC10.89 ± 1.61 abABC14.15 ± 1.52 aA13.01 ± 2.61 aAB12.26 ± 1.71 aAB
Note: Different lowercase letters (a, b) indicate that there is a significant difference in above-ground biomass between different nitrogen application levels at the same age (p < 0.05). Different uppercase letters (A, B, C) indicate that there is a significant difference in above-ground biomass among different age conditions at the same nitrogen application level (p < 0.05).
Table 3. Significance analysis of root biomass for different treatment methods.
Process ModeRoot Biomass (t ha−1)
2017201820192020202120222023
CK5.08 ± 0.50 aBC5.09 ± 0.63 aBC5.09 ± 2.24 abBC7.02 ± 0.69 aAB7.16 ± 1.64 aAB7.80 ± 1.49 aA3.78 ± 1.24 aC
N755.93 ± 1.08 aAB5.75 ± 0.27 aAB7.29 ± 0.86 aA7.81 ± 2.09 aA7.01 ± 0.57 aA7.72 ± 1.76 aA4.26 ± 0.59 aB
N1504.68 ± 0.42 aA5.37 ± 1.50 aA3.91 ± 0.53 bA6.81 ± 1.91 aA6.75 ± 0.71 aA7.10 ± 1.72 aA6.00 ± 2.60 aA
Note: Different lowercase letters (a, b) indicate significant differences in root biomass between different nitrogen application levels at the same age (p < 0.05). Different uppercase letters (A, B, C) indicate significant differences in root biomass among different age conditions at the same nitrogen application level (p < 0.05).
Table 4. Significance analysis of soil SOC under different treatment methods.
N LevelSoil Layers (cm)SOC (g kg−1)
20162017201820192020202120222023
CK0–1013.38 ± 1.52 aA II23.46 ± 3.43 aA I22.99 ± 1.55 aA I20.23 ± 2.84 aA I20.79 ± 2.34 aA I22.36 ± 1.06 aA I21.70 ± 1.81 aA I22.24 ± 2.59 aA I
10–2013.04 ± 1.37 aA IV23.01 ± 2.97 aA I,II23.76 ± 1.22 aA I19.17 ± 2.05 aA III20.45 ± 2.87 aA I,II,III19.87 ± 2.45 aA II,III20.78 ± 2.32 aA I,II,III21.99 ± 2.15 aA I,II,III
20–4011.14 ± 2.54 aA I18.74 ± 3.90 aA I16.02 ± 3.01 aB I18.43 ± 5.52 aA I14.00 ± 1.41 aB I11.54 ± 3.71 aB I14.41 ± 4.90 aB I16.20 ± 2.51 aB I
40–604.83 ± 1.46 aB II11.75 ± 2.82 aB I8.18 ± 2.25 aC I,II8.96 ± 4.79 aB I,II8.75 ± 2.05 aC I,II5.34 ± 1.01 aC II7.35 ± 2.40 aC I,II8.16 ± 1.01 aC I,II
N750–1013.41 ± 1.09 aA III23.20 ± 2.47 aA I23.84 ± 1.87 aA I16.80 ± 1.17 abA II22.05 ± 2.03 aA I22.42 ± 2.34 aA I22.72 ± 1.07 aA I24.33 ± 0.92 aA I
10–2013.71 ± 1.08 aA III20.98 ± 2.52 aAB I23.80 ± 1.67 aA I16.77 ± 1.56 abA II20.99 ± 1.92 aA I21.32 ± 2.02 aA I21.60 ± 2.14 aA I21.92 ± 1.70 aA I
20–4010.54 ± 2.45 aA III15.50 ± 3.29 aB I,II16.99 ± 2.44 aB I11.72 ± 1.10 abB II,III14.85 ± 1.80 aB I,II,III14.17 ± 4.02 aB I,II,III16.76 ± 0.60 aB I16.85 ± 1.59 aB I
40–606.08 ± 2.32 aB I8.71 ± 3.74 aC I9.26 ± 1.79 aC I6.71 ± 1.26 aC I9.09 ± 2.65 aC I6.28 ± 2.84 aC I8.49 ± 1.62 aC I9.15 ± 1.70 aC I
N1500–1012.93 ± 1.39 aA II21.97 ± 2.87 aA I20.42 ± 1.79 aA I14.41 ± 1.51 bA II20.76 ± 2.05 aA I20.55 ± 0.92 aA I21.83 ± 1.17 aA I21.55 ± 1.65 aA I
10–2012.77 ± 1.44 aA II21.13 ± 1.83 aAB I21.78 ± 1.63 aA I14.29 ± 1.57 bA II18.83 ± 3.19 aA I19.21 ± 2.01 aA I19.39 ± 2.55 aA I19.69 ± 1.46 aA I
20–409.52 ± 1.41 aB I15.44 ± 468 aB I15.26 ± 6.41 aAB I9.37 ± 1.83 bB I12.68 ± 2.52 aB I11.35 ± 5.33 aB I11.35 ± 3.40 aB I11.56 ± 5.14 aB I
40–604.44 ± 1.28 aC II8.67 ± 2.60 aC I,II12.09 ± 3.88 aB I8.45 ± 3.69 aB I,II8.40 ± 2.65 aB I,II5.88 ± 4.70 aB I,II5.80 ± 1.57 aC I,II7.25 ± 3.01 aB I,II
Note: Different lowercase letters (a, b) indicate significant differences in SOC among different nitrogen application levels at the same age and soil layer (p < 0.05); different uppercase letters (A, B, C) indicate significant differences in SOC among different soil layers at the same nitrogen application level and age (p < 0.05); different Greek numerals (I, II, III, IV) indicate significant differences in SOC among different ages at the same nitrogen application level and soil layer (p < 0.05).
Table 5. Significance analysis of soil TN under different treatment methods.
N LevelSoil Layers (cm)TN (g kg−1)
20162017201820192020202120222023
CK0–102.18 ± 0.23 aA I2.56 ± 0.31 aA I2.16 ± 0.23 aA I2.12 ± 0.14 aA I2.17 ± 0.15 aA I2.13 ± 0.10 aA I2.09 ± 0.24 aA I2.15 ± 0.21 aA I
10–202.19 ± 0.18 aA I,II2.60 ± 0.34 aA I2.11 ± 0.19 aA II2.09 ± 0.19 aA II2.09 ± 0.15 aA II1.92 ± 0.28 aA II2.00 ± 0.26 aA II2.20 ± 0.24 aA I,II
20–401.86 ± 0.34 aA I,II2.24 ± 0.38 aAB I1.50 ± 0.29 aB II,III1.71 ± 0.33 aA I,II,III1.47 ± 0.12 aB II,III1.11 ± 0.39 aB III1.28 ± 0.48 aB II,III1.55 ± 0.24 aB II,III
40–601.05 ± 0.43 aB II1.56 ± 0.38 aB I0.80 ± 0.23 aC II,III1.14 ± 0.25 aB I,II0.80 ± 0.14 aC II,III0.55 ± 0.15 aC III0.78 ± 0.26 aB II,III0.82 ± 0.20 aC II,III
N750–102.00 ± 0.56 aAB I2.52 ± 0.38 aA I2.25 ± 0.21 aA I2.28 ± 0.20 aA I2.23 ± 0.16 aA I2.17 ± 0.12 aA I2.17 ± 0.12 aA I2.28 ± 0.08 aA I
10–202.21 ± 0.23 aA I2.36 ± 0.29 aA I2.19 ± 0.19 aA I2.27 ± 0.17 aA I2.11 ± 0.22 aA I2.04 ± 0.13 aA I2.09 ± 0.18 aA I2.15 ± 0.15 aA I
20–401.72 ± 0.33 aAB I,II1.96 ± 0.34 aAB I1.56 ± 0.28 aB I,II1.70 ± 0.07 aB I,II1.42 ± 0.21 aB I,II1.31 ± 0.38 aB II1.58 ± 0.07 aB I,II1.62 ± 0.12 aB I,II
40–601.20 ± 0.44 aB I,II1.44 ± 0.27 aB I0.88 ± 0.22 aC II,III0.89 ± 0.17 aC II,III0.75 ± 0.29 aC II,III0.69 ± 0.22 aC III0.84 ± 0.18 aC II,III0.90 ± 0.11 aC II,III
N1500–102.17 ± 0.21 aA I2.27 ± 0.14 aA I2.03 ± 0.29 aA I2.06 ± 0.18 aA I2.12 ± 0.20 aA I2.07 ± 0.12 aA I0.29 ± 0.16 aA I2.15 ± 0.12 aA I
10–202.12 ± 0.21 aA I2.36 ± 0.27 aA I2.00 ± 0.23 aA I2.08 ± 0.13 aA I2.03 ± 0.19 aA I1.87 ± 0.20 aA I1.88 ± 0.24 aA I1.98 ± 0.23 aA I
20–401.63 ± 0.20 aB I,II1.89 ± 0.52 aAB I1.41 ± 0.57 aAB I,II1.33 ± 0.36 aB I,II1.34 ± 0.31 aB I,II0.96 ± 0.40 aB II1.06 ± 0.32 aB I,II1.07 ± 0.46 aB I,II
40–600.92 ± 0.14 aC I,II1.31 ± 0.32 aB I0.83 ± 0.27 aB I,II1.21 ± 0.52 aB I,II0.84 ± 0.21 aC I,II0.63 ± 0.42 aB II0.59 ± 0.14 aC II0.69 ± 0.26 aB I,II
Note: Different lowercase letters (a) indicate significant differences in soil TN among different nitrogen application levels at the same age and soil layer (p < 0.05); different uppercase letters (A, B, C) indicate significant differences in soil TN among different soil layers at the same nitrogen application level and age (p < 0.05); different Greek numerals (I, II, III) indicate significant differences in soil TN among different ages at the same nitrogen application level and soil layer (p < 0.05).
Table 6. Significance analysis of soil TP under different treatment methods.
N LevelSoil Layers (cm)TP (g kg−1)
20162017201820192020202120222023
CK0–100.48 ± 0.04 aA I0.20 ± 0.03 bA III0.17 ± 0.01 bA III0.21 ± 0.04 bA III0.46 ± 0.03 aA I,II0.46 ± 0.02 aA I,II0.42 ± 0.04 aA II0.43 ± 0.02 aA II
10–200.44 ± 0.03 aAB I,II0.18 ± 0.05 bA III0.17 ± 0.02 bA III0.18 ± 0.03 bA III0.46 ± 0.01 aA I0.41 ± 0.02 aAB II0.40 ± 0.03 aA II0.44 ± 0.05 aA I,II
20–400.39 ± 0.03 aB I0.15 ± 0.01 bAB II0.15 ± 0.02 bA II0.15 ± 0.02 bA II0.39 ± 0.02 aB I0.33 ± 0.04 aC I0.33 ± 0.09 aAB I0.38 ± 0.03 aA I
40–600.30 ± 0.03 bC II0.12 ± 0.01 bB III0.12 ± 0.01 bB III0.16 ± 0.03 bA III0.31 ± 0.03 aC I,II0.35 ± 0.05 aBC I,II0.29 ± 0.03 aB II0.37 ± 0.06 aA I
N750–100.50 ± 0.03 aA I,II0.49 ± 0.04 aA I,II0.55 ± 0.07 aA I0.47 ± 0.05 aA I,II0.49 ± 0.04 aA I,II0.50 ± 0.03 aA I,II0.43 ± 0.04 aA II0.45 ± 0.03 aA II
10–200.50 ± 0.04 aA I,II0.45 ± 0.04 aA II,III,IV0.53 ± 0.04 aA I0.50 ± 0.06 aA I,II0.48 ± 0.03 aAB I,II,III0.43 ± 0.01 aAB III,IV0.40 ± 0.03 aA IV0.41 ± 0.04 aAB IV
20–400.42 ± 0.05 aAB I,II0.39 ± 0.07 aAB I,II0.42 ± 0.03 aB I0.42 ± 0.03 aAB I0.41 ± 0.02 aB I,II0.39 ± 0.07 aB I,II0.33 ± 0.04 aB II0.37 ± 0.02 aAB I,II
40–600.39 ± 0.05 aB I0.34 ± 0.06 aB I0.32 ± 0.06 aC I0.35 ± 0.06 aB I0.29 ± 0.07 aC I0.29 ± 0.06 aC I0.27 ± 0.03 aB I0.34 ± 0.08 aB I
N1500–100.53 ± 0.02 aA I,II0.49 ± 0.04 aA I,II,III0.54 ± 0.04 aA I0.47 ± 0.03 aA II,III0.48 ± 0.05 aA I,II,III0.49 ± 0.02 aA I,II,III0.45 ± 0.03 aA III0.44 ± 0.04 aA III
10–200.43 ± 0.11 aAB I0.46 ± 0.03 aAB I0.49 ± 0.06 aAB I0.48 ± 0.04 aA I0.48 ± 0.03 aA I0.41 ± 0.02 aB I0.39 ± 0.05 aA I0.41 ± 0.05 aAB I
20–400.43 ± 0.05 aAB I0.39 ± 0.07 aBC I,II0.38 ± 0.07 aBC I,II0.40 ± 0.08 aA I,II0.38 ± 0.05 aAB I,II0.39 ± 0.04 aBC I,II0.28 ± 0.06 aB II0.35 ± 0.01 aBC I,II
40–600.34 ± 0.02 abB I,II0.31 ± 0.04 aC I,II0.33 ± 0.03 aC I,II0.39 ± 0.08 aA I0.34 ± 0.07 aB I,II0.33 ± 0.05 aC I,II0.25 ± 0.04 aB II0.33 ± 0.05 aC II
Note: Different lowercase letters (a, b) indicate significant differences in soil TP among different nitrogen application levels at the same age and soil layer (p < 0.05); different uppercase letters (A, B, C) indicate significant differences in soil TP among different soil layers at the same nitrogen application level and age (p < 0.05); different Greek numerals (I, II, III, IV) indicate significant differences in soil TP among different ages at the same nitrogen application level and soil layer (p < 0.05).
Table 7. Significance analysis of the soil C:N ratio under different treatment methods.
N LevelSoil Layers (cm)C:N Ratio
20162017201820192020202120222023
CK0–106.13 ± 0.30 aA III9.21 ± 1.07 aA II10.72 ± 0.78 aA I9.59 ± 1.55 aA I,II9.54 ± 0.49 aA I,II10.50 ± 0.40 aA I10.41 ± 0.46 aAB I,II10.35 ± 0.55 aA I,II
10–205.95 ± 0.27 aA V8.05 ± 0.27 aAB IV11.32 ± 0.66 aA I9.21 ± 0.97 aA III,IV9.79 ± 1.13 aA II,III,IV10.41 ± 0.40 aA I,II10.42 ± 0.47 aAB I,II10.03 ± 0.56 aA II,III
20–405.93 ± 0.27 aA III8.32 ± 0.48 aAB II,III10.68 ± 0.72 aA I,II11.05 ± 3.59 aA I9.51 ± 0.66 aA I,II10.69 ± 1.16 aA I,II11.36 ± 0.70 aA I10.49 ± 0.46 aA I,II
40–604.74 ± 0.61 aB II7.58 ± 0.49 aB I,II10.96 ± 3.27 aA I,II9.58 ± 8.15 aA I,II11.37 ± 3.47 aA I9.91 ± 1.20 aA I,II9.54 ± 0.45 aB I,II10.23 ± 1.17 aA I,II
N750–107.28 ± 2.16 aA II9.35 ± 1.31 aA I10.63 ± 0.28 aA I7.40 ± 0.36 bA I9.87 ± 0.35 aA I10.31 ± 0.58 aA I10.48 ± 0.18 aA I10.66 ± 0.08 aA I
10–206.22 ± 0.33 aA V8.89 ± 0.07 aA III10.88 ± 0.50 aA I7.37 ± 0.16 bA IV10.02 ± 0.85 aA II10.42 ± 0.31 aA I,II10.35 ± 0.50 aA I,II10.20 ± 0.13 aA II
20–406.09 ± 0.25 aA III7.85 ± 0.41 aAB II10.95 ± 0.44 aA I6.89 ± 0.46 aA I,II10.57 ± 1.28 aA I10.90 ± 1.27 aA I10.58 ± 0.32 aA I10.43 ± 0.65 aA I
40–605.02 ± 0.14 aA IV5.81 ± 1.80 aB III,IV10.95 ± 2.05 aA I,II7.56 ± 0.48 aA II,III,IV14.44 ± 6.52 aA I8.60 ± 1.97 aA II,III,IV10.22 ± 0.47 aA I,II,III10.25 ± 1.72 aA I,II,III
N1500–105.96 ± 0.31 aA II9.78 ± 1.71 aA I10.17 ± 0.86 aA I6.98 ± 0.25 bA II9.78 ± 0.23 aA I9.94 ± 0.58 aAB I10.47 ± 0.33 aA I10.02 ± 0.26 aA I
10–206.00 ± 0.09 aA VI9.00 ± 0.53 aA IV10.95 ± 0.69 aA I6.87 ± 0.44 bA V9.20 ± 0.78 aA III,IV10.28 ± 0.41 aAB I,II10.30 ± 0.53 aA I,II10.03 ± 0.65 aA II,III
20–405.82 ± 0.18 aAB IV8.12 ± 0.67 aAB III10.66 ± 0.80 aA I,II7.22 ± 0.75 aA III9.60 ± 0.79 aA II11.83 ± 1.33 aA I10.80 ± 1.00 aA I,II10.75 ± 0.17 aA I,II
40–604.75 ± 0.98 aB II6.51 ± 0.67 aB II18.07 ± 12.81 aA I6.98 ± 0.71 aA II10.56 ± 4.43 aA I,II8.88 ± 1.57 aB I,II9.73 ± 1.28 aA I,II10.35 ± 1.02 aA I,II
Note: Different lowercase letters (a, b) indicate significant differences in the soil C:N ratio among different nitrogen application levels at the same age and soil layer (p < 0.05); different uppercase letters (A, B) indicate significant differences in the soil C:N ratio among different soil layers at the same nitrogen application level and age (p < 0.05); different Greek numerals (I, II, III, IV, V, VI) indicate significant differences in the soil C:N ratio among different ages at the same nitrogen application level and soil layer (p < 0.05).
Table 8. Significance analysis of soil C:P ratio under different treatment methods.
N LevelSoil Layers (cm)C:P Ratio
20162017201820192020202120222023
CK0–1027.88 ± 1.65 aA IV120.18 ± 24.62 aA I,II137.66 ± 10.91 aAB I98.67 ± 27.85 aA II45.61 ± 2.91 aA III,IV48.21 ± 2.60 aA III,IV51.42 ± 5.05 aA III51.52 ± 4.89 aA III
10–2029.68 ± 4.56 aA II151.32 ± 77.69 aA I139.26 ± 8.24 aA I110.90 ± 25.30 aA I44.61 ± 5.86 aA II48.10 ± 6.82 aA II52.50 ± 5.19 aA II50.07 ± 4.80 aAB II
20–4028.75 ± 5.85 aA II125.67 ± 23.43 aA I104.99 ± 23.58 aB I124.03 ± 44.83 aA I36.38 ± 3.09 aAB II34.57 ± 9.54 aB II42.81 ± 7.06 aA II42.55 ± 3.42 aB II
40–6016.20 ± 3.94 aB III101.11 ± 34.41 aA I71.39 ± 19.39 aC I65.29 ± 50.43 aA I,II28.31 ± 7.40 aB II,III15.91 ± 4.62 aC III24.67 ± 5.70 aB III22.84 ± 5.24 aC III
N750–1026.69 ± 0.93 abA IV47.68 ± 4.99 bA I,II43.63 ± 3.68 bA II35.70 ± 3.08 bA III44.82 ± 4.64 aA II45.54 ± 6.33 aAB II52.97 ± 4.69 aA I53.96 ± 3.26 aA I
10–2027.62 ± 2.83 aA IV46.56 ± 1.77 bA II45.06 ± 3.13 bA II33.60 ± 3.17 bA III44.19 ± 3.86 aA II49.06 ± 4.78 aA I,II54.25 ± 6.13 aA I53.34 ± 2.22 aAB I
20–4024.65 ± 2.60 aA IV39.71 ± 5.03 bA II,III39.83 ± 3.71 bA II,III27.64 ± 2.07 bB IV36.36 ± 4.15 aAB III36.30 ± 5.98 aB III51.79 ± 5.84 aA I45.61 ± 5.43 aB I,II
40–6015.23 ± 3.56 aB IV24.94 ± 8.02 bB I,II,III,IV29.45 ± 2.94 bB I,II,III19.03 ± 2.02 aC III,IV32.18 ± 7.68 aB I20.55 ± 7.36 aC II,III,IV30.76 ± 2.61 aB I,II28.33 ± 6.91 aC I,II,III
N1500–1024.19 ± 1.96 bAB V45.11 ± 5.53 bA I,II37.89 ± 2.02 bA III30.83 ± 3.80 bA IV43.57 ± 3.14 aA II41.95 ± 2.50 aAB II,III49.05 ± 2.82 aA I48.73 ± 0.88 aAB I
10–2032.21 ± 11.47 aA III,IV45.67 ± 1.37 bA I,II44.90 ± 3.79 bA I,II29.68 ± 0.76 bA IV39.32 ± 4.25 aAB II,III46.77 ± 4.32 aA I,II49.52 ± 2.98 aA I49.20 ± 7.33 aA I
20–4022.09 ± 3.14 aAB I38.82 ± 5.28 bA I37.70 ± 11.62 bA I23.84 ± 3.96 bAB I33.24 ± 2.04 aAB I27.87 ± 10.62 aBC I39.54 ± 5.81 aB I33.05 ± 14.20 aBC I
40–6013.00 ± 3.51 aB II27.31 ± 6.82 bB I,II37.72 ± 15.20 bA I20.54 ± 6.83 aB I,II27.33 ± 11.58 aB I,II17.52 ± 12.37 aC I,II23.47 ± 6.30 aC I,II21.30 ± 7.54 aC I,II
Note: Different lowercase letters (a, b) indicate significant differences in the soil C:P ratio among different nitrogen application levels at the same age and soil layer (p < 0.05); different uppercase letters (A, B, C) indicate significant differences in the soil C:P ratio among different soil layers at the same nitrogen application level and age (p < 0.05); different Greek numerals (I, II, III, IV, V) indicate significant differences in the soil C:P ratio among different ages at the same nitrogen application level and soil layer (p < 0.05).
Table 9. Significance analysis of the soil N:P ratio under different treatment methods.
N LevelSoil Layers (cm)N:P Ratio
20162017201820192020202120222023
CK0–104.56 ± 0.36 aA III13.25 ± 3.11 aA I12.86 ± 0.85 aA I10.12 ± 1.19 aA II4.78 ± 0.27 aA III4.59 ± 0.15 aA III4.94 ± 0.49 aA III4.98 ± 0.45 aA III
10–204.98 ± 0.72 aA II17.14 ± 8.90 aA I12.31 ± 0.39 aA I11.91 ± 1.40 aA I4.55 ± 0.25 aA II4.63 ± 0.74 aA II5.04 ± 0.42 aA II4.98 ± 0.25 aA II
20–404.81 ± 0.73 aA III15.04 ± 2.30 aA I9.77 ± 1.75 aB II11.23 ± 1.98 aA II3.82 ± 0.11 aB II3.32 ± 1.04 aA II3.77 ± 0.61 bB II4.06 ± 0.32 aB II
40–603.52 ± 1.23 aA III13.32 ± 4.24 aA I6.79 ± 1.37 aC II7.10 ± 0.95 aB II2.53 ± 0.16 aC III1.65 ± 0.56 aB III2.60 ± 0.63 aC III2.32 ± 0.76 aC III
N750–103.96 ± 0.98 aAB II5.18 ± 0.79 bA I4.11 ± 0.44 bA I,II4.82 ± 0.33 bA I,II4.53 ± 0.35 aA I,II4.40 ± 0.36 aA I,II5.05 ± 0.37 aA I,II5.06 ± 0.29 aA I,II
10–204.44 ± 0.33 aA II5.24 ± 0.23 bA I4.14 ± 0.16 bA II4.56 ± 0.47 bAB II4.42 ± 0.27 aA II4.70 ± 0.34 aA I,II5.24 ± 0.49 aA I5.23 ± 0.22 aA I
20–404.04 ± 0.33 aAB II,III5.04 ± 0.46 bA I3.65 ± 0.45 bA II,III4.01 ± 0.17 bB II,III3.50 ± 0.63 aAB III3.37 ± 0.66 aB III4.88 ± 0.43 aA I4.36 ± 0.35 aB I,II
40–603.03 ± 0.65 aB II4.26 ± 0.27 bA I2.75 ± 0.37 bB II2.53 ± 0.36 bC II2.49 ± 0.71 aB II2.29 ± 0.44 aC II3.02 ± 0.33 aB II2.81 ± 0.62 aC II
N1500–104.06 ± 0.26 aAB III,IV4.66 ± 0.33 bA I,II3.75 ± 0.32 bA IV4.41 ± 0.51 bA I,II,III4.45 ± 0.28 aA I,II,III4.22 ± 0.15 aA II,III,IV4.68 ± 0.24 aA I,II4.87 ± 0.22 aA I
10–205.36 ± 1.88 aA I5.10 ± 0.36 bA I4.10 ± 0.33 bA I4.33 ± 0.17 bA I4.27 ± 0.21 aA I4.57 ± 0.51 aA I4.82 ± 0.38 aA I4.91 ± 0.68 aA I
20–403.79 ± 0.45 aAB I,II4.78 ± 0.53 bA I3.49 ± 0.95 bAB I,II3.38 ± 0.85 bA I,II3.49 ± 0.41 aB I,II2.37 ± 0.82 aB II3.68 ± 0.53 bB I,II3.05 ± 1.27 aB II
40–602.70 ± 0.40 aB I,II4.14 ± 0.66 bA I2.45 ± 0.64 bB II2.96 ± 1.05 bA I,II2.54 ± 0.57 aC II1.91 ± 1.11 aB II2.43 ± 0.68 aC II2.05 ± 0.66 aB II
Note: Different lowercase letters (a, b) indicate significant differences in the soil N:P ratio among different nitrogen application levels at the same age and soil layer (p < 0.05); different uppercase letters (A, B, C) indicate significant differences in the soil N:P ratio among different soil layers at the same nitrogen application level and age (p < 0.05); different Greek numerals (I, II, III, IV) indicate significant differences in the soil N:P ratio among different ages at the same nitrogen application level and soil layer (p < 0.05).
Disclaimer/Publisher’s Note: The statements, opinions and data contained in all publications are solely those of the individual author(s) and contributor(s) and not of MDPI and/or the editor(s). MDPI and/or the editor(s) disclaim responsibility for any injury to people or property resulting from any ideas, methods, instructions or products referred to in the content.

