Article

Maize Seed Damage Identification Method Based on Improved YOLOV8n

1
School of Mechanical and Electrical Engineering, Hainan University, Haikou 570228, China
2
Key Laboratory of Tropical Intelligent Agricultural Equipment, Ministry of Agriculture and Rural Affairs, Haikou 570228, China
*
Authors to whom correspondence should be addressed.
Agronomy 2025, 15(3), 710; https://doi.org/10.3390/agronomy15030710
Submission received: 15 January 2025 / Revised: 6 March 2025 / Accepted: 12 March 2025 / Published: 14 March 2025
(This article belongs to the Section Precision and Digital Agriculture)

Abstract

:
The case of randomly scattered maize seeds presents the problem of complex background and high density, making detection difficult. To address this challenge, this paper proposes an improved YOLOv8n model (OBW-YOLO) for detecting damaged maize seeds. The introduction of the C2f-ODConv module enhances the model’s ability to extract damaged features, especially in complex scenarios, allowing for better capture of local information. The improved BIMFPN module optimizes the fusion of shallow and deep features, reduces detail loss, and improves detection accuracy. To accelerate model convergence and improve detection precision, the traditional bounding box loss function has been replaced by WIoU, significantly enhancing both accuracy and convergence speed. Experimental results show that the OBW-YOLO model achieves a detection accuracy of 93.6%, with mAP@0.5 and mAP@0.5:0.95 reaching 97.6% and 84.8%, respectively, which represents an improvement of 2.5%, 1%, and 1.2% compared to previous models. Additionally, the number of parameters and model sizes have been reduced by 33% and 22.5%, respectively. Compared to other YOLO models, OBW-YOLO demonstrates significant advantages in both accuracy and mAP. Ablation experiments further validate the effectiveness of the improvements, and heatmap analysis shows that the improved model is more precise in capturing the damaged features of maize seeds. These improvements enable the OBW-YOLO model to achieve significant performance gains in maize seed damage detection, providing an effective solution for the automated quality inspection of maize seeds in the agricultural field.

1. Introduction

Maize is one of the most important crops in the world [1]. To ensure high maize yields, not only high-quality maize varieties are needed, but also high-quality maize seeds [2]. Seed quality testing is a crucial part of the breeding, and inspecting the appearance integrity of maize seeds is an important indicator. Maize damage is mainly caused by two factors: one is mechanical damage, such as bruising, impact damage, and cracks; the other is biological damage, such as pest or pathogen damage [3]. Currently, in China’s maize seed production and breeding, the detection of damaged seeds mainly relies on manual selection. Therefore, it is crucial to develop a method for detecting maize seed damage in a random scattering state. At present, visible-light-based maize seed appearance and detection mainly include machine vision-based methods and deep learning-based detection methods.
Traditional machine vision technology has been widely applied in various fields such as industry, agriculture, and biology. Specifically, in seed quality testing, traditional machine vision utilizes image recognition and machine learning techniques to extract features such as color, texture, size, and shape, which are then used to classify and identify seed quality issues [4,5,6]. For example, Xin Cui et al. [7] conducted experiments under dark box and specific lighting conditions, combining machine vision feature extraction with a Support Vector Machine (SVM) classifier. By optimizing parameters through grid search and cross-validation, they significantly improved classification accuracy. Zhang Han et al. [8] conducted experiments under specific lighting conditions using HALCON, establishing a model for detecting maize mold and damage. They achieved a 95% detection rate for moldy seeds and an 89% detection rate for damaged seeds. Although traditional machine vision methods can achieve high accuracy and improve detection efficiency to some extent, they still have limitations due to their strict requirements on lighting conditions. Additionally, their slower detection speed and the need to process targets individually make them less efficient.
Deep learning has demonstrated significant advantages in object recognition, particularly due to its powerful learning and feature extraction capabilities [9]. By optimizing the model, deep learning can achieve higher accuracy in seed detection, with strong robustness and generalization ability, enabling it to handle complex scenarios. The YOLO algorithm is a deep learning-based object detection algorithm known for its fast detection speed while maintaining high accuracy, making it particularly suitable for applications that require real-time performance. Qiaohuan Wang et al. [10] used YOLOv5 for detecting cotton seed damage and mold, proposing a relatively fast and accurate cotton seed sorting solution. Xin Li et al. [11] proposed a YOLOv5s+Ghost+BiFPN model that combines the Ghost module and Bidirectional Feature Pyramid Network (BiFPN), achieving an accuracy of 99.7%, significantly outperforming YOLOv5s. This model also reduces FLOPs and model size, enabling fast and accurate ground recognition of red buckwheat seeds. Siqi Niu et al. [12] proposed an improved lightweight YOLOv8 model for maize seed quality detection, classifying seeds into four states: healthy, damaged, pest-infested, and moldy, achieving an mAP of 98.5%. However, this model can only detect 16 seeds at a time and requires manual separation of overlapping seeds, which increases the number of detection steps and limits the number of seeds detected.
Recent YOLO series models have also been reported in applications such as crop monitoring, pest and disease control, automated harvesting, precision fertilization, and seed quality detection [13,14,15,16,17,18]. Yuheng Li et al. [19] proposed a maize pest detection method based on YOLOv9, combining PGI and GELAN modules and introducing MSPA, significantly enhancing feature extraction capabilities. This method achieved an accuracy of 96.3% in pest detection, providing farmers with timely pest information and effectively reducing crop losses. Sitong Guan et al. [20] improved YOLOv10 for wheat ear detection, achieving an accuracy of 93.69%, a recall rate of 91.70%, and an average precision (mAP) of 95.10%. While these improvements offer significant advantages, the enhanced model comes with higher computational complexity and requires efficient hardware support, which may make it less suitable for field operations.
The above studies confirm the advantages of YOLO series models in crop quality detection. However, research on damaged maize seed detection is limited, and existing studies have been conducted in low-density and relatively ideal environments. Therefore, this paper proposes a method for detecting damaged maize seeds in high-density conditions based on YOLOv8n. This approach addresses the classification and detection issues in the complex, high-density backgrounds commonly found in randomly scattered maize seeds. It optimizes detection accuracy under visible light conditions while significantly reducing the model’s parameter count and size. The optimized model provides an effective solution for detecting damaged maize seeds, promotes the further development of related detection technologies, and offers new insights into the automation of maize seed quality detection in the agricultural field.

2. Materials and Methods

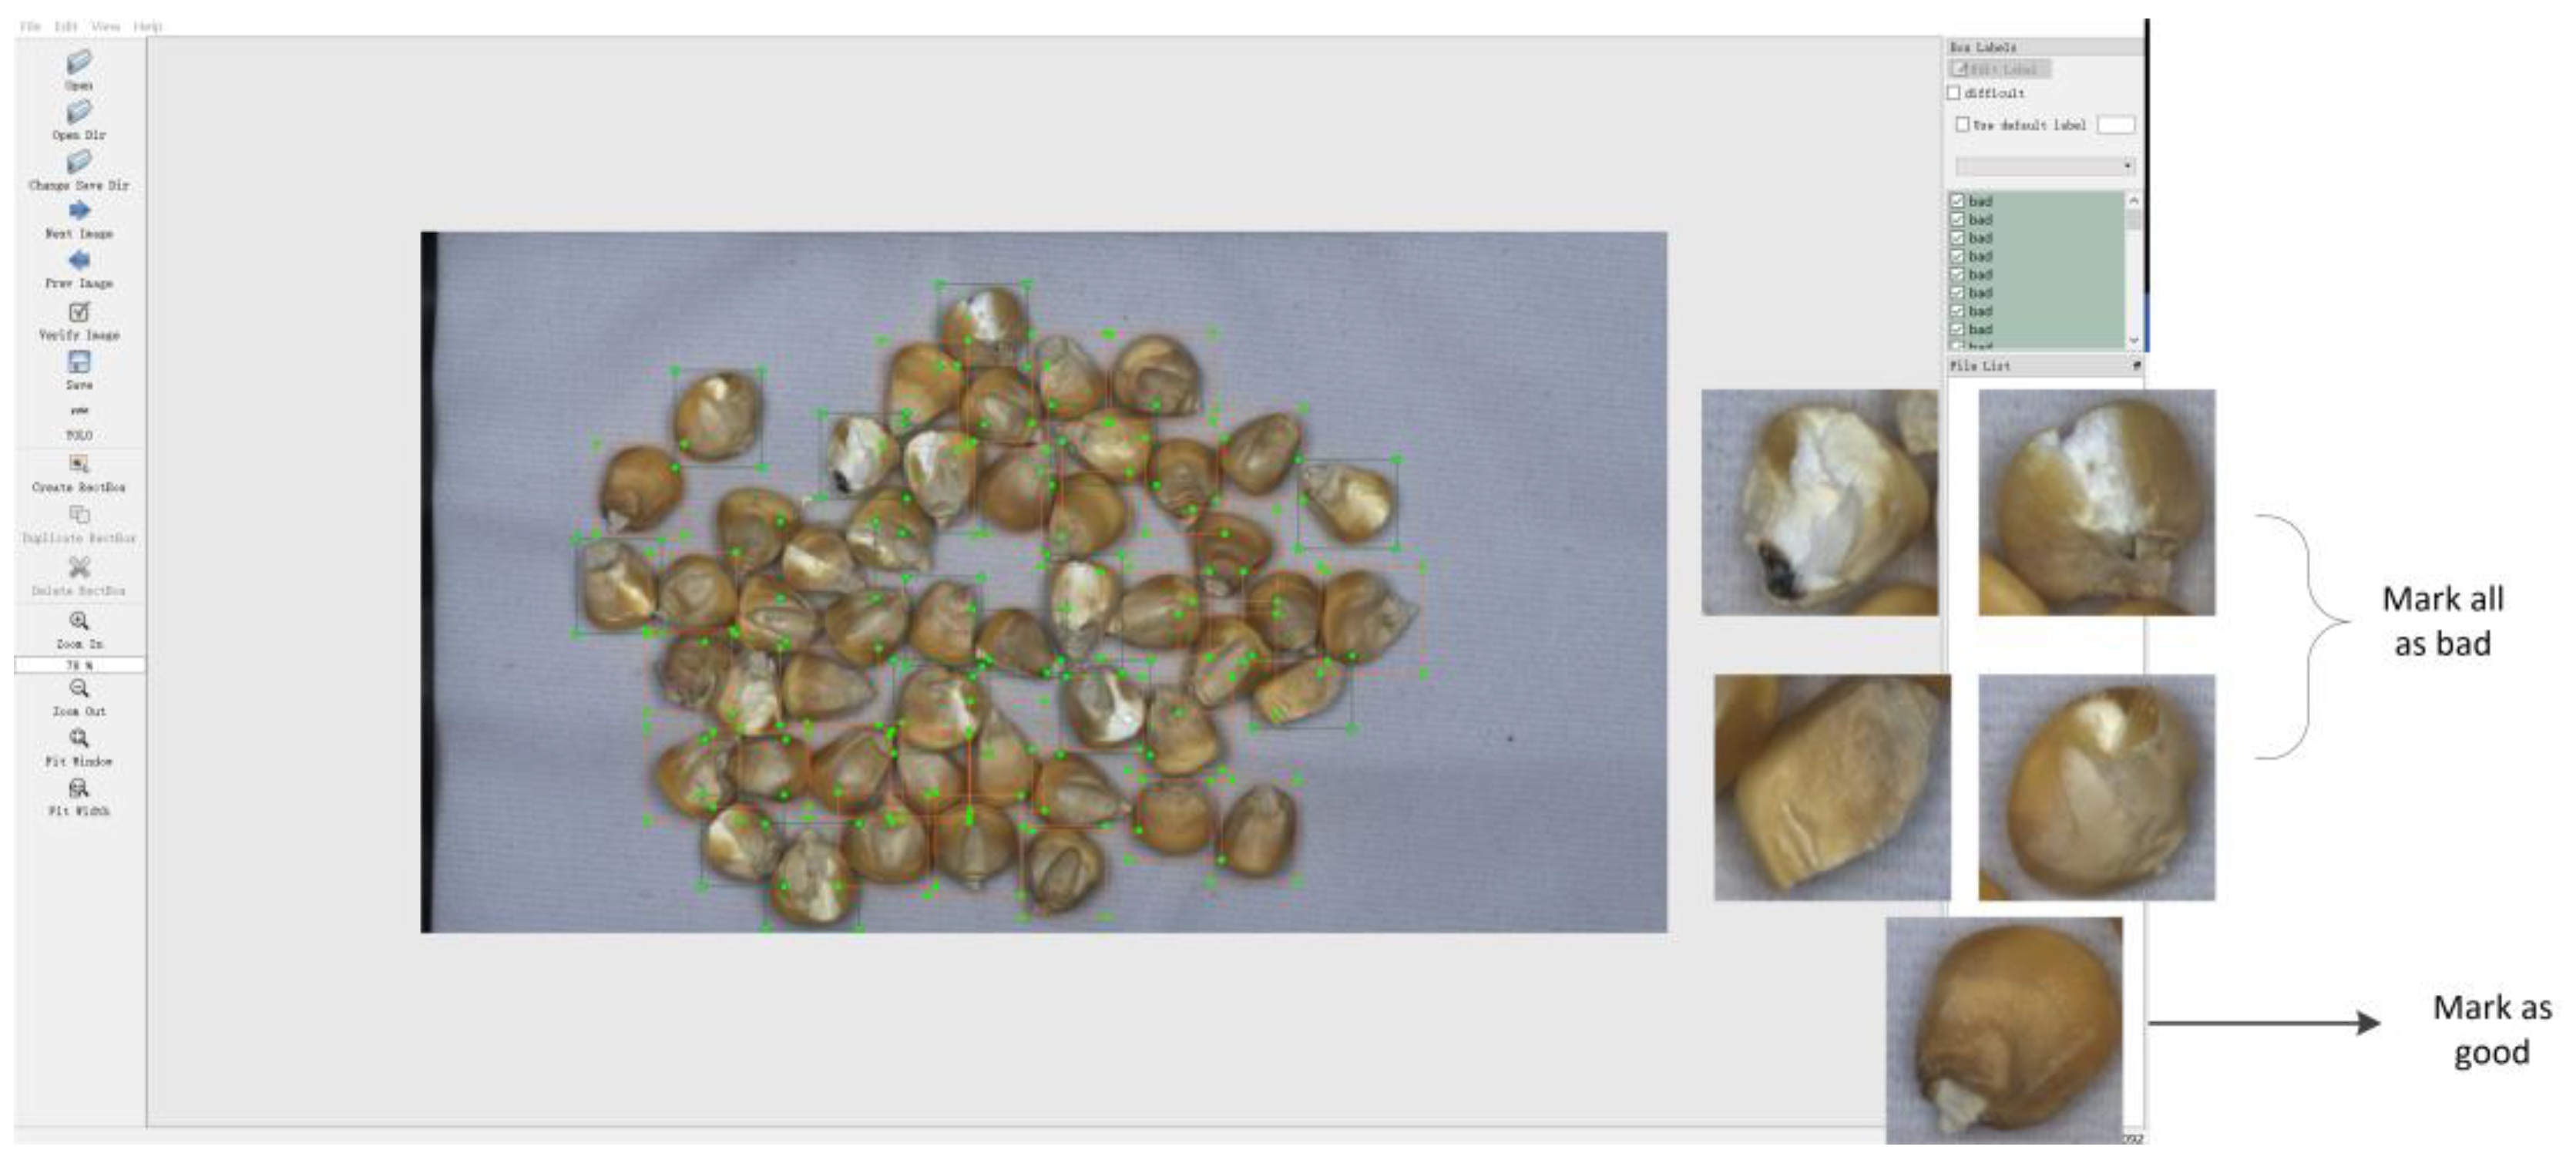
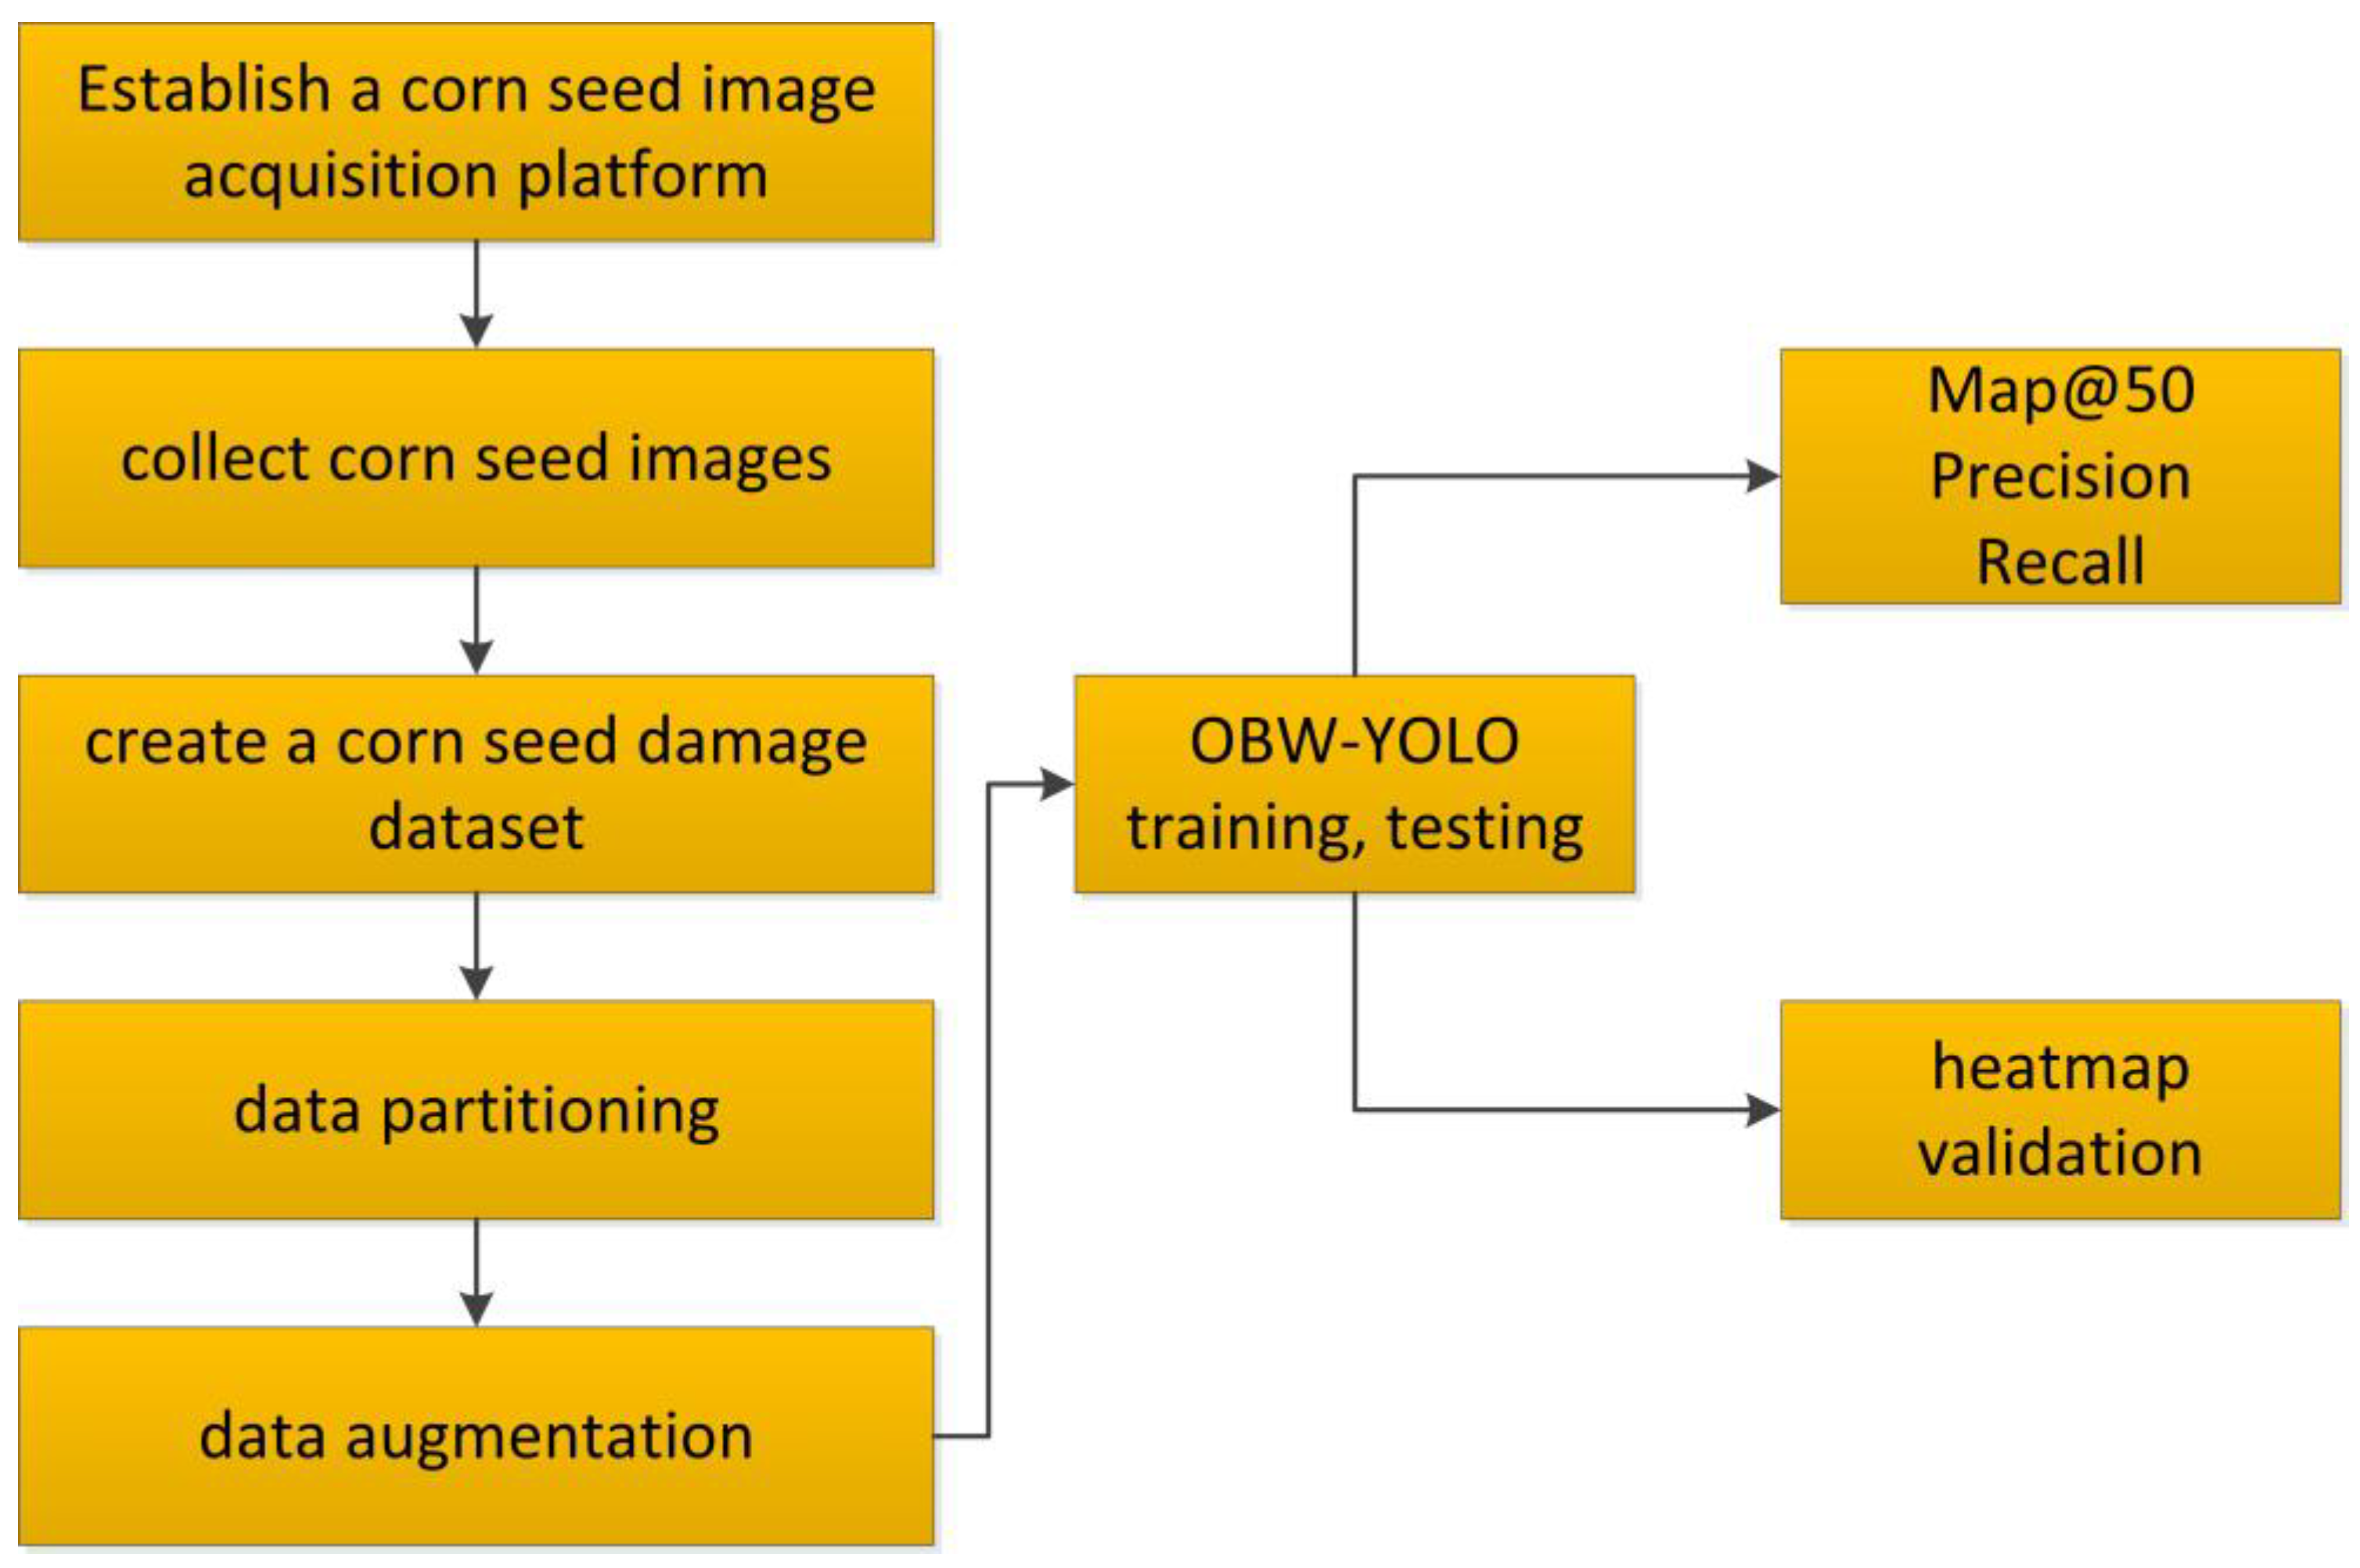
2.1. Development of a Cracked Maize Seed Dataset

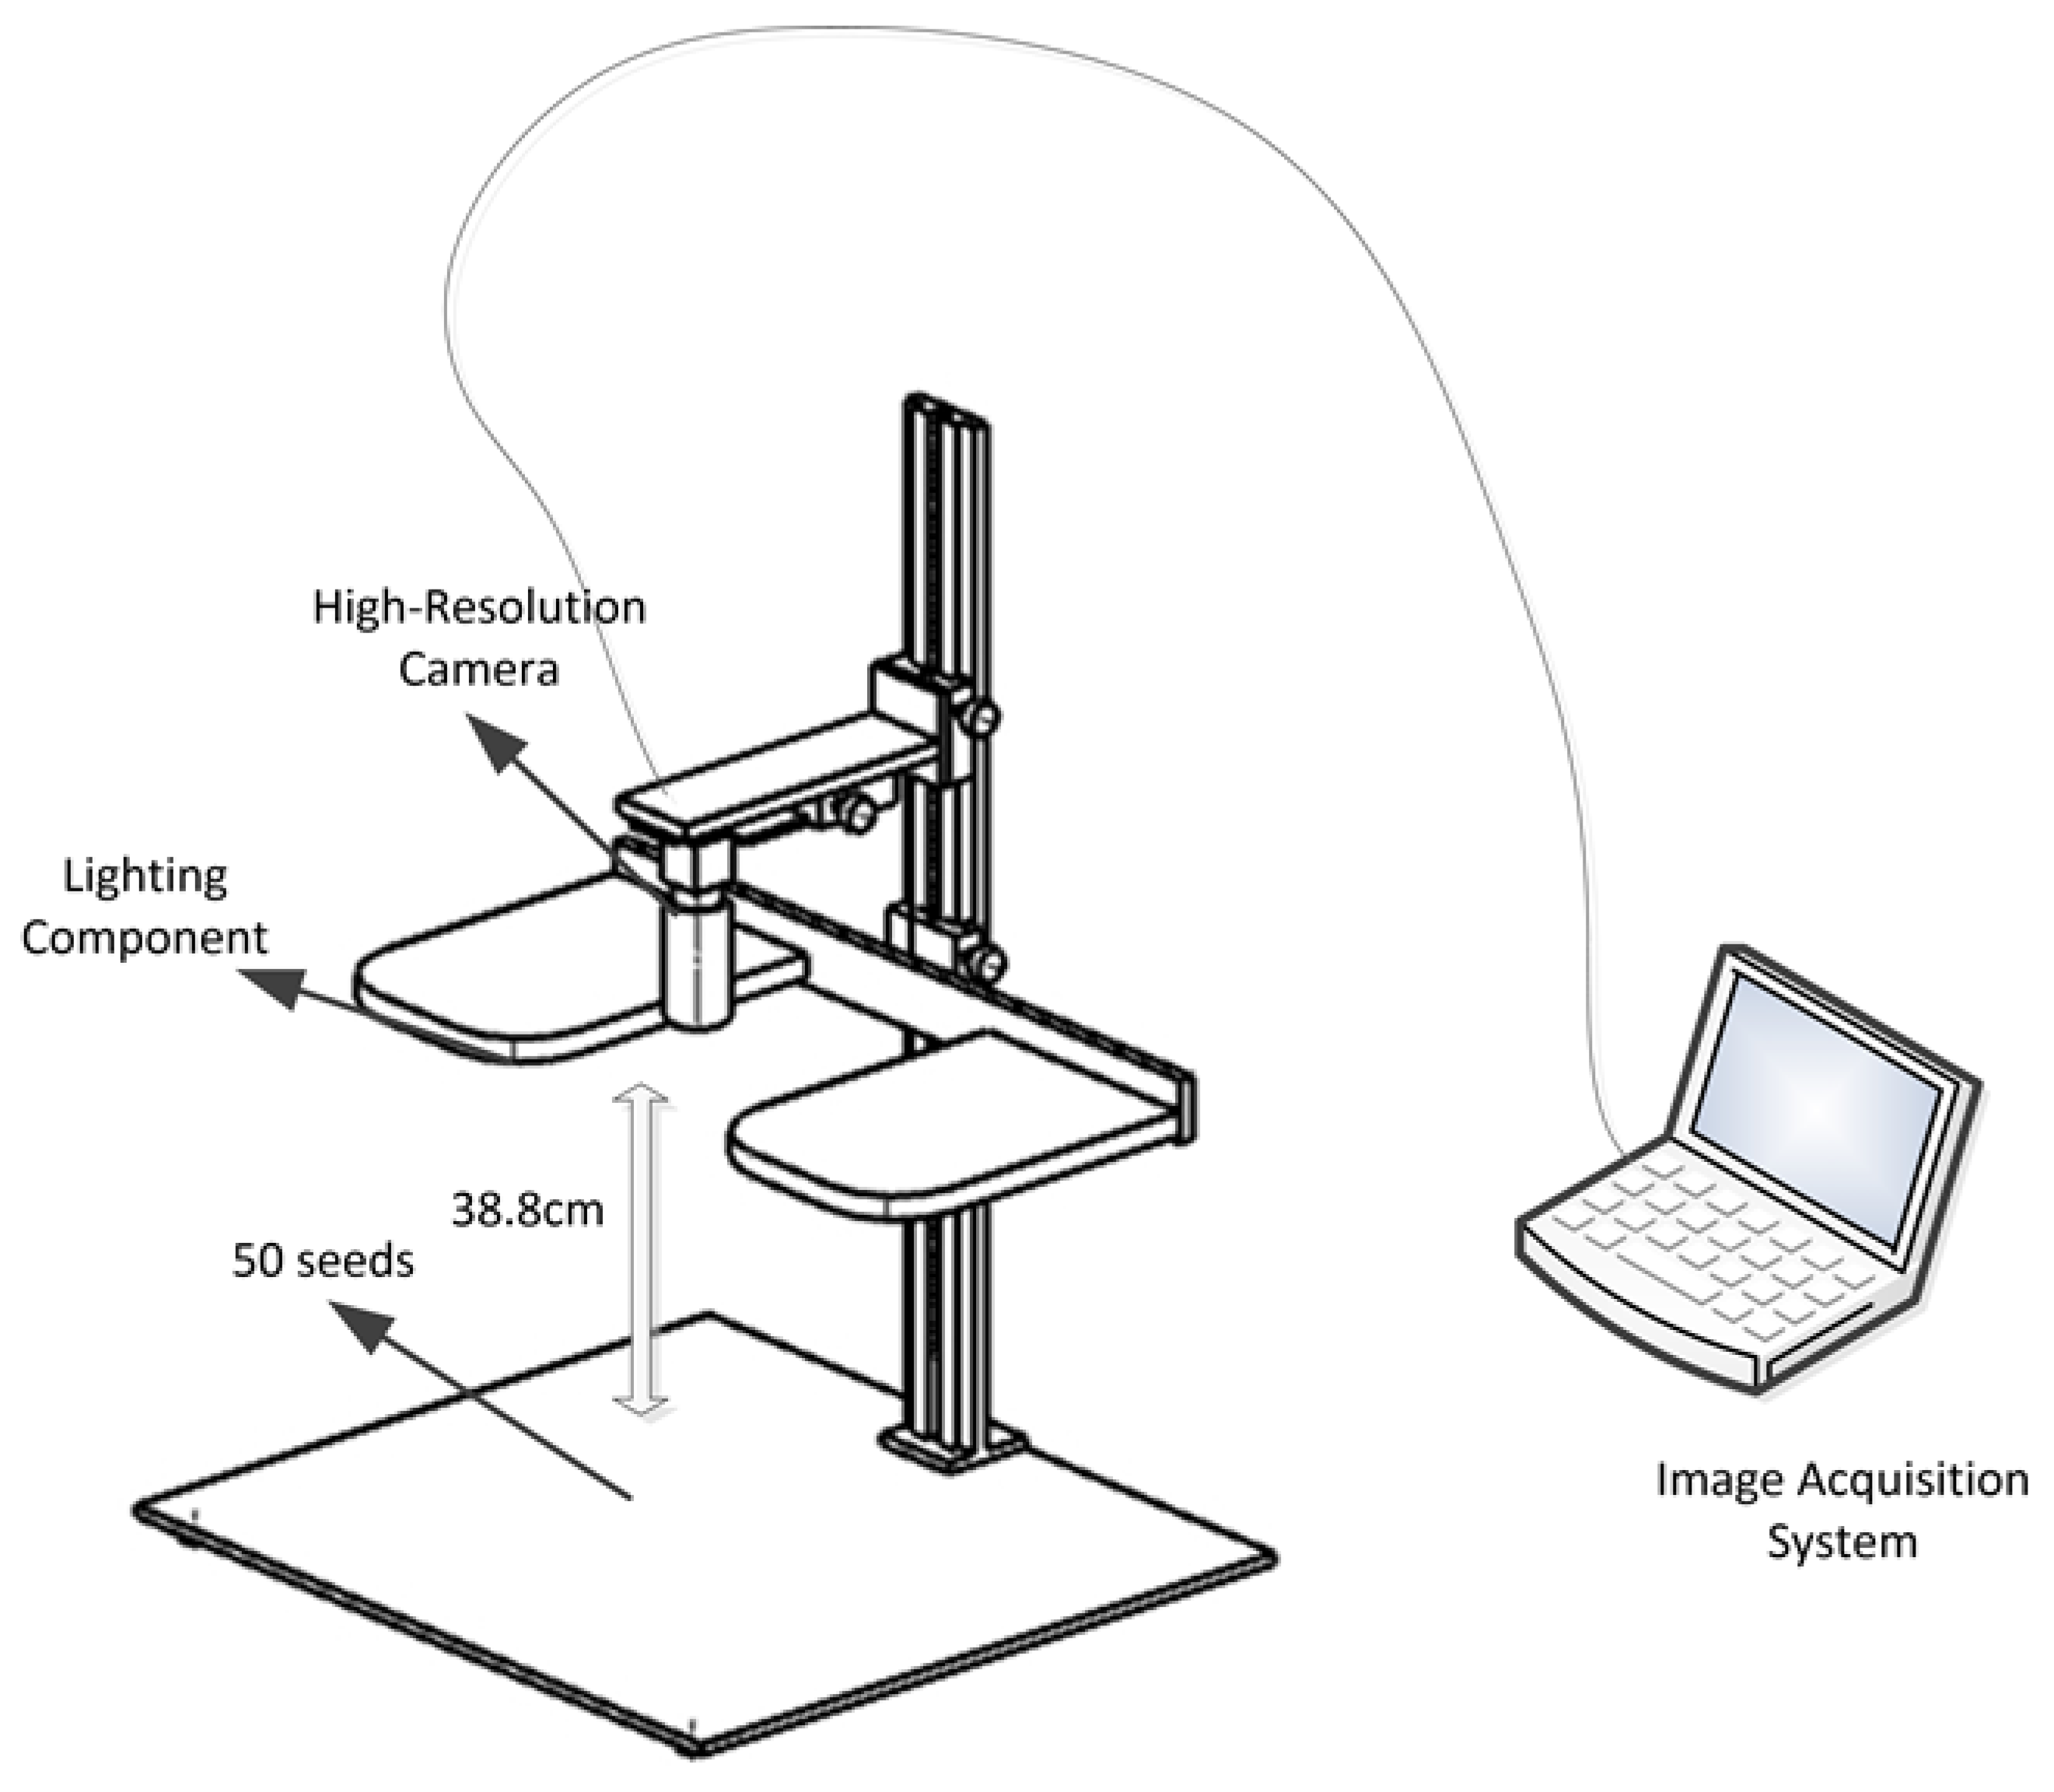
2.1.1. Image Acquisition

To stably capture surface image information of maize seeds, we constructed a maize seed image acquisition platform. As shown in Figure 1, the platform consists of the following four main components:
(1)
Adjustable Camera Platform: A custom-designed platform that supports fine-tuning of camera height, ensuring precise adjustment of the shooting angle. The adjustable height range is from 10 cm to 50 cm.
(2)
Lighting Component: The system consists of two LED lights, both from the brand RL and model RL-11, with a color temperature range from 2700 K to 5500 K. These lights provide uniform illumination to optimize image quality. The LED lights are manufactured in Shaoxing, China, by Shaoxing Creative Imaging Equipment Co., Ltd.
(3)
High-resolution Camera: Equipped with a 20-megapixel area scan camera, model MV-CS200-10UC by Hikvision, along with a 2000-pixel adjustable zoom lens for brightness control, ensuring high-precision image capture. The equipment manufactured by Hikvision in Hangzhou, China.
(4)
Image Acquisition System: A computer running Hikvision image acquisition software MSV-4.1.0, used for real-time image data capture and processing.
Figure 1. Maize seed image acquisition platform.
Agronomy 15 00710 g001
During the shooting process, we used white velvet paper as the background, which helps reduce reflections and increase contrast during the shooting process. The background was placed parallel to the camera at a distance of 38.8 cm. The best imaging effect of maize seeds occurs at 38.8 cm, where the image is clear and not blurry. All maize seed images were captured at this distance. The image acquisition system utilized Hikvision MVS 4.1.0 software, and the image resolution was set to 1920 pixels × 1080 pixels. Images were captured without the use of image enhancement filters or automatic exposure adjustments. For image collection, we mixed high-quality seeds and defective seeds in a single bag, randomly grabbed 50 seeds, and randomly scattered them within the capturing area. We then pressed the shutter to capture the maize seed images. After shooting, the photographed seeds were set aside and not returned to the bag. The standard for maize seed classification defines intact seeds as those with no visible damage, while damaged seeds, as shown in Figure 2 are those exhibiting visible defects. Another 50 seeds were grabbed from the bag, repeating the process until all the seeds were photographed. In total, 508 images were collected, with a total sample size of 25,400 seeds, including 14,100 intact seeds and 11,300 damaged seeds. The annotation example is shown in Figure 2.
The maize seed variety used in this study is “Zhengda 809”. During the research, both intact maize seeds and various defective seeds were collected, including seeds with embryo defects, insect damage, and endosperm defects. A total of 508 images were captured, with each image containing 50 maize seeds. These seeds were randomly mixed, combining healthy seeds with different types of defective seeds, and were randomly scattered within a designated area on the experimental platform, as shown in Figure 3. A total of 25,400 samples were collected, including 12,340 healthy seeds and 13,060 damaged seeds. The 508 images were then divided into training, validation, and test sets in a 7:2:1 ratio, with 355 images allocated to the training set, 102 images to the validation set, and 51 images to the test set.

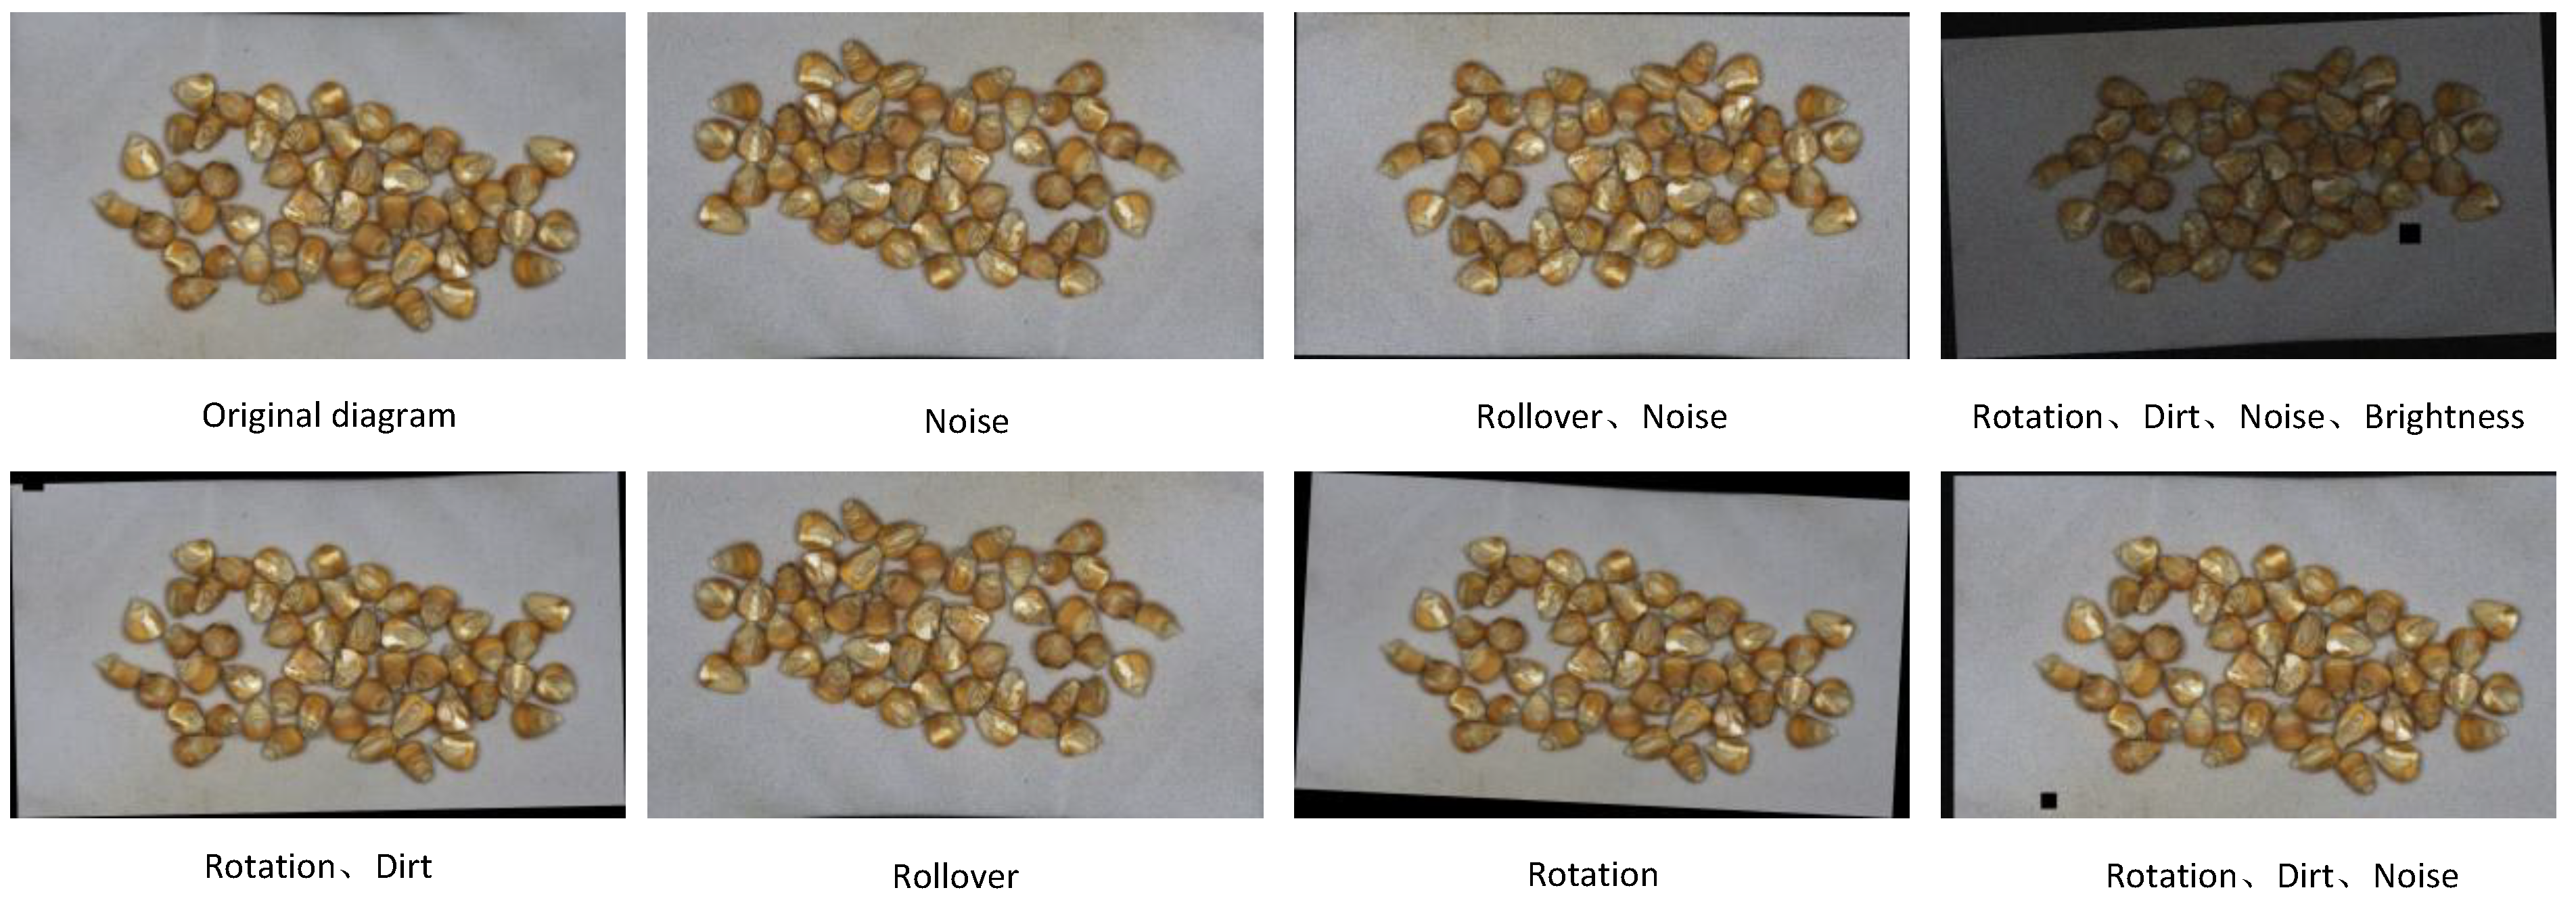
2.1.2. Data Enhancement

The sample data of maize seeds are relatively limited, which may pose a risk of overfitting during model training. Specifically, the current dataset contains only 508 images, with a limited number of damaged seeds and a relatively uniform collection environment. These factors may result in the sample range being insufficient to fully capture the various characteristics of maize seed damage. By adding noise and adjusting brightness, seed images under various lighting conditions and shooting environments are simulated to increase the diversity of the dataset, allowing the model to better adapt to changes in real-world scenarios. In addition, defect simulation techniques are used to generate seed damage images of different types and degrees, ensuring that the model can learn a broad distribution of damage features, thus improving its ability to recognize actual damage conditions. Through translation operations, the robustness of the model to changes in seed position is enhanced, enabling it to identify damaged seeds at different positions and angles. To improve the model’s robustness, generalization capability, and overall performance, this study systematically enhanced and expanded the dataset. Specifically, various processing techniques were applied to the image data using the OpenCV tool (https://opencv.org/), including noise addition, brightness adjustment, blemish simulation, and translation. The noise adjustment range is set from 0.01 to 0.05, the brightness adjustment range is from 0.2 to 0.5, and the rotation angle is between ±5° and ±15°. The cutout length is set to 100 pixels with a quantity of 1. The translation operation includes horizontal and vertical shifts, both set to 1/3 of the image width and height. The padding method uses edge reflection to avoid black borders. By employing random combinations of these processing methods, the dataset was expanded by seven times. Additionally, the LabelImg tool was used for data annotation, categorizing the seeds into two classes: healthy seeds (good) and defective seeds (bad), with defective seeds encompassing embryo defects, fractures, insect damage, and endosperm defects. The expanded dataset and its processing effects are shown in Figure 4. To better understand this study, a flowchart has been created to illustrate the main processes, such as image acquisition, preprocessing, training, and testing, as shown in Figure 5.

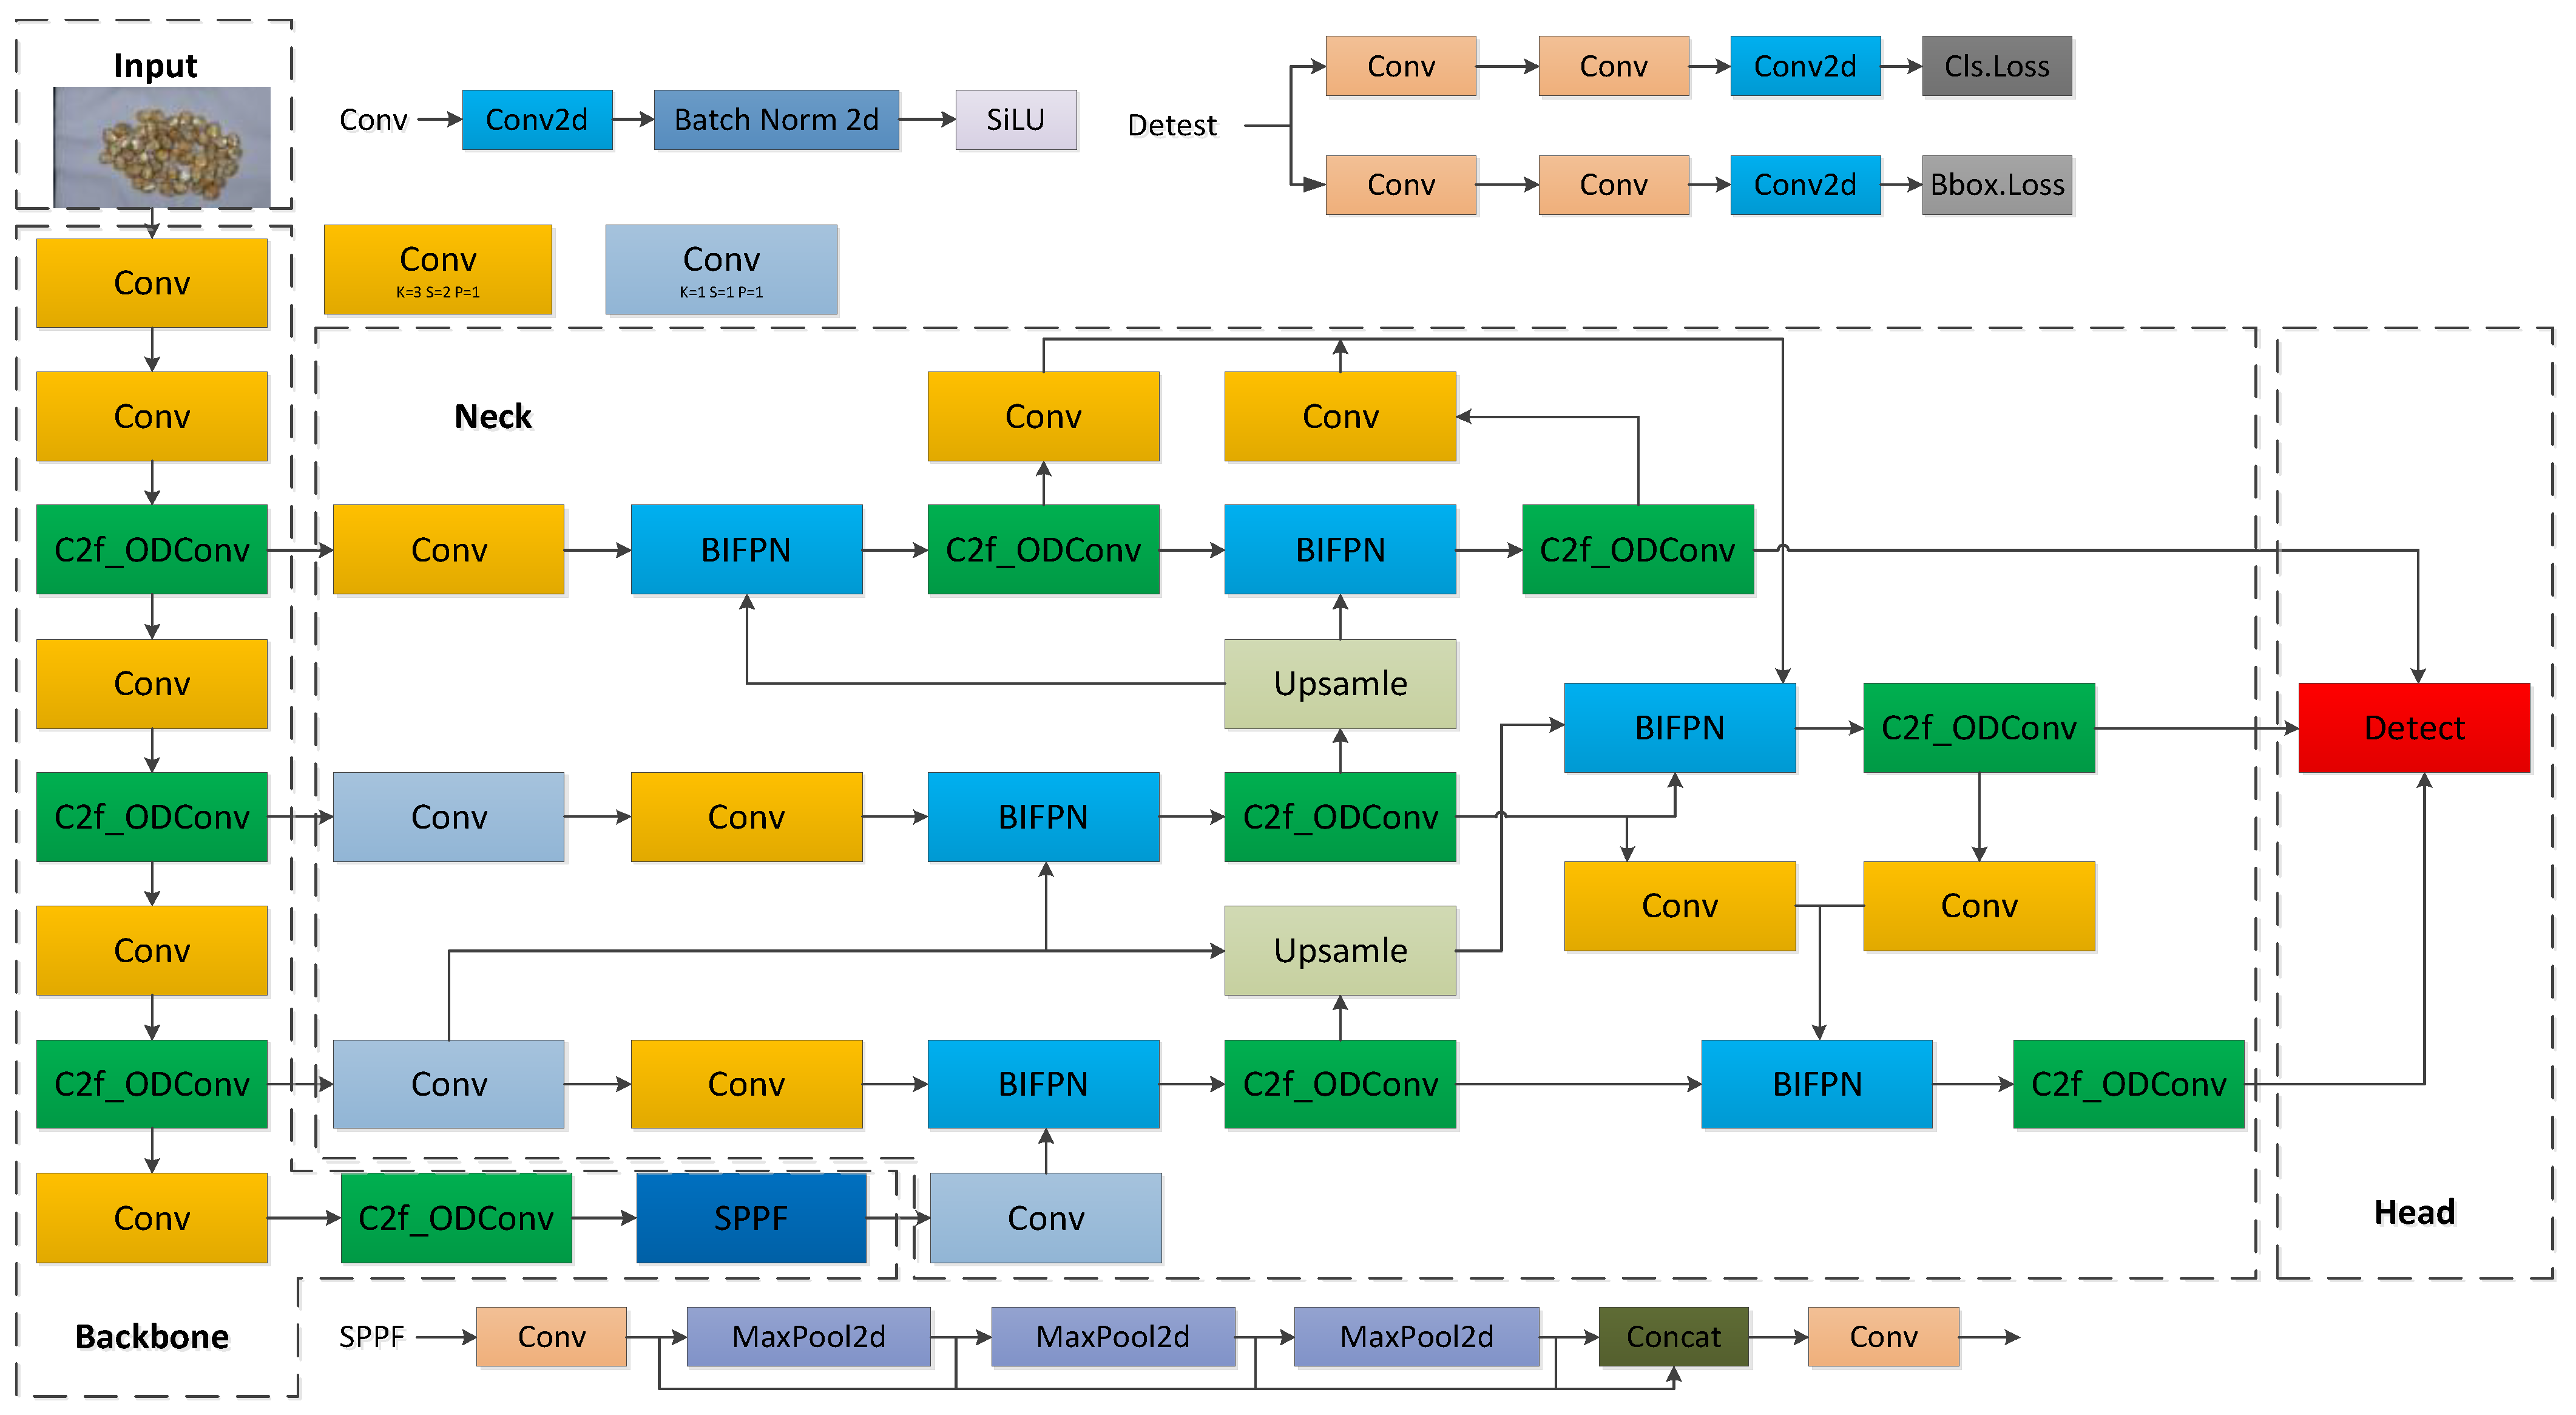
2.2. The Network Structure of OWB-YOLO

YOLOv8 [21] is a single-stage object detection algorithm that offers high accuracy, low latency, efficient computation speed, and wide applicability. It has been widely used in agricultural fields, such as pest detection, seed quality inspection, and crop monitoring. YOLOv8 provides five different versions: YOLOv8-n, YOLOv8-s, YOLOv8-m, YOLOv8-l, and YOLOv8-x. Although the network structures of these versions are the same, they differ in depth and width, with optimizations made primarily based on model size and computational complexity to suit different application scenarios and hardware environments. Among them, YOLOv8-n has the fewest parameters and computational load, making it the chosen baseline model for improvement in this study. The network structure of YOLOv8-n can be broadly divided into four parts: the input layer, feature extraction network layer, feature fusion layer, and output layer. The feature extraction network layer is responsible for extracting important features from the input image, while the feature fusion layer enhances the network’s multi-scale detection ability by fusing features of different sizes. YOLOv8 uses the CIoU loss function, optimizing bounding box regression loss, confidence loss, and classification loss to achieve accurate object detection results.
To enhance the model’s ability to extract features of damaged maize seeds, this study designed the C2f-ODConv module to improve the model’s ability to capture local information, particularly in the complex scenarios of stochastic maize seed distribution. The improved BIMFPN module optimizes the fusion of shallow and deep features, reducing model complexity and minimizing detail loss, thereby improving detection accuracy. To accelerate model convergence and improve detection precision, the traditional bounding box loss function has been replaced by WIoU [22], significantly increasing both accuracy and convergence speed. The structure of the OWB-YOLO model is shown in Figure 6.

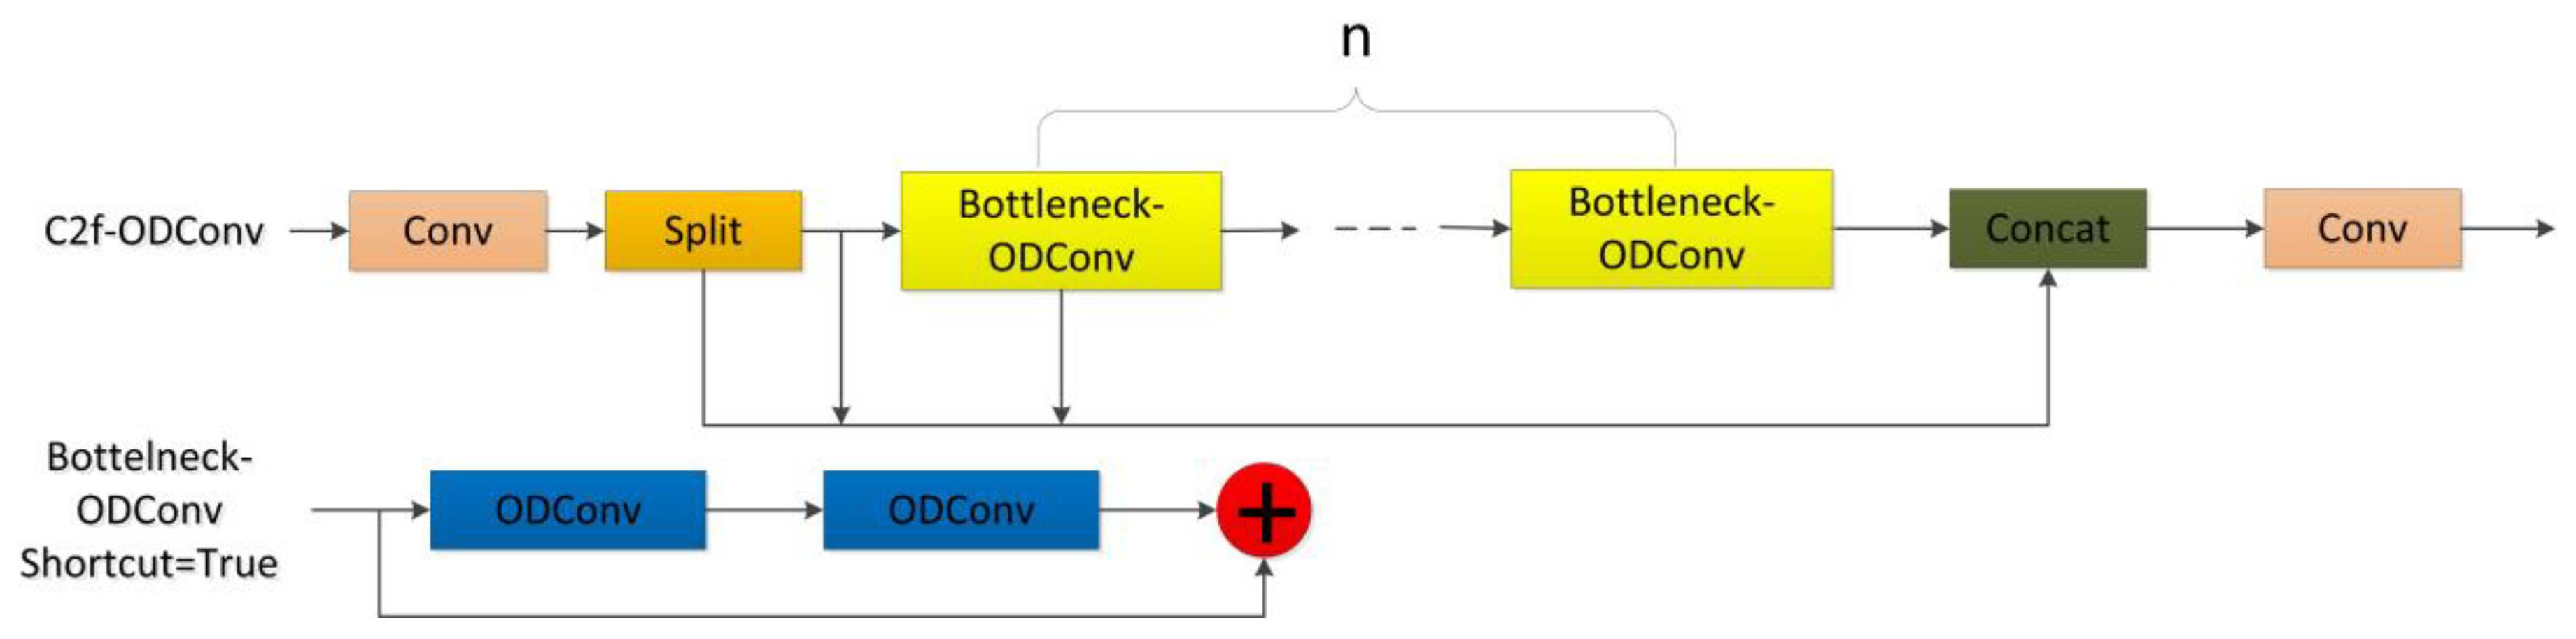
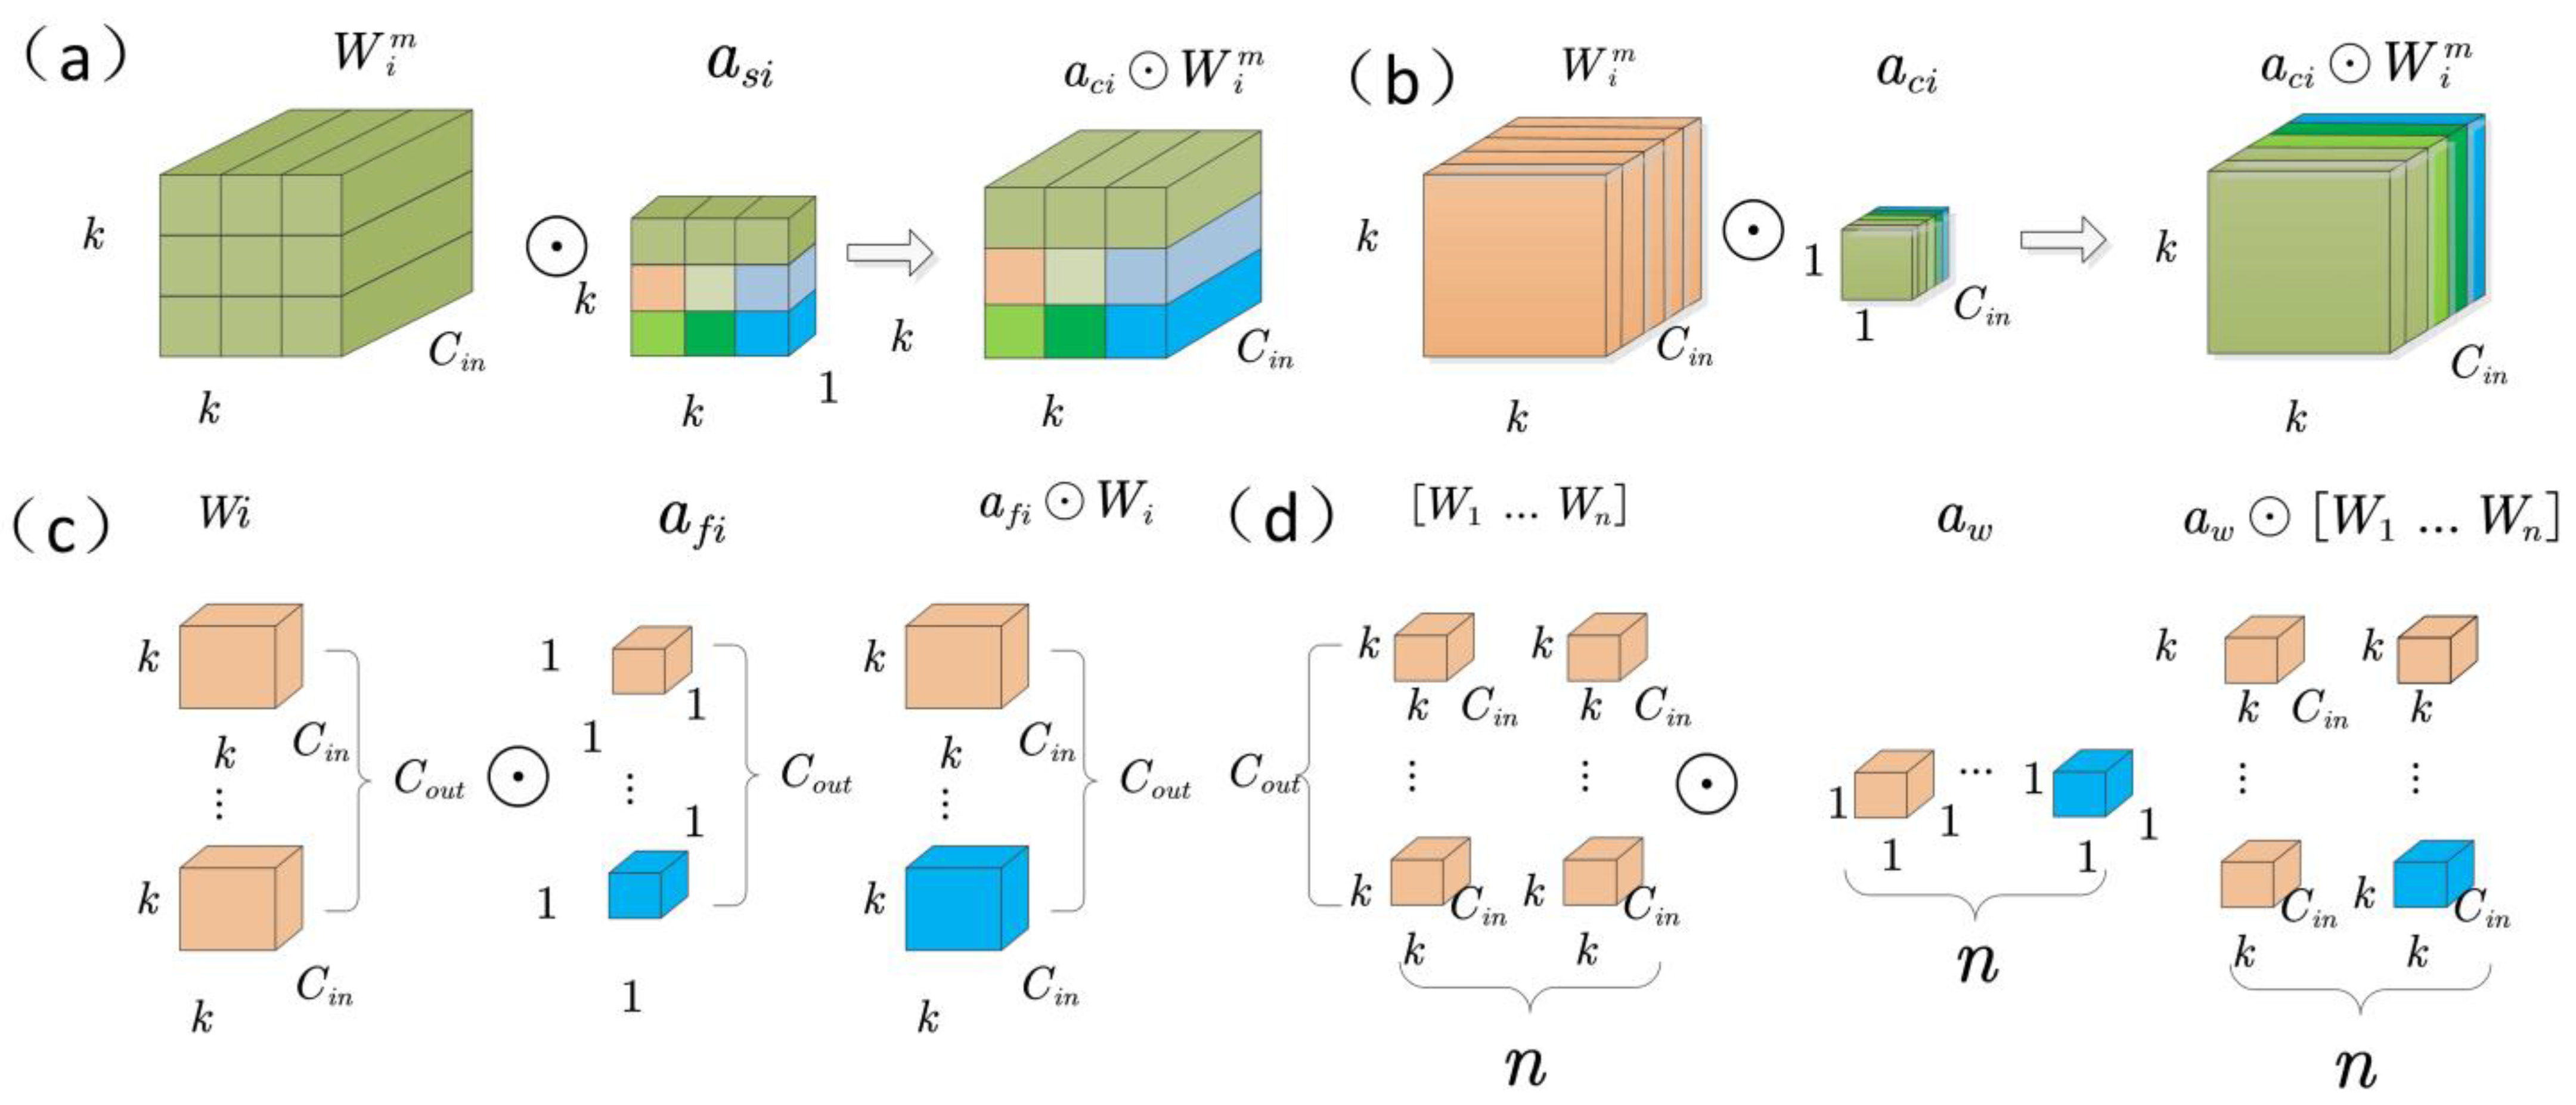
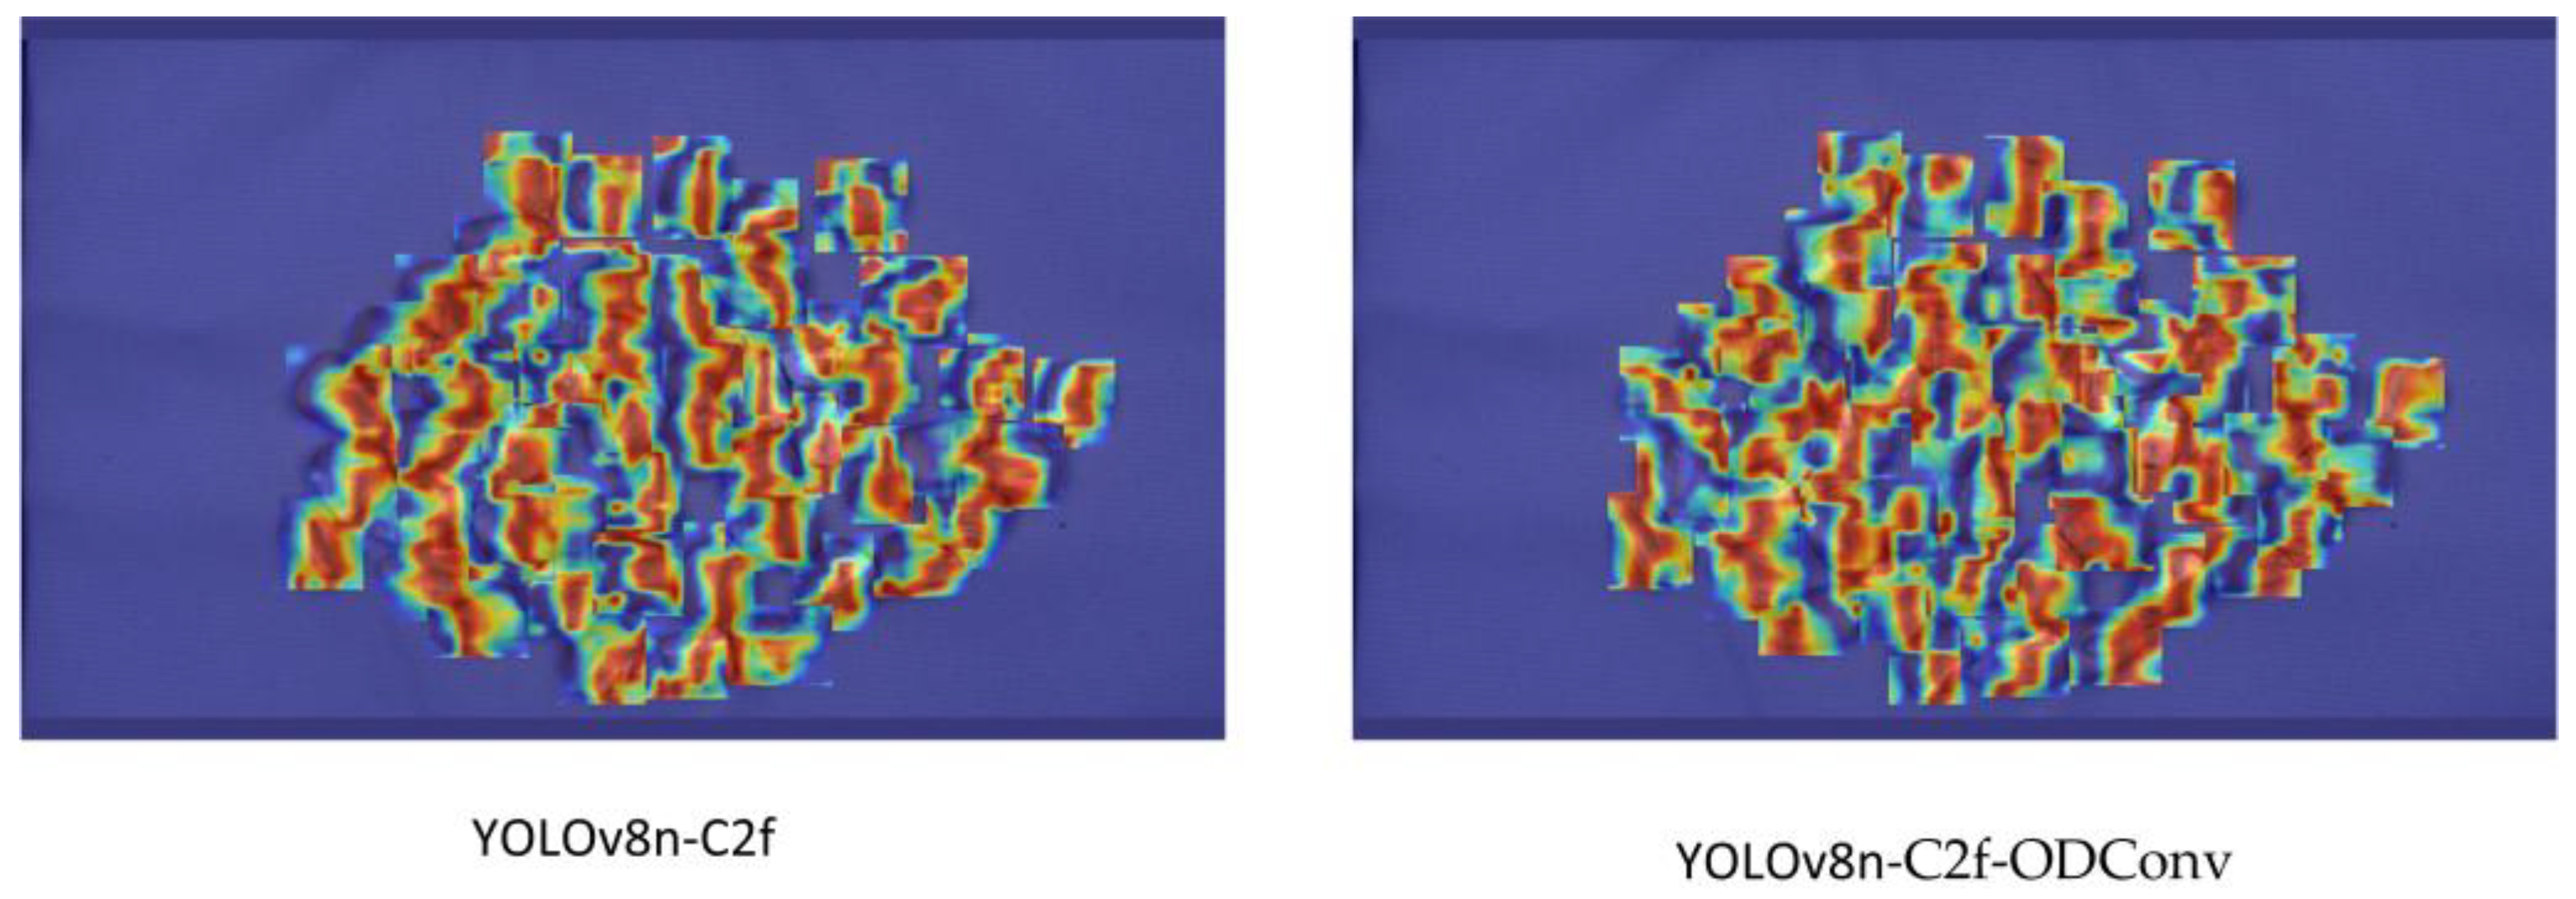
2.2.1. C2f-ODConv Attention Mechanism

To enhance the ability to extract damaged features of maize seeds, we designed a C2f-ODConv module to replace all C2f modules in both the backbone and neck modules, as shown in Figure 7 The Bottleneck block in the C2f module still relies on traditional convolution. However, compared to dynamic convolution [23], traditional convolution has inherent limitations when processing 3D convolutional kernel information. Traditional convolution uses static convolution kernels, which, while simpler to implement, cannot dynamically adjust the weights of the kernels based on specific inputs. This lack of flexibility can lead to insufficient feature extraction and reduced computational efficiency, ultimately negatively affecting overall performance.
Dynamic convolution adjusts the shape and size of the convolution kernels based on the characteristics of the input data, thus adapting to data of different sizes. Unlike traditional convolution, dynamic convolution performs the convolution operation by linearly weighting multiple convolution kernels, where the weighting values are related to the input data. As a result, the operation of dynamic convolution is input-dependent. Specifically, the dynamic convolution layer performs a linear combination of multiple convolution kernels and applies dynamic weighting to the convolution operation using an attention mechanism. This allows the weights of the kernels to be adjusted according to the characteristics of each input sample, significantly improving the flexibility and adaptability of feature extraction. The formula can be expressed as follows:
Y = i = 1 N   a i X K i
Here, a i is the dynamic weighting coefficient related to the input features, X is the input data, K i is the i convolution kernel, represents the convolution operation, and Y is the output feature map.
However, the strong adaptability of dynamic convolution in feature extraction, there are still limitations in the design of kernel space dimensions, input channels, and output channels, which may lead to inefficient computation.
To address these issues, the ODConv module introduces a multidimensional attention mechanism. This module focuses not only on the weights of the convolutional kernels but also on learning attention in parallel across the four dimensions of the kernels, learning attention for each dimension separately. This design allows the ODConv module to excel at extracting complex features, especially when handling the characteristics of damaged maize seeds. Compared to the C2f module, ODConv utilizes the weighted mechanism of dynamic convolution by linearly combining multiple convolution kernels and adaptively adjusting the weights based on input features. This approach, compared to traditional convolution operations, effectively reduces the number of parameters. ODConv dynamically adjusts the shape and size of the convolution kernels, optimizing the convolution operation according to the characteristics of the input data. This allows the model to more flexibly adapt to the diversity of different inputs, thereby enhancing its feature extraction capability. In comparison to static convolution kernels, ODConv is more capable of capturing complex and multi-scale feature information. The formula definition for the ODConv module is as follows:
y = ( a w 1 a f 1 a c 1 a s 1 w 1 + + a w n a f n a c n a s n w n ) × x
In the formula, x R h × w × c i n and y R h × w × c o u t represent the input features and output features, respectively; w i denotes the i -th convolutional kernel composed of c o u t filters; w i m R k × k × c i n and m = 1 , c o u t represent the m -th filter of the i -th convolutional kernel; indicates the multiplication operation along different dimensions of the kernel space; α c i R k × k assigns different attention scalars to the convolution parameters (each filter of the convolutional kernel) at the k × k spatial position; α c i R c i n assigns different attention scalars to the c i n channels of each convolution filter; and α w i is a scalar used for weighting w i , which allocates the attention scalars to the entire convolution kernel, similar to the attention scalars in dynamic convolution. The ODConv module accumulates the four types of attention into the convolution kernel, as illustrated in Figure 8. By incorporating the attention types based on channel number, position, filter, and convolution kernel weights into the convolution kernel w i , it effectively integrates the four types of attention.
Based on the above analysis, the ODConv module exhibits exceptional performance in feature extraction. This study integrates the ODConv module into the C2f module to further enhance the extraction capability of maize seed features and optimize the integration of contextual information. Specifically, we replace the standard convolution in the Bottleneck layers of the C2f module with ODConv convolution. This adjustment not only preserves the basic architecture of the C2f module but also effectively enhances the feature extraction capability of the backbone network, allowing the neck section to better fuse features. In the modified C2f module, when processing the input feature map, standard convolution operations are first performed, and then the feature map is split into two parts. One part of the feature map undergoes convolution calculations through n Bottleneck-ODConv modules, while the other part remains unchanged. Subsequently, these two parts of the feature map are merged to generate the final output feature map. This improved module effectively captures gradient flow information and enhances attention to the characteristics of the convolution kernel through the four-dimensional parallel learning of the ODConv module. This improvement reduces the computational load of the model and significantly enhances the performance of maize seed detection.

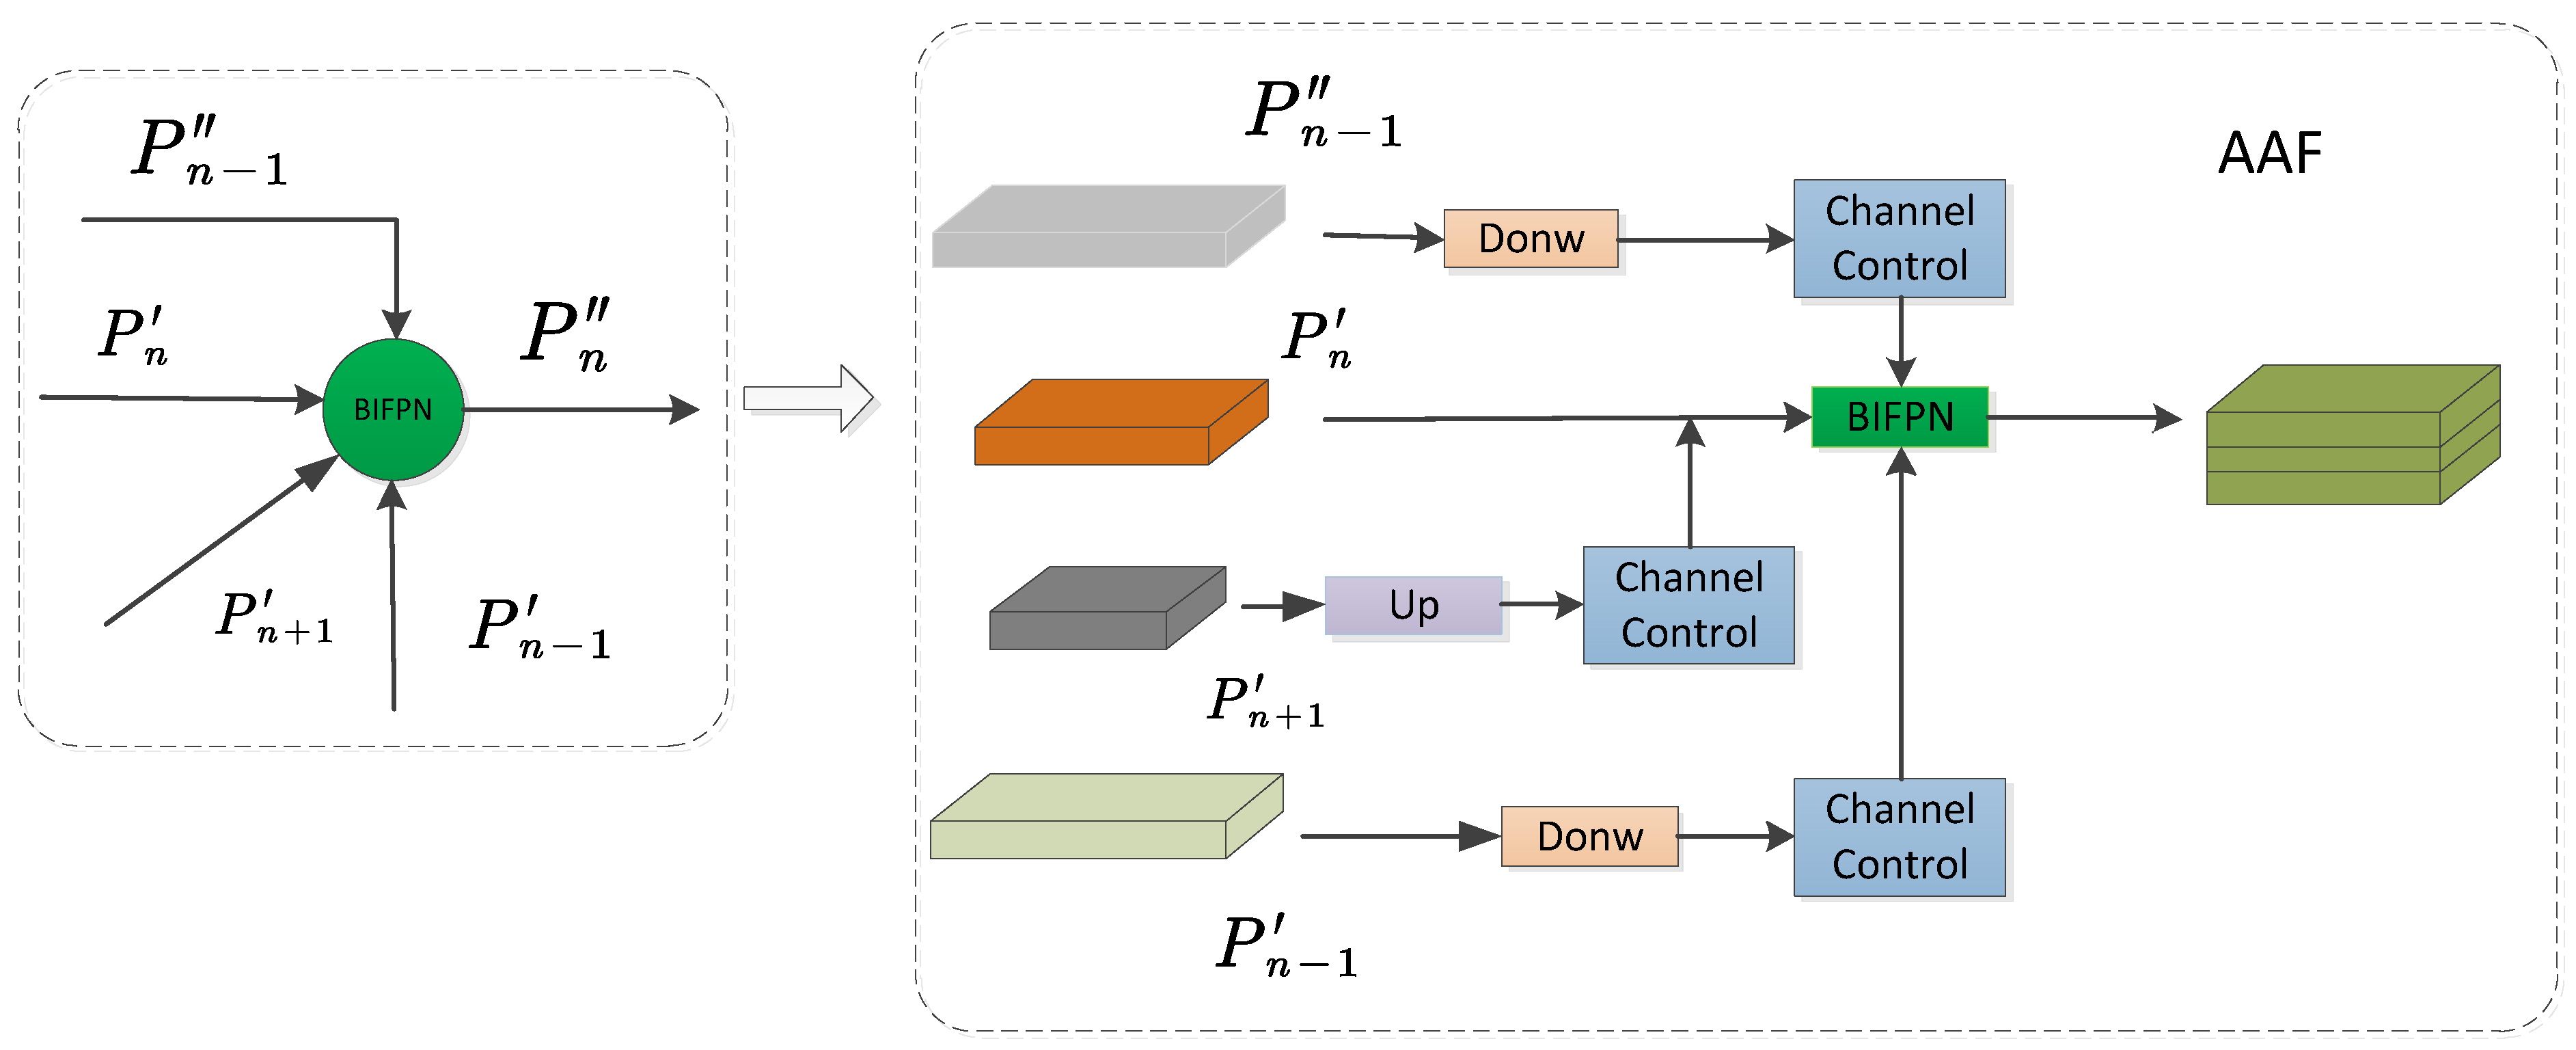
2.2.2. Neck Network Improvement

The YOLOv8n model utilizes networks such as FPN (Feature Pyramid Network) and PAN (Path Aggregation Network) as the neck networks [24], playing a crucial role in connecting the backbone network to the detection head. This design significantly enhances the model’s flexibility in handling targets of different sizes, enabling it to effectively detect objects of various dimensions, thereby improving overall detection accuracy.
Nevertheless, the YOLOv8 model still has certain limitations in the adaptive integration of high-level semantic information and low-level spatial information. Although the feature enhancement module in the neck can provide richer and more distinctive features, thereby improving the model’s feature representation capability and supplying higher-quality features for subsequent detection layers, the effective integration of high-level and low-level information still requires further optimization. This inadequacy in integration may affect the model’s performance in complex scenarios, especially when it is necessary to consider both detailed information and overall context simultaneously. Therefore, to further enhance the detection capability of YOLOv8, it is essential to explore more advanced feature fusion techniques to achieve more efficient information integration and utilization.
This study introduces the BIMFPN module into the neck network of the YOLOv8n model to enhance the feature fusion effect. The neck network of OBW-YOLO adopts a multi-branch auxiliary FPN structure, where the Shallow Auxiliary Fusion (SAF) [25] module is primarily used to combine the outputs from the backbone network and the neck network, effectively retaining shallow feature information, and thus promoting the optimization of the subsequent learning process. The Shallow Auxiliary Fusion (SAF) module, compared to common feature fusion techniques such as FPN and PAN, offers higher selectivity, avoids feature redundancy, and improves the detection ability for small objects. On the other hand, the core of the gradient combination in the Deep Embedded Advanced Auxiliary Fusion (AAF) module consists of three components: the weighting mechanism, backpropagation, and gradient updates. By transmitting more gradient information, it increases the diversity of information at the output layer, further improving the model’s performance. The BIMFPN module fuses feature maps of different scales through the BiFPN method in a weighted addition format, while also introducing learnable weights to dynamically adjust the contribution of each scale feature map during the fusion process. Compared to simple feature concatenation or direct addition, the weighted addition method is more flexible and can better utilize features from different levels. The ReLU activation function is used to ensure that the weights are non-negative, allowing the model to automatically optimize the weight contributions of various scale features during the training process.
O u t p u t = i R e L U w i · F i
Among them, w i is the learnable weight, and F i is the feature map.
In the backbone network, retaining shallow spatial features is crucial for enhancing the detection capability of small objects. However, shallow features are susceptible to noise due to their foundational information. Therefore, we treat these features as auxiliary branches, combining them with deep network features to ensure more stable and accurate subsequent learning. Based on this requirement, we propose the Shallow Auxiliary Fusion (SAF) module, the specific principles of which are illustrated in Figure 9.
The core of the SAF module lies in combining high-resolution shallow features from the same level of the backbone network with deep features, ensuring that key spatial localization information is preserved while enhancing the network’s spatial feature representation capability. To achieve this fusion operation, the BiFPN introduces three 1 × 1 convolutional layers before entering the neck network at the P3, P4, and P5 feature layers to adjust the number of channels.
Let the feature maps with the same dimensions and consistent channel numbers be denoted as P n 1 , P n , and P n + 1 , representing feature maps of different sizes but with the same channel number, while P n , P n , and P n represent the three paths in the neck network. The upsampling operation is indicated by U ( · ) , and “Down” represents 3 × 3 downsampling, combined with batch normalization layers. The convolution operation using the SiLU activation function is denoted as δ , and C is used to control the number of channels. The output results after processing through the SAF module are as follows:
P n = B I F P N ( δ ( C ( D o w n P n 1 ) ) , P n , U P N + 1 )
Figure 9. Structure of the SAF module.
Agronomy 15 00710 g009
To enhance the information flow between feature layers, the AAF module has been introduced into the deep network. This module is specifically designed for the fusion of multi-scale features by integrating high-resolution shallow features, low-resolution shallow features, features at the same level, and previous features, thereby improving the transmission capability between features, as shown in Figure 10. This fusion strategy enables the P4 output layer to effectively extract information from four different levels, significantly improving the detection performance of medium-sized targets. To further optimize the fusion process, the AAF module uses 1 × 1 convolutions to adjust the number of channels in each layer, balancing the influence of each feature layer on the final result. The resulting formula is as follows:
P n = B I F P N ( δ C D o w n P n 1 , δ C D o w n P N 1 , P n , C U P n + 1 )
Figure 10. AAF module structure diagram.
Agronomy 15 00710 g010
The BIMFPN module combines the SAF (Shallow Auxiliary Fusion) and AAF (Advanced Auxiliary Fusion) modules. The SAF module aims to combine shallow spatial information with deep features to retain more localization details, thereby enhancing the model’s performance in small object detection. The AAF module, on a deeper level, integrates multi-scale information, further optimizing the diversity and hierarchy of features, allowing the model to exhibit stronger expressiveness when detecting medium-sized objects. The combination of these two significantly enhances the model’s ability to detect different target scales. However, the SAF and AAF modules use concatenation (Concat) for feature fusion, which cannot effectively differentiate the importance of each feature layer, potentially affecting performance in detecting damaged maize seeds. To address this issue, a weighted BiFPN network was introduced, significantly improving the efficiency of multi-scale feature fusion and reducing the interference of redundant information, thereby enhancing the accuracy of object detection. The design of BIMFPN not only retains key features but also optimizes the feature fusion process, making the model more efficient and precise in complex scenarios. Additionally, replacing the C2f module in the neck with the ODConv module enables the model to dynamically adjust convolution weights to better adapt to changes in input features. The introduction of the ODConv module enhances feature representation capability, especially in handling complex backgrounds or occluded targets, significantly improving detection accuracy. This improvement allows the model to provide higher accuracy and reliability when facing various challenges.

2.2.3. Loss Function Improvement

The loss function of YOLOv8 can be seen as a “guide” during the model training process, used to evaluate the accuracy of object recognition in images. The loss function is mainly composed of four parts: localization error, confidence error, classification error, and balance error. First, it measures the position difference between the predicted bounding box and the ground truth bounding box. The localization error in YOLOv8 takes into account factors such as position, size, and aspect ratio. The CIoU loss function can be expressed as follows:
C I o U = I o U ρ 2 b ^ , b c 2 α ν
IoU is the Intersection over Union (IoU) between the predicted bounding box and the ground truth box c 2 , and ρ 2 b ^ , b is the Euclidean distance between the centers of the predicted box and the ground truth box, squared, and represents the diagonal length of the smallest enclosing box that contains both the ground truth and predicted boxes. ν is the aspect ratio difference, and α is the weight factor controlling the aspect ratio.
Confidence error (cross-entropy loss) measures whether the predicted box contains the object. It consists of two parts: the confidence error for the object box and the confidence error for the non-object box. The confidence loss is calculated using the following formula:
L c o n f = ( C ^ log C + 1 C ^ log 1 C )
In the formula, C ^ is the ground truth confidence label (0 or 1), and C is the predicted confidence by the model.
Classification error assesses the accuracy of predicting the object class. It calculates the probability distribution of each predicted box’s class and compares it with the ground truth label. The formula is as follows:
L c l s = c p c ^ l o g ( p c )
In the formula, p c ^ is the ground truth class label of the object, and p c is the predicted class probability.
Balancing errors by adjusting the ratio of positive and negative samples optimizes the training process, especially on imbalanced datasets. YOLOv8 employs Focal Loss to help balance the impact of positive and negative samples, reducing the interference from a large number of easily classifiable negative samples during training, and enhancing the training effectiveness of hard-to-classify samples. The formula is as follows:
L f o c a l = α 1 p t γ l o g ( p t )
In the formula, p t represents the predicted probability of the target category, α is the balancing factor, and γ is a crucial hyperparameter that adjusts the importance of hard and easy samples.
In the loss function of YOLOv8, the localization error, confidence error, and balancing error may underperform when dealing with small objects, dense scenes, and imbalanced data distributions, where CIoU (Complete Intersection over Union) might not be ideal. Especially in the case of randomly distributed maize seeds, high-density and complex backgrounds often lead to suboptimal detection performance. To address this problem, this study introduces Wise IoU (WIoU), a bounding box loss function based on a dynamic non-monotonic attention mechanism. WIoU eliminates the aspect ratio penalty term in CIoU and dynamically adjusts the quality evaluation mechanism of anchor boxes, enabling the model to focus more on moderately qualified anchor boxes, thereby significantly improving localization accuracy. In complex scenarios such as drone aerial photography, WIoU can adaptively adjust the weights of small objects, effectively enhancing detection performance. Additionally, WIoU balances the impact of high-quality and low-quality anchor boxes on model regression, strengthening the model’s generalization capability and comprehensively improving its overall performance [26].

3. Experiment

3.1. Experimental Configuration

The model training and testing are conducted on a 64-bit Ubuntu system with the following configuration: GPU is NVIDIA GeForce RTX 4090, CPU is Intel 8488C, and memory is 32 GB. Python 3.9, PyTorch 2.2, and CUDA version 12.1 are used for training.

3.2. Experiment Parameters Setting

The model’s hyperparameters are set as follows: the initial learning rate is 0.01, using the SGD optimizer with a momentum value of 0.937 and a weight decay coefficient of 0.0005. The learning rate adjustment factor (lrf) is set to 0.01. The batch size is 32, and training is performed for 300 epochs. Additionally, the IoU threshold for object detection is set to 0.7.
The training dataset, validation dataset, and test dataset are split in a 7:2:1 ratio. A learning rate warm-up strategy is applied, where the learning rate gradually increases from 0.0 to 0.01 over the first 3 epochs. Early stopping is employed with a patience value of 100, meaning training will stop if the performance on the validation set does not improve for 100 epochs. Moreover, common data augmentation techniques are used, including a 50% probability for horizontal flipping, scaling by a factor of 0.5, and translation with a shift of 0.1. For data preprocessing, input images are resized to 640 × 640 pixels to match the input requirements of the YOLOv8 model. All images are standardized prior to training, with pixel values scaled to the range [0, 1] and normalized using the mean and standard deviation to ensure consistency and stability of the data.

3.3. Evaluation Metrics

This experiment uses four evaluation metrics to measure model performance: recall, precision, mAP, Param, and GFLOPs. Precision refers to the proportion of actual positive samples among the samples predicted as positive by the model. Recall measures the model’s ability to identify all positive samples, and its calculation formula is as follows:
P = T P T P + F P
R = T P T P + F N
In the formula, FN represents false negatives, TP represents true positives, and FP represents false positives. The curve plotted with recall on the x-axis and precision on the y-axis is called the PR curve. The average value of the area under this curve is the AP value for that category, and its calculation formula is as follows:
A P = 0 1 P ( R ) d r
mAP is the sum of the average precision values for all categories, divided by the total number of categories. Its calculation formula is as follows:
m A P = i = 1 k A P i k c l a s s e s
mAP can be subdivided into mAP@0.5 and mAP@0.5:0.95. mAP@0.5 represents the results at an IoU threshold of 0.5, while mAP@0.5:0.95 is the average score calculated from an IoU value of 0.5, increasing by 0.05 until reaching 0.95. The higher the mAP value, the better the overall precision of the model.

4. Results and Analysis

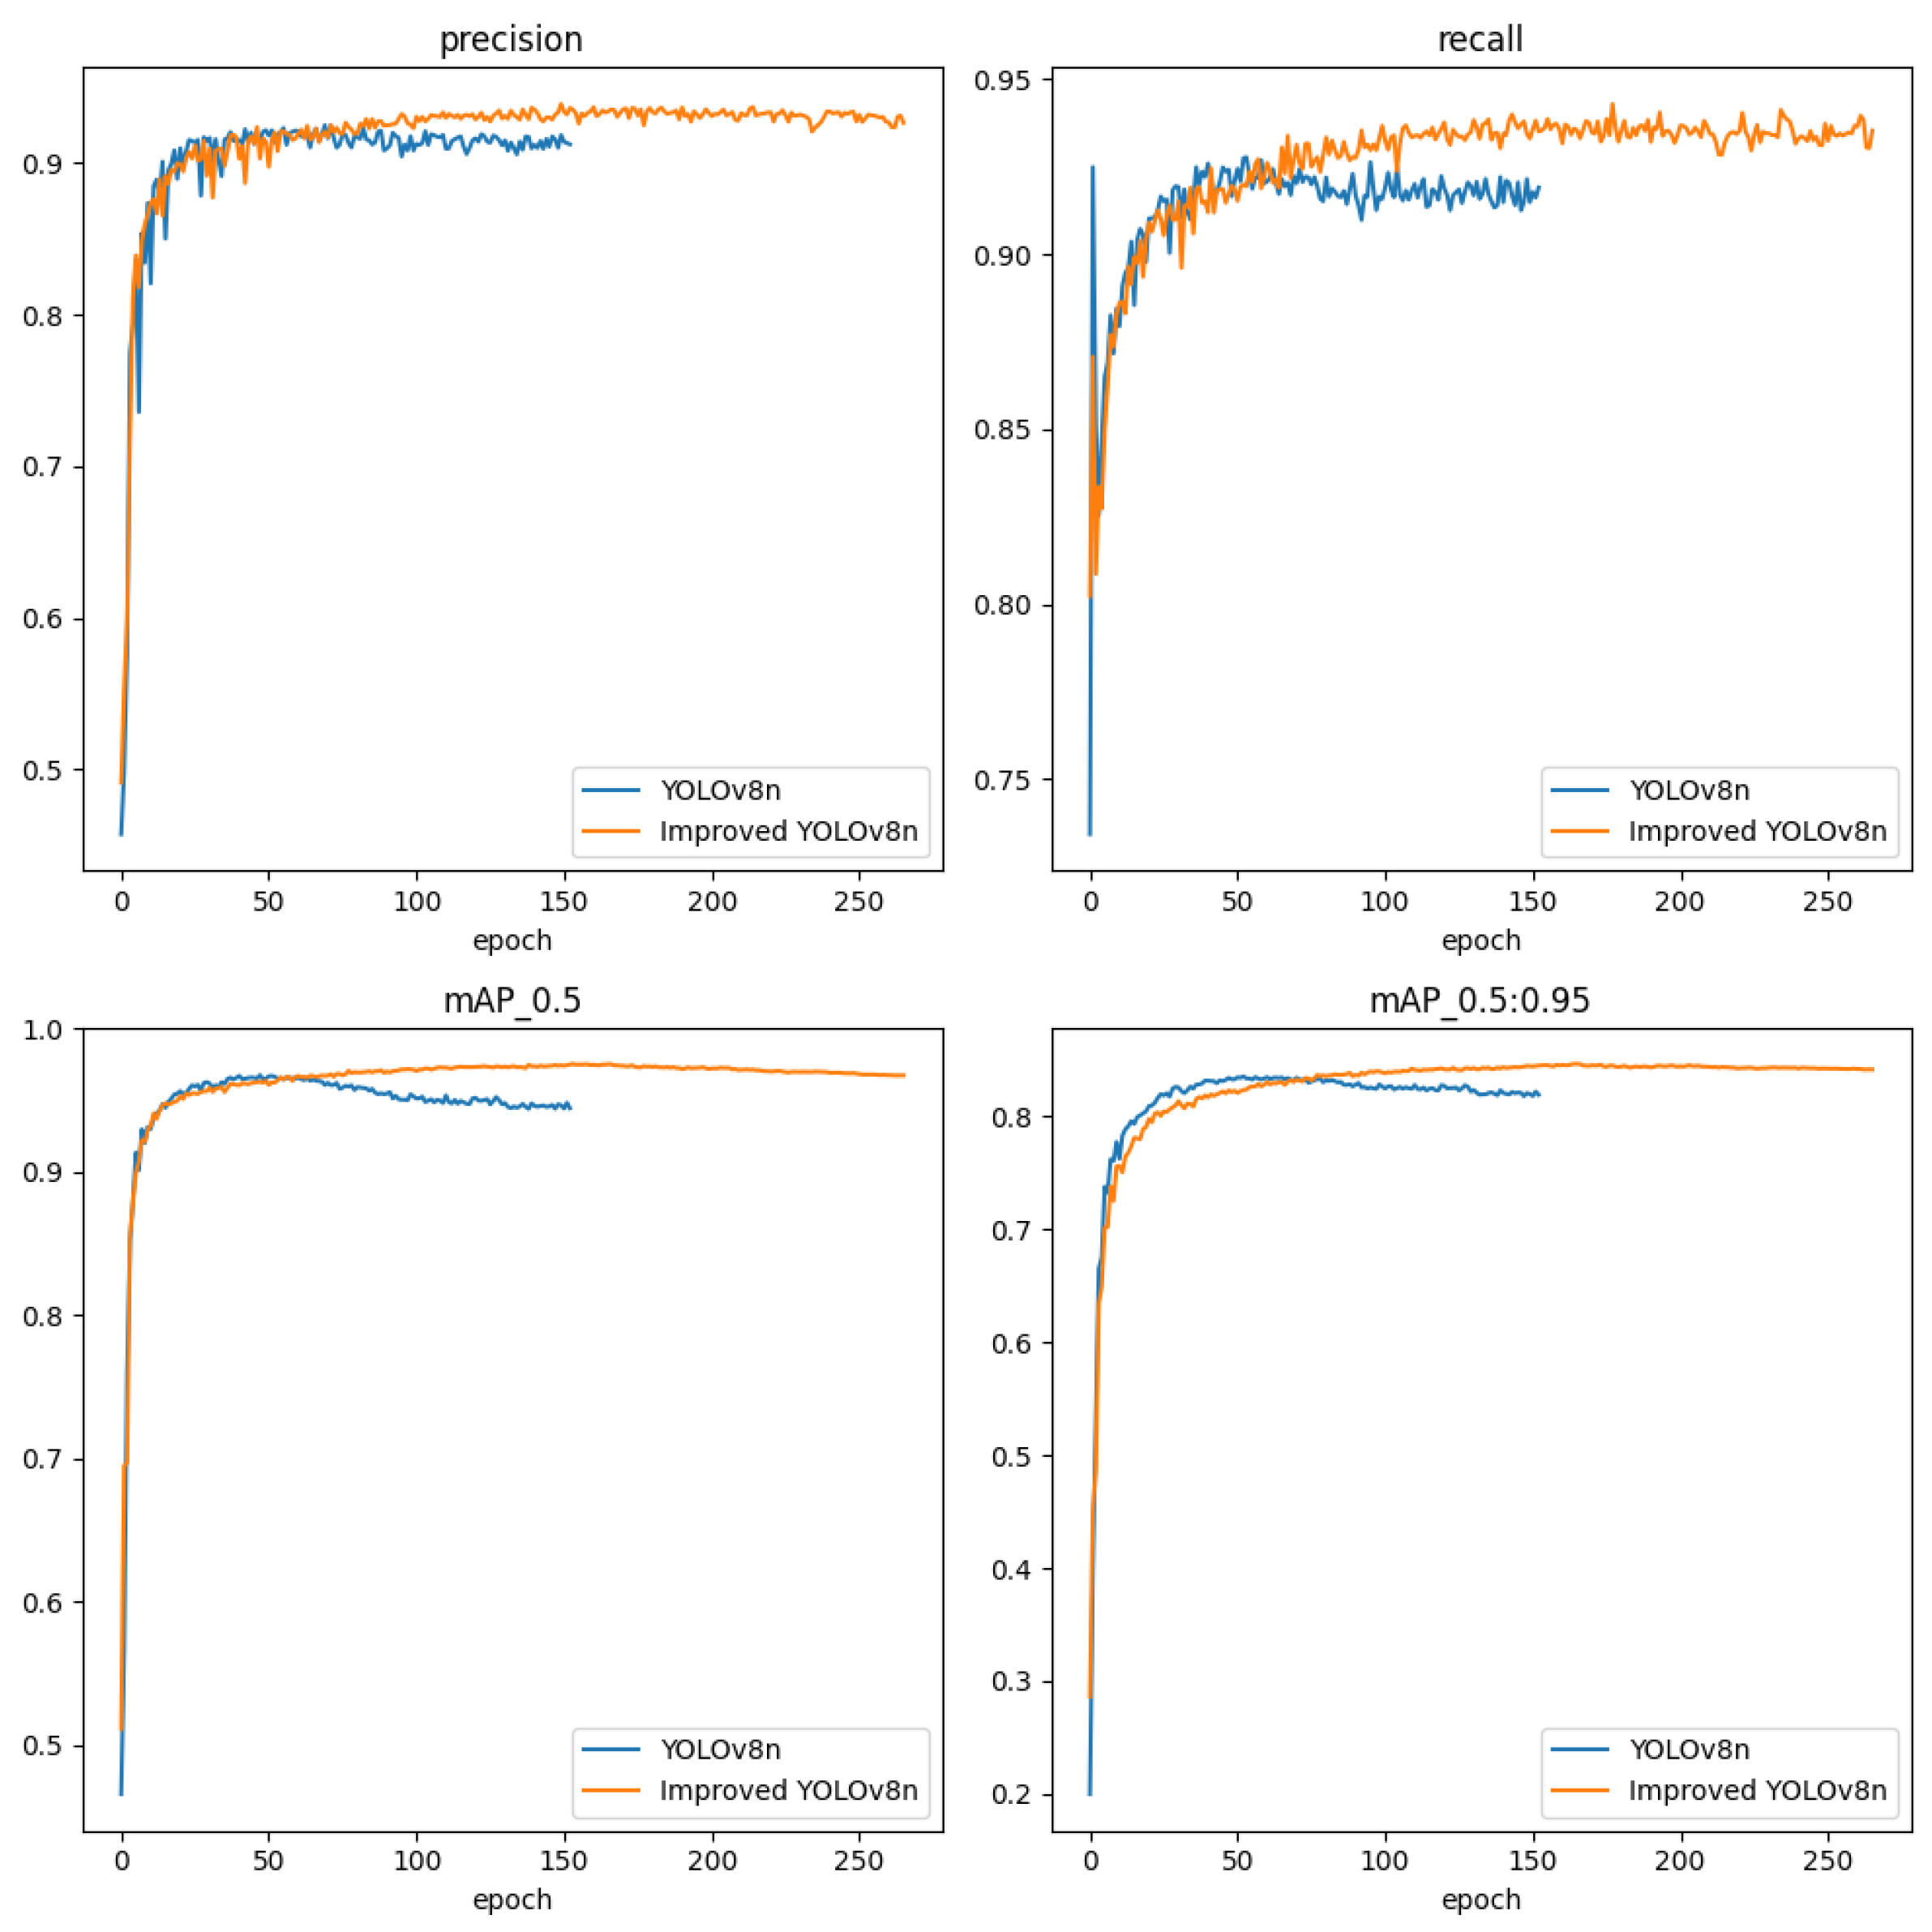
4.1. Comparison of Improvement Methods Effectiveness

To evaluate the performance of the proposed OWB-YOLO model, structural improvements were made to the YOLOv8n model, and various improvement methods were compared through experiments. To verify the effectiveness of the loss function, the modified network model compared CIoU [27] loss function, WIoU loss function, DIoU [28] loss function, GIoU [29] loss function, EIou [30] loss function, MpdIoU [31] loss function, and SIoU [32] loss function, as detailed in Table 1.
Based on the analysis of the table data, the WIoU loss function demonstrates the best performance in the modified model. Compared to other loss functions, WIoU excels in comprehensive metrics such as precision, recall, and mean average precision. Therefore, the WIoU loss function significantly enhances the performance of the modified model, effectively improving the accuracy of object detection.
In the YOLOv8 model, the C2f (Cross-stage Partial with Fusion) module is an optimized residual module characterized by its lightweight and efficient design. This study replaces the C2f modules located at different positions in YOLOv8 with the C2f-ODConv module to explore the impact of this replacement on network performance, computational complexity, and parameter count, thereby seeking the optimal configuration.
Based on the data in Table 2, replacing the C2f module with the C2f-ODConv module demonstrates the best performance in both the backbone network and the neck network. Although replacing the modules individually in the backbone or neck networks results in a decrease in computational complexity (GFLOPs) and parameter count (Params/M), there is no significant improvement in the mAP@0.5 and mAP@0.5:0.95 metrics. However, when both modules are replaced throughout the entire network, mAP@0.5 increases by 0.6%, and mAP@0.5:0.95 increases by 0.5%. As shown in the heatmap in Figure 11, the heatmap generated by the network trained with the C2f-ODConv structure exhibits more vibrant colors compared to the original YOLOv8-C2f heatmap. This indicates that C2f-ODConv is more effective in extracting features of maize seeds.
The backbone network is responsible for extracting low-level features, while the neck network performs multi-scale feature fusion. Replacing the C2f module in only one part may lead to inconsistencies in feature coordination across different layers, affecting overall performance. When only the C2f module in the backbone network is replaced while keeping the neck network’s original structure, the features generated by the backbone may not be fully utilized by the neck network, resulting in inconsistencies in feature flow and impacting detection effectiveness. On the other hand, when both C2f modules in the backbone and neck networks are replaced, ODConv’s dynamic features work better. It ensures consistent feature representation and processing across network layers. ODConv uses dynamic convolution kernels. These kernels adjust their weights based on input data. This lets each convolutional layer optimize its processing. It also improves feature transfer and fusion. This mechanism keeps information consistent from the backbone to the neck network. It avoids information loss or inconsistency. ODConv improves feature transfer and fusion. This boosts model performance. First, dynamic weighted kernels adjust feature fusion based on input diversity. This ensures effective cross-layer feature transfer. Second, gradient optimization adjusts feature map weights. It improves gradient flow and prevents vanishing or exploding gradients. It also makes training more stable. Finally, cross-layer fusion uses weighted summation. It optimizes multi-scale feature combinations. This enhances feature diversity and expression. Overall, it improves model performance.

4.2. Ablation Experiment

According to the data in Table 3, replacing the C2f module in YOLOv8n with the C2f-ODConv module significantly improves the model’s performance. Specifically, precision increased by 1.2%, mAP@0.5 improved by 0.5%, and mAP@0.5:0.95 increased by 0.5%. Additionally, computational complexity (GFLOPs) decreased significantly from 8.1 to 5.8. After introducing the BIMAFPN structure, the model’s precision improved by 0.8% compared to the original model, indicating that this structure effectively enhances the detection of small targets, such as damaged maize seeds. Replacing the CIoU loss function with the WIoU loss function resulted in a 0.4% increase in precision, highlighting WIoU’s advantage in capturing the characteristics of damaged maize seeds. Combining the C2f-ODConv module and the BIMAFPN structure, the improved YOLOv8n model achieved gains of 1.7%, 0.3%, 1%, and 1.2% in precision, recall, mAP@0.5, and mAP@0.5:0.95, respectively. Compared to the original model, the improved model demonstrated enhancements of 2.1%, 0.4%, 1%, and 1.2% in precision, recall, mAP@0.5, and mAP@0.5:0.95, respectively. Meanwhile, GFLOPs and parameter count (Params) were reduced by 33% and 22.6%, respectively, indicating that the improved network structure not only enhances detection performance but also significantly optimizes computational efficiency.
This study set both the proposed model and the original YOLOv8n model to train for 300 epochs. The original model completed training at the end of the 165th epoch, while the improved model finished training at the 282nd epoch. The change curves for precision, mAP@0.5, and loss values are shown in the figure. The precision curve rises rapidly between 0 and 50 epochs, indicating that the C2f-ODConv module accelerates the learning of effective features. Between 50 and 150 epochs, the curve enters an oscillatory tuning phase. Compared to the original YOLOv8n, the adjustment speed is faster, demonstrating that the dynamic gradient weighting of the WIoU loss function effectively suppresses overfitting. The recall curve shows a faster convergence speed, with a more significant improvement in recall. From the mAP_0.5 and mAP_0.5:0.95 curves, it is evident that the improved model converges faster and the curves during training are more stable. As illustrated in Figure 12, the improved model demonstrates enhancements in precision, recall, mAP@0.5, and mAP@0.5:0.95, outperforming the original YOLOv8n model.

4.3. Comparison Experiments of Different Models

To further validate the advantages of OBW-YOLO, we compared it with mainstream models, including YOLOv3n-tiny, YOLOv5s [33], YOLOv7-tiny [34], YOLOv9n [35], YOLOv10n [36], and YOLOv11n [37], as shown in Table 4. All models were trained and tested under the same experimental conditions. The results demonstrate that OBW-YOLO excels in detection performance, with an accuracy (P) of 0.936, recall (R) of 0.934, mAP@0.5 of 0.976, and mAP@0.5:0.95 of 0.848, outperforming other models. Additionally, OBW-YOLO has a computational complexity (GFLOPs) of 5.4 and a parameter count (Params/M) of 4.8 M, which are significantly lower than most comparison models, such as YOLOv3n-tiny (12.9 GFLOPs, 16.6 M Params), YOLOv5s (15.8 GFLOPs, 14.4 M Params), and YOLOv9n (8.2 GFLOPs, 18.1 M Params). Although YOLOv10n and YOLOv11n have lower parameter counts (2.7 M and 2.6 M, respectively), OBW-YOLO leads comprehensively in detection performance. In conclusion, OBW-YOLO performs better in accuracy, recall, mAP, and computational complexity while maintaining a lower parameter count, proving its efficiency and effectiveness in object-detection tasks.

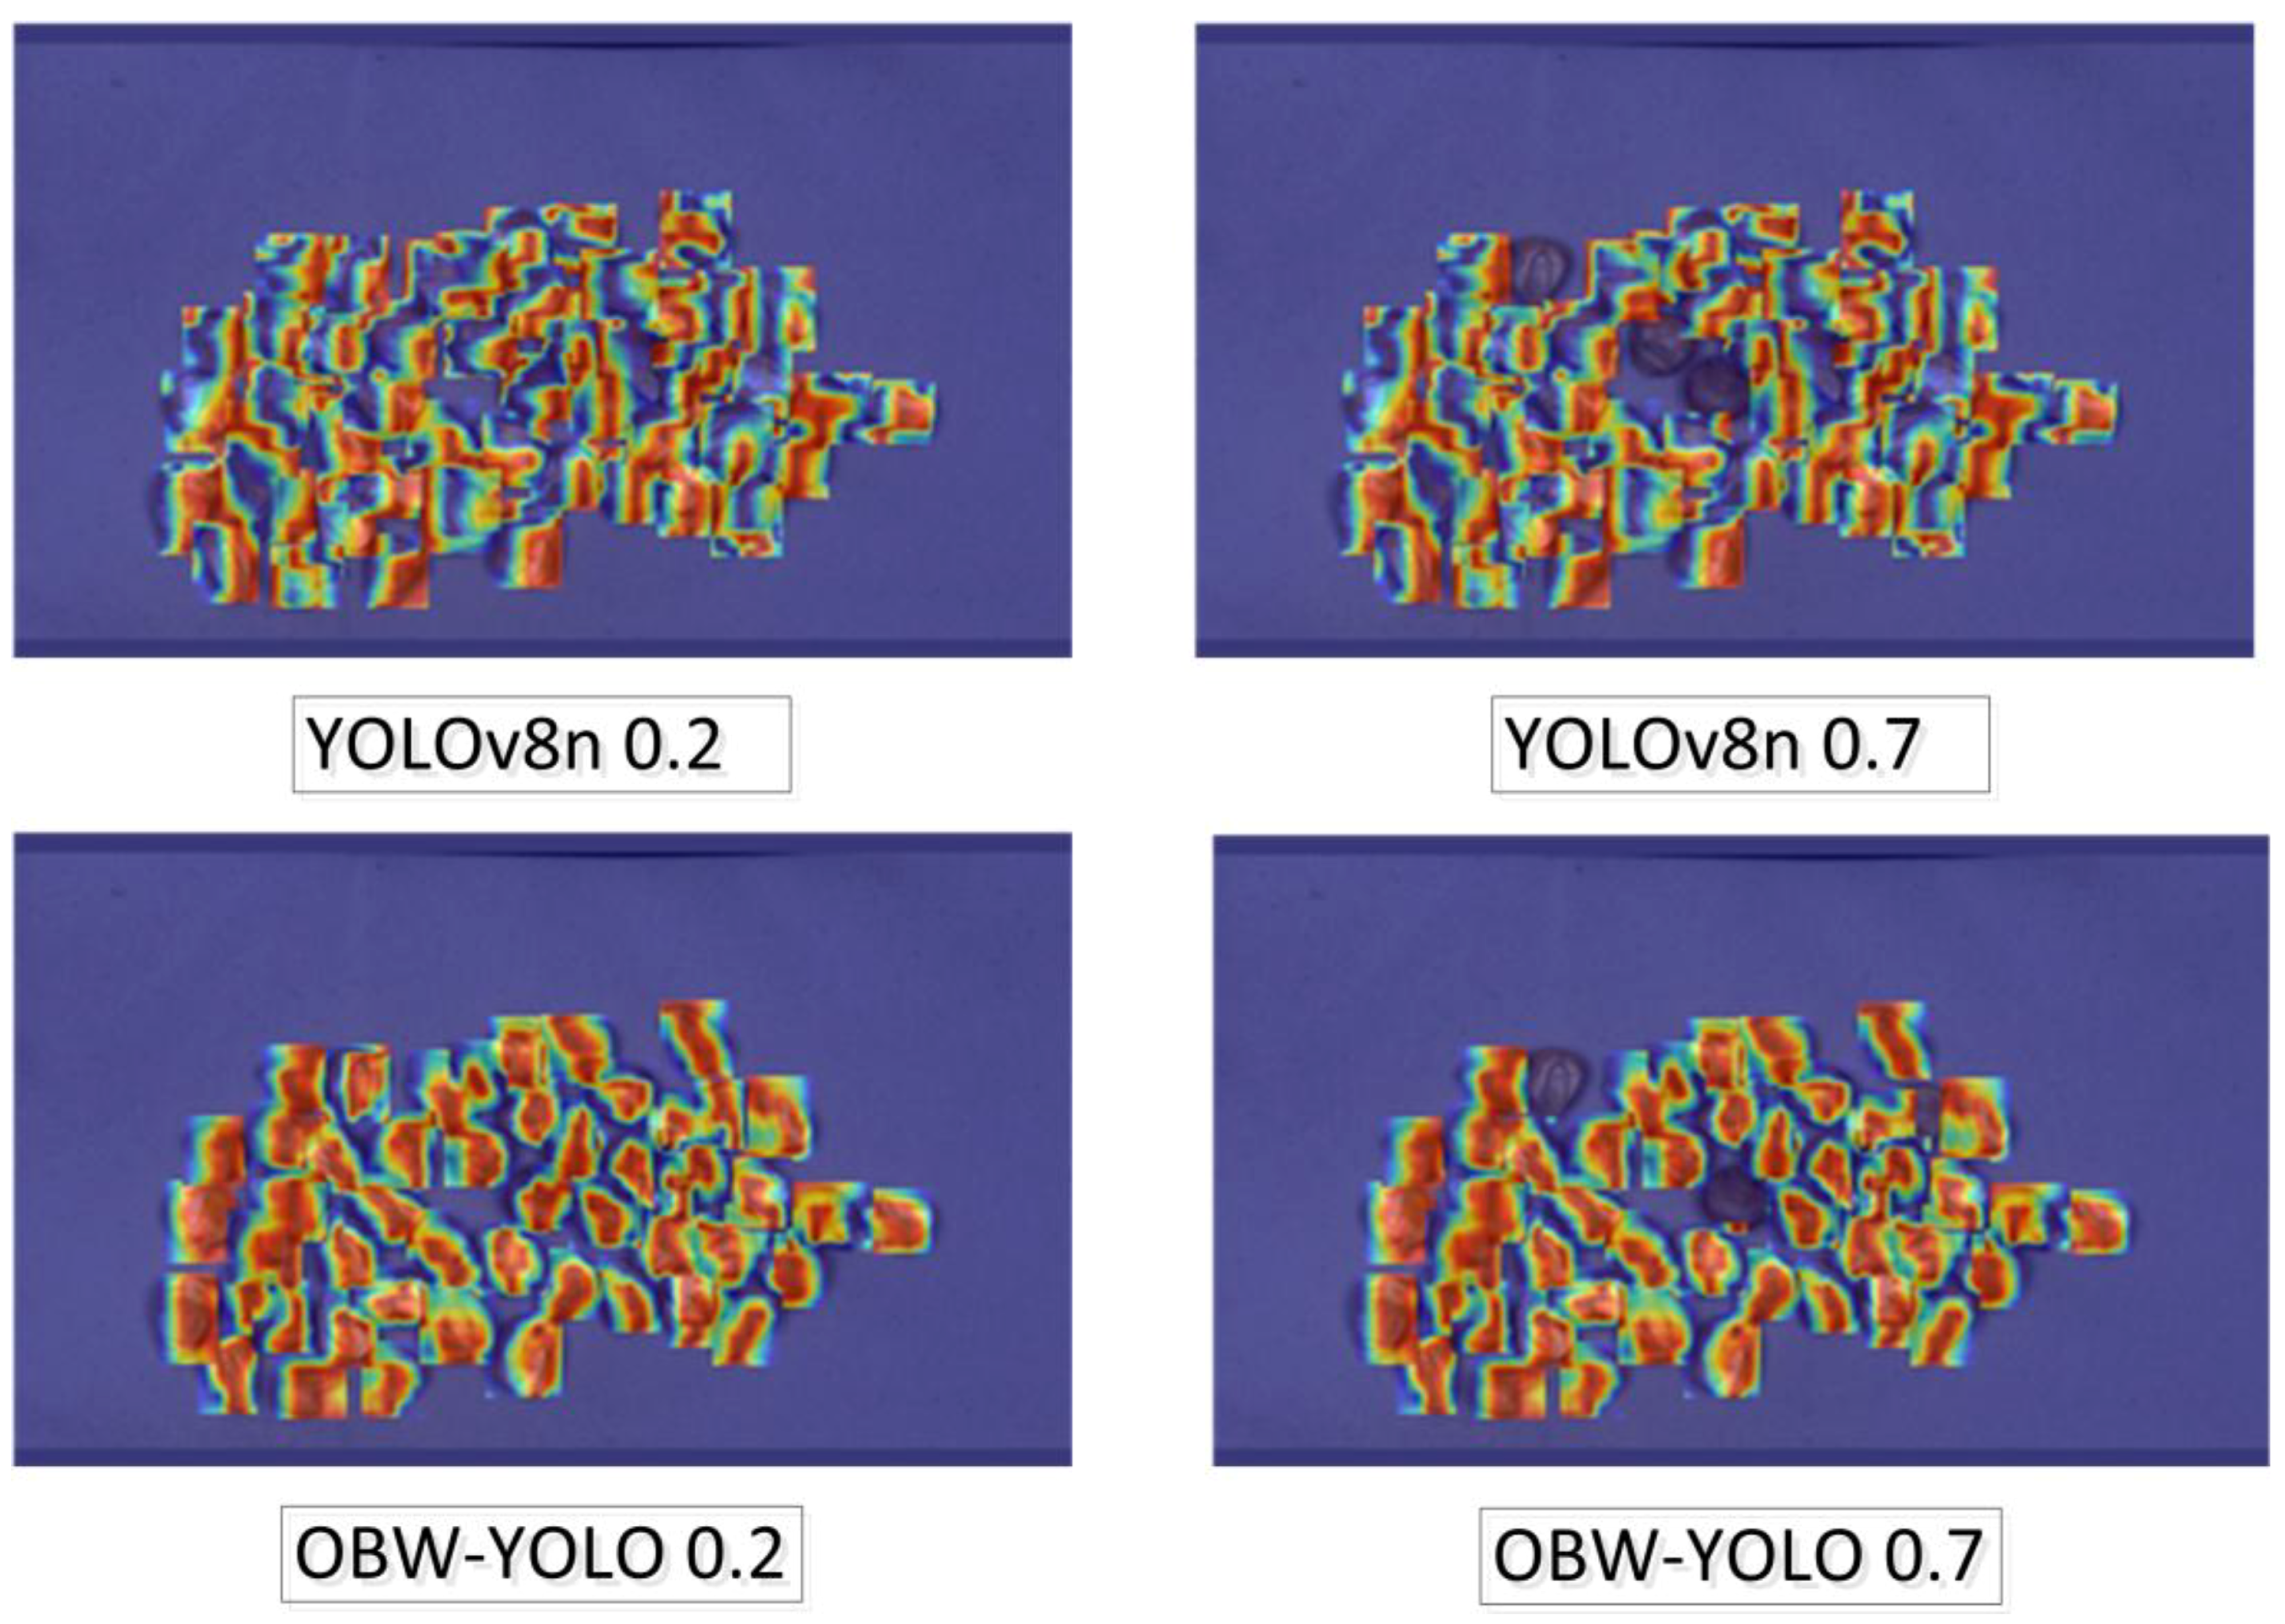
4.4. Model Feature Visualization

Grad-CAM [38] is a method for visualizing the attention mechanisms of deep neural networks by calculating gradients to identify regions of the network that have a significant impact on predictions for specific classes. Using Grad-CAM allows for visual observation of the image areas that the network focuses on during classification tasks, helping to analyze and interpret the decision-making process of the network. In this study, we set the confidence thresholds at 0.2 and 0.7, and the generated heatmaps are shown in Figure 10. In the heatmaps, brighter colors indicate higher positive response levels.
From Figure 13, it can be observed that the improved OBW-YOLO model is more aligned with the actual conditions of the samples compared to the original model. It can more accurately focus on the damaged areas of the maize seeds, with higher heatmap values indicating damage and more precise localization, resulting in more reliable performance.

4.5. Algorithm Validation

In the model comparison experiment, a visual comparison of the detection results for damaged maize seeds was conducted between YOLOv8n and the improved OBW-YOLO model, as shown in Figure 14.
By comparing the detection results of the original YOLOv8n model with the OBW-YOLO model, the YOLOv8n model exhibits significant shortcomings in target recognition and localization accuracy, such as recognition errors and localization deviations. In contrast, the OBW-YOLO model significantly outperforms the YOLOv8n model in the recognition accuracy of both damaged and healthy maize seeds. These results show that the proposed algorithm effectively addresses the issue of poor detection performance under the common high-density and complex backgrounds of randomly scattered maize seeds, proving its effectiveness.

5. Discussion

This study presents an automated detection method for assessing the damage to maize seeds under random scattering conditions. During the detection process, the maize seeds are simply placed on the collection platform, as shown in Figure 1, without the need for manual separation. Afterward, the OBW-YOLO model is run on a computer to perform the seed damage detection. In the course of the study, it was found that seed quality detection often requires manually or mechanically dispersing high-density seeds, which not only reduces efficiency and increases costs but may also cause secondary damage to the seeds, leading to higher damage rates. For example, Zhang Han [8] Siqi Niu [12], and others had to manually or use machines to separate high-density seeds during their detection process. In contrast, our study skips the separation step entirely, allowing for direct detection, which improves detection efficiency and reduces costs. The improved OBW-YOLO model, with its C2f-ODConv module, BIMFPN module, and loss function replacement, shows improved detection accuracy (mAP) while significantly reducing model size and parameter count. This makes the maize seed damage detection process more efficient and automated.
Although this study has achieved favorable results, there are still some limitations and areas for improvement. (1) The FPS of the original YOLOv8n model is 2243, while the FPS of the OBW-YOLO model is 1921. Although the inference time of the OBW-YOLO model has increased, this is mainly due to the increase in model complexity, which has led to a longer inference time. To verify the impact of this change in practical applications, we transferred the trained OBW-YOLO model to the maize seed detection system. The system uses a Dell G3 3590 laptop with a Windows operating system, an i5-8300H CPU, and a 1050Ti GPU. When images were imported into the system for detection, the result showed that the detection time per image was 0.064 s (as shown in Figure 15), which fully meets the real-time detection frame rate requirements. (2) Although this study has made progress in optimizing the accuracy of maize seed detection, further research is needed to explore model compression techniques such as pruning and knowledge distillation to accelerate deployment and inference time. Additionally, incorporating more maize varieties in the data collection process and capturing images of maize under various lighting conditions will help further explore how to optimize the model’s real-time performance, generalization ability, and environmental adaptability, ensuring its effectiveness in real-world applications.

6. Conclusions

This study addresses the issue of detecting damaged maize seeds under high-density, complex backgrounds in random scattering conditions by proposing an improved network model based on YOLOv8n, named OBW-YOLO. To enhance the accuracy and efficiency of detecting damaged maize seeds, several optimizations have been implemented in the model.
First, the C2f module of the network incorporates ODConv convolution. ODConv convolution significantly enhances the extraction capability of damaged seed features by conducting kernel space detection across four dimensions, improving the model’s ability to capture local information and detailed features.
Second, the neck network of OBW-YOLO uses a multi-branch auxiliary FPN structure. The SAF (Shallow Auxiliary Fusion) module integrates outputs from the backbone and neck while preserving shallow features to optimize learning. The AAF (Auxiliary Adaptive Fusion) module transmits more gradient information, enhancing output diversity and performance. The BIMFPN (Bidirectional Multi-branch Feature Pyramid Network) module fuses multi-scale features using a weighted addition approach via BiFPN. This method dynamically adjusts contributions, making it more flexible than simple feature concatenation or direct addition, thus allowing for better utilization of features from different levels.
Additionally, to further accelerate the convergence speed of the model and improve detection accuracy, OBW-YOLO replaces the original bounding box loss function with the WIoU (Weighted Intersection over Union) loss function. WIoU not only optimizes the accuracy of bounding box localization but also facilitates the rapid convergence of the model during training, enhancing the overall performance of the model.
Under the same experimental conditions, the performance of the improved OBW-YOLO model was compared with other models in the YOLO series for the task of detecting damaged maize seeds. The experimental results indicate that the OBW-YOLO model outperformed the original YOLOv8n model in metrics such as accuracy, mAP@0.5, and mAP@0.5:0.95. Specifically, the accuracy improved by 2.1%, mAP@0.5 increased by 1%, and mAP@0.5:0.95 rose by 1.2%. Furthermore, the improved OBW-YOLO model also demonstrated significant advantages in terms of the number of parameters and model size, with reductions of 33% and 22.5%, respectively.
In summary, the improved OBW-YOLO model not only demonstrates higher accuracy and stability in detecting damaged maize seeds but also features a smaller model size and fewer parameters. This model provides efficient and precise methodological support for the task of detecting damaged maize seeds, making it of significant practical value.

Author Contributions

Conceptualization, S.Y., B.W., S.R. and R.Y.; Data Curation, B.W. and J.W.; Funding Acquisition, S.Y. and R.Y.; Investigation, B.W.; Methodology, S.Y. and B.W.; Project Administration, S.Y., R.Y. and S.R.; Software, B.W. and S.Y.; Supervision, J.W; Validation, B.W.; Writing—Original Draft, B.W.; Writing—Review and Editing, S.Y., B.W. and S.R. All authors have read and agreed to the published version of the manuscript.

Funding

This research was funded by the National Key R and D Program of China under grant number 2023YFD2000401, the earmarked fund for the Tropical High-efficiency Agricultural Industry Technology System of Hainan University.

Data Availability Statement

The original contributions presented in the study are included in the article, and further inquiries can be directed to the corresponding author.

Conflicts of Interest

The authors declare no conflicts of interest.

References

  1. Song, P.; Yue, X.; Gu, Y.; Yang, T. Assessment of maize seed vigor under saline-alkali and drought stress based on low field nuclear magnetic resonance. Biosyst. Eng. 2022, 220, 135–145. [Google Scholar] [CrossRef]
  2. Sun, W.; Xu, M.; Xu, K.; Chen, D.; Wang, J.; Yang, R.; Chen, Q.; Yang, S. CSGD-YOLO: A Corn Seed Germination Status Detection Model Based on YOLOv8n. Agronomy 2025, 15, 128. [Google Scholar] [CrossRef]
  3. Tu, K.-L.; Li, L.-J.; Yang, L.-M.; Wang, J.-H.; Qun, S. Selection for high quality pepper seeds by machine vision and classifiers. J. Integr. Agric. 2018, 17, 1999–2006. [Google Scholar] [CrossRef]
  4. Urena, R.; Rodrıguez, F.; Berenguel, M. A machine vision system for seeds quality evaluation using fuzzy logic. Comput. Electron. Agric. 2001, 32, 1–20. [Google Scholar] [CrossRef]
  5. Granitto, P.M.; Navone, H.D.; Verdes, P.F.; Ceccatto, H. Weed seeds identification by machine vision. Comput. Electron. Agric. 2002, 33, 91–103. [Google Scholar] [CrossRef]
  6. de Medeiros, A.D.; Pereira, M.D.; Soares, T.; Noronha, B.G.; Pinheiro, D.T. Computer vision as a complementary method to vigour analysis in maize seeds. J. Exp. Agric. Int. 2018, 25, 1–8. [Google Scholar] [CrossRef]
  7. Cui, X. Design and Experimental Analysis on Device of Corn Seeds, Double-Sided Damage Detection Based on Machine Vision. Master’s Thesis, Shandong University of Technology, Zibo, China, 2019. [Google Scholar] [CrossRef]
  8. Han, Z.; Ning, Y.; Wu, X.; Cheng, W.; Bin, L. Design and Experiment of Online Maize Single Seed Detection and Sorting Device. Trans. Chin. Soc. Agric. Mach. 2022, 53, 159–166. [Google Scholar] [CrossRef]
  9. Zhao, Z.-Q.; Zheng, P.; Xu, S.-t.; Wu, X. Object detection with deep learning: A review. IEEE Trans. Neural Netw. Learn. Syst. 2019, 30, 3212–3232. [Google Scholar] [CrossRef]
  10. Wang, Q.; Yu, C.; Zhang, H.; Chen, Y.; Liu, C. Design and experiment of online cottonseed quality sorting device. Comput. Electron. Agric. 2023, 210, 107870. [Google Scholar] [CrossRef]
  11. Li, X.; Niu, W.; Yan, Y.; Ma, S.; Huang, J.; Wang, Y.; Chang, R.; Song, H. Detection of Broken Hongshan Buckwheat Seeds Based on Improved YOLOv5s Model. Agronomy 2023, 14, 37. [Google Scholar] [CrossRef]
  12. Niu, S.; Xu, X.; Liang, A.; Yun, Y.; Li, L.; Hao, F.; Bai, J.; Ma, D. Research on a Lightweight Method for Maize Seed Quality Detection Based on Improved YOLOv8. IEEE Access 2024, 12, 32927–32937. [Google Scholar] [CrossRef]
  13. Sapkota, R.; Karkee, M. Yolo11 and vision transformers based 3d pose estimation of immature green fruits in commercial apple orchards for robotic thinning. arXiv 2024, arXiv:2410.19846. [Google Scholar]
  14. Chen, C.; Zheng, Z.; Xu, T.; Guo, S.; Feng, S.; Yao, W.; Lan, Y. Yolo-based uav technology: A review of the research and its applications. Drones 2023, 7, 190. [Google Scholar] [CrossRef]
  15. Wang, Q.; Liu, Y.; Zheng, Q.; Tao, R.; Liu, Y. SMC-YOLO: A High-Precision Maize Insect Pest-Detection Method. Agronomy 2025, 15, 195. [Google Scholar] [CrossRef]
  16. Zhao, H.; Tang, Z.; Li, Z.; Dong, Y.; Si, Y.; Lu, M.; Panoutsos, G. Real-time object detection and robotic manipulation for agriculture using a yolo-based learning approach. In Proceedings of the 2024 IEEE International Conference on Industrial Technology (ICIT), Bristol, UK, 25–27 March 2024; pp. 1–6. [Google Scholar] [CrossRef]
  17. Singh, A.; Joshua, C.J. Nanobot-Assisted Pollination for Sustainable Agriculture: A Review of Image Classification and Deep Learning Techniques with YOLO, SLAM, and MATLAB. IEEE Access 2024, 12, 189902–189925. [Google Scholar] [CrossRef]
  18. Wang, L.; Wang, S.; Yang, Z.; Zhang, Y.; Feng, X. A Full-View Detection Method for Maize Grain Based on Multi-Mirror Reflection Imaging Principle and the Tpfm-Sdpf-Yolo Model. Preprint 2025. [Google Scholar] [CrossRef]
  19. Li, Y.; Wang, M.; Wang, C.; Zhong, M. A method for maize pest detection based on improved YOLO-v9 model. In Proceedings of the 2024 7th International Conference on Computer Information Science and Application Technology (CISAT), Hangzhou, China, 12–14 July 2024; pp. 858–861. [Google Scholar] [CrossRef]
  20. Guan, S.; Lin, Y.; Lin, G.; Su, P.; Huang, S.; Meng, X.; Liu, P.; Yan, J. Real-time detection and counting of wheat spikes based on improved YOLOv10. Agronomy 2024, 14, 1936. [Google Scholar] [CrossRef]
  21. Solawetz, J.; Francesco. What Is YOLOv8? The Ultimate Guide. 2023. Available online: https://roboflow.com/ (accessed on 15 August 2024).
  22. Tong, Z.; Chen, Y.; Xu, Z.; Yu, R. Wise-IoU: Bounding box regression loss with dynamic focusing mechanism. arXiv 2023, arXiv:2301.10051. [Google Scholar]
  23. Li, C.; Zhou, A.; Yao, A. Omni-dimensional dynamic convolution. arXiv 2022, arXiv:2209.07947. [Google Scholar]
  24. Lin, T.-Y.; Dollár, P.; Girshick, R.; He, K.; Hariharan, B.; Belongie, S. Feature pyramid networks for object detection. In Proceedings of the IEEE Conference on Computer Vision and Pattern Recognition, Honolulu, HI, USA, 21–26 July 2017; pp. 2117–2125. [Google Scholar] [CrossRef]
  25. Yang, Z.; Guan, Q.; Zhao, K.; Yang, J.; Xu, X.; Long, H.; Tang, Y. Multi-branch Auxiliary Fusion YOLO with Re-parameterization Heterogeneous Convolutional for Accurate Object Detection. In Pattern Recognition and Computer Vision (PRCV); Lecture Notes in Computer Science; Springer: Singapore, 2024; pp. 492–505. [Google Scholar] [CrossRef]
  26. Li, M.; Xiao, Y.; Zong, W.; Song, B. Detecting chestnuts using improved lightweight YOLOv8. Trans. Chin. Soc. Agric. Eng 2024, 40, 201–209. [Google Scholar] [CrossRef]
  27. Zheng, Z.; Wang, P.; Liu, W.; Li, J.; Ye, R.; Ren, D. Distance-IoU loss: Faster and better learning for bounding box regression. In Proceedings of the AAAI Conference on Artificial Intelligence, New York, NY, USA, 7–12 February 2020; pp. 12993–13000. [Google Scholar] [CrossRef]
  28. Zheng, Z.; Wang, P.; Ren, D.; Liu, W.; Ye, R.; Hu, Q.; Zuo, W. Enhancing geometric factors in model learning and inference for object detection and instance segmentation. IEEE Trans. Cybern. 2021, 52, 8574–8586. [Google Scholar] [CrossRef] [PubMed]
  29. Rezatofighi, H.; Tsoi, N.; Gwak, J.; Sadeghian, A.; Reid, I.; Savarese, S. Generalized intersection over union: A metric and a loss for bounding box regression. In Proceedings of the IEEE/CVF Conference on Computer Vision and Pattern Recognition, Long Beach, CA, USA, 16–17 June 2019; pp. 658–666. [Google Scholar] [CrossRef]
  30. Zhang, Y.-F.; Ren, W.; Zhang, Z.; Jia, Z.; Wang, L.; Tan, T. Focal and efficient IOU loss for accurate bounding box regression. Neurocomputing 2022, 506, 146–157. [Google Scholar] [CrossRef]
  31. Ma, S.; Xu, Y. Mpdiou: A loss for efficient and accurate bounding box regression. arXiv 2023, arXiv:2307.07662. [Google Scholar]
  32. Gevorgyan, Z. SIoU loss: More powerful learning for bounding box regression. arXiv 2022, arXiv:2205.12740. [Google Scholar]
  33. Jocher, G.; Chaurasia, A.; Stoken, A.; Borovec, J.; Kwon, Y.; Michael, K.; Tao, X.; Fang, J.; Lorna; Zeng, Y.; et al. Ultralytics YOLOv5. 2020. Available online: https://zenodo.org/records/7347926 (accessed on 15 August 2024).
  34. Wang, C.-Y.; Bochkovskiy, A.; Liao, H.-Y.M. YOLOv7: Trainable bag-of-freebies sets new state-of-the-art for real-time object detectors. In Proceedings of the IEEE/CVF Conference on Computer Vision and Pattern Recognition, Vancouver, BC, Canada, 17–24 June 2023; pp. 7464–7475. [Google Scholar] [CrossRef]
  35. Wang, C.Y.; Yeh, I.H.; Liao, H.Y.M. Yolov9: Learning what you want to learn using programmable gradient information. arXiv 2024, arXiv:2402.13616. [Google Scholar]
  36. Wang, A.; Chen, H.; Liu, L.; Chen, K.; Lin, Z.; Han, J.; Ding, G. Yolov10: Real-time end-to-end object detection. arXiv 2024, arXiv:2405.14458. [Google Scholar]
  37. Khanam, R.; Hussain, M. Yolov11: An overview of the key architectural enhancements. arXiv 2024, arXiv:2410.17725. [Google Scholar]
  38. Vinogradova, K.; Dibrov, A.; Myers, G. Towards interpretable semantic segmentation via gradient-weighted class activation mapping (student abstract). In Proceedings of the AAAI Conference on Artificial Intelligence, New York, NY, USA, 7–12 February 2020; pp. 13943–13944. [Google Scholar] [CrossRef]
Figure 2. LabelImg 1.8.6 software annotation details.
Agronomy 15 00710 g002
Figure 3. Randomly scattered maize seeds.
Agronomy 15 00710 g003
Figure 4. Maize seed data augmentation.
Agronomy 15 00710 g004
Figure 5. Flowchart of maize seed damage detection.
Agronomy 15 00710 g005
Figure 6. OWB-YOLO network structure diagram.
Agronomy 15 00710 g006
Figure 7. C2f-ODConv module structure diagram.
Agronomy 15 00710 g007
Figure 8. ODConv four types of attention scalars function diagram. (a) Perform Location-wise multiplication along the spatial dimensions, processing the data at each location in the image. (b) Perform Location-wise multiplication along the input channels, operating on each input channel. (c) This operation is performed along the output channels, where each filter performs multiplication on different output channels. (d) Perform Location-wise multiplication along the dimensions of the convolution kernel, which is a small window applied to the image, and this operation is performed on the entire convolution kernel.
Agronomy 15 00710 g008
Figure 11. Comparison heatmap of C2f and C2f-ODConv.
Agronomy 15 00710 g011
Figure 12. Change curves of precision, recall, mAP@0.5, and mAP@0.5:0.95 values.
Agronomy 15 00710 g012
Figure 13. Heatmaps of YOLOv8n and OBW-YOLO at 0.2 and 0.7 confidence levels.
Agronomy 15 00710 g013
Figure 14. Detection results of YOLOv8n and OBW-YOLO models.
Agronomy 15 00710 g014
Figure 15. Maize seed detection system interface.
Agronomy 15 00710 g015
Table 1. Comparison of loss function model performance.
ModelPRmAP@0.5Map@0.95
CIoU0.930.9330.9710.845
WIoU0.9340.9340.9760.848
DIoU0.9330.9320.9730.846
GIoU0.9290.9320.9720.845
EIou0.9320.9320.9710.844
MpdIoU0.9280.9330.9720.845
SIoU0.9220.9340.9700.843
Table 2. Comparison of replacing C2f-ODConv modules at different positions in the network.
ModelPRmAP@0.5mAP@0.5:0.95GFLOPsParams/M
YOLOv8n0.9150.930.9630.8368.16.2
Backbone
Replacement
0.9170.9220.9640.8366.76.4
Neck
Replacement
0.9230.9260.9650.8337.16.3
Complete
Replacement
0.9270.9320.9690.8415.76.5
Table 3. Ablation study comparison.
C2f-ODConvBIMAFPNWIoUPRmAP@0.5mAP@0.5:0.95GFLOPsParams/M
0.9150.930.9640.8368.16.2
0.9270.9320.9690.8415.76.5
0.9230.9260.9670.8387.44.6
0.9190.9310.9630.8348.16.2
0.9320.9330.9740.8485.44.8
0.9270.9320.970.8425.76.5
0.9280.9250.9650.8397.44.6
0.9360.9340.9760.8485.44.8
Table 4. Comparison of OBW-YOLO with different models.
ModelPRmAP@0.5mAP@0.5:0.95GFLOPsParams/M
YOLOv3n-tiny0.8980.920.9530.79212.916.6
YOLOv5s0.9320.8940.9620.81515.814.4
YOLOV7-tiny0.9260.9250.9630.81313.012.3
YOLOv8n0.9150.930.9660.8368.16.2
YOLOv9n0.9220.9260.9670.8418.218.1
YOLOv10n0.9240.9240.9620.8328.22.7
YOLOv11n0.9210.9220.9610.8336.32.6
YOLOv8-OBW0.9360.9340.9760.8485.44.8
Disclaimer/Publisher’s Note: The statements, opinions and data contained in all publications are solely those of the individual author(s) and contributor(s) and not of MDPI and/or the editor(s). MDPI and/or the editor(s) disclaim responsibility for any injury to people or property resulting from any ideas, methods, instructions or products referred to in the content.

