Article

Comprehensive Evaluation of Different Oat Varieties in Semi-Arid Areas of Gansu Province

1
Key Laboratory of Grassland Ecosystem, Gansu Agricultural University, Ministry of Education, Lanzhou 730070, China
2
Pratacultural College, Gansu Agricultural University, Lanzhou 730070, China
*
Author to whom correspondence should be addressed.
Agronomy 2025, 15(3), 707; https://doi.org/10.3390/agronomy15030707
Submission received: 20 February 2025 / Revised: 8 March 2025 / Accepted: 12 March 2025 / Published: 14 March 2025

Abstract

:
In light of the current global challenges, such as climate change, the overexploitation of natural resources, and increasing food demand, drought-tolerant forage crops present substantial potential for development in dryland regions. However, there is a notable gap in research that integrates yield improvement, nutritional quality enhancement, and resistance to pests and diseases in the production of forage crops in semi-arid areas. Therefore, selecting oat forage varieties that exhibit high yield, superior quality, and enhanced pest resistance can substantially advance the forage industry and animal husbandry in semi-arid regions. In this study, ten oat varieties, including both domestic and international cultivars, were cultivated in a semi-arid region (Weiqi town, Gansu Province) during the 2023–2024 growing season. A comprehensive analysis was performed to assess the yield, quality, and pest resistance of these varieties. All ten oat varieties successfully completed their growth cycles. Among them, Everleaf 126 exhibited a shorter plant height compared to the other varieties, measuring 103.32 cm and 115.14 cm over two years. However, its superior leaf area and tiller number led to the highest hay yields (11,819.33 kg/ha and 13,550.67 kg/ha) and seed yields (4913.20 kg/ha and 5242.33 kg/ha). Additionally, Everleaf 126 demonstrated significantly higher leaf–stem ratios (0.35 and 0.41), crude protein content (8.52% and 9.13%), and crude fat content (2.19% and 2.69%) relative to other oat varieties (p < 0.05). Furthermore, it showed the best resistance to powdery mildew (MR), red leaf disease (HR), leaf spot disease (MR), and aphids (R). The plant height of Kona was the lowest, measuring 81.22 cm and 87.16 cm, respectively, with the fewest number of tillers and the smallest leaf area. Baler II exhibited the lowest hay yield at 8770.10 kg/ha and 7898.33 kg/ha, as well as the lowest seed yield at 3409.33 kg/ha and 3323.90 kg/ha. Kona also had the lowest leaf–stem ratio (0.19 and 10.13) and crude protein content (5.74% and 6.58%), while exhibiting the highest neutral detergent fiber (NDF) and acid detergent fiber (ADF) values. Furthermore, Kona showed the poorest resistance to powdery mildew (MS) and leaf spot (MS). Finally, based on the comprehensive evaluation analysis of the membership function, in the semi-arid region, Everleaf 126 achieved the highest overall performance based upon a comprehensive evaluation, followed by Molasses and Longyan No.3. In comparison, Kona received the poorest performance.

1. Introduction

Oat (Avena sativa L.) is an annual gramineous crop that ranks sixth globally in grain production [1]. Based on the 2020 summary statistics from the United States Department of Agriculture–National Agricultural Statistics Service (USDA-NASS), approximately 1.2 million hectares of oats were planted in the United States, of which about 400,000 hectares were harvested for human consumption [2]. The crop exhibits remarkable resistance to disease, drought, and poor soil conditions, while also featuring high palatability and dry matter content. Known as the ‘third staple food’, it is a dominant crop in the arid and semi-arid regions of China and serves as a versatile grain and forage crop distinguished by its strong adaptability and high yield [3].
Oats are considered more suitable for cultivation in less favorable environments, such as cool and cold regions as well as semi-arid areas, compared to other forage crops [4]. Notably, arid and semi-arid environments account for approximately 30% of the global land area and 52% of China’s total land area [5]. In semi-arid regions, elevated temperatures and insufficient water availability present substantial challenges. Following precipitation, soil compaction exacerbates poor soil conditions, significantly impacting the adaptability of various oat cultivars. Rising temperatures also lead to increased pest and disease pressure, which in turn reduces oat forage yield and quality [6]. As a critical forage crop for animal husbandry in China, oats play an essential role in livestock production, which has become a major economic driver in arid and semi-arid regions [7]. Therefore, examining the distribution and climatic characteristics of arid and semi-arid regions and their impact on agricultural and livestock production is of strategic significance for advancing China’s agricultural modernization.
Gansu Province, a traditional and prominent oat-producing region in China, has seen significant growth in its forage industry due to the rapid advancement of animal husbandry. This has established it as a primary cultivation area, especially amongst arid and semi-arid regions. The natural conditions here are particularly conducive to meeting the essential requirements for oat growth and development. Zhangye City, situated in Gansu Province at approximately 38 degrees north latitude, lies within an optimal crop cultivation zone. Oat plants grown in this region display remarkable characteristics such as substantial height, a high leaf-to-stem ratio, and superior chlorophyll retention [8]. Shandan County, a key administrative division of Zhangye City, is distinguished as one of the primary regions for oat grass cultivation. The county boasts an oat grass planting area surpassing 49,420 acres, with the Shandan Horse Farm serving as a premier base for producing high-quality oat grass. As a result, this area has become one of the most suitable locations in China for the large-scale, concentrated planting and production of premium oat forage [9]. However, local farmers and herders predominantly rely on self-propagation and self-planting cultivation methods, resulting in a lack of standardization among oat varieties. This has led to incomplete or inaccurate basic data, causing producers to prioritize yield over quality. As a result, many oat varieties exhibit similar yields but differ significantly in quality [10]. To address the challenges faced by oat varieties in semi-arid regions, including disorganization, poor stress resistance, and limited germplasm resources, we conducted an in-depth analysis of yield traits, quality traits, and resistance to pests and diseases. This study encompassed one local variety (Longyan No. 3), four domestic varieties (Longyan No. 2, Longyan No. 4, Qinghai 444, Longyan No. 6), and five international varieties (Molasses, Baler Ⅱ, Kona, Mengshi, Everleaf 126). Screening for oat varieties with high yield, stress resistance, and suitability for large-scale cultivation and grain/feed processing is of great significance. This will enrich the genetic diversity of local oat resources, enhance oat productivity and quality, and promote the development of dryland agriculture and grassland animal husbandry [11].

2. Materials and Methods

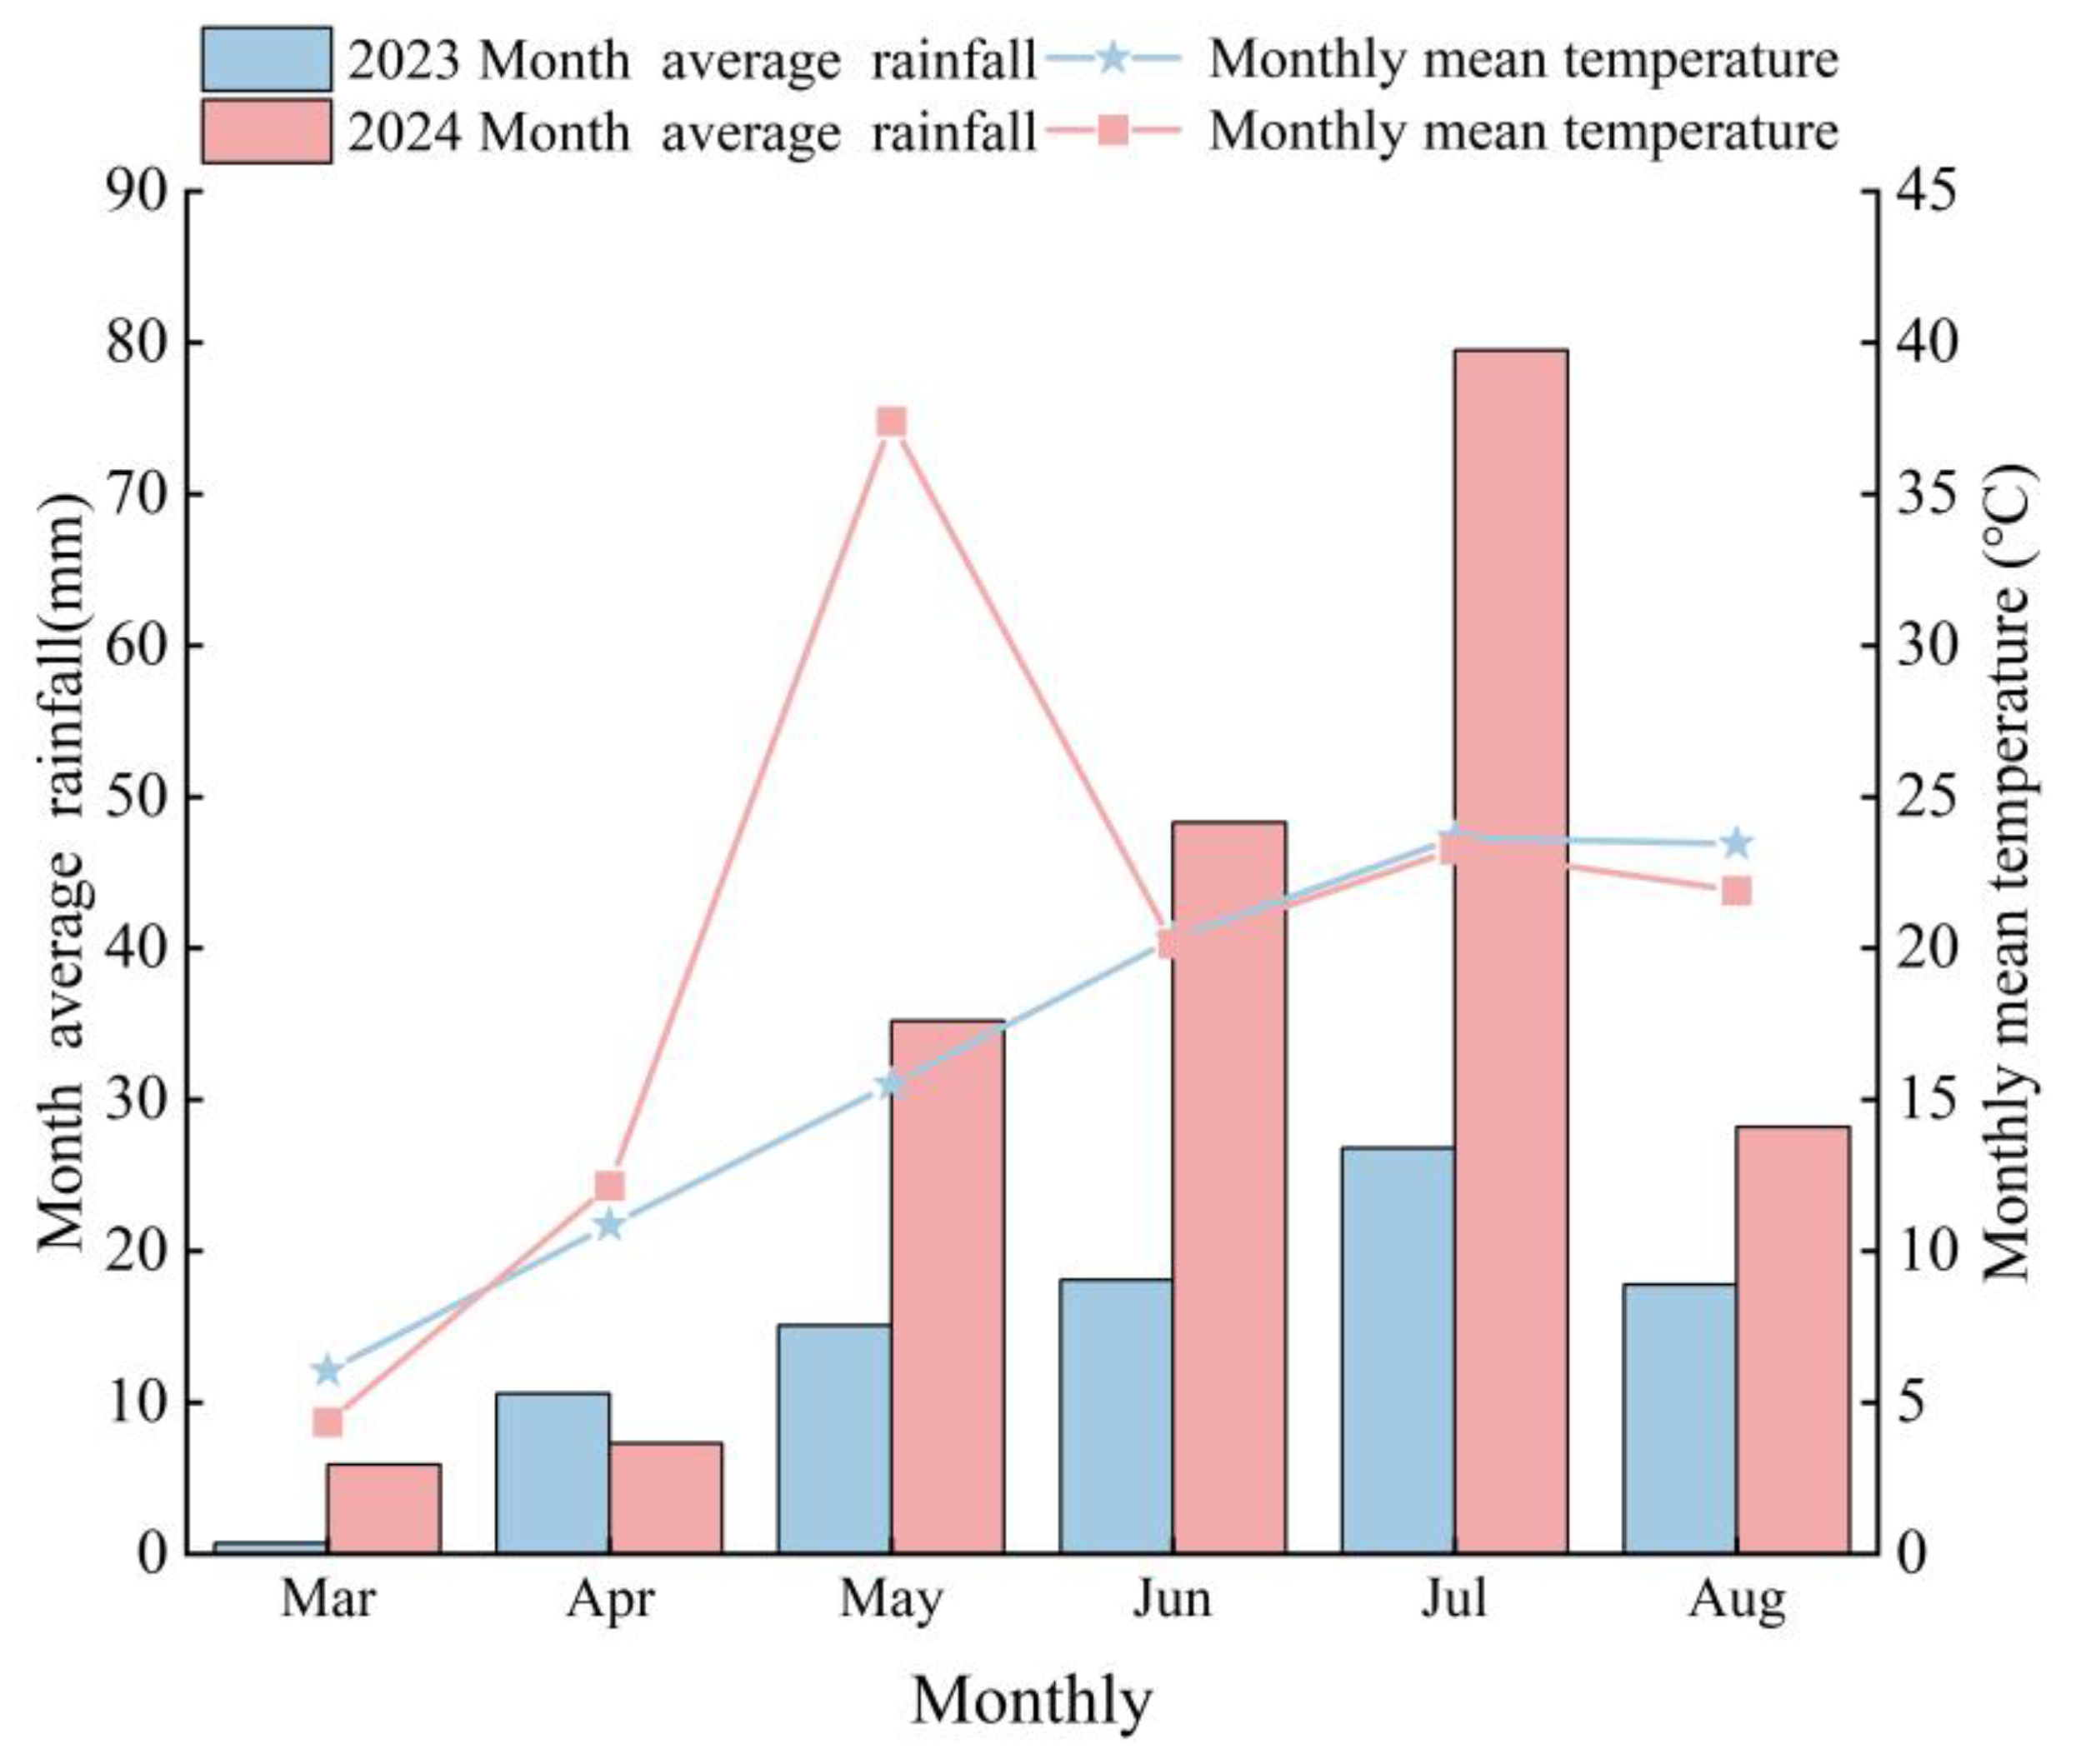
2.1. Test Site Overview

Weiqi Town, situated in Shandan County, Gansu Province, is located at an elevation of 1850 m. The region exhibits a warm temperate semi-arid climate, characterized by an annual average temperature of approximately 15 degrees Celsius, annual sunshine duration of 3077.9 h, and annual precipitation of around 195 mm. The mean annual evaporation rate is 3240 mm, and the frost-free period lasts for about 134 days. The monthly average temperature and monthly average precipitation data during the oat growing season in 2023 and 2024 are shown in Figure 1. Prior to sowing, soil samples from the 0–30 cm layer were collected using a five-point composite sampling method (Table 1). The content of organic matter was determined by the potassium dichromate volumetric method [12]. The content of organic carbon was determined by potassium dichromate oxidation spectrophotometry [13]. The content of total phosphorus was determined by the molybdenum–antimony anti-colorimetric method [14]. The content of total nitrogen was determined by the Kjeldahl method [15]. The pH was determined by a pH meter [16]. Based on the results of soil analysis, the nutrient levels in the soil were adequate to support optimal plant growth.

2.2. Testing Material

The 10 oat cultivars employed in this study, as illustrated in Table 2, were supplied by the College of Prataculture at Gansu Agricultural University.

2.3. Experimental Design

In this experiment, a randomized block design was utilized to sow seeds in Weiqi Town, Shandan County, Gansu Province, during the years 2023 and 2024. Seeds were sown on 27 March in each respective year. Ten varieties were planted, with each plot measuring 20 m2 (4 m × 5 m). The experiment was replicated three times, resulting in a total of 30 plots. The sowing rate was established at 140 kg/ha, with a row spacing of 25 cm and an inter-plot distance of 1 m. Manual furrow drilling was conducted, planting 16 rows per plot at a depth of 4 to 5 cm. Prior to sowing, 225 kg/ha of compound fertilizer (2:1:1) was applied as a basal dressing. Additionally, 140 kg/ha of urea was top-dressed once during the jointing stage. Irrigation was applied once during both the tillering and jointing stages, with no additional irrigation throughout the remainder of the growth period. Weed control was achieved through scheduled manual removal.

2.4. Determination of Production Traits of Oats

2.4.1. Investigation of Growth Period

The growth stages of various cultivars were monitored, including the seedling, grain-filling, and maturity stages. The identification criteria were defined as follows: a specific growth stage was deemed to be reached when 50% of the plants exhibited the corresponding characteristics; the early phase was identified when 10–20% of the plants showed early-stage features; and the peak period was confirmed when 80% of the plants displayed peak characteristics [17].

2.4.2. Agronomic Traits

After controlling for the confounding effects of marginal influences in each plot during the filling period, a total of 10 plants were randomly selected. The precise measurement of plant height was conducted using a steel tape measure, capturing the absolute distance from the base to the top of each oat plant. The length from the tip of the flag leaf and the second leaf to the base of the leaf shaft was measured by a tape measure as the leaf length, and the width of the flag leaf and the second leaf were measured at the base of each leaf. The leaf area was calculated as AL = R × (leaf length) × (leaf width), where R is the correction coefficient of leaf area (0.8317) [18]. The counts were recorded for both tillers and effective tillers per plant.

2.4.3. Yield Traits

The hay yield was quantified during the filling stage, and dry samples were retained for the analysis of essential nutrients [19]. Upon reaching maturity, all plants within the plot were harvested, dried, and threshed. The area from which fresh grass samples were initially collected was excluded from this process, and the seed yield was subsequently converted to a per-hectare basis.

2.4.4. Determination of Nutritional Quality of Oats at Filling Stage

During the sampling phase, 200 g of fresh oat samples were precisely weighed and transported to the laboratory. Upon arrival, the leaves, stems, and ears were meticulously separated and dried under controlled conditions. Subsequently, the leaf-to-stem ratio was determined [20].
The crude protein content was determined using the Kjeldahl method [21]. The acid detergent fiber (ADF) and neutral detergent fiber (NDF) contents were analyzed using the Van Soest detergent fiber method [22]. Soluble sugar content was assessed via the chromogenic method [23], whereas the crude fat content was determined through Soxhlet extraction [24].

2.4.5. Investigation of Pests and Diseases in Oat Filling Stage

The disease classification of oat powdery mildew was based on the “Field Efficacy Test Criteria” [25]. For red leaf disease, the evaluation followed the technical specifications outlined in China’s agricultural industry standards for assessing wheat resistance to yellow dwarf virus disease [26]. The severity of leaf spot disease was graded according to the standard established by Yuan Junhai [27].
The disease index [28] = 100 × (∑number of diseased plants in each disease grade × disease grade value)/(total number of investigated plants × highest grade value).

2.4.6. Aphid Pest Investigation in Oats During Filling Stage

In each plot, five ‘Z’-shaped sampling points were established, and twenty plants were randomly selected at each point. The number of aphids on each plant was recorded to calculate the aphid index. The aphid damage grading standard used in this experiment was adapted from the criteria established by Forbes AR [29]. The aphid damage index was calculated based on three replicate survey datasets (I*), and field resistance was subsequently evaluated using this index. Since no definitive aphid-resistant oat variety was available for this experiment, the out-of-center rate method was employed for evaluation [30].

2.5. Statistical Analysis of Data

Excel 2016 was used to sort all the experimental data [31], and SPSS 25.0 [32] and Origin v.2024 [33] analysis software were used to analyze the data by variance analysis, correlation analysis and principal component analysis (PCA). This was an efficacious multi-factor decision-making approach that utilized membership function analysis to conduct a comprehensive evaluation of the influence of various factors. The data transformed by this method were more reliable and accurate compared to those obtained through other techniques, thereby mitigating the bias inherent in evaluating the adaptability and quality of oats using a single index. In the context of multi-indicator comprehensive evaluations, this method provided more precise and robust ranking results.

3. Results

3.1. Growth Period

The growth period of plants reflects their adaptive response to external ecological factors. As indicated in Table 3, the ten oat varieties successfully complete their growth periods, although the durations varied among different varieties under identical environmental conditions. The emergence time of Baler II was the shortest over the two years, at 10 days in 2023 and 9 days in 2024. It also had the shortest duration to reach the filling stage, followed by Kona. In contrast, Everleaf 126 exhibited the longest seedling stage, lasting 13 days, and took the longest time to enter the filling stage. Overall, the period from emergence to maturity for the ten oat varieties was longer in 2024 compared to 2023.

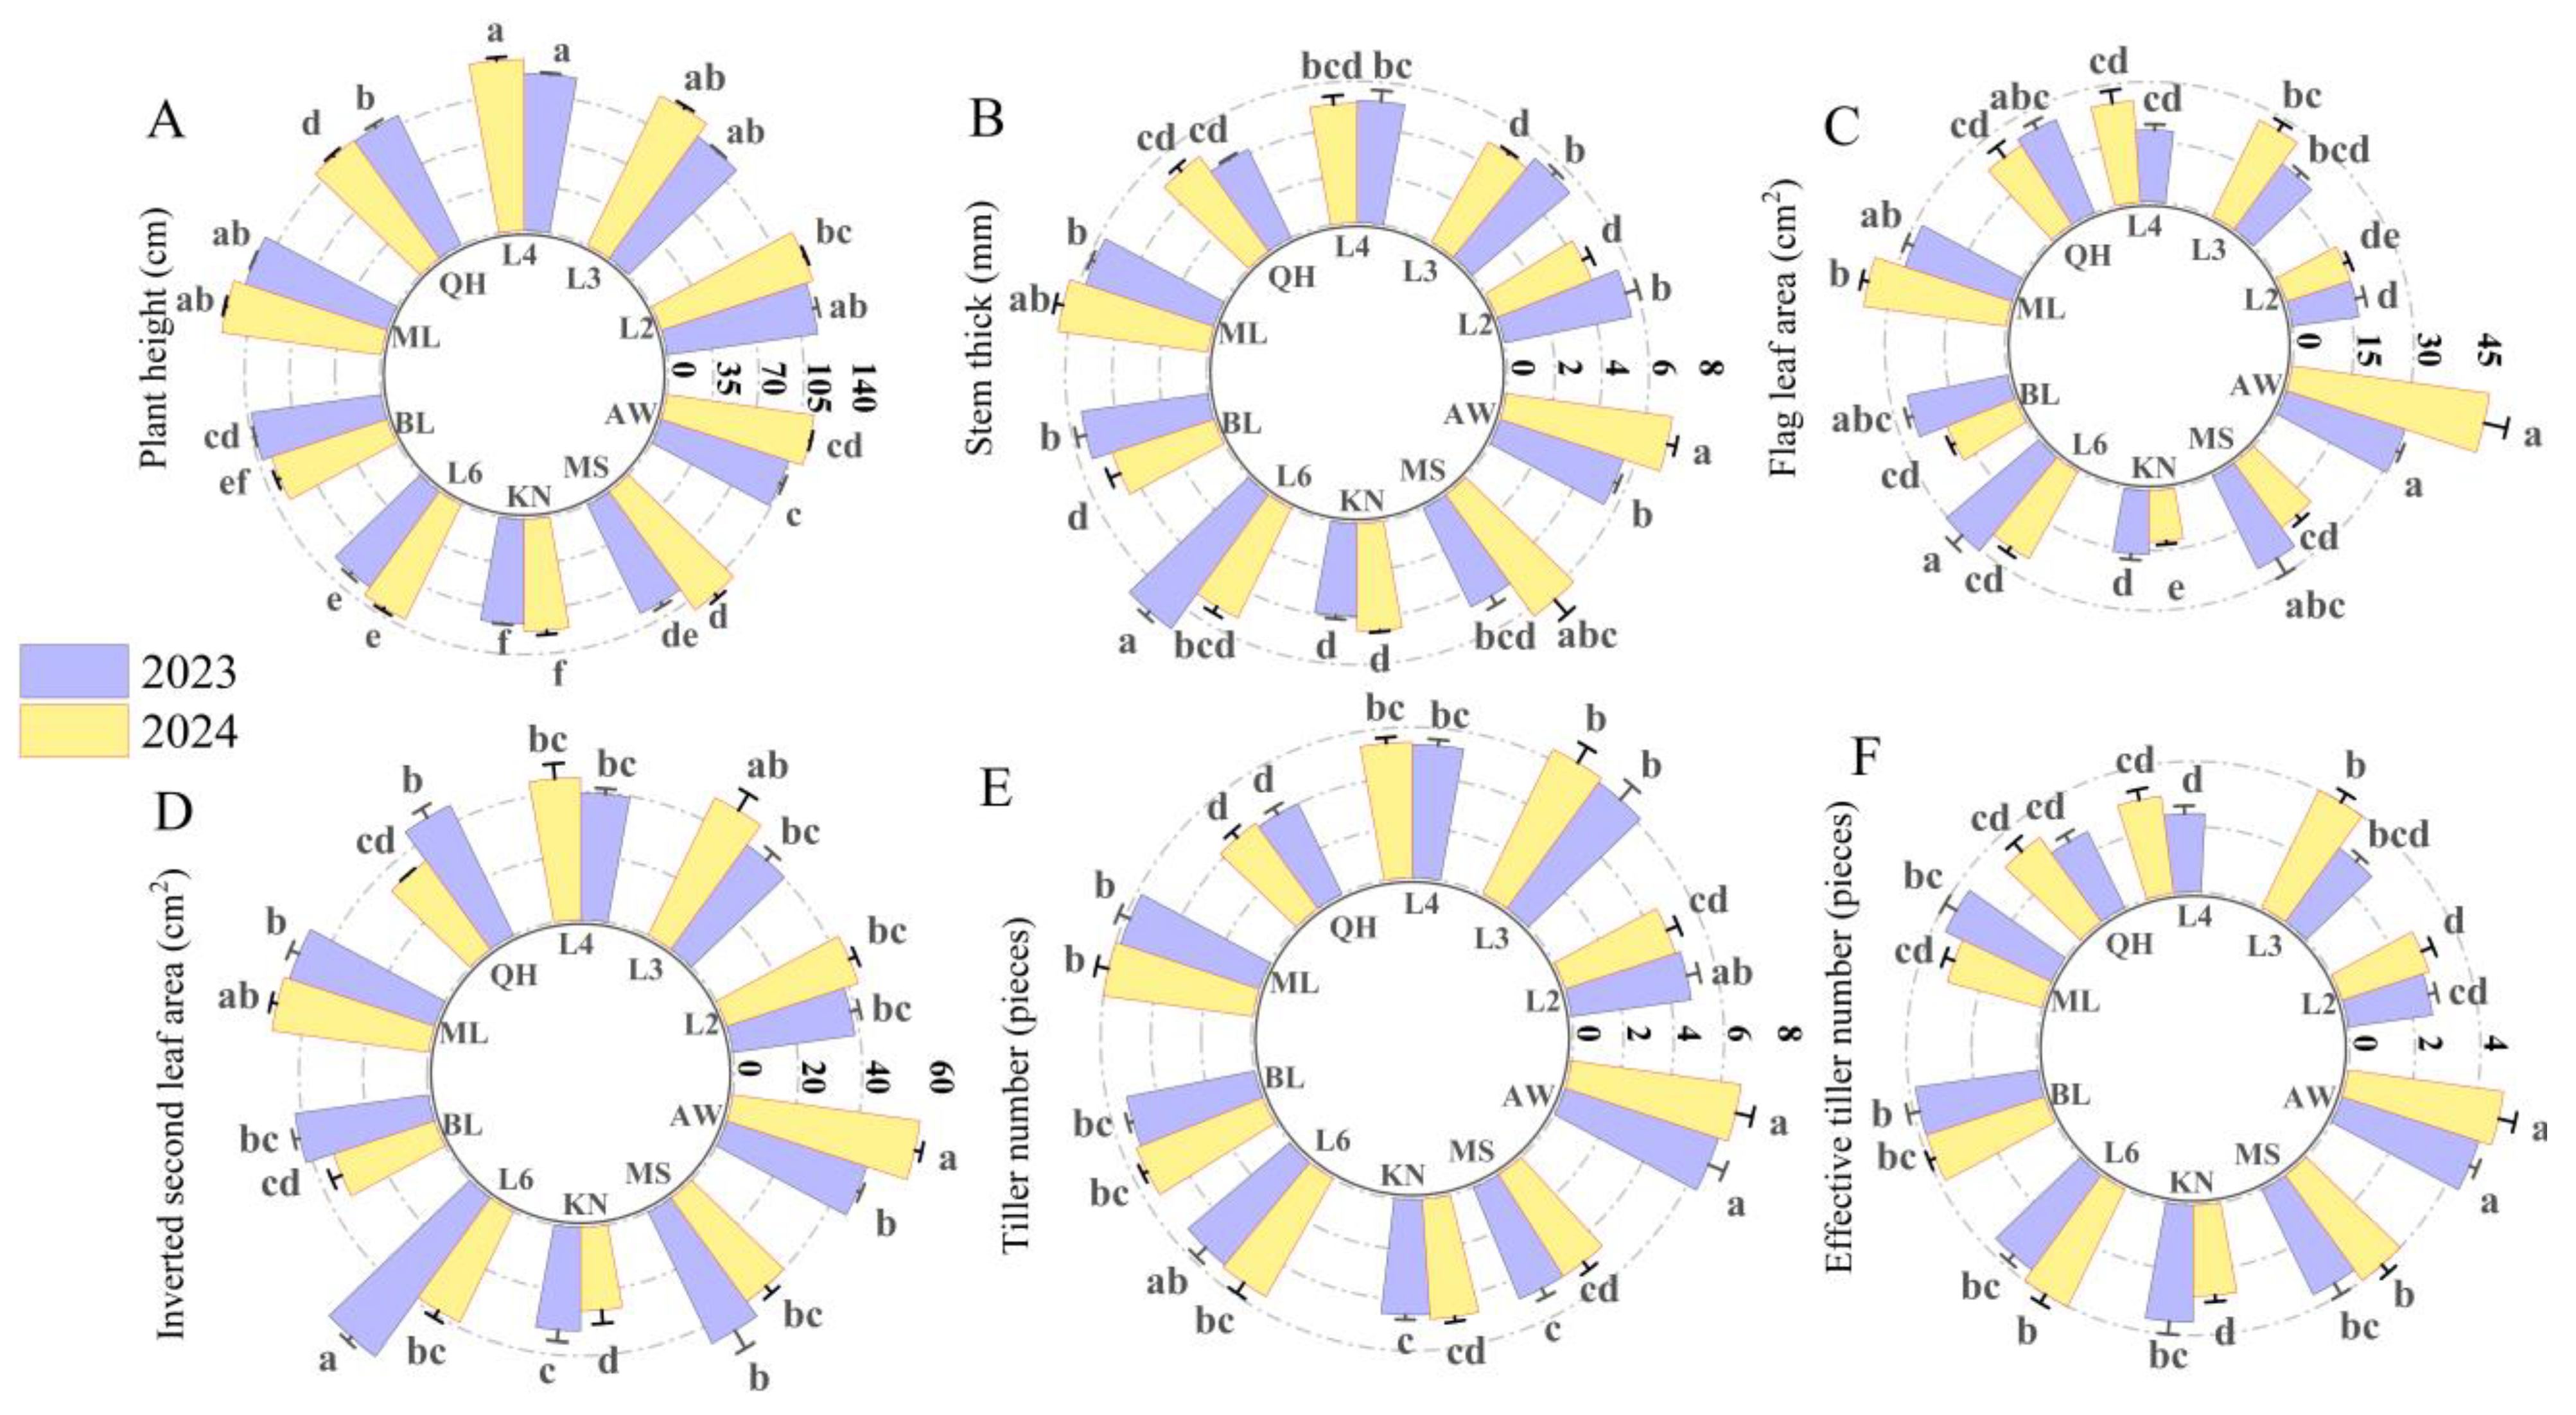
3.2. Agronomic Characters

The analysis of plant height (Figure 2A) for the ten oat varieties revealed that Longyan No. 4 exhibited significantly greater plant heights compared to the other varieties over two consecutive years (p < 0.05), with measurements of 121.72 cm and 132.70 cm, respectively. Kona demonstrated the lowest plant height across both years. Notably, while most oat varieties showed an increase in plant height from 2023 to 2024, Baler II experienced an unexpected decrease in plant height in 2024. The stem diameter significantly influences the quality, taste, and palatability of forage (Figure 2B) [34]. In 2023, Longyan No. 6 had the widest stem diameter at 7.02 cm, while in 2024, Everleaf 126 exhibited the largest stem diameter, measuring 7.12 cm. Kona had the smallest stem diameters in both years, with measurements of 3.94 mm in 2023 and 4.58 mm in 2024. The flag leaf area (Figure 2C) and the second leaf area (Figure 2D) of Everleaf 126 were significantly larger compared to other oat varieties. Specifically, the flag leaf area achieved the highest values over two years, measuring 31.03 cm2 and 49.63 cm2, respectively. These measurements were notably higher than those of other oat varieties (p < 0.05). In contrast, Kona had the smallest flag leaf and second leaf areas among all tested varieties. In the comparison of tiller numbers (Figure 2E) and effective tiller numbers (Figure 2F), Everleaf 126 exhibited significantly higher values in both metrics across the two years (p < 0.05). In contrast, Qinghai 444 consistently showed the lowest tiller number over the two years, with an average of 4. Specifically, in 2023, Longyan No. 4 had the lowest effective tiller number, averaging 2.4, whereas Kona had the lowest effective tiller number in 2024, with an average of 2.8.

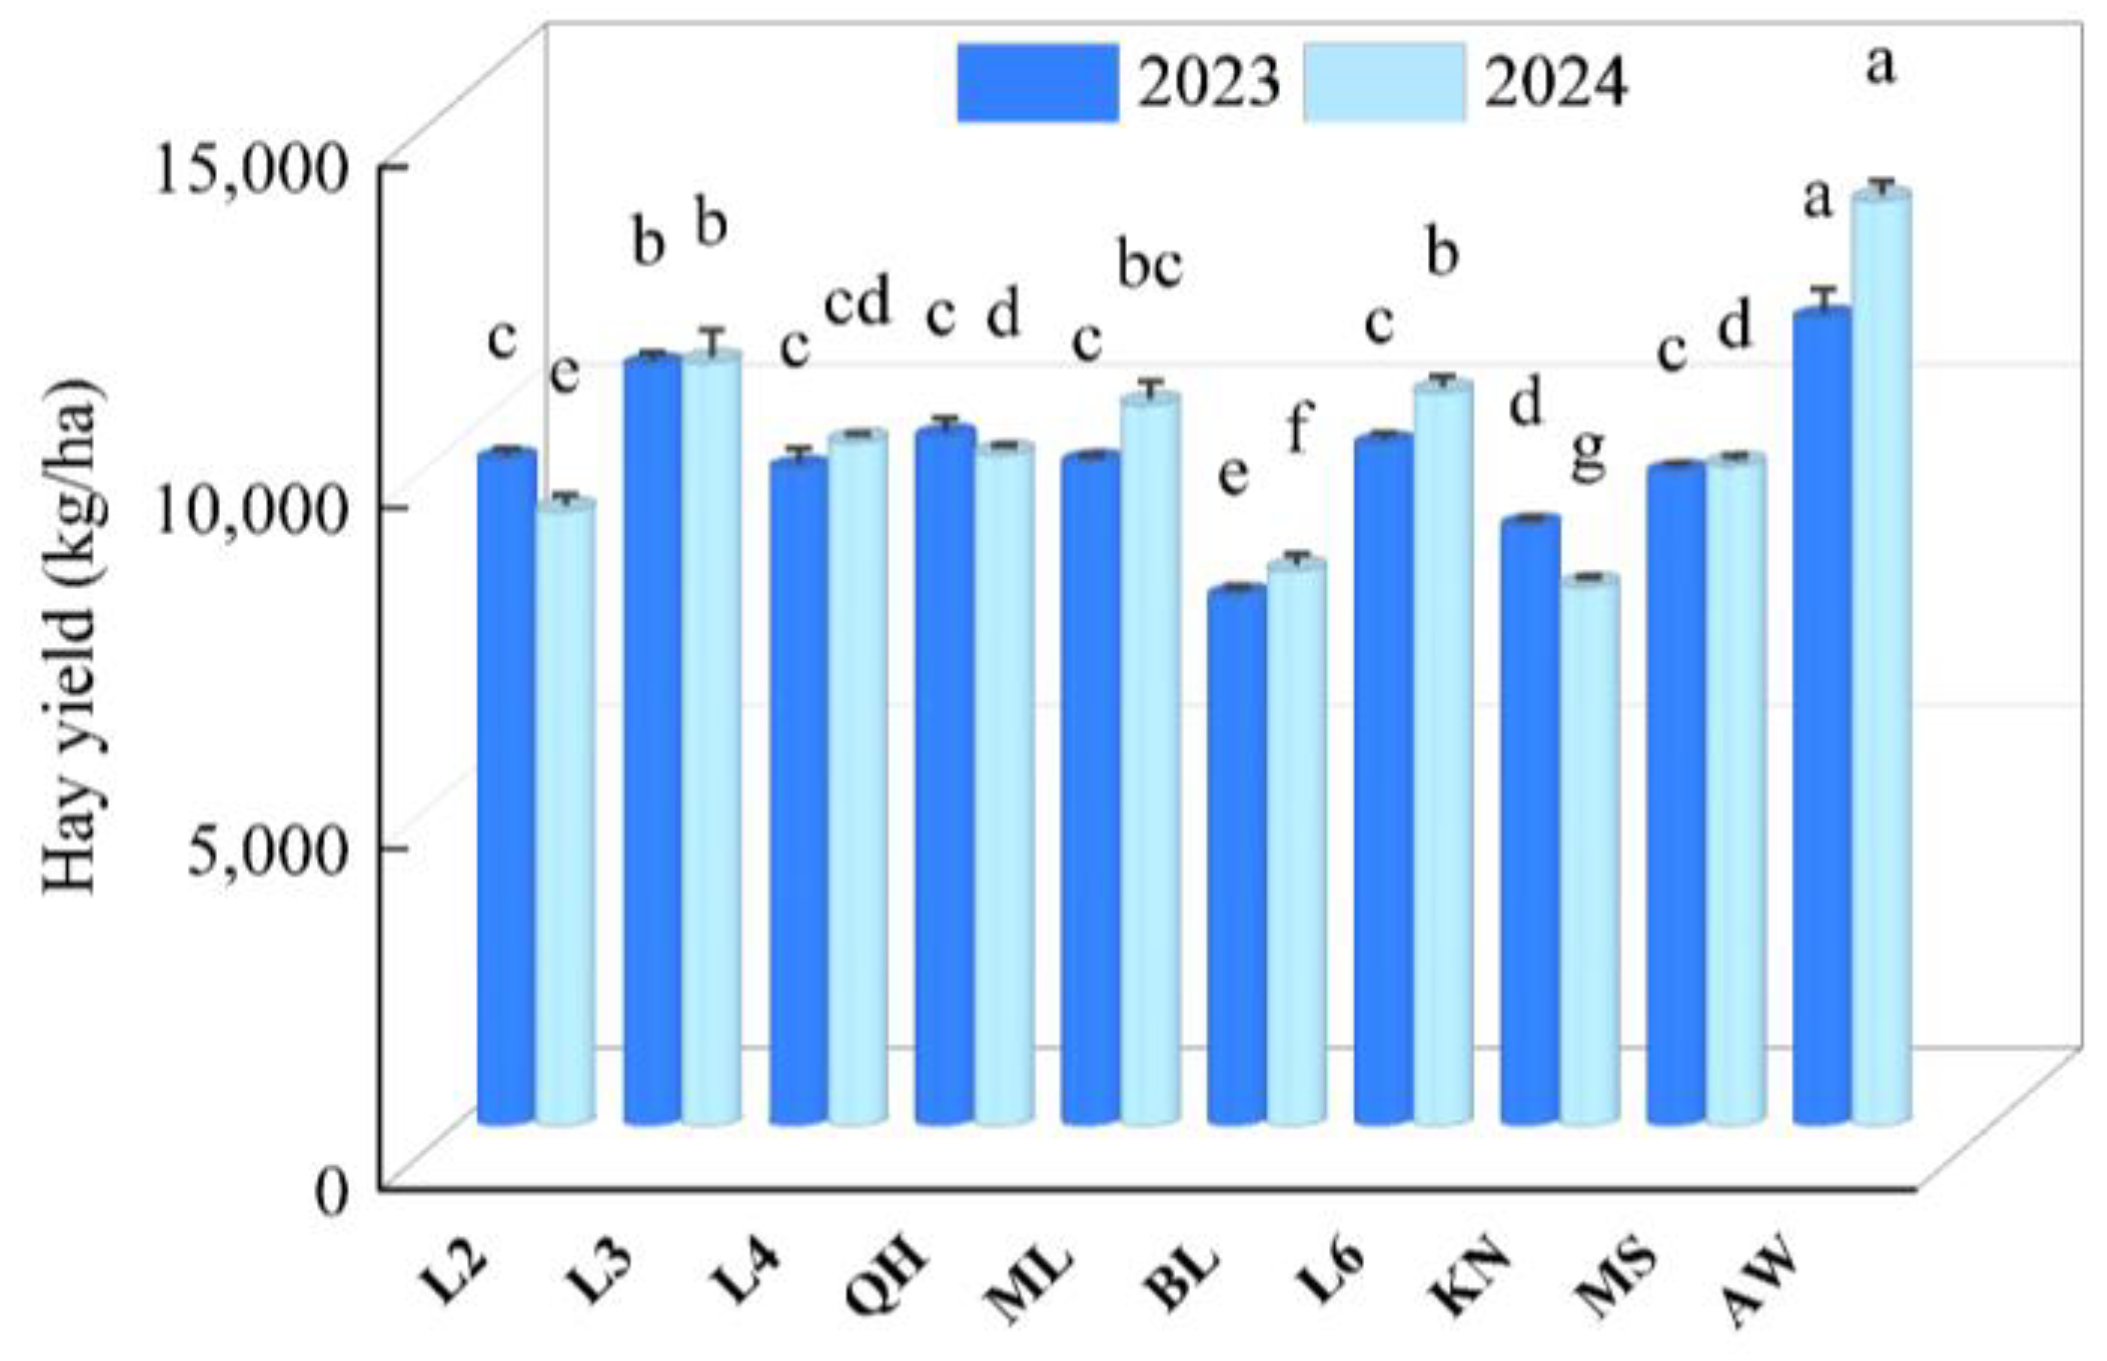
3.3. Hay Yield Analysis of Different Oat Varieties
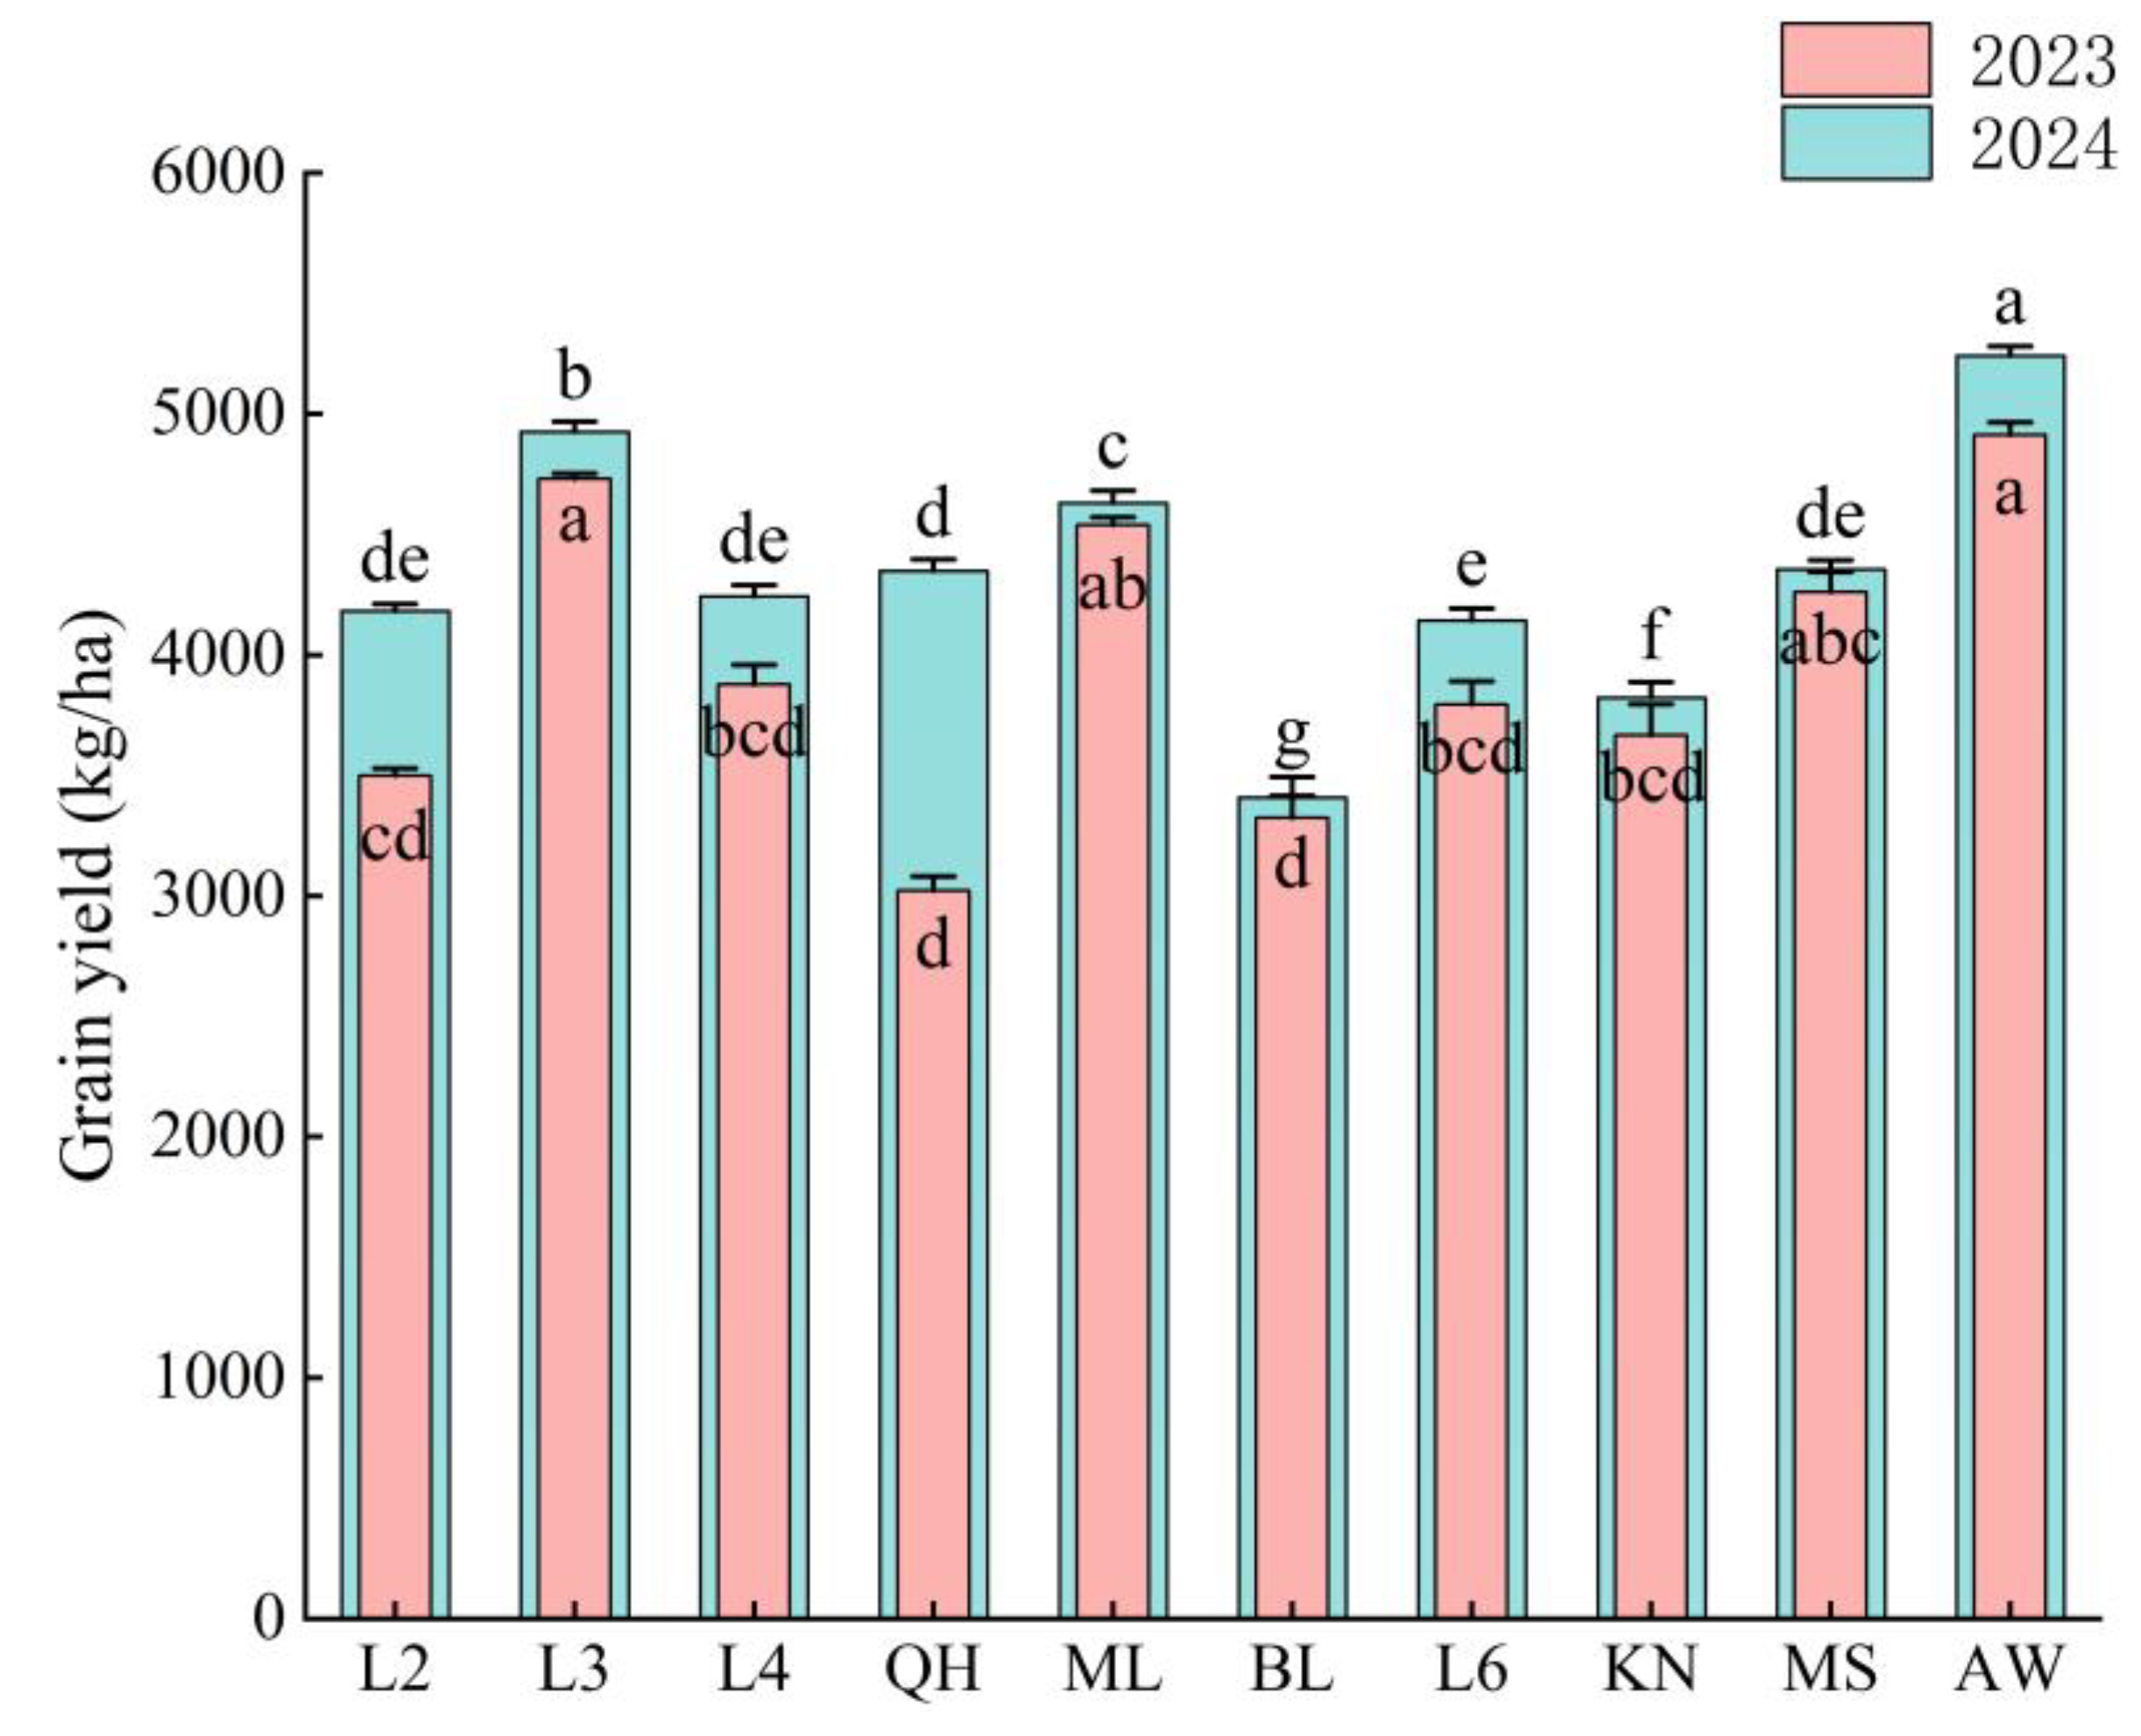
As shown in Figure 3, except for Kona, the hay yields of all the other oat varieties in 2024 surpassed those of 2023. Among the varieties tested, Everleaf 126 demonstrated the highest hay yield in both years, with respective yields of 11,819.33 kg/ha and 13,550.67 kg/ha, significantly outperforming the other oat varieties (p < 0.05). Longyan No. 3 ranked second, achieving yields of 11,120 kg/ha and 11,174.63 kg/ha. In 2023, Baler Ⅱ recorded the lowest hay production. In 2024, the varieties surpassing hay yields in excess of 10,000 kg/ha expanded to include Longyan No. 3, Longyan No. 4, Molasses, Longyan No. 6, and Everleaf 126.

3.4. Grain Yield

As illustrated in Figure 4, the grain yield of the ten oat varieties in semi-arid regions exhibited significant variation over a two-year period. The seed yields of Everleaf 126 were 4913.20 kg/ha and 5242.33 kg/ha over the two-year period, representing the highest yields among all the tested varieties. In 2023, while there was no significant difference in seed yield between Everleaf 126 and Longyan No. 3, they were significantly higher than those of other oat varieties (p < 0.05). In contrast, Qinghai 444 had the lowest grain yield at 3022.23 kg/ha in 2023, while Baler II recorded the lowest yield at 3409 kg/ha in 2024.
Overall, the seed yield of the ten oat varieties increased in 2024. Notably, Everleaf 126, Longyan No. 3, and Molasses exhibited consistently higher average yields over the two-year period compared to other varieties, whereas Baler Ⅱ recorded the lowest seed yield during this time. With the exception of Baler Ⅱ and Kona, which had grain yields lower than 4000 kg/ha in 2024, all the other oat varieties produced yields exceeding 4000 kg/ha. In 2023, however, none of the ten oat varieties achieved a grain yield surpassing 5000 kg/ha.

3.5. Analysis of Nutritional Quality of Different Oat Varieties

The nutritional quality of forage not only determines the growth and development of livestock but also indirectly influences the yield and quality of livestock products [35]. As shown in Figure 5, Everleaf 126 demonstrated superior nutritional characteristics compared to other oat varieties, with a significantly higher leaf–stem ratio, crude protein content, and crude fat content (p < 0.05). Specifically, in 2024, these values were 0.41, 9.13%, 2.69%, and 7.32%, respectively. The leaf–stem ratios of Molasses, Longyan No. 2, Qinghai 444, and Longyan No. 3 decreased in 2024 (Figure 5A). The leaf–stem ratios for Kona were the lowest, at 0.13 and 0.19 for the respective samples. As shown in Figure 5B, the crude protein content of most of the oat varieties increased in 2024, with the exception of Baler II, which experienced a decline. Notably, the 2024 crude protein content of Longyan No. 3 was 27% higher compared to its 2023 levels. The crude fat contents of Longyan No. 3 and Qinghai 444 decreased in 2024, whereas the crude fat contents of the other oat varieties increased compared to 2023 (Figure 5C). Regarding soluble sugar content, Kona, Longyan No. 6, and Baler II showed a decrease in 2024, while the remaining varieties exhibited an increase (Figure 5D). The soluble sugar content of Qinghai 444 was the lowest in 2023 at 3.91%, while Longyan No. 4 had the lowest soluble sugar content in 2024 at 3.40%. In terms of fiber content (Figure 5E,F), Kona exhibited the highest levels of neutral detergent fiber (55.03%) and acid detergent fiber (42.95%) in 2023. In 2024, Baler II produced the highest acid detergent fiber content, whereas Qinghai 444 had the highest neutral detergent fiber content. Everleaf 126 consistently showed the lowest neutral detergent fiber content across both years.

3.6. Disease Analysis

The resistances of the oat varieties to powdery mildew, red leaf blotch, and leaf spot disease showed significant variation (p < 0.05). Among the ten evaluated oat varieties, Longyan No. 3, Molasses, Longyan No. 6, Mengshi, and Everleaf 126 exhibited consistent resistance to all three diseases over the two-year evaluation period. In the evaluation of powdery mildew resistance, Everleaf 126 demonstrated the lowest disease indices, with values of 8.1 and 9.4, respectively, indicating moderate resistance (MR). Conversely, Kona exhibited the highest disease indices, at 17.2 and 16.6, respectively, suggesting moderate susceptibility (MS) (Table 4). In the evaluation of red leaf disease resistance (Table 5), Longyan No. 3, Molasses, Longyan No.6, and Everleaf 126 all demonstrated strong resistances. Specifically, Molasses had the lowest average severity score of 0.63 in 2023, while Everleaf 126 achieved the lowest average severity score of 0.56 in 2024. In contrast, Qinghai 444 exhibited the highest average severity scores over the two years, with values of 1.45 in 2023 and 1.17 in 2024, indicating its susceptibility to red leaf disease (Table 5). In the evaluation of leaf spot disease resistance, both Qinghai 444 and Kona consistently exhibited the highest disease indices over two years, indicating moderate susceptibility (MS). The resistance of Longyan No. 2 to leaf spot disease declined from moderately resistant (MR) to moderately susceptible (MS). Conversely, Baler II showed an improvement from moderately susceptible (MS) to moderately resistant (MR). Other oat varieties maintained consistent moderate resistance (MR) to leaf spot disease (Table 6).

3.7. Analysis of Aphid Resistance of Different Oat Varieties

The resistance of the 10 oat varieties to aphids exhibited significant variation (Table 7). Among the oats, Longyan No. 3, Mengshi, and Everleaf 126 consistently demonstrated resistance (R) over two years, with Everleaf 126 showing the highest level of resistance. Conversely, Longyan No. 2, Longyan No. 4, and Qinghai 444 were consistently susceptible (S) to aphids during this period. In 2023, Kona displayed the lowest resistance, categorized as highly susceptible (HS). In 2024, the second generation of Baler II also showed high susceptibility (HS) to aphids. Notably, Molasses, Longyan No. 6, and Kona exhibited improved resistances in 2024 compared to 2023, while the second generation of Baler II experienced a more pronounced decline in resistance, remaining highly susceptible (HS).

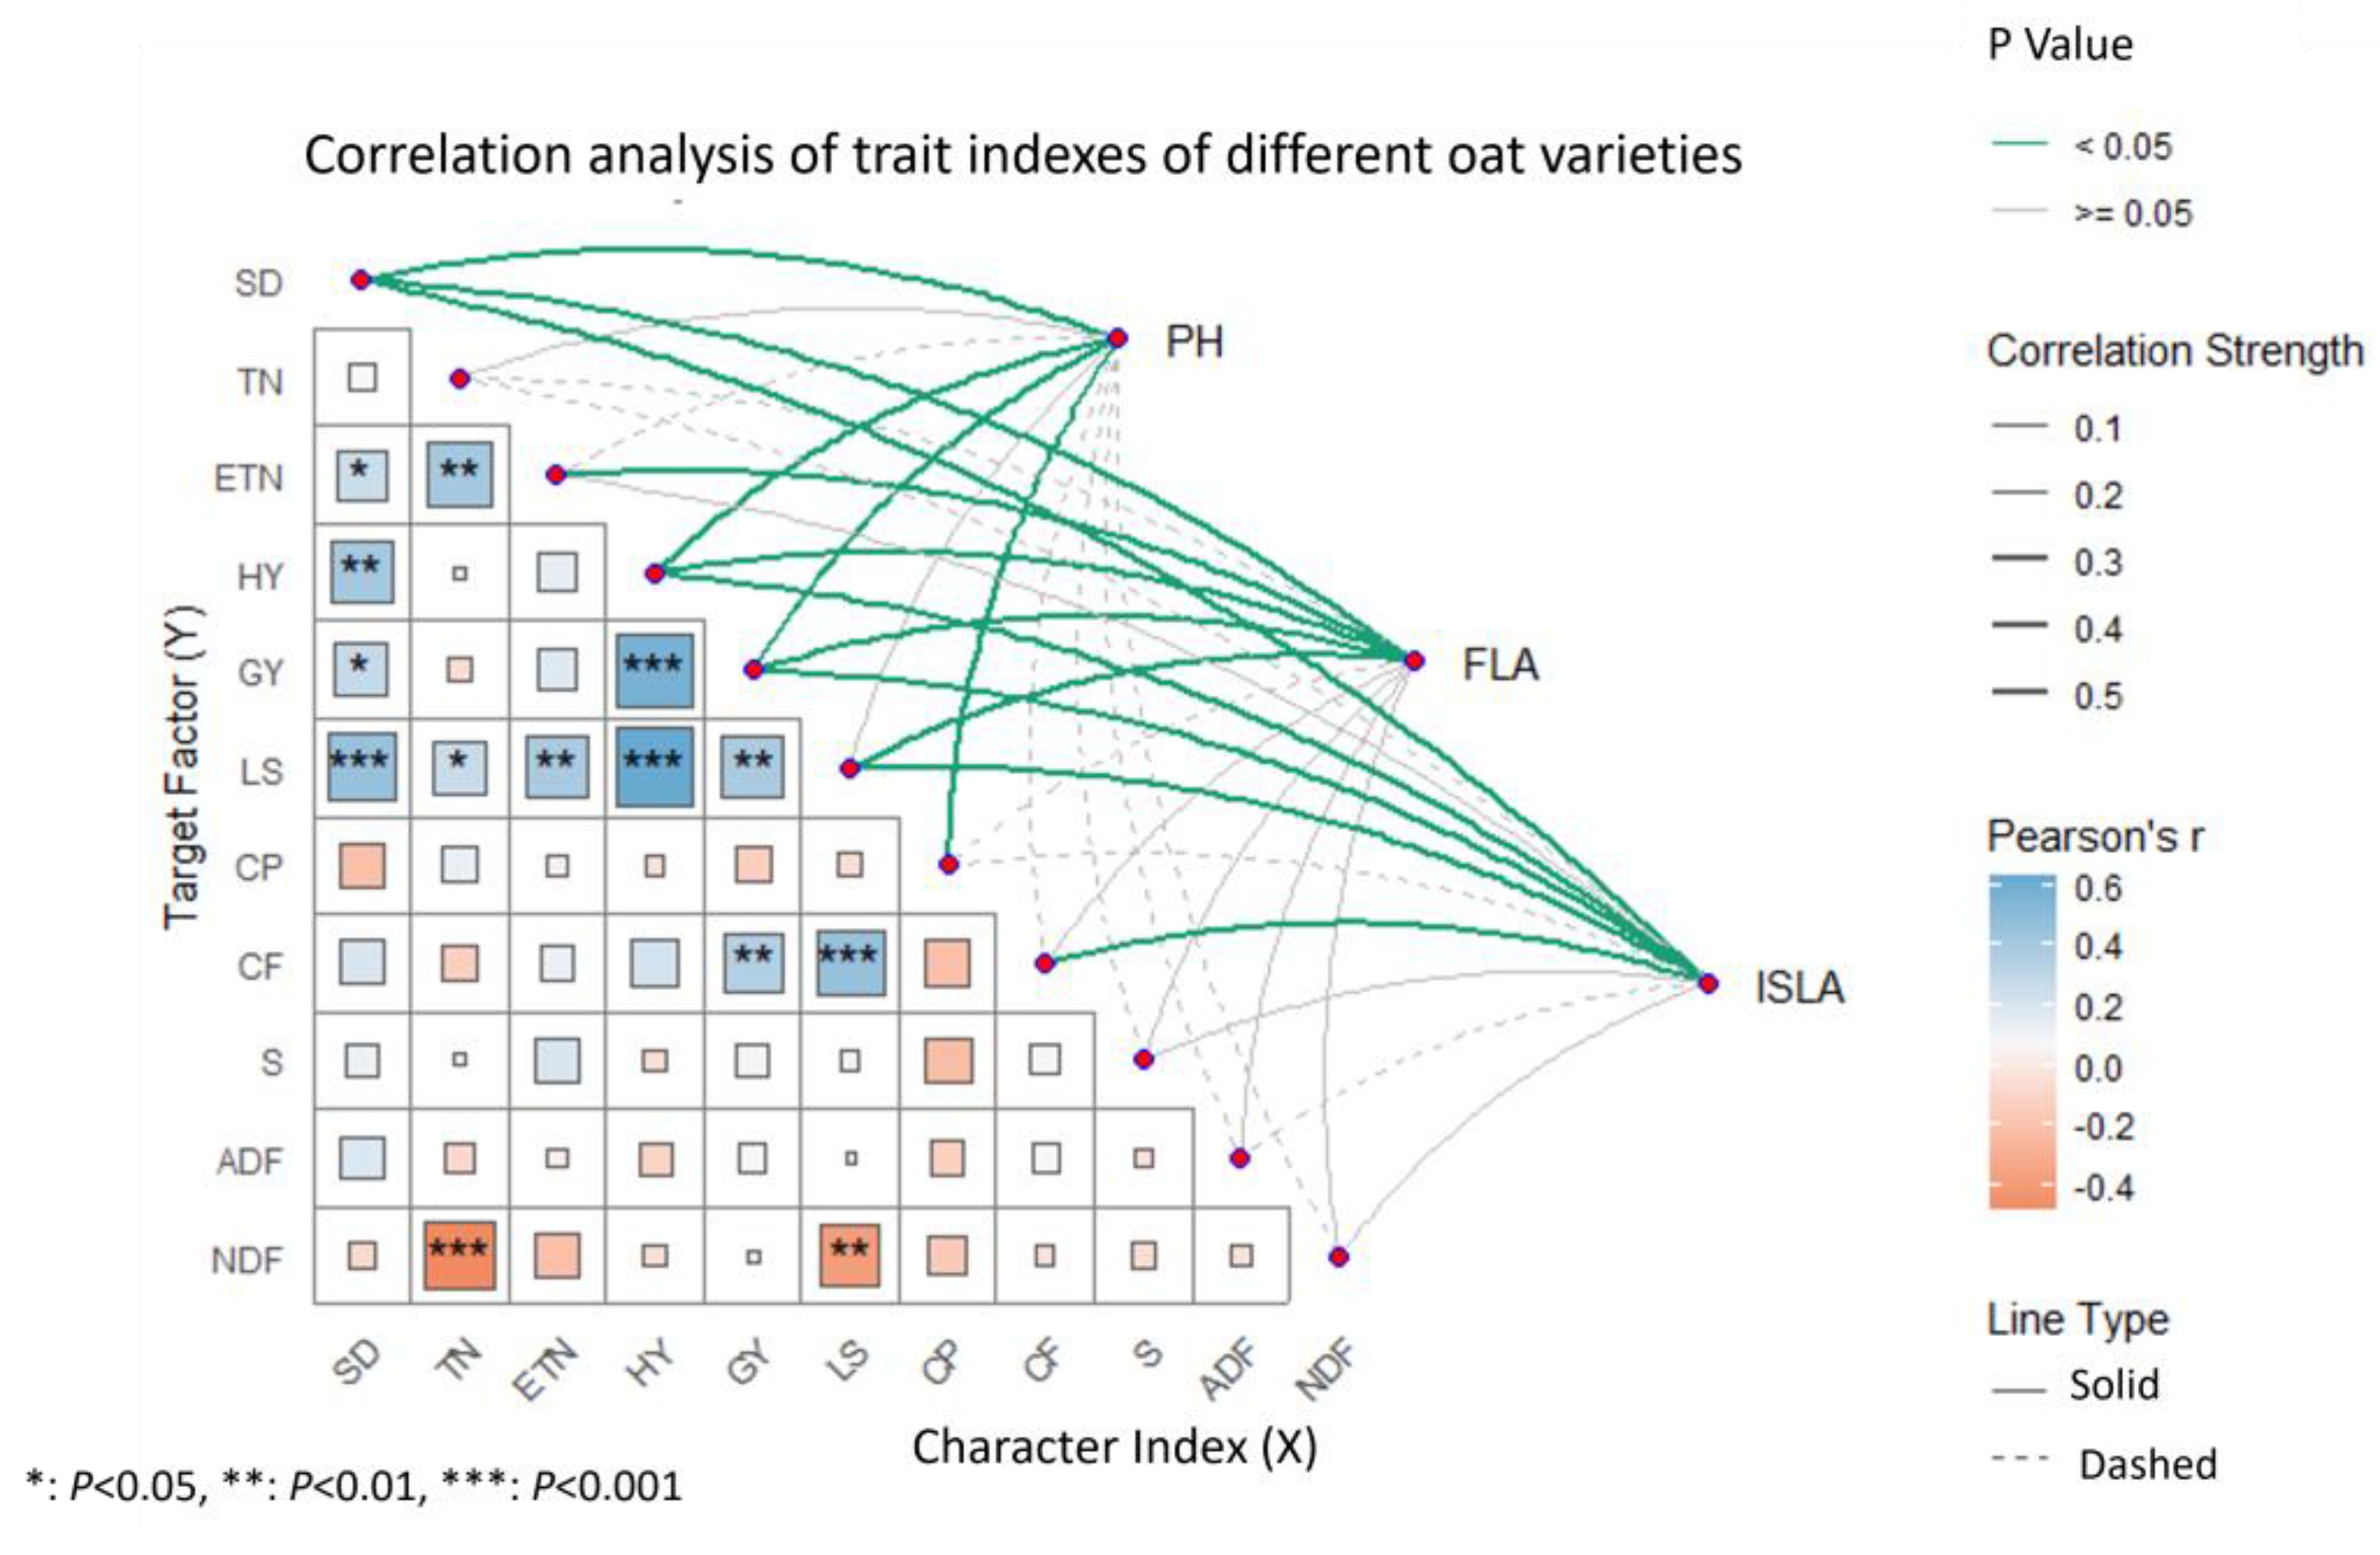
3.8. Correlation Analysis of Traits

Through the correlation analysis of 14 indices across the 10 oat varieties (Figure 6), it was observed that plant height (PH) and leaf area significantly influenced oat yield and quality. Specifically, PH exhibited significant correlations with stem diameter (SD), hay yield (HY), grain yield (GY), and crude protein content (CP). Meanwhile, the internode to flag leaf area (FLA) and internode to inverted second leaf area (ISLA) were significantly correlated with SD, HY, GY, and leaf–stem ratio (LS) (p < 0.05). Additionally, ISLA showed a significant correlation with crude fat (CF). The thicknesses of the lines in the correlation diagram visually represent the strength of the relationships, where thicker lines indicate stronger correlations. Notably, the line between ISLA and LS is particularly thick, suggesting a strong correlation between specific leaf area and leaf–stem ratio. Furthermore, LS was significantly correlated with effective tiller number (ETN) at the 0.001 level.

3.9. Comprehensive Index, Weight, Membership Function Value, D Value, and Comprehensive Evaluation of 10 Oat Varieties

The membership function method was utilized to conduct a comprehensive evaluation of the 16 indicators across the 10 oat varieties, resulting in the membership function values for these varieties under different principal components (Table 8 and Table 9). Specifically, in 2023, Molasses exhibited the highest membership function value for the first principal component of the composite index, U(X1) = 1.00. In 2024, Everleaf 126 achieved the same highest membership function value for this principal component, also at U(X1) = 1.00. Notably, Kona had the lowest membership function value for this component in both years, with U(X1) = 0.00. It is evident that under Principal Component 1, Molasses and Everleaf 126 exhibit the highest suitability, while Kona shows the lowest adaptability. Consequently, based on the D value, the suitability ranking of the ten oat varieties in 2023 is as follows: Everleaf 126 > Molasses > Longyan No. 3 > Longyan No. 6 > Mengshi > Longyan No. 4 > Qinghai 444 > Baler II> Longyan No. 2 > Kona. Based on the D value, the optimal planting order for the ten oat varieties in 2024 is as follows: Everleaf 126 > Molasses > Longyan No. 3 > Longyan No. 6 > Mengshi > Longyan No. 4 > Baler II > Qinghai 444 > Longyan No. 2 > Kona.

4. Discussion

4.1. Growth Period and Yield Traits of Different Oat Varieties

Plant growth is influenced by a multitude of climatic factors, including light, temperature, and precipitation, as well as soil conditions. These factors not only affect plant development but also influence the timing of crop sowing and other agricultural practices. The duration of the growth period for forage grass is primarily determined by the genetic characteristics of the variety; however, environmental conditions and cultivation management practices also play a significant role [36]. The findings of this study reveal that ten oat varieties successfully completed their entire growth cycles within a two-year period. In the first year, growth durations ranged from 97 to 111 days, and in the second year, they ranged from 99 to 113 days. Notably, the variety Everleaf 126 exhibited the longest growth period, while Qinghai 444 demonstrated the shortest. Furthermore, oats cultivated in Gansu are predominantly spring oats, which is consistent with the typical growth period of 100 to 120 days observed in most regions [37].
Agronomic traits serve as direct indicators of the phenotypic characteristics and ecological adaptability of species, constituting one of the primary methodologies in traditional variety breeding [38]. Plant height is a crucial determinant of forage yield and can be used as a significant proxy to evaluate grass productivity [39]. In this study, the average plant heights of the ten oat varieties were 105.53 cm and 113.13 cm, respectively, in 2023 and 2024. These values were notably lower than the average plant height of 123.90 cm reported for oats grown in the semi-arid regions of northwest China [40]. Kirk’s research findings reveal a positive correlation between oat grass yield and plant height, indicating that taller plants generally exhibit higher yield potential [41]. Similarly, Zhang Jie identified plant height as a critical determinant of forage yield, noting substantial variation in this trait among different varieties [42]. Notably, the Helios variety demonstrated the greatest plant height, which aligned with its superior hay yield of 5812.10 kg/ha. In this experiment, the plant height of Longyan No. 4 was higher than that of other oat varieties, measuring 121.72 cm and 132.70 cm, respectively (p < 0.05). Although Everleaf 126 exhibited a lower plant height at 103.32 cm and 115.14 cm, it achieved the highest hay yields among all varieties, at 11,819.33 kg/ha and 13,550.67 kg/ha. The flag leaf area and the second leaf area of this oat variety were significantly larger than those of other varieties (p < 0.05). Leaf area plays a critical role in directly influencing hay yield. As a result, this variety demonstrated superior yield performance relative to the other oat varieties. Therefore, plant height serves not only as a critical determinant of forage yield but also as an integrative indicator reflecting other agronomic traits such as tiller number and leaf area. The variations in grass yield among different oat varieties can be attributed to multiple factors, including the genetic production performance of the varieties, sowing and harvesting periods, and the semi-arid ecological conditions characteristic of the region [43].
Oat grain yield is a critical metric for assessing the adaptability of oat varieties. The number of effective tillers per plant is a primary factor that significantly influences seed yield. Furthermore, the grain yield of different oat cultivars varies across regions and environmental conditions [44]. The mean effective tiller count for the 10 oat varieties examined in this study was 5, which was substantially higher than the average of 2.8 reported by Li Feng in his investigation of 16 oat varieties on the Songnen Plain [45]. The number of effective tillers in the Everleaf 126 variety reached up to six, significantly higher than that observed in other oat varieties (p < 0.05). This suggests that this particular variety possesses a superior capacity for reproductive branch differentiation, which plays a crucial role in contributing to the significant yield differences among oat varieties. Consequently, the variation in yield across different oat varieties is influenced not only by their adaptability to the climate and environment but also by the intrinsic characteristics of the selected forage oat varieties.

4.2. Nutritional Quality

The nutritional quality of forage not only directly affects the growth, reproduction, and foraging behaviors of livestock and wild herbivores by influencing nutrient acquisition, but also indirectly impacts the yield, quality, and economic value of livestock products through altered forage-herbivore interactions [46]. The proportions of stems, leaves, and ears in oats significantly influence their nutritional composition, which in turn determines their feeding value and palatability. Lou Chunhua examined the production performance of oats in the Yellow River beach area and found that leaf-to-stem ratios in this region ranged from 0.66 to 1.44 [47]. By contrast, the leaf-to-stem ratios observed in our study were considerably lower, ranging from 0.14 to 0.41. It is well established that leaf–stem ratio is primarily regulated by genetic factors, while environmental conditions play a significant role in influencing leaf development. The Yellow River beach area, characterized by a temperate continental monsoon climate with an annual average rainfall of approximately 656.3 mm, provides optimal temperature and precipitation levels conducive to oat leaf development. As a result, these favorable environmental conditions contributed to a higher leaf–stem ratio.
From a nutritional perspective, crude protein (CP) is an essential nutrient for livestock. Its concentration not only affects the economic efficiency of forage but also has a direct impact on milk yield and milk protein content in livestock [48]. Crude fat, as a critical energy source second only to crude protein, plays a significant role in enhancing heat retention in animals during winter, protecting them from harsh environmental conditions and storing energy to prevent fat loss in yaks [49]. In this experiment, the CP and CF of Everleaf 126 were significantly higher than those of other oat varieties over the two-year period (p < 0.05). The peak values for CP and EE were recorded in 2024 at 9.13% and 2.69%, respectively, which were lower than the results reported by Kanwal A [50]. Furthermore, except for Baler II, the CP content of the other oat varieties exhibited a significant increase, likely due to the different times at which these varieties entered the grain-filling stage and variations in sampling times. Neutral detergent fiber (NDF) affects the feed intake rate of forage, whereas acid detergent fiber (ADF) influences its digestibility. High-quality forage is typically characterized by higher concentrations of crude protein (CP) and ether extract (EE), coupled with lower levels of ADF and NDF. In this experiment, the neutral detergent fiber (NDF) and acid detergent fiber (ADF) contents of Kona in 2023 were significantly higher than those of other oat varieties (p < 0.05). Notably, Everleaf 126 exhibited the lowest NDF content over the two-year study period. These results align with Wang Yanchao’s reported NDF range of 41.84% to 59.45% for ten oat varieties in Qinghai Province [51]. However, a significant difference was observed in ADF content, which may be attributed to environmental variations at the testing site or inherent differences among the oat varieties.
Soluble sugar is an essential compound that plays a pivotal role in the synthesis and catabolism of higher plants, including sucrose, glucose, fructan and other related carbohydrates. Moreover, it serves as a critical osmotic regulator in plants [52]. In this experiment, Longyan No.6 exhibited the highest soluble sugar content in 2023, while Everleaf 126 showed the highest content in 2024. The results were lower than those reported by Fu Dongqing [53] (6–13%), but consistent with the findings of Quzhen (7–11%) [54]. These discrepancies may be attributed to variations in cultivar types, ecological conditions, and methodologies employed for determining soluble sugar content.

4.3. Diseases and Pests of Different Oat Varieties

Our screening and comprehensive evaluation of the introduced oat varieties not only focuses on agronomic traits, feeding value, and grain yield, but also places significant emphasis on stress resistance. In light of the changing climate and environmental conditions, oat cultivation faces increasing threats from diseases such as powdery mildew, red leaf disease, smut, and leaf spot. These diseases have resulted in a notable decline in both the quality and yield of oat forage [55]. In this study, Longyan No. 3, Molasses, Longyan No.6, Mengshi, and Everleaf 126 exhibited significant resistance to the three diseases under investigation. Notably, Everleaf 126 demonstrated the highest level of resistance to powdery mildew over a two-year period. According to Zhao Feng, among 213 oat germplasms evaluated for powdery mildew resistance, only 28 (13.1%) were identified as resistant, while 185 (86.9%) were found to be susceptible [56]. These findings underscore the critical role of oat variety in determining susceptibility to powdery mildew. The investigation into powdery mildew resistance indicated that the susceptibility of certain oat varieties to the disease had changed, possibly due to variations in climatic conditions and precipitation levels. Oat red leaf disease, caused by the barley yellow dwarf virus (BYDV) and transmitted by aphids, poses a significant threat to oat crops. Notably, Kona and Baler II exhibited the lowest resistance to aphids, rated as highly susceptible (HS) in 2023 and 2024, respectively. Consequently, these two varieties demonstrated the lowest resistances to red leaf disease and experienced the highest average severity over the two-year evaluation period. However, Everleaf 126 and Longyan No. 3 exhibited superior and consistent resistance (R) to aphids over the two years. Furthermore, these varieties demonstrated higher resistance to red leaf disease, achieving high resistance (HR). In 2023, seven of the oat varieties exhibited increased susceptibility to aphids, while in 2024, only four varieties showed similar vulnerability. This phenomenon can be attributed to the increased average temperature in 2023, which resulted in a rise in oat aphid populations, consequently diminishing the resistance to red leaf disease.
Oat leaf spot disease is prevalent in most global oat cultivation regions. This disease is distinguished by its widespread occurrence, prolonged duration, and significant impact. During the seedling stage, it can lead to stunted growth and, in severe cases, seedling mortality [57]. Jalli investigated oat leaf spot disease in Finland and reported field incidence rates ranging from 25% to 63% [58]. In this study, the resistance of ten oat varieties to leaf spot disease was evaluated, categorizing them as either moderately susceptible or moderately resistant. The disease indexes for Everleaf 126 were the lowest, at 13.5 and 14.0, respectively, indicating its higher resistance. In contrast, Baler II (2023) and Kona (2024) exhibited the highest disease indices, with values of 31.0 and 25.0. Overall, the ten oat varieties exhibited lower resistances to oat leaf spot disease. This phenomenon may be attributed to the varying levels of genetic resistance among different oat varieties or the influence of the planting environment. Notably, the average temperature over the two-year period was higher than usual, which was conducive to the growth of leaf spot pathogens such as Alternaria alternata and Epicoccum layuens, thereby increasing the likelihood of leaf spot disease occurrence.

4.4. Comprehensive Evaluation Analysis

Given the complex interdependencies among crop traits, yield, and quality, the performance of oat varieties is determined not only by their inherent characteristics but also by a multitude of external factors, particularly environmental conditions. Consequently, there is a significant correlation between these three elements. Conducting correlation analysis can provide deeper insights into the relationships between quantitative traits, thereby enabling a more comprehensive understanding of the synergistic interactions among them [59]. In this study, leaf area and plant height (PH) were found to have significant positive correlations with yield, while exhibiting negative correlations with soluble sugar (S), acid detergent fiber (ADF) and neutral detergent fiber (NDF). Consequently, when cultivating oat forage grass in semi-arid regions, it is advisable to select varieties that optimize plant height and leaf area.
The membership function method offers a comprehensive and systematic evaluation of the index by calculating the weighted average of the measurement indicators. This approach effectively addresses the limitations associated with relying solely on a limited number of indicators for assessment [60]. The membership function values for the ten oat varieties ranged from 0.13 to 0.78, with an average value between 0.6 and 0.7, indicating excellent performance and classifying them as Grade I. Values between 0.4 and 0.6 are considered good and categorized as Grade II, while values between 0.3 and 0.4 are deemed suboptimal and classified as Grade III. Any value below 0.3 is classified as Grade IV [61]. In 2023, the Everleaf 126 and Molasses varieties were rated as excellent (Grade I); Longyan No. 3, Longyan No. 6, and Mengshi were rated as good (Grade II); Baler II was rated as poor (Grade III); and Longyan No. 1, Longyan No. 4, Qinghai 444, and Kona were rated as very poor (Grade IV). In 2024, Everleaf 126 was again rated as excellent (Grade I); Longyan No. 3, Molasses, Longyan No. 6, and Mengshi were rated as good (Grade II); Longyan No. 4 was rated as poor (Grade III); and Longyan No. 2, Qinghai 444, Baler II, and Kona were rated as very poor (Grade IV). In this study, the comprehensive evaluation of Everleaf 126 was consistently the highest over the two-year period, whereas Kona received the lowest overall evaluation. According to Nan Ming, Baiyan 15 and Yanke 2 oats demonstrated superior performance in an introduction trial conducted in the semi-arid region of northwest China [62]. This discrepancy could be attributed to the distinct genotypes of different oat varieties and their varying degrees of adaptability to environmental conditions. Therefore, evaluating the adaptability of different oat varieties should not depend solely on a single trait. Instead, a comprehensive assessment that thoroughly considers the adaptability of each variety within the local context is essential. When evaluating the adaptability of various oat varieties, integrating the membership function method with other evaluation techniques can address discrepancies caused by varying index units, manage fuzzy data more effectively, improve comparability, facilitate interdisciplinary applications, and provide more comprehensive and precise analysis results and solutions [63].

5. Conclusions

In semi-arid regions, the stress resistance of oat varieties is a crucial factor determining their adaptability and consistent yield. Significant differences were observed in yield, quality, and disease resistance among various oat varieties. All ten oat varieties could successfully complete their growth cycles. Everleaf 126, despite its relatively shorter plant height, exhibits superior leaf area and tiller count, which enhance its ability to capture sunlight and perform efficient photosynthesis. This leads to greater accumulation of dry matter during later growth stages. As a result, Everleaf 126 demonstrates the highest nutritional quality and exhibits stronger resistance to pests and diseases. Longyan No. 3 and Molasses also exhibited outstanding performance, characterized by taller plant heights, superior yields and quality, and pest and disease resistance on par with Everleaf 126. After a comprehensive evaluation using the membership function, it was concluded that Everleaf 126 was the most suitable variety for cultivation in semi-arid regions, followed closely by Molasses and Longyan No. 3. In contrast, Kona demonstrated poor adaptability to this environment.

Author Contributions

Conceptualization, G.Z. (Guanlu Zhang) and J.C.; methodology, G.Z. (Guanlu Zhang); software, G.Z. (Guanlu Zhang), J.C., G.Z. (Guiqin Zhao), L.Z., W.W. and K.N.; validation, G.Z. (Guanlu Zhang), G.Z. (Guiqin Zhao), L.Z., W.W. and K.N.; formal analysis, G.Z. (Guanlu Zhang), J.C., G.Z. (Guiqin Zhao) and L.Z.; investigation, G.Z. (Guiqin Zhao), L.Z., W.W. and K.N.; resources, J.C. and G.Z. (Guiqin Zhao); data curation, G.Z. (Guanlu Zhang), J.C. and L.Z.; writing—original draft preparation, G.Z. (Guanlu Zhang); writing—review and editing, G.Z. (Guanlu Zhang) and J.C.; visualization, J.C., W.W. and K.N.; supervision, J.C. and G.Z. (Guiqin Zhao); project administration, G.Z. (Guanlu Zhang); funding acquisition, J.C., G.Z. (Guiqin Zhao), W.W. and K.N. All authors have read and agreed to the published version of the manuscript.

Funding

This work was funded by the National Center of Pratacultural Technology Innovation (under preparation) Special Fund for Innovation Platform Construction (CCPTZX2023B05); the Chief Scientist Program in Gansu Province (23ZDKA013); the China Agriculture Research System (CARS-7-C-1); and the study of the cultivation and processing technology of forage oats in semi-arid area of Shandan County (GSAU-JSYF-2023-16).

Data Availability Statement

The data presented in this study are available on request from the corresponding author.

Acknowledgments

We extend our sincere gratitude to the College of Pratacultural Science at Gansu Agricultural University and the Key Laboratory of Grassland Ecosystems, Ministry of Education, for their invaluable support in facilitating our experimental platform.

Conflicts of Interest

The authors declare no conflicts of interest.

References

  1. Ki-Seung, K.; Tinker, N.A.; Newell, M.A. Improvement of Oat as a Winter Forage Crop in the Southern United States. Crop Sci. 2014, 54, 1336–1346. [Google Scholar] [CrossRef]
  2. Mccartney, D.; Fraser, J.; Ohama, A. Annual cool season crops for grazing by beef cattle. A Canadian review. Can. J. Anim. Sci. 2008, 88, 517–533. [Google Scholar] [CrossRef]
  3. Carr, P.M.; Horsley, R.D.; Poland, W.W. Barley, Oat, and Cereal–Pea Mixtures as Dryland Forages in the Northern Great Plains. Agron. J. 2004, 96, 677–684. [Google Scholar] [CrossRef]
  4. Kristensen, M.; Bügel, S. A diet rich in oat bran improves blood lipids and hemostatic factors, and reduces apparent energy digestibility in young healthy volunteers. Eur. J. Clin. Nutr. 2011, 65, 1053–1058. [Google Scholar] [CrossRef] [PubMed]
  5. Lu, Y.; Wang, R.; Cai, Z. Climatic change and influence in arid and semi-arid area of China. J. Arid. Land Resour. Environ. 2009, 19, 1651–1662. [Google Scholar] [CrossRef]
  6. Peel, M. Alfalfa and Forage Kochia Improve Nutritive Value of Semiarid Rangelands. Forage Grazinglands 2013, 11, 1–10. [Google Scholar] [CrossRef]
  7. Zhang, J.; Nie, X.; Zhao, G. First Report of Leaf Spot Caused by Alternaria brassicae on Avena sativa in China. Plant Dis. 2021, 105, 3750. [Google Scholar] [CrossRef] [PubMed]
  8. Wang, P.; Ma, Y.; Gan, H.; Gu, X. Evaluation of production performance and feeding value of 14 forage oats in the northern foot of Qilian Mountains. Livest. Vet. J. 2022, 41, 95–98+100. [Google Scholar]
  9. Mu, P.; Zhao, G.; Chai, J. Analysis of oat production performance and adaptability in different ecological regions of Gansu Province based on GGE-Biplot. Chin. J. Ecol. Agric. 2015, 23, 705–712. [Google Scholar]
  10. Martinez, M.F.; Arelovich, H.M.; Wehrhahne, L.N. Grain yield, nutrient content and lipid profile of oat genotypes grown in a semiarid environment. Field Crops Res. 2010, 116, 92–100. [Google Scholar] [CrossRef]
  11. Wang, G.; Xu, H.; Zhao, H.; Wu, Y.; Gao, X.; Chai, Z.; Liang, Y.; Zhang, X.; Zheng, R.; Yang, Q.; et al. Screening Optimal Oat Varieties for Cultivation in Arid Areas in China: A Comprehensive Evaluation of Agronomic Traits. Agronomy 2023, 13, 2266. [Google Scholar] [CrossRef]
  12. Macray, J.E.; Montgomery, D.R. Trends in soil organic matter and topsoil thickness under regenerative practices at the University of Washington student farm. PeerJ 2023, 11, e16336. [Google Scholar] [CrossRef] [PubMed] [PubMed Central]
  13. Soon, Y.K.; Abboud, S. A comparison of some methods for soil organic carbon determination. Commun. Soil Sci. Plant Anal. 1991, 22, 943–954. [Google Scholar] [CrossRef]
  14. Jalali, M.; Jalali, M.; Beygi, M.; Salehi, Z.; Antoniadis, V. Available and total phosphorus background levels in soils: A calcareous and semi-arid region. Environ. Monit. Assess. 2023, 195, 600. [Google Scholar] [CrossRef] [PubMed]
  15. Arunrat, N.; Sereenonchai, S.; Hatano, R. Effects of fire on soil organic carbon, soil total nitrogen, and soil properties under rotational shifting cultivation in northern Thailand. J. Environ. Manag. 2022, 302, 113978. [Google Scholar] [CrossRef] [PubMed]
  16. Mondal, R.; Mistri, B. Determination of Soil Quality Index of agricultural land adjacent to industrial sites of Jamuria C.D.Block, Paschim Bardhaman District, West Bengal. Environ. Monit Assess 2023, 195, 1536. [Google Scholar] [CrossRef] [PubMed]
  17. Kelman, W.M.; Dove, H. Growth and phenology of winter wheat and oats in a dual-purpose management system. Crop Pasture Sci. 2009, 60, 921–932. [Google Scholar] [CrossRef]
  18. Van Wychen, L.R.; Maxwell, B.D.; Bussan, A.J. Wild oat (Avena fatua) habitat and water use in cereal grain cropping systems. Weed Sci. 2004, 52, 352–358. [Google Scholar] [CrossRef]
  19. Aydin, N.; Mut, Z.; Mut, H. Effect of Autumn and Spring Sowing Dates on Hay Yield and Quality of Oat (Avena sativa L.) Genotypes. J. Anim. Vet. Adv. 2012, 9, 1539–1545. [Google Scholar] [CrossRef]
  20. Grise, M.M.; Cecato, U.; de Moraes, A.; Canto, M.W.D.; Martins, E.N.; Pelissari, A.; Mira, R.T. Evaluation of chemical composition and in vitro digestibility of mixture of oat IAPAR 61 (Avena strigosa Schreb cv IAPAR 61) +field pea (Pisum arvense L.) under grazing in different sward heights. R. Bras. Zootec. 2001, 30, 659–665. [Google Scholar] [CrossRef]
  21. Bicsak, R.C.; Collaborators. Comparison of Kjeldahl Method for Determination of Crude Protein in Cereal Grains and Oilseeds with Generic Combustion Method: Collaborative Study. J. Aoac. Int. 1993, 76, 780–786. [Google Scholar] [CrossRef]
  22. Cherney, D.J.R.; Mertens, D.R.; Moore, J.E. Morphology, fiber composition and mean particle diameter relationships in ground barley and oat forages at different ages. Anim. Feed Sci. Technol. 1990, 31, 65–78. [Google Scholar] [CrossRef]
  23. Manthey, F.A.; Hareland, G.A.; Huseby, D.J. Soluble and Insoluble Dietary Fiber Content and Composition in Oat. Cereal Chem. 1999, 76, 417420. [Google Scholar] [CrossRef]
  24. Wang, R.-L.; Wu, J.-Y.; Liu, H.-J. Comparative study on production performance and nutritional quality of ten oat varieties in Inner Mongolia. Feed. Res. 2023, 46, 128. [Google Scholar] [CrossRef]
  25. Admassu-Yimer, B.; Klos, K.E.; Griffiths, I.; Cowan, A.; Howarth, C. Mapping of Crown Rust (Puccinia coronata f. sp. avenae) Resistance Gene Pc54 and a Novel Quantitative Trait Locus Effective Against Powdery Mildew (Blumeria graminis f. sp. avenae) in the Oat (Avena sativa) Line Pc54. Phytopathology 2022, 112, 1316–1322. [Google Scholar] [CrossRef] [PubMed]
  26. Zhang, Z.; Lin, Z.; Xin, Z. Research progress in BYDV resistance genes derived from wheat and its wild relatives. J. Genet. Genomics. 2009, 36, 567–573. [Google Scholar] [CrossRef] [PubMed]
  27. Jeong, M.H.; Choi, E.D.; Park, S.Y. First Report of Brown Leaf Spot Caused by Epicoccum tobaicum on Oat (Avena sativa) in Korea. Plant Dis. 2022, 107, 2255. [Google Scholar] [CrossRef] [PubMed]
  28. Weiss, W.P. Macromineral digestion by lactating dairy cows: Factors affecting digestibility of magnesium. J. Dairy Sci. 2004, 87, 2167–2171. [Google Scholar] [CrossRef]
  29. Forbes, A.R. Aphid Populations and Their Damage to Oats in British Columbia. Can. J. Plant Sci. 1962, 42, 660–666. [Google Scholar] [CrossRef]
  30. Lauriault, L.M.; Kirksey, R.E. Yield and Nutritive Value of Irrigated Winter Cereal Forage Grass–Legume Intercrops in the Southern High Plains, USA. Agron. J. 2004, 96, 352–358. [Google Scholar] [CrossRef]
  31. Morris, C.A.; Deochand, N.; Peterson, S.M. Using Microsoft Excel® to Build a Customized Partial-Interval Data Collection System. Behav. Anal. Pract. 2018, 11, 504–516. [Google Scholar] [CrossRef] [PubMed] [PubMed Central]
  32. Loffing, F. Raw Data Visualization for Common Factorial Designs Using SPSS: A Syntax Collection and Tutorial. Front. Psychol. 2022, 13, 808469. [Google Scholar] [CrossRef] [PubMed] [PubMed Central]
  33. Meng, W.Y.; Li, J.Q.; Xu, G.C.; Guo, J.W.; Zhao, W. Numerical Simulation and Experimental Research of Icicles under The Single Point of Blasting in the Yellow River. Appl. Mech. Mater. 2014, 501–504, 2020–2025. [Google Scholar] [CrossRef]
  34. Ghafoor, R.; Akram, N.A.; Rashid, M.; Ashraf, M.; Iqbal, M.; Lixin, Z. Exogenously applied proline induced changes in key anatomical features and physio-biochemical attributes in water stressed oat (Avena sativa L.) plants. Physiol. Mol. Biol. Plants 2019, 25, 1121–1135. [Google Scholar] [CrossRef] [PubMed] [PubMed Central]
  35. Rahetlah, V.B.; Randrianaivoarivony, J.M.; Razafimpamoa, L.H. Effects of Seeding Rates on Forage Yield and Quality of Oat (Avena sativa L.) Vetch (Vicia sativa L.) Mixtures Under Irrigated Conditions of Madagascar. Afr. J. Food Agric. Nutr. Dev. 2010, 10, 4254–4267. [Google Scholar] [CrossRef]
  36. Coblentz, W.K.; Bertram, M.G.; Martin, N.P. Planting Date Effects on Fall Forage Production of Oat Cultivars in Wisconsin. Agron. J. 2011, 103, 145–155. [Google Scholar] [CrossRef]
  37. Jing, F.; Ren, S.; Bian, F. Adaptability evaluation and screening of 16 oat varieties in Longzhong area of Gansu. Chin. J. Grassl. 2023, 45, 68–76. [Google Scholar]
  38. Peterson, D.M.; Wesenberg, D.M.; Burrup, D.E. Relationships among Agronomic Traits and Grain Composition in Oat Genotypes Grown in Different Environments. Crop Sci. 2005, 45, 1249–1255. [Google Scholar] [CrossRef]
  39. Gao, K.; Yu, Y.F.; Xia, Z.T.; Yang, G.; Xing, Z.L.; Qi, L.T.; Ling, L.Z. Response of height, dry matter accumulation and partitioning of oat (Avena sativa L.) to planting density and nitrogen in Horqin Sandy Land. Sci. Rep. 2019, 9, 7961. [Google Scholar] [CrossRef] [PubMed] [PubMed Central]
  40. Arduini, I.; Baldanzi, M.; Pampana, S. Reduced Growth and Nitrogen Uptake During Waterlogging at Tillering Permanently Affect Yield Components in Late Sown Oats. Front. Plant Sci. 2019, 10, 1087. [Google Scholar] [CrossRef] [PubMed] [PubMed Central]
  41. Kirk, L.E. Self-fertilization in relation to crop improvement. Sci. Agron. 1964, 8, 1–40. [Google Scholar]
  42. Zhang, J.; Yan, Z.; Yin, Q. Evaluation and screening of 22 oat forage varieties in Dalad Banner area. Chin. J. Grassl. 2020, 42, 134–140. [Google Scholar]
  43. Liu, L.; Liang, G.; Liu, W.; Ju, Z. Variation and interrelationships in the growth, yield, and lodging of oat under different planting densities. PeerJ 2024, 12, e17310. [Google Scholar] [CrossRef] [PubMed] [PubMed Central]
  44. Li, F.; Li, X.; Zhang, Z.; Li, W.; Na, Y.; Xu, L.; Tao, Y. Comprehensive evaluation of productivity of 16 spring-sowing oat varieties in Songnen Plain. Chin. J. Grassl. 2022, 6–44. [Google Scholar] [CrossRef]
  45. Zhang, H.; Liu, C.; Mao, L.; Li, Y.; Shen, Y. Divergent response of hay and grain yield of oat: Effects of environmental factors and sowing rate. J. Sci. Food Agric. 2023, 103, 233–242. [Google Scholar] [CrossRef] [PubMed]
  46. Waheed, A.; Ahmad, W.; Shehzad, M.A. Nitrogen and phosphorus: Impact on forage oat (Avena sativa L.) growth, yield and its quality attributes. Pak. J. Agric. Sci. 2012, 49, 473–479. [Google Scholar] [CrossRef]
  47. Lou, C.; Wang, B.; Li, D.; Zhu, X.; Qi, S.; Wang, C. Production performance and nutritional quality of 16 spring-sown oat varieties in the Yellow River beach area. Pratacultural Sci. 2019, 36, 1843–1851. [Google Scholar]
  48. Hou, L.; Bai, W.; Zhang, Q.; Liu, Y.; Sun, H.; Luo, Y.; Song, S.; Zhang, W.H. A new model of two-sown regime for oat forage production in an alpine region of northern China. Environ. Sci. Pollut. Res. Int. 2022, 29, 70520–70531. [Google Scholar] [CrossRef] [PubMed]
  49. Zhu, G.; Liu, J.; Wu, H.; Zhu, Y.; Nimir, N.E.A.; Zhou, G. The Optimum Mixed Cropping Ratio of Oat and Alfalfa Enhanced Plant Growth, Forage Yield, and Forage Quality in Saline Soil. Plants 2024, 13, 3103. [Google Scholar] [CrossRef] [PubMed] [PubMed Central]
  50. Tang, Y.M.; Qiu, S.N.; Li, Q.Y.; Di, G.L.; Wang, J.L.; Sun, H.X. Simulated global climate change benefits the nutritive value of oat grass. Plant Biol. 2022, 24, 846–853. [Google Scholar] [CrossRef] [PubMed]
  51. Duan, L.; Ju, Z.; Ma, X. Research on Enhancing the Yield and Quality of Oat Forage: Optimization of Nitrogen and Organic Fertilizer Management Strategies. Agronomy 2024, 14, 1406. [Google Scholar] [CrossRef]
  52. Wang, Y.; Song, L.; Zhang, F.; Wang, X.; Sun, Y.; Ma, C. Comparison of agronomic traits, production performance and quality of different oat varieties during growth period. Xinjiang Agric. Sci. 2020, 57, 10. [Google Scholar]
  53. Fu, D.; Wang, Y.; Mao, J. Quality analysis and evaluation of different oat varieties under dry farming conditions in mountainous areas. Xinjiang Agric. Sci. 2022, 59, 9. [Google Scholar] [CrossRef]
  54. Qu, Z.; Wu, H.; Liu, Z.; Qu, N.; Tong, S.; Da, W.; Ni, M. Comparative test of different oat varieties in Duojiao Township, Nanmulin County. Tibet. Agric. Sci. Technol. 2022, 44, 35–38. [Google Scholar]
  55. Hanse, B.; Schneider, J.H.M.; Termorshuizen, A.J.; Varrelmann, M. Pests and diseases contribute to sugar beet yield difference between top and averagely managed farms. Crop Prot. 2011, 30, 671–678. [Google Scholar] [CrossRef]
  56. Zhao, F.; Guo, M.; Guo, C.; Shang, X.; Zhao, Z.; Zhao, G. Evaluation of powdery mildew resistance in 213 oat germplasm. Pratacultural Sci. 2017, 34, 8. [Google Scholar] [CrossRef]
  57. Choudhury, S.; Hu, H.; Larkin, P.; Meinke, H.; Shabala, S.; Ahmed, I.; Zhou, M. Agronomical, biochemical and histological response of resistant and susceptible wheat and barley under BYDV stress. PeerJ. 2018, 6, e4833. [Google Scholar] [CrossRef] [PubMed] [PubMed Central]
  58. Praveen, B.; Kumar, M.K.P.; Devanna, P.; Palanna, K.B.; Buella, P.P.; Ramesh, G.V.; Reddy, N.K.; Nagaraja, A. First report of Alternaria alternata causing leaf spot on Oat (Avena sativa) in India. Plant Dis. 2021, 105, 3301. [Google Scholar] [CrossRef] [PubMed]
  59. Jalli, M.; Laitinen, P.; Latvala, S. The emergence of cereal fungal diseases and the incidence of leaf spot diseases in Finland. Agric. Food Sci. 2011, 20, 62–73. [Google Scholar] [CrossRef]
  60. Yang, W.; Zhao, S.; Wang, X.; Fan, X.; Lan, Z. Adaptability research and evaluation of nutritional value of 20 maize varieties in Anding district. Feed Res. 2024, 47, 143. [Google Scholar] [CrossRef]
  61. Vol, N. An Alternative Method for Inducing a Membership Function of a Category. Int. J. Approx. Reason. 1994, 11, 1–28. [Google Scholar] [CrossRef]
  62. Nan, M.; Zhao, G.; Li, J.; Cai, J. Association analysis and evaluation of yield and quality of introduced oat varieties in semi-arid region of Northwest China. Grassl. J. 2018, 26, 9. [Google Scholar] [CrossRef]
  63. Tong, C.; Yang, G.; Bolige, A.; Terigen; Li, H.; Li, B.; Li, Z.; Zheng, Q. Screening of Salt-Tolerant Thinopyrum ponticum Under Two Coastal Region Salinity Stress Levels. Front. Genet. 2022, 13, 832013. [Google Scholar] [CrossRef] [PubMed] [PubMed Central]
Figure 1. Monthly average temperature and precipitation changes in 2023 and 2024.
Agronomy 15 00707 g001
Figure 2. An agronomic trait analysis of the different oat varieties. (A): Plant height; (B): Stem thick; (C): Flag leaf area; (D): Inverted second leaf area; (E): Tiller number; (F): Effective tiller number; L2—Longyan No. 2; L3—Longyan No. 3; L4—Longyan No. 4; QH—Qinghai 444; ML—Molasses; BL—Baler Ⅱ; L6—Longyan No. 6; KN—Kona; MS—Mengshi; AW—Everleaf 126. The lowercase letters in the figure indicate the statistical significance of the differences between the various measurements for the cultivars, as determined by Tukey’s HSD test (p < 0.05). The same as below.
Agronomy 15 00707 g002
Figure 3. Analysis of hay yield of different oat varieties. The lowercase letters in the figure indicate the statistical significance of the differences between the various measurements for the cultivars, as determined by Tukey’s HSD test (p < 0.05).
Agronomy 15 00707 g003
Figure 4. Analysis of grain yield of different oat varieties. The lowercase letters in the figure indicate the statistical significance of the differences between the various measurements for the cultivars, as determined by Tukey’s HSD test (p < 0.05).
Agronomy 15 00707 g004
Figure 5. Analysis of nutritional quality of different oat varieties. (A): Leaf-stem ratio; (B): Crude protein; (C): Crude fat; (D): Soluble sugar; (E): Acid detergent fiber; (F): Neutral detergent fiber. The lowercase letters in the figure indicate the statistical significance of the differences between the various measurements for the cultivars, as determined by Tukey’s HSD test (p < 0.05).
Agronomy 15 00707 g005
Figure 6. Correlation analysis of each trait index for ten oat varieties. Note: PH−plant height; SD-stem diameter; FLA-flag leaf area; ISLA-inverted second leaf area; TN−tillering number; ETN−effective tillering number; LS−leaf–stem ratio; HY−hay yield; SY−seed yield; CP−crude protein; CF−crude fat; NDF−neutral detergent fiber; ADF−acid detergent fiber; S−soluble sugar.
Agronomy 15 00707 g006
Table 1. Determination of soil nutrient content at 0–30 cm before sowing in 2023 and 2024.
Soil Nutrient20232024
Organic matter27.15 g/kg28.56 g/kg
Organic carbon16.12 g/kg16.57 g/kg
Total phosphorus0.38 mg/kg0.39 mg/kg
Total nitrogen0.48 mg/kg0.5 mg/kg
pH8.128.23
Table 2. Sources of 10 oat varieties.
NumberVarietiesSourcePercentage of Germination (%)
1Longyan No. 2Gansu78
2Longyan No. 3Gansu83
3Longyan No. 4Gansu94
4Qinghai 444Qinghai89
5MolassesUSA81
6Baler IICanada66
7Longyan No. 6Gansu81
8KonaUSA78
9MengshiUSA80
10Everleaf 126USA81
Table 3. Phenological periods of different oat varieties (month/day).
Variety20232024
Sowing
Date
Seeding
Stage
Grain-Filling
Stage
Ripe
Stage
Growth
Duration (d)
Sowing
Date
Seeding
Stage
Grain-Filling
Stage
Ripe
Stage
Growth
Duration (d)
Longyan No. 23/274/86/217/13973/274/76/237/1599
Longyan No. 33/274/106/237/181003/274/86/257/21104
Longyan No. 43/274/106/227/14963/274/76/237/16100
Qinghai 4443/274/76/167/9943/274/66/187/1198
Molasses3/274/76/247/161013/274/86/247/22105
Baler II3/274/66/207/12973/274/76/237/18102
Longyan No. 63/274/86/227/161003/274/76/247/23107
Kona3/274/76/217/151003/274/76/217/18102
Mengshi3/274/86/237/181023/274/96/247/20103
Everleaf 1263/274/106/287/301113/274/106/298/1113
Table 4. Different oat varieties’ powdery mildew questionnaire.
20232024
VarietyGrade of DiseaseDiseased Leaf
Rate
Disease IndexDisease Resistance
Types
Grade of DiseaseDiseased Leaf
Rate
Disease IndexDisease Resistance
Types
013579 013579
Longyan No. 24827911505216.0MS4232168205814.8MR
Longyan No. 351378400499.0MR5035104105010.2MR
Longyan No. 45230144004810.2MR44281510305616.0MS
Qinghai 44453181118004715.7MS4630148205414.0MR
Molasses5527123304511.0MR513494204910.5MR
Baler II53211610004713.2MS24481315007618.0MS
Longyan No. 64433212005611.7MR4733127105312.3MR
Kona29431414007117.2MS46301410405816.6MS
Mengshi503596005010.2MR5034102605212.8MR
Everleaf 126553212100458.1MR533211400479.40MR
Note: MR, moderately resistant; MS, moderate susceptibility.
Table 5. Red leaf disease questionnaire for different oat varieties.
20232024
VarietyGrade of DiseaseAverage SeverityDisease Resistance TypesGrade of DiseaseAverage SeverityDisease Resistance Types
012345012345
Longyan No. 2303020101001.40R40301614001.04R
Longyan No. 33030132500.82HR4530137500.97HR
Longyan No. 436301711601.21R5018169701.05R
Qinghai 444303015151001.45R4030129901.17R
Molasses5530123000.63HR603046000.56HR
Baler II32302014401.28R30302810201.24R
Longyan No. 64930138000.80HR6025105000.60HR
Kona37302010301.12R45201317501.17R
Mengshi4030178501.08R5030812000.82HR
Everleaf 1265035105000.70HR5526118000.72HR
Note: HR, high resistance; R, resistant.
Table 6. Leaf spot disease questionnaire f different oat varieties.
20232024
VarietyGrade of DiseaseDiseased Leaf
Rate
Disease IndexDisease Resistance
Types
Grade of DiseaseDiseased Leaf
Rate
Disease IndexDisease Resistance
Types
01234 01234
Longyan No. 2384220006220.5MR323533006825.3MS
Longyan No. 3543610004614.0MR523810004815.0MR
Longyan No. 4413425005921.0MR463618005418.0MR
Qinghai 4444423151085628.75MS4716211605326.5MS
Molasses513712004915.3MR473415405319.0MR
Baler II4018202206031.0MS344221306620.0MR
Longyan No. 648408405217.0MR423716505821.0MR
Kona5991111104126.0MS403317736025.0MS
Mengshi404515306321.0MR403624006521.0MR
Everleaf 12655369004513.5MR563910005414.0MR
Note: MR, moderately resistant; MS, Moderate susceptible.
Table 7. Comparison and identification of aphid resistance among 10 oat varieties.
20232024
VarietyI/I *Resistance LevelI/I *Resistance Level
Longyan No. 21.16S1.14S
Longyan No. 31.06R1.03R
Longyan No. 41.18S1.15S
Qinghai 4441.15S1.17S
Molasses1.18S1.08R
Baler II1.11S1.21HS
Longyan No. 61.15S1.09R
Kona1.21HS1.20S
Mengshi1.08R1.09R
Everleaf 1261.02R1.05R
Note: R, resistant; S, susceptible; HS, high sensitivity. I * represents the mean value of the aphid damage index of all the tested varieties in three replicates; I represents the highest value of the aphid damage index in the next three replicates.
Table 8. Comprehensive index, weight, membership function value, D value, and comprehensive evaluation of 10 oat varieties in 2023.
VarietyPrincipal Component 1Principal Component 2Principal
Component 3
Principal Component 4U(X1)U(X2)U(X3)U(X4)D ValuesRank
Longyan No. 2−0.80 −0.97 0.66 −0.10 0.18 0.07 0.65 0.48 0.24 9
Longyan No. 31.08 −1.12 −0.49 −0.69 0.80 0.02 0.27 0.31 0.53 3
Longyan No. 4−0.49 −1.17 0.29 0.05 0.28 0.00 0.52 0.52 0.28 8
Qinghai 444−0.98 −0.40 0.40 1.65 0.12 0.26 0.56 1.00 0.29 7
Molasses1.70 0.12 −1.31 0.64 1.00 0.43 0.00 0.70 0.73 2
Baler II−0.60 0.81 −0.88 1.08 0.25 0.66 0.14 0.83 0.38 6
Longyan No. 60.54 −0.40 1.12 −1.10 0.62 0.26 0.80 0.18 0.54 4
Kona−1.36 1.06 −1.08 −1.72 0.00 0.75 0.08 0.00 0.17 10
Mengshi0.17 0.25 −0.44 0.04 0.50 0.47 0.28 0.52 0.47 5
Everleaf 1260.75 1.81 1.73 0.14 0.69 1.00 1.00 0.55 0.78 1
Weight 0.570.210.120.1
Table 9. Comprehensive index, weight, membership function value, D value, and comprehensive evaluation of 10 oat varieties in 2024.
VarietyPrincipal Component 1Principal Component 2Principal Component 3U(X1)U(X2)U(X3)D ValuesRank
Longyan No. 2−0.69 −1.24 −0.51 0.19 0.00 0.24 0.17 9
Longyan No. 30.78 −0.75 −0.35 0.63 0.18 0.29 0.54 3
Longyan No. 4−0.09 −0.84 −0.96 0.37 0.15 0.10 0.32 6
Qinghai 444−0.78 −1.22 1.93 0.16 0.01 1.00 0.21 8
Molasses0.28 1.23 0.87 0.48 0.92 0.67 0.56 2
Baler II−0.97 1.46 −0.68 0.11 1.00 0.19 0.24 7
Longyan No. 60.69 −0.26 −1.28 0.60 0.36 0.00 0.52 4
Kona−1.32 0.55 0.39 0.00 0.66 0.52 0.13 10
Mengshi0.09 0.76 −0.33 0.42 0.74 0.29 0.46 5
Everleaf 1262.01 0.31 0.93 1.00 0.57 0.69 0.72 1
Weight 0.780.140.08
Disclaimer/Publisher’s Note: The statements, opinions and data contained in all publications are solely those of the individual author(s) and contributor(s) and not of MDPI and/or the editor(s). MDPI and/or the editor(s) disclaim responsibility for any injury to people or property resulting from any ideas, methods, instructions or products referred to in the content.

