Article

Association Analysis and Identification of Candidate Genes for Sorghum Coleoptile Color

1
College of Agriculture, Anhui Science and Technology University, Bengbu 233100, China
2
Anhui Province International Joint Research Center of Forage Bio-Breeding, Chuzhou 233100, China
3
Department of Biology, University of Louisiana at Lafayette, Lafayette, LA 70504, USA
*
Authors to whom correspondence should be addressed.
Agronomy 2025, 15(3), 688; https://doi.org/10.3390/agronomy15030688
Submission received: 8 February 2025 / Revised: 5 March 2025 / Accepted: 9 March 2025 / Published: 13 March 2025
(This article belongs to the Section Crop Breeding and Genetics)

Abstract

:
Coleoptile is a sheath-like structure unique to monocots and is easily observed in sorghum. Colored coleoptiles have been shown to protect plants against abiotic and biotic stresses. The purpose of this study was to identify factors controlling coleoptile color in sorghum. We phenotyped the sorghum mini core accessions for coleoptile color in two environments, determined the anthocyanin content of each color of selected accessions, carried out a genome-wide association analysis and identified a candidate gene. The phenotypic analysis showed that 95 (40% of 235) accessions were green, 28 (12%) were purple and 42 (18%) were red in both 2022 and 2023. About 12% of the accessions changed from green to red due to environmental conditions. The anthocyanin content analysis showed a positive correlation between intensity of coleoptile color and anthocyanin levels. A genome-wide association analysis identified two candidate genes, Sobic.006G175700 and Sobic.006G175500, mapped to this trait in a single locus on chromosome 6. An orthologous comparison, together with mapping, sequence analysis and qPCR, identified Sobic.006G175700 as Rs1, the gene determining the sorghum coleoptile color. The haplotype analysis with SNPs from both coding and upstream regions of Sobic.006G175700 indicates that the predominant haplotypes can differentiate between green and colored coleoptile colors. This information can be used for marker-assisted selection of desired coleoptile colors in sorghum.

1. Introduction

Sorghum (Sorghum bicolor (Linn.) Moench) is a versatile crop. Its grain serves as a staple food for millions of people in the semi-arid tropics of Africa, Asia and Central America [1]. However, most of the world’s sorghum grain, and nearly all of that in Western countries, is used as animal feed [2]. Therefore, sorghum has become the main grain crop in semi—arid areas [3,4]. In China, in addition to being food and feed, sorghum grains are also used to distill spirits (baijiu) such as Moutai, Langjiu, Luzhoulaojiao, Wuliangye and Fenjiu [5]. One attractive feature of sorghum is its stress tolerance [6]. Compared to maize (the most common crop to which sorghum is compared), sorghum uses water and nitrogen more efficiently under stress or nonstress conditions [7] and produces more biomass under drought conditions [7,8] due to the deeper root penetration by sorghum during drought stress [8]. Interestingly, a new study found that modern US maize hybrids outperform modern US sorghum hybrids across all water availability treatments and that sorghum outperforms only maize hybrids released before 1970 in water limited conditions [9].
Coleoptiles are cylindrical organs that ensheathe the first leaf and shoot apex in grass seedlings and are unique to monocots [10]. They physically protect the first leaf and shoot apex during seed germination and emergence as the leaf and shoot apex pass through the soil [11]. The coleoptile color can also protect seedlings from abiotic and biotic stresses. The early flavonoid biosynthesis genes in wheat were expressed in red coleoptiles but were not activated in white coleoptiles [12]. In wheat, seedlings with dark purple (red) coleoptiles exhibit higher drought tolerance than plants with light purple coleoptiles [13] and plants with colored coleoptile are more resistant to Fusarium crown rot, a chronic and severe fungal disease in many wheat-growing regions of the world, than those with non-colored coleoptile [14]. It is well established that the color of a plant is determined by pigments in the cells of the leaf pulp. Anthocyanins are the primary pigments responsible for plant coloration, and they can produce various colors, including pink, purple and red [15,16,17]. The color intensity of coleoptiles in different sorghum varieties is also influenced by anthocyanin levels, which can vary between varieties. Anthocyanins are usually accumulated in the vacuoles of plant cells and are converted from chlorophyll [18]. The presence of various anthocyanins produces different coleoptile colors [19,20,21]. For example, red tissues contain significantly more anthocyanins than pink tissues, which in turn contain significantly more anthocyanins than green tissues [20]. In general, colored coleoptiles contain much higher levels of anthocyanins than colorless ones [22]. Coleoptile color has also been used to detect hybrid seed purity in rice. In this case, both female (2081A) and male parents (Luhui 17, 06A2066, R30, R287 and R725) have a green coleoptile color, but their hybrids show a purple line in the coleoptile. Therefore, any F1 hybrids not showing purple lines in the coleoptile are off-types [23].
Sorghum coleoptile color is controlled by two genes: Rs1 and Rs2 [24]. Mace and Jordan (2010) located Rs1 in chromosome 6 and Rs2 in chromosome 10 [25]. Morris et al. (2013) further mapped Rs1 to Sb06g025060 [26]. In maize, anthocyanins accumulation is controlled by two sets of duplicated genes: colorless1 (c1, ZmC1)/purple leaf1 (pl1) are members of the R2R3-MYB family of transcription factors, and booster1 (b1)/red1 (r1, ZmR) are members of the basic helix-loop-helix (bHLH) family. The c1 controls pigmentation in the kernel (aleurone and scutellum) while pl1 controls pigmentation in leaf sheath, culm, tassel, and husks [27]. One of the r1 locus genes, P, controls maize coleoptile color [28,29]. The donor genome material in ‘i: S29Ra’ was found to be represented by a fragment on chromosome 7D, flanked by the microsatellite loci Xgwm0044 and Xgwm1481. This fragment carries a cluster of genes, including Rc-D1 (red coleoptile), Pc-D1 (purple culm), Pls-D1 (purple leaf sheaths), Plb-D1 (purple leaf blades), and Ra-D1 (red auricles), which collectively confer intense anthocyanin pigmentation in the coleoptile, culm, leaf sheaths, leaf blades, and auricles, respectively [30]. Overexpression of ZmC1 by the maize ubiquitin promoter in wheat led to pigmentation in coleoptiles, auricles and stems, and ZmR the coloration in spikelets and seeds, but simultaneous overexpression of both genes produced the strongest pigmentation in almost all tissues [31]. This suggests that the two genes synergistically promote anthocyanin accumulation [32]. In wheat, Rc-A1, Rc-B1 and Rc-D1 (corresponding to TaMYB-A1, TaMYB-B1 and TaMYB-D1 [33] and TaC1-A1, TaC1-B1 and TaC1-D1 [34], respectively determine the anthocyanin pigmentation of coleoptiles [34,35]. These genes have been shown to be the orthologs of rice OsC1 [34]. OsC1 (LOC_Os06g10350) regulates rice leaf sheath color [36,37,38] and controls the presence/absence of two purple lines in the rice coleoptile [23]. It was these two purple lines that were used to determine rice hybrid purity, as mentioned above [23]. However, no sorghum coleoptile genes have been clearly identified.
The objective of this study was to map quantitative trait loci (QTLs) associated with sorghum coleoptile color and to identify the candidate genes that regulate coleoptile color in sorghum. In this study, we determined the coleoptile color of 235 and anthocyanin content of selected accessions in the sorghum mini core collection [39], performed a genome-wide association analysis to map the coleoptile color gene(s), identified two candidate genes, quantified their expression by quantitative real-time PCR (qPCR) in sorghum accessions with different coleoptile colors and identified haplotypes that can differentiate between green and colored coleoptile colors.

2. Materials and Methods

2.1. Plant Material

A total of 235 accessions from the sorghum mini core [39] were used in this study. Ten to fifteen seeds of each accession were sown in a field in a randomized complete block design with three replicates in 2022 and 2023, both in Fengyang, Anhui, China. We recorded the coleoptile colors of 235 sorghum accessions over two consecutive years (Table S1).

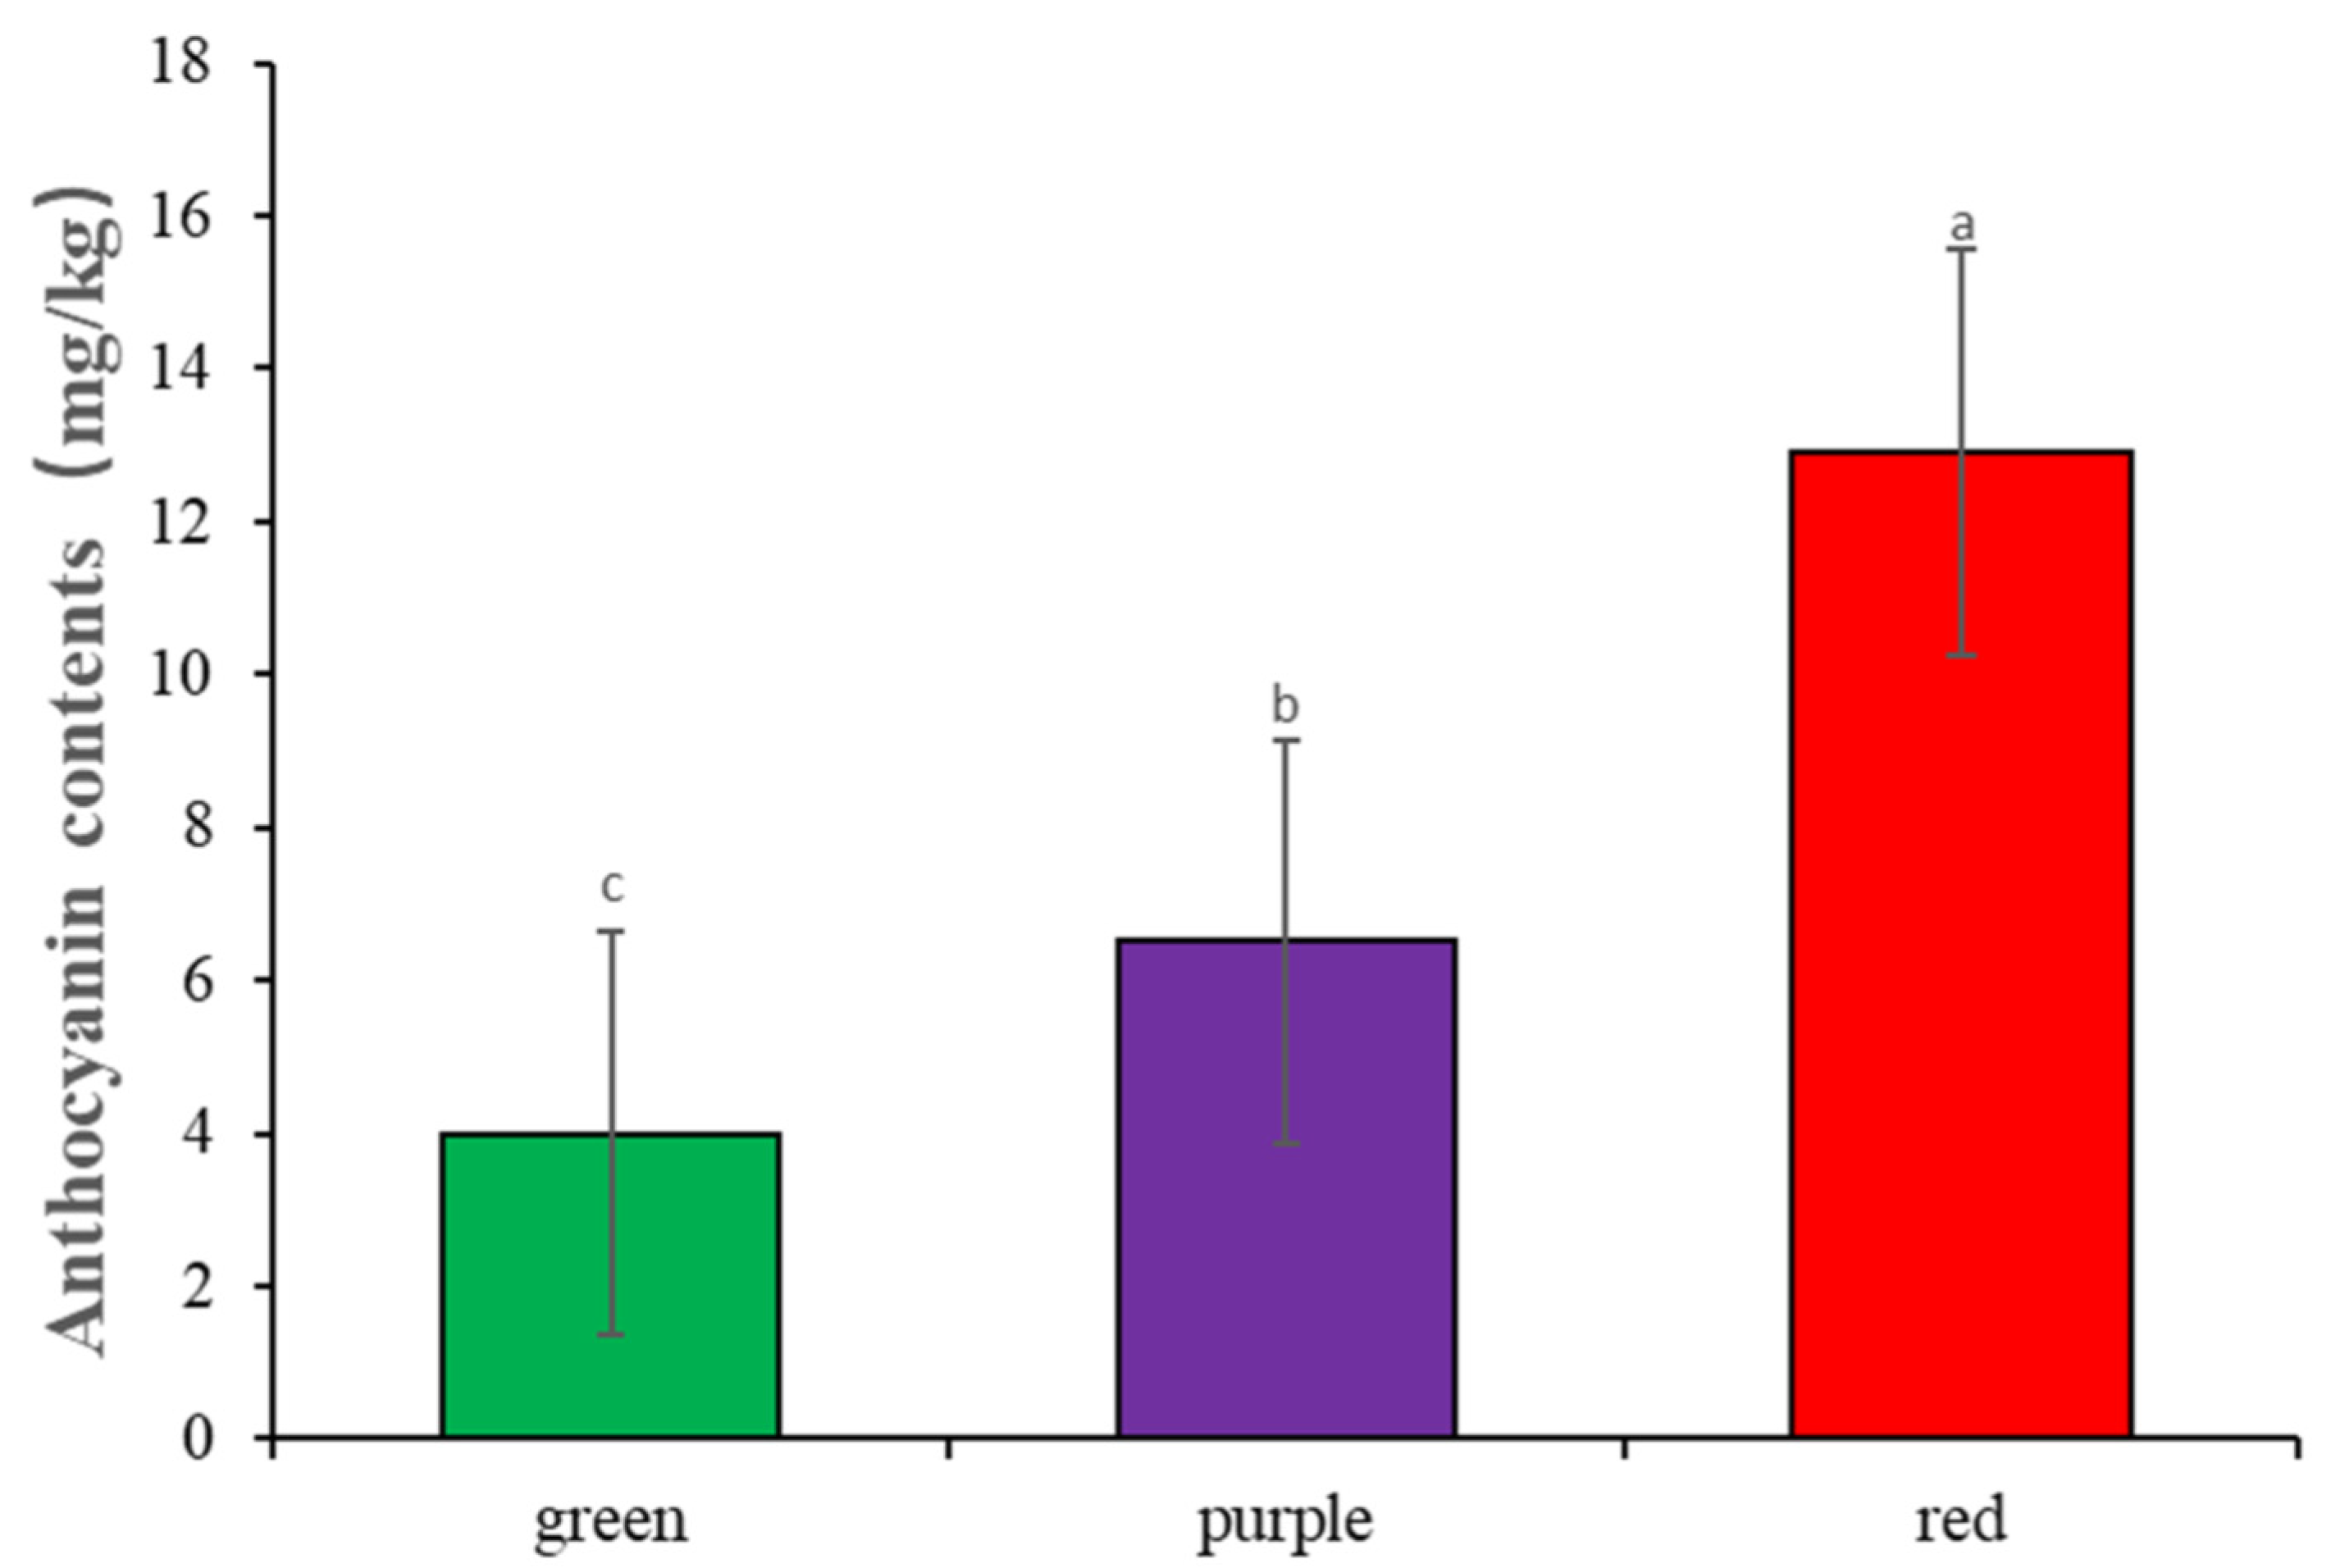
2.2. Phenotypic Identification and Anthocyanin Content Analysis

At two-leaf stage (10 days after sowing), seedlings were pulled from soil to record coleoptile color as green (“1”), purple (“2”) and red (“3”). Selected accessions were analyzed for anthocyanin content in the coleoptile using Yu (2000) method with minor modifications [40]. Specifically, the coleoptiles (fresh weight) were cut into 1–2 mm pieces, 0.1 g was weighed and placed in a 2 mL centrifuge tube, and 1 mL of 0.1 mol/L hydrochloric acid solution was added. The sample tubes were sealed with aluminum foil and placed in a thermostatic oscillator at 32 °C and 200 rpm for 4 h. After oscillation, the supernatant was measured by METASH V-5100 visible spectrophotometer at 530 nm with 0.1 mol/L hydrochloric acid solution as blank control, and the data were recorded. The relative anthocyanin content were compared by defining an absorbance of A = 0.1 as equivalent to one anthocyanin unit per 1 g of sample in 10 mL of 0.1 mol/L hydro-chloric acid solution.

2.3. Genome-Wide Association (GWAS) Analysis

GWAS was performed using 6,094,317 SNPs after filtering based on the criteria of minor allele frequency of >0.05 and missing data rate of 10% or less in the population [41]. The kinship matrix (K) and the Q matrix were generated using EMMAX [42] and STRUCTURE 2.3.4 [43], respectively, with the covariate variable as described in the previous report [44]. The SNPs were pruned with LD (LD-pruning) using PLINK (version 1.90) by the parameter (-indep-pairwise 50 10 0.2) to remove highly interlocking SNPs in the LD region. Linkage disequilibrium (LD) analysis was conducted using LDBlockShow [45]. The analysis included both the original SNPs and the dataset with redundant SNPs removed. The modified Bonferroni correction was used to determine the genome-wide significance thresholds, based on a nominal level of α = 0.05, corresponding to a raw p-value of 1 × 10⁻⁶ or a –log10(p)-value of 6.0. Candidate genes were identified using the reference sequence Sorghum bicolor versions 3.1.1 and 5.1, curated at Phytozome 13 (https://phytozome-next.jgi.doe.gov/ (accessed on 5 March 2023)) [46].

2.4. Quantitative Real-Time PCR (qPCR) Analysis

Nine varieties (IS 3158, IS 4951, IS 9108, IS 12965, IS 17941, IS 21863, IS 24453, IS 24939 and IS 31706, Table S1) with green, purple, and red coleoptiles with consistent color expression in the two environments were germinated. RNA was extracted from coleoptiles using the RNAprep Pure Plant Total RNA Extraction Kit (TIANGEN, Beijing, China) following the manufacturer’s instructions. The mRNA was reverse transcribed into cDNA using the ToloScript all-in-one RT EasyMix for qPCR Kit (TOLOBIO, Shanghai, China). The qPCR reaction was carried out in a 20 μL reaction with three replicates of each sample using Applied Biosystems real-time fluorescence quantitative PCR (Thermo Fisher Scientific, Waltham, MA, USA). The primers (Table S3) were designed by QuantPrime [47]. The reaction contained 5 μL cDNA, 2 μL each primer (0.1 nmol/μL), 10 μL 2 × Q3 SYBR Qpcr Master mix and 3 μL ddH2O. The samples were run on a qPCR instrument with the following cycles: one cycle of 95 °C for 30 s, 40 cycles of 95 °C for 10 s, 60 °C for 30 s, and one cycle each of 95 °C for 15 s, 60 °C for 1 min, and 95 °C for 15 s. Melting curves, melting temperatures and Ct values were output via QuantStudio™ Real-Time PCR software v1.6.1, where Ct values were used to calculate the expression of different samples.

2.5. Statistical Analysis

The exponential function was used to calculate the relative expression level in Microsoft Excel 2019 spreadsheet [48,49]. The data were analyzed by ANOVA using Graphpad Prism software 9.1.0.

3. Results

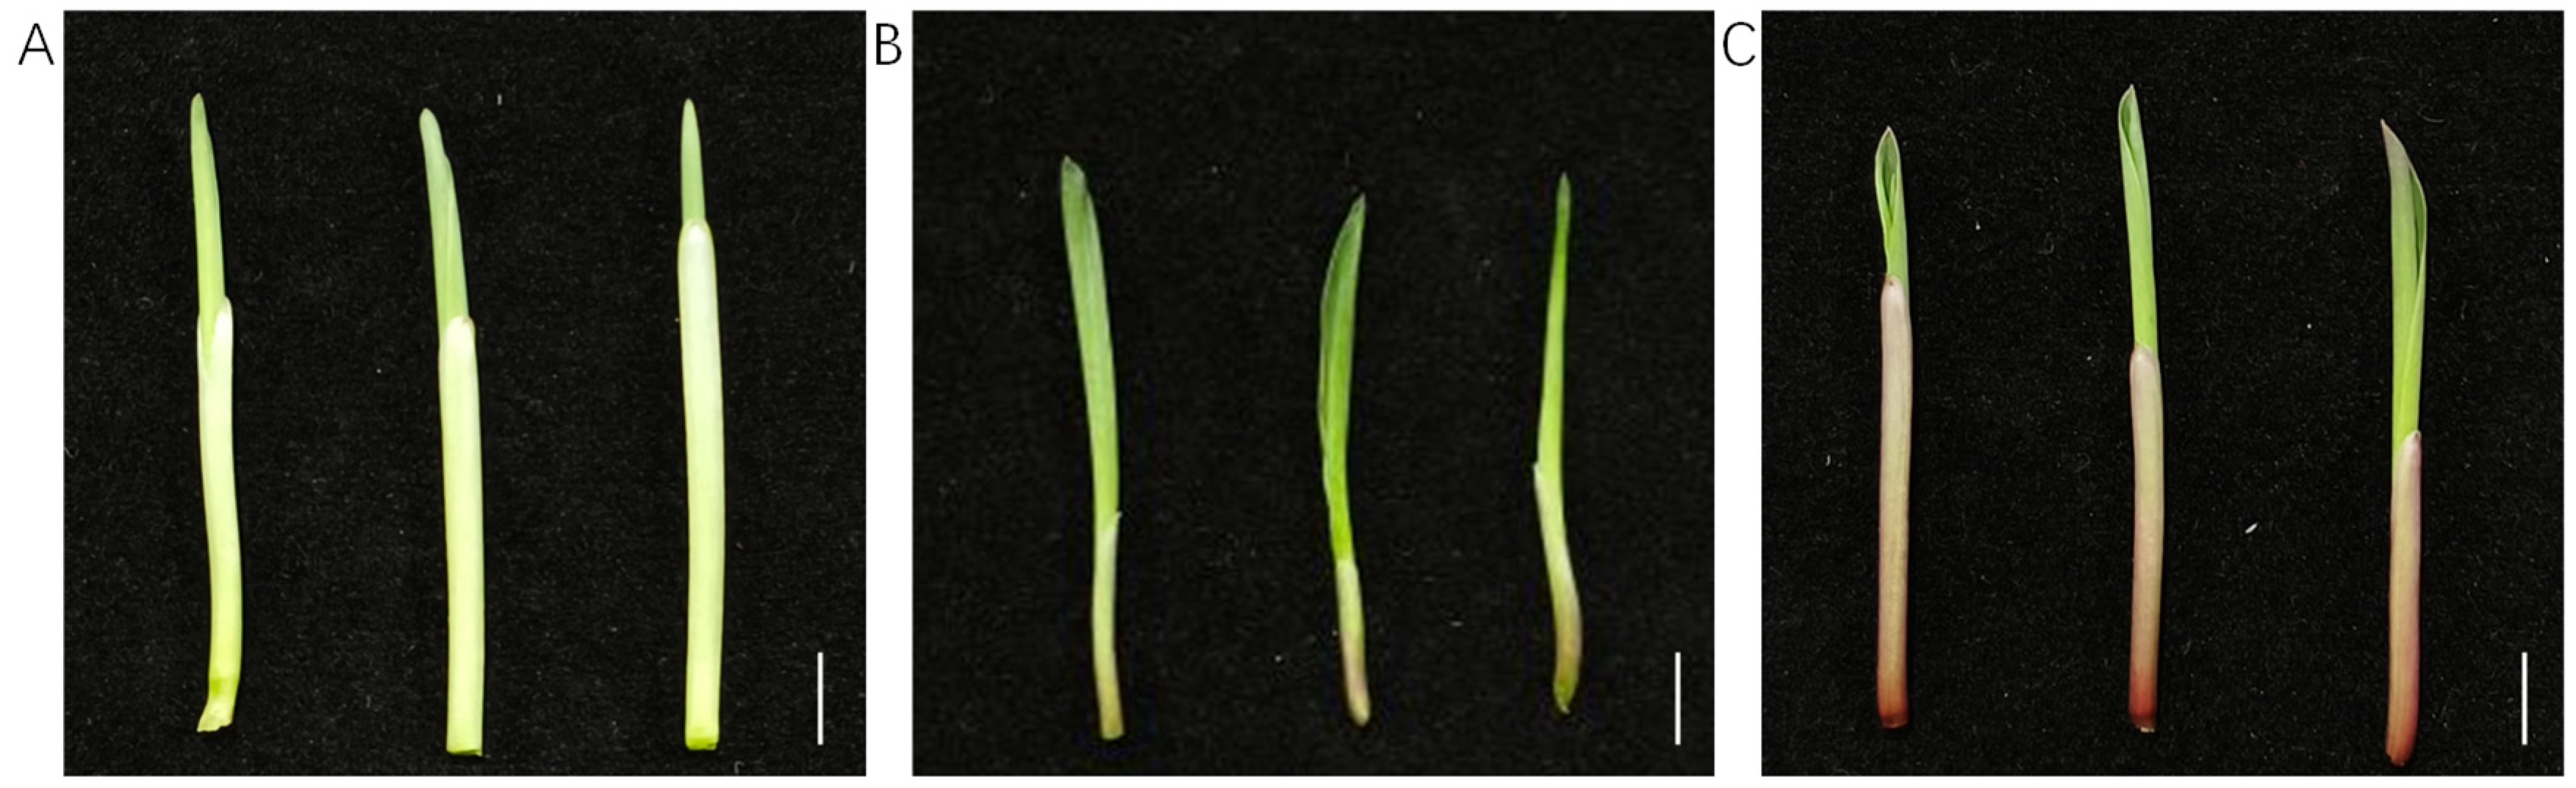
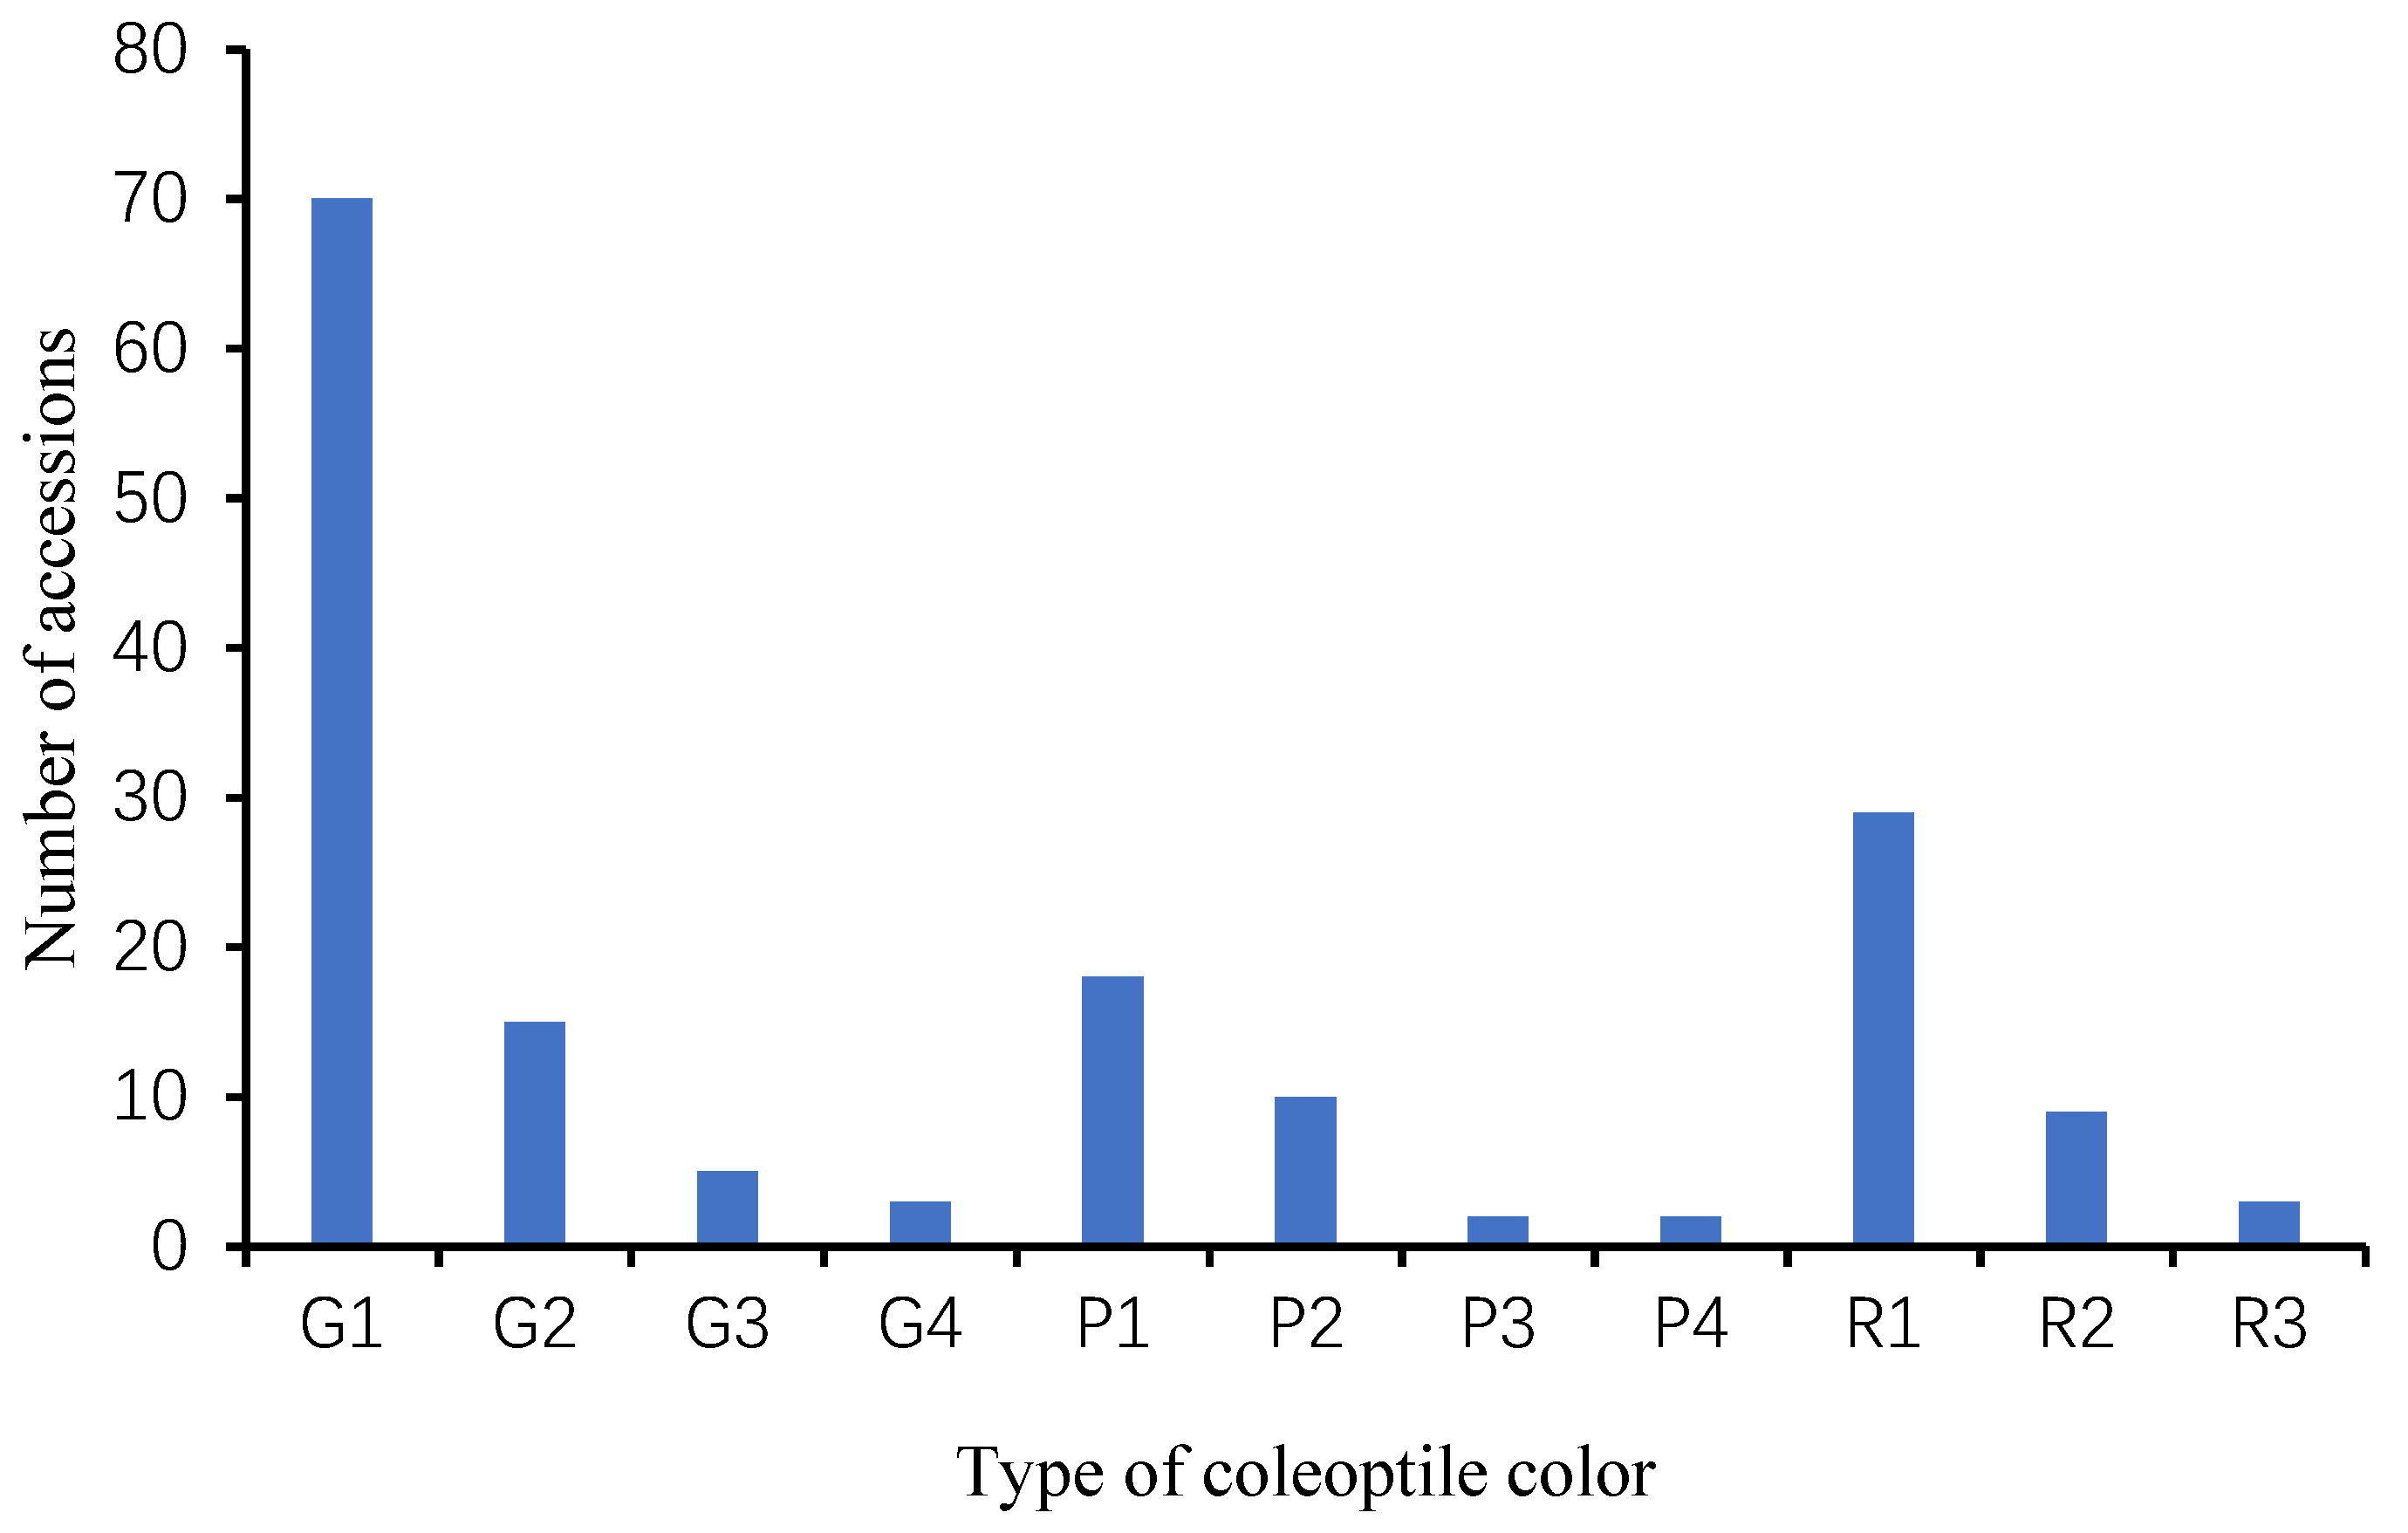
3.1. Phenotypic Analysis of Sorghum Coleoptile Color

The sorghum coleoptile color of the 235 accessions can be divided into green, purple and red (Figure 1, about 10 days). The coleoptile anthocyanin content of the coleoptile of the nine selected varieties of sorghum (Figure 1) was determined as follows: As expected, the red coleoptile contained significantly higher anthocyanin levels than purple and green, and purple was significantly higher than green. The red coleoptiles contained 12.9 mg/kg anthocyanin while purple and green contained 6.5 and 4.0 mg/kg anthocyanin, respectively (Figure 2).
Between the two environments in which the coleoptile color of these 235 sorghum accessions was evaluated, some showed different coleoptile colors. In 2022, 122 accessions were green (52% of the total), 61 were purple (26%) and 52 were red (22%). In 2023, 110 accessions were green (47%), 53 were purple (22%) and 72 were red (31%). A total of 95 accession (40% of 235) varieties were green, 28 (12%) were purple and 42 (18%) were red in both 2022 and 2023 (Table 1). In 2023, twenty coleoptile accessions that were green in 2022 changed to purple and seven to red, 11 coleoptile accessions that were purple in 2022 turned to green, and 22 to red, and five coleoptile accessions that were red in 2022 changed to purple, and four to green. In summary, 78% of the green, 46% of the purple and 81% of the red accessions from 2022 were retained in 2023. The complete phenotypic data are provided as Table S1.

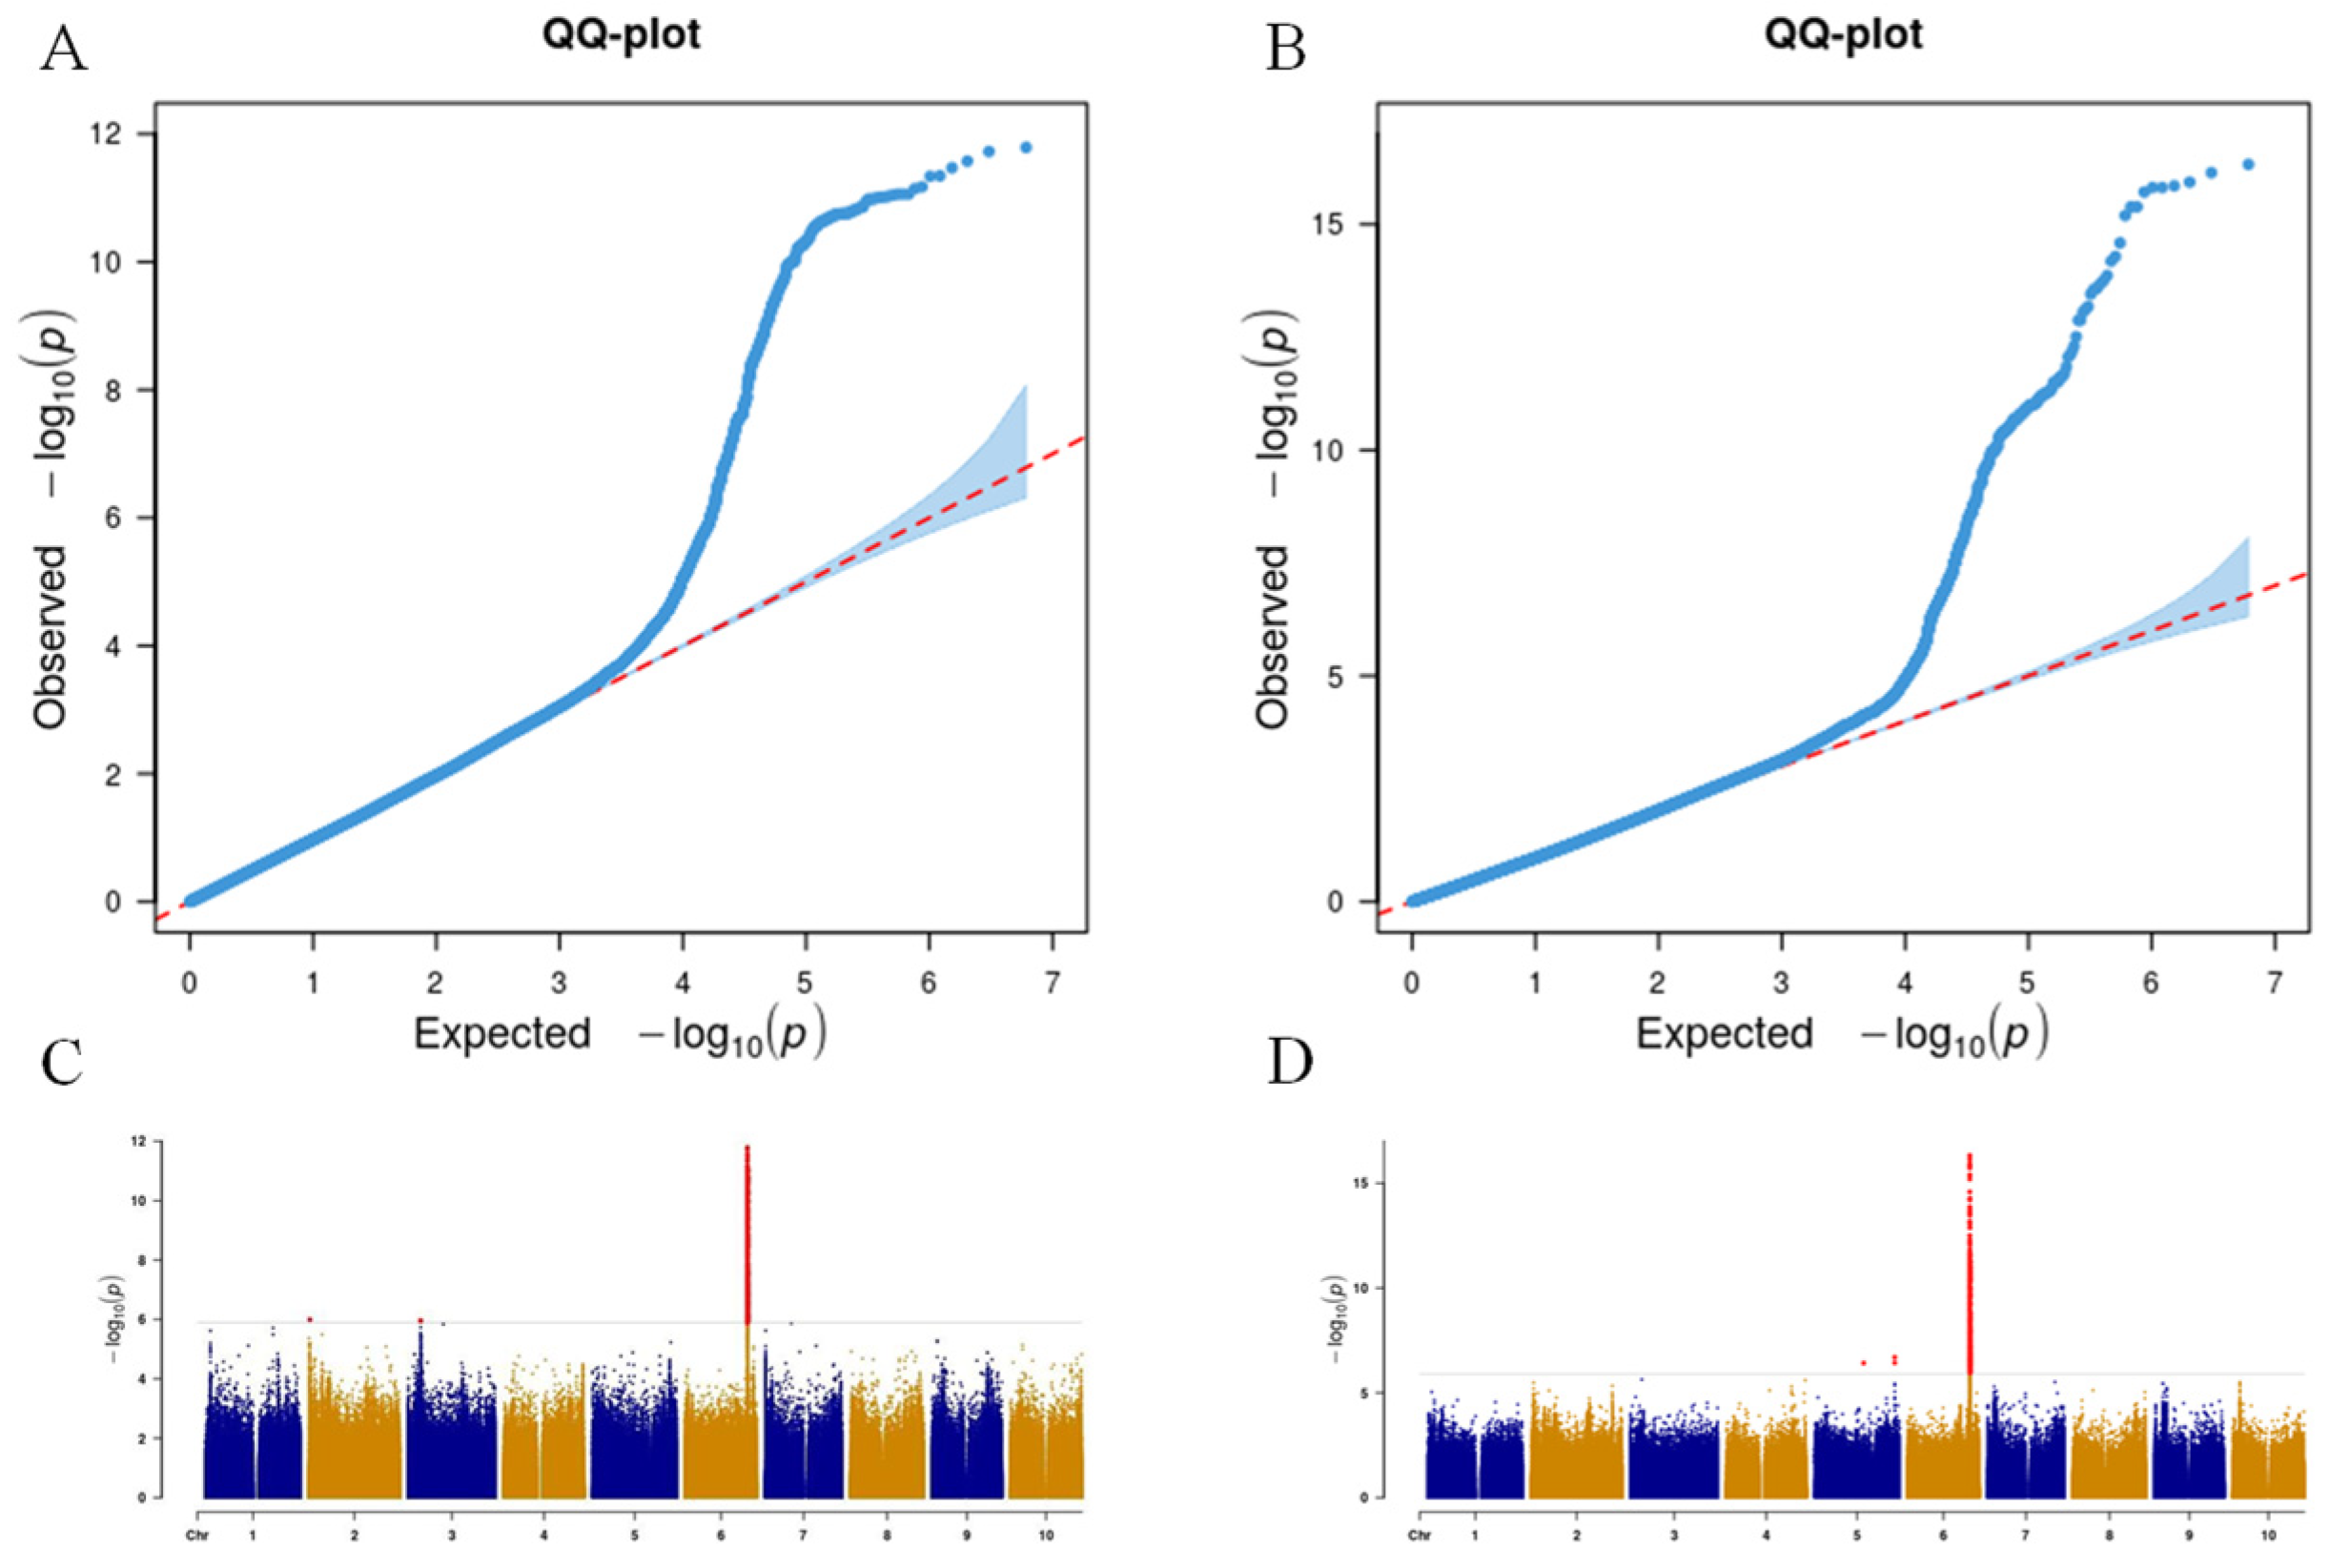
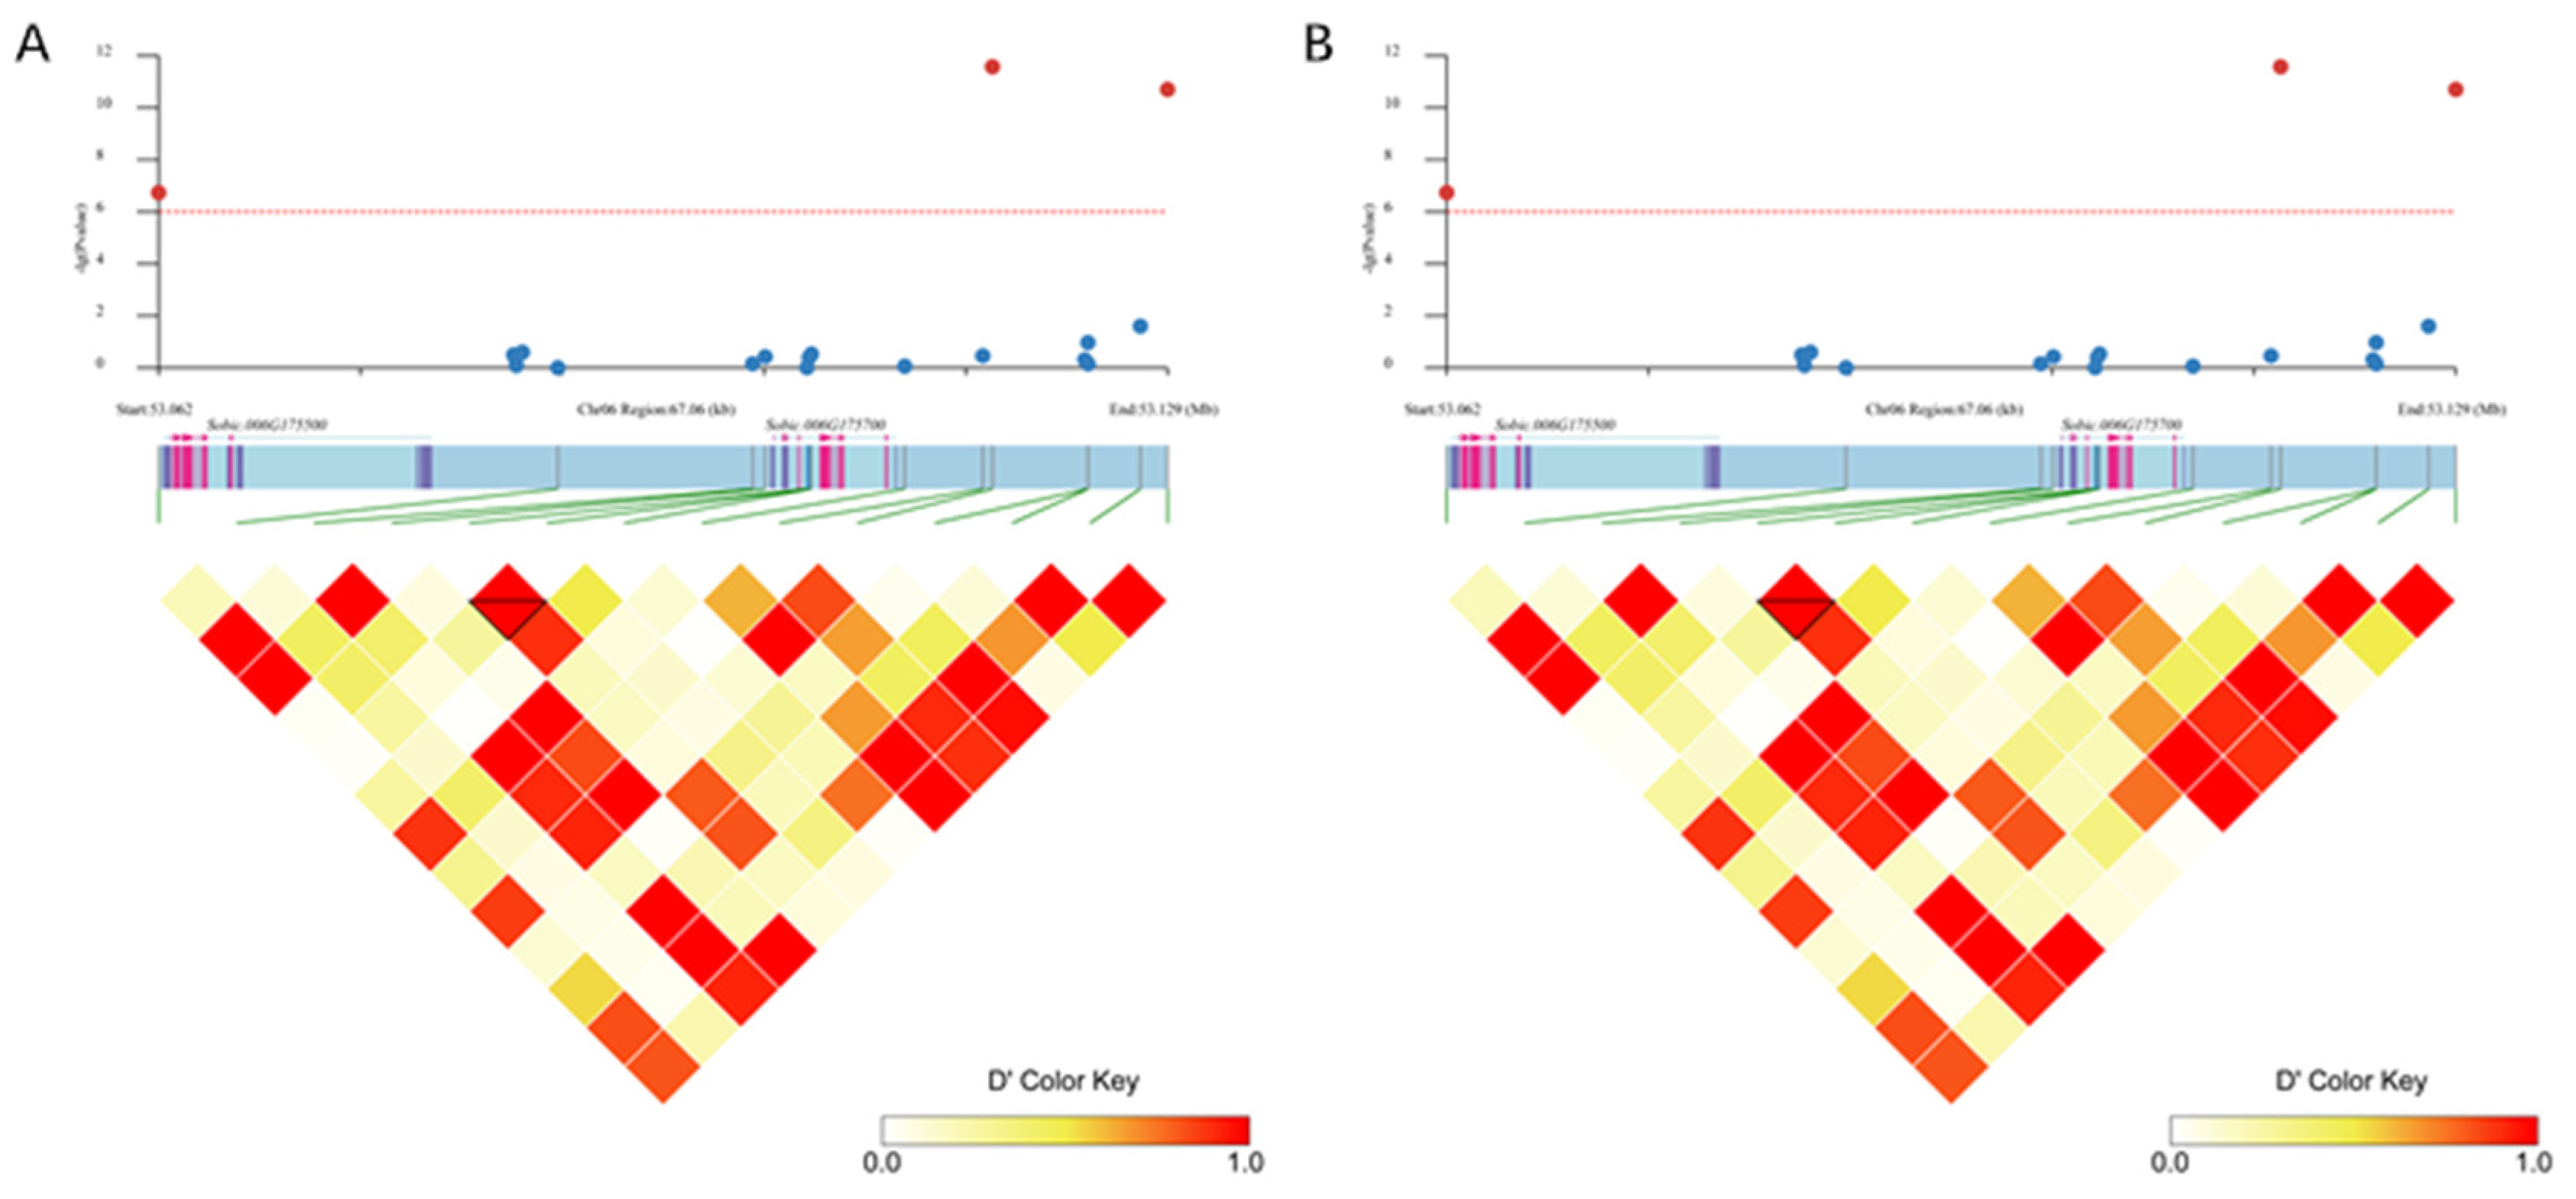
3.2. Genome-Wide Association Analysis of Sorghum Coleoptile Color

A total of three coleoptile color QTLs were identified in each of the two environments through GWAS (Table 2). In 2022, the three loci were detected on chromosomes 2, 3 and 6. But in 2023, two loci were detected on chromosome 5 and one on chromosome 6. The two QTLs on chromosome 6 exhibited an overlap in their respective locations and were both mapped with p values that were exceptionally low (Table 2). In 2022, the tightest SNP (53125544) was linked to coleoptile color, with a p value of 1.63 × 10⁻¹², and in 2023, the tightest SNP (53117435) was linked to coleoptile color, with a p value of 5.18 × 10⁻¹⁵ (Table 2 and Figure 3). Therefore, this QTL was stable in both years and tightly linked to coleoptile color.

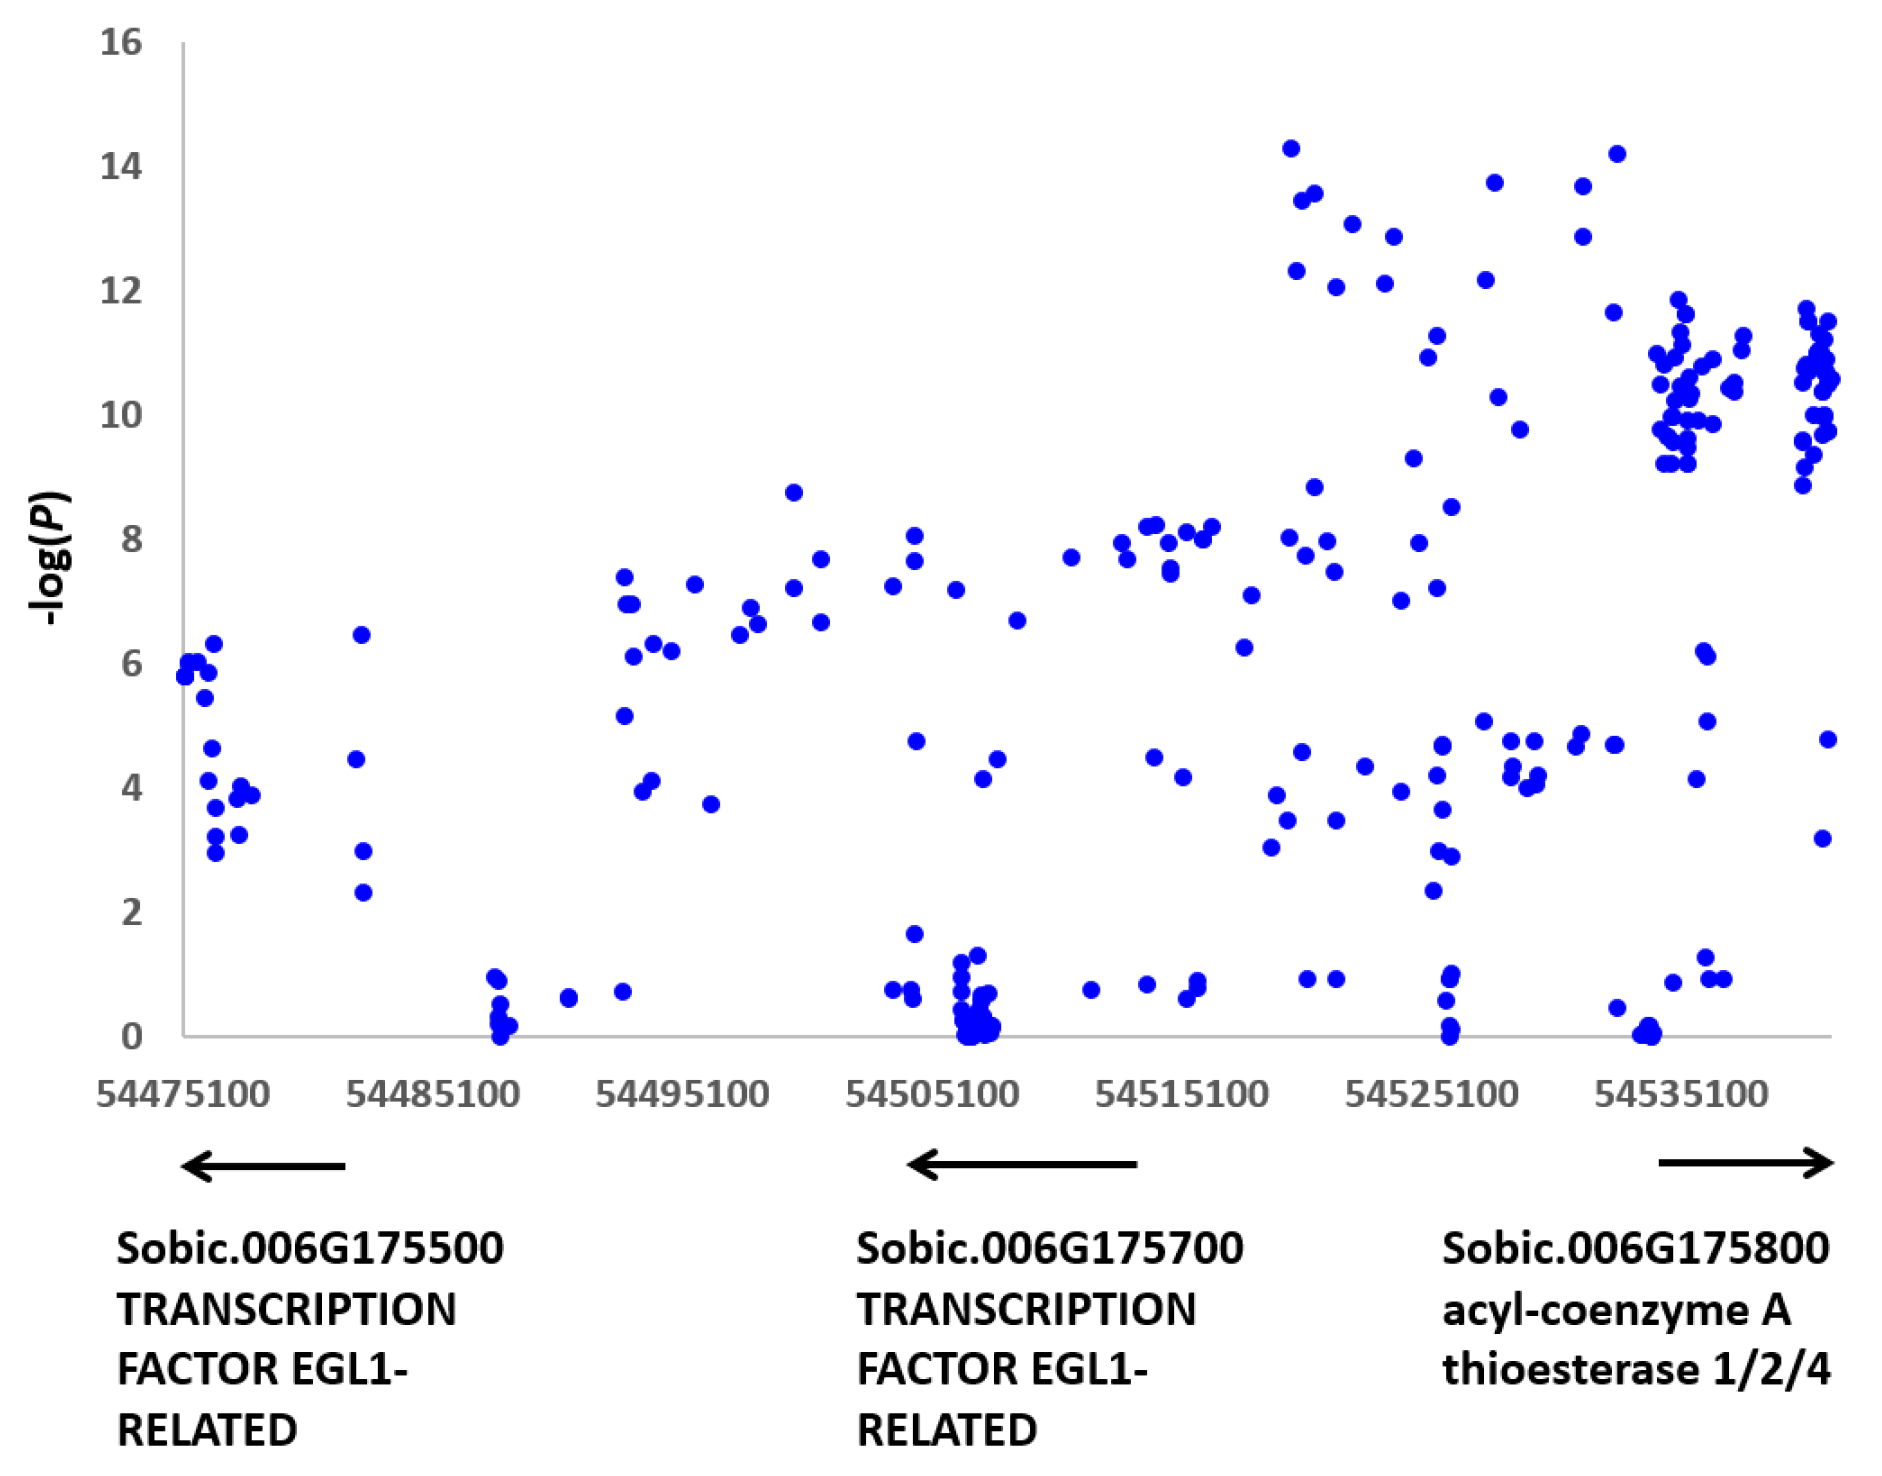
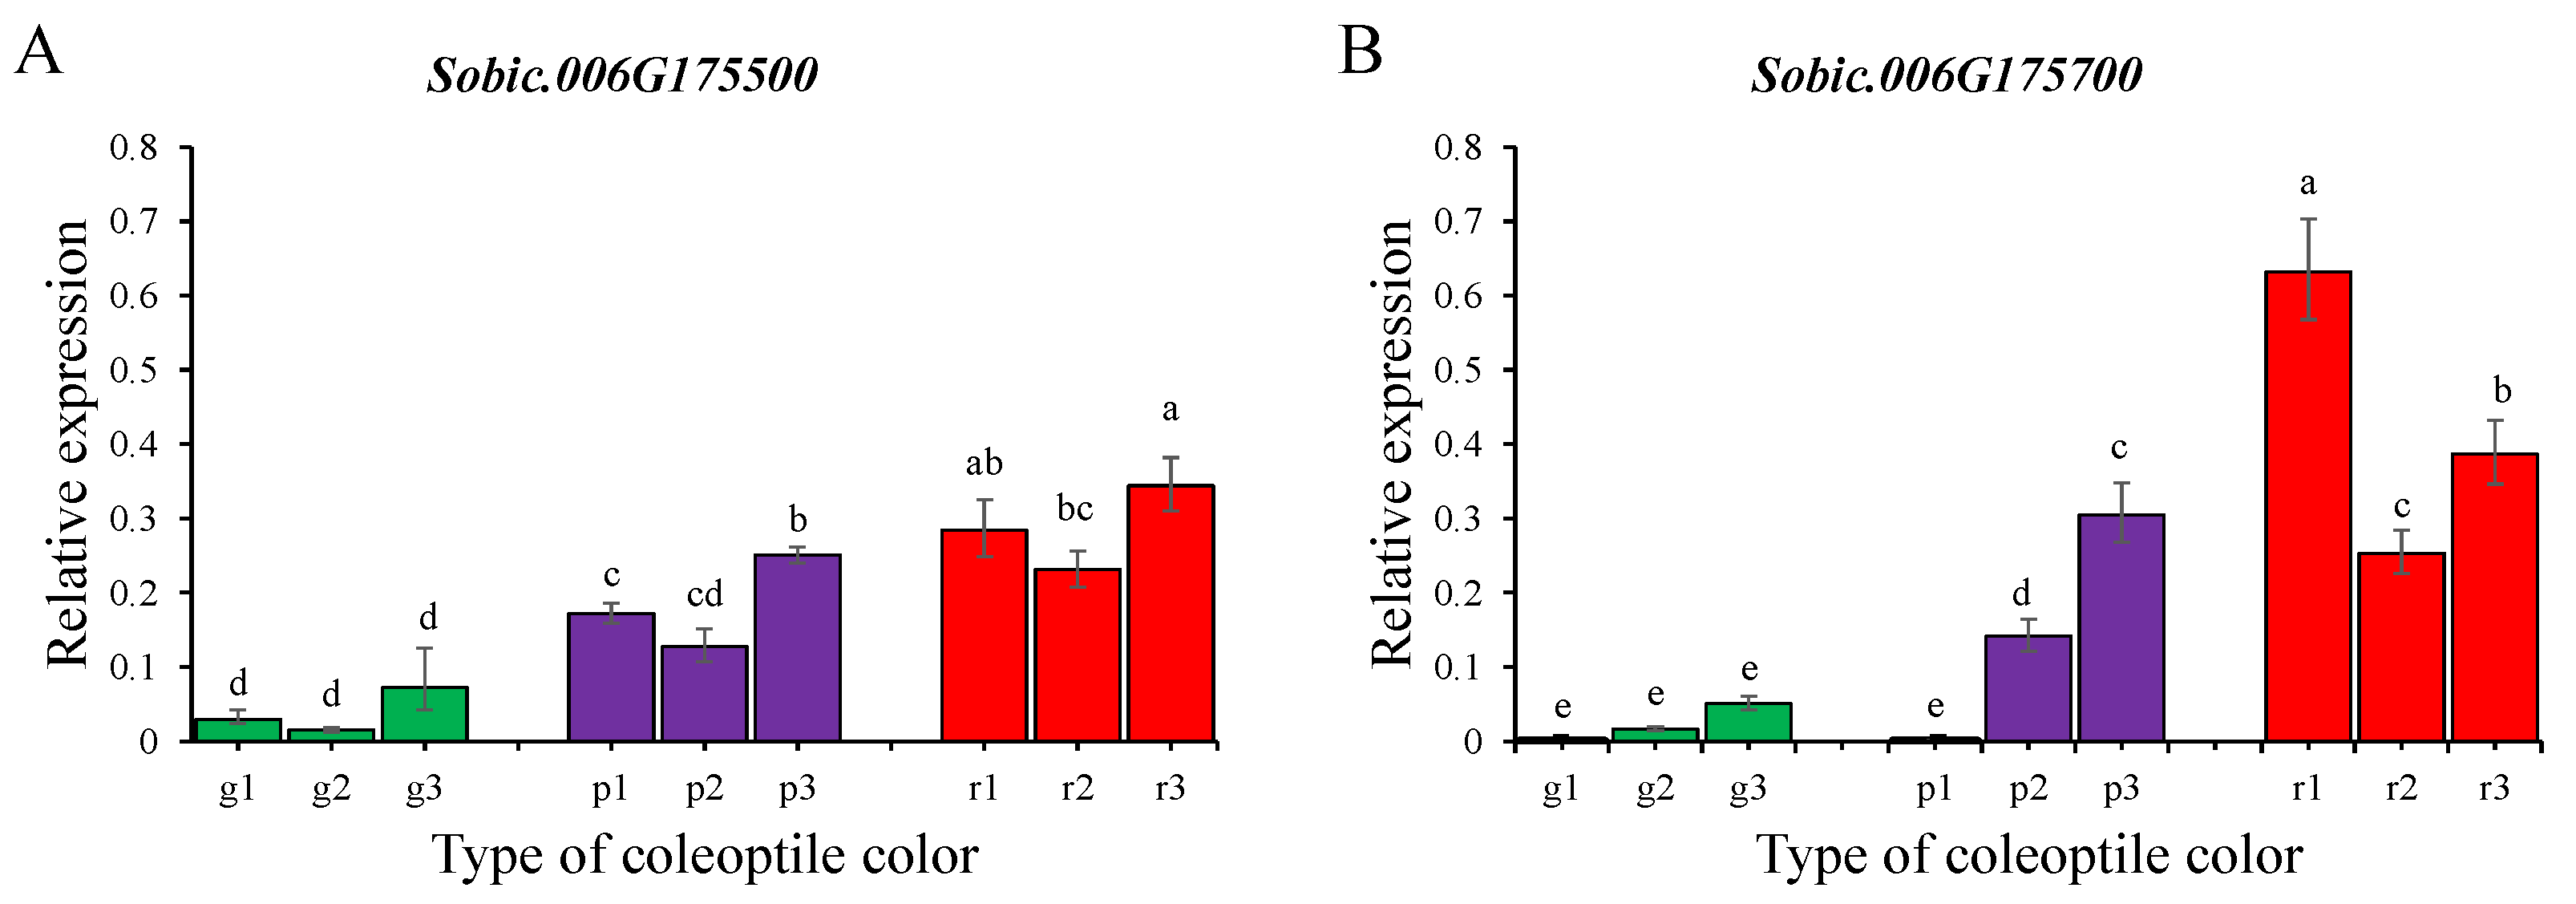
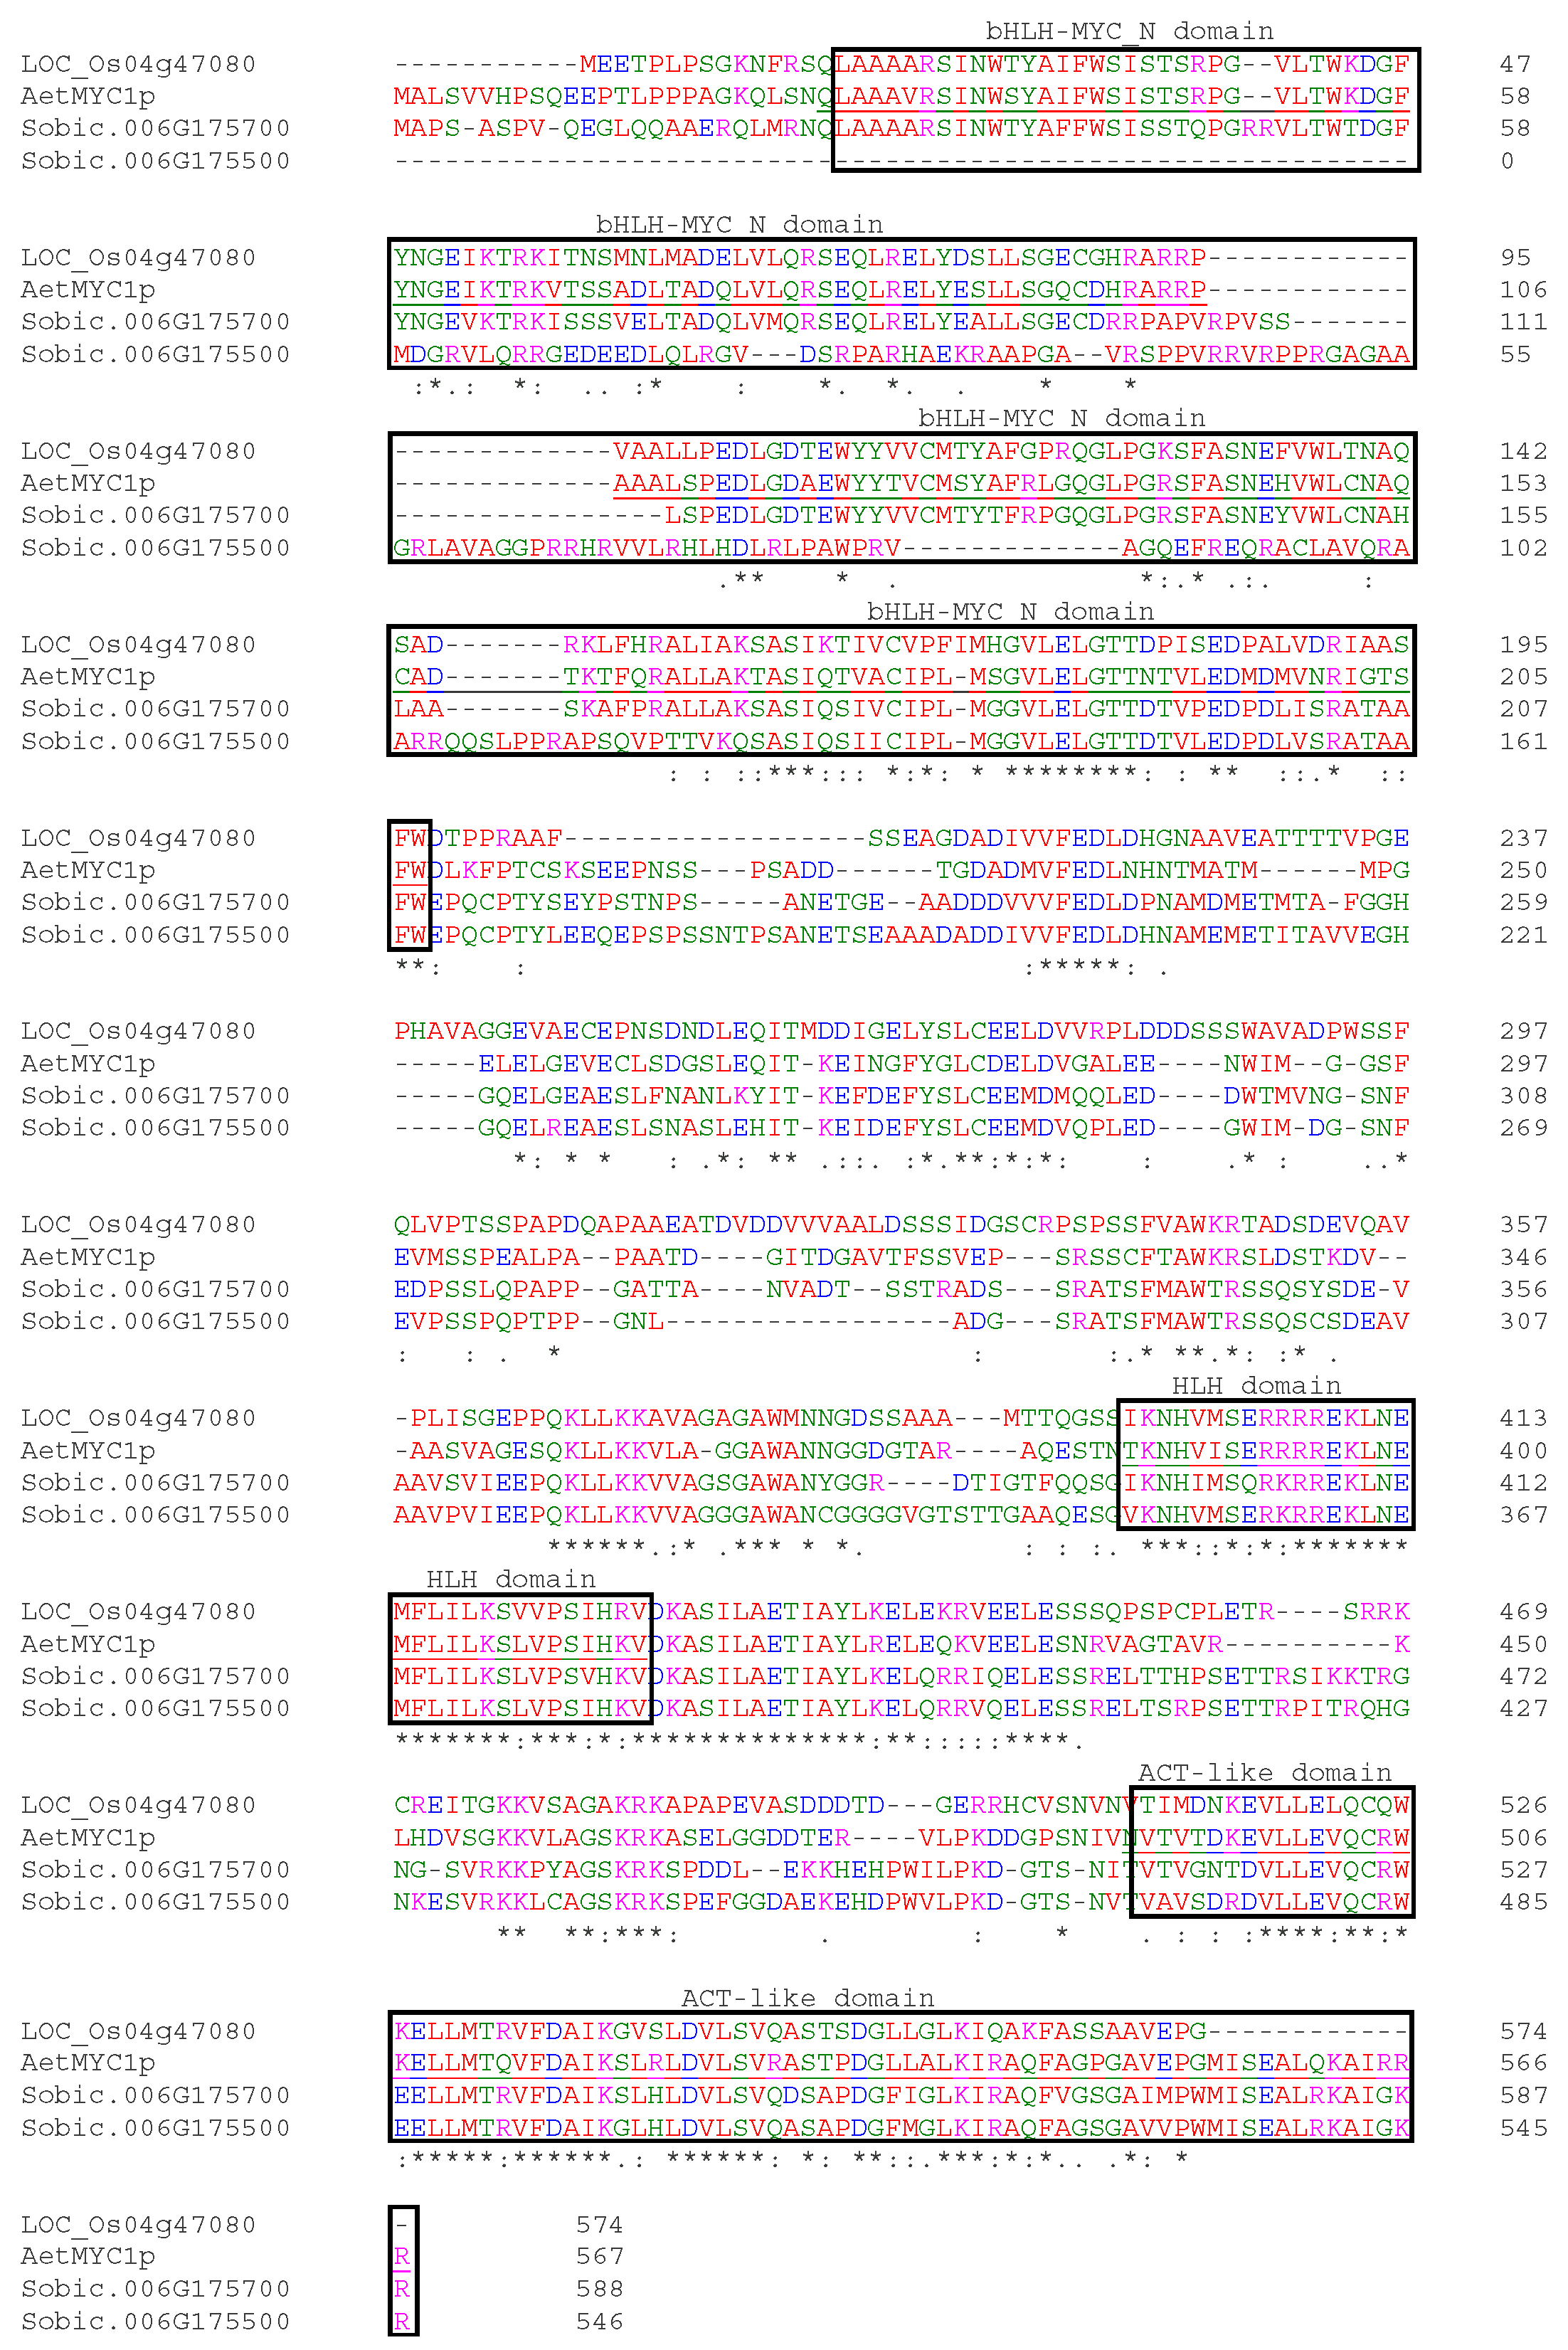
3.3. Candidate Genes and qPCR Analysis

To further analyze the chromosome 6 locus using the most up-to-date genome annotation (Figure S2), SNP marker positions were converted to sorghum bicolor v5.1. In v5.1, this region contained three genes, Sobic.006G175500, Sobic.006G175700 and Sobic.006G175800 (Figure 4). While Sobic.006G175500 and Sobic.006G175700 both code for MYC/MYB basic helix-loop-helix (bHLH) transcription factors known to regulate the anthocyanin biosynthetic pathway in flowering plants [50], Sobic.006G175800 codes for acyl-coenzyme A thioesterase which mainly functions in lipid metabolism [51]. In addition, the most significant SNP, 54519504 (5.18 × 10⁻¹⁵), was 6.4 kb from the Sobic.006G175700, but 37.2 kb from the Sobic.006G175500 coding region (Figure 4).
To further identify candidate genes, redundant SNPs were removed using PLINK, leaving only 20 SNPs in the candidate region (Figure 5). Among these, the p-values of three SNPs exceeded the threshold, with two of them located near Sobic.006G175700. Notably, the most significant SNP (referred to as the main SNP) was found 13.8 kb (2022) and 16.5 kb (2023) upstream of Sobic.006G175700 in both years. This strongly suggests that Sobic.006G175700 is the likely candidate gene controlling coleoptile color.
To analyze the expression levels of the candidate genes in the three color groups, RNA was extracted from the coleoptiles, and qPCR analysis was performed. While the expression of Sobic.006G175500 was consistent within each group, with significant differences observed between green and purple, and between green and red, there were no significant differences between purple and red (Figure 6A). In contrast, Sobic.006G175700 was not consistently expressed within each group. While there were no significant differences between green and red compared to purple, there were significant differences between the green and red groups. However, a general trend showed increasing expression from green to purple to red. (Figure 6B). These results showed that both genes are upregulated in the purple/red varieties although Sobic.006G175700 was expressed at a slightly higher level than Sobic.006G175500 especially in the red varieties.
To further identify which of the two transcription factors was the candidate gene, we aligned the protein sequences of LOC_Os04g47080 (rice Ra gene) [50], AetMYC1p (the Aegilops tauschii that controls red coleoptile color) [52], Sobic.006G175500 and Sobic.006G175700 (Figure 7). According to the domain sequence from Cao et al. (2017) [52], the Sobic.006G175500 sequence is incomplete as it contains deletions and insertions in the bHLH-MYC_N domain (Figure 7). Based on this and other evidence described in the Discussion, it is clear that Sobic.006G175700 is the candidate gene for sorghum coleoptile color.

3.4. Haplotype Analysis for the Candidate Gene

In addition, we performed a haplotype analysis using 38 SNPs from 54508481 to 54531141 bp, covering the first half of the sixth exon to 18 kb upstream of Sobic.006G175700 and accessions that showed consistent coleoptile colors in both 2022 and 2023. We found four haplotypes each for green (G1–G4) and purple (P1–P4), and three haplotypes for red (R1–R3) coleoptile colors (Figure 8 and Table S2). In each color group, G1/P1/R1 were the predominant haplotypes. It is clear that P1 was identical to R1, indicating that the haplotype cannot differentiate between purple and red accessions (Table S2), which is consistent with the gene expression showing an insignificant difference between red and purple coleoptiles. However, G1 was able to discriminate between green and colored coleoptile colors (Table S2), which is consistent with the gene expression showing a significant difference between red and green coleoptiles. This shows that these haplotypes can be used to develop markers for selecting desired coleoptile colors.

4. Discussion

The Coleoptile color appeared early and was closely related to anthocyanin content and environment. The wheat line CS(Hope7A) showed red coleoptiles, while Chinese Spring expressed green coleoptiles when grown in the light; however, both lines showed colored coleoptiles in the dark [53]. Similarly, developing seeds overexpressing ZmR exposed to light conditions showed up-regulated transcript levels of anthocyanin biosynthesis-related genes compared to no light exposure [31] and TdRCA1,which regulates anthocyanin biosynthesis in emmer wheat coleoptiles, is activated by light [14]. In this study, we found that 52% of the varieties possessed green coleoptiles and the rest had colored (purple/red) coleoptiles in 2022. But in 2023, 40% of the varieties showed green coleoptile and 60% showed colored coleoptiles, indicating that environmental conditions, possibly light, can affect anthocyanin content. Despite this, the genetic control predominated because a strong locus was mapped across the two environments.
The qPCR analysis also provides important information for candidate genes. Both OsAi (LOC_Os11g15210) and OsCl (LOC_Os06g10350) affect rice coleoptile purple line expression. The OsAi gene belongs to the bHLH transcription factor family, while the OsC1 gene is of the MYB transcription factor family [54]. The qPCR analysis showed that OsAi is only expressed in the coleoptile, and OsC1 is expressed in the coleoptile and leaves [54]. In determining a rice PSH1 (purple leaf sheath 1) candidate gene, Hu et al. (2020) found that the relative expression of Rb2 in NIL-ZS97 (purple leaf sheath) was 13.9 times that of NIL-XZ2 (green leaf sheath) in the leaf sheath [37]. However, the expression of Rb1 in the leaf sheath of NIL-ZS97 was 130 times higher than that of NIL-XZ2. Hence, gene expression provides further support for the suggestion that Rb1 might be the most likely gene controlling leaf sheath color [37]. Another leaf sheath color gene, PSH1 (OsC1) is expressed at a higher level in the leaf sheath at the seedling stage and at a lower level in the leaves, and it is not expressed in the roots [55]. In this study, we also observed that as a general trend, the expression of both candidate genes increased as the anthocyanin content increased.
The two candidate genes found in this study, Sobic.006G175500 and Sobic.006G175700, share 76% identity and 83% similarity. Our expression data show that both genes are upregulated in purple/red varieties, although Sobic.006G175700 was expressed at slightly higher level than Sobic.006G175500 in these purple/red accessions. Morris et al. (2013) mapped sorghum coleoptile color to a region around 54 Mb on chromosome 6 (in Sorghum bicolor v1.4 [26]). This peak colocalizes with the classical Rs1 locus and a priori candidate gene Sb06g025060 which corresponds to Sobic.006G175700 in Sorghum bicolor v3.1.1 and is 220 kb downstream from the most significant SNP (S6_53849573). This provides more evidence that Sobic.006G175700 is the candidate gene for colored coleoptiles. The other evidence is from orthologs of related species as discussed below.
The genome search using both genes against the maize genome curated at Phytozome 13 indicates that both are most homologous to Zm00001eb429330, the P gene that controls maize coleoptile color [28,56]. Searching GenBank with both protein sequences identified the rice Ra gene (LOC_Os04g47080) as the best match. But searching the rice genome curated at Phytozome 13 produced slightly different results. Sobic.006G175700 is most homologous to LOC_Os04g47080 while Sobic.006G175500 is most homologous to LOC_Os04g47040. All of these five genes (Sobic.006G175500, Sobic.006G175700, Zm00001eb429330, LOC_Os04g47080 and LOC_Os04g47040) have been annotated as myc-type bHLH transcription factors, known to regulate the anthocyanin biosynthetic pathway in flowering plants [50]. But LOC_Os04g47080 and LOC_Os04g47040 are different from OsAi, which is located on rice chromosome 11 [54]. The rice Ra gene, LOC_Os04g47080, can activate anthocyanin synthesis in maize and is expressed in purple, not green, rice leaves [55]. The expression profiles from RiceXPro [57] indicate that LOC_Os04g47040 is mainly expressed in paleas and lemmas, but LOC_Os04g47080 is highly expressed in leaf sheaths, in addition to pistils and anthers (Figure S1). In Aegilops tauschii, Sobic.006G175700 is most homologous to AetMYC1p (Traes_2BL_1EDB62D8E) which together with AetMYB7D, induces anthocyanin biosynthesis [52]. Based on these lines of evidence, we conclude that Sobic.006G175700 is the candidate gene for sorghum coleoptile color, although further functional studies are needed.

5. Conclusions

This study identified key factors controlling coleoptile color in sorghum by pheno-typing sorghum mini core accessions in two environments and analyzing the anthocyanin content. We found that 40% of the accessions were green, 12% were purple and 18% were red, with environmental conditions causing some accessions to change color. A positive correlation between coleoptile color intensity and anthocyanin content was established. A genome-wide association analysis identified two candidate genes, Sobic.006G175700 and Sobic.006G175500, linked to coleoptile color in one locus on chromosome 6. Further analysis confirmed Sobic.006G175700 as the Rs1 gene, responsible for coleoptile color in sorghum. The haplotype analysis of the SNPs from both coding and upstream regions of Rs1 demonstrated that specific haplotypes can distinguish between green and colored coleoptile colors. These findings provide valuable insights for marker-assisted selection of desired coleoptile colors in sorghum breeding.

Supplementary Materials

The following supporting information can be downloaded at: https://www.mdpi.com/article/10.3390/agronomy15030688/s1, Figure S1: Expression of LOC_Os04g47080 (A) and LOC_Os04g47040 (B) in rice; Figure S2: Linkage disequilibrium (LD) plot of the candidate gene region on sorghum chromosome 6 for 2022 (A) and 2023 (B); Table S1: Coleoptile color for 235 sorghum accessions in two environments (green (“1”), purple (“2”) and red (“3”); Table S2: a Haplotypes of green coleoptile color in sorghum, b Haplotypes of purple coleoptile color in sorghum, c Haplotypes of red coleoptile color in sorghum; Table S3: Primers used in this study.

Author Contributions

K.W.: Investigation, Conceptualization, Methodology, Software, Visualization, Writing—Original Draft; L.W.: Investigation, Resources, Reviewing and Editing; Q.S.: Data Analysis, Writing, Reviewing and Editing; L.H.: Investigation, Writing, Reviewing and Editing; Z.X.: Investigation, Writing, Reviewing and Editing; Y.W.: Writing, Reviewing and Editing; J.L.: Funding Acquisition, Conceptualization, Investigation, Methodology, Software, Writing, Reviewing and Editing. All authors have read and agreed to the published version of the manuscript.

Funding

The authors declare that financial support was received for the research, authorship, and/or publication of this article. This study was supported by the National Natural Science Foundation of China (32372134), the Key Project of Natural Science Research of Anhui Provincial Education Department (KJ2021ZD0108), and the Distinguished talents of Anhui Provincial Education Department (gxbjZD2022045), Key Discipline Construction Funds of Anhui Sciences and Technology University (No. XK-XJGF001).

Data Availability Statement

The original contributions presented in this study are included in the article/Supplementary Material. Further inquiries can be directed to the corresponding authors.

Conflicts of Interest

The authors declare no conflicts of interest.

References

  1. Proietti, I.; Frazzoli, C.; Mantovani, A. Exploiting Nutritional Value of Staple Foods in the World’s Semi-Arid Areas: Risks, Benefits, Challenges and Opportunities of Sorghum. Healthcare 2015, 3, 172–193. [Google Scholar] [CrossRef] [PubMed]
  2. Khoddami, A.; Messina, V.; Vadabalija Venkata, K.; Farahnaky, A.; Blanchard, C.L.; Roberts, T.H. Sorghum in foods: Functionality and potential in innovative products. Crit. Rev. Food Sci. Nutr. 2023, 63, 1170–1186. [Google Scholar] [CrossRef] [PubMed]
  3. National Research Council. Lost Crops of Africa: Volume I: Grains; The National Academies Press: Washington, DC, USA, 1996. [Google Scholar]
  4. Rhodes, D.H.; Hoffmann, L.; Rooney, W.L.; Herald, T.J.; Bean, S.; Boyles, R.; Kresovich, S.; Brenton, Z.W. Genetic architecture of kernel composition in global sorghum germplasm. BMC Genom. 2017, 18, 15. [Google Scholar] [CrossRef]
  5. Zhang, L.; Ding, Y.; Xu, J.; Gao, X.; Cao, N.; Li, K.; Feng, Z.; Cheng, B.; Zhou, L.; Ren, M.; et al. Selection Signatures in Chinese Sorghum Reveals Its Unique Liquor-Making Properties. Front. Plant Sci. 2022, 13, 923734. [Google Scholar] [CrossRef] [PubMed]
  6. Abreha, K.B.; Enyew, M.; Carlsson, A.S.; Vetukuri, R.R.; Feyissa, T.; Motlhaodi, T.; Ng’uni, D.; Geleta, M. Sorghum in dryland: Morphological, physiological, and molecular responses of sorghum under drought stress. Planta 2021, 255, 20. [Google Scholar] [CrossRef]
  7. Lemaire, G.; Charrier, X.; Hébert, Y. Nitrogen uptake capacities of maize and sorghum crops in different nitrogen and water supply conditions. Agronomie 1996, 16, 231–246. [Google Scholar] [CrossRef]
  8. Schittenhelm, S.; Schroetter, S. Comparison of drought tolerance of maize, sweet sorghum and sorghum-sudangrass hybrids. J. Agron. Crop Sci. 2013, 200, 46–53. [Google Scholar] [CrossRef]
  9. Rotundo, J.L.; Salinas, A.; Gomara, N.; Borras, L.; Messina, C. Maize outyielding sorghum under drought conditions helps explain land use changes in the US. Field Crops Res. 2024, 308, 109298. [Google Scholar] [CrossRef]
  10. Tillich, H.J. Seedling diversity and the homologies of seedling organs in the order Poales (Monocotyledons). Ann. Bot. 2007, 100, 1413–1429. [Google Scholar] [CrossRef]
  11. Srivastava, L.M. Plant Growth and Development: Hormones and Environment; Academic Press: Boston, MA, USA, 2002; pp. 341–379. [Google Scholar]
  12. Eiko, H.; Ahmed, N.; Kazuhiko, N. Colour genes (R and Rc) for grain and coleoptile upregulate flavonoid biosynthesis genes in wheat. Genome 2005, 48, 747–754. [Google Scholar]
  13. Shoeva, O.Y.; Gordeeva, E.I.; Arbuzova, V.S.; Khlestkina, E.K. Anthocyanins participate in protection of wheat seedlings from osmotic stress. Cereal Res. Commun. 2017, 45, 47–56. [Google Scholar] [CrossRef]
  14. Li, J.; Zhang, C.; Xu, X.; Su, Y.; Gao, Y.; Yang, J.; Xie, C.J.; Ma, J. A MYB family transcription factor TdRCA1 from wild emmer wheat regulates anthocyanin biosynthesis in coleoptile. Theor. Appl. Genet. 2024, 137, 208. [Google Scholar] [CrossRef] [PubMed]
  15. Harborne, J.B.; Williams, C.A. Anthocyanins and other flavonoids. Nat. Prod. Rep. 2001, 18, 310–333. [Google Scholar] [CrossRef]
  16. Tanaka, Y.; Brugliera, F.; Kalc, G.; Senior, M.; Dyson, B.; Nakamura, N.; Katsumoto, Y.; Chandler, S. Flower Color Modification by Engineering of the Flavonoid Biosynthetic Pathway: Practical perspectives. Biosci. Biotechnol. Biochem. 2010, 74, 1760–1769. [Google Scholar] [CrossRef] [PubMed]
  17. Zhang, X.; Zhang, L.; Zhang, D.; Su, D.; Li, W.; Wang, X.; Chen, Q.; Cai, W.; Xu, L.; Cao, F.; et al. Comprehensive analysis of metabolome and transcriptome reveals the mechanism of color formation in different leave of Loropetalum Chinense var. Rubrum. BMC Plant Biol. 2023, 23, 133. [Google Scholar] [CrossRef]
  18. Khoddami, A.; Mohammadrezaei, M.; Roberts, T.H. Effects of Sorghum Malting on Colour, Major Classes of Phenolics and Individual Anthocyanins. Molecules 2017, 22, 1713. [Google Scholar] [CrossRef]
  19. Liu, C.H.; Zhao, X.L.; Wang, Z.; Zheng, X.Z.; Xue, L.L.; Liu, C.; Chen, Z.Y.; Zhang, B.F. Evaluation of the antioxidant activity of blueberry ethanol extracts under microwave extraction. Int. J. Agric. Biol. Eng. 2022, 15, 205–213. [Google Scholar] [CrossRef]
  20. Lee, C.; Lee, J.Y.; Lee, J.W. Relationship of fruit color and anthocyanin content with related gene expression differ in strawberry cultivars during shelf life. Sci. Hortic. 2022, 301, 111109. [Google Scholar] [CrossRef]
  21. Wu, Y.Q.; Zhang, C.H.; Huang, Z.J.; Lyu, L.F.; Li, J.; Li, W.L.; Wu, W.L. The color difference of rubus fruits is closely related to the composition of flavonoids including anthocyanins. LWT 2021, 149, 111825. [Google Scholar] [CrossRef]
  22. Khlestkina, E.K.; Antonova, E.V.; Pershina, L.A.; Soloviev, A.A.; Badaeva, E.D.; Börner, A.; Salina, E.A. Variability of Rc (red coleoptile) alleles in wheat and wheat-alien genetic stock collections. Cereal Res. Commun. 2011, 39, 465–474. [Google Scholar] [CrossRef]
  23. Du, S.L.; Wang, Z.W.; Chen, Y.; Tan, Y.; Li, X.; Zhu, W.P.; He, G.H.; Lei, K.R.; Guo, L.B.; Zhang, Y. Coleoptile purple line regulated by A-P gene system is a valuable marker trait for seed purity identification in hybrid rice. Rice Sci. 2022, 29, 451–461. [Google Scholar] [CrossRef]
  24. Doggett, H. Sorghum, 2nd ed.; Longmans Scientific and Technical: Harlow, UK, 1988. [Google Scholar]
  25. Mace, E.S.; Jordan, D.R. Location of major effect genes in sorghum (Sorghum bicolor (L.) Moench). Theor. Appl. Genet. 2010, 121, 1339–1356. [Google Scholar] [CrossRef] [PubMed]
  26. Morris, G.P.; Rhodes, D.H.; Brenton, Z.; Ramu, P.; Thayil, V.M.; Deshpande, S.; Hash, C.T.; Acharya, C.; Mitchell, S.E.; Buckler, E.S.; et al. Dissecting genome-wide association signals for loss-of-function phenotypes in sorghum flavonoid pigmentation traits. G3 2013, 3, 2085–2094. [Google Scholar] [CrossRef]
  27. Cone, K.C. Anthocyanin synthesis in maize aleurone tissue. Plant Cell Monogr. 2007, 8, 121–139. [Google Scholar]
  28. Li, Y.; Bernot, J.P.; Illingworth, C.; Lison, W.; Bernot, K.M.; Eggleston, W.B.; Fogle, K.J.; Dipaola, J.E.; Kermicle, J.; Alleman, M. Gene conversion within regulatory sequences generates maize r alleles with altered gene expression. Genetics 2001, 159, 1727–1740. [Google Scholar] [CrossRef]
  29. Walker, E.L.; Panavas, T. Structural features and methylation patterns associated with paramutation at the r1 locus of Zea mays. Genetics 2001, 159, 1201–1215. [Google Scholar] [CrossRef]
  30. Elena, K.K.; Elena, I.G.; Valentina, S.A. Molecular and functional characterization of wheat near-isogenic line ‘i:S29Ra’ having intensive anthocyanin pigmentation of the coleoptile, culm, leaves and auricles. Plant Breed. 2014, 133, 454–458. [Google Scholar]
  31. Riaz, B.; Chen, H.; Wang, J.; Du, L.; Wang, K.; Ye, X. Overexpression of Maize ZmC1 and ZmR Transcription Factors in Wheat Regulates Anthocyanin Biosynthesis in a Tissue-Specific Manner. Int. J. Mol. Sci. 2019, 20, 5806. [Google Scholar] [CrossRef]
  32. Qi, X.; Guo, S.; Zhong, Y.; Chen, B.; Liu, Z.; Yan, T.; Feng, B.; Ni, Z.; Chen, S.; Liu, C. Establishment of an efficient haploid identification system by engineering anthocyanin accumulation in the wheat embryo. Plant Commun. 2023, 4, 100568. [Google Scholar] [CrossRef]
  33. Wang, Y.Q.; Hou, X.J.; Zhang, B.; Chen, W.J.; Liu, D.C.; Liu, B.L.; Zhang, H.G. Identification of a Candidate Gene for Rc-D1, a Locus Controlling Red Coleoptile Colour in Wheat. Cereal Res. Commun. 2016, 44, 35–46. [Google Scholar] [CrossRef]
  34. Himi, E.; Taketa, S. Isolation of candidate genes for the barley Ant1 and wheat Rc genes controlling anthocyanin pigmentation in different vegetative tissues. Mol. Genet. Genom. 2015, 290, 1287–1298. [Google Scholar] [CrossRef] [PubMed]
  35. Khlestkina, E.K.; Pestsova, E.G.; Röder, M.S.; Börner, A. Molecular mapping, phenotypic expression and geographical distribution of genes determining anthocyanin pigmentation of coleoptiles in wheat (Triticum aestivum L.). Theor. Appl. Genet. 2002, 104, 632–637. [Google Scholar] [CrossRef] [PubMed]
  36. Chin, H.S.; Wu, Y.P.; Hour, A.L.; Hong, C.Y.; Lin, Y.R. Genetic and Evolutionary Analysis of Purple Leaf Sheath in Rice. Rice 2016, 9, 8. [Google Scholar] [CrossRef] [PubMed]
  37. Hu, W.; Zhou, T.; Han, Z.; Tan, C.; Xing, Y. Dominant complementary interaction between OsC1 and two tightly linked genes, Rb1 and Rb2, controls the purple leaf sheath in rice. Theor. Appl. Genet. 2020, 133, 2555–2566. [Google Scholar] [CrossRef]
  38. Jiang, L.Q.; Lyu, S.W.; Yu, H.; Zhang, J.; Sun, B.G.; Liu, Q.; Mao, X.G.; Chen, P.G.; Pan, D.J.; Chen, W.F.; et al. Transcription factor encoding gene OsC1 regulates leaf sheath color through anthocyanidin metabolism in Oryza rufipogon and Oryza sativa. BMC Plant Biol. 2024, 24, 147. [Google Scholar] [CrossRef]
  39. Upadhyaya, H.D.; Pundir, R.P.; Dwivedi, S.L.; Gowda, C.L.; Reddy, V.G.; Singh, S. Developing a mini core collection of sorghum for diversified utilization of germplasm. Crop Sci. 2009, 49, 1769–1780. [Google Scholar] [CrossRef]
  40. Yu, X. Analysis and Study of Anthocyanins in Plant Leaves. Mod. Instrum. 2000, 04, 37–38, (In Chinese with English Summary). [Google Scholar]
  41. Wang, L.; Upadhyaya, H.D.; Zheng, J.; Liu, Y.; Singh, S.K.; Gowda, C.L.; Kumar, R.; Zhu, Y.; Wang, Y.H.; Li, J. Genome-wide Association Mapping Identifies Novel Panicle Morphology Loci and Candidate Genes in Sorghum. Front. Plant Sci. 2021, 12, 743838. [Google Scholar] [CrossRef]
  42. Kang, H.M.; Sul, J.H.; Service, S.K.; Zaitlen, N.A.; Kong, S.Y.; Freimer, N.B.; Sabatti, C.; Eskin, E. Variance component model to account for sample structure in genome-wide association studies. Nat. Genet. 2010, 42, 348–354. [Google Scholar] [CrossRef]
  43. Pritchard, J.K.; Stephens, M.; Rosenberg, N.A.; Donnelly, P. Association mapping in structured populations. Am. J. Hum. Genet. 2000, 67, 170–181. [Google Scholar] [CrossRef]
  44. Upadhyaya, H.D.; Wang, L.; Prakash, C.S.; Liu, Y.; Gao, L.; Meng, R.; Seetharam, K.; Gowda, C.L.L.; Ganesamurthy, K.; Singh, S.K.; et al. Genome-wide association mapping identifies an SNF4 ortholog that impacts biomass and sugar yield in sorghum and sugarcane. J. Exp. Bot. 2022, 73, 3584–3596. [Google Scholar] [CrossRef] [PubMed]
  45. Dong, S.S.; He, W.M.; Ji, J.J.; Zhang, C.; Guo, Y.; Yang, T.L. LDBlockShow: A fast and convenient tool for visualizing linkage disequilibrium and haplotype blocks based on variant call format files. Brief. Bioinform. 2021, 22, bbaa227. [Google Scholar] [CrossRef] [PubMed]
  46. Goodstein, D.M.; Shu, S.; Howson, R.; Neupane, R.; Hayes, R.D.; Fazo, J.; Mitros, T.; Dirks, W.; Hellsten, U.; Putnam, N.; et al. Phytozome: A comparative platform for green plant genomics. Nucleic Acids Res. 2012, 40, D1178–D1186. [Google Scholar] [CrossRef] [PubMed]
  47. Arvidsson, S.; Kwasniewski, M.; Riaño-Pachón, D.M.; Mueller-Roeber, B. QuantPrime—A flexible tool for reliable high-throughput primer design for quantitative PCR. BMC Bioinform. 2008, 9, 465. [Google Scholar] [CrossRef]
  48. Gao, S.; Peng, J.; Rong, M.; Liu, Y.; Xu, Y.; Wei, J. Screening and validation of reference genes in Dracaena cochinchinensis using quantitative real-time PCR. Sci. Rep. 2024, 14, 6165. [Google Scholar] [CrossRef]
  49. Livak, K.J.; Schmittgen, T.D. Analysis of relative gene expression data using real-time quantitative PCR and the 2−ΔΔCT method. Methods 2001, 25, 402–408. [Google Scholar] [CrossRef]
  50. Hu, J.; Anderson, B.; Wessler, S.R. Isolation and characterization of rice R genes: Evidence for distinct evolutionary paths in rice and maize. Genetics 1996, 142, 1021–1031. [Google Scholar] [CrossRef]
  51. Kalinger, R.S.; Pulsifer, I.P.; Hepworth, S.R.; Rowland, O. Fatty Acyl Synthetases and Thioesterases in Plant Lipid Metabolism: Diverse Functions and Biotechnological Applications. Lipids 2020, 55, 435–455. [Google Scholar] [CrossRef]
  52. Cao, D.; Ye, G.J.; Zong, Y.; Zhang, B.; Chen, W.J.; Liu, B.L.; Zhang, H.G. AetMYC1, the Candidate Gene Controlling the Red Coleoptile Trait in Aegilops tauschii Coss. Accession As77. Molecules 2017, 22, 2259. [Google Scholar] [CrossRef]
  53. Ahmed, N.; Maekawa, M.; Utsugi, S.; Rikiishia, K.; Ahmad, A.; Noda, K. The wheat Rc gene for red coleoptile colour codes for a transcriptional activator of late anthocyanin biosynthesis genes. J. Cereal Sci. 2006, 44, 54–58. [Google Scholar] [CrossRef]
  54. Zhang, Y. Map-Based Cloning and Application of Two Genes Related to Purple Line in Rice Coleoptile. Ph.D. Thesis, Southwest University, Chongqing, China, 2009. [Google Scholar]
  55. Gao, D.; He, B.; Zhou, Y.; Sun, L. Genetic and molecular analysis of a purple sheath somaclonal mutant in Japonica rice. Plant Cell Rep. 2011, 30, 901–911. [Google Scholar] [CrossRef] [PubMed]
  56. Robbins, T.P.; Walker, E.L.; Kermicle, J.L.; Alleman, M.; Dellaporta, S.L. Meiotic instability of the R-r complex arising from displaced intragenic exchange and intrachromosomal rearrangement. Genetics 1991, 129, 271–283. [Google Scholar] [CrossRef] [PubMed]
  57. Sato, Y.; Takehisa, H.; Kamatsuki, K.; Minami, H.; Namiki, N.; Ikawa, H.; Ohyanagi, H.; Sugimoto, K.; Antonio, B.A.; Nagamura, Y. RiceXPro Version 3.0: Expanding the informatics resource for rice transcriptome. Nucleic Acids Res. 2013, 41, D1206–D1213. [Google Scholar] [CrossRef]
Figure 1. Three sorghum coleoptile colors of 9 accessions from the 235 evaluated in this study. Note: (A) green, (B) purple, (C) red, bar = 1 cm.
Agronomy 15 00688 g001
Figure 2. Analysis of anthocyanin content. Note: Lower case indicates significant differences between treatments at the 0.05 level.
Agronomy 15 00688 g002
Figure 3. QQ plots and Manhattan plots of coleoptile color for sorghum plants in the two environments. Note: (A/C) is 2022, (B/D) is 2023.
Agronomy 15 00688 g003
Figure 4. Chromosome 6 regions of candidate genes with 2023 data. Note: The x-axis is the chromosome position in bp.
Agronomy 15 00688 g004
Figure 5. Linkage disequilibrium (LD) plots of candidate gene regions on sorghum chromosome 6 after removing redundant SNPs in 2022 (A) and 2023 (B). Notes: Manhattan plot in the candidate genes (top), gene identifier in the region (middle) and LD heat map (bottom).
Agronomy 15 00688 g005
Figure 6. The qPCR analysis for the three coleoptile color groups with three biological replicates for Sobic.006G175500 (A) and Sobic.006G175700 (B). Note: g1–g3 represent IS4951, IS3158 and IS24453 with green, p1–p3 represent IS31706, IS12965, IS17941 with purple and r1–r3 represent IS9108, IS21863 and IS24939 with red coleoptile colors. Three biological replicates were performed for each accession, and statistical analysis was conducted using ANOVA. Different lower-case letters indicate significant differences between treatments at the 0.05 level.
Agronomy 15 00688 g006
Figure 7. Protein sequence alignment of LOC_Os04g47080 [50], AetMYC1p [52], Sobic.006G175500 and Sobic.006G175700. Note: Domain sequences were based on Cao et al. (2017) [52]. * indicates amino acids that are the same in all four genes.
Agronomy 15 00688 g007
Figure 8. Haplotype frequencies for green (G1–G4), purple (P1–P4) and red (R1–R3) coleoptile colors in sorghum. Note: The y-axis represents the number of accessions.
Agronomy 15 00688 g008
Table 1. Number and proportion of varieties with different coleoptile colors in sorghum mini core accessions.
RedPurpleGreenTotal
20225261122235
proportions22%26%52%100%
20237253110235
proportions31%22%47%100%
Table 2. Quantitative trait loci of color coleoptile mapped in the two environments.
TraitEnvironmentQTLCHRPOS (bp)p-Value
Coleoptile color2022Chr02:1034741210347411.021537 × 10−6
Chr03:107037933107037931.082520 × 10−6
Chr06:531255446531255441.627272 × 10−12
2023Chr05:679655065679655062.025845 × 10−7
Chr05:415142845415142843.798307 × 10−7
Chr06:530328836531174355.18 × 10−15
QTL, quantitative trait locus; CHR, chromosome; POS, position.
Disclaimer/Publisher’s Note: The statements, opinions and data contained in all publications are solely those of the individual author(s) and contributor(s) and not of MDPI and/or the editor(s). MDPI and/or the editor(s) disclaim responsibility for any injury to people or property resulting from any ideas, methods, instructions or products referred to in the content.

