Article

YOLO-MECD: Citrus Detection Algorithm Based on YOLOv11

1
School of Software, Jiangxi Agricultural University, Nanchang 330045, China
2
School of Microelectronics, Shanghai University, Shanghai 201800, China
*
Author to whom correspondence should be addressed.
Agronomy 2025, 15(3), 687; https://doi.org/10.3390/agronomy15030687
Submission received: 23 January 2025 / Revised: 2 March 2025 / Accepted: 11 March 2025 / Published: 13 March 2025
(This article belongs to the Section Precision and Digital Agriculture)

Abstract

Accurate quantification of the citrus dropped number plays a vital role in evaluating the disaster resistance capabilities of citrus varieties and selecting superior cultivars. However, research in this critical area remains notably insufficient. To bridge this gap, we conducted in-depth experiments using a custom dataset of 1200 citrus images and proposed a lightweight YOLO-MECD model that is built upon the YOLOv11s architecture. Firstly, the EMA attention mechanism was introduced as a replacement for the traditional C2PSA attention mechanism. This modification not only enhances feature extraction capabilities and detection accuracy for citrus fruits but also achieves a significant reduction in model parameters. Secondly, we implemented a CSPPC module based on partial convolution to replace the original C3K2 module, effectively reducing both parameter count and computational complexity while maintaining mAP values. At last, the MPDIoU loss function was employed, resulting in improved bounding box detection accuracy and accelerated model convergence. Notably, our research reveals that reducing convolution operations in the backbone architecture substantially enhances small object detection capabilities and significantly decreases model parameters, proving more effective than the addition of small object detection heads. The experimental results and comparative analysis with similar network models indicate that the YOLO-MECD model has achieved significant improvements in both detection performance and computational efficiency. This model demonstrates excellent comprehensive performance in citrus object detection tasks, with a precision (P) of 84.4%, a recall rate (R) of 73.3%, and an elevated mean average precision (mAP) of 81.6%. Compared to the baseline, YOLO-MECD has improved by 0.2, 4.1, and 3.9 percentage points in detection precision, recall rate, and mAP value, respectively. Furthermore, the number of model parameters has been substantially reduced from 9,413,574 in YOLOv11s to 2,297,334 (a decrease of 75.6%), and the model size has been compressed from 18.2 MB to 4.66 MB (a reduction of 74.4%). Moreover, YOLO-MECD also demonstrates superior performance against contemporary models, with mAP improvements of 3.8%, 3.2%, and 5.5% compared to YOLOv8s, YOLOv9s, and YOLOv10s, respectively. The model’s versatility is evidenced by its excellent detection performance across various citrus fruits, including pomelos and kumquats. These achievements establish YOLO-MECD as a robust technical foundation for advancing citrus fruit detection systems and the development of smart orchards.

1. Introduction

Citrus is one of the most important economic crops around the world, holding a significant position in international agriculture [1]. China possesses abundant citrus resources with diverse varieties, leading the world in both cultivation area and production volume. The citrus industry has become a key role in promoting rural economic development in China [2]. During the growth period, the number of fruits on trees is an important indicator for revealing the tree’s health [3,4,5]. During citrus cultivation, various extreme natural disasters (such as strong winds and heavy rains) can easily cause fruit drop, resulting in significant losses for farmers. Therefore, citrus breeders have been seeking superior varieties that possess certain resistance to natural disasters and are less prone to fruit drop, which is of great significance for the development of China’s citrus industry. Currently, breeders and farmers count the on-tree or dropped fruit after natural disasters manually, which inevitably involves problems such as high costs, low efficiency, and poor accuracy. This deficiency limits the selection of superior citrus varieties and has become a bottleneck of the citrus industries. Therefore, how to achieve precise detection and count on-tree or dropped fruits automatically in natural environments is an urgent problem that needs to be solved.
Although morphology-based methods have previously achieved acceptable results, their generalizability remains unsatisfactory. Furthermore, these methods need manually designed features, and are easily affected by lighting and the environmental background, making them unfavorable for practical applications in different environments. Recently, deep learning algorithms represented by convolutional neural networks have been widely applied in agricultural fruit recognition, disease detection, yield estimation, and achieving good results in crops such as navel oranges, citrus, and pomelos. Based on different model structures, deep-learning-based object detection algorithms can be mainly divided into two categories. One is the two-stage object detection methods represented by R-CNN, Fast R-CNN, and Faster R-CNN; these approaches obtain proposal regions firstly and then perform classification within the current region [6,7,8]. For example, Yan et al. [9] proposed an improved Faster R-CNN-based rosa roxburghii fruit recognition method, achieving a recall rate, precision, and recognition speed of 96.93%, 95.53%, and 0.2 s/image, respectively. Xiong et al. [10] proposed a green citrus visual detection method based on Faster R-CNN that could accurately identify green citrus under different lighting conditions and sizes, achieving a mean average precision (mAP) of 85.49%. While these algorithms have high accuracy, the region proposal step consumes substantial computational resources and requires a longer detection time, making it difficult to meet real-time requirements. The other category is single-stage object detection algorithms, represented by SSD and the YOLO (You Only Look Once) series [11,12,13,14,15,16,17]. These algorithms do not need to generate candidate boxes but instead transform the bounding box problem into a regression problem, featuring high accuracy, a fast speed, a short training time, and a low computational cost. For example, Zhang et al. [18] proposed an improved YOLOv4-LITE lightweight neural network detection algorithm for highly dense and severely adhered cherry tomato targets. The model used MobileNet-v3 as the feature extraction network, modified the pyramid network, and introduced small target detection layers, achieving a significant reduction in model weights and an average precision of 99.74%. Wang et al. [19] introduced MPDIoU to replace the original CIoU as the loss function based on the YOLOV8 network, accelerated model convergence, added small target detection layers to improve small target recognition ability, and used SCConv as the feature extraction network. The test results showed that the improved network model achieved a precision, recall, and mean average precision of 97.7%, 97%, and 99%, respectively.
In terms of citrus detection, the YOLO-GC model proposed by Lv et al. [20], based on improved YOLOv5s, successfully achieved the real-time precise detection of fruits in complex natural environments. The model obtained excellent results, showing a precision, recall, and mean average precision (mAP) of 96.5%, 89.4%, and 96.6%, respectively. Lv et al. [21] optimized the YOLOv3 network architecture, achieving both an improved detection speed and accuracy while reducing the model size. The improved YOLOv5 detection method proposed by Gao et al. [22] made a breakthrough: while reducing the model parameters to one-seventh of the original network, it still achieved 98.8% precision and 99.1% average precision, effectively resolving the inherent contradiction between accuracy and model complexity in traditional algorithms.
From the existing research, it is evident that although significant progress has been made in fruit target detection technology based on deep learning, current studies are predominantly confined to the detection of single fruit categories, revealing limitations in model generalization capabilities. Particularly for citrus fruits, their wide variety and significant inter-individual differences further complicate the detection process. Furthermore, earlier versions of the YOLO algorithm, such as YOLOv8, often suffer from complex model architectures and high computational demands, making them less suitable for lightweight application scenarios. To address these issues and meet the practical needs of citrus breeders and orchard managers, this paper takes both on-tree fruits and dropped fruits as objects and proposes a citrus detection and counting method based on improved YOLOv11. The main contributions of this paper are as follows:
(1) Replaced the C2PSA attention mechanism after the SPPF layer with the EMA (efficient multi-scale attention) attention mechanism, enhancing the model’s ability to extract citrus fruit feature information and thereby improving detection accuracy.
(2) Introduced the CSPPC module to replace the original C3K2 module in the model, reducing redundant computations and optimizing memory access while improving citrus fruit detection accuracy.
(3) Replaced the original CIoU (complete intersection over union loss) loss function with the MPDIoU (minimum point distance intersection over union) loss function, both improving bounding box accuracy and accelerating model convergence speed.
(4) The architecture of the original network detection layer was modified in the backbone network, which significantly decreased the parameter count while simultaneously enhancing the detection capability for citrus fruits.

2. Materials and Methods

2.1. Image Acquisition

The citrus images were collected at the Garden of Jiangxi Agricultural University (115.8° E, 28.7° N) in Nanchang City, Jiangxi Province, during October to November 2024. The images were captured using a Honor 70 camera (Honor Device Co., Ltd., Shenzhen, China). Due to adverse weather conditions in the earlier period, each fruit tree experienced varying degrees of fruit drop. To enhance the model’s applicability in real-world scenarios, a total of 1200 images were captured under different conditions, including varying distances, weather conditions, lighting conditions, occlusion situations, viewing angles, and fruit density levels, with 4096 × 3072 pixels resolution. Each image contains both citrus fruits on the tree and those that had fallen on the ground. Some sample images are shown in Figure 1.

2.2. Dataset Annotation and Construction

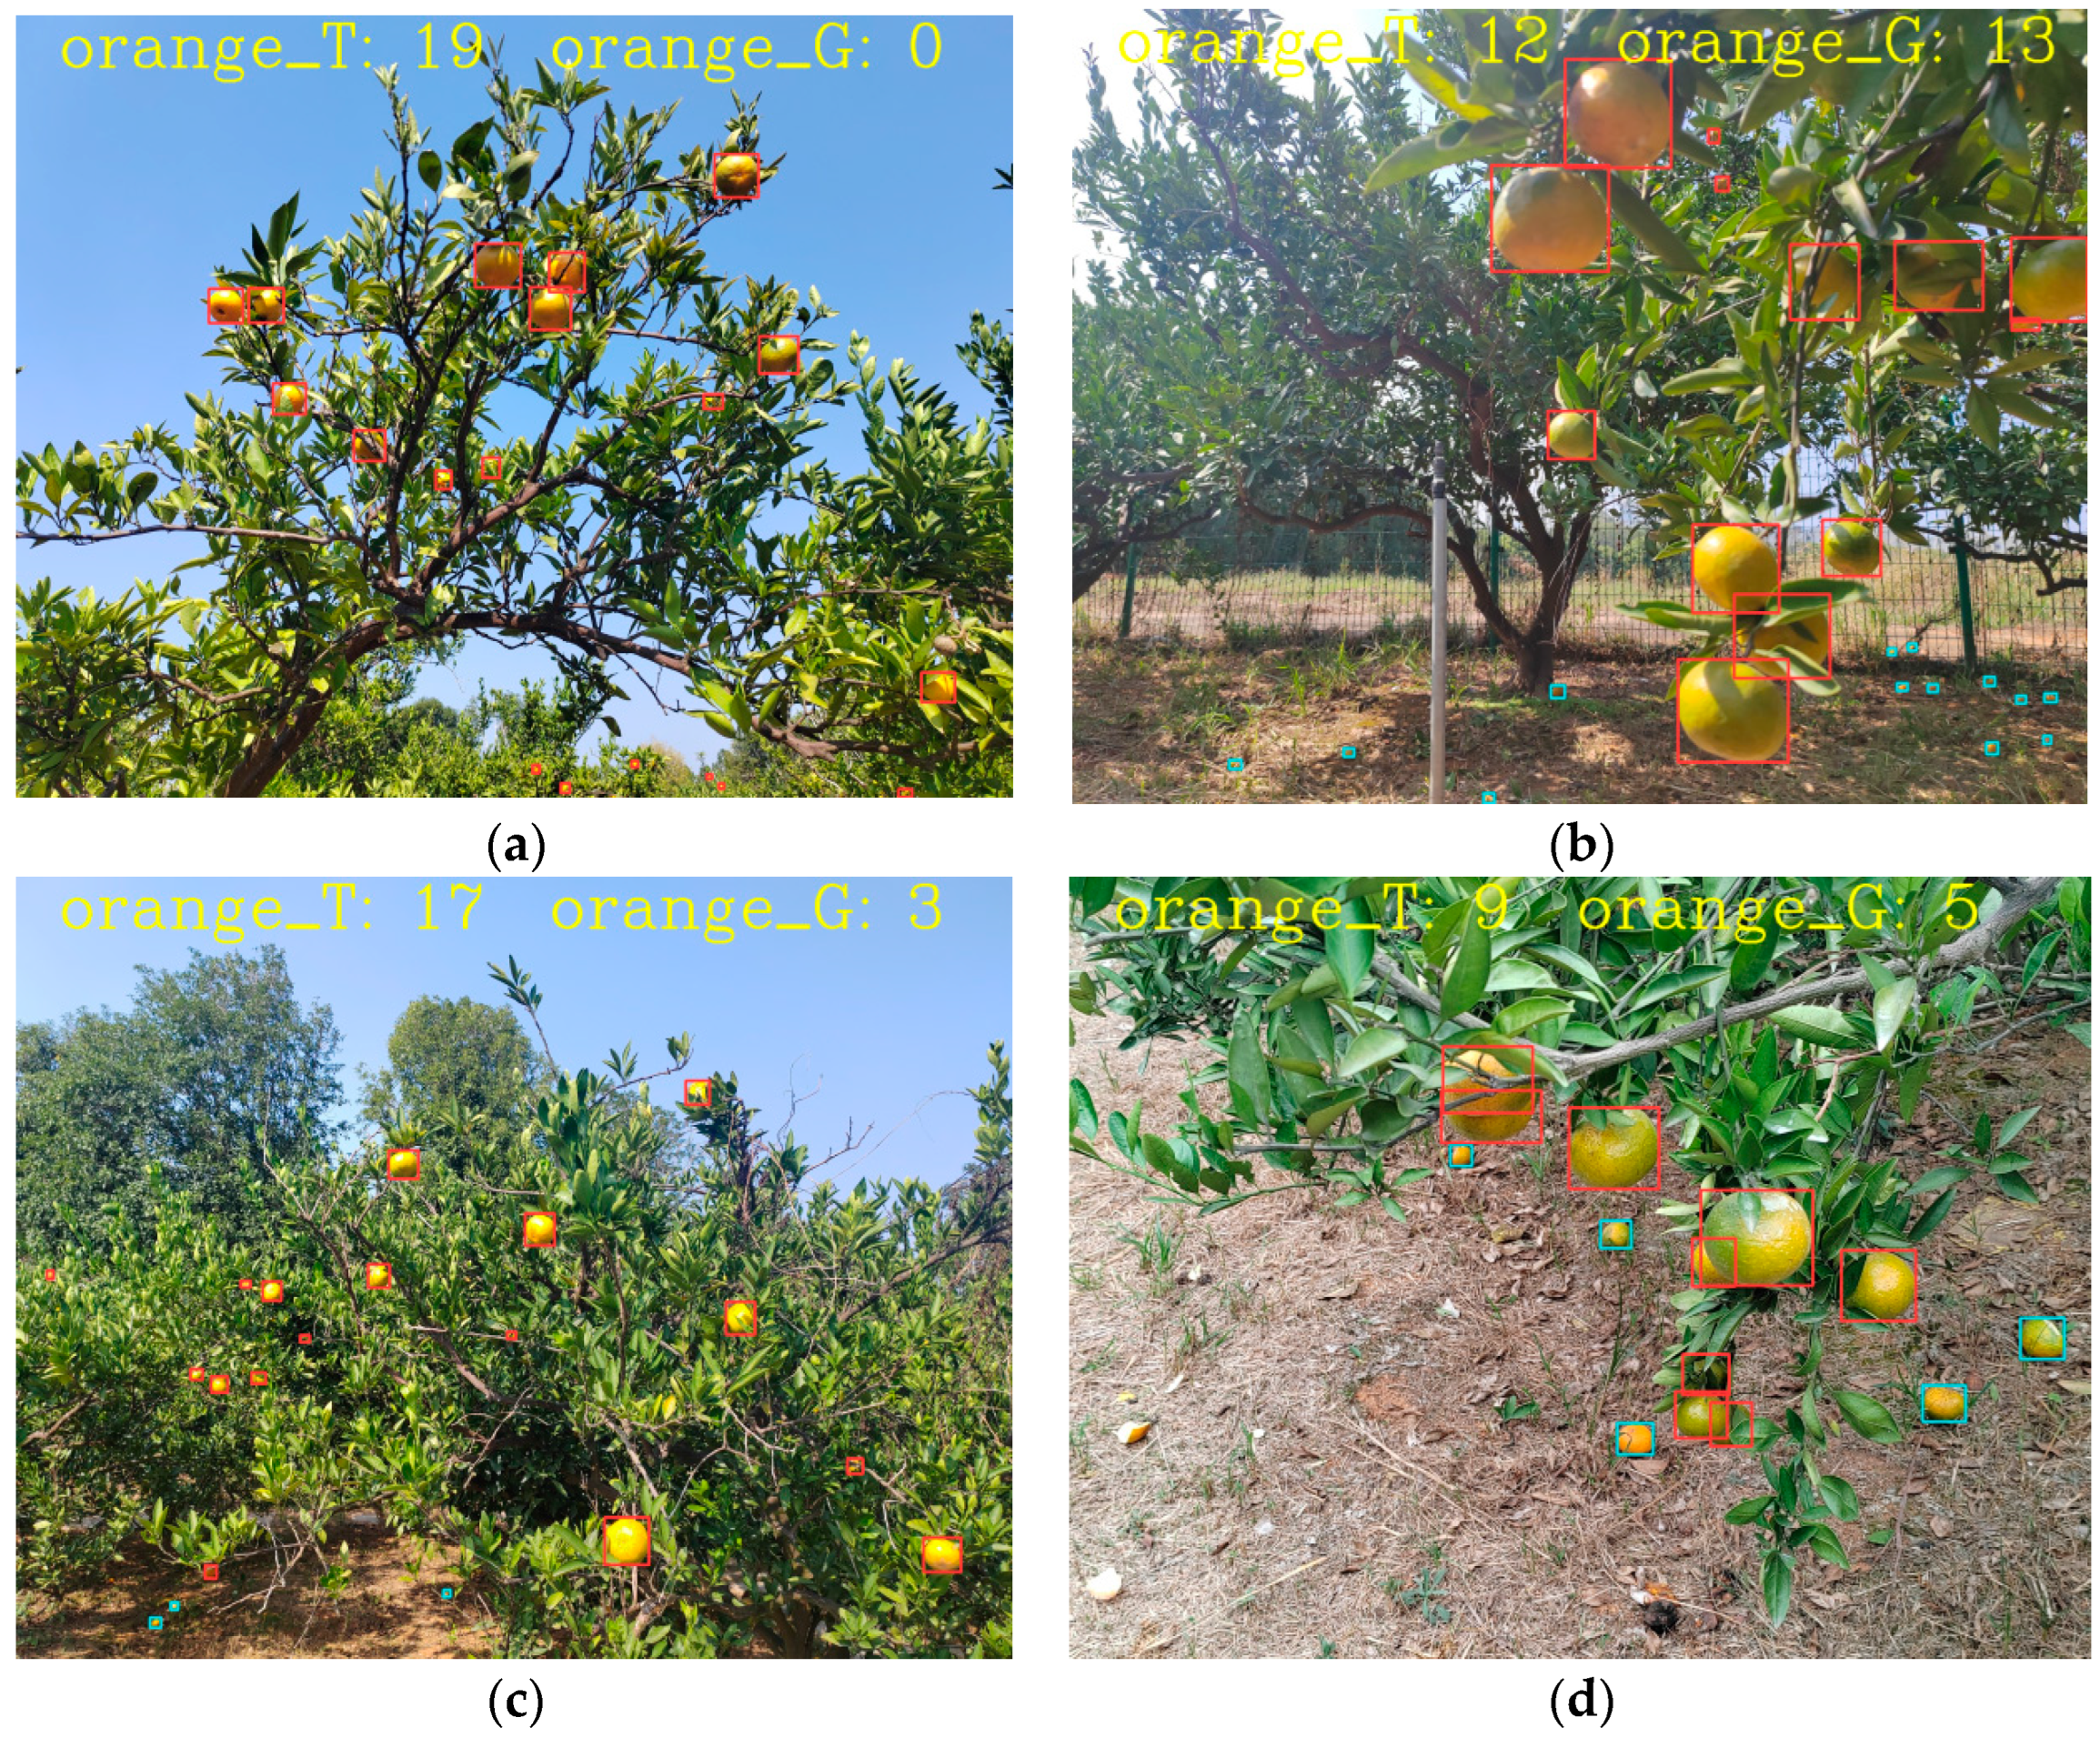
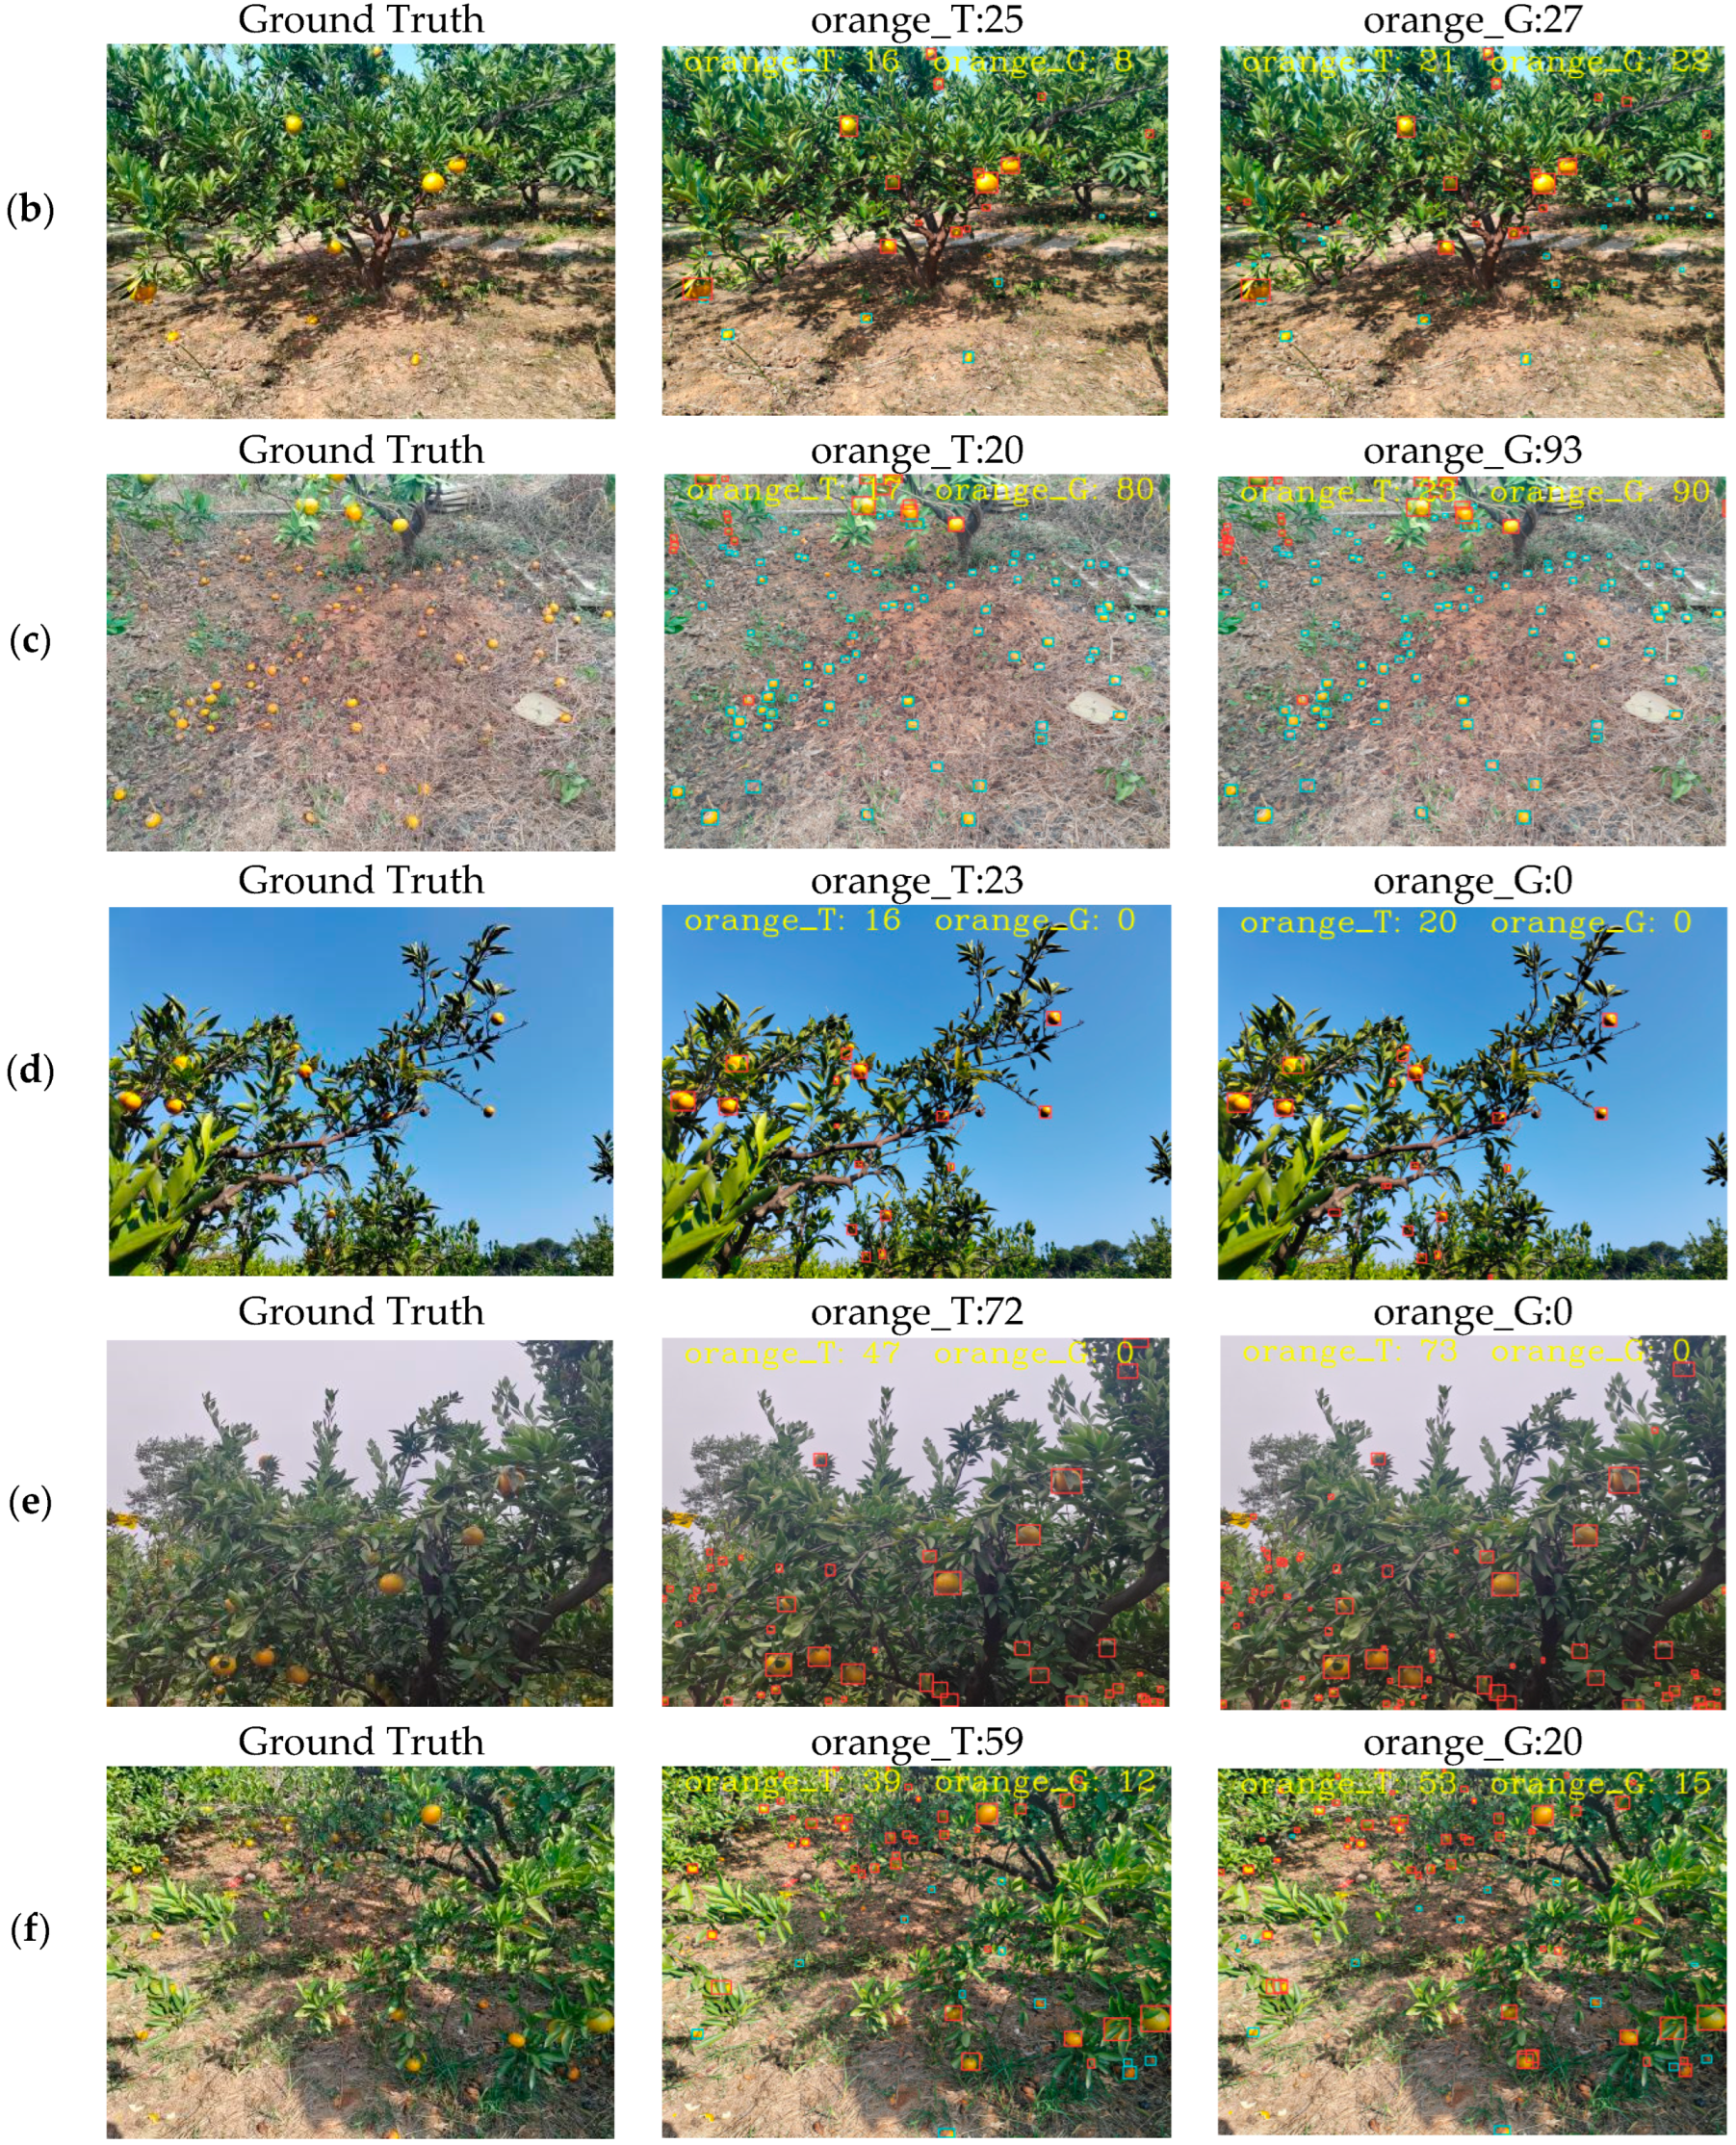
Two categories were established: the on-tree fruit (named “orange_T”) and those that had fallen to the ground (named “orange_G”). The dataset annotation process was executed utilizing LabelImg image annotation software (1.8.0). The dataset was divided into training, validation, and test subsets at a ratio of 8:1:1. To strengthen the robustness and generalization capability of the network model, we deployed a comprehensive data augmentation process, encompassing six transformation techniques: spatial translation, rotation variation, geometric flipping, strategic cropping, brightness adjustment, and Gaussian noise injection. This series of measures effectively enhanced the model’s robustness, enabling it to better cope with complex and varied data environments [23,24].

2.3. Data Analysis

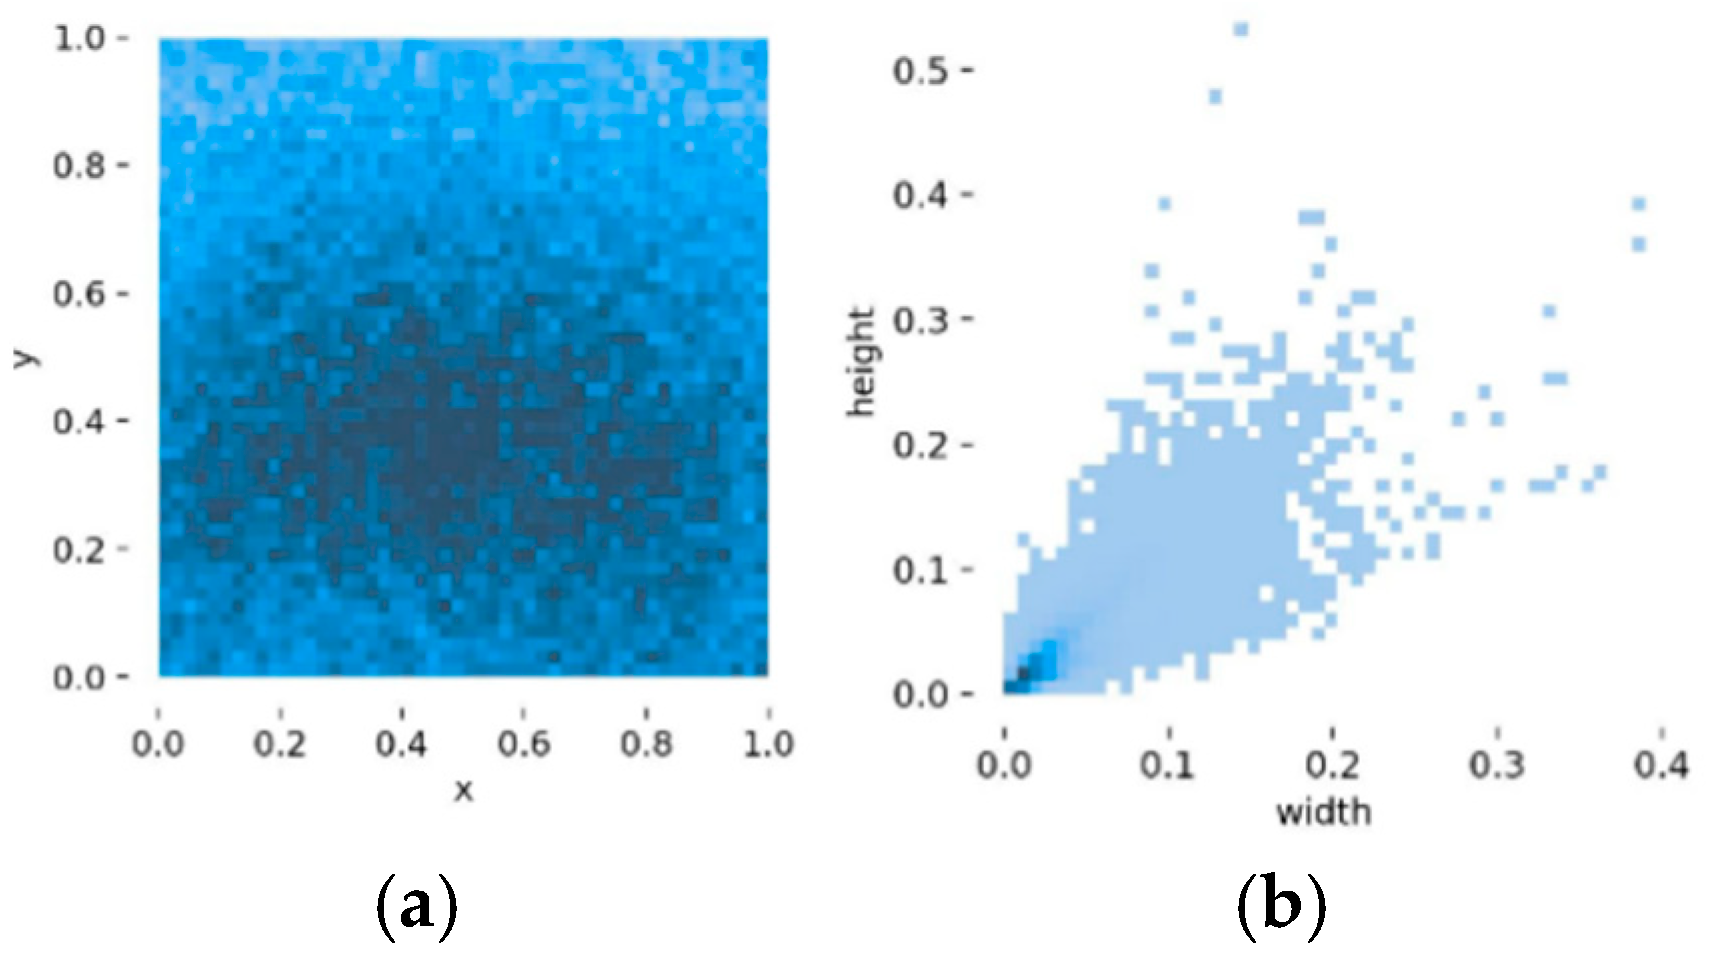
Quantitative analysis of the spatial characteristics reveals several significant findings. Figure 2a presents the spatial distribution analysis of citrus bounding boxes, demonstrating a predominantly uniform distributional pattern with no significant clustering phenomena. Figure 2b illustrates the dimensional analysis of bounding box relative sizes within the image space, revealing a notable concentration of dimensions within the 0–0.01 range. This distribution pattern indicates a predominance of small-scale target objects within our dataset, a characteristic that potentially introduces challenges for detection accuracy. These observed distributional characteristics can be attributed to multiple interconnected factors, including, but not limited to, established citrus cultivation methodologies, inherent growth patterns, and viewpoint constraints during data acquisition, all of which contribute to the complexity of the model’s detection parameters.

2.4. YOLOv11 Network Architecture

YOLOv11 represents the latest evolution in the YOLO (You Only Look Once) object detection algorithm series. In comparison to its antecedents, it introduces sophisticated architectural paradigms and technological innovations, demonstrating substantial enhancements in both model accuracy and computational efficiency [25,26]. The YOLOv11 framework encompasses five distinct model variants—n, s, l, m, and x—characterized by incrementally increasing network depth and detection precision, strategically designed to accommodate diverse application scenarios. Based on a comprehensive consideration of factors such as detection accuracy, model complexity, and hardware compatibility, we selected YOLO11s from these variants as the foundational architecture for our research [27].
The framework of YOLOv11 comprises three fundamental components: the backbone, neck, and head. The backbone, responsible for feature extraction, implements the classical Darknet-53 deep residual network architecture, incorporating strategically designed convolutional layers with diverse kernel scales to facilitate comprehensive multi-scale feature capture. Notably, the C3k2 module has been integrated, leveraging its demonstrated capability in synthesizing high-level features with contextual information to enhance detection precision. Consequently, YOLOv11 implements a sophisticated modification to the CSPLayer, substituting the conventional C2f module with the more advanced C3k2 module. Following multiple convolutional operations, YOLOv11 incorporates the SPPF module to expand the receptive field and capture hierarchical features in complex environmental scenarios.
The neck component orchestrates sophisticated feature fusion, utilizing path aggregation networks and C3k2 modules to integrate multi-scale feature maps generated across various stages of the backbone, thereby enhancing the network’s capability to capture features across diverse spatial scales. The head component maintains a meticulously designed decoupled architecture, bifurcating into classification and localization prediction branches to effectively mitigate inherent task conflicts between classification and localization objectives. Furthermore, the classification detection head implements an innovative substitution of the conventional dual 3 × 3 convolutions with two depth-separable convolutions comprising DWConv and 1 × 1 convolutions, resulting in substantial optimizations in both model parameterization and computational requirements.

2.5. YOLO-MECD Model

Although YOLOv11 is designed as a general-purpose object detection model and demonstrates excellent performance, it can still be further optimized for citrus detection tasks by addressing specific target characteristics, such as the significant variation in fruit size, complex occlusion, and similar color and texture patterns, to enhance detection accuracy and adaptability. Consequently, YOLO-MECD, an enhanced derivative of YOLOv11s, was proposed by us. This novel model improved detection precision at a small size. The specific architectural enhancements encompass the following modifications:
(1) Implementation of the EMA attention mechanism to supersede the original C2PSA attention mechanism, facilitating enhanced network feature extraction capabilities while reducing model parameters.
(2) Substitution of the conventional CIoU loss function with the MPDIoU loss function, resulting in improved model detection precision and accelerated convergence rates.
(3) Integration of the CSPPC architecture to replace the C3K2 structure in YOLOv11, effectively reducing the model’s parametric complexity.
(4) Optimization of convolution operations in the backbone component, simultaneously achieving significant parameter reduction while enhancing small object detection capabilities.
The architectural framework of the YOLO-MECD model is illustrated in Figure 3.

2.5.1. CSPPC Module

While reducing convolution operations in the backbone effectively diminishes model parameters and volume, it potentially results in increased GFLOPs. To enhance model efficiency without compromising detection precision, numerous researchers have implemented depth-wise convolution for feature extraction. Although this approach effectively reduces computational complexity, it simultaneously increases memory access requirements, resulting in diminished GFLOP efficiency. The C3K2 module in YOLOv11, incorporating multiple bottleneck modules, extracts comprehensive features but introduces excessive channel information redundancy. Consequently, certain channels may exhibit high similarity with others, resulting in redundant processing during forward propagation without contributing additional effective information, thereby increasing both computation and memory overhead.
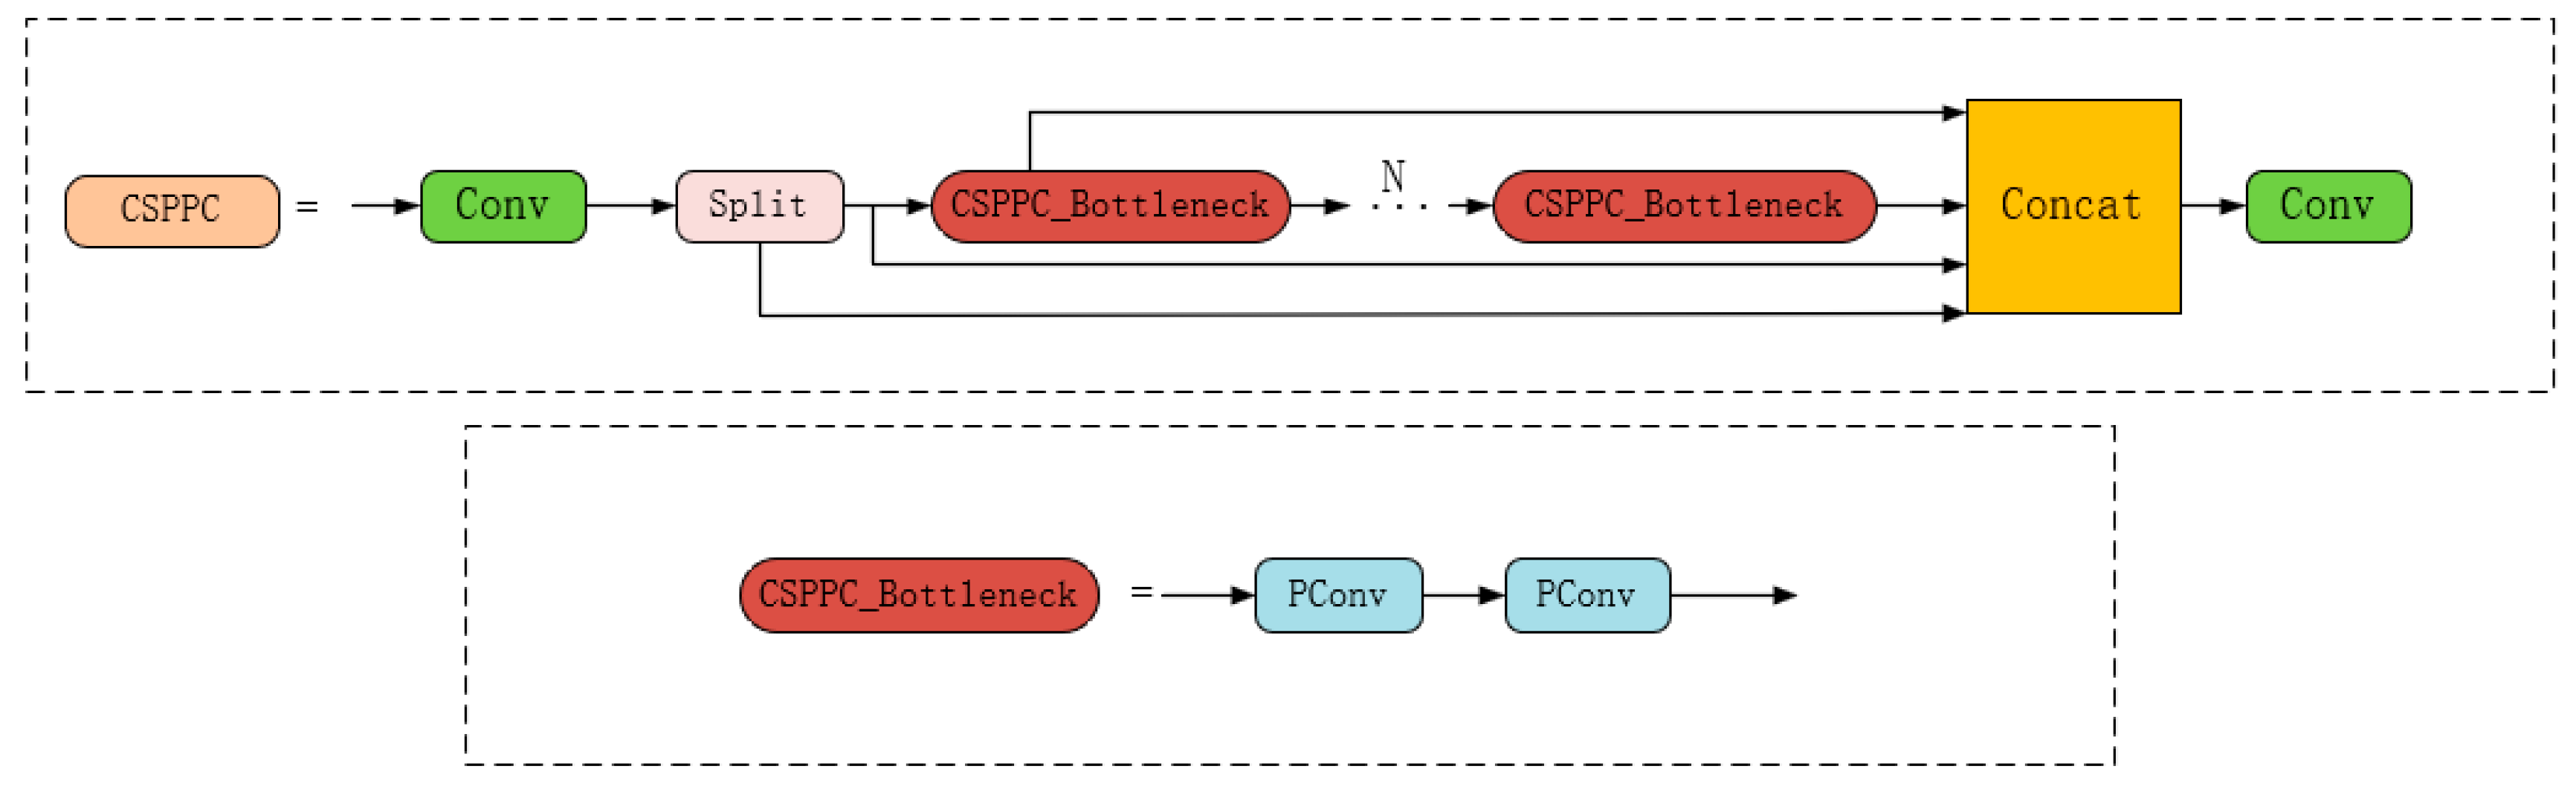
To conquer these limitations, this investigation implements PConv (partial convolution), a lightweight convolution structure characterized by high-speed inference capabilities [28]. Based on this architecture, we have developed the CSPPC structure to supersede the C3K2 module in YOLOv11. The architectural framework of the CSPPC structure is illustrated in Figure 4.
The fundamental architecture of PConv is predicated on the selective processing of a subset of input channels during convolution operations while maintaining channel integrity for non-processed channels. This innovative design paradigm achieves significant computational optimization through the elimination of redundant channel-wise calculations, facilitating enhanced spatial feature extraction efficiency while simultaneously improving real-time performance and model efficiency metrics without compromising operational capabilities.
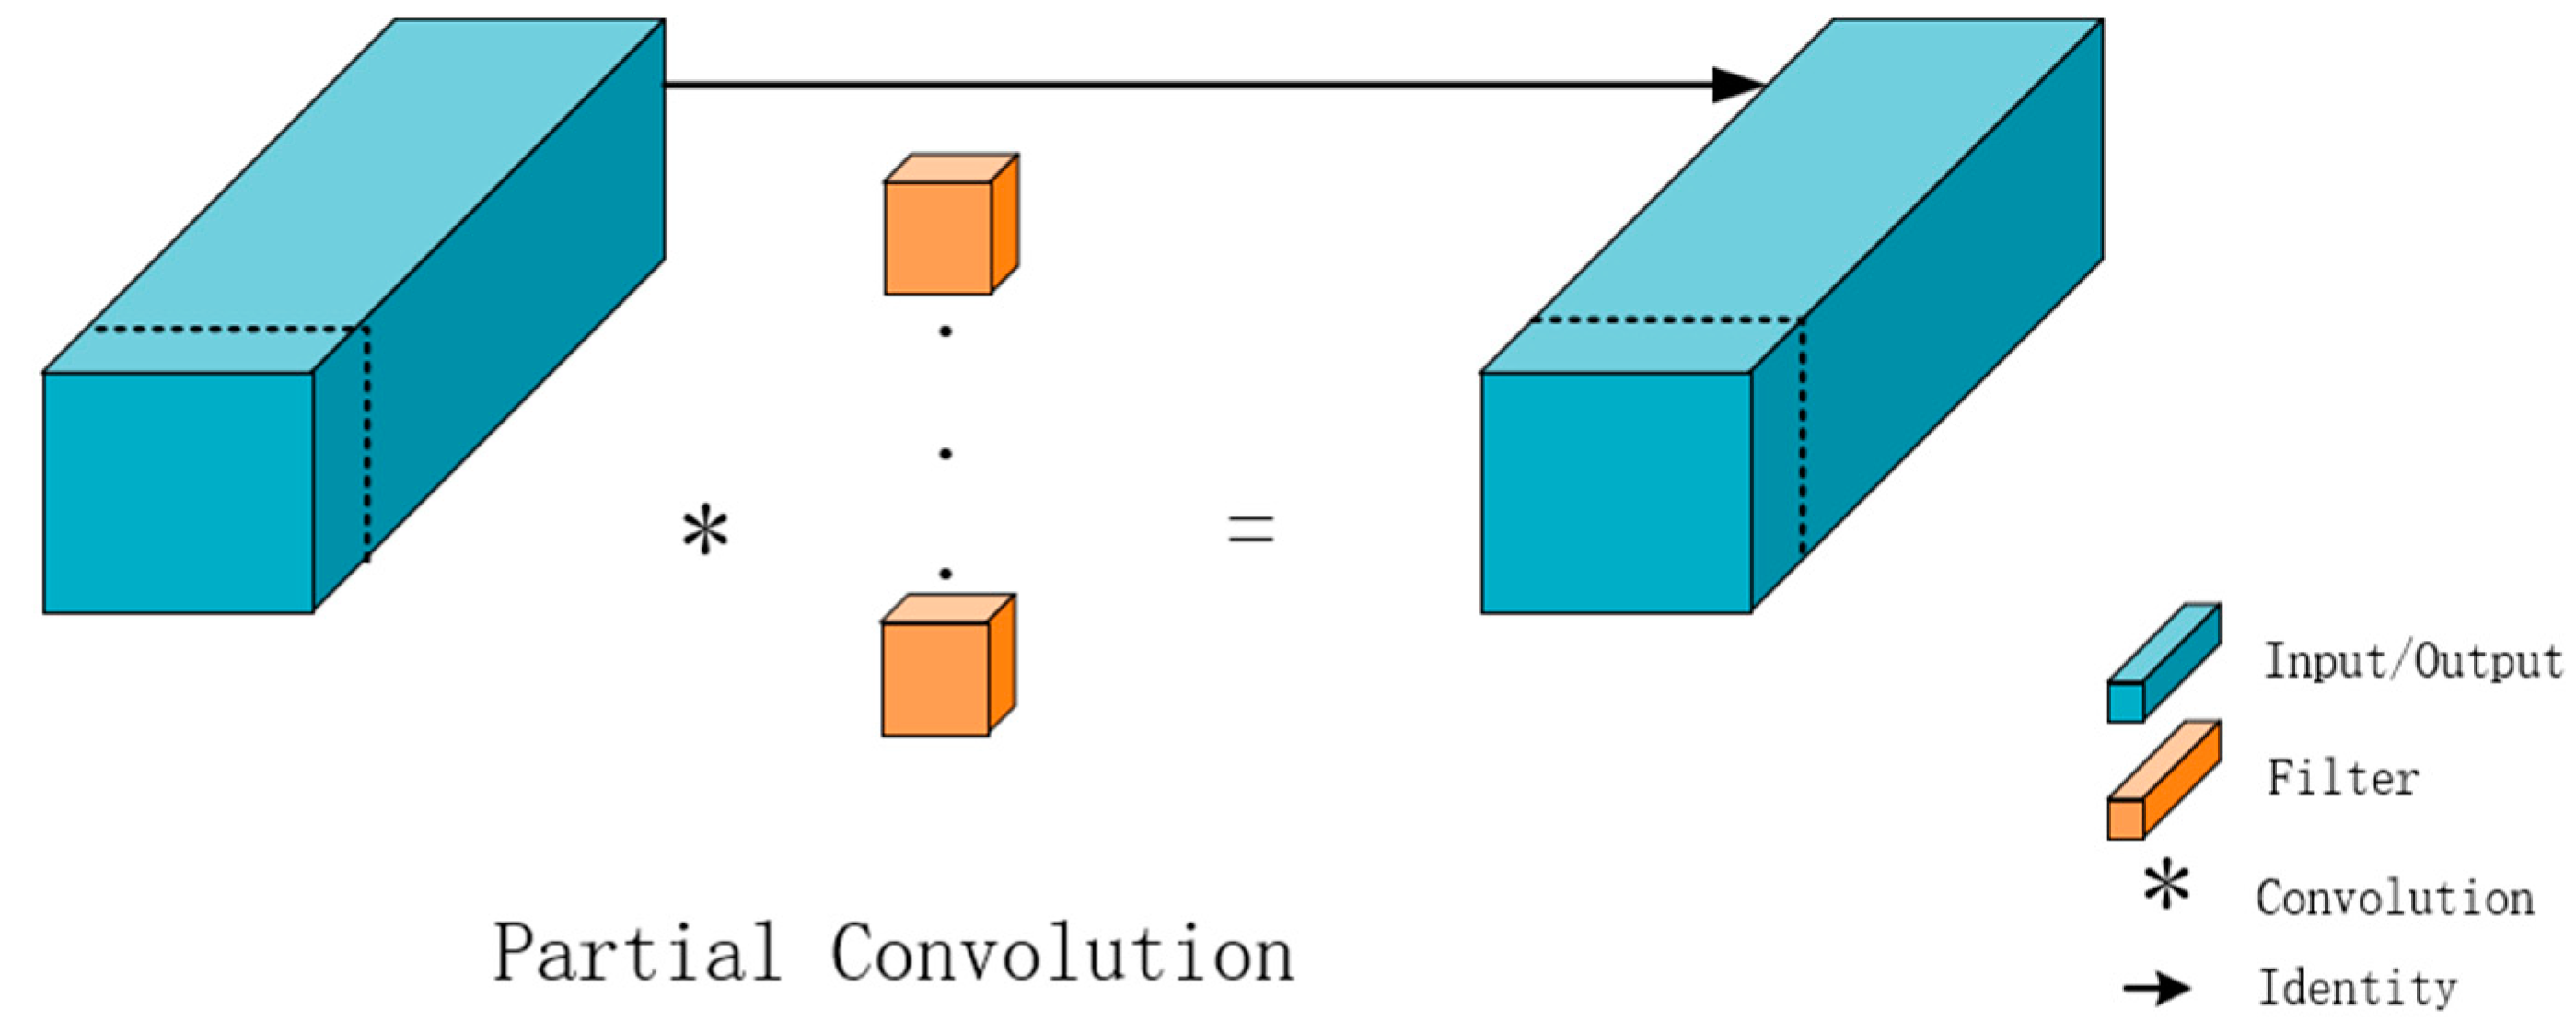
In quantitative terms, given feature map dimensions h and w, total channel count c, participating convolution channels c p , and convolution kernel dimension k, the computational complexity (FLOP) of the PConv module can be formally expressed through Equations (1) and (2). The architectural schema is presented in Figure 5.
F p c o n v = h × w × k 2 × c p       2
r = c p c
The implementation of PConv with a 1/4 convolution ratio demonstrates a remarkable reduction in computational complexity, achieving GFLOPs equivalent to 1/16 of conventional convolution operations, thereby substantially optimizing the detection model’s FLOP efficiency. Moreover, the selective engagement of cp channels in spatial feature extraction, while maintaining downstream feature channel integrity, facilitates substantial optimization of both computational requirements and memory access patterns.
The CSPPC module’s architectural innovation, characterized by the substitution of conventional convolution operations with PConv within the C3K2 framework and the integration of a dual-branch structural paradigm, achieves enhanced feature extraction capabilities while simultaneously implementing significant reductions in both parametric complexity and GFLOPs, culminating in a more efficient lightweight model architecture.

2.5.2. EMA Attention Mechanism

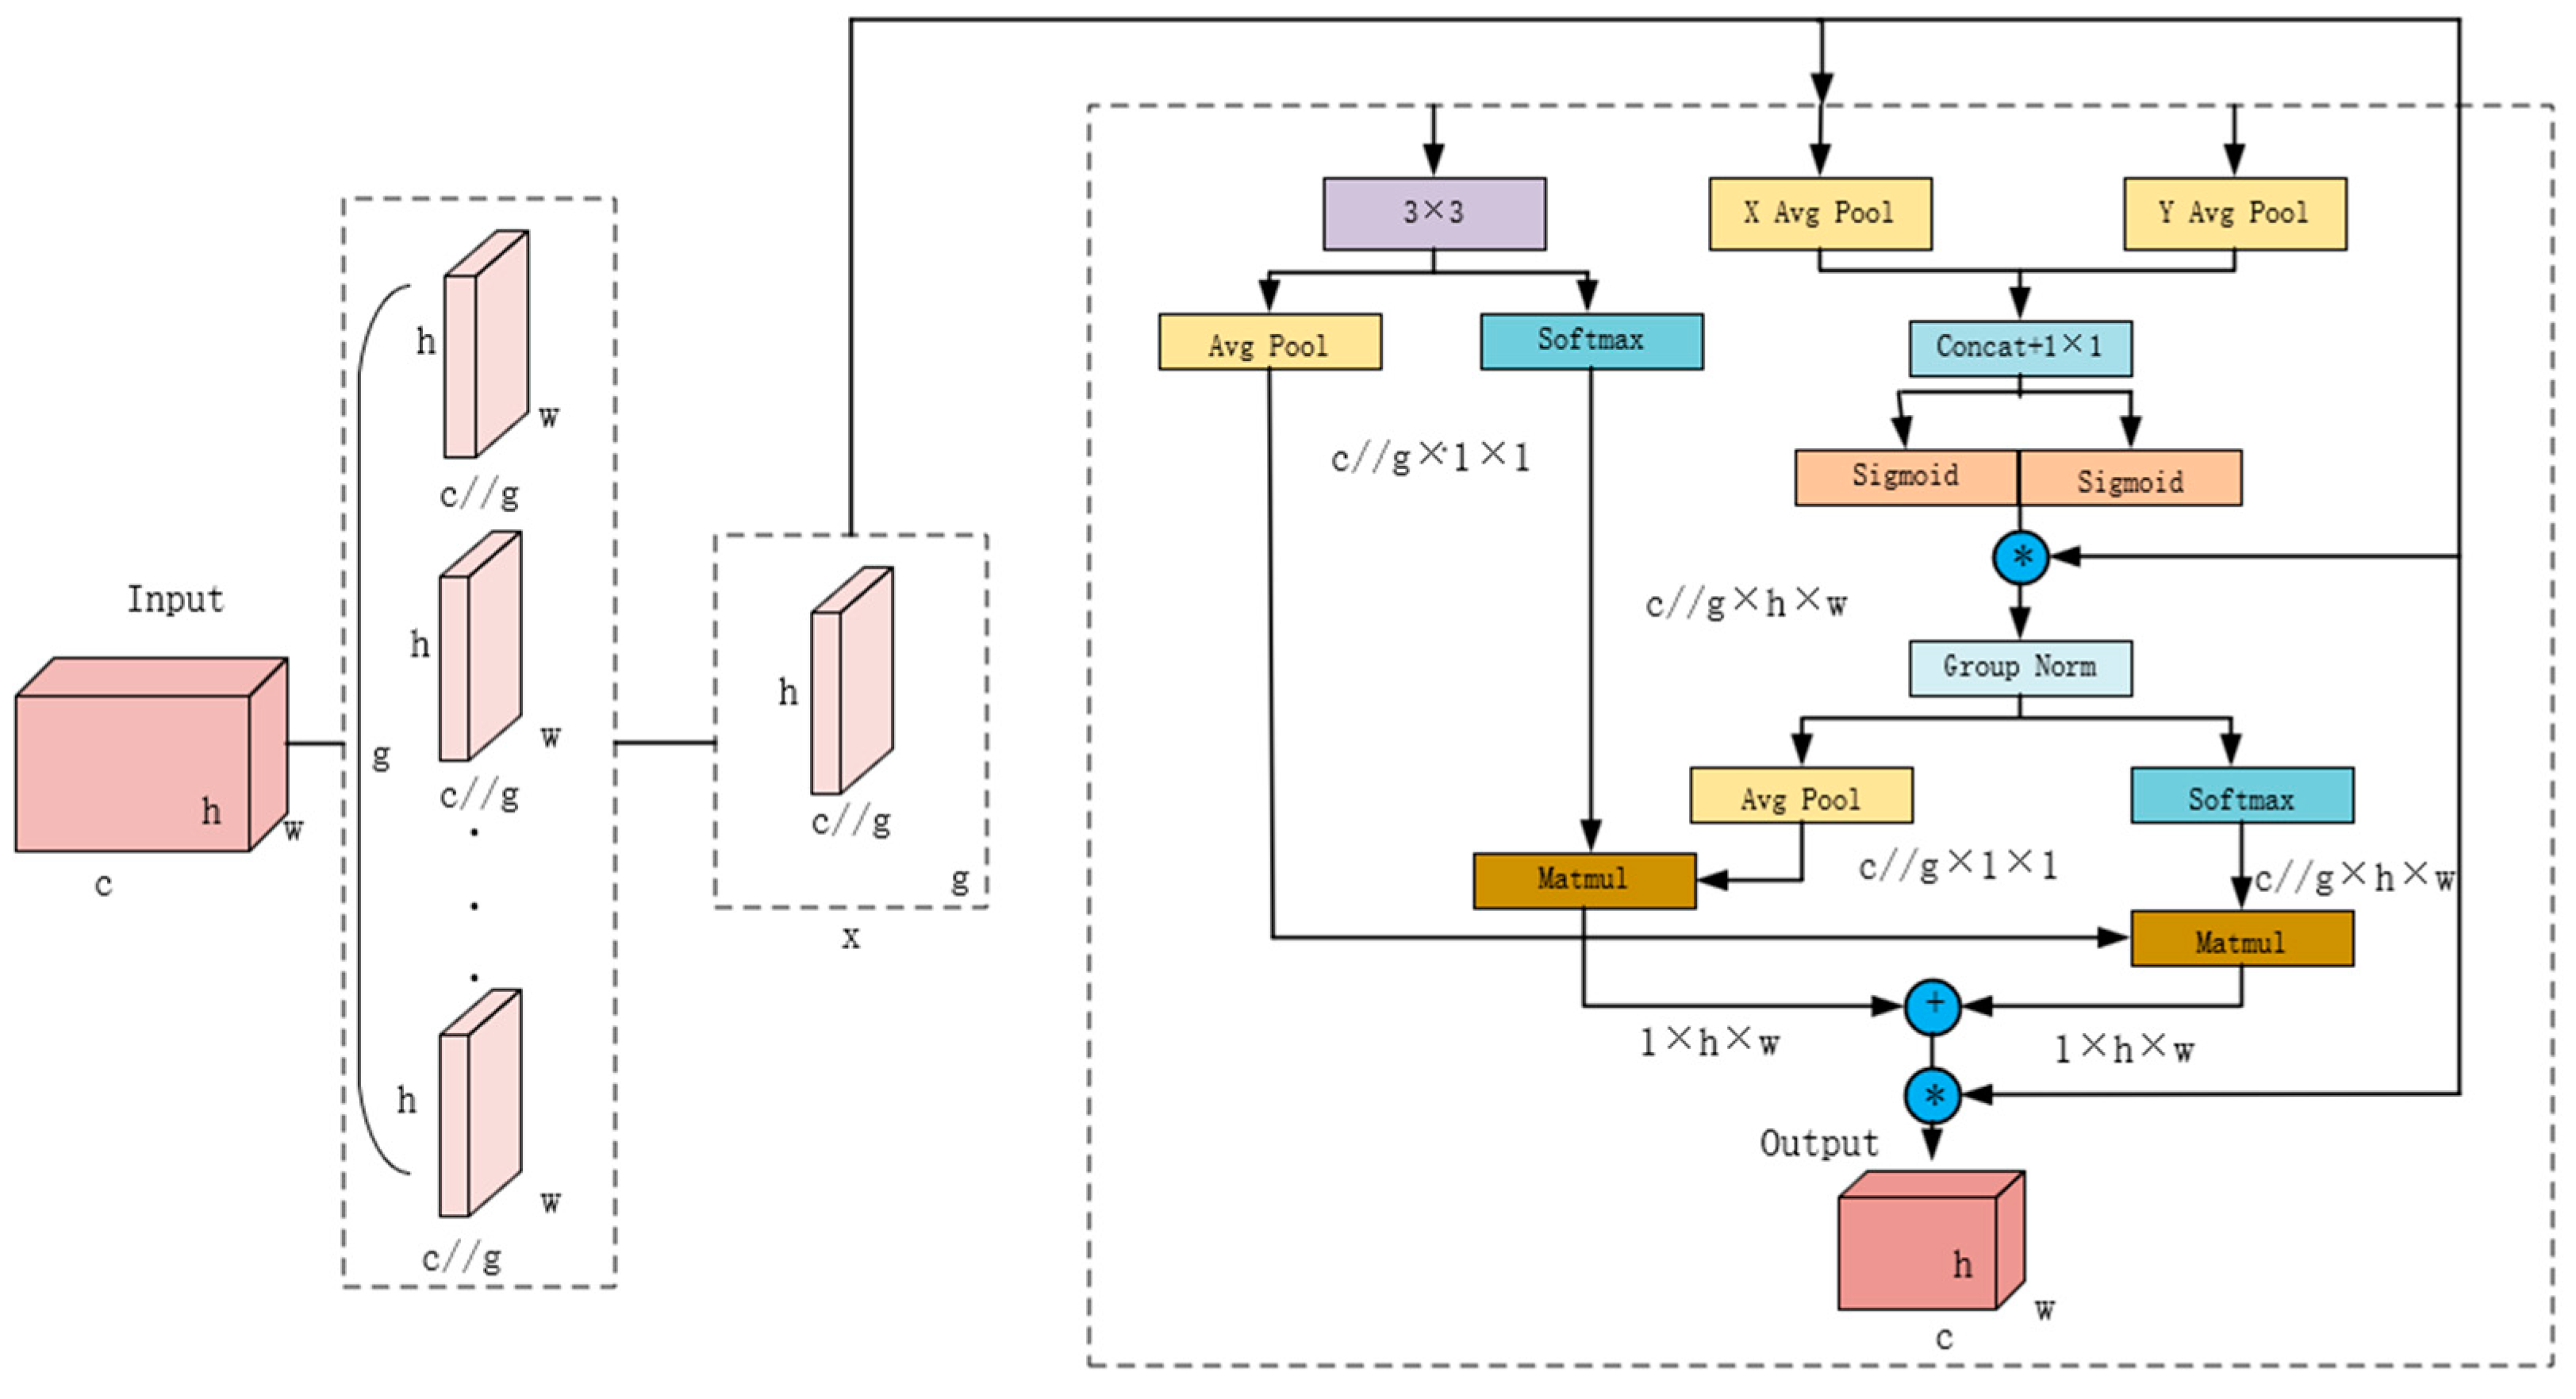
The attention mechanism serves as a critical architectural component facilitating selective feature emphasis, enabling the model to prioritize salient image characteristics while attenuating non-pertinent background information, thereby enhancing both detection performance metrics and generalization capabilities. EMA (efficient multi-scale attention) represents an optimized multi-scale attention module whose foundational principle is predicated on achieving efficient cross-channel learning through strategic channel reorganization and grouping methodologies while maintaining model complexity constraints [29]. The architecture of the EMA attention mechanism is shown in Figure 6.
The architectural framework incorporates multiple operational components: “X Avg Pool” and “Y Avg Pool” denoting one-dimensional horizontal and vertical global pooling operations, respectively; Conv representing convolutional operations; Matmul indicating matrix multiplication; GroupNorm signifying normalization procedures; Reweight representing weight redistribution; Groups denoting grouped convolution operations; and Sigmoid and Softmax functioning as activation functions. The asterisk * denotes the fusion of inputs directed towards the asterisk *.
In the feature grouping domain, input feature maps undergo strategic partitioning into g sub-features for diverse semantic information extraction, maintaining the relationship g<<C.
In the parallel sub-network section, EMA extracts attention weights of grouped feature maps through three parallel paths, where two paths adopt 1 × 1 convolution branches while the third path employs a 3 × 3 convolution branch. To capture cross-channel dependencies and alleviate the computational burden, EMA models the interaction of cross-channel information along the channel dimension. Specifically, in the 1 × 1 branches, two one-dimensional global average pooling operations are utilized, aggregating two channel attention maps within each group through multiplication to achieve cross-channel feature interaction. In the 3 × 3 branch, a 3 × 3 convolution is employed to capture local cross-channel interaction information, further expanding the feature space.
Additionally, the EMA architecture integrates cross-spatial learning mechanisms, facilitating the aggregation of multi-dimensional cross-spatial information to achieve comprehensive feature integration and enhanced network feature extraction capabilities.

2.5.3. MPDIoU Loss Function

The loss function represents an integral architectural component in detection model frameworks, serving as a critical metric for the quantitative assessment of prediction effectiveness. The function exhibits inverse proportionality between its magnitude and the spatial proximity of predicted bounding boxes to their corresponding ground truth coordinates. YOLOv11 employs the CIoU (complete intersection over union) boundary loss function, which can be formally expressed through the following mathematical formulation:
L C I O U = 1 I O U + P 2 B g t , B p r d c 2 + a v
V = 4 Π 2 ( t a n 1 W t H t t a n 1 W H ) 2
a = v 1 I O U + v
where W and H represent the width and height of the predicted citrus bounding box, Wt and Ht denote the width and height of the ground truth bounding box, Bprd and Bgt represent the centroids of the predicted and ground truth bounding boxes, respectively; ρ indicates the Euclidean distance between Bprd and Bgt; c represents the diagonal distance of the smallest enclosing box containing both predicted and ground truth boxes; IoU (intersection over union) quantifies their degree of overlap. LCIoU represents the CIoU loss function. As evident from Equations (3)–(5), when the aspect ratios of predicted and ground truth boxes are identical, ν equals zero. Under these conditions, the effectiveness of the CIoU loss function is compromised, resulting in varying sensitivities to objects of different scales, particularly disadvantageous for small object localization. However, given the prevalence of small objects in our custom citrus dataset, utilizing this loss function frequently results in detection omissions.
To effectively address this limitation, we introduce the MPDIoU loss function [
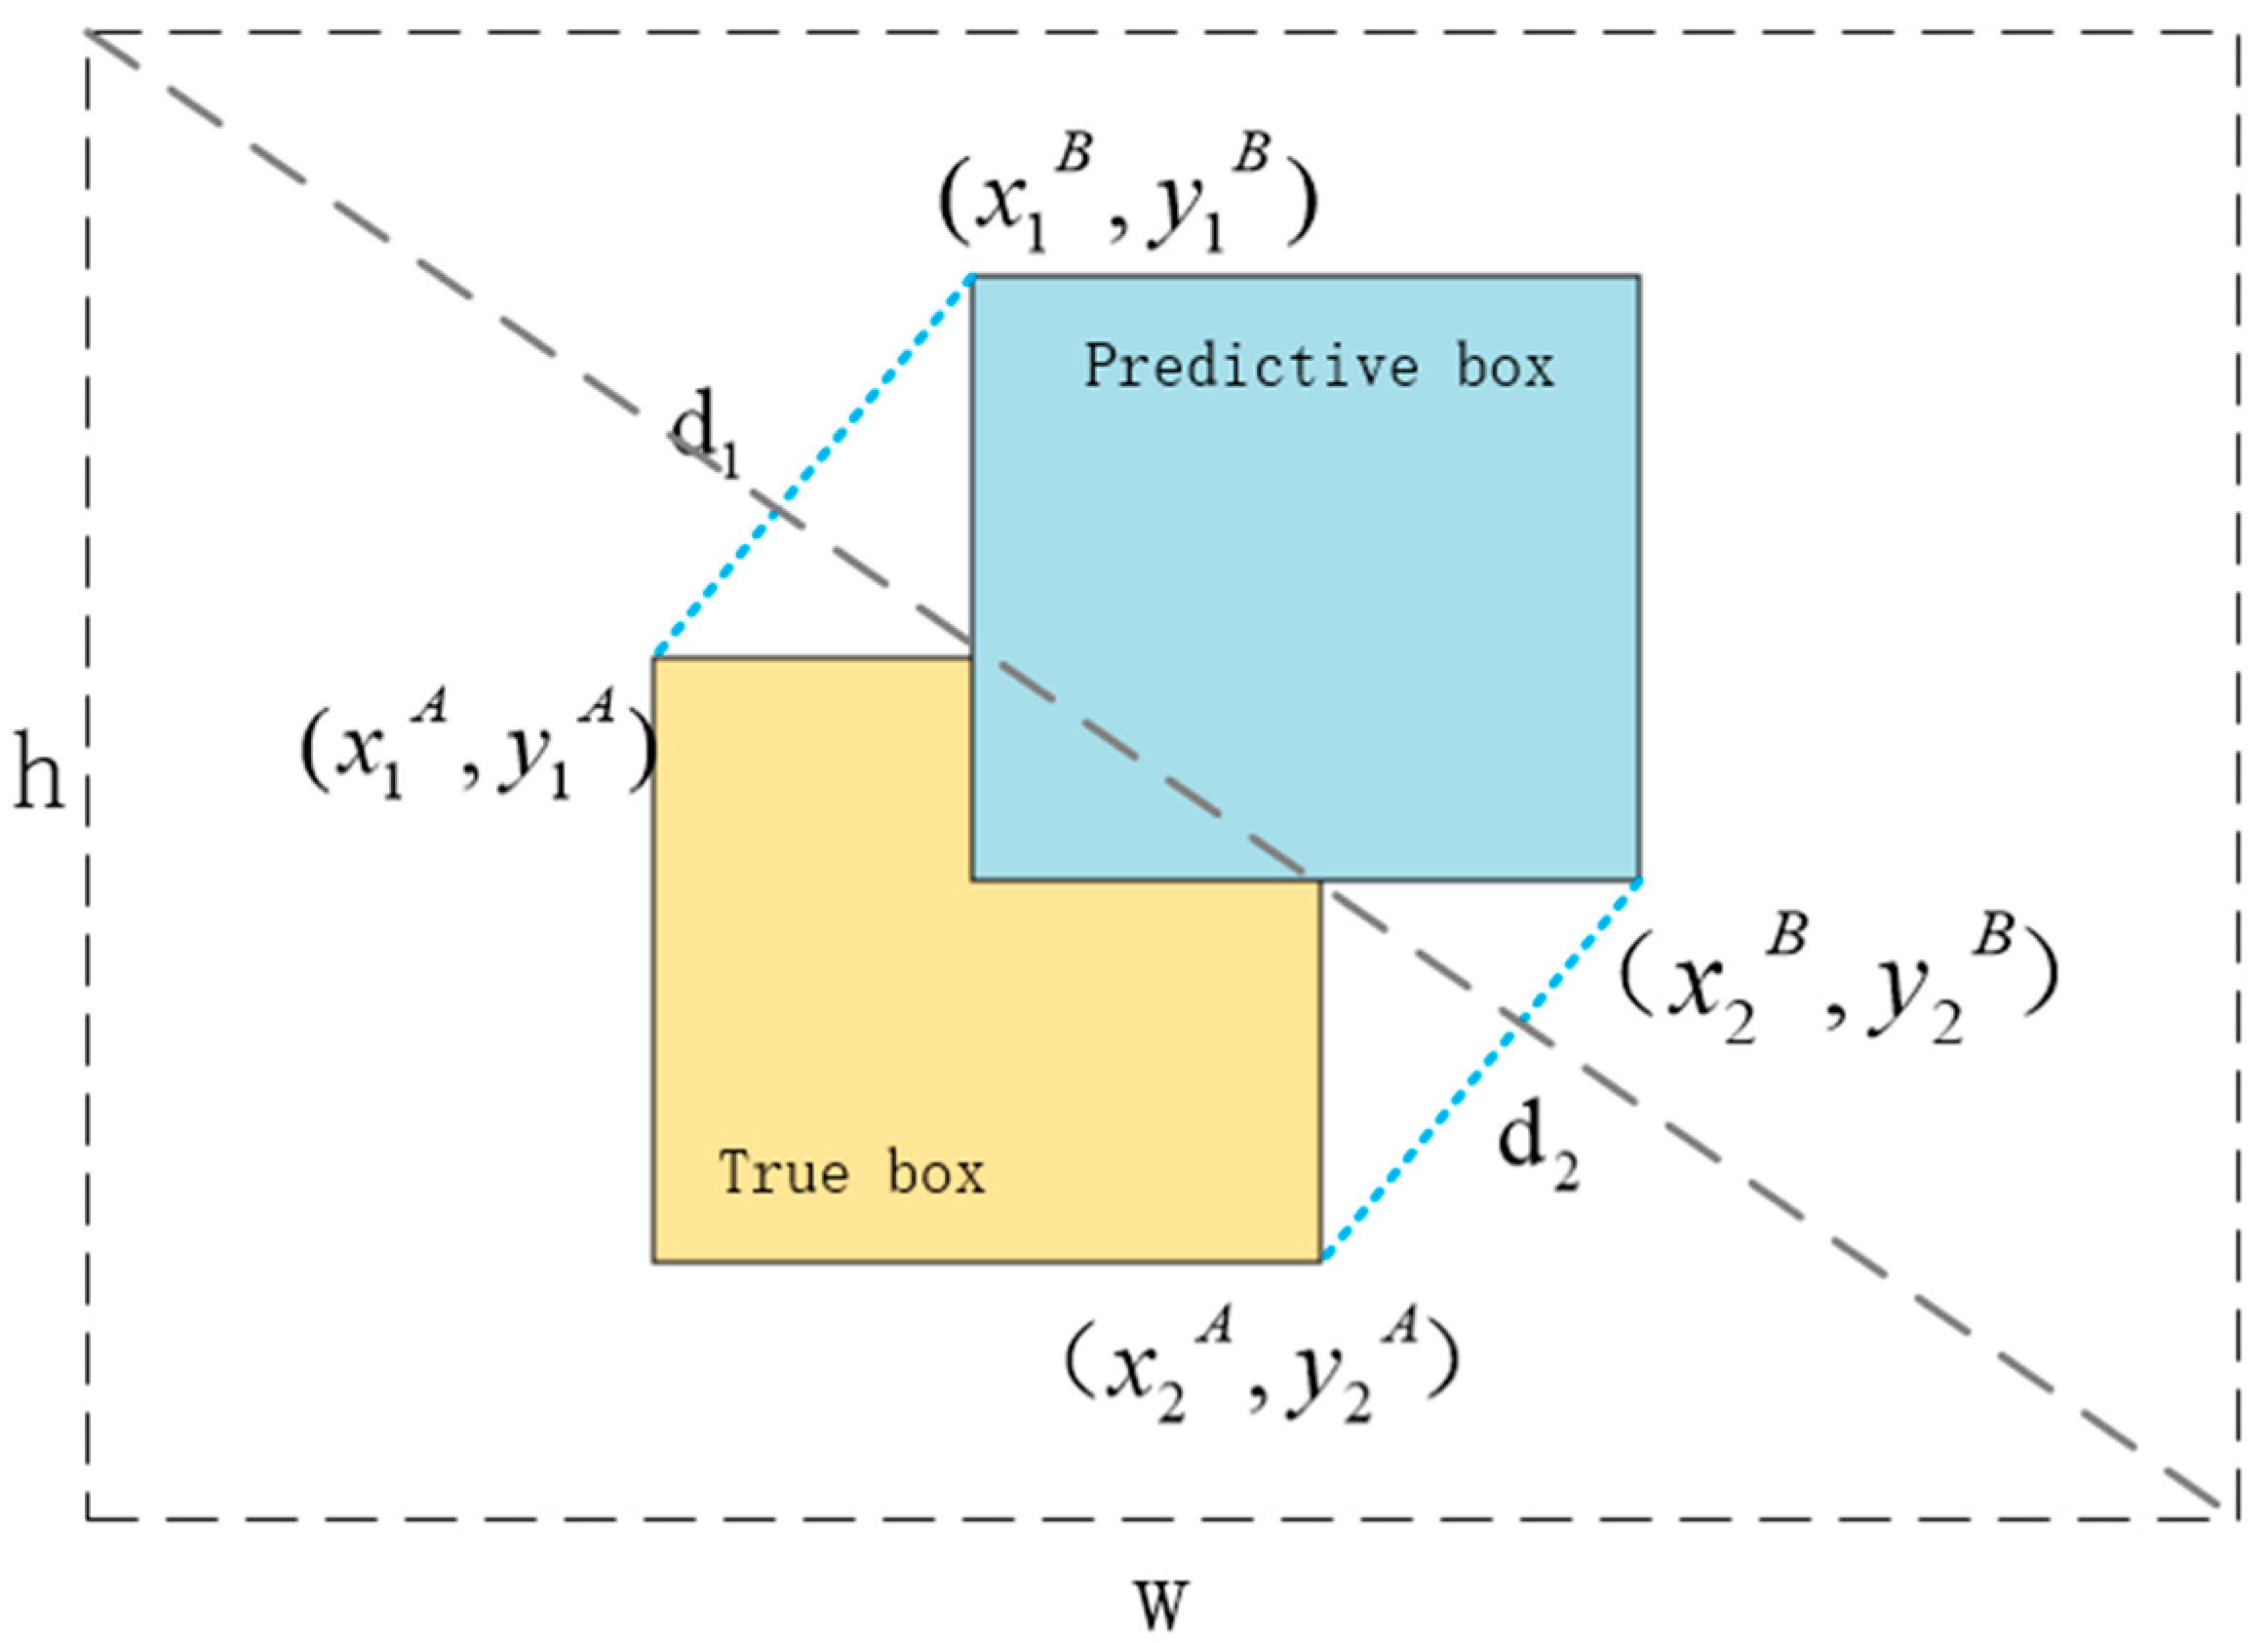
30]. The MPDIoU loss function encompasses all relevant factors typically considered in other loss functions, providing a more comprehensive approach to object detection boundary refinement. MPDIoU simplifies similarity comparisons between two detection boxes, applicable to both overlapping and non-overlapping boundary box regression. The computational principles of MPDIoU are illustrated in Figure 7. It enhances prediction accuracy and accelerates model regression convergence by calculating the minimum point distance between predicted and actual boxes as a similarity metric. The mathematical formulation of MPDIoU is expressed as follows:
d 1       2 = ( x 1     B x 1     A ) 2 + ( y 1       B y 1     A ) 2
d 2       2 = ( x 2     B x 2     A ) 2 + ( y 2       B y 2     A ) 2
L M P D I O U = 1 A B A B + d 1     2 w 2 + h 2 + d 2     2 w 2 + h 2
where variables d1 and d2 represent the distances between the top-left and bottom-right corners of ground truth box A and the predicted box B, respectively. w and h denote the width and height of the input image. (x1B, y1B) and (x2B, y2B) represent the coordinates of the top-left and bottom-right corners of the predicted box, respectively.

2.5.4. Reconstruction of Detection Layer

The YOLOv11 network detection layer architecture is illustrated in Figure 8a. Following feature fusion, the feature maps output by detection heads p3, p4, and p5 exhibit dimensions of 80 × 80, 40 × 40, and 20 × 20 pixels, respectively, corresponding to small, medium, and large targets. In the feature maps output by detection heads p3, p4, and p5, each pixel represents information from 32 × 32, 16 × 16, and 8 × 8 pixel regions of the input network image, respectively. However, numerous target objects in the image possess dimensions smaller than 8 × 8 pixels, resulting in relatively limited detail information in the output feature maps, consequently leading to suboptimal detection accuracy for small targets and significant detection omissions.
To enhance small target detection capabilities, numerous researchers have implemented additional P2 detection heads specifically for small targets, as illustrated in Figure 8b. Through this approach, the output feature map dimensions are 160 × 160, 80 × 80, 40 × 40, and 20 × 20 pixels, respectively, enabling the effective detection of targets larger than 4 × 4 pixels in the input image, thereby significantly improving detection accuracy and reducing omission incidents. Although this methodology demonstrates substantial improvements in detection performance, it results in significant increases in both parameter count and computational complexity, unfavorable for model deployment on embedded devices and mobile platforms.
Based on these considerations, this investigation implements network structure optimization by reducing downsampling operations in the backbone network to decrease network layers, resulting in feature map dimensions of 160 × 160, 80 × 80, and 40 × 40 for P3, P4, and P5 detection heads, respectively, facilitating enhanced small target detection. The detection layer architecture is illustrated in Figure 8c. Compared to methods incorporating additional small target detection heads, this optimization achieves significant reductions in network layers, computational complexity, and parameter count, better aligning with practical application requirements.

2.6. Experimental Configuration

The experimental framework is implemented on a Windows 10 (Professional Edition) operating system, utilizing an Nvidia GeForce RTX 3060Ti (NVIDIA Corporation, Santa Clara, CA, USA) graphics processing unit with 12 GB VRAM capacity. The software infrastructure comprises CUDA 12.1, Python 3.12, and the PyTorch 2.3 deep learning framework. Training hyperparameters are configured with the following specifications: learning rate initialized at 0.0001, batch size of 16, weight decay coefficient of 0.0005, momentum parameter of 0.937, iteration count of 200, and SGD optimization algorithm. Consistency in dataset utilization and training configurations is maintained across all model implementations.

2.7. Evaluation Metrics

The precision (P), recall (R), mean average precision (mAP), F1 score, model size, parameter count, and GFLOPs were utilized to evaluate the result in this paper. Precision (P), a fundamental metric, quantifies the ratio of true positive predictions to total positive predictions, with higher values indicating enhanced model discrimination against false positive identifications. The mathematical formulation for precision computation is expressed as follows:
p r e c i s i o n = T P T P + F P × 100 %
Recall (R) quantifies the ratio of correctly identified positive samples to the total number of actual positive samples in the dataset. An elevated recall value indicates enhanced model proficiency in comprehensive target object detection. This metric can be mathematically formulated as:
r e c a l l = T P T P + F N × 100 %
mAP (mean average precision) quantifies the arithmetic mean of precision values across multiple categories, while the F1 score serves as a harmonized metric that integrates both precision and recall. Parameter count serves as a metric for architectural complexity, where reduced parameterization enables enhanced deployment capabilities on computationally constrained platforms. FLOPs provide a quantitative measure of computational complexity, where optimization of this metric facilitates efficient model execution in edge computing environments.
Within the context of the presented mathematical formulations, TP (true positive) denotes the cardinality of correctly classified positive instances, FP (false positive) represents the quantity of negative instances erroneously classified as positive, and FN (false negative) indicates the number of positive instances incorrectly classified as negative.

3. Results

3.1. Performance of YOLO-MECD Network

The experimental results demonstrate that the improved YOLO-MECD model performs exceptionally well in citrus detection tasks, achieving an accuracy (P) of 84.4%, a recall rate (R) of 73.3%, and a mean average precision (mAP) of 81.6%. By comparing the performance of YOLO-v11s and YOLO-MECD on precision curves, recall curves, mAP curves, and loss curves (as shown in Figure 9), it is evident that the improved model shows significant enhancements in all three key metrics: precision, recall, and mAP. Additionally, the convergence speed of the loss function is noticeably faster, indicating higher efficiency and stability during the training process. These improvements fully validate that the YOLO-MECD model possesses stronger detection capabilities and practical utility in citrus target detection tasks.
Figure 10 illustrates the detection performance of the YOLO-MECD model under different scenarios. The specific numerical values are shown in Table 1. (a) demonstrates the detection results of upward-angle conditions, where nineteen citrus fruits were successfully detected, with even small, distant fruit targets not being missed. (b) presents the detection effectiveness in wide-angle and backlighting conditions, successfully detecting 12 larger but partially occluded hanging fruits and 13 fallen fruits at a distance with small targets. (c) shows the detection performance under clear-sky and front-lighting conditions, where, despite some occlusion and small targets, 17 hanging fruits and 3 fallen fruits were accurately detected. (d) displays the detection results under overcast and downward-angle conditions, where the model could still effectively identify targets with partial occlusion and overlap, successfully detecting nine hanging fruits and five fallen fruits.

3.2. Ablation Experiment

Through an ablation study, we can more clearly understand the specific contributions of each module in improving model performance. The ablation experiment results are shown in Table 2, where “x” indicates the non-use of a particular module, and “√” indicates that the module was used. In Table 2,
  • YOLO-M represents the model with the MPDIoU loss function;
  • YOLO-E represents the model with the EMA attention mechanism;
  • YOLO-C represents the model introducing the CSPPC module;
  • YOLO-D represents the model reconstructing the detection layer;
  • YOLO-MECD combines all four of the aforementioned improvements.
As shown in Table 2, after replacing the original CIoU loss function in YOLOv11 with the MPDIoU loss function, despite a 0.3% decrease in precision, the recall and mAP improved by 0.7% and 0.2%, respectively, while maintaining the same parameter count and computational complexity. This indicates that the MPDIoU loss function can effectively enhance the model’s detection performance and accelerate model convergence. After substituting the original C3K2 attention mechanism with the EMA attention mechanism, the parameter count and computational complexity were reduced by 10.5% and 3.2%, respectively, while precision and mAP increased by 1.1% and 0.2%. This improvement stems from the EMA attention mechanism’s ability to capture pixel-level pairwise relationships using the sigmoid function and highlight global context information across all pixels. By fusing context information at different scales, the CNN can achieve better pixel-level attention on high-level feature maps, thereby enhancing the network’s feature extraction capability through cross-spatial learning methods. After replacing all C3K2 modules with the CSPPC module, although precision, recall, and mAP remained almost unchanged, the parameter count and computational complexity were reduced by 17.9% and 7%, respectively. This is attributed to PConv, which processes only a portion of input channels during convolution operations while leaving other channels unchanged, thus avoiding redundant computations. Reducing the number of convolutions in the backbone led to a 69.4% decrease in parameter count, while recall and mAP improved by 4.6% and 3.7%, respectively. This demonstrates that the improvement can effectively enhance the model’s detection performance and facilitate deployment on mobile platforms. Finally, by integrating enhancement mechanisms such as EMA, the optimized model demonstrated a 75.6% reduction in the number of parameters compared to the original model, alongside improvements in precision, recall, and mAP by 0.2%, 4.1%, and 3.9%, respectively.
The ablation experiment results demonstrate that each improvement positively impacted model performance, validating the effectiveness of the YOLO-MECD model design. Through these improvements, YOLO-MECD not only enhanced the accuracy and efficiency of citrus detection but also maintained the model’s lightweight nature, providing robust technical support for practical applications.

3.3. Comparison of Different Attention Mechanisms

To verify the advantages of EMA in model detection performance, this paper compared four common attention mechanisms: coordinate attention (CA), the convolutional block attention module (CBAM), efficient channel attention (ECA), and the global attention module (GAM) [31,32,33,34]. CA captures inter-channel dependencies by modeling the correlations between channels in feature maps. The CBAM is an attention mechanism that combines spatial and channel attention. ECA introduces an efficient channel attention module for extracting inter-channel correlations. The GAM enhances the performance of deep neural networks in cross-dimensional interactions by preserving and amplifying channel and spatial information.
The impact of different attention mechanisms on model performance is shown in Table 3.
As shown in Table 3, among the five compared attention mechanisms, the model using the EMA module demonstrates significant advantages. Its precision is 0.4%, 1%, 2.1%, and 1% higher than CBAM, ECA, GAM, and CA, respectively. Compared to the YOLOv11s model, the EMA module improved precision, recall, and mAP by 1.1%, 1%, and 0.2%, respectively. Simultaneously, the model’s size, FLOPs, and parameter count decreased by 10.4%, 3.2%, and 10.5%.
The model using the EMA module achieved an mAP that is 0.3% higher than the CBAM, ECA, and CA. Although the GAM improved mAP and recall by 0.2% and 1%, respectively, its precision decreased by 1%. Moreover, its size, FLOPs, and parameter count increased by 58.2%, 21.1%, and 59.1%, which is unfavorable for model deployment. Therefore, this paper chose to replace the C2PSA attention mechanism in YOLOv11s with EMA to optimize the model results.

3.4. Comparison of Different Loss Functions

To explore the impact of different loss functions on the YOLOv11s model’s performance and find the most suitable loss function for this research, we replaced the CIoU loss function in YOLOv11 with SIoU, EIoU, DIoU, FocalerIoU, GIoU, ShapeIoU, and MPDIoU, and compared their performance in citrus detection [35,36,37]. The results of models with different loss functions are shown in Table 4.
As shown in Table 4, the MPDIoU loss function demonstrates significant advantages. Compared to the original CIoU loss function, MPDIoU improved recall by 0.7%, F1 score by 0.3, and mAP by 0.2%. Compared to DIoU, MPDIoU increased recall, F1 score, and mAP by 1.3%, 0.4%, and 0.5%, respectively. When compared to GIoU, MPDIoU enhanced recall by 0.6% and F1 score by 0.1%. Against EIoU, MPDIoU improved recall, F1 score, and mAP by 1.1%, 0.4%, and 0.5%, respectively. Compared to SIoU, MPDIoU increased recall, F1 score, and mAP by 0.7%, 0.2%, and 0.2%. When contrasted with ShapeIoU, MPDIoU enhanced recall, F1 score, and mAP by 0.6%, 0.3%, and 0.1%. Compared to FocalIoU, MPDIoU improved recall, F1 score, and mAP by 1.4%, 0.1%, and 0.2%. Although MPDIoU shows slight limitations in precision, it outperforms other loss functions across the three critical metrics of recall, F1 score, and mAP, demonstrating a more comprehensive advantage.

3.5. Comparison of Different Detection Layer Architectures

To verify the rationality of our detection layer architecture modifications, we used the original YOLOv11s model as the baseline for comparing the effects of three different detection layer frameworks. The experimental results are shown in Table 5. Here, YOLOv11s+P2 indicates the addition of a small object detection head to the original YOLOv11s. YOLOv11s+RDL represents the reconstruction of a detection layer in YOLOv11s
As shown in Table 5, YOLOv11s+P2 demonstrated significant improvements, with precision (P), recall (R), F1 score, and mAP increasing by 1%, 5.4%, 3.5%, and 4.1%, respectively. However, these improvements came at the cost of a 1.5% increase in parameters, 2.1% increase in model size (Size), and a 34.3% increase in FLOPs. Compared to the original model, YOLOv11s+RDL showed a slight decrease in precision (P), but improved recall (R), F1 score, and mAP by 4.6%, 2.4%, and 3.7%, respectively. Simultaneously, its parameter count and model size (Size) decreased by 69.4% and 67.6%. Although YOLOv11s+RDL did not show as significant improvements in accuracy as YOLOv11s+P2, its mAP was only 0.4% lower, and it demonstrated clear advantages in parameter count and model size. Taking comprehensive considerations into account, Improved-11s performs more in line with our requirements for the overall task.

3.6. Comparison with Different Models

To highlight the advantages of YOLO-MECD, we compared and tested it against YOLOv8s, YOLOv9s, YOLOv10s, and YOLOv11s. The relevant experimental results are shown in Table 6.
As shown in Table 6, YOLO-MECD achieved an mAP of 81.6% and an F1 score of 78.5% in citrus detection tasks, with recall rates notably superior to other models. Compared to YOLOv8s, YOLOv9s, YOLOv10s, and YOLOv11s, the YOLO-MECD model improved mAP by 3.8%, 3.2%, 5.5%, and 3.9%, respectively. In terms of F1 score, YOLO-MECD also performed exceptionally, exceeding YOLOv8s, YOLOv9s, YOLOv10s, and YOLOv11s by 2.3%, 2%, 2.9%, and 2.5%, respectively. Additionally, the parameter count of YOLO-MECD was only 20.6%, 23.1%, 28.6%, and 24.4% of YOLOv8s, YOLOv9s, YOLOv10s, and YOLOv11s, respectively.
These results demonstrate that YOLO-MECD maintains a high processing speed and compact model size while pursuing high precision and recall rates, giving it significant advantages in practical applications and enabling effective citrus detection in complex natural environments.
The figure below compares the actual detection performance between YOLO-MECD and the original YOLO V11 model.
As shown in Figure 11, in Scenario (a), YOLO-MECD performed excellently, successfully detecting all citrus fruits. While YOLOv11s successfully detected all orange_T class citrus, it had three missed detections and one false detection for orange_G class citrus. In Scenario (b), YOLO-MECD had five missed detections for orange_T class and seven missed detections for orange_G class, along with one duplicate detection. Meanwhile, YOLOv11s experienced more severe missed detections, with 10 missed detections for orange_T class and 21 missed detections for orange_G class, also including 1 duplicate detection. In Scenario (c), YOLO-MECD had two duplicate detections, two false detections, and one missed detection. In contrast, YOLOv11s had one duplicate detection, two false detections, and fifteen missed detections. The missed detections predominantly occurred for distant orange_G class citrus. Although YOLO-MECD still experienced some missed detections, it significantly improved compared to YOLOv11s, indicating a stronger small-object detection capability. In Scenario (d), YOLO-MECD successfully detected twenty orange_T class citrus but missed three severely occluded citrus, while YOLOv11s added four additional missed detections. In Scenario (e), YOLO-MECD had four false detections and three missed detections, whereas YOLOv11s had two false detections and twenty-seven missed detections. In Scenario (f), YOLO-MECD missed seven orange_T class and five orange_G class citrus, with one duplicate detection for orange_T class. YOLOv11s missed 20 orange_T class and 8 orange_G class citrus. Consequently, compared to YOLOv11s, YOLO-MECD demonstrates superior detection performance across all scenarios, better meeting detection requirements.

3.7. Generalization Experiment

To verify the model’s generalization ability, experiments need to be conducted on multiple datasets. Pomelo and kumquat are common citrus fruits, but they differ significantly in size from citrus. Therefore, we selected these datasets for testing, with partial test results shown in Figure 12.
In the pomelo dataset, since most pomelos remain on the tree, only one label, “pomelo”, was set. In the kumquat dataset, we divided the samples into two categories: “kumquats on the tree” (labeled as kumquat_T) and “kumquats fallen on the ground” (labeled as kumquat_G). Both datasets were divided into training, validation, and test sets in an 8:1:1 ratio. For detailed dataset information, please refer to Table 7.
We used YOLOv11s and YOLO-MECD models, which had been trained for 200 rounds on citrus detection, as the basis for transfer learning, with an additional 100 training rounds. The experimental results are shown in Table 8, where YOLOv11s-pomelo and YOLOv11s-kumquat represent the pomelo and kumquat detection models trained based on YOLOv11s, respectively; YOLO-MECD-pomelo and YOLO-MECD-kumquat represent the pomelo and kumquat detection models trained based on YOLO-MECD, respectively.
Based on the experimental results in Table 8, in the pomelo dataset, although the improved model showed a slight decrease in recall and F1 score, it improved precision (P) and mAP by 0.3% and 0.8%, respectively. Simultaneously, the model’s size reduced by 74.2%, demonstrating a significant advantage. In the kumquat dataset, due to the smaller size of kumquats, the improved model enhanced precision (P), recall, F1 score, and mAP by 0.8%, 12.3%, 8.4%, and 12.9%, respectively, with the size still decreasing by 74.2%, showing even more pronounced advantages. Figure 12 displays the detection results on kumquat and pomelo datasets. These results demonstrate that the YOLO-MECD model possesses excellent generalization capabilities, effectively applicable to other datasets. Moreover, the model’s improvements in small object detection are particularly remarkable, providing valuable insights for small object detection tasks.

3.8. Model Visualization

To investigate the reasons for YOLO-MECD’s detection advantages, this study employed the GradCAM++method to generate heat maps, visualizing key features of citrus fruits and highlighting YOLO-MECD’s strengths [38]. Heat maps represent object distribution information through varying color intensities, where warm colors (such as red and yellow) indicate high-activity or high-importance regions while cool colors (like blue and green) represent low-activity or low-importance areas. The concentrated warm-color regions in heat maps are particularly significant for detection performance. Figure 13 displays heat maps generated by different models under various conditions.
As shown in Figure 13, compared to YOLOv11s, the YOLO-MECD model demonstrates stronger anti-interference capabilities in citrus detection. It is less susceptible to interference from backgrounds and tree leaves, and can effectively detect small, distant citrus fruits. The heat sources in the heat maps are concentrated on the target objects, indicating that this enhanced model can accurately extract citrus features while effectively mitigating the impacts of background noise and lighting variations.

4. Discussion

4.1. Model Limitations

Although the proposed YOLO-MECD model has achieved good results in detecting hanging and fallen citrus fruits, some limitations remain. For instance, the detection performance can still be improved in scenarios with dense or occluded citrus fruits. The specific test conditions are shown in Table 9. Figure 14 illustrates cases of poor detection effects. In image (a), we detected 33 fruits on the tree and 4 fallen fruits, but this was not entirely accurate. There were seven missed detections, three duplicate detections, and two false detections. In image (b), we successfully detected 25 hanging fruits, but still experienced two duplicate detections and one missed detection.

4.2. Application Comparison

To objectively evaluate the practical application effectiveness of our method, we conducted a comparative experiment by randomly selecting ten orchard images from different scenarios. During the experiment, our method, based on computer vision technology, achieved automatic detection with a processing time of less than one second per image and supported batch processing, significantly improving detection efficiency. As a control, we invited orchard staff to perform manual counting. To simulate real-world working conditions, the detection time for each image was limited to 30 s. The experimental results demonstrate that our method exhibits significant advantages in both detection efficiency and accuracy, with specific comparative data presented in the table below (Table 10).
From the experimental results, it is evident that the detection accuracy of our method is significantly superior to manual detection. Furthermore, considering the cost factors associated with manual detection (approximately 200 RMB per day per inspector), our method also demonstrates a clear advantage in reducing production costs. Taking into account multiple factors such as detection accuracy, efficiency, and cost, our method exhibits notable application value and promotion potential compared to traditional manual detection approaches. This highly efficient and precise detection technology will significantly enhance the work efficiency of breeders, providing robust technical support for the crop breeding process.

4.3. The Significance of This Study

In the modern orchard of citrus, precise fruit counting provides an important tool for fruit thinning, protective bagging, harvesting operations, and post-harvest handling, contributing to improved overall production efficiency. The AI-based intelligent system enables full-cycle precision management through dynamic fruit quantity tracking. On one hand, for fruit on the tree, the system effectively reduces labor intensity during thinning by analyzing fruit density; at the time of bagging, the materials can be procured accurately based on fruit quantity statistics; furthermore, at the harvesting phase, the citrus yield can be precisely predicted with the help of intelligent counting algorithms. On the other hand, by enabling the simultaneous identification and counting of citrus fruits on trees and on the ground, the program achieves broader applicability. For example, research indicates that different citrus varieties exhibit markedly distinct fruit drop characteristics under identical environmental conditions, with these biological traits showing significant correlations with climatic adaptability. Thus, in windy regions, certain citrus varieties demonstrate a relatively higher tendency for fruit drop. By establishing a dynamic fruit drop monitoring system, this approach not only supports scientific decision making in regionalized variety selection but also opens new avenues for genetic improvement through the accumulation of multi-dimensional varietal response data. More importantly, the number of dropped fruits can also reflect the nutritional and water status of citrus, providing valuable insights for farmers. In summary, this technical framework quantitatively evaluates fruit retention stability, establishing a methodological foundation for orchard management and breeding improved varieties. It offers vital technical support for innovation in the citrus industry.

5. Conclusions

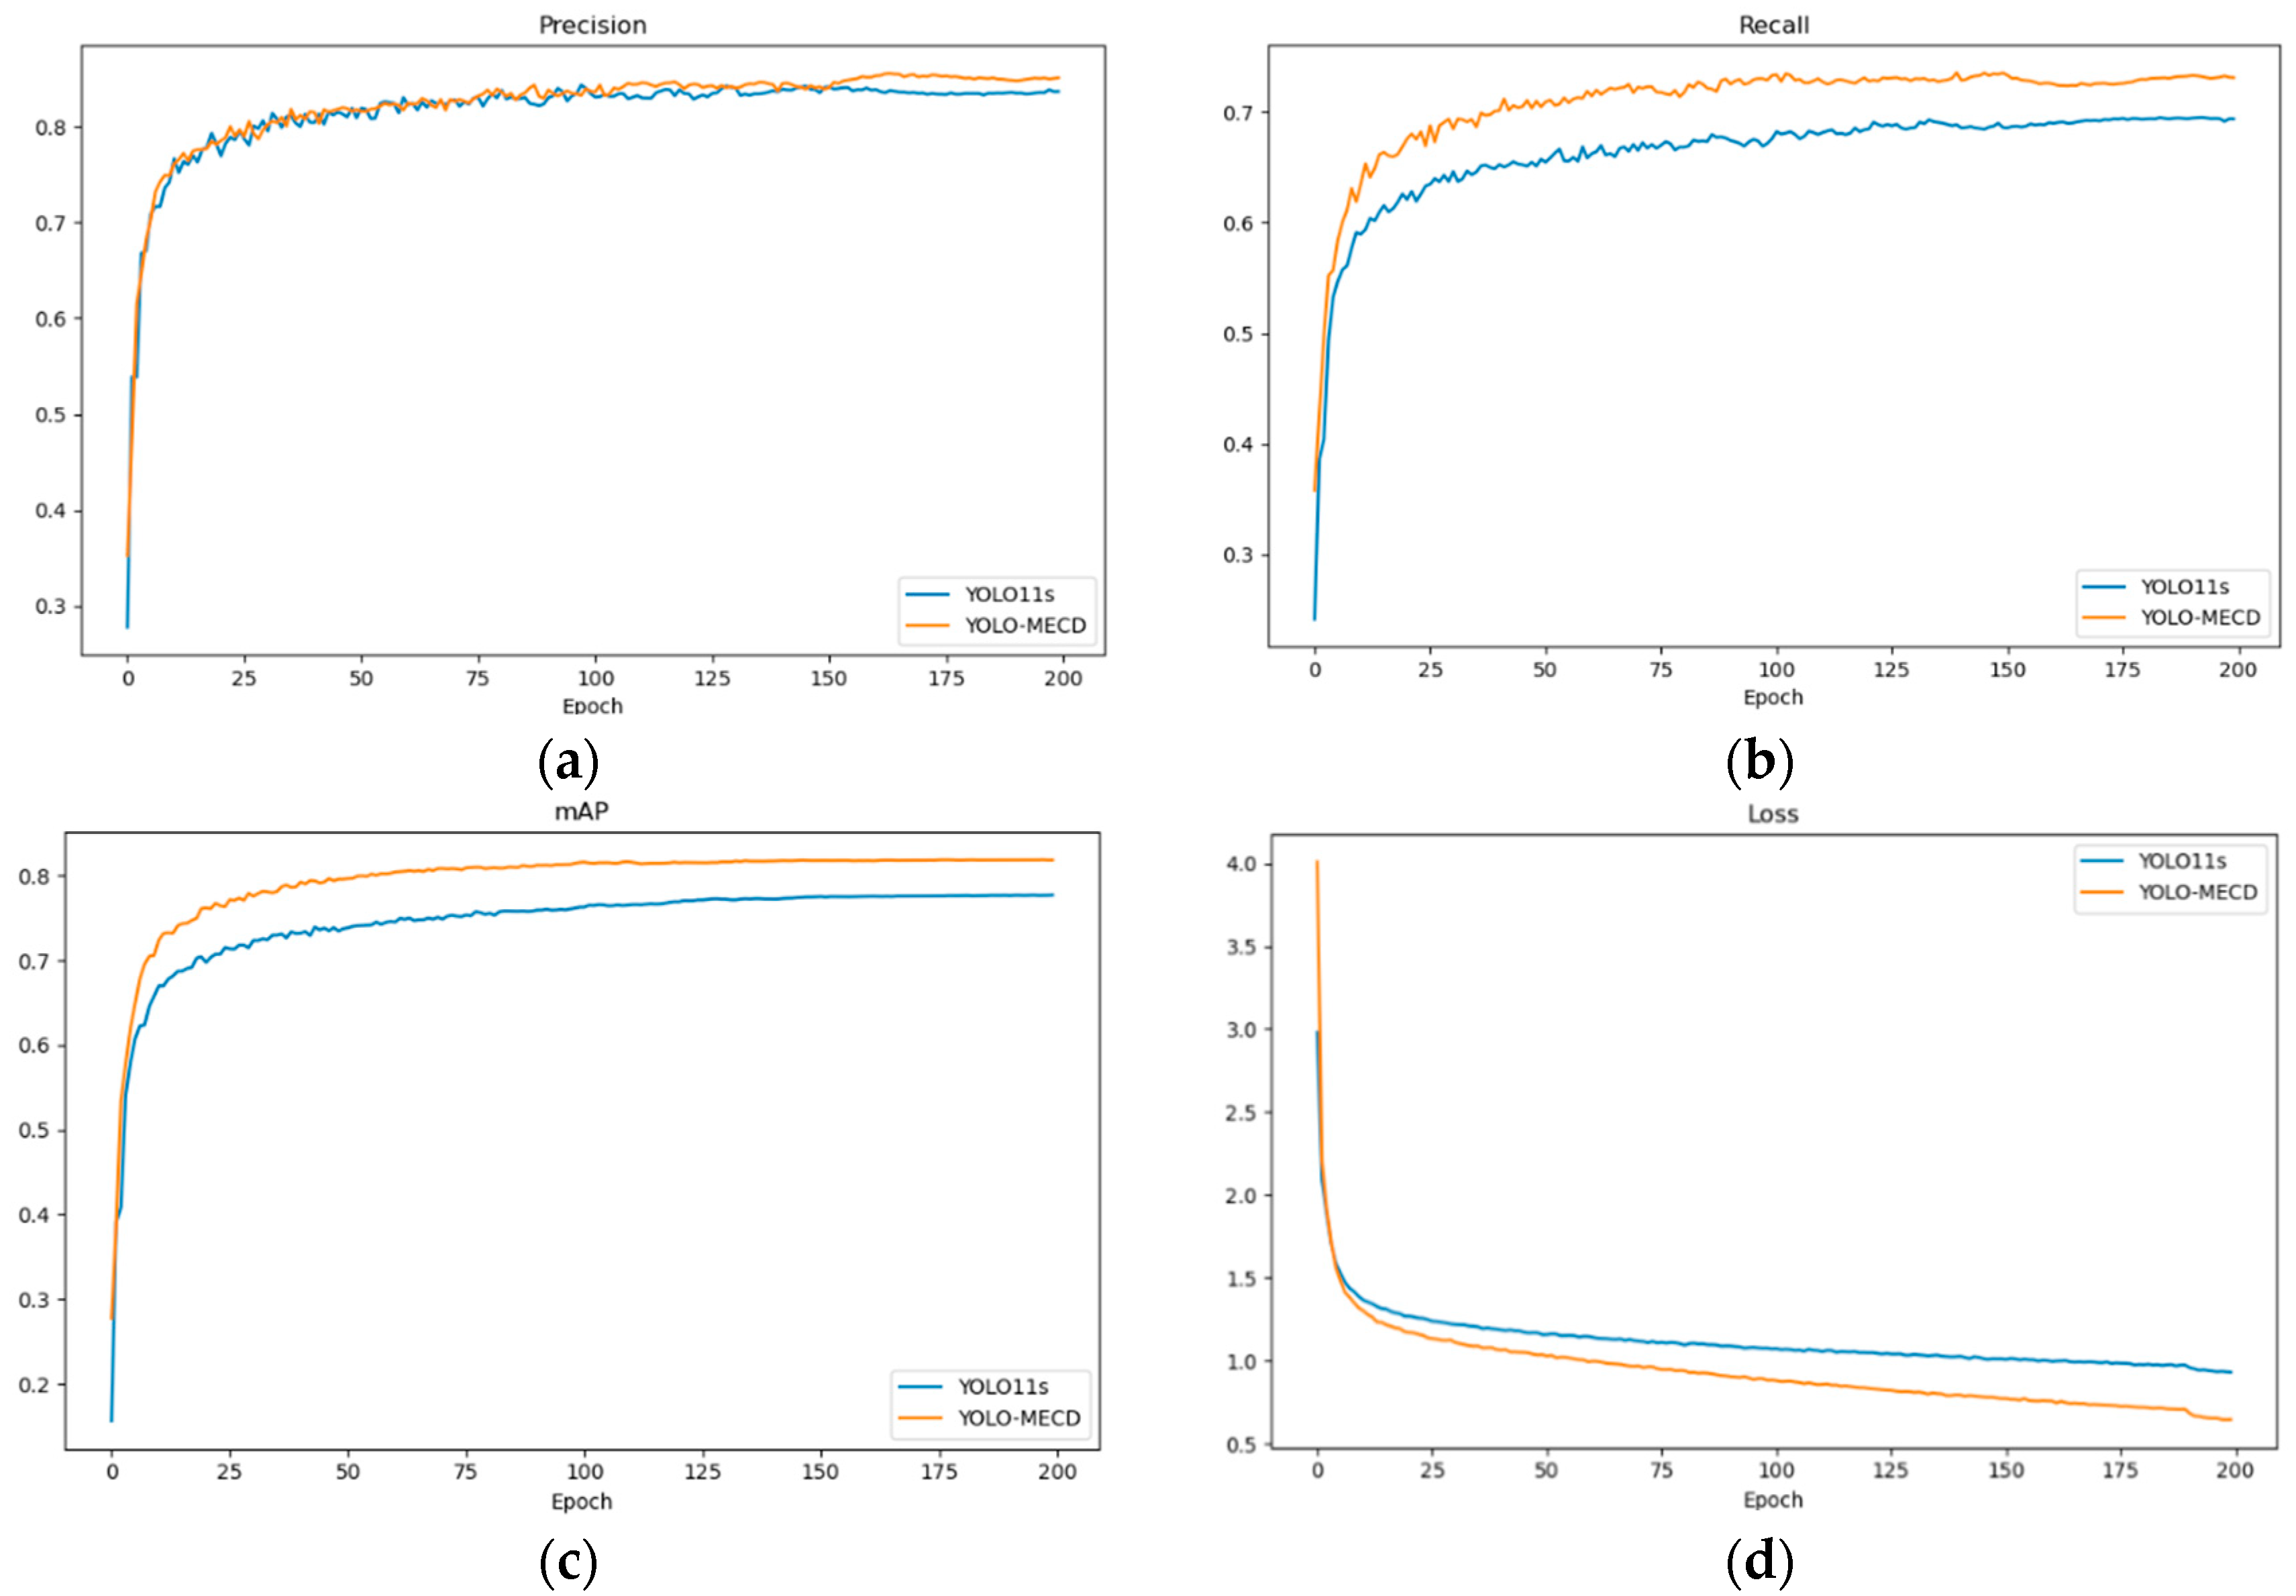
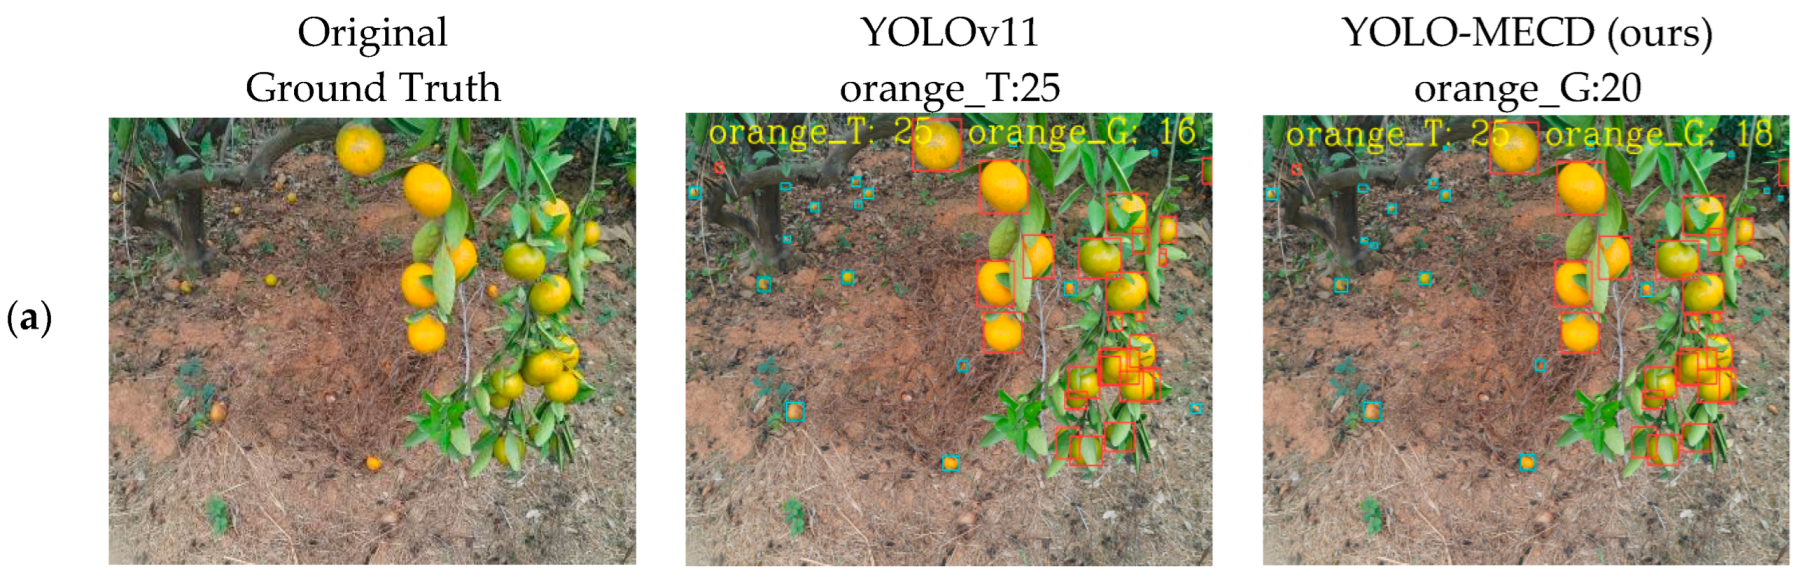
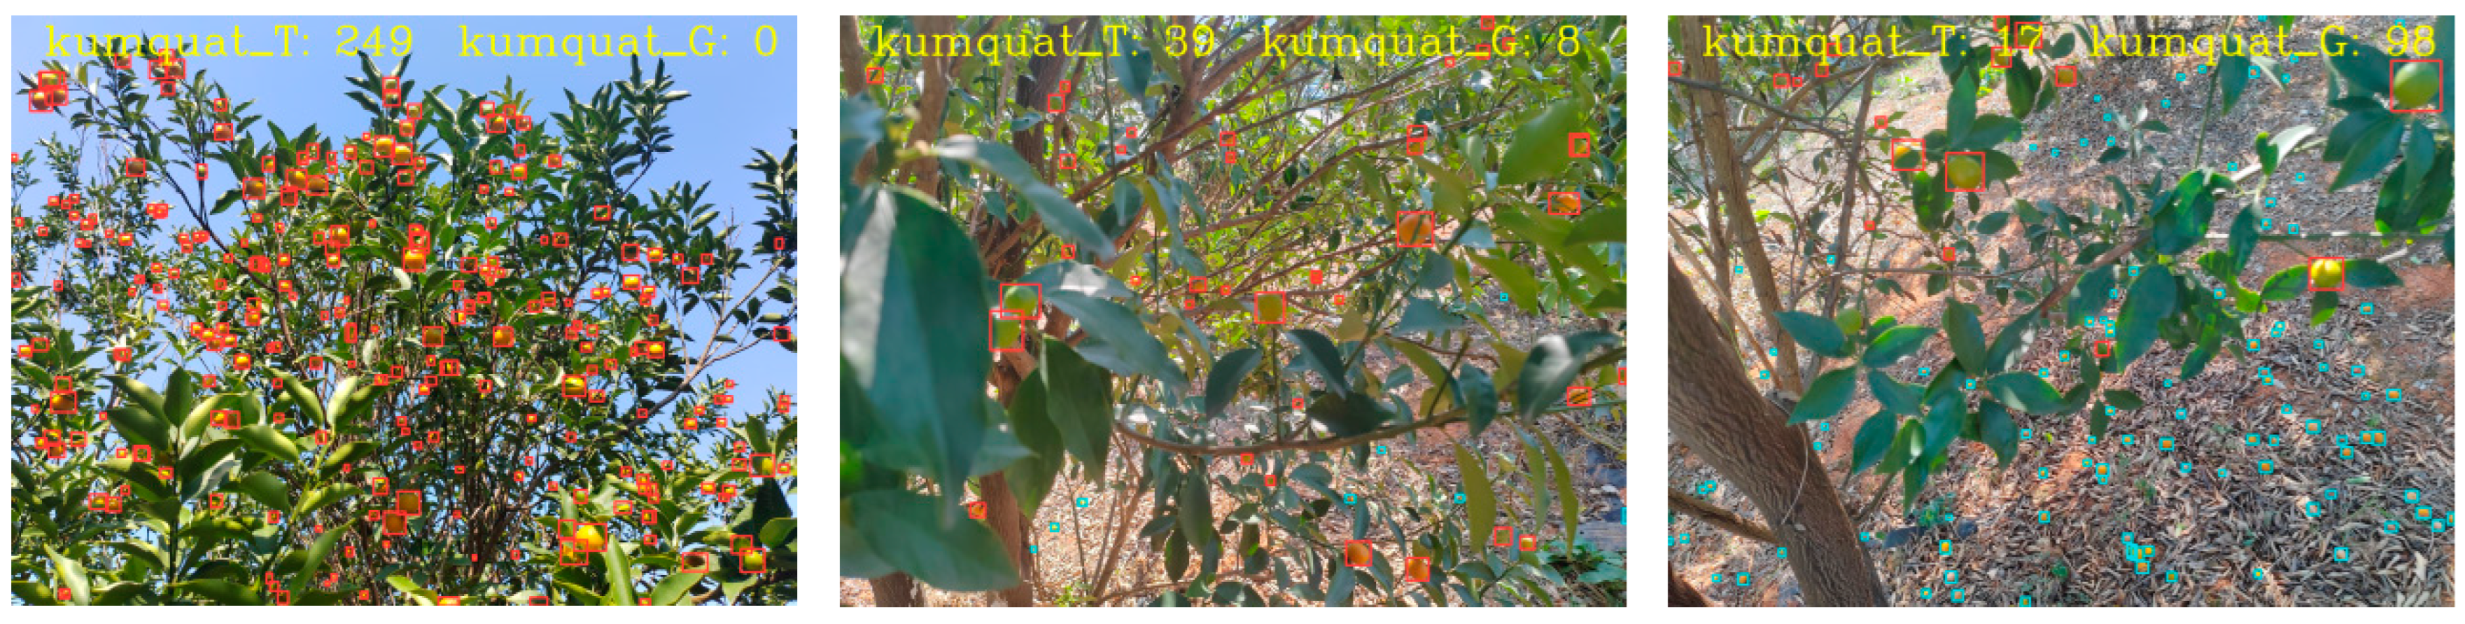
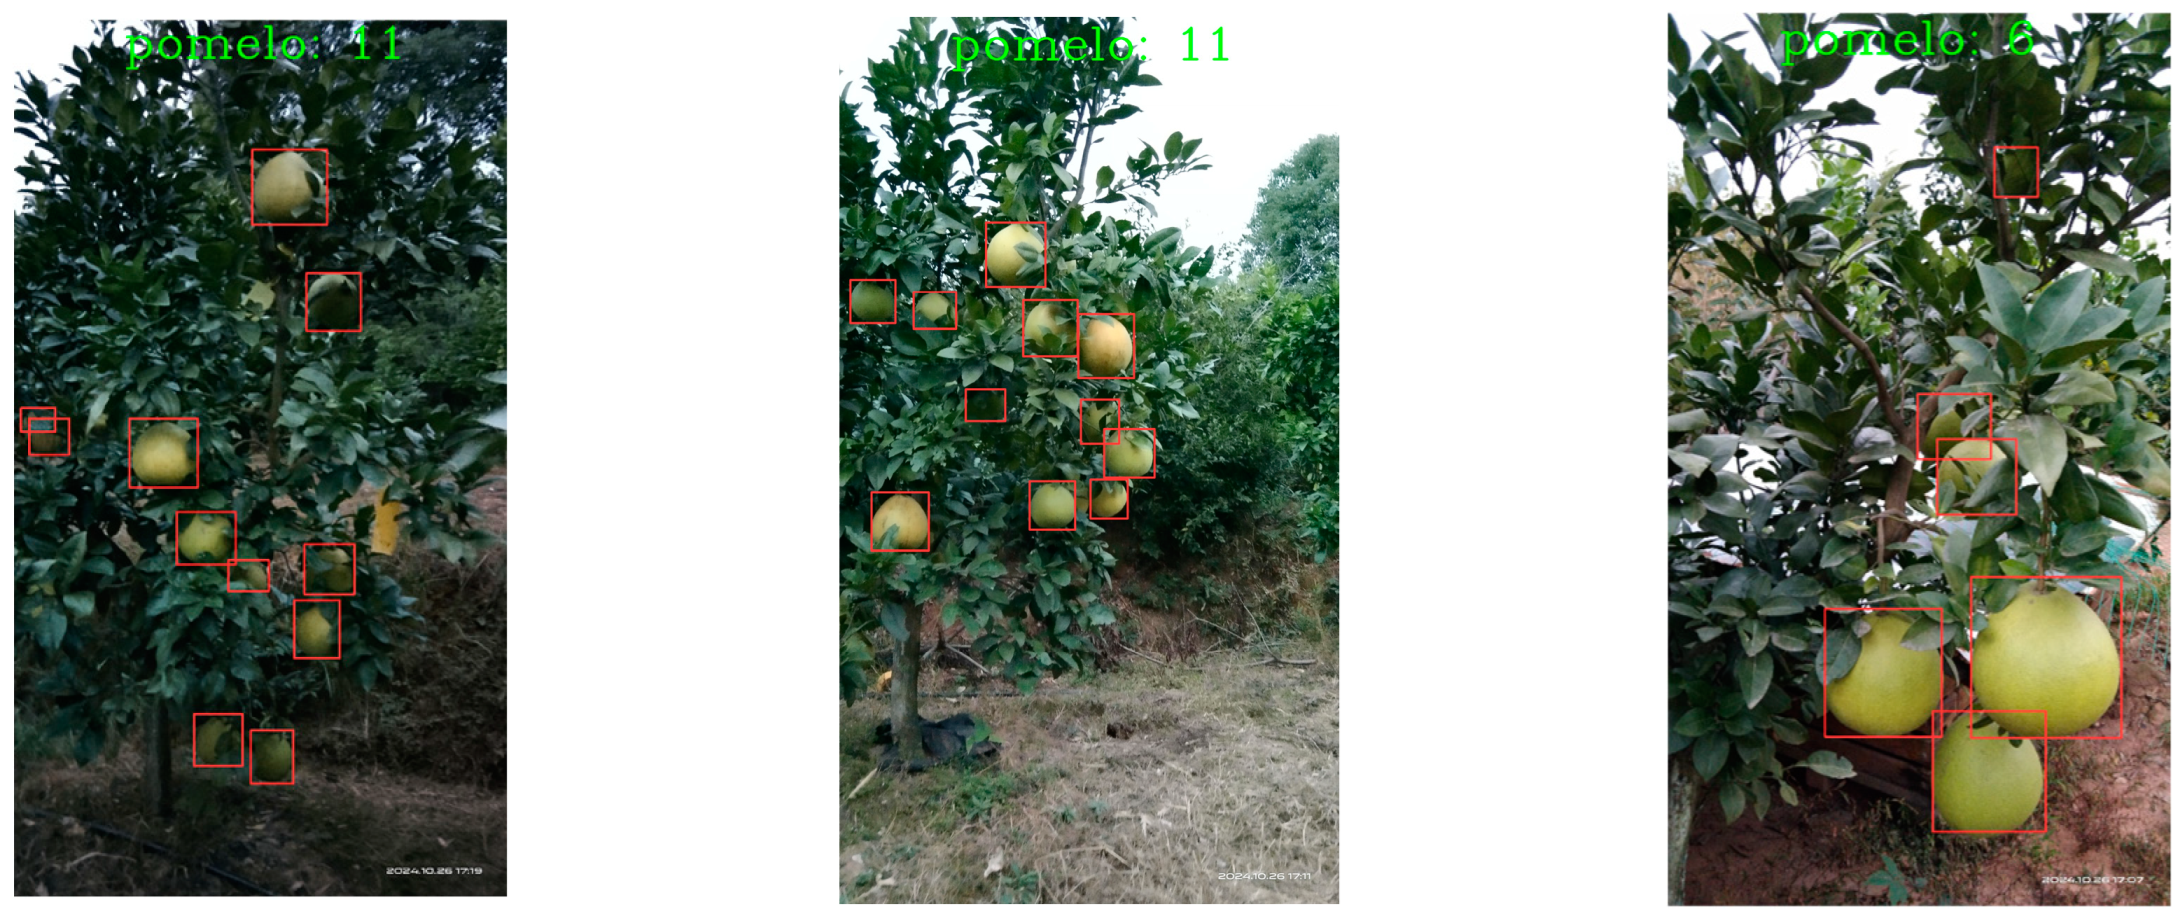
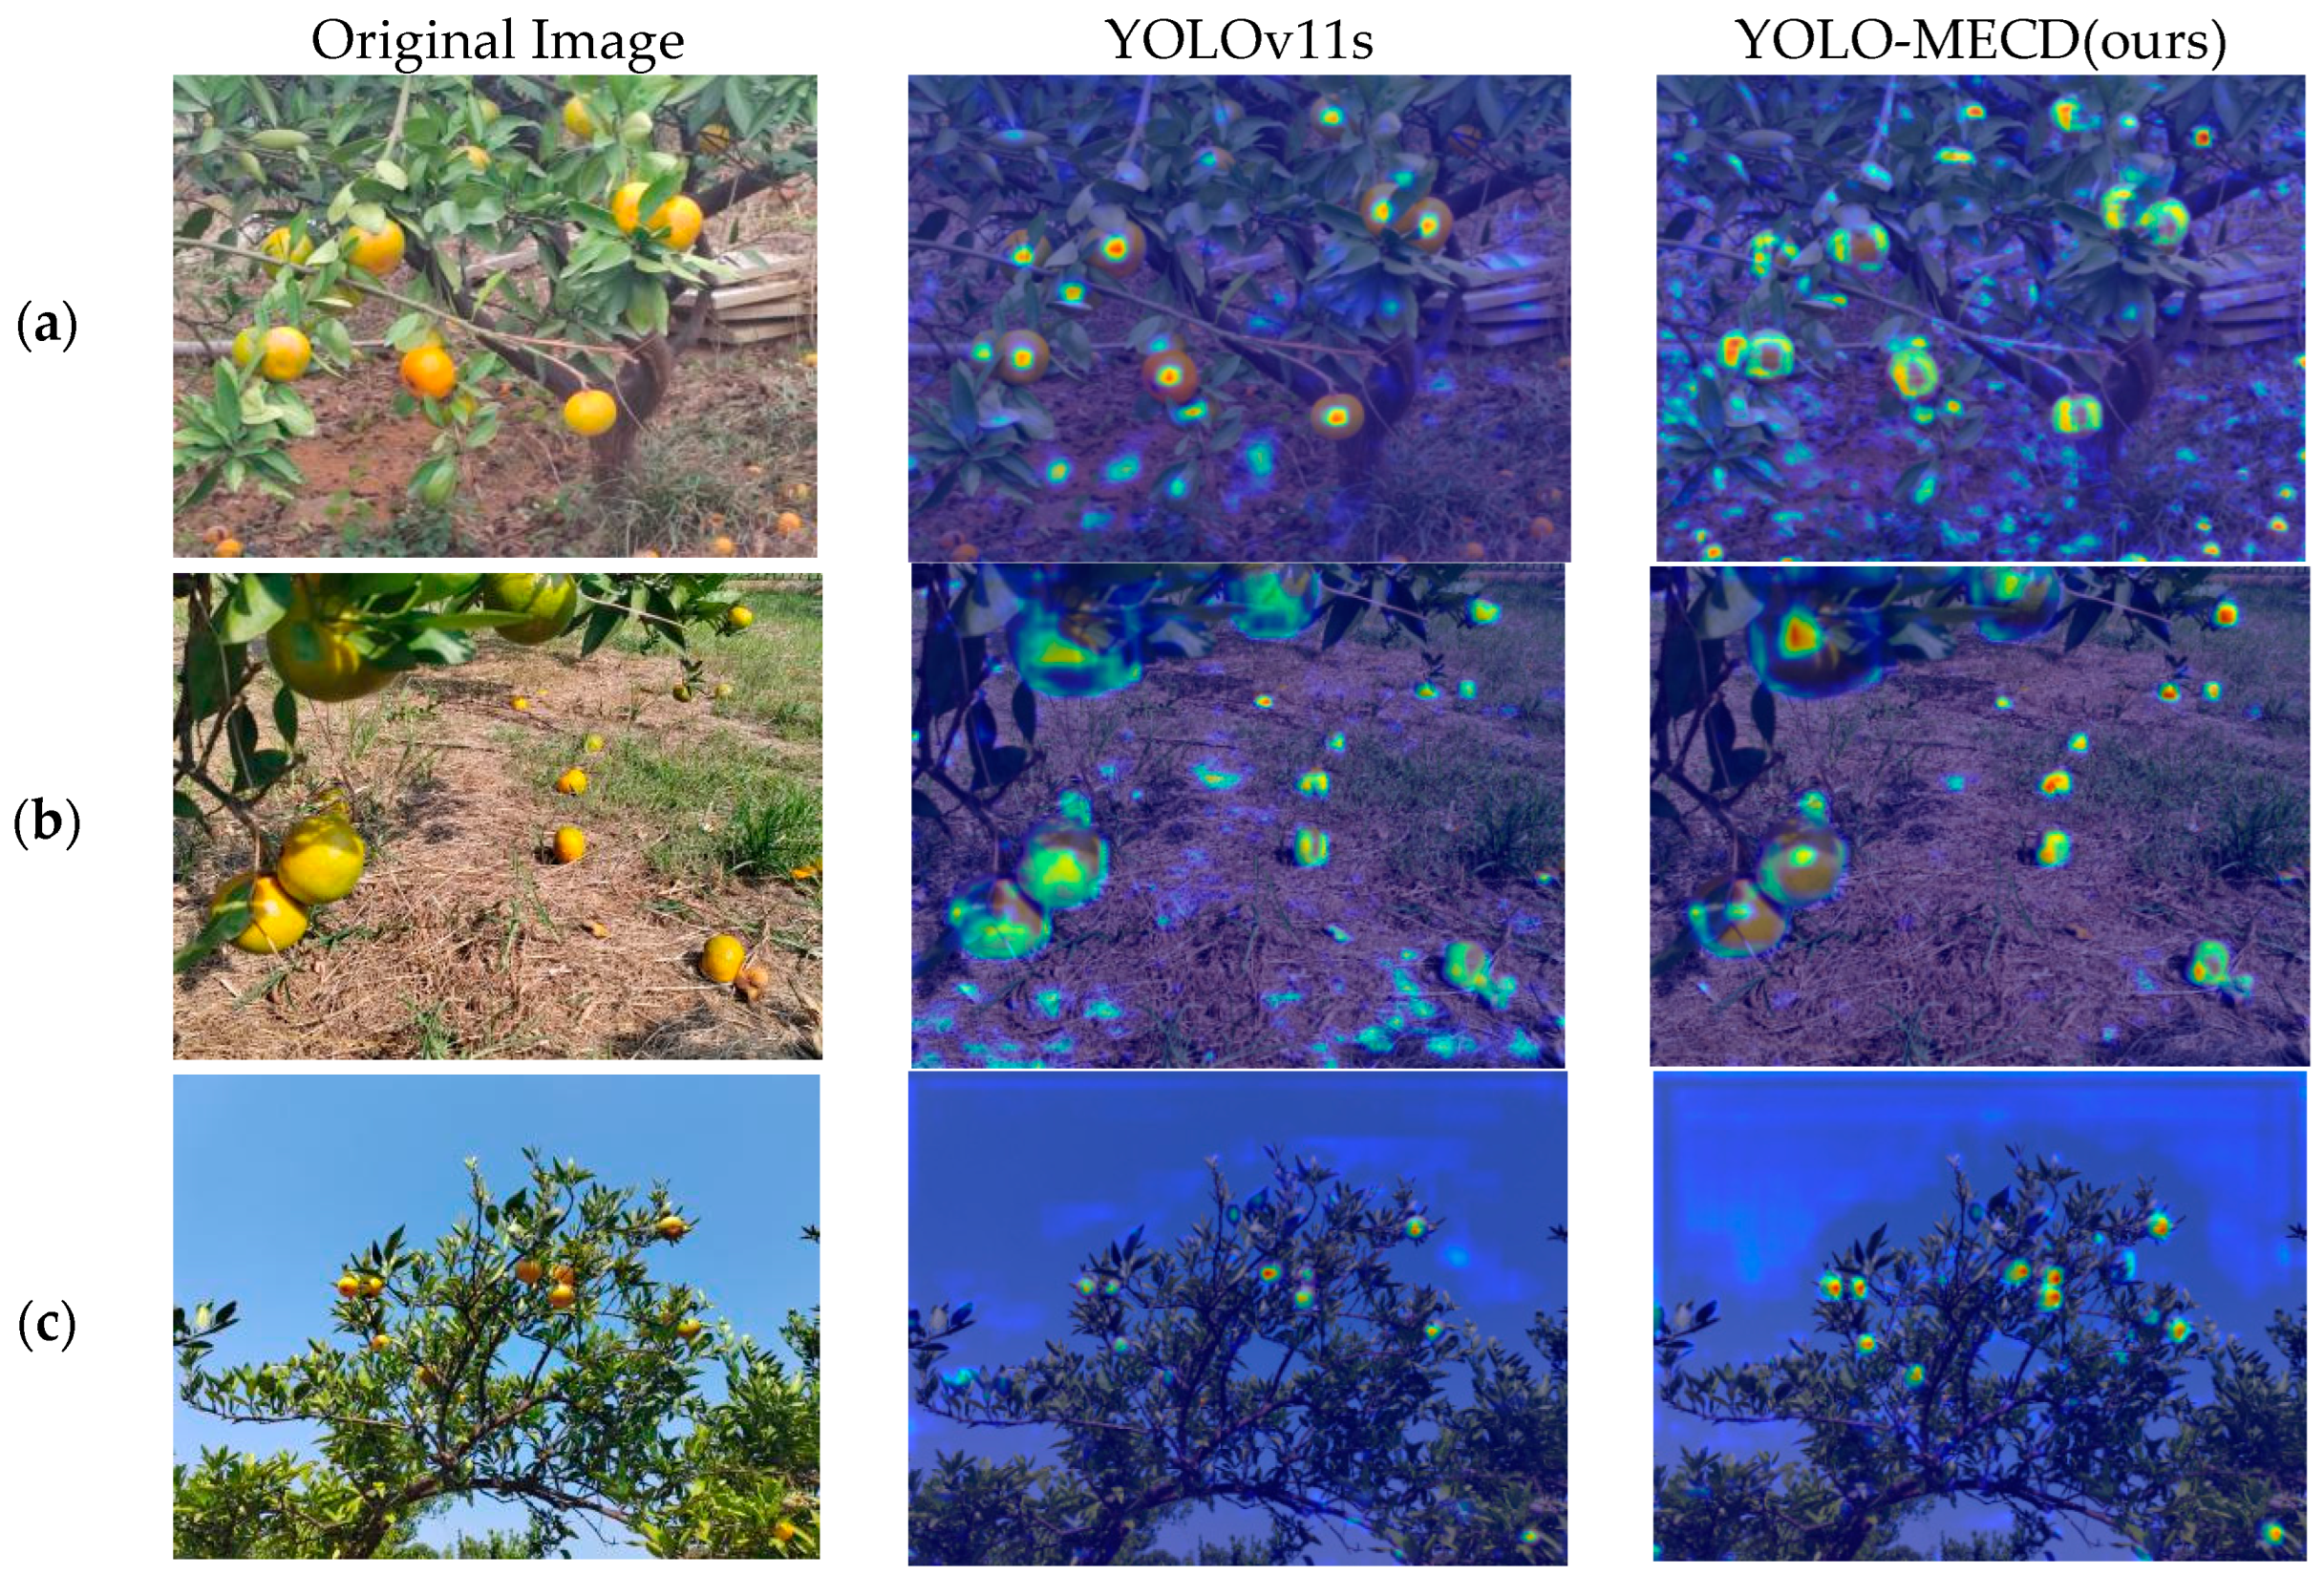
To achieve the rapid and accurate detection of on-tree and fallen citrus fruits in complex environments, this paper proposes an improved citrus detection model named YOLO-MECD. The model enhances feature extraction and detection accuracy by introducing the EMA (efficient multi-scale attention) module to replace the C2PSA module. Simultaneously, the CSPPC module, designed based on partial convolution, replaces the C3K2 module, effectively reducing the model’s parameter count and computational complexity. To further optimize performance, the model adopts the MPDIoU loss function instead of the CIoU loss function, which not only improves detection accuracy but also accelerates convergence speed. Additionally, by streamlining the number of convolutional layers in the backbone network, the model significantly enhances small target detection capability while substantially reducing the number of parameters, laying a solid foundation for mobile deployment. The experimental results demonstrate that, compared to the original YOLOv11 model, YOLO-MECD achieved improvements of 0.2, 4.1, and 3.9 percentage points in precision (P), recall (R), and mean average precision (mAP), respectively, while significantly enhancing feature extraction capabilities and effectively reducing the occurrence of missed detections, false detections, and repeated detections. Under the condition of substantially optimized model complexity (with a 75.6% reduction in parameter count), YOLO-MECD achieved P, R, and mAP values of 84.4%, 73.3%, and 81.6%, respectively. Compared to YOLOv8, YOLOv9, and YOLOv10, YOLO-MECD improved mAP by 3.8, 3.2, and 5.5 percentage points, demonstrating significant performance advantages. Furthermore, the method exhibited excellent adaptability in detection tasks for citrus fruits such as lingonberries, fully validating the model’s strong generalization capability and practical application value. It is worth noting that the issue of duplicate counting that may arise during multi-angle shooting will be addressed in future research. In the future, techniques such as knowledge distillation and network pruning can be employed to further optimize the model structure, significantly reducing computational complexity while improving detection accuracy. Additionally, we plan to deploy this model on edge devices for practical application verification, assessing its performance and feasibility in real-world environments.

Author Contributions

Conceptualization, H.Y.; methodology, Y.L., L.L., H.X., F.X. and B.S.; writing—original draft preparation, Y.L. and H.Y.; writing—review and editing, L.L., H.X., F.X. and B.S. All authors have read and agreed to the published version of the manuscript.

Funding

This research received no external funding.

Data Availability Statement

Given that the data used in this study were self-collected, the dataset is being further improved. Thus, the dataset is unavailable at present.

Acknowledgments

Special thanks to the reviewers for their valuable comments. I would like to disclose that we used artificial intelligence tools for polishing the manuscript.

Conflicts of Interest

The authors declare no conflicts of interest.

References

  1. Guo, W.W.; Ye, J.L.; Deng, X.X. 70 Years of Fruit Science Research in New China—Citrus. J. Fruit Sci. 2019, 36, 1264–1272. [Google Scholar] [CrossRef]
  2. Shen, Z.M. Current Status and Future Prospects of China’s Citrus Production. Sci. Farming 2019, 9, 5–10. [Google Scholar] [CrossRef]
  3. Peng, M.C.; Tu, L.X. Causes of Citrus Fruit Drop and Comprehensive Prevention and Control Technology. Plant Dr. 2011, 24, 22–23. [Google Scholar] [CrossRef]
  4. Feng, Y.; Xiong, W.; Huang, M.; Peng, L.Z.; Li, L.; Xia, R.B.; Pu, Z.P.; Kong, W.B.; Chen, W. Study on Causes of Winter Fruit Drop in Late-Maturing Citrus and New Technology for Fruit Retention and Drop Prevention. J. Southwest Norm. Univ. (Nat. Sci. Ed.) 2016, 41, 32–38. [Google Scholar] [CrossRef]
  5. Dong, Q.Q.; Gong, G.Z.; Peng, Z.C.; Li, Y.B.; Hou, Y.H.; Hong, Q.B. Analysis of the Relationship Between Pre-Harvest Fruit Drop and Endogenous Hormone Content in Different Parts of Citrus Fruit. Plant Physiol. J. 2018, 54, 1569–1575. [Google Scholar] [CrossRef]
  6. Girshick, R.; Donahue, J.; Darrell, T.; Malik, J. Rich feature hierarchies for accurate object detection and semantic segmentation. In Proceedings of the 2014 IEEE Conference on Computer Vision and Pattern Recognition, Columbus, OH, USA, 23–28 June 2014. [Google Scholar] [CrossRef]
  7. Girshick, R. Fast R-CNN. In Proceedings of the IEEE International Conference on Computer Vision, Santiago, Chile, 7–13 December 2015; pp. 1440–1448. [Google Scholar]
  8. Ren, S.; He, K.; Girshick, R.; Sun, J. Faster R-CNN: Towards real-time object detection with region proposal networks. IEEE Trans. Pattern Anal. Mach. Intell. 2017, 39, 1137–1149. [Google Scholar] [CrossRef]
  9. Yan, J.W.; Zhao, Y.; Zhang, L.W.; Su, X.L.; Liu, H.Y.; Zhang, F.G.; Fan, W.G.; He, L. Recognition of Rosa Roxburghii Fruit in Natural Environment Based on Improved Faster-RCNN. Trans. Chin. Soc. Agric. Eng. 2019, 35, 143–150. [Google Scholar] [CrossRef]
  10. Xiong, J.T.; Liu, Z.; Tang, L.Y.; Lin, R.; Pu, R.B.; Peng, H.X. Research on Visual Detection Technology of Green Citrus in Natural Environment. Trans. Chin. Soc. Agric. Mach. 2018, 49, 45–52. [Google Scholar] [CrossRef]
  11. Wei, L.; Dragomir, A.; Dumitru, E.; Christian, S.; Scott, R.; Yang, F.C.; Alexander, C.B. SSD: Single Shot MultiBox Detector. In Proceedings of the European Conference on Computer Vision (ECCV), Amsterdam, The Netherlands, 8–16 October 2016; Springer: Cham, Switzerland, 2016; pp. 21–37. [Google Scholar] [CrossRef]
  12. Redmon, J.; Divvala, S.; Girshick, R.; Farhadi, A. You Only Look Once: Unified, Real-Time Object Detection. In Proceedings of the IEEE Conference on Computer Vision and Pattern Recognition (CVPR), Las Vegas, NV, USA, 27–30 June 2016; pp. 779–788. [Google Scholar] [CrossRef]
  13. Redmon, J.; Farhadi, A. YOLO9000: Better, Faster, Stronger. In Proceedings of the IEEE Conference on Computer Vision and Pattern Recognition (CVPR), Honolulu, HI, USA, 21–26 July 2017; pp. 6517–6525. [Google Scholar] [CrossRef]
  14. Redmon, J.; Farhadi, A. YOLOv3: An Incremental Improvement. arXiv 2018, arXiv:1804.02767. [Google Scholar] [CrossRef]
  15. Bochkovskiy, A.; Wang, C.Y.; Liao, H.Y.M. YOLOv4: Optimal Speed and Accuracy of Object Detection. arXiv 2020, arXiv:2004.10934. [Google Scholar] [CrossRef]
  16. Wang, C.Y.; Bochkovskiy, A.; Liao, H.Y.M. YOLOv7: Trainable Bag-of-Freebies Sets New State-of-the-Art for Real-Time Object Detectors. arXiv 2022, arXiv:2207.02696. [Google Scholar] [CrossRef]
  17. Wang, C.Y.; Yeh, I.H.; Mark Liao, H.Y. YOLOv9: Learning What You Want to Learn Using Programmable Gradient Information. In Proceedings of the European Conference on Computer Vision (ECCV), Milan, Italy, 29 September–4 October 2024; Springer Nature: Cham, Switzerland, 2024; pp. 1–21. [Google Scholar]
  18. Zhang, F.; Chen, Z.J.; Bao, R.F.; Zhang, C.C.; Wang, Z.H. Dense cherry tomato recognition based on improved YOLOv4-LITE lightweight neural network. Trans. Chin. Soc. Agric. Eng. 2021, 37, 270–278. [Google Scholar] [CrossRef]
  19. Wang, J.P.; He, M.; Zhen, Q.G.; Zhou, H.P. Static and dynamic detection counting method of Camellia oleifera fruits based on improved COF-YOLO v8n. Trans. Chin. Soc. Agric. Mach. 2024, 55, 193–203. [Google Scholar] [CrossRef]
  20. Lv, Q.; Lin, G.; Jiang, J.; Wang, M.Z.; Zhang, H.Y.; Yi, S.L. Detection of green citrus fruits in natural scenes based on improved YOLOv5s model. Trans. Chin. Soc. Agric. Eng. 2024, 40, 147–154. [Google Scholar]
  21. Lv, S.L.; Lu, S.H.; Li, Z.; Hong, T.S.; Xue, Y.J.; Wu, B.L. Citrus recognition method based on improved YOLOv3-LITE lightweight neural network. Trans. Chin. Soc. Agric. Eng. 2019, 35, 205–214. [Google Scholar] [CrossRef]
  22. Gao, X.Y.; Wei, S.; Wen, Z.Q.; Yu, T.B. Citrus detection method based on improved YOLOv5 lightweight network. Comput. Eng. Appl. 2023, 59, 212–221. [Google Scholar] [CrossRef]
  23. Qin, K.; Zhang, J.; Hu, Y. Identification of Insect Pests on Soybean Leaves Based on SP-YOLO. Agronomy 2024, 14, 1586. [Google Scholar] [CrossRef]
  24. Yin, H.; Wei, Q.; Gao, Y.; Hu, H.; Wang, Y. Moving toward smart breeding: A robust amodal segmentation method for occluded Oudemansiella raphanipes cap size estimation. Comput. Electron. Agric. 2024, 220, 108895. [Google Scholar] [CrossRef]
  25. Wei, J.; Ni, L.; Luo, L.; Chen, M.; You, M.; Sun, Y.; Hu, T. GFS-YOLOv11: A Maturity Detection Model for Multi-Variety Tomato. Agronomy 2024, 14, 2644. [Google Scholar] [CrossRef]
  26. Xu, X. Side-Scan Sonar Small Objects Detection Based on Improved YOLOv11. J. Mar. Sci. Eng. 2025, 13, 162. [Google Scholar] [CrossRef]
  27. Jocher, G.; Qiu, J. Ultralytics YOLO11. Version 11.0.0. 2024. Available online: https://github.com/ultralytics/ultralytics (accessed on 5 October 2024).
  28. Chen, J.; Kao, S.H.; He, H.; Zhuo, W.; Wen, S.; Lee, C.H.; Chan, S.H.G. Run, Don’t Walk: Chasing Higher FLOPS for Faster Neural Networks. In Proceedings of the 2023 IEEE/CVF Conference on Computer Vision and Pattern Recognition (CVPR), Vancouver, BC, Canada, 18–22 June 2023; pp. 1–12. [Google Scholar] [CrossRef]
  29. Ouyang, D.; He, S.; Zhan, J.; Guo, H.; Huang, Z.; Luo, M.L.; Zhang, G.L. Efficient Multi-Scale Attention Module with Cross-Spatial Learning. arXiv 2023, arXiv:2305.13563. [Google Scholar] [CrossRef]
  30. Ma, S.; Xu, Y. MPDIoU: A Loss for Efficient and Accurate Bounding Box Regression. arXiv 2023, arXiv:2307.07662. [Google Scholar] [CrossRef]
  31. Hou, Q.; Zhou, D.; Feng, J. Coordinate Attention for Efficient Mobile Network Design. arXiv 2021, arXiv:2103.02907. [Google Scholar] [CrossRef]
  32. Woo, S.; Park, J.; Lee, J.Y.; Kweon, I.S. CBAM: Convolutional Block Attention Module. In Proceedings of the European Conference on Computer Vision (ECCV), Munich, Germany, 8–14 September 2018; Springer: Cham, Switzerland, 2018; pp. 3–19. [Google Scholar] [CrossRef]
  33. Wang, Q.; Wu, B.; Zhu, P.; Li, P.; Hu, Q. ECA-Net: Efficient Channel Attention for Deep Convolutional Neural Networks. In Proceedings of the 2020 IEEE/CVF Conference on Computer Vision and Pattern Recognition (CVPR), Seattle, WA, USA, 13–19 June 2020; pp. 11531–11539. [Google Scholar] [CrossRef]
  34. Liu, Y.; Shao, Z.; Hoffmann, N. Global Attention Mechanism: Retain Information to Enhance Channel-Spatial Interactions. arXiv 2021, arXiv:2112.05561. [Google Scholar] [CrossRef]
  35. Zhang, Y.F.; Ren, W.; Zhang, Z.; Jia, Z.; Wang, L.; Tan, T. Focal and Efficient IOU Loss for Accurate Bounding Box Regression. arXiv 2021, arXiv:2101.08158. [Google Scholar] [CrossRef]
  36. Zheng, Z.; Wang, P.; Liu, W.; Li, J.; Ye, R.; Ren, D. Distance-IoU Loss: Faster and Better Learning for Bounding Box Regression. arXiv 2019, arXiv:1911.08287. [Google Scholar] [CrossRef]
  37. Rezatofighi, H.; Tsoi, N.; Gwak, J.Y.; Sadeghian, A.; Reid, I.; Savarese, S. Generalized Intersection over Union: A Metric and A Loss for Bounding Box Regression. In Proceedings of the IEEE/CVF Conference on Computer Vision and Pattern Recognition (CVPR), Long Beach, CA, USA, 15–20 June 2019; pp. 658–666. [Google Scholar] [CrossRef]
  38. Chattopadhyay, A.; Sarkar, A.; Howlader, P.; Balasubramanian, V.N. Grad-CAM++: Improved Visual Explanations for Deep Convolutional Networks. In Proceedings of the 2018 IEEE Winter Conference on Applications of Computer Vision (WACV), Lake Tahoe, NV, USA, 12–15 March 2018; pp. 839–847. [Google Scholar] [CrossRef]
Figure 1. Citrus images in the orchard. (a) Cloudy day; (b) sunny day; (c) top view; (d) upward view; (e) long distance; (f) short distance; (g) backlight; (h) under light.
Agronomy 15 00687 g001
Figure 2. Visualization and statistical analysis of dataset characteristics. The color depth exhibits a positive correlation with the distribution density, where darker blue regions represent high-density distributions and lighter blue areas correspond to low-density distributions. (a) Spatial distribution analysis of bounding box positional coordinates. (b) Dimensional distribution analysis of bounding box relative scales.
Agronomy 15 00687 g002
Figure 3. Schematic of YOLO-MECD network architecture; Agronomy 15 00687 i001 represents modified components.
Agronomy 15 00687 g003
Figure 4. Framework of CSPPC module.
Agronomy 15 00687 g004
Figure 5. Schematic of PConv architectural configuration.
Agronomy 15 00687 g005
Figure 6. Schematic of EMA module architecture.
Agronomy 15 00687 g006
Figure 7. Schematic of MPDIoU loss function.
Agronomy 15 00687 g007
Figure 8. Detection layer architectures of three approaches. (a) Detection layer of YOLOv11s. (b) Detection layer of YOLOv11s with adding small object detection component. (c) Reconstruction of detection layer in YOLOv11s. * means multiplication.
Agronomy 15 00687 g008
Figure 9. Training process curves. (a) Precision; (b) recall; (c) mAP; (d) loss.
Agronomy 15 00687 g009
Figure 10. Partial test results. (a) Upward angle, clear sky. (b) Wide angle, backlighting. (c) Clear sky, front lighting. (d) Overcast, downward angle. Red bounding boxes represent orange_T class, blue bounding boxes represent orange_G class.
Agronomy 15 00687 g010
Figure 11. Detection result visualization. Red bounding boxes represent orange_T class, blue bounding boxes represent orange_G class. (a) Overcast, close distance. (b) Clear sky, under light. (c) Overcast, downward angle. (d) Clear sky, upward angle. (e) Overcast, occlusion. (f) Clear sky, long distance.
Agronomy 15 00687 g011aAgronomy 15 00687 g011b
Figure 12. Partial detection results visualization. In the first three images, the red border represents kumquat_T, and the blue border represents kumquat_G. In the following three images, the red border represents pomelo.
Agronomy 15 00687 g012aAgronomy 15 00687 g012b
Figure 13. Heat map visualization. (a) Overcast, close distance. (b) Clear sky, close distance. (c) Clear sky, upward angle. (d) Clear sky, downward angle. (e) Clear sky, backlighting. (f) Clear sky, front lighting.
Agronomy 15 00687 g013aAgronomy 15 00687 g013b
Figure 14. Demonstration of poor detection results. White bounding boxes represent missed detection targets, indicated by white arrows; black bounding boxes represent duplicate detection targets, indicated by blue arrows; green bounding boxes represent false detection targets, indicated by yellow arrows. (a) Clear sky, downward angle, with actual ground truth of 36 and 3. (b) Overcast, upward angle, with actual ground truth of 24 and 0. Red bounding boxes represent orange_T class, blue bounding boxes represent orange_G class.
Agronomy 15 00687 g014
Table 1. Test results.
Imageorange_Torange_G
(a)190
(b)1213
(c)173
(d)95
Table 2. Ablation experiment results. The bolded data represent the optimal value for the indicator in the respective column.
ModelMPDIoUEMACSPPCDEP (%)R (%)mAP (%)ParemetersFLOPs (G)
YOLOv11s××××84.269.277.79,413,57421.3
YOLO-M×××83.969.977.99,413,57421.3
YOLO-E×××85.368.877.98,428,03820.6
YOLO-C×××84.968.777.87,727,63819.8
YOLO-D×××83.773.881.42,881,04623.2
YOLO-MECD84.473.381.62,297,33421.6
Table 3. Comparison of different attention mechanisms. The bolded data represent the optimal value for the indicator in the respective column.
ModelP (%)R (%)mAP (%)Size (MB)FLOPs (G)Parameters
YOLOv11s84.269.277.718.221.39,413,574
YOLOv11s-CBAM84.968.877.616.820.78,688,168
YOLOv11s-ECA84.368.977.616.320.58,425,417
YOLOv11s-GAM83.270.277.928.825.814,981,574
YOLOv11s-CA84.36977.716.420.58,451,062
YOLOv11s-EMA (ours)85.368.877.916.320.68,428,038
Table 4. Comparison of different loss functions. The bolded data represent the optimal value for the indicator in the respective column.
Loss FunctionP (%)R (%)F1 (%)mAP (%)
CIou84.269.27677.7
DIoU84.968.675.977.4
GIoU84.769.376.277.9
EIoU84.768.875.977.4
SIoU84.669.276.177.7
ShapeIoU84.269.37677.8
FocalerIoU85.868.576.277.7
MPDIoU (ours)83.969.976.377.9
Table 5. Comparison of detection framework architectures for three algorithms. The bolded data represent the optimal value for the indicator in the respective column.
MethodP (%)R (%)F1 (%)mAP (%)ParametersSize (MB)FLOPs (G)
YOLOv11s84.269.27677.79,413,57418.221.3
YOLOv11s+P285.274.679.581.89,559,64018.628.6
YOLOv11s+RDL83.773.878.481.42,881,0465.923.2
Table 6. Comparison of different models. The bolded data represent the optimal value for the indicator in the respective column.
ModelP (%)R (%)F1 (%)mAP (%)ParametersSize (MB)FLOPs (G)
YOLOv8s85.568.876.277.811,126,35821.428.6
YOLOv9s84.669.876.578.47,028,90815.227.6
YOLOv10s85.368.375.676.18,036,50815.724.8
YOLOv11s84.269.27677.79,413,57418.221.3
YOLO-MECD (ours)84.473.378.581.62,297,3344.6621.6
Table 7. Pomelo and kumquat dataset information.
DatasetNumber of ImagesNumber of Labels
kumquat505074
pomelo2001417
Table 8. Experimental results of original and improved models on different datasets. The bolded data represent the optimal value for the indicator in the respective column.
ModelP (%)R (%)F1 (%)mAP (%)Size (MB)
YOLOv11s-pomelo87.879.583.485.218.2
YOLO-MECD-pomelo88.176.181.7864.7
YOLOv11s-kumquat74.649.859.758.618.2
YOLO-MECD-kumquat75.462.168.171.54.7
Table 9. Specific test results.
Code Nameorange_Torange_GError DetectionRepetition DetectionMissed Detection
(a)334237
(b)250021
Table 10. Comparison of detection performance.
Detection MethodP (%)R (%)mAP (%)
YOLO-MECD (ours)84.8%73.1%81.9%
manual detection75.6%67.2%72.8%
Disclaimer/Publisher’s Note: The statements, opinions and data contained in all publications are solely those of the individual author(s) and contributor(s) and not of MDPI and/or the editor(s). MDPI and/or the editor(s) disclaim responsibility for any injury to people or property resulting from any ideas, methods, instructions or products referred to in the content.

