Article

Molecular Characterization of an EMS-Induced Ab-γg-Rich Saponin Mutant in Soybean (Glycine max (L.) Merr.)

1
Department of Applied Biosciences, Kyungpook National University, Daegu 41566, Republic of Korea
2
Faculty of Agriculture, Iwate University, 3-18-8 Ueda, Morioka 020-8550, Japan
3
Upland-Field Machinery Research Center, Kyungpook National University, Daegu 41566, Republic of Korea
4
Department of Agriculture, Forestry and Bioresources, Seoul National University, Seoul 08826, Republic of Korea
*
Author to whom correspondence should be addressed.
Agronomy 2025, 15(3), 648; https://doi.org/10.3390/agronomy15030648
Submission received: 3 February 2025 / Revised: 27 February 2025 / Accepted: 2 March 2025 / Published: 5 March 2025
(This article belongs to the Special Issue Advances in Crop Molecular Breeding and Genetics—2nd Edition)

Abstract

:
Soybean is particularly known for accumulating saponins in its seeds. This study aimed to identify a causal gene to control an increase in Ab-γg saponin in PE1607 from an EMS-treated population of the soybean cultivar Pungsannamul. Segregation analysis in F2 seeds verified that a single recessive allele controlled the increased Ab-γg saponin in PE1607. Bulk segregant analysis and mutant individuals identified the candidate region, containing the previously reported Sg-3 (Glyma.10G104700) gene, encoding a glucosyltransferase responsible for conjugating glucose as the third sugar at the C-3 position of the aglycone. NGS identified SNPs in the upstream of the Sg-3 gene, designated as the sg-3b allele. Expression analysis revealed that PE1607 exhibited a threefold decrease in Sg-3 expression in the hypocotyls compared to the Pungsannamul. Moreover, Sg-3 expressions significantly differed between the hypocotyls and cotyledons in developing seeds, with relatively low expression observed in the cotyledons. The results conclude that sg-3b allele may contribute to the reduced Sg-3 expression, resulting in an increase in Ab-γg saponin in PE1607. In addition, in the cotyledons, DDMP-βg and DDMP-βa saponins are present, containing rhamnose instead of glucose as the third sugar at the C-3 position of aglycone. This suggests that Sg-3, known as glucosyltransferase, does not significantly contribute to saponin biosynthesis in cotyledons.

1. Introduction

Soybeans are a globally significant crop valued for their vegetative oil and protein meals [1,2,3]. Soybean seeds primarily comprise protein, oil, carbohydrates, and secondary metabolites such as isoflavones and saponins [4]. In mature soybean seeds, saponins constitute 0.62–6.16% of the hypocotyls dry weight [5] and comprise approximately 0.2–0.5% of the entire soybean seed [6]. Notably, saponins are predominantly concentrated in the hypocotyls rather than the cotyledons in mature soybean seeds [7].
Saponins are triterpene compounds consisting of sugar moieties and an aglycone [8]. In soybean, saponins are classified into two main groups: group A and DDMP (2,3-dihydro-2,5-dihydroxy-6-methyl-4H-pyran-4-one) saponins ([9,10], Figure S1a). The aglycone of group A saponins, soyasapogenol A (3β, 21β, 22β, 24-tetrahydroxyolean-12-ene; SS-A), features a hydroxyl group at the C-21 position, while the aglycone of DDMP saponins and soyasapogenol B (3β, 22β, 24-trihydroxyolean-12-ene; SS-B) does not [11]. A sugar moiety is also attached to the C-3 position of both group A and DDMP saponins. The sugar moiety begins with glucuronic acid (GlcUA) as the first sugar. The second sugar can be either galactose (Gal) or arabinose (Ara), named γg and γa, respectively [10]. Glucose (Glc) and rhamnose (Rha) can comprise the third sugar. When the second sugar is Gal, the sugar combinations –GlcUA–Gal–Glc and –GlcUA–Gal–Rha are designated as αg and βg saponins, respectively. When the second sugar is arabinose (Ara), the sugar combinations –GlcUA–Ara–Glc and –GlcUA–Ara–Rha are designated as αa and βa saponins, respectively [10]. Furthermore, group A saponins possess an additional sugar moiety at the C-22 position, whereas DDMP saponins feature a DDMP moiety [10,12]. The presence of the DDMP moiety renders DDMP saponins prone to hydrolysis and photooxidation, leading to the formation of group B and group E saponins [13]. The soybean saponins are classified based on their moiety composition and nomenclature, as illustrated in Figure S1b.
Group A saponins are considered partly responsible for the unpleasant aftertaste and bitterness associated with soybean-based foods attributed to the presence of an additional sugar moiety with an acetylated second sugar at the C-22 position [14,15]. However, the degradation derivatives of DDMP saponins and group B saponins have been demonstrated to possess various beneficial properties and functions. For example, group B saponins have been shown to exert an antiviral effect on HIV or HSV in vitro [16,17,18,19]. Additionally, group B saponins isolated from soybeans could suppress human colon cancer cell proliferation by inducing macroautophagy [20,21].
Regarding saponin biosynthesis, UDP-dependent glycosyltransferases (UGTs) involved in the attachment of sugars to the aglycone of soybean saponins have been identified in previous studies. In soybean, five UGTs have been identified to be involved in saponin biosynthesis to date, namely Sg-1, GmSGT2, Sg-4, GmSGT3, and Sg-3 [22,23,24,25]. Firstly, the incorporation of the second sugar at the C-22 position of group A saponins is catalyzed by two types of glycosyltransferases, xylosyltransferase (UGT73F4), and glucosyltransferase (UGT73F2). Sg-1 (Glyma.07G254600) encodes a glycosyltransferase that is present in two different alleles, Sg-1a and Sg-1b [23]. Then, the incorporation of galactose as the second sugar at the C-3 position was proposed to be catalyzed by a galactosyltransferase (UGT73P2) encoded by GmSGT2 (Glyma.11G053400), as confirmed through in vitro enzymatic activity assays [22]. Furthermore, the possible presence of arabinose as an additional second sugar at the C-3 position was supported by research conducted through overexpression and null mutants of Sg-4 (Glyma.01G046300) encoding an arabinosyltransferase (UGT73P10) [24,26].
Regarding the third sugar at the C-3 position, rhamnose is attached by a rhamnosyltransferase (UGT91H4) encoded by GmSGT3 (Glyma.08G181000) [22,25]. Additionally, Sg-3 (Glyma.10G104700), encoding the glucosyltransferase (UGT91F11) responsible for the attachment of glucose to a third sugar moiety at the C-3 position, has been extensively investigated in previous research. The sg-3 deletion mutant was identified as the cultivar Mikuriya-ao, and was confirmed by a complementation test by introducing the wild-type Sg-3 gene [25,26]. Furthermore, two distinct sg-3 mutants were discovered in the ethyl methanesulfonate (EMS)-induced population derived from the cultivar Enrei, encompassing one nonsense and one missense mutant. In our previous study, a new nonsense mutant allele (sg-3a) was identified in an EMS-induced line of the Korean cultivar Pungsannamul [27]. These mutants explained the Ab-γg saponin-rich phenotype, attributed to the sg-3 gene’s role in governing the glucose sugar moiety at the C-3 position of soybean saponins. Considering this, the loss of Sg-3 function disrupted the biosynthesis of Ab-αg saponin, the predominant type of group A saponins, and led to the accumulation of Ab-γg saponin, which serves as the precursor for Ab-αg saponin (Figure S2).
In this study, we identified an EMS-induced mutant line, PE1607, originating from the EMS-treated Korean cultivar Pungsannamul, exhibiting increased Ab-γg saponin. This study sought to identify candidate genes governing elevated Ab-γg saponin contents in PE1607 using bulk segregant analysis (BSA) and resequencing analysis. Through BSA, a genomic region on chromosome 10 encompassing the Sg-3 gene was identified. Segregation analysis in F2 seeds confirmed that a single recessive allele controlled the accumulation of Ab-αg saponin. The expression level of Sg-3 was decreased in the hypocotyls of PE1607 compared to the wild-type Pungsannamul. This mutant line represents a new variant of the Sg-3 gene (sg-3b allele), exhibiting single nucleotide polymorphism (SNP) variation in the upstream region rather than the coding region.

2. Materials and Methods

2.1. EMS-Induced Mutant Population

The previous study by Chae et al. [28] developed a total of 3774 lines of an EMS-induced population through advancement to the M4 generation by treating soybean seeds of the Korean cultivar Pungsannamul [29] with a 0.3% EMS solution. PE1607 was isolated from this EMS-induced population by comparing the saponin phenotypes of hypocotyls, which exhibited an increased Ab-γg saponin phenotype, through thin-layer chromatography (TLC) analysis. To identify genomic regions controlling the increased Ab-γg saponin content in PE1607, two populations derived from the Jinpung × PE1607 and Uram × PE1607 crosses were developed. The wild-type Korean cultivars, Jinpung [30] and Uram [31], showed normal saponin compositions similar to that of Pungsannamul. The initial cross was conducted during the summer of 2020 and 2021 at the experimental field of Kyungpook National University, located in Gunwi (36°07′ N, 128°38′ E), Republic of Korea. Then, F1 seeds of the two different crosses were planted to obtain F2 seeds during the winter of 2020–2021 and 2021–2022 at the greenhouse of Kyungpook National University, located in Daegu (35°89′ N, 128°61′ E), Republic of Korea. These F2 seeds from the two populations were used to analyze genotypic segregation, phenotypic segregation, and BSA.

2.2. Saponin Composition Determination in F2 Seeds by Thin-Layer Chromatography

Dried mature F2 seeds were obtained from the crosses of Uram × PE1607 and Jinpung × PE1607, respectively, and separated into hypocotyls and cotyledons. The hypocotyls were then utilized to assess the saponin phenotype through thin-layer chromatography (TLC) analysis. The thin-layer chromatography (TLC) analysis, as described by Sundaramoorthy et al. [10], was conducted with minor modifications. Mature dry seeds were utilized for saponin extraction. A 10-fold volume (v/w) of 80% (v/v) aqueous methanol was added to isolated hypocotyl individually and incubated at room temperature for 10 h. Subsequently, 7 μL of hypocotyl extracts were gently loaded onto a TLC plate (TLC silica gel 60 F254, Merck, Darmstadt, Germany). A solution of chloroform:methanol:water (65:35:10, v/v) was prepared for 4 h, and the lower phase of the solution was saturated in the developing chamber for 1 h. The TLC plate with hypocotyl extracts was in the chamber for 50 min and dried at 90 °C for 10 min. Subsequently, the dried plate was incubated in 10% (v/v) H2SO4 for 10 min, and the bands of saponins were visualized after drying at 100 °C for 15 min.

2.3. Saponin Composition Quantification in the Two Parental Lines by LC-PDA-MS/MS

To detect and quantify the saponin contents in the mutant (PE1607) and Pungsannamul soybean lines, liquid chromatography with a photodiode array and tandem mass spectrometry (LC-PDA-MS/MS) coupled with high-performance liquid chromatography (HPLC) was performed [32]. Saponins were extracted from the hypocotyls of dried mature seeds by soaking them in 50-fold volumes (v/w) of 80% aqueous methanol (v/v), with a single hypocotyl used per replicate. Details on the LC-PDA-MS/MS analysis are provided in previous studies [10,27]. The saponin extraction was assessed with UV (205 nm) and MS spectra, and the analysis was performed using XCALIBUR software version 3.1 (Thermo Fisher Scientific, Santa Clara, CA, USA).

2.4. Mapping Analysis and Whole-Genome Resequencing

The cetyltrimethylammonium bromide (CTAB) extraction method was employed for DNA extraction from the remaining cotyledons (~50 mg) [33]. The genomic DNA of F2 seeds and parental lines (Uram, Jinpung, and PE1607) were used for genotyping using the Affymetrix 180K Axiom® SNP array (performed by DNALINK, Inc., Seoul, Republic of Korea) and for subsequent mapping analysis to identify genomic regions controlling increased Ab-γg saponin in PE1607 [34]. First, BSA was conducted using SNP data from wild-type bulk DNA and mutant bulk DNA of the Uram × PE1607 F2 population (Table S1). Next, 9 F2 mutant lines of Uram × PE1607 were used for narrowing down the candidate genomic region interval. Similarly, 18 F2 individual lines of the Jinpung × PE1607 were also used for narrowing down the genomic region interval (Table S1).
Genomic DNA of PE1607 and Pungsannamul were extracted for whole-genome resequencing conducted by next-generation sequencing (NGS) on the Illumina HiSeqTM 2500 platform (Macrogen, Seoul, Republic of Korea) using paired-end resequencing libraries. Filtered high-quality reads were mapped to the soybean reference genome, Glycine max Wm82.a4.v1 from phytozome (https://phytozome-next.jgi.doe.gov/info/Gmax_Wm82_a4_v1, accessed on 27 June 2022), using a Burrows–Wheeler Aligner (BWA) [35]. Aligned files were converted to binary alignment map (BAM) files using SAMtools software (version 1.16) [36]. The BAM files of both PE1607 and Pungsannamul were analyzed for variants of the Sg-3 gene using the Integrative Genomics Viewer (IGV, version 2.16.0).

2.5. Sg-3 Gene Sequencing and Genotyping

To identify Sg-3 gene variants from resequencing analysis, the genomic DNA of Pungsannamul and PE1607 was performed with a polymerase chain reaction (PCR), and the Sg-3 upstream and coding region were sequenced. The PCR was prepared using DiaStar™ Taq DNA Polymerase (5 U/µL, SolGent, Daejeon, Republic of Korea) following its protocol and conducted under the following conditions: initial denaturation at 95 °C for 5 min, followed by 40 cycles of denaturation at 95 °C for 30 s, annealing at 55–58 °C for 30 s, and extension at 72 °C for 60 s. The final extension step was carried out at 72 °C for 6 min. The primer sequences are detailed in Table S2. The PCR product was purified with the HiGene™ Gel and PCR Purification System (BIOFACT, Daejeon, Republic of Korea) and sequenced and analyzed by a sequencing service (SolGent, Daejeon, Republic of Korea).

2.6. Development of an Sg-3b Allele Genotyping Assay

For the Sg-3 genotyping assay, a SimpleProbe was designed using the Lightcycler Probe Design Software 2.0 (Version 1, Roche Applied Sciences, Penzberg, Germany) on the region of the target sequence. The Sg-3 genotyping assay was conducted with an asymmetric mixture of primers [0.5 µM forward (5′-TAATTGTGGATTGCGGTGAGC-3′) and 0.2 µM reverse (5′-AGGGTTCACATGACCCACTG-3′) with a 5:2 asymmetric mix of primers]; the SimpleProbe was used at a concentration of 2 µM of 5′-FAM-SPC- GGCATACTATCAATTCTAGAAGGAACTGTCTT-phosphate-3′. The genotyping assay was prepared using DiaStar™ Taq DNA Polymerase (5 U/µL, SolGent, Daejeon, Republic of Korea) with the addition of 2 µM of SimpleProbe. The LightCycler® 480 Real-Time PCR System (Roche, Basel, Switzerland) was used to perform the assay, conducted under the following conditions: 95 °C for 5 min, followed by 50 cycles of denaturation at 95 °C for 15 s, annealing at 58 °C for 15 s, and extension at 72 °C for 15 s and the final extension step was carried out at 72 °C for 5 min. Then, a melting curve step was carried out from 55 °C to 70 °C, and the fluorescence was measured every 0.1 °C. The wild-type allele of Uram and Jinpung exhibited a peak at 66 °C, whereas the peak of the mutant allele (sg-3b) of PE1607 appeared at 62 °C and heterozygous alleles exhibited both peaks (Figure S3).

2.7. RNA Isolation and Quantitative Real-Time PCR (qRT-PCR)

RNA extraction was performed from samples when the seed fresh weight reached 200 mg at the seed developing stages. The seeds were separated into hypocotyls and cotyledons before extraction using the QIAzol® Lysis Reagent (QIAGEN, Germantown, MD, USA), with three hypocotyls (~10 mg) and one cotyledon (~100 mg) individually used per replicate. In order to eliminate potential DNA contamination, recombinant DNase I (Takara Bio, Kusatsu, Shiga, Japan) was applied. The first-strand cDNA was synthesized with the DiaStar™ RT Kit (SolGent, Daejeon, Republic of Korea) and oligo-dT (20). The Cons7 gene from soybean served as the reference gene [37]. The qRT-PCR was prepared utilizing the WizPure™ qPCR Master (SYBR; Wizbiosolutions, Seongnam, Republic of Korea) and performed using the LightCycler® 480 Real-Time PCR System (Roche, Basel, Switzerland) under the following conditions: initial denaturation at 94 °C for 5 min, 40 cycles of denaturation at 94 °C for 10 s, annealing at 58 °C for 10 s, extension at 72 °C for 20 s, and final extension at 72 °C for 5 min. The primer details are provided in Table S2.

2.8. Statistical Analysis and cis-Elements Analysis

The chi-square analysis and the Student’s t-test were performed using the IBM SPSS Statistics version 26.0 program (SPSS Inc., Chicago, IL, USA). The chi-square analysis was conducted based on the co-segregation ratio of the F2 population. Additionally, a Student’s t-test was performed to analyze the saponin concentration and the relative expression of the Sg-3 gene.
The cis-elements analysis was conducted using the New PLACE, a database of plant cis-acting regulatory DNA elements (https://www.dna.affrc.go.jp/PLACE/?action=newplace, accessed on 19 February 2025) [38].

3. Results

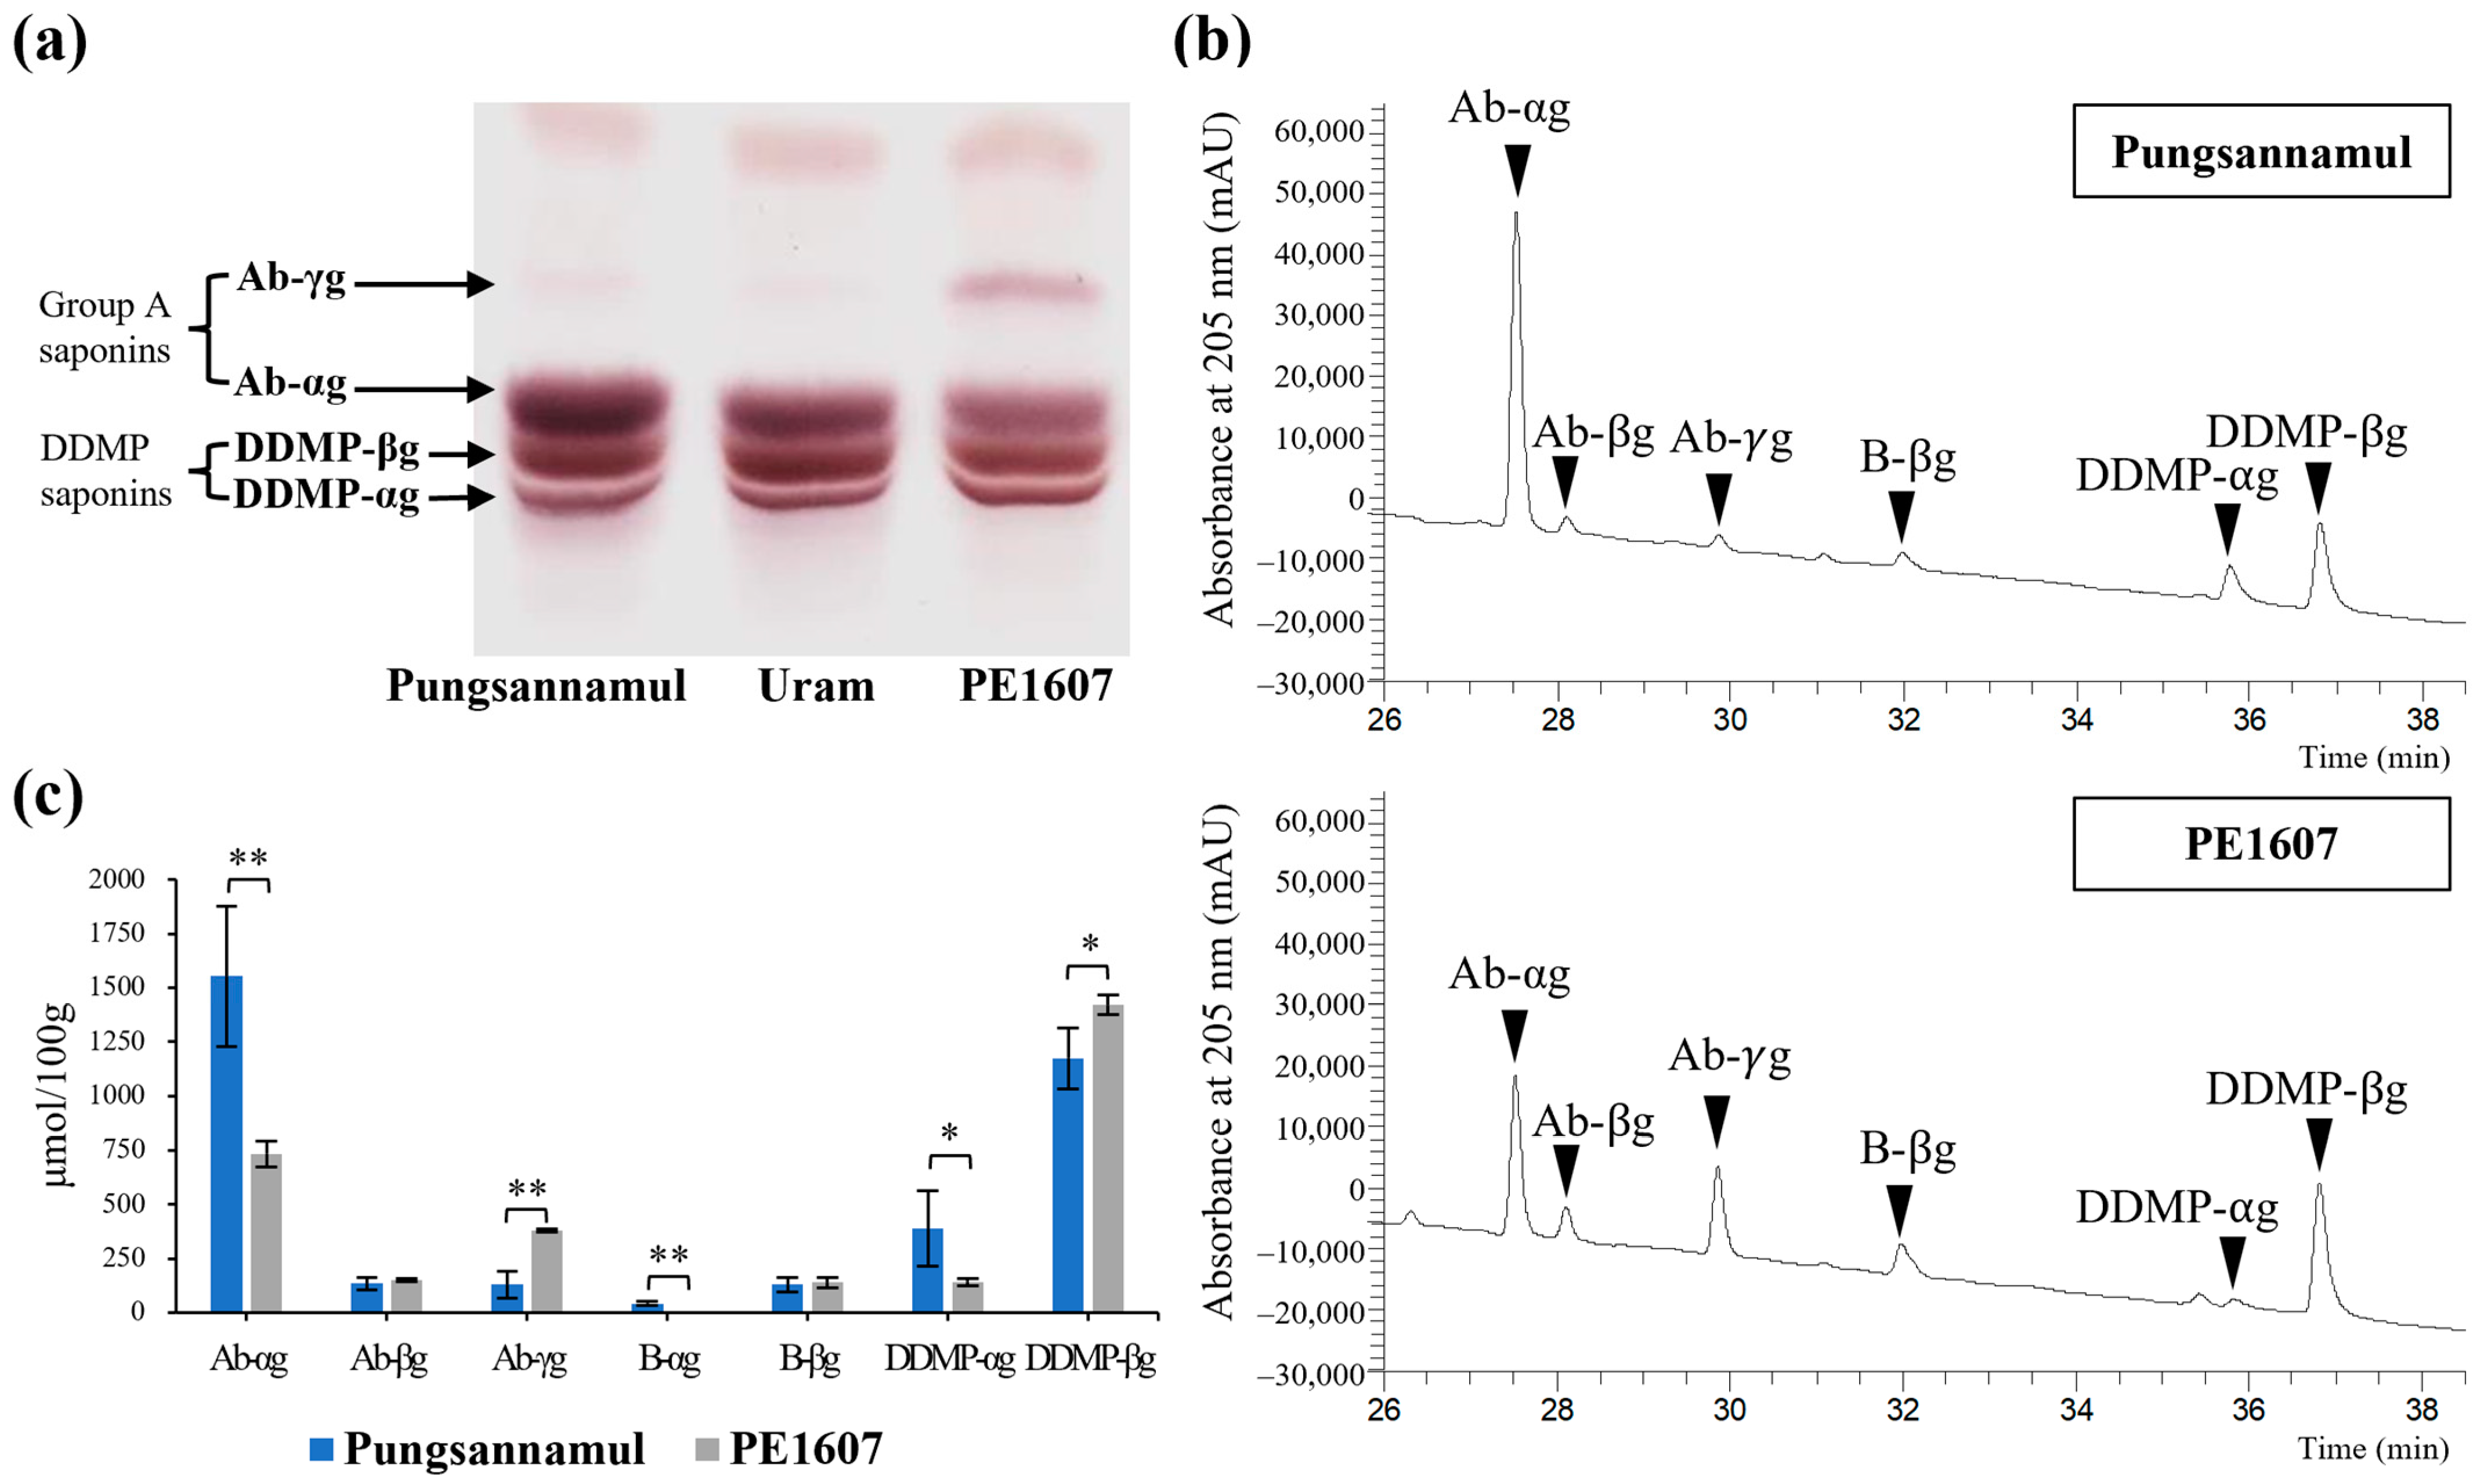
3.1. Isolation of an Ab-γg Saponin Rich Mutant Line

The study assessed the saponin composition in an EMS-induced population through TLC analysis. In soybean, saponins are abundant in seed hypocotyls rather than in cotyledons and other plant tissues [7]. Dried mature seed hypocotyls were utilized for the TLC analysis. Among the mutant lines, PE1607 was found to exhibit elevated Ab-γg saponin content compared to its parental lines, Pungsannamul and Uram (Figure 1a). LC-PDA-MS/MS revealed a notable decrease in the Ab-αg saponin peak and an increase in the Ab-γg saponin peak in PE1607 compared to Pungsannamul, with retention times corresponding to Ab-αg and Ab-γg saponins, respectively (Figure 1b). Concerning their concentration, the amount of Ab-αg saponin was reduced approximately 2-fold, whereas the amount of Ab-γg saponin was significantly increased in PE1607 compared to Pungsannamul (Figure 1c). This result can be explained by the relationship between Ab-γg and Ab-αg as precursors and products (Figure S2). However, DDMP-βg exhibited an increase, while DDMP-αg was reduced in PE1607 compared to Pungsannamul (Figure 1c). This result indicates that the change in the accumulation of DDMP-αg and DDMP-βg is associated with the metabolic flux across the saponin biosynthetic pathway in soybean.

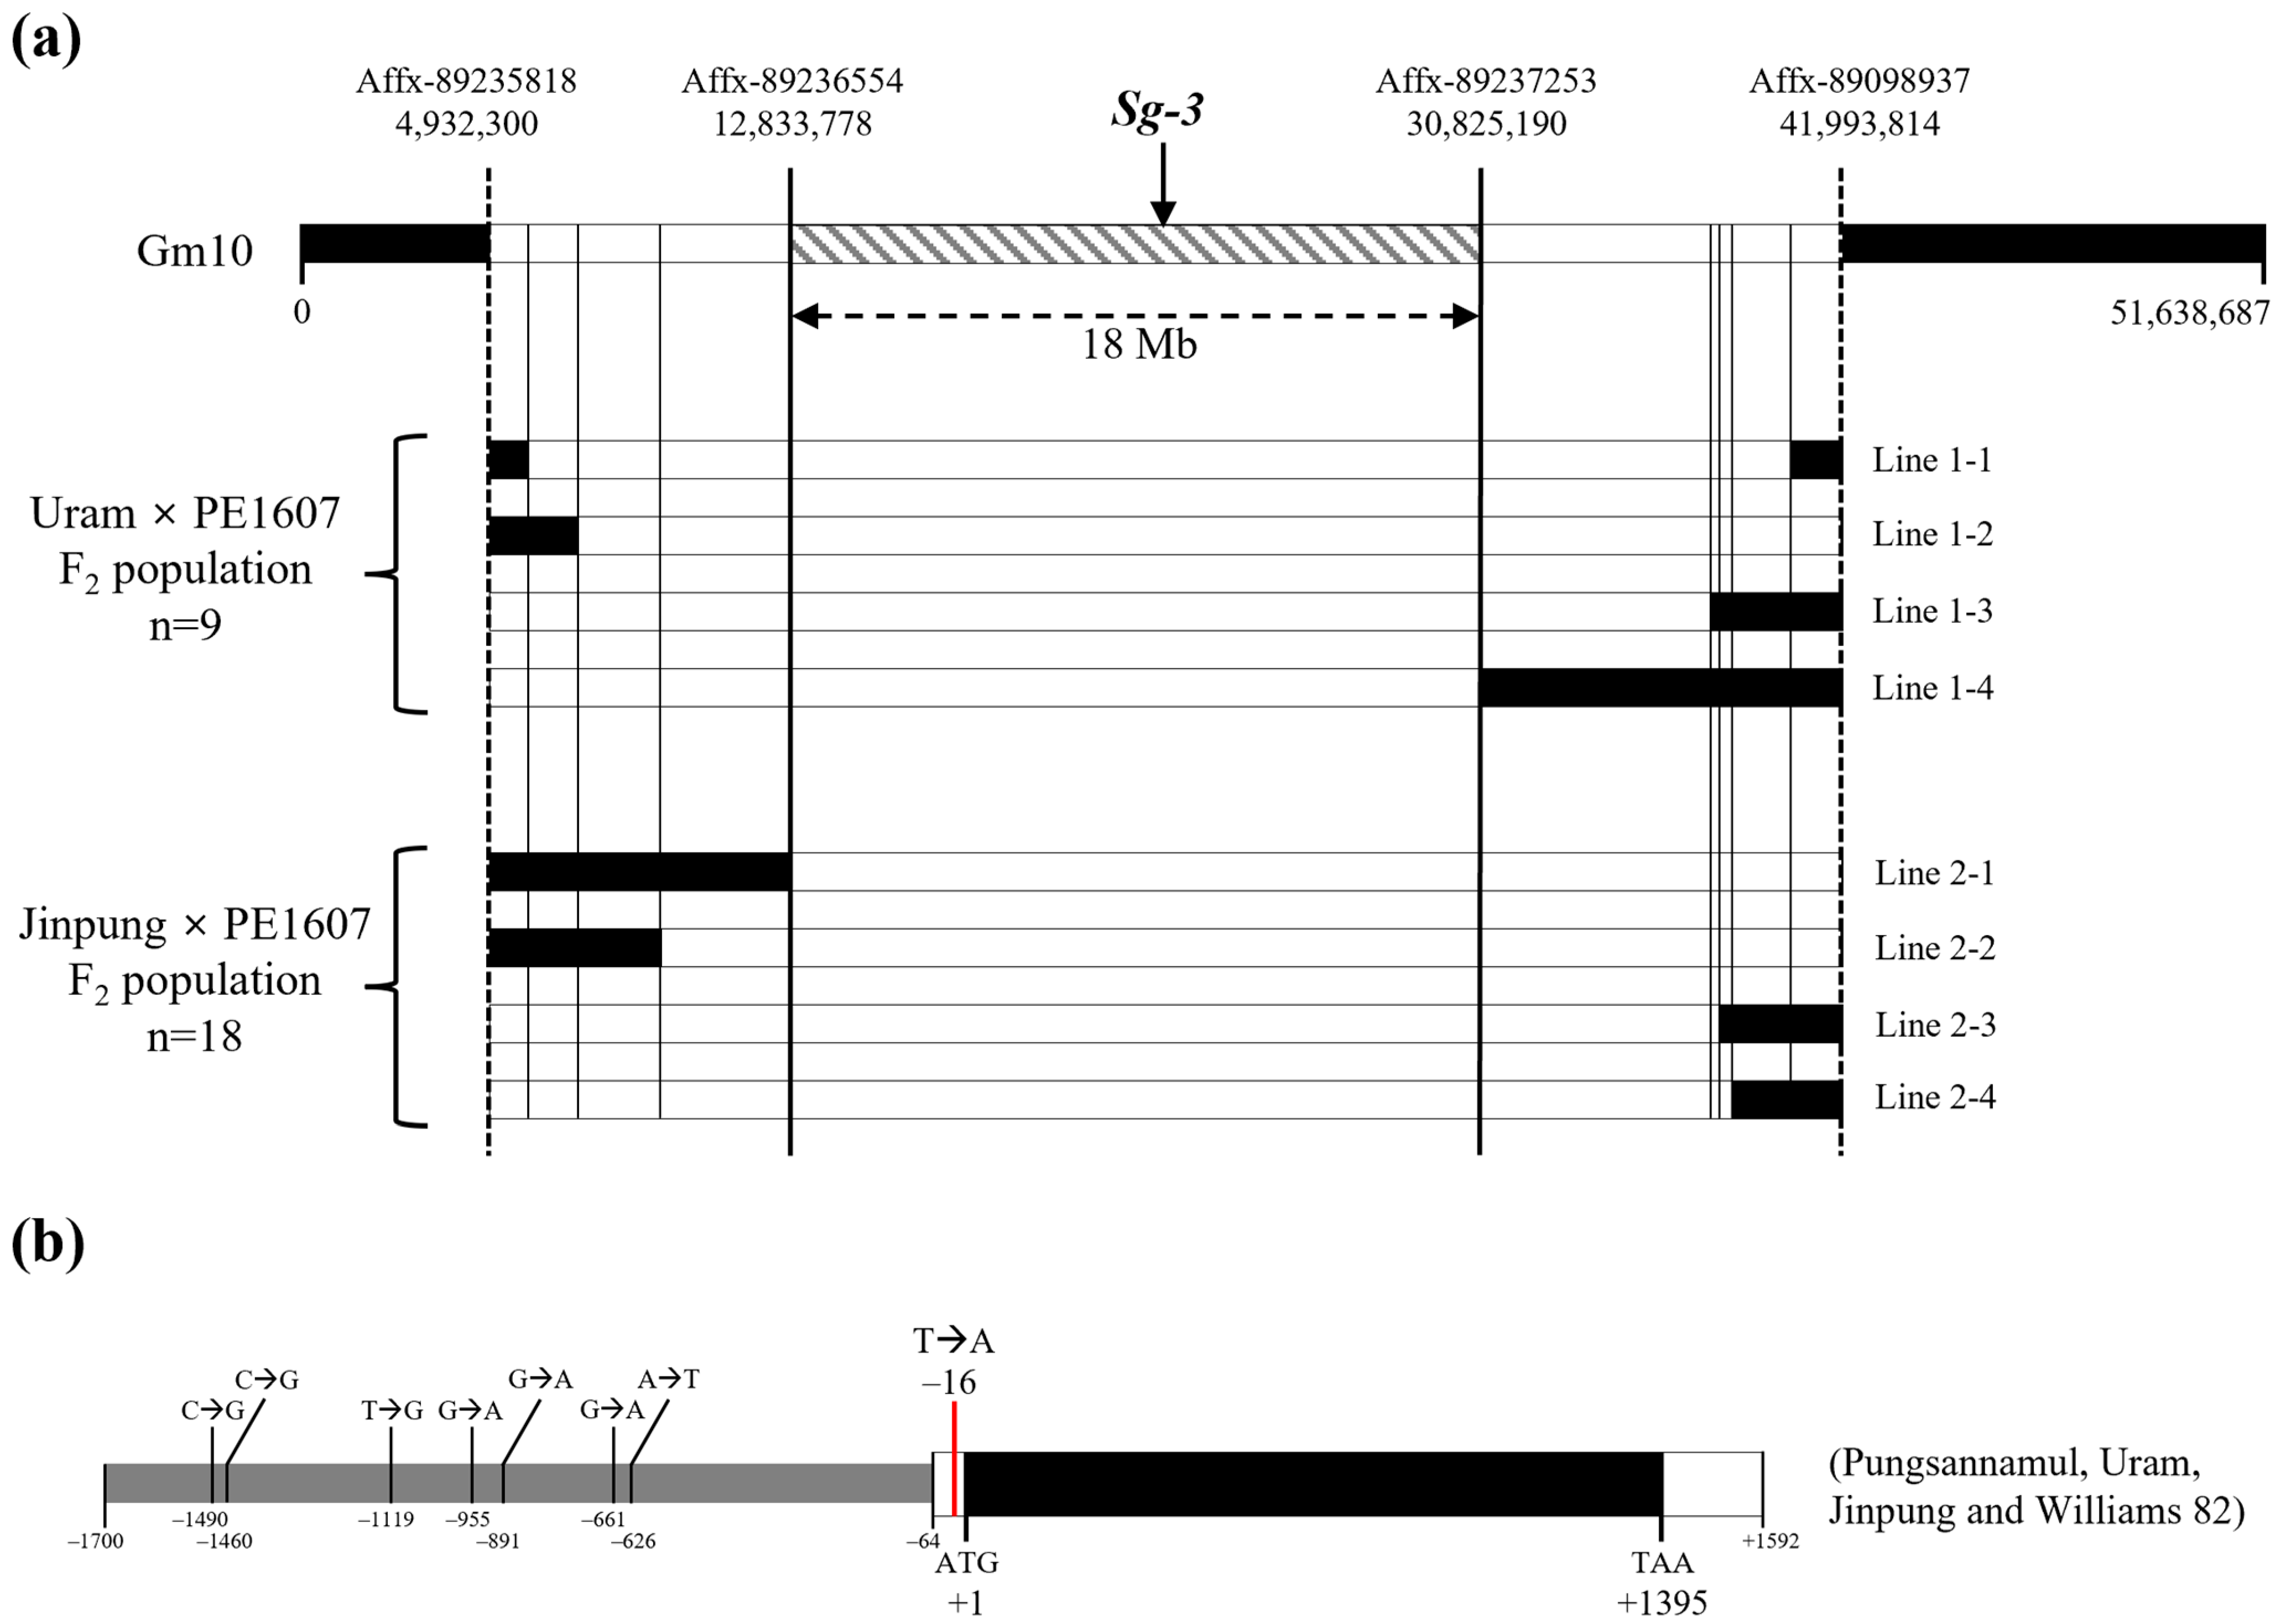
3.2. Mapping Analysis of the PE1607 Mutant

A total of 180,962 SNP loci were analyzed using the Affymetrix 180K Axiom® SNP array and were utilized for the candidate region mapping analysis. When comparing the SNPs in Uram and PE1607, a total of 36,109 SNPs were polymorphic. Similarly, a total of 34,635 polymorphic SNPs were identified between Jinpung and PE1607 and used for further analysis. Initially, through BSA in the wild-type bulk and mutant bulk from the Uram × PE1607 population, a candidate region was identified in chromosome 10 between Affx-89235818 (4,932,300 bp in Glycine max Wm82.a4.v1) and Affx-89098937 (41,993,814 bp in Glycine max Wm82.a4.v1). Next, the interval region was narrowed down using 9 individual mutants and 18 individual mutants from Uram × PE1607 and Jinpung × PE1607, respectively (Table S1). The overlapping region was refined to approximately 18 Mb between 12,833,778 bp and 30,825,190 bp in chromosome 10 (Figure 2a). In this interval, 208 genes are annotated, including the Sg-3 gene (Table S3).

3.3. Segregation of the Ab-γg Saponin-Rich Phenotype Among F2 Seeds of Two Segregating Populations

The segregation analysis results in two segregating populations are shown in Table 1. A total of 146 F2 seeds from Uram × PE1607 and 74 F2 seeds from Jinpung × PE1607 were analyzed for saponin composition through TLC analysis. The mutant lines exhibited an elevated Ab-γg saponin content compared to the wild-type, with a phenotypic ratio of 3:1 (wild-type:Ab-γg saponin rich) (Figure S4, Table 1). The SNPs in the region upstream of Sg-3 were designated as the sg-3b allele (Figure 2b). A single SNP in the 5′–UTR, selected to represent SNPs in the region upstream of Sg-3, was used for the genotyping assay (Figure 2b and Figure S3). Co-segregation analysis showed an acceptable fit to a ratio of 1:2:1 (wild-type:heterozygous:Ab-γg saponin rich) in the Uram × PE1607 (χ2 value = 0.18, p = 0.91) and the Jinpung × PE1607 (χ2 value = 0.04, p = 0.98) segregating populations (Table 1). This result suggests that a single recessive allele controls the Ab-γg saponin-rich phenotype.

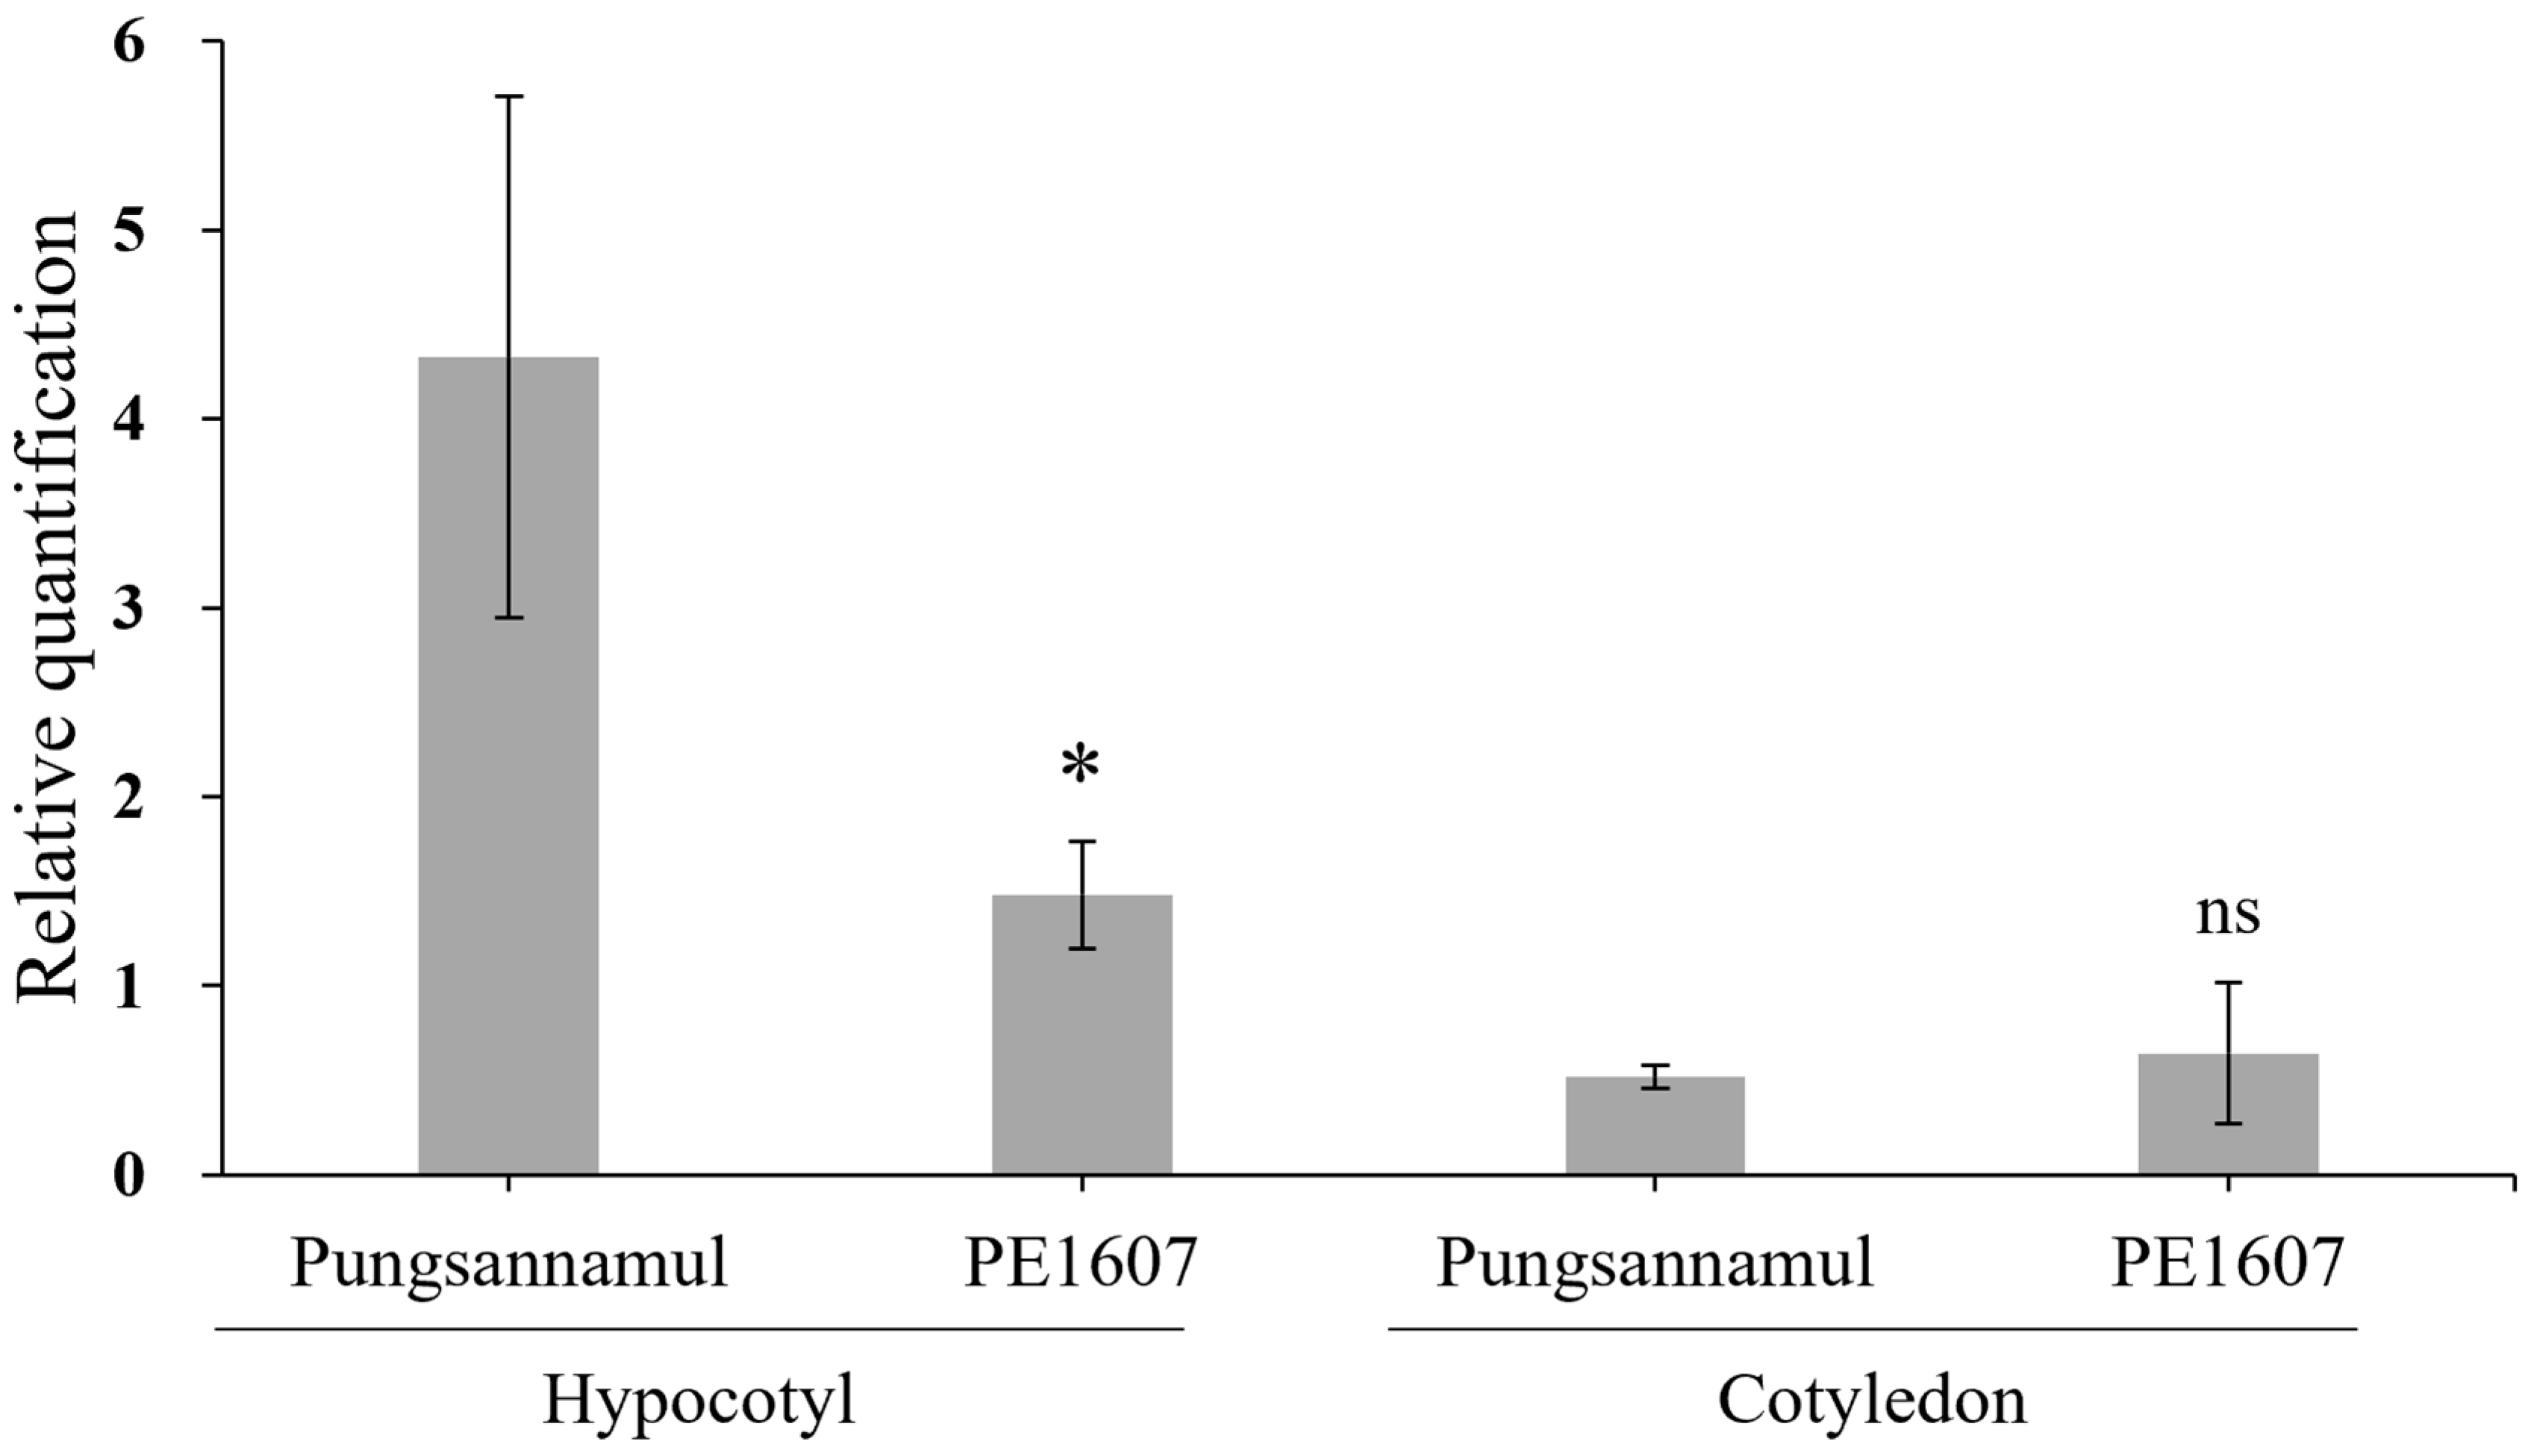
3.4. Molecular Analysis of the Sg-3 Mutant

Based on the mapping results, the Sg-3 gene was identified to be located within the candidate region (Figure 2a). Additionally, the Ab-γg saponin-rich phenotype closely resembled that of the previously reported sg-3 mutant [25,27]. To confirm whether PE1607 is indeed a sg-3 mutant, a sequencing analysis of the Sg-3 coding region was conducted. However, no polymorphisms were identified in the Sg-3 coding region when compared to Pungsannamul, Jinpung, Williams 82, and PE1607 (Figure 2b). To further investigate the causal mutations, the expression levels of Sg-3 were assessed in hypocotyls and cotyledons of developing seeds using qRT-PCR (Figure 3). Interestingly, the expression of Sg-3 in the hypocotyls of PE1607 was significantly lower compared to Pungsannamul (p < 0.05). However, expression levels of the Sg-3 gene in the cotyledons of both PE1607 and Pungsannamul were relatively low. To identify Sg-3 gene variants, resequencing was conducted by NGS, utilizing the Williams 82 reference genome as a baseline, and comparisons were performed with the Pungsannamul and PE1607. Eight SNPs in the upstream region of the Sg-3 gene in PE1607 were identified (Figure 2b). Ultimately, the mutations in the upstream region of Sg-3 in PE1607 may result in decreased expression levels, potentially influencing the phenotype, particularly in relation to Ab-γg accumulation in hypocotyls.

4. Discussion

Chemical mutagenesis has successfully been applied to various plants to generate mutant plants, including soybeans. Many enzyme types are involved in the biosynthesis of soybean saponins, which are highly complex compounds. In our previous study, a mutant population was developed from the EMS-mutagenized Pungsannamul to discover new genetic materials that exhibit altered saponin composition. Of these mutant lines with changes in DDMP saponin content, PE2248 and PE2371 were identified to lack DDMP saponins due to a mutation in the Sg-9 gene [10]. Regarding group A saponins, PE1327 was identified as having a reduced content of group A saponins, associated with an allele of the Sg-5 gene [39]. Additionally, we identified the PE1905 mutant with an increased Ab-γg (Af) and Ab-δ saponin, and the PE1539 mutant with an increase in Ab-γg saponin [27,40]. In this study, we discovered another EMS-induced mutant line, PE1607, with increased Ab-γg saponin.
In PE1607, BSA revealed a candidate region on chromosome 10 that was associated with the Ab-γg-rich saponin phenotype. Utilizing genotypic data from 9 and 18 individual mutants of the Uram × PE1607 and Jinpung × PE1607 populations, we narrowed the candidate region to an interval between 12,833,778 bp and 30,825,190 bp in chromosome 10 (Table S1). Previous studies demonstrated that the Ab-γg (Af) saponin-rich phenotype was associated with sg-3 mutant alleles [25,27]. In this study, a total of 208 genes, including the Sg-3 gene, were located in this region, possibly indicating that Sg-3, Glyma.10G104700 was a candidate gene for the accumulation of Ab-γg saponin in PE1607 (Table S3). Through resequencing PE1607 and Sanger sequencing of the Sg-3 gene locus, eight SNPs were identified upstream of the Sg-3 gene and annotated as the sg-3b allele (Figure 2b). Expression analysis revealed significantly different expression levels of the Sg-3 gene in hypocotyls between Pungsannamul and PE1607 (Figure 3). Based on the results, the sg-3b allele in PE1607 exhibits gene expression variation compared to the Sg-3 gene. However, transcription factor genes in this interval region could not be ruled out due to there being no polymorphisms in the coding region of the Sg-3 gene and differences in expression levels of the Sg-3 gene between Pungsannamul and PE1607.
Ab-αg saponin accumulated in much higher concentrations in Pungsannamul hypocotyls than Ab-βg or Ab-γg saponins (Figure 1). Ab-γg saponin, the precursor of both Ab-αg and Ab-βg saponins, has two sugars, –GlcUA–Gal, at the C-3 position (Figure S1). The difference between Ab-αg and Ab-βg saponins is the presence of Glc and Rha as the third sugar at the C-3 position. This indicates that the biosynthesis of Ab-αg and Ab-βg saponins follows a competitive pathway controlled by Sg-3 and GmSGT3 genes, initiated with the precursor of Ab-γg saponin [25]. Additionally, the accumulation of Ab-αg in the hypocotyls suggests that GmSGT3 has a minimal catalytic affinity for utilizing Ab-γg saponin as a substrate compared to Sg-3. However, the accumulation of DDMP-αg and DDMP-βg saponins exhibited significant differences. In this study, as well as other previous studies, the concentration of DDMP-βg was slightly higher than that of DDMP-αg (Figure 1) [10,25,27]. This suggests that both Sg-3 and GmSGT3 exhibit an affinity for DDMP-γg as a substrate, with GmSGT3 demonstrating a marginally greater affinity than Sg-3.
Additionally, expression analyses were conducted in the hypocotyls of developing seeds. In hypocotyls, the expression levels of Sg-3 in PE1607 were significantly lower than those in Pungsannamul (Figure 3). This implies that the decreased expression of Sg-3 may lead to inadequate synthesis of the Sg-3 protein, potentially causing a decrease in Ab-αg saponin and an accumulation of Ab-γg saponin as its precursor. Similarly, for DDMP saponin, this leads to a reduction in DDMP-αg saponin and increased DDMP-βg saponin contents. Furthermore, in a previous study, the null mutant and the nonsense mutation of Sg-3 exhibited no accumulation of Ab-αg and DDMP-αg saponins [25,27]. In summary, a decrease in the expression level of the Sg-3 gene in PE1607 resulted in reduced levels of Ab-αg and DDMP-αg saponins alongside elevated levels of Ab-γg and DDMP-βg saponins.
In previous studies, the saponin contents in the cotyledons were reported to be different from those in the hypocotyls. In cotyledons, only two types of DDMP saponins, DDMP-βg and DDMP-βa, exist [41]. The sugar moiety of those saponins at the C-3 position is –GlcUA–Gal–Rha and –GlcUA–Ara–Rha, respectively (Figure S1). GmSGT2 was proposed to conjugate Gal as the second sugar at the C-3 position, and Sg-4 could attach Ara as the second sugar at the C-3 position [22,24]. Moreover, Sg-3 and GmSGT3 attach Glc and Rha as the third sugar at the C-3 position, respectively [22,25,27]. These saponin biosynthesis genes and the saponin contents of the cotyledons suggest that Sg-3 does not contribute to the accumulation of saponin in the cotyledons. Furthermore, in this study, an expression analysis of the Sg-3 gene was also conducted in the cotyledons of developing seeds (Figure 3). Sg-3 expression levels were significantly lower in the cotyledons than in the hypocotyls in Pungsannamul. Additionally, the expression of the Sg-3 gene in cotyledons did not exhibit significant differences between PE1607 and Pungsannamul, as both displayed low expression levels. Taken together, the accumulation of DDMP-βg and DDMP-βa in the cotyledons, the role of the Sg-3 gene as the glucosyltransferase at the C-3 position, and the low expression of Sg-3 suggest that the Sg-3 does not significantly contribute to the accumulation of saponin containing Glc moiety as the third sugar at the C-3 position in the cotyledons.
The upstream region of the Sg-3 gene in PE1607 contained eight SNPs (Figure 2b). To determine whether the SNPs affected Sg-3 expression through cis-acting elements, we analyzed their physical positions using the New PLACE database to identify overlapped positions with previously reported cis-acting elements [38]. As a result, four SNPs were identified to overlap with cis-acting elements (Figure S5). First, the SNP located 1490 bp upstream of the start codon, which resulted in a C-to-G conversion, was identified as RHERPATEXPA7 [42], which consists of the KCACGW sequence, with the CACG part being highly conserved. Second, 2 SNPs on 1119 bp and 626 bp upstream of the start codon were identified in POLASIG1 [43] and POLASIG2 [44,45,46]. Finally, the SNP located 661 bp upstream was overlapped with two different cis-acting elements, CCA1ATLHCB1 [47] and ARR1AT [48]. Among these, ARR1AT is known as an ARR1-binding element in Arabidopsis thaliana, and Arabidopsis response regulator 1 (ARR1) encodes a transcription factor responsive to cytokinin [48]. Similarly, previous studies reported that jasmonate (MeJA), a plant hormone, stimulates saponin biosynthesis in Centella asiatica, Galphimia glauca, and Panax notoginseng [49,50]. In particular, Yano et al. [9] demonstrated that the application of MeJA in soybean seedlings increased the expression of saponin biosynthetic genes, including BAS1, GmCYP72A61, GmCYP93E1, GmSGT2, and GmSGT3. Taken together, similar to the ARR1 response to cytokinin, some transcription factors influenced by MeJA may associate with the ARR1AT motif, potentially leading to affecting the Sg-3 expression in PE1607. Thus, future research should focus on exploring cis-acting elements to gain a deeper understanding of the expression of saponin biosynthetic genes, especially the Sg-3 gene in soybean.

5. Conclusions

We identified a mutant line, PE1607, derived from an EMS-induced population, which exhibited an increased level of Ab-γg with a decreased level of Ab-αg, as well as an increased level of DDMP-βg with a decreased level of DDMP-αg. The results of this study confirm that this mutant saponin phenotype was controlled by the sg-3b allele through BSA and co-segregation analysis of the phenotype and genotype from two F2 populations. In addition, the Sg-3 expression of PE1607 was significantly reduced in the hypocotyls of developing seeds compared to the wild-type, Pungsannamul. This study concluded that the sg-3b allele may cause a decrease in Sg-3 expression, leading to the mutant saponin phenotype observed in PE1607. Moreover, the expression of the Sg-3 gene in cotyledons of developing seeds was relatively lower than that in the hypocotyls of Pungsannamul. In cotyledon, DDMP-βg and DDMP-βa saponins accumulate, both of which contain Rha instead of Glc as the third sugar at the C-3 position. The Sg-3 gene, which functions as a glucosyltransferase to conjugate Glc as the third sugar at the C-3 position, may not be expressed in the cotyledons, suggesting that Sg-3 does not significantly contribute to saponin biosynthesis in cotyledons.

Supplementary Materials

The following supporting information can be downloaded at: https://www.mdpi.com/article/10.3390/agronomy15030648/s1, Figure S1: Chemical structures and nomenclature of saponins in soybean; Figure S2: Conjugation of glucose as a third sugar moiety in saponin biosynthesis; Figure S3: Genotyping analysis of sg-3b allele using a simpleprobe; Figure S4: Thin-layer chromatography (TLC) analysis of hypocotyl in F2 lines crossing with Uram and PE1607; Figure S5: The upstream region of the Sg-3 gene in Pungsannamul with SNP variation in PE1607; Table S1: The number of F2 population using for Affymetrix 180K Axiom® SNP array; Table S2: Primer sequence using in this paper; Table S3: Gene annotation in candidate region.

Author Contributions

Conceptualization, J.P. and J.T.S.; formal analysis, J.P., H.S. and C.T.; investigation, J.P. and H.S.; resources, J.-D.L.; writing—original draft preparation, J.P.; writing—review and editing, H.J., C.T., J.L., J.-D.L., H.S.S. and J.T.S.; visualization, J.P. and H.J.; validation, J.L. and H.S.S.; supervision, J.T.S.; project administration, J.T.S.; funding acquisition, J.T.S. All authors have read and agreed to the published version of the manuscript.

Funding

This research was supported by Basic Research Program through the National Research Foundation of Korea (NRF), funded by the Ministry of Education (RS-2023-00245755).

Data Availability Statement

Data are contained within the article and Supplementary Materials.

Conflicts of Interest

The authors declare no conflicts of interest.

References

  1. Riaz, M.N. Soy Applications in Food; CRC Press: Boca Raton, FL, USA, 2005. [Google Scholar]
  2. Sugano, M. Soy in Health and Disease Prevention; CRC Press: Boca Raton, FL, USA, 2005. [Google Scholar]
  3. Rotundo, J.L.; Marshall, R.; McCormick, R.; Truong, S.K.; Styles, D.; Gerde, J.A.; Gonzalez-Escobar, E.; Carmo-Silva, E.; Janes-Bassett, V.; Logue, J. European soybean to benefit people and the environment. Sci. Rep. 2024, 14, 7612. [Google Scholar] [CrossRef] [PubMed]
  4. Medic, J.; Atkinson, C.; Hurburgh, C.R. Current knowledge in soybean composition. J. Am. Oil Chem. Soc. 2014, 91, 363–384. [Google Scholar] [CrossRef]
  5. Shiraiwa, M.; Harada, K.; Okubo, K. Composition and content of saponins in soybean seed according to variety, cultivation year and maturity. Agric. Biol. Chem. 1991, 55, 323–331. [Google Scholar]
  6. Kim, S.-L.; Berhow, M.A.; Kim, J.-T.; Chi, H.-Y.; Lee, S.-J.; Chung, I.-M. Evaluation of soyasaponin, isoflavone, protein, lipid, and free sugar accumulation in developing soybean seeds. J. Agric. Food Chem. 2006, 54, 10003–10010. [Google Scholar] [CrossRef]
  7. Shimoyamada, M.; Harada, K.; Okubo, K. Saponin composition in developing soybean seed (Glycine max (L.) Merrill, cv. Mikuriyaao). Agric. Biol. Chem. 1991, 55, 1403–1405. [Google Scholar]
  8. Moses, T.; Papadopoulou, K.K.; Osbourn, A. Metabolic and functional diversity of saponins, biosynthetic intermediates and semi-synthetic derivatives. Crit. Rev. Biochem. Mol. Biol. 2014, 49, 439–462. [Google Scholar] [CrossRef]
  9. Yano, R.; Takagi, K.; Takada, Y.; Mukaiyama, K.; Tsukamoto, C.; Sayama, T.; Kaga, A.; Anai, T.; Sawai, S.; Ohyama, K. Metabolic switching of astringent and beneficial triterpenoid saponins in soybean is achieved by a loss-of-function mutation in cytochrome P450 72A69. Plant J. 2017, 89, 527–539. [Google Scholar] [CrossRef] [PubMed]
  10. Sundaramoorthy, J.; Park, G.T.; Komagamine, K.; Tsukamoto, C.; Chang, J.H.; Lee, J.D.; Kim, J.H.; Seo, H.S.; Song, J.T. Biosynthesis of DDMP saponins in soybean is regulated by a distinct UDP-glycosyltransferase. New Phytol. 2019, 222, 261–274. [Google Scholar] [CrossRef] [PubMed]
  11. Sawai, S.; Saito, K. Triterpenoid biosynthesis and engineering in plants. Front. Plant Sci. 2011, 2, 25. [Google Scholar] [CrossRef]
  12. Yoshiki, Y.; Kudou, S.; OKuBo, K. Relationship between chemical structures and biological activities of triterpenoid saponins from soybean. Biosci. Biotechnol. Biochem. 1998, 62, 2291–2299. [Google Scholar] [CrossRef]
  13. Guang, C.; Chen, J.; Sang, S.; Cheng, S. Biological functionality of soyasaponins and soyasapogenols. J. Agric. Food Chem. 2014, 62, 8247–8255. [Google Scholar] [CrossRef]
  14. Okubo, K.; Iijima, M.; Kobayashi, Y.; Yoshikoshi, M.; Uchida, T.; Kudou, S. Components responsible for the undesirable taste of soybean seeds. Biosci. Biotechnol. Biochem. 1992, 56, 99–103. [Google Scholar] [CrossRef]
  15. Rupasinghe, H.V.; Jackson, C.-J.C.; Poysa, V.; Di Berardo, C.; Bewley, J.D.; Jenkinson, J. Soyasapogenol A and B distribution in soybean (Glycine max L. Merr.) in relation to seed physiology, genetic variability, and growing location. J. Agric. Food Chem. 2003, 51, 5888–5894. [Google Scholar] [CrossRef]
  16. Nakashima, H.; Okubo, K.; Honda, Y.; Tamura, T.; Matsuda, S.; Yamamoto, N. Inhibitory effect of glycosides like saponin from soybean on the infectivity of HIV in vitro. Aids 1989, 3, 655–658. [Google Scholar] [CrossRef] [PubMed]
  17. Hayashi, K.; Hayashi, H.; Hiraoka, N.; Ikeshiro, Y. Inhibitory activity of soyasaponin II on virus replication in vitro. Planta Medica 1997, 63, 102–105. [Google Scholar] [CrossRef] [PubMed]
  18. Kinjo, J.; Yokomizo, K.; Hirakawa, T.; SHII, Y.; NOHARA, T.; UYEDA, M. Anti-herpes virus activity of fabaceous triterpenoidal saponins. Biol. Pharm. Bull. 2000, 23, 887–889. [Google Scholar] [CrossRef]
  19. Ikeda, T.; Yokomizo, K.; Okawa, M.; Tsuchihashi, R.; Kinjo, J.; Nohara, T.; Uyeda, M. Anti-herpes virus type 1 activity of oleanane-type triterpenoids. Biol. Pharm. Bull. 2005, 28, 1779–1781. [Google Scholar] [CrossRef]
  20. Ellington, A.A.; Berhow, M.; Singletary, K.W. Induction of macroautophagy in human colon cancer cells by soybean B-group triterpenoid saponins. Carcinogenesis 2005, 26, 159–167. [Google Scholar] [CrossRef]
  21. Ellington, A.A.; Berhow, M.A.; Singletary, K.W. Inhibition of Akt signaling and enhanced ERK1/2 activity are involved in induction of macroautophagy by triterpenoid B-group soyasaponins in colon cancer cells. Carcinogenesis 2006, 27, 298–306. [Google Scholar] [CrossRef]
  22. Shibuya, M.; Nishimura, K.; Yasuyama, N.; Ebizuka, Y. Identification and characterization of glycosyltransferases involved in the biosynthesis of soyasaponin I in Glycine max. FEBS Lett. 2010, 584, 2258–2264. [Google Scholar] [CrossRef]
  23. Sayama, T.; Ono, E.; Takagi, K.; Takada, Y.; Horikawa, M.; Nakamoto, Y.; Hirose, A.; Sasama, H.; Ohashi, M.; Hasegawa, H. The Sg-1 glycosyltransferase locus regulates structural diversity of triterpenoid saponins of soybean. Plant Cell 2012, 24, 2123–2138. [Google Scholar] [CrossRef]
  24. Takagi, K.; Yano, R.; Tochigi, S.; Fujisawa, Y.; Tsuchinaga, H.; Takahashi, Y.; Takada, Y.; Kaga, A.; Anai, T.; Tsukamoto, C. Genetic and functional characterization of Sg-4 glycosyltransferase involved in the formation of sugar chain structure at the C-3 position of soybean saponins. Phytochemistry 2018, 156, 96–105. [Google Scholar] [CrossRef] [PubMed]
  25. Yano, R.; Takagi, K.; Tochigi, S.; Fujisawa, Y.; Nomura, Y.; Tsuchinaga, H.; Takahashi, Y.; Takada, Y.; Kaga, A.; Anai, T. Isolation and characterization of the soybean Sg-3 gene that is involved in genetic variation in sugar chain composition at the C-3 position in soyasaponins. Plant Cell Physiol. 2018, 59, 797–810. [Google Scholar] [CrossRef]
  26. Takada, Y.; Tayama, I.; Sayama, T.; Sasama, H.; Saruta, M.; Kikuchi, A.; Ishimoto, M.; Tsukamoto, C. Genetic analysis of variations in the sugar chain composition at the C-3 position of soybean seed saponins. Breed. Sci. 2012, 61, 639–645. [Google Scholar] [CrossRef]
  27. Ko, J.; Sundaramoorthy, J.; Tsukamoto, C.; Park, J.; Lee, J.; Jo, H.; Lee, J.-D.; Seo, H.S.; Song, J.T. Genetic and Molecular Characterization of a New EMS-Induced Mutant without the Third Glucose Moiety at the C-3 Sugar Chain of Saponin in Glycine max (L.) Merr. Agronomy 2022, 12, 1598. [Google Scholar] [CrossRef]
  28. Chae, J.-H.; Dhakal, K.H.; Asekova, S.; Song, J.T.; Lee, J.-D. Variation of fatty acid composition in soybean’Pungsannamul’mutation population from EMS treatment. Curr. Res. Agric. Life Sci. 2013, 31, 45–50. [Google Scholar]
  29. Suh SugKee, S.S.; Kim HagSin, K.H.; Oh YoungJin, O.Y.; Kim KyungHo, K.K.; Cho SangKyun, C.S.; Kim YoungJin, K.Y.; Kim SooDong, K.S.; Park HoKi, P.H.; Park MoonSoo, P.M.; Cho SooYeon, C.S. A new soyabean variety for sprouts with small seeds and high yields, “Pungsan-namulkong”. RDA J. Crop Sci. 1997, 39, 120–124. [Google Scholar]
  30. Lee, C.; Choi, M.-S.; Kim, H.-T.; Yun, H.-T.; Lee, B.; Chung, Y.-S.; Kim, R.W.; Choi, H.-K. Soybean [Glycine max (L.) Merrill]: Importance as a crop and pedigree reconstruction of Korean varieties. Plant Breed. Biotechnol. 2015, 3, 179–196. [Google Scholar] [CrossRef]
  31. Jong Min, K.; Won Young, H.; Hyun Tae, K.; Young Hoon, L.; Man Soo, C.; Byong Won, L.; Sang Uk, S.; Jeong Hyun, S.; Ki Won, O.; Hong Tae, Y.; et al. Soybean cultivar for soy-paste, ‘Uram’ with mechanization harvesting, large seed, disease resistance and high yield. Korean J. Breed. Sci. 2016, 48, 301–306. [Google Scholar] [CrossRef]
  32. Takada, Y.; Sasama, H.; Sayama, T.; Kikuchi, A.; Kato, S.; Ishimoto, M.; Tsukamoto, C. Genetic and chemical analysis of a key biosynthetic step for soyasapogenol A, an aglycone of group A saponins that influence soymilk flavor. Theor. Appl. Genet. 2013, 126, 721–731. [Google Scholar] [CrossRef]
  33. Doyle, J.J.; Doyle, J.L. A rapid DNA isolation procedure for small quantities of fresh leaf tissue. Phytochem. Bull. 1987, 19, 11–15. [Google Scholar]
  34. Lee, Y.G.; Jeong, N.; Kim, J.H.; Lee, K.; Kim, K.H.; Pirani, A.; Ha, B.K.; Kang, S.T.; Park, B.S.; Moon, J.K. Development, validation and genetic analysis of a large soybean SNP genotyping array. Plant J. 2015, 81, 625–636. [Google Scholar] [CrossRef] [PubMed]
  35. Langmead, B.; Salzberg, S.L. Fast gapped-read alignment with Bowtie 2. Nat. Methods 2012, 9, 357–359. [Google Scholar] [CrossRef]
  36. Li, H.; Handsaker, B.; Wysoker, A.; Fennell, T.; Ruan, J.; Homer, N.; Marth, G.; Abecasis, G.; Durbin, R.; Subgroup, G.P.D.P. The sequence alignment/map format and SAMtools. Bioinformatics 2009, 25, 2078–2079. [Google Scholar] [CrossRef]
  37. Libault, M.; Thibivilliers, S.; Bilgin, D.; Radwan, O.; Benitez, M.; Clough, S.; Stacey, G. Identification of four soybean reference genes for gene expression normalization. Plant Genome 2008, 1, 44–54. [Google Scholar] [CrossRef]
  38. Higo, K.; Ugawa, Y.; Iwamoto, M.; Korenaga, T. Plant cis-acting regulatory DNA elements (PLACE) database: 1999. Nucleic Acids Res. 1999, 27, 297–300. [Google Scholar] [CrossRef]
  39. Sundaramoorthy, J.; Palaniswamy, S.; Park, G.T.; Son, H.R.; Tsukamoto, C.; Lee, J.-D.; Kim, J.H.; Seo, H.S.; Song, J.T. Characterization of a new sg-5 variant with reduced biosynthesis of group A saponins in soybean (Glycine max (L.) Merr.). Mol. Breed. 2019, 39, 144. [Google Scholar] [CrossRef]
  40. Park, C.W.; Kulkarni, K.P.; Kim, M.; Mukaiyama, K.; Tsukamoto, C.; Chung, G.; Song, J.T.; Lee, J.-D. Characterization of an EMS-induced soybean mutant with an increased content of Af saponin and a new component Ab-δ in the seed hypocotyl. Euphytica 2018, 214, 163. [Google Scholar] [CrossRef]
  41. Krishnamurthy, P.; Fujisawa, Y.; Takahashi, Y.; Abe, H.; Yamane, K.; Mukaiyama, K.; Son, H.-R.; Hiraga, S.; Kaga, A.; Anai, T. High-throughput screening and characterization of a high-density soybean mutant library elucidate the biosynthesis pathway of triterpenoid saponins. Plant Cell Physiol. 2019, 60, 1082–1097. [Google Scholar] [CrossRef]
  42. Kim, D.W.; Lee, S.H.; Choi, S.-B.; Won, S.-K.; Heo, Y.-K.; Cho, M.; Park, Y.-I.; Cho, H.-T. Functional conservation of a root hair cell-specific cis-element in angiosperms with different root hair distribution patterns. Plant Cell 2006, 18, 2958–2970. [Google Scholar] [CrossRef]
  43. Loke, J.C.; Stahlberg, E.A.; Strenski, D.G.; Haas, B.J.; Wood, P.C.; Li, Q.Q. Compilation of mRNA polyadenylation signals in Arabidopsis revealed a new signal element and potential secondary structures. Plant Physiol. 2005, 138, 1457–1468. [Google Scholar] [CrossRef] [PubMed]
  44. O’Neill, S.D.; Kumagai, M.H.; Majumdar, A.; Huang, N.; Sutliff, T.D.; Rodriguez, R.L. The α-amylase genes in Oryza sativa: Characterization of cDNA clones and mRNA expression during seed germination. Mol. Gen. Genet. MGG 1990, 221, 235–244. [Google Scholar] [CrossRef] [PubMed]
  45. Guhaniyogi, J.; Brewer, G. Regulation of mRNA stability in mammalian cells. Gene 2001, 265, 11–23. [Google Scholar] [CrossRef] [PubMed]
  46. Proudfoot, N.J.; Furger, A.; Dye, M.J. Integrating mRNA processing with transcription. Cell 2002, 108, 501–512. [Google Scholar] [CrossRef]
  47. Wang, Z.-Y.; Kenigsbuch, D.; Sun, L.; Harel, E.; Ong, M.S.; Tobin, E.M. A Myb-related transcription factor is involved in the phytochrome regulation of an Arabidopsis Lhcb gene. Plant Cell 1997, 9, 491–507. [Google Scholar]
  48. Sakai, H.; Honma, T.; Aoyama, T.; Sato, S.; Kato, T.; Tabata, S.; Oka, A. ARR1, a transcription factor for genes immediately responsive to cytokinins. Science 2001, 294, 1519–1521. [Google Scholar] [CrossRef]
  49. Mangas, S.; Bonfill, M.; Osuna, L.; Moyano, E.; Tortoriello, J.; Cusido, R.M.; Piñol, M.T.; Palazón, J. The effect of methyl jasmonate on triterpene and sterol metabolisms of Centella asiatica, Ruscus aculeatus and Galphimia glauca cultured plants. Phytochemistry 2006, 67, 2041–2049. [Google Scholar] [CrossRef]
  50. Li, J.; Wang, J.; Wu, X.; Liu, D.; Li, J.; Li, J.; Liu, S.; Gao, W. Jasmonic acid and methyl dihydrojasmonate enhance saponin biosynthesis as well as expression of functional genes in adventitious roots of Panax notoginseng FH Chen. Biotechnol. Appl. Biochem. 2017, 64, 225–238. [Google Scholar] [CrossRef]
Figure 1. Saponin phenotypes of wild-type and mutant soybean lines in seed hypocotyls. (a) Thin-layer chromatography (TLC) analysis of seed hypocotyls from wild-type cultivars (Pungsannamul and Uram) and the mutant line (PE1607). (b) Liquid chromatography with photodiode array and tandem mass spectrometry (LC-PDA-MS/MS) profiles of saponin extracts from seed hypocotyls of Pungsannamul (upper panel) and PE1607 (lower panel). Saponins are indicated by an upside-down black triangle. (c) Quantification of saponins in seed hypocotyls using LC-PDA-MS/MS. Asterisks indicate significant differences regarding each saponin compound between Pungsannamul and PE1607 using Student’s t-test (* p < 0.05, ** p < 0.01). Error bars represent ± standard deviation of three biological replicates.
Agronomy 15 00648 g001
Figure 2. Mapping analysis of PE1607 crossing populations and gene structure of Sg-3 (Glyma.10G104700). (a) Bulk segregant analysis (BSA) mapping and narrowing-down of the candidate region in the Uram × PE1607 F2 population. The BSA mapping results are shown with white bars, which correspond to the PE1607 genotype. The results are presented in four individual mutant lines from two F2 populations, and the white bar corresponds to the PE1607 genotype. The overlapping candidate region, 18 Mb, is highlighted in a box with diagonal lines, and the location of the Sg-3 gene is indicated by an arrow. Physical positions are based on Wm82.a4.v1. Details of the lines used in the cross are provided in Table S1. (b) Gene structure of Sg-3 (Glyma.10G104700) including the upstream, 5′–UTR and 3′–UTR. The coding region of the Sg-3 gene is represented by a black box, the 5′–UTR and 3′–UTR of the Sg-3 gene are indicated by white boxes, and the upstream region of the Sg-3 gene is marked by a gray box. The SNPs in PE1607, compared to the wild-type varieties (Pungsannamul, Uram, Jinpung, and Williams 82), are indicated by a black line, with the SNP variation marked by an arrow to show the change in PE1607 on the right side. The SNP used in this study for the SimpleProbe assay is indicated by a red line (Figure S3).
Agronomy 15 00648 g002
Figure 3. Expression profiles of the Sg-3 gene in hypocotyls and cotyledons of developing seeds. Expression levels were calculated relative to the constitutively expressed gene (Cons7) used as the reference. Error bars represent ± standard deviation of three biological replicates. Asterisks indicate significant differences between Pungsannamul and PE1607 using Student’s t-test (* p < 0.05, ns; not significant).
Agronomy 15 00648 g003
Table 1. Segregation and co-segregation analysis in the hypocotyls of F2 seeds of two crossing populations.
Parents and Their ProgeniesSaponin
Phenotype
Observed(Expected)χ2 ValueProbabilitySaponin
Phenotype
Observed(Expected)χ2 ValueProbability
Cross 1
P1: UramWild type Wild type
P2: PE1607Ab-γg rich Ab-γg rich
F2 populationWild type107(110)0.160.68 ns *Wild type34(36)0.180.91 ns
Heterozygous73(74)
Ab-γg rich39(36) Ab-γg rich39(36)
Cross 2
P1: JinpungWild type Wild type
P2: PE1607Ab-γg rich Ab-γg rich
F2 populationWild type56(56)01 nsWild type19(18)0.040.98 ns
Heterozygous37(38)
Ab-γg rich18(18) Ab-γg rich18(18)
* ns, not significant (p > 0.05).
Disclaimer/Publisher’s Note: The statements, opinions and data contained in all publications are solely those of the individual author(s) and contributor(s) and not of MDPI and/or the editor(s). MDPI and/or the editor(s) disclaim responsibility for any injury to people or property resulting from any ideas, methods, instructions or products referred to in the content.

