Article

Can Increased Density Compensate for Extremely Late-Sown Wheat Yield?

College of Agronomy, Xinjiang Agricultural University, Urumqi 830052, China
*
Author to whom correspondence should be addressed.
Agronomy 2025, 15(3), 607; https://doi.org/10.3390/agronomy15030607
Submission received: 27 December 2024 / Revised: 20 January 2025 / Accepted: 24 January 2025 / Published: 28 February 2025

Abstract

To clarify the compensatory effect of increasing density on the yield of extremely late-sown wheat and screen the best combination of the sowing date and density of extremely late-sown wheat in the wheat area of northern Xinjiang, this study set three extremely late-sown dates of October 25 (D1), November 4 (D2), and November 14 (D3) and four densities of 337.5 (M1), 450 (M2), 562.5 (M3), and 675 kg·hm−2 (M4). Additionally, the effects of the sowing date and density combinations on the formation process of the yield element spike number, spike grain number, and 1000-grain weight were analyzed in detail using the local conventional sowing date and density (25 September, 270 kg·hm−2) as the control (CK). The results showed that compared to the CK, increasing the planting density of extremely late-sown wheat compensated for the reduction in the number of harvested spikes due to low emergence rates. The young spikes were stunted due to a reduction in the number of grains per spike, and the grain grouting rate caused a reduction in the defects of the 1000-grain weight in order to increase the number of harvested spikes to improve yield. Under extremely late sowing conditions, D2M2 had the highest post-spring emergence rates, the highest number of harvested spikes, better development of young spikes and grain-filling, and non-significant declines in the number of grains per spike and 1000-grain weight, which balanced the contribution of the number of harvested spikes, number of grains per spike, and 1000-grain weight to the yield and gave the highest yield. After comprehensive yield factor analysis, sowing 450 kg·hm−2 (1.00 × 10⁶ seeds·hm−2) on 4 November (pre-winter cumulative temperature of 47.5 °C) was determined to be the best combination for planting extremely late-sown wheat in the northern Xinjiang wheat area, and the results of this study can provide important theoretical and technical references for guaranteeing the yield of winter wheat in extremely late-sown winter wheat areas.

1. Introduction

Wheat (Triticum aestivum L.) is one of the most widely grown crops globally, providing about 20% of the energy for daily human life worldwide [1]. China is the largest producer and consumer of wheat in the world, and the high yield of wheat in the northern region of Xinjiang, as one of the most important wheat-producing areas in the country, plays a crucial role in ensuring national food security [2,3].
The northern region of Xinjiang has developed a cropping pattern of late-sown winter wheat at the limit of inverted stubble planting after the harvest of late fall crops such as cotton and maize due to its unique climatic conditions (low precipitation, large temperature difference, long sunshine duration, and dry climate) and geographic location (river valleys and oasis agriculture are predominant), as well as its ability to improve the quality of arable land, and the cropping pattern is now widely promoted and applied [4,5]. In addition, extremely late-sown wheat has the advantage of alleviating the tension of machinery and labor use [6]. Moreover, compared to the timely sowing of winter wheat, the extremely late sowing of winter wheat has the advantages of saving prewinter water and reducing pests and diseases, and winter wheat has a greater yield than spring wheat does [7]. However, Dreccer et al. [8] reported that late-sown winter wheat is prone to forming weak or even no seedlings because of insufficient prewinter cumulative temperature and light, and Akhtar et al. [9] reported that late-sown winter wheat is susceptible to low temperature freezes due to a weak pre-growth period, resulting in high overwintering mortality, reduced tiller-forming ability, and affected grain-filling, which severely affects yield. Shah et al. [10] reported that for every day of delay in sowing, late-sown winter wheat yield decreased by 1%, and this yield loss was due mainly to suppressed wheat growth and environmental constraints. Therefore, how to improve field management measures to guarantee the yield of extremely late-sown winter wheat has become an important scientific problem to be solved.
In field management practices, planting density is a more controllable cultivation measure in wheat production and an important factor affecting wheat population structure and yield formation [11,12]. An appropriate sowing density can alleviate competition between populations and individuals and help build a reasonable population structure [13]. Increasing the planting density can increase the compactness of the wheat population canopy, enhance the surface area available for photosynthesis, improve the absorption and conversion efficiency of light energy, and thus increase yield [14]. Wheat sowing density significantly affects plant distribution in the field, tillering, and spike formation [15]. Currently, increasing the number of basic seedlings to increase the number of spikes per unit area has been used to increase yield [16]. However, a high number of basic seedlings leads to a decrease in the nutrient area of a single plant; some plants will be eliminated due to poor growth, and the number of spikes per unit area will not significantly increase [17]. Moreover, it has also been demonstrated that increasing the number of spikes per unit area by increasing the number of basic seedlings through higher planting densities can fully compensate for the yield loss one week after late sowing and partially compensate for the yield loss two weeks after late sowing but cannot compensate for the yield loss more than two weeks after ultra-late sowing [10]. In addition, a high planting density reduces the number of grains per spike and the thousand-grain weight, the number of tillers per plant, and the plant height, which reduces yield [18]. Therefore, the potential to further increase the number of spikes per unit area by increasing the number of basic seedlings is very low.
Studies have shown that increasing the planting density has a compensatory effect on late-sown winter wheat [19,20]. Sun et al. [21] showed, in a study on the summer maize–winter wheat biannual restriction area of the North China Plain, that the dual objectives of a normal harvest of summer maize and an increased yield of winter wheat could be achieved by planting appropriately late and increasing the planting density of wheat. By delaying the harvest of summer soybean and increasing the planting density of winter wheat, a double harvest could be achieved in the eastern Great Plains of the U.S. Bastos et al. [22] noted that increasing the planting density can mitigate yield reduction in late-sown winter wheat caused by insufficient light and temperature during the pre-winter period. Therefore, increasing the density is an important measure to reduce yield loss in late-sown wheat by increasing the density to compensate for the insufficient number of basic seedlings and lower number of harvested spikes caused by the reduction in tillers in late-sown wheat, which in turn guarantees yield [20,23]. However, there are few studies on the extremely late sowing of wheat, and most of them are based on production experience in the past century [24,25] and lack a scientific basis. In addition, the mechanism of whether the technique of “making up for late sowing with denser sowing” can play a role in guaranteeing the yield of winter wheat under extremely late sowing conditions is still unclear, which needs to be solved urgently.
For this reason, this study investigated different sowing periods and sowing densities in winter wheat fields in the northern region of Xinjiang; used the appropriate period and amount of winter wheat for sowing as the control; studied the differences between yield formation during the appropriate period and with the appropriate amount of wheat sown and the extremely late sowing of high-density wheat; probed the effects of different sowing periods and densities on the extremely late sowing of high-yield wheat; and explored the optimal combination of sowing periods and densities under the conditions of extremely late sowing. The results of this study will help improve “late sowing with density” technology and provide theoretical support for the popularization of this technology.

2. Materials and Methods

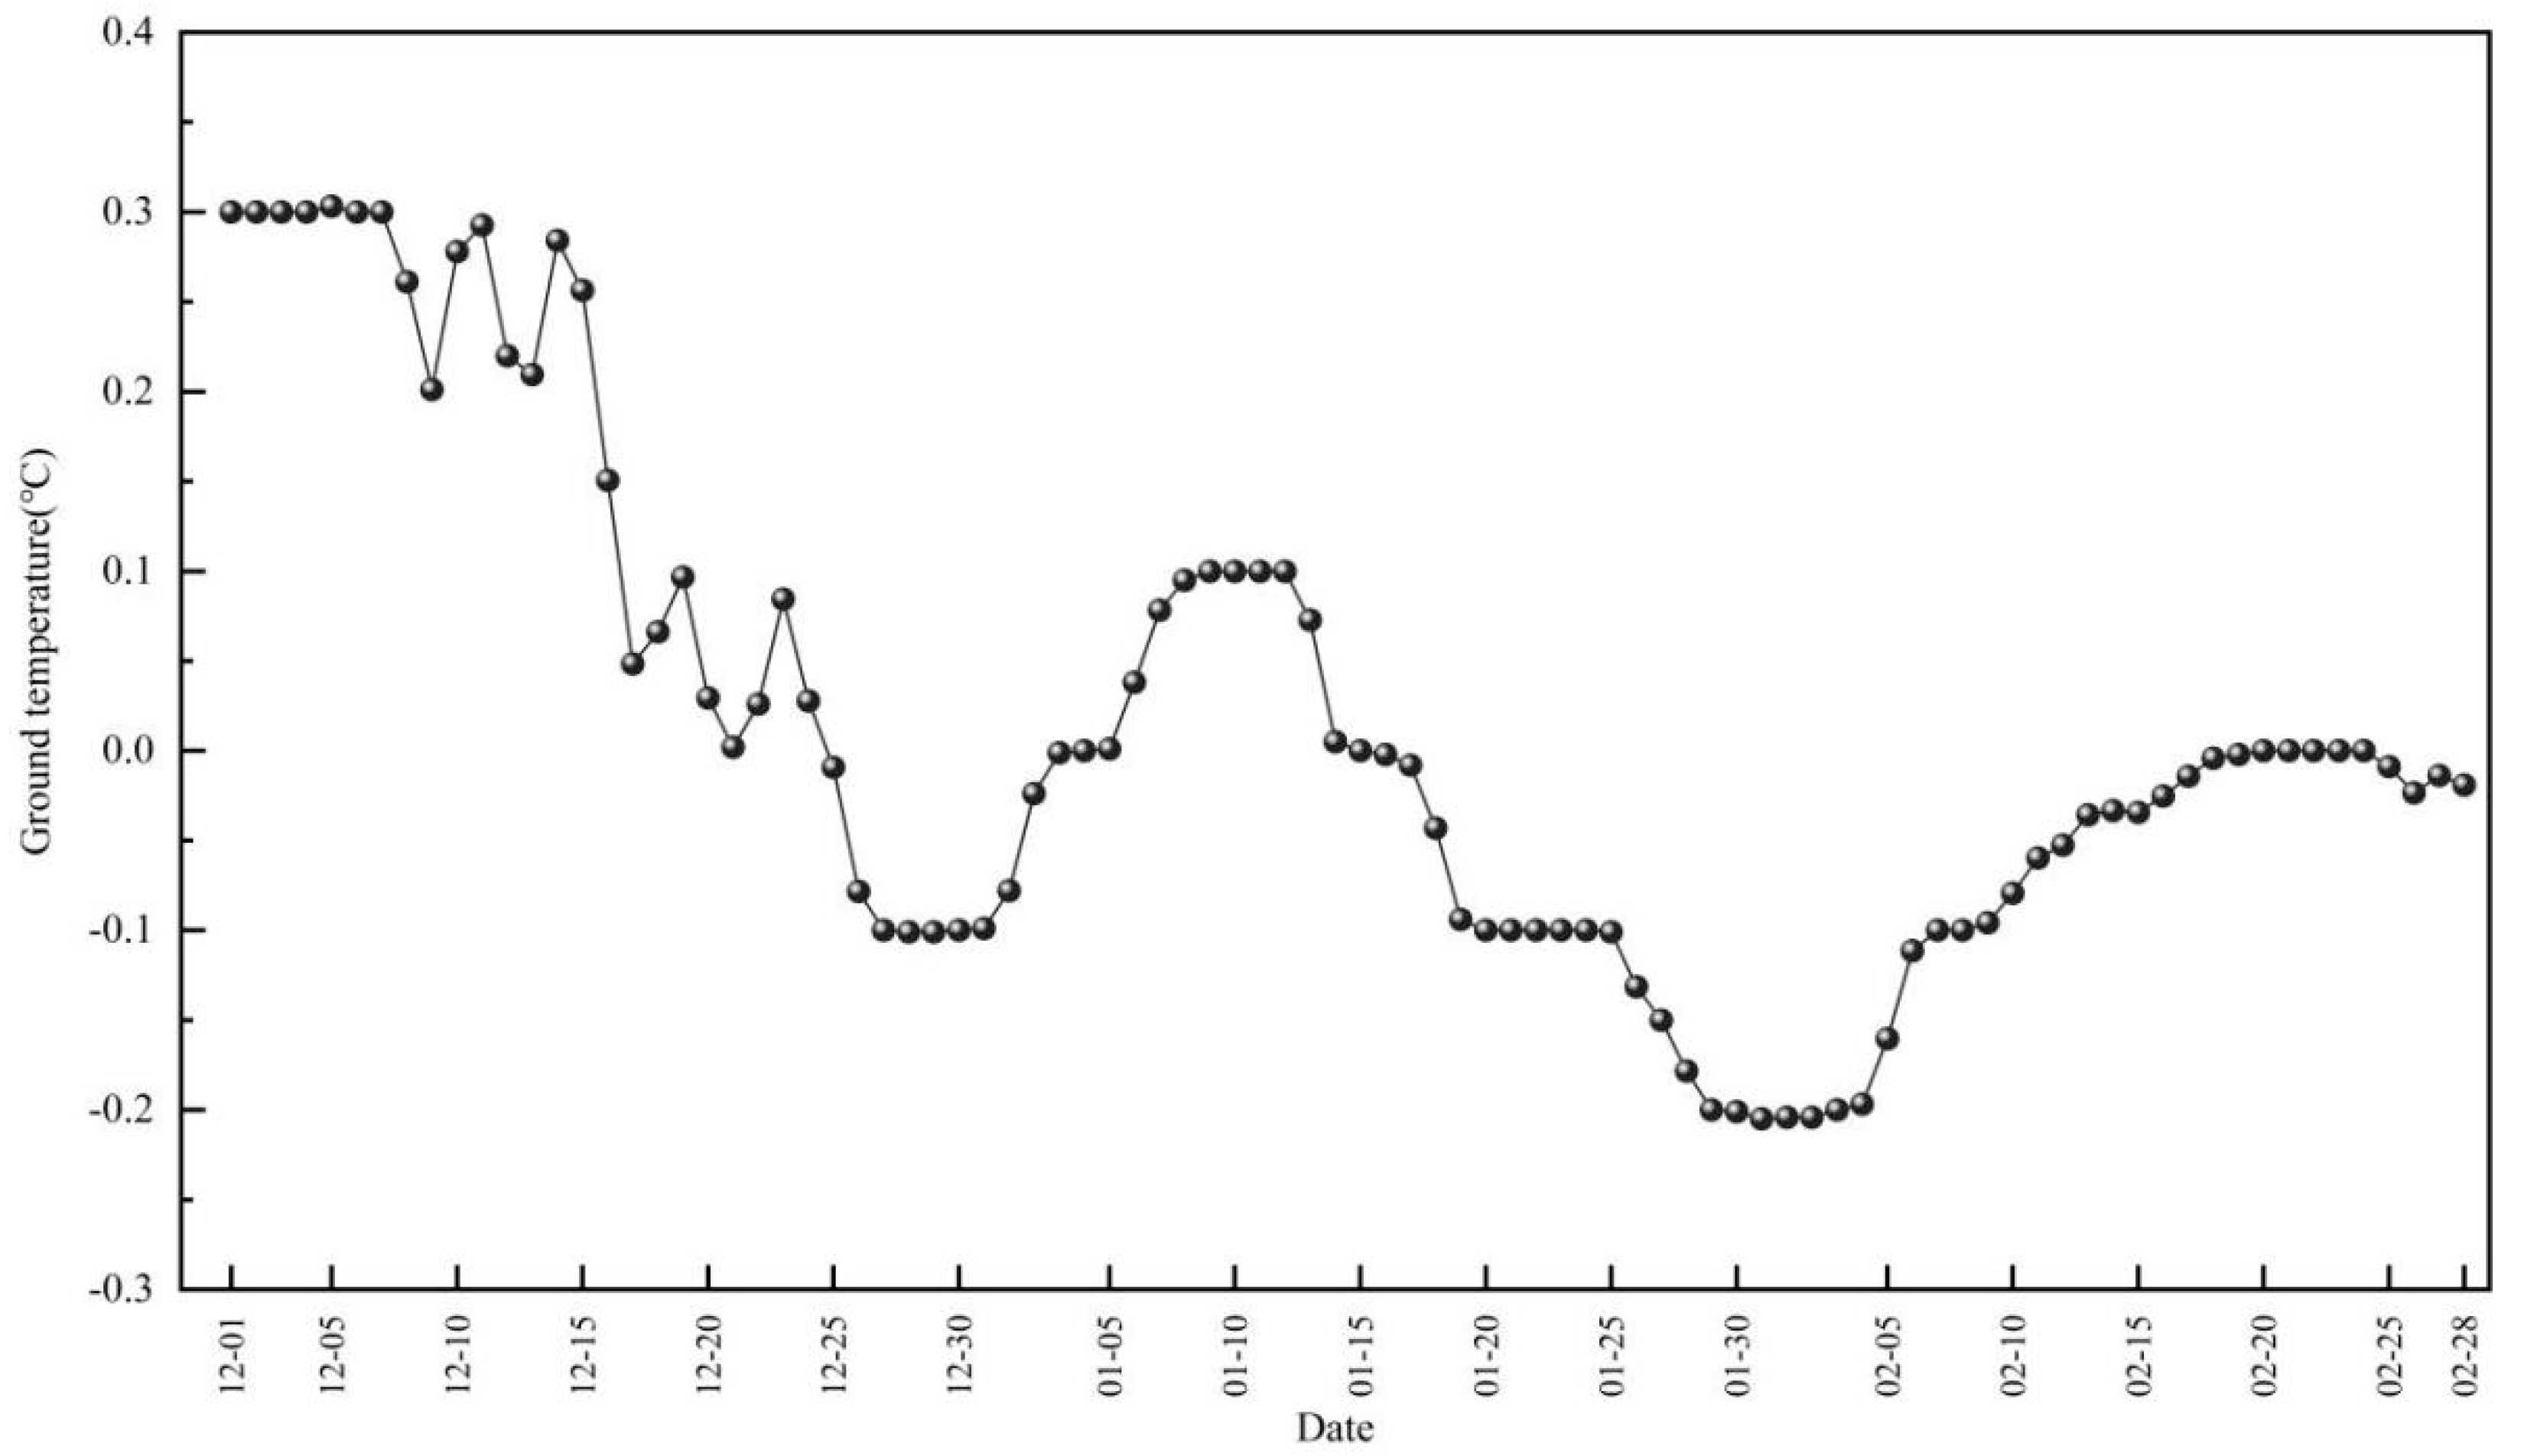
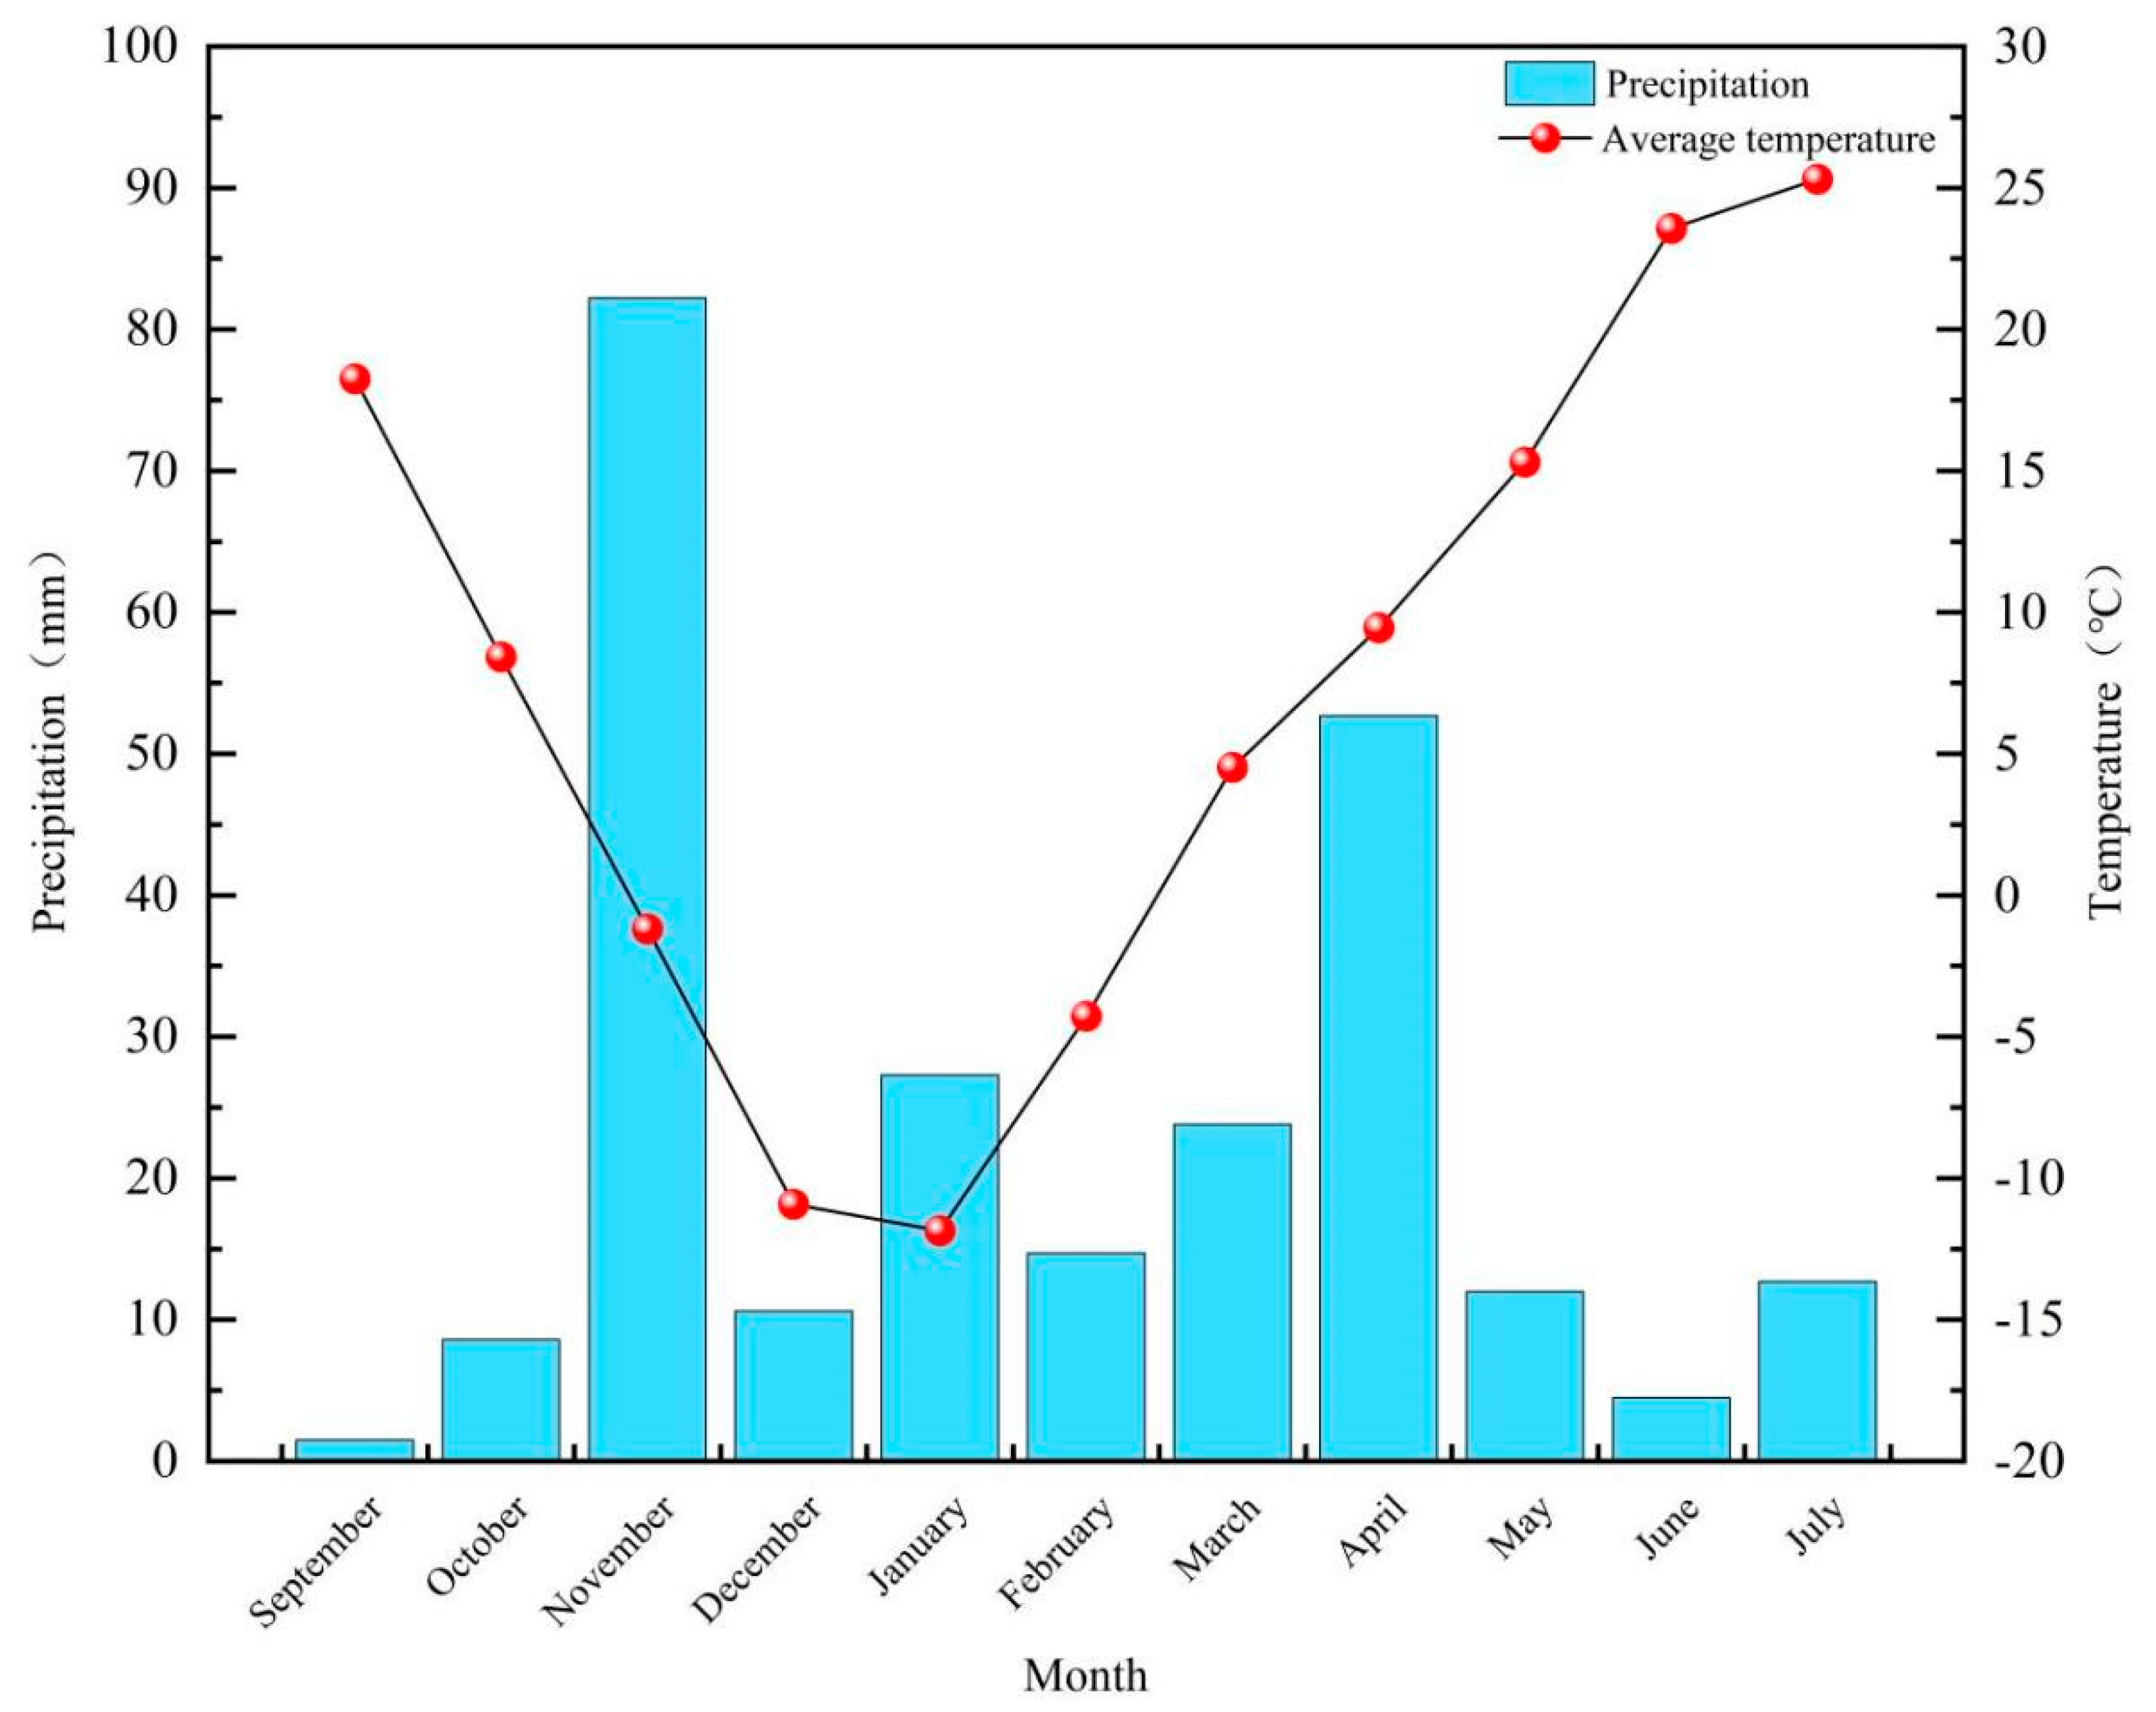
2.1. Overview of Experimental Site

The experiment was conducted from September 2021 to July 2023 at the Agricultural Science Research Institute in Tacheng District (46°21′ N, 82°41′ E, altitude: 415 m); trials using post-harvest plots of maize met the requirement of the extremely late sowing of wheat. This region has a temperate continental climate characterized by an average annual temperature of 6.2 °C, 2832 h of sunshine per year, and an average annual precipitation of 2700 mm. The weather conditions during the wheat sowing stage are shown in Figure 1, the daily average ground temperature of soil 4 cm underground in the experimental field during the wheat overwintering stage is shown in Figure 2, and the average month-by-month rainfall and average monthly air temperature during the wheat growing season are shown in Figure 3. The soil type of the test field is sandy loam, the soil nutrient conditions before the test are shown in Table 1.

2.2. Method

2.2.1. Experimental Design

A dual-factor split-plot experimental design was used, where the main plot comprised the sowing period (D), which included three treatments: D1 (25 October, pre-winter accumulated temperature of 102.8 °C), D2 (4 November, pre-winter accumulated temperature of 47.5 °C), and D3 (14 November, pre-winter accumulated temperature of 8.6 °C). The sub-plots included density (M), with four treatments: M1 (337.5 kg·hm−2/0.75 × 106 seeds·hm−2), M2 (450 kg·hm−2/1.00 × 106 seeds·hm−2), M3 (562.5 kg·hm−2/1.25 × 106 seeds·hm−2), and M4 (675 kg·hm−2/1.50 × 106 seeds·hm−2). The control (CK) was defined by the local suitable sowing date and density (25 September, pre-winter accumulated temperature of 408.8 °C; 270 kg·hm−2/0.60 × 106 seeds·hm−2). Each experimental unit covered an area of 10.0 m2 (2 m × 5 m), with four replicates. The tested variety, Xindong 18, which is known for its robust overwintering ability, is widely cultivated locally and has a 1000-grain weight of about 45 g. Seeds were manually sown with a row spacing of 20 cm and a sowing depth of about 4 cm. The base fertilizer included 300 kg·hm−2 diammonium phosphate, and CK wheat was sown at an optimal time. On 25 September, 750 m3 of seedling water was administered via capillary drip irrigation, followed by 750 m3 of winter water on 30 October. In total, 1500 m3 of water was irrigated before winter, and the capillaries were repaired after the spring. On 5 October, a simulation was conducted using the previous crop’s drip irrigation facilities to administer 750 m3 of bottom soil moisture for the extremely late-sown wheat before winter. After spring, capillary tubes were laid with one tube per three rows, spaced 60 cm apart. Drip irrigation was applied during the green stage (three-leaf stage), jointing stage, booting stage, flowering stage, and filling stage, with 750 m3 applied in each stage. A total of 375 kg·hm−2 of urea was added during the turning-green stage (three-leaf stage), jointing stage, and booting stage, adding 75, 150, and 150 kg·hm−2, respectively.

2.2.2. Yield and Yield Composition Factors

Before harvesting, 25 consecutive wheat plants were selected from each plot to measure the number of grains per spike and the weight of tillering grains on the main stem. A representative 2 m2 area was selected to measure the effective number of spikes (grains per spike ≥ 7), the yield was quantified, and the 1000-grain weight was determined. A grain moisture meter (PM-8188-A, KETT, Japan) was used to measure the 1000-grain weight and yielded a 13% water weight.

2.2.3. Dynamics of the Seedling Emergence Rate, Total Stem Number, and Panicle Number

Post-emergence, five consecutive rows measuring 2 m each were selected from each community and marked at designated points, and the number of seedlings was recorded to calculate the emergence rate. At maturity, the total number of wheat ears, effective number of ears, and ineffective number of ears (less than 7) were measured in a designated area. In this experiment, the basic number of seedlings was assumed to represent the number of main stem ears, the effective number of ears was considered to be the number of main stem ears and tillering ears, and the number of tillering ears was calculated.

2.2.4. Overwintering Morphology and Cell Osmotic Regulatory Substances

Following overwintering, 10 representative seedlings were selected from each community, and seedlings from different densities were mixed according to the same sowing date. Various indicators, such as the tiller number, leaf number, root number, and bud length, were subsequently measured. After washing, the plants were dried, and the proline and soluble sugar contents of the wheat plants were analyzed [26].

2.2.5. Number of Spikelets and Flowers

After maturity, five representative wheat ears were selected from each plot, and the total number of spikelets, effective number of spikelets, and ineffective number of spikelets were measured. The total number of small flowers, effective number of small flowers, number of weak infertile small flowers (i.e., the number of small flowers that did not form grains at the top or bottom of the wheat spikes), and number of strong infertile small flowers (i.e., the number of small flowers that did not form grains in the middle of the wheat spikes) were also recorded.

2.2.6. Small Panicle Base and Small Flower Base

Following the three-leaf stage, five representative wheat plants were selected daily from each treatment for the dissection of young spikes. The number of spikelets and flower primordia was assessed via a stereomicroscope (SZM7045, Shunyu Optical Technology Co., Ltd., Yuyao, China), and the rate of flower primordia formation was calculated via the following formula:
Formation rate of small flower primordia = peak number of small flower
primordia/late stage small flower primordia formation base

2.2.7. Grain-Filling Characteristics

From days 0 to 30 post-flowering, five spikes were collected from each plot every five days. Two grains were extracted from the outer side of five pairs of small spikes in the middle of each spike, totaling 50 grains. These grains were placed in paper bags, roasted at 105 °C for 30 min, dried at 85 °C to a constant weight, weighed, and analyzed for grouting parameters using the logistic model Y = K/(1 + ea + bt).

2.2.8. Canopy Temperature

After heading, three pathways in the experimental field were selected, and the air temperature and humidity were measured using a meter (S21A, Pengyun IoT Co., Ltd., Xuzhou, China) positioned about 75 cm from the ground (at the wheat-ear level). The data were collected every 15 min.

2.2.9. Data Analysis

Data processing was conducted using Microsoft Excel 2021, and all the statistical analyses were performed by analysis of variance (ANOVA), using SPSS 79.0 (IBM Corp., Chicago, IL, USA). We performed mean separation through Duncan’s multiple range test. All the graphs were generated using Origin2021 (Origin Lab Corporation, Northampton, MA, USA).

3. Results and Analysis

3.1. Influence of Sowing Time and Density on Yield and Yield Components

As shown in Table 2, the results of the 2021–2022 and 2022–2023 trials were essentially the same. Compared to those in the CK treatment, the yield and number of grains in the spikes in the two-year trial DM treatment significantly decreased by 7.98% and 37.42% and by 7.60% and 38.71%, respectively; the number of harvested spikes significantly increased by 17.13% and 20.57%; and the weight of 1000 grains increased by 0.99% and 2.38%, respectively. But, the differences were not significant. In extremely late sowing, under the same density conditions, the yield and number of harvested spikes in the two-year experiment were the highest in D2; the yields of D1 and D3 decreased by 1.89% to 8.19% and the number of harvested spikes decreased by 4.44% to 20.13% compared to those of D2, whereas the number of grains per spike and 1000-grain weight were the lowest in D2. In addition, the number of grains per spike in D1 and D3 increased by 5.07% to 11.57% compared to that in D2, and the weight of 1000 grains increased by 0.16% to 1.60%. Under the same sowing date, the yield of the two-year experiment first increased and then decreased with increasing density and was the highest in M2. The number of harvested spikes increased with increasing density, and the number of grains per spike and 1000-grain weight decreased with increasing density. In combination with the other two factors, the sowing date and density did not interact with the yield or the number of spikes and grains per spike and interacted with the 1000-grain weight, and the yield of the two-year experiment was the highest in D2M2. Compared to those in the CK treatment, the yield decreased by 0.96% and 1.12%, the number of harvested spikes increased by 28.31% and 27.68%, the number of grains per spike decreased by 40.00% and 40.17%, and the weight of one thousand grains increased by 1.81% and 2.15%, respectively.

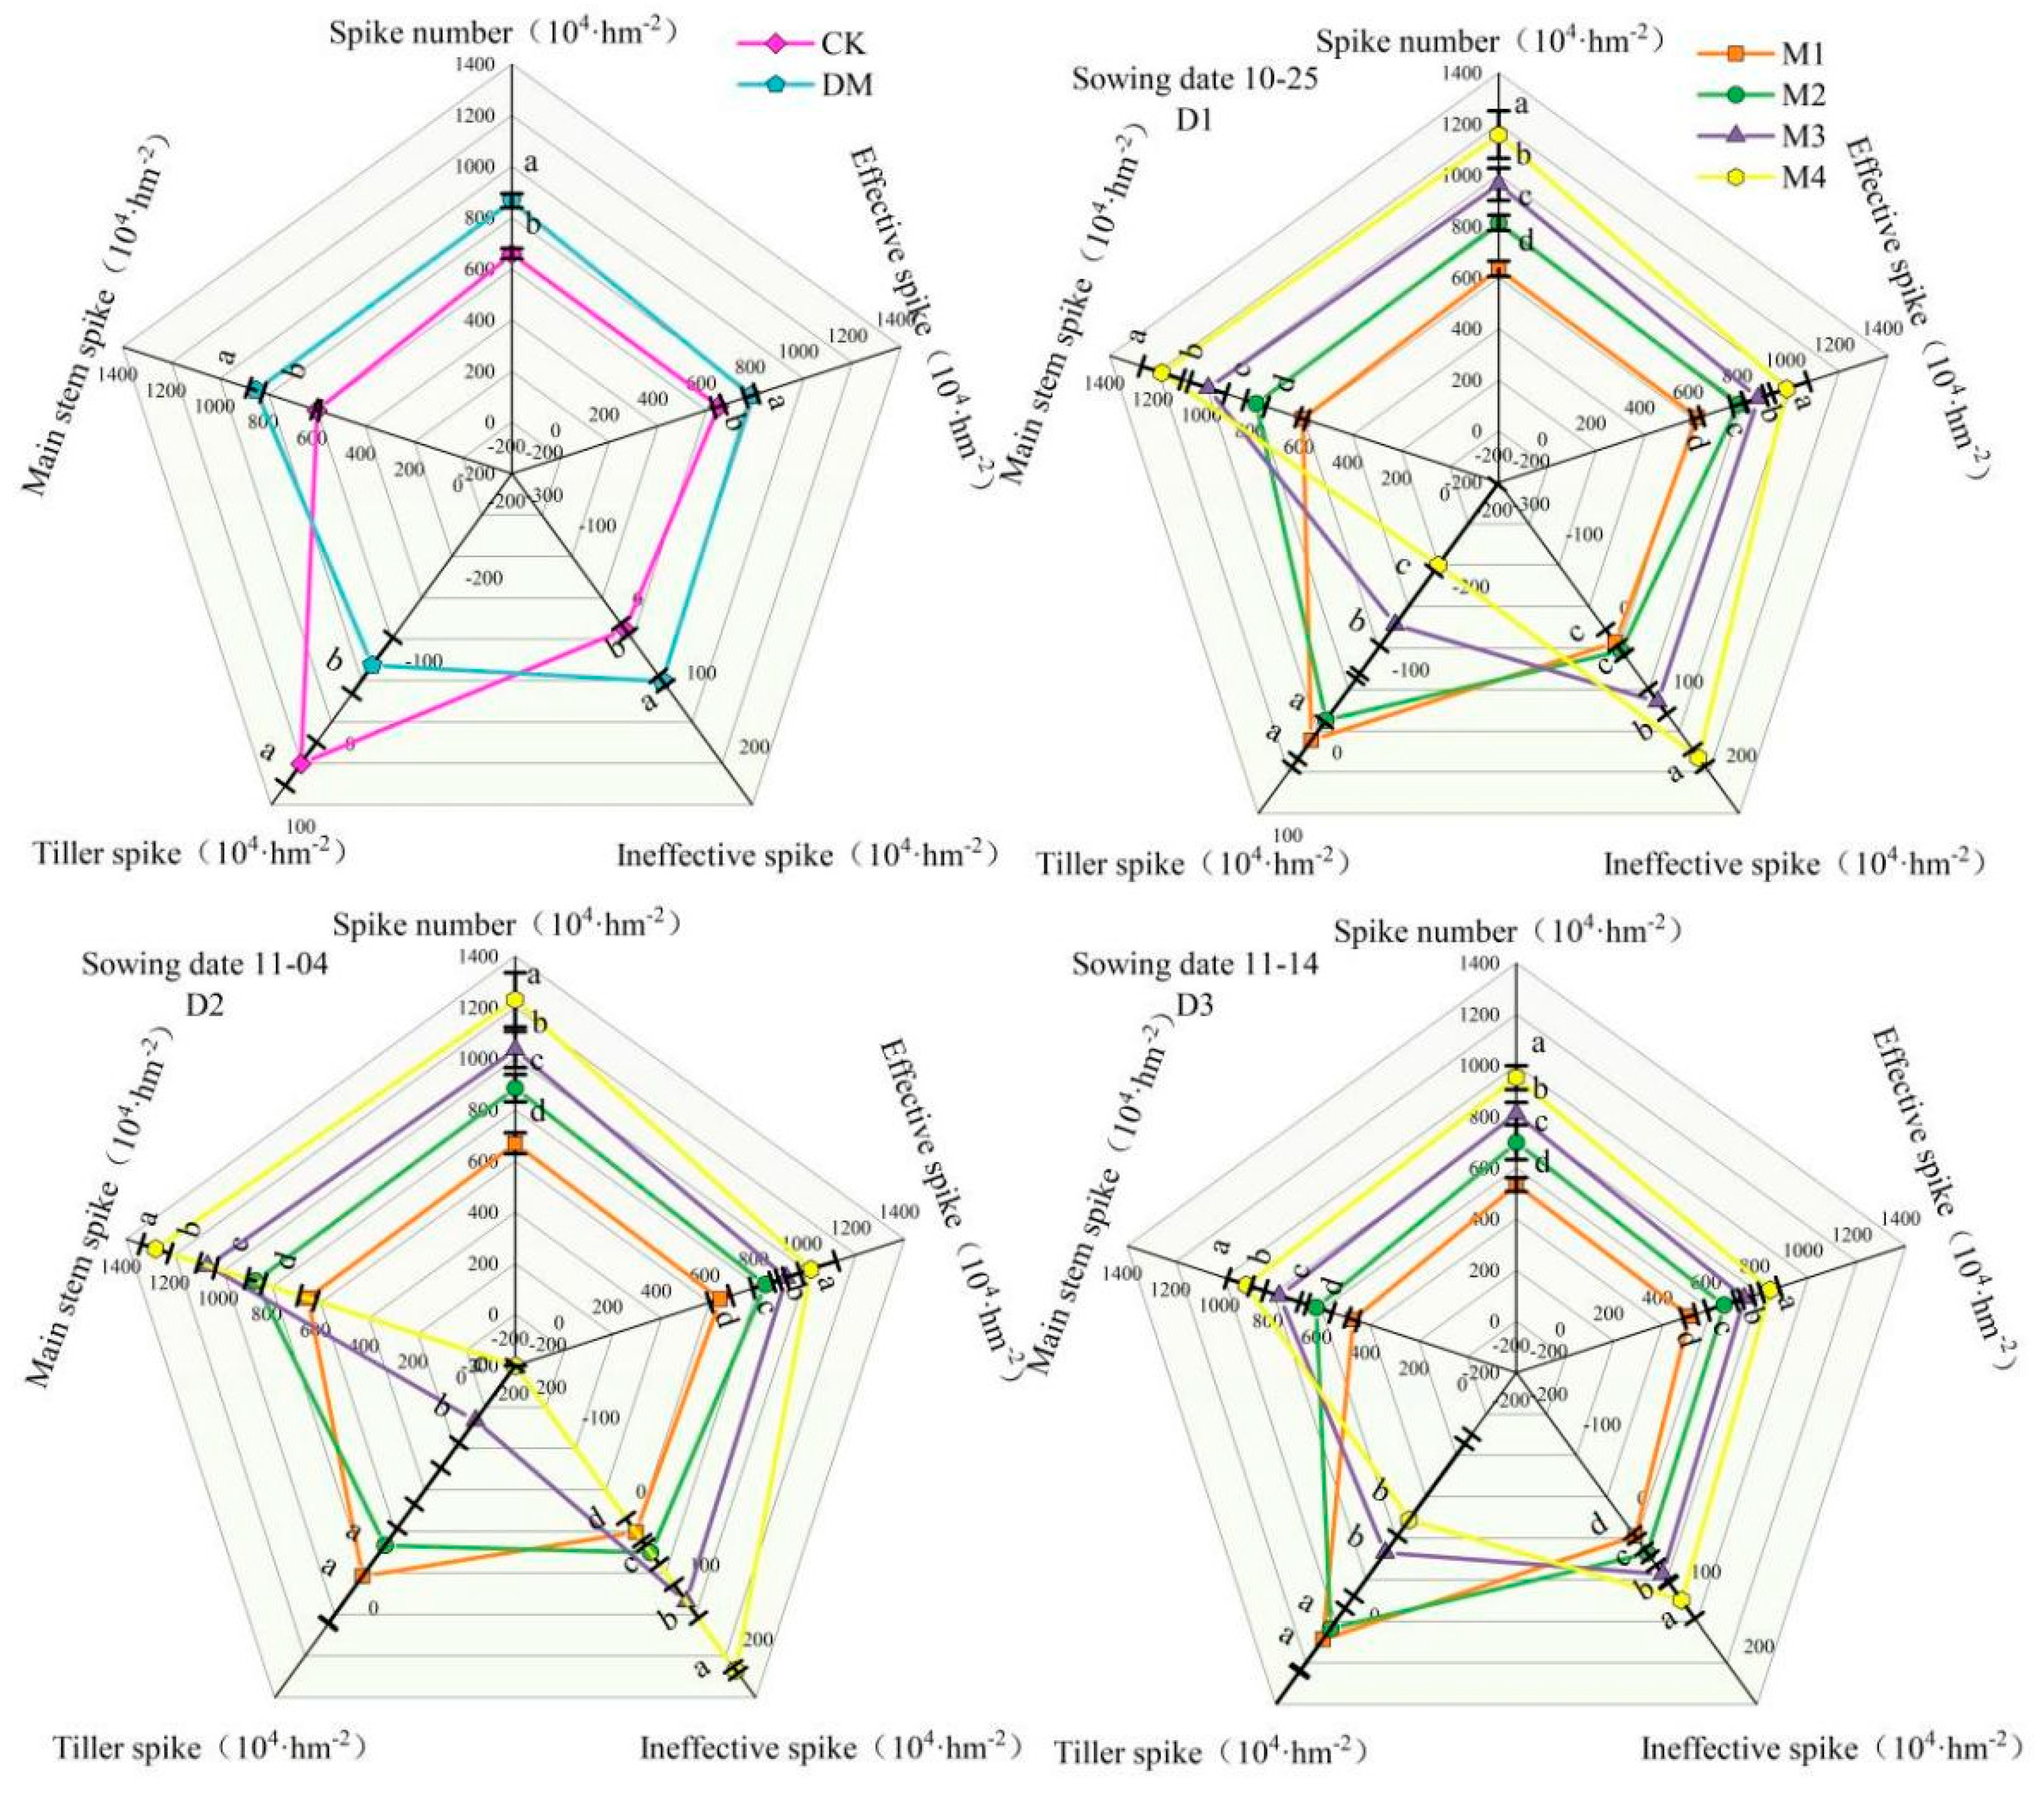
3.2. Influence of Sowing Date and Planting Density on Panicle Number

3.2.1. Effects of Sowing Date and Planting Density on Panicle Number

As shown in Figure 4, compared to those in the CK treatment, the numbers of total spikes, effective spikes, ineffective spikes, and main stem spikes significantly increased by 31.36%, 20.57%, 625.46%, and 42.10% in the DM treatment, whereas the number of tiller spikes significantly decreased by 235.00%. Under extremely late sowing conditions, the increase in D2 and density promoted an increase in the total number of spikes, effective spikes, ineffective spikes, and main stem spikes and a decrease in the number of tiller spikes; combining the factors of the sowing period and density, the total numbers of spikes, effective spikes, ineffective spikes, and main stem spikes were the highest, and the number of tiller spikes was the lowest for D2M4. After the density of the extremely late-sown wheat increased, the number of effective spikes basically increased all the way up to the main stem spike, and the phenomenon of the main stem spike becoming an ineffective spike (negative tiller spikes appeared) was even observed. The increase in the number of harvested spikes depended on the increase in density (Table 1), and a higher density exacerbated the occurrence of this phenomenon.

3.2.2. Influence of Sowing Time and Density on Seedling Emergence Rate

As shown in Figure 5, compared to that in the CK treatment, the DM seedling emergence was significantly lower (by 24.01%). In extremely late sowing, under the same density conditions, the post-spring emergence rates of D1 and D3 were significantly lower, by 6.25% and 24.08%, respectively, than those of D2; however, there was no significant effect of density on the emergence rate, and there was no interaction effect between the sowing period and density on the emergence rate. Extremely late-sown wheat with increased density presented a low post-spring emergence rate and almost total tiller extinction, relying on the main stem to form spikes (Figure 1); thus, the higher the emergence rate was, the greater the number of spikes harvested was.

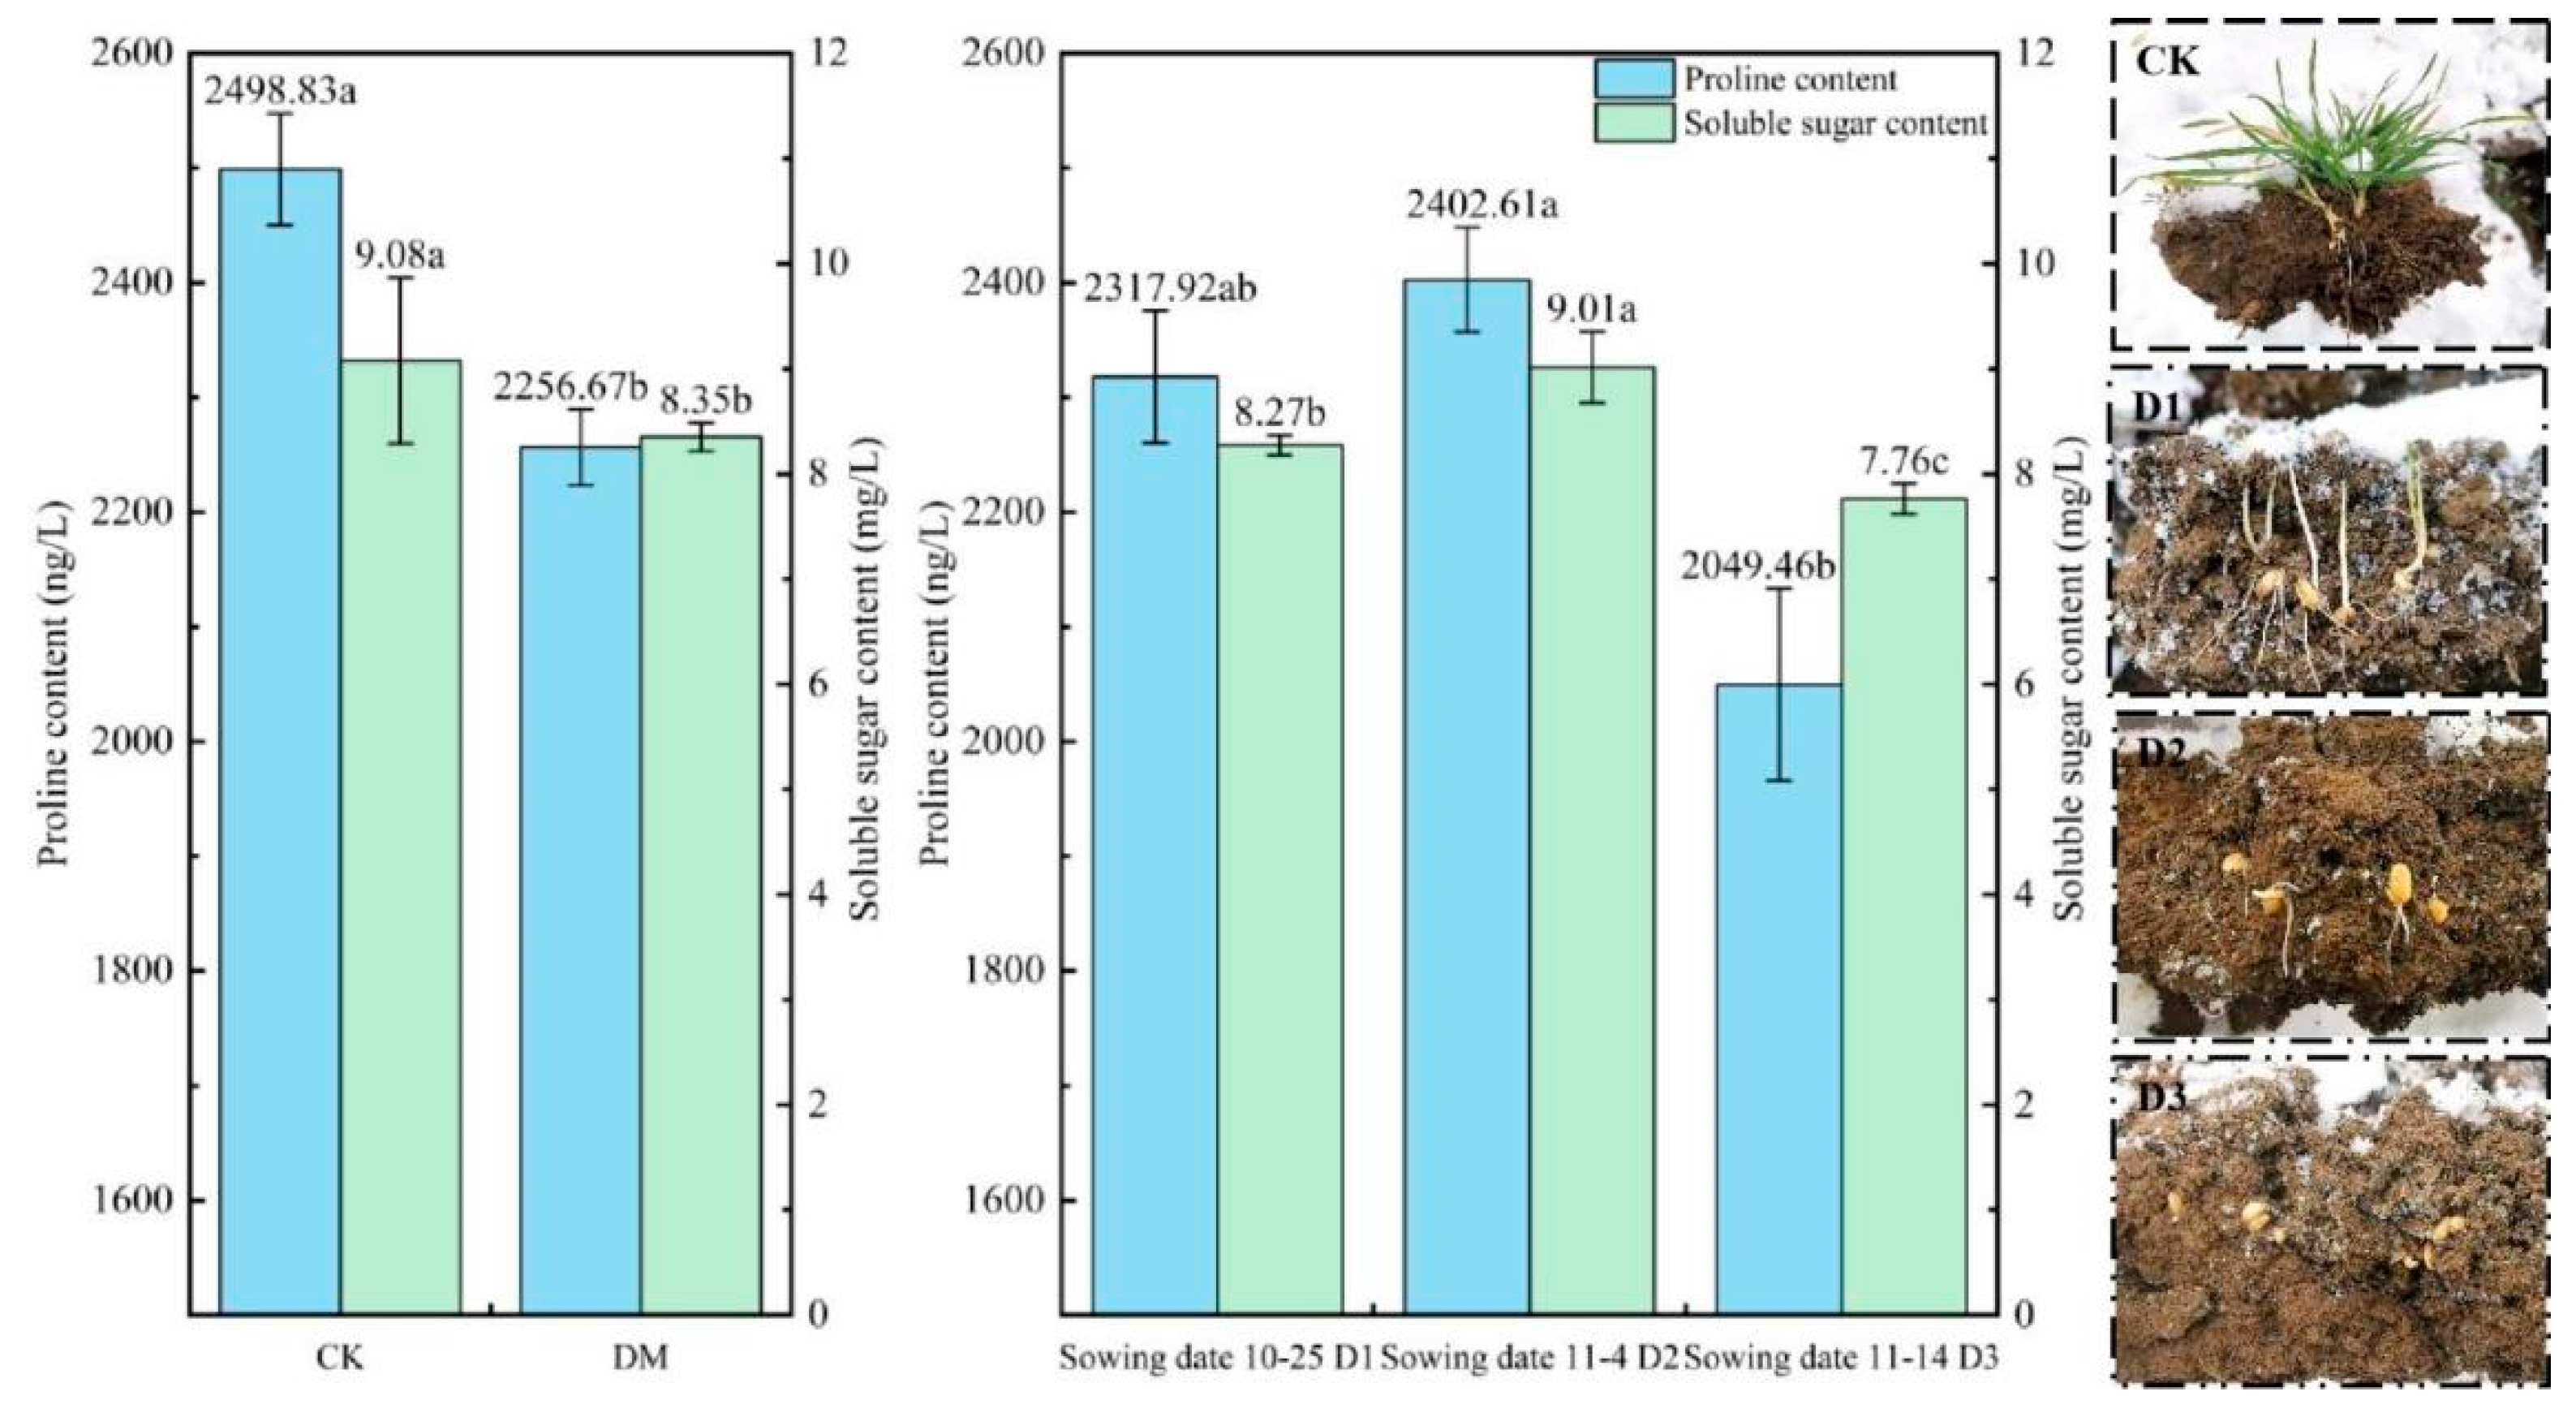
3.2.3. Effects of Sowing Time on Morphology of Overwintering Plants and Levels of Cell Osmotic Regulatory Substances

As shown in Figure 6, compared to the CK, the extremely late-sown wheat was limited by the sowing date, did not emerge before winter, grew weakly, had significantly reduced cellular osmoregulatory substances (proline and soluble sugar), was susceptible to freezing, and had a high overwintering mortality rate, resulting in a lower rate of emergence in spring (Figure 2). But, the proline content of D2 increased by 3.66% and 17.23%, and the soluble sugar content increased by 8.95% and 16.11% compared to that of D1 and D3. D2 had the strongest cold resistance, with the lowest overwintering mortality rate, the highest rate of emergence in spring, and the highest number of basic seedlings. The number of harvested spikes was also the highest (Figure 1 and Table 1).

3.3. Effects of Sowing Date and Density on Number of Grains per Spike

3.3.1. Effects of Sowing Date and Density on Number of Spikelets and Flowers

As shown in Figure 7, compared to that in the CK, the extremely late-sown wheat spikelet morphology was smaller, and the reduction in the number of grains per spike (Table 1) was associated with a significant decrease in the total number of DM spikelets, the number of effective spikelets, the number of total florets, the number of effective florets, and the number of strong and ineffective florets, as well as a significant increase in the number of ineffective spikelets and the number of weak and ineffective florets. In the extremely late sowing stage, under the same density conditions, D2 wheat spikelets were the smallest, and the total spikelet number and effective spikelet number tended to decrease with an increasing sowing time. The total spikelet number and effective floret number were the lowest in D2, whereas the number of ineffective spikelets, the number of strongly ineffective florets, and the number of weakly ineffective florets were the greatest in D2. In the same sowing period, the increase in density promoted the morphology of the spikelets to decrease, and the number of total spikelets, the number of effective spikelets, the number of effective florets, and the number of strongly ineffective florets decreased. The number of ineffective spikelets and the number of weakly ineffective florets increased with an increasing spikelet number, which was also the reason for the decrease in the number of grains per spike (Table 1). The combination of the two factors for the D1 and M1 wheat spikelets was greater, and other spikelet index performances were better.

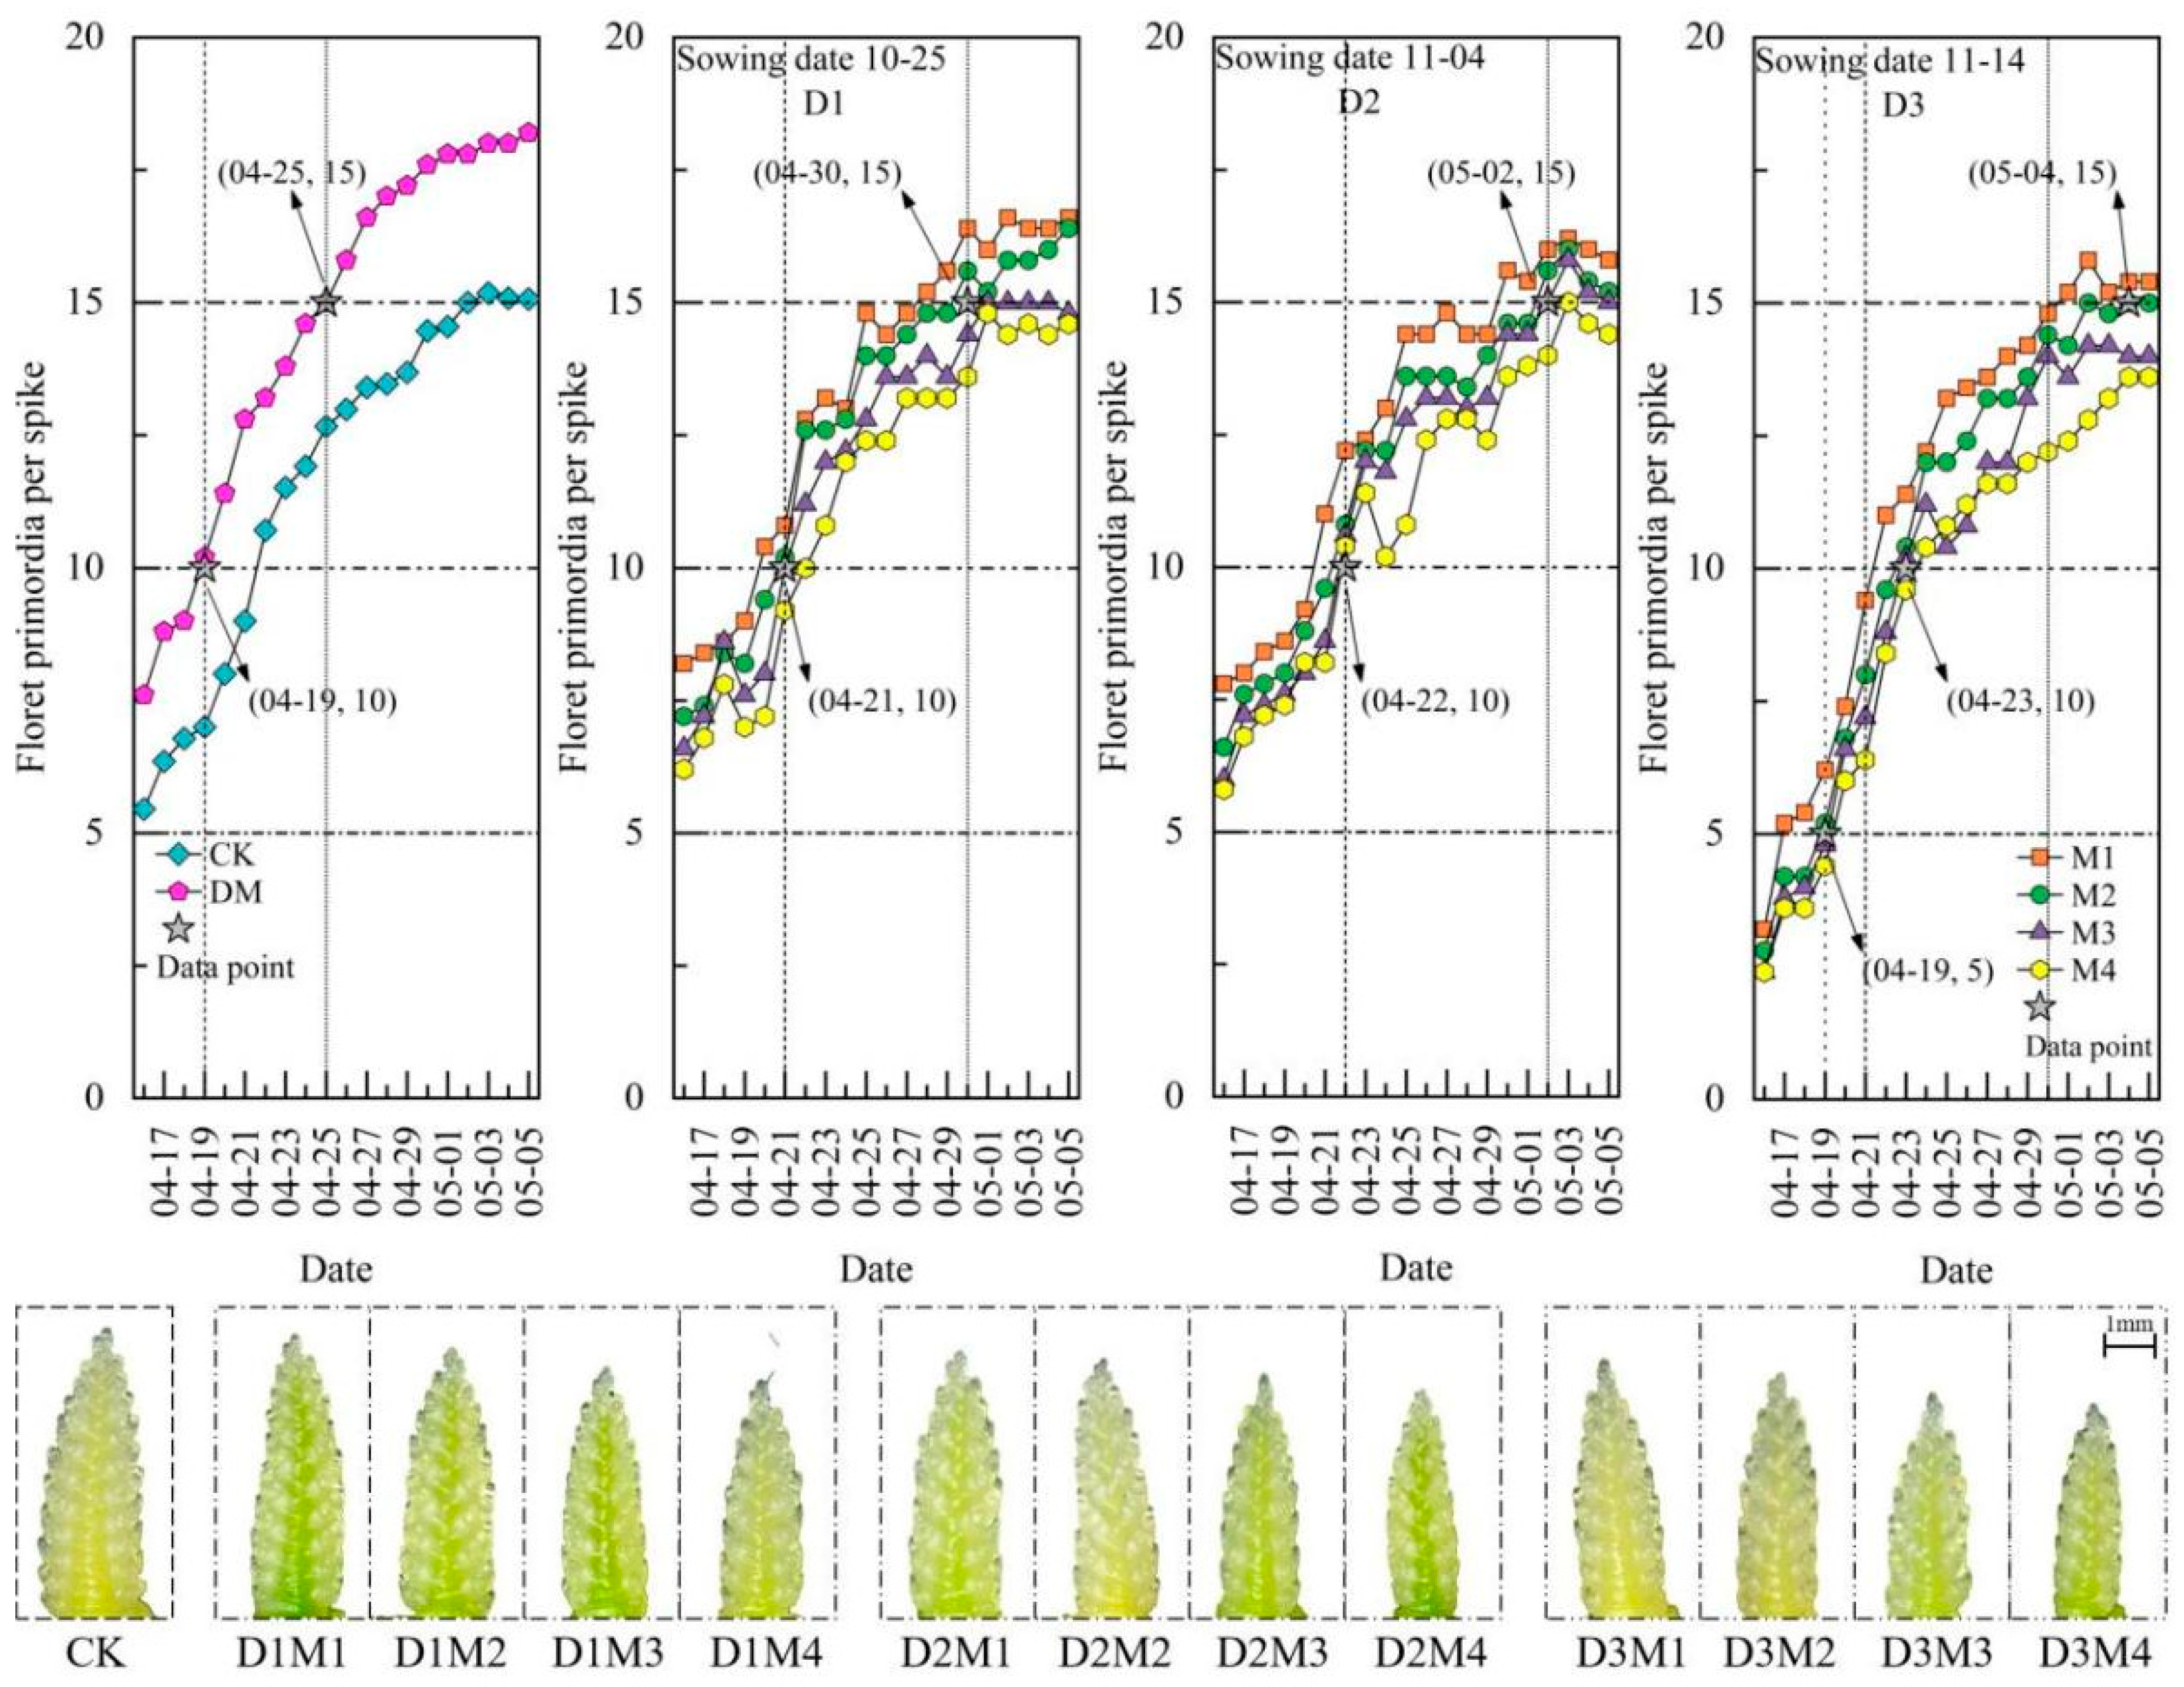
3.3.2. Effects of Sowing Date and Density on Original Number of Spikelets

As shown in Figure 8, compared to that in the CK, the frontal morphology of young spikelets in the extremely late-sown wheat was smaller, the number of DM spikelet primordia was delayed by 3 d and 7 d at the time the nodes had more than 10 and 15 spikelets, and the number of final formations was reduced by 17.22%. Under extremely late sowing conditions, delaying the sowing date and increasing the density resulted in a smaller spikelet frontal morphology, delayed and shorter spikelet primordia formation, and a reduced number of spikelets, which affected spikelet development and formation (Figure 7).

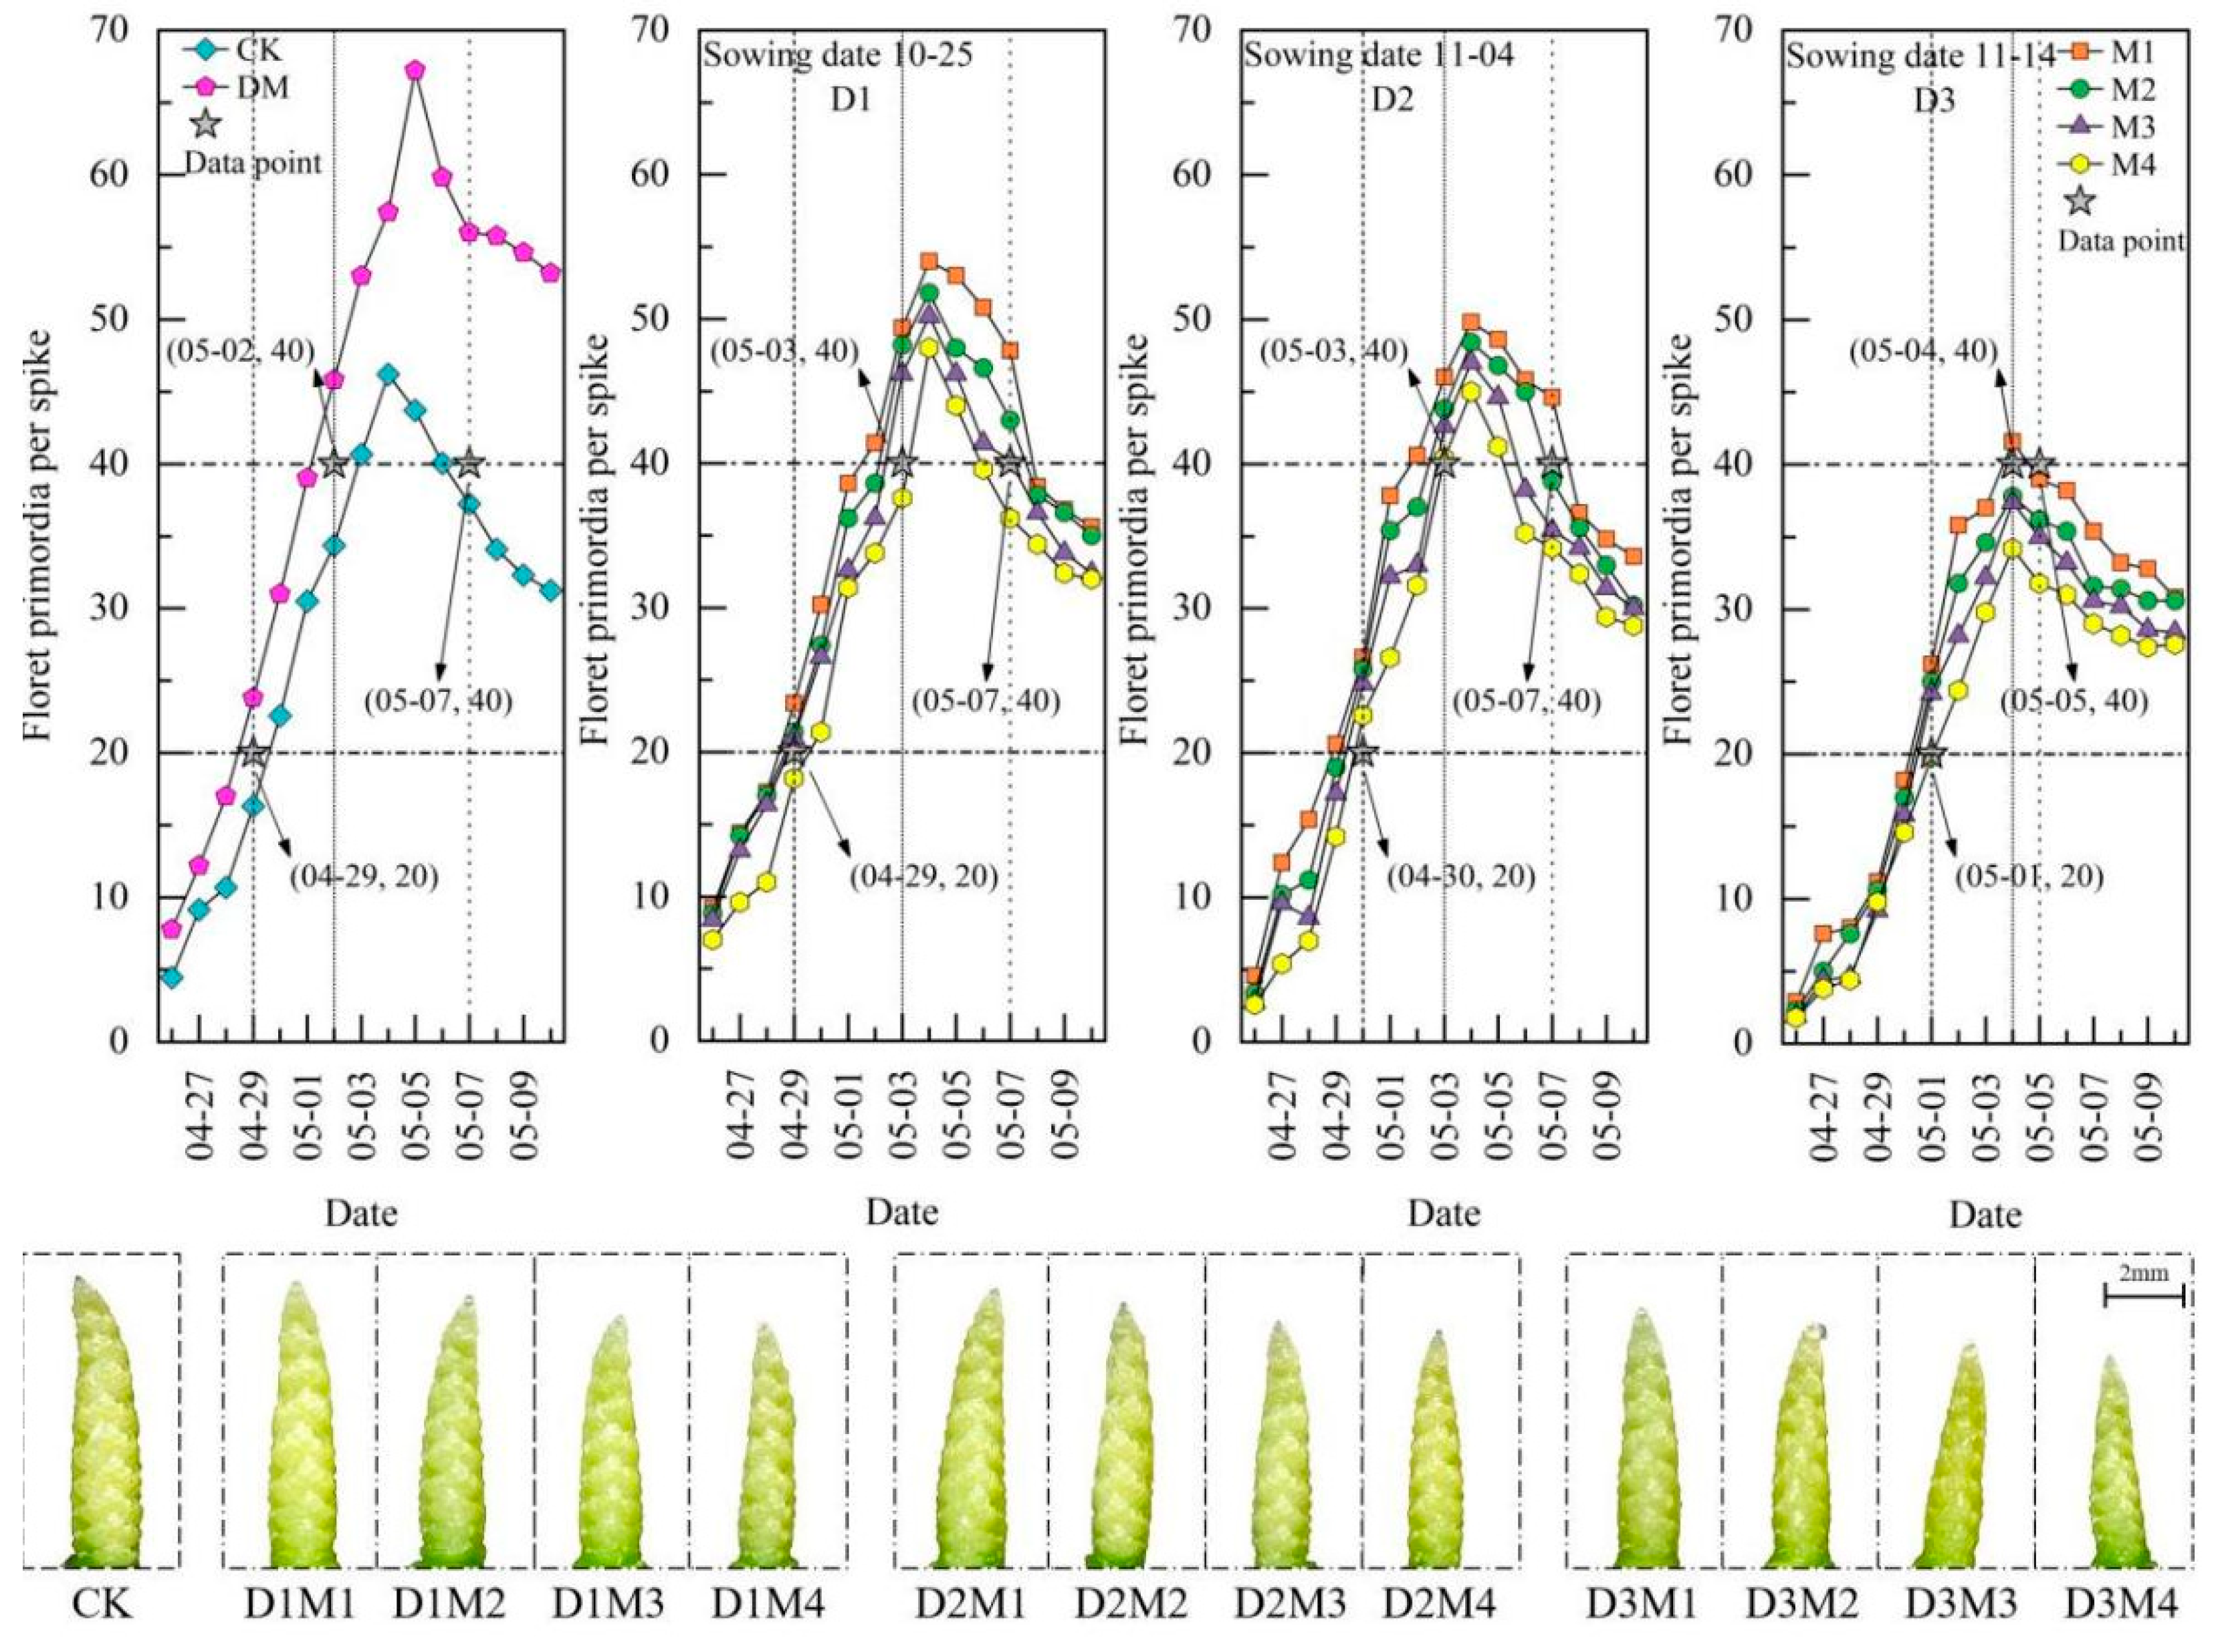
3.3.3. Effects of Sowing Time and Density on Number of Small Flower Primordia Plants

As shown in Figure 9, compared to those in the CK, the lateral morphology of young spikelets in the extremely late-sown wheat was smaller, the number of DM floret primordia exceeded 20 and 40, the peak was delayed by 1 d and 2 d, the peak was advanced by 2 d, and the number of peaks and the number of final formations were reduced by 31.39% and 41.26%, respectively. Under extremely late sowing conditions, delaying the sowing date and increasing the density resulted in a smaller lateral morphology in young spikes, delayed and shorter floret primordia formation, reduced peaks, and a reduced number of final formations, affecting floret development and formation (Figure 4).

3.3.4. Effects of Sowing Time and Density on Rate of Small Flower Primordia Formation

As shown in Figure 10, the lateral morphology of young spikes in the extremely late-sown wheat was smaller, and the DM floret primordia formation rate was significantly reduced by 12.45% compared to that in the CK. Under extremely late sowing conditions, delaying sowing and increasing the sowing density caused a shorter lateral morphology in young spikelets; however, under the same density conditions, the number of D3 floret primordia decreased (Figure 6), but the rate of D3 floret primordia formation significantly increased by 20.43% and 27.05% compared to that of D1 and D3, respectively, which in turn led to an increase in the number of florets (Figure 7) and was the main reason for the increase in the number of grains per spike (Table 2). In addition, density did not significantly affect seedling emergence, and there was no interaction effect between the sowing period and density on seedling emergence.

3.4. Influence of Sowing Time and Density on 1000-Grain Weights

3.4.1. Logistic Model for Grain-Filling

As shown in Table 3 and Table 4, compared to that of the CK, the DM grain-filling time was slightly shorter, and the reduction in the filling rate was greater, affecting the 1000-grain weight. When the sowing density was extremely late, the sowing period had a greater impact on the grouting rate, in which the D3 grouting rate was high, which was favorable for the formation of the thousand-kernel weight, whereas the density also affected the formation of the seed grain by affecting the grouting rate; the higher the density was, the lower the grouting rate was, which was, in turn, unfavorable for the formation of the thousand-kernel weight.

3.4.2. Crown Temperature and Humidity During Grain-Filling Process

As shown in Figure 11, compared to the CK, the DM seed-filling time was delayed by 3 d. However, the difference in the daily average temperature and humidity during the filling process was smaller, with an increase of 3.51% in the cumulative daily average canopy temperature and a decrease of 2.20% in the cumulative daily average canopy humidity. The difference in the cumulative canopy temperature and humidity values during the filling process between the CK treatment and the LGW treatment was small, and the values were essentially the same.

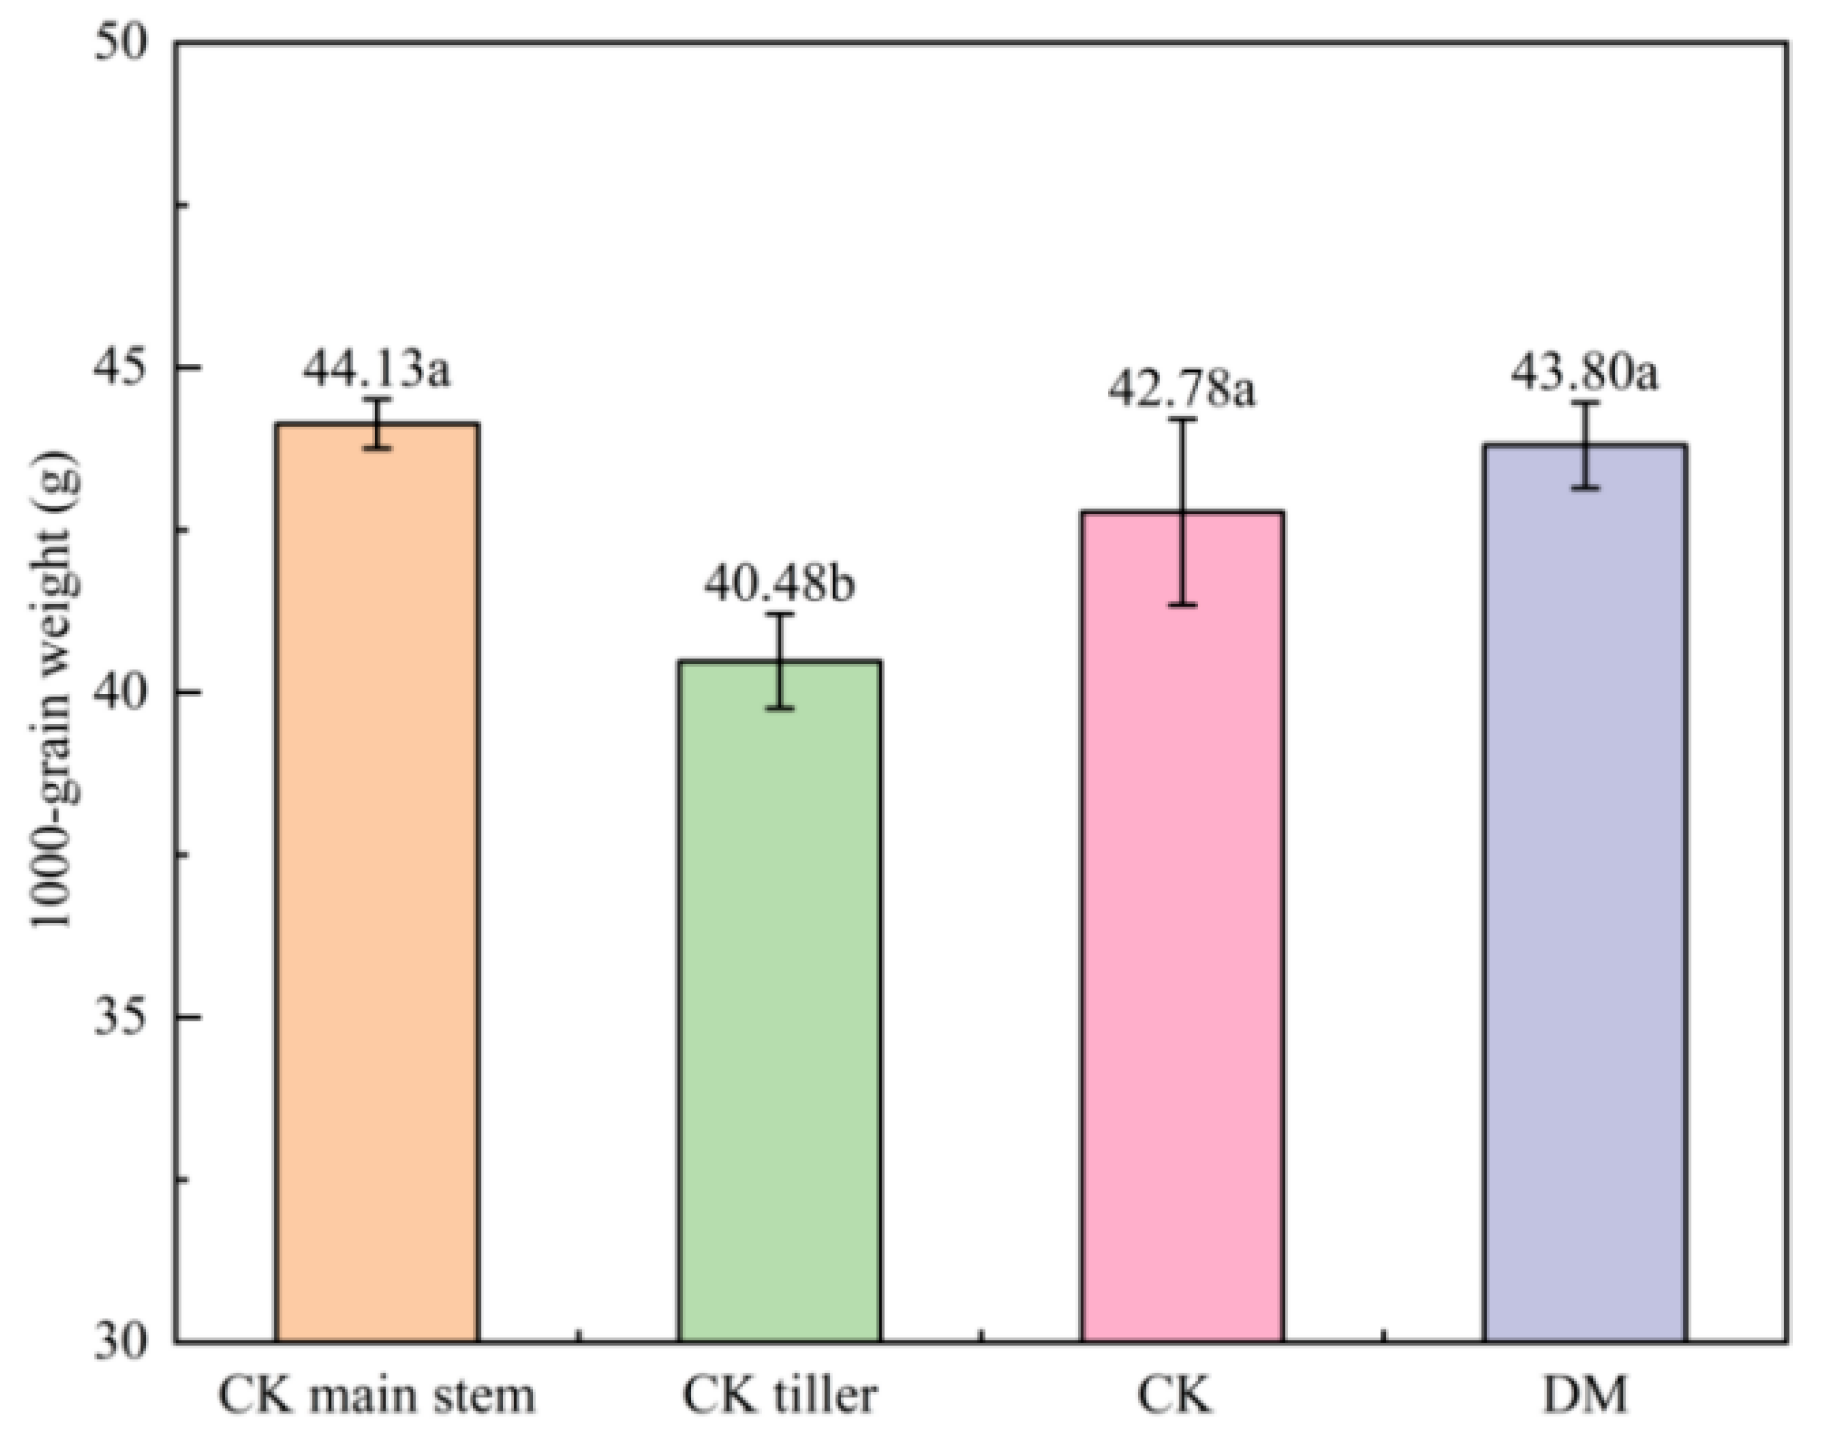
3.4.3. Differences in 1000-Grain Weights

As shown in Figure 12, the difference between the thousand-kernel weight of the CK, CK main stem, and DM was not significant, whereas all three weights were significantly greater than that of the CK tiller thousand-kernel weight. The CK main stem weight was 0.75% greater and the CK and CK tiller weights were 2.33% and 7.58% lower, respectively, than the DM weight.

4. Discussion

4.1. Increasing Density Increased the Number of Main Stem Spikes in Extremely Late-Sown Wheat, Thus Increasing the Number of Harvested Spikes

Conventionally sown winter wheat has suitable germination conditions and growth environments, high seedling rates, stable basic seedling numbers, high tiller spike formation rates, reasonable population structures, healthy spike development, and favorable grain formation, which are good for obtaining high yields [20,27]. In contrast, the excessively late sowing of winter wheat exposes it to unfavorable environmental conditions in terms of germination and growth, low seedling emergence, high overwintering mortality, insufficient basic seedling numbers, late tillering, and almost total extinction results with a sharp decrease in the number of harvested spikes, which ultimately affects yield [20,28,29]. Increasing the density to increase the number of basic seedlings and utilizing the main stem to form spikes to compensate for the disadvantage of a reduced number of harvested spikes is the most commonly used cultivation tool to achieve high yields in late-sown wheat [11,16]. In this study, extremely late-sown wheat had a weak overwintering morphology, a low content of cellular osmoregulatory substances, high overwintering mortality, and low post-spring emergence, which was consistent with the results of previous studies [11,27]. In addition, after increasing the density in this study, although the tillers were basically not spiked and the effective spikes were almost all main stem spikes, the number of spikes harvested was much greater than that of conventionally sown wheat, so increasing the density compensated for the defects associated with late sowing, which resulted in a decrease in yield (Figure 4 and Table 2).
When increasing wheat yield and reducing yield gaps, selecting the optimal sowing date and density to obtain the optimal population size is conducive to more efficient resource utilization and higher yields and profits [16]. Excessive density not only increases the sowing cost and waste of seeds but also increases interspecific competition and decreases the quality of stem spike development, resulting in lower yields [22]. This study revealed that under extremely late sowing conditions, D2 had a greater content of cellular osmoregulatory substances than D1 and D3 did; low overwintering mortality; high seedling emergence rates; the highest population size; and the greatest number of main stem spikes, with a consequent increase in the number of harvested spikes, which better compensated for low seedling emergence and tiller extinction, in addition to saving seeds and reducing production costs (Figure 4, Figure 5 and Figure 6, and Table 2). However, excessive density increased the transformation of main stem spikes into ineffective spikes, which affected population development and resulted in yield loss, with less of this phenomenon occurring in M1 and M2 (Figure 4). In addition to the influence of the external environment, the limit of the late sowing of wheat could not be very late. When the surface temperature was below 0 °C (the test began on 10 November), the field soil froze. This caused the phenomenon of “melting during the day, freezing at night” coupled with an increase in snow and rain at this time, an increase in the field soil moisture content, the soil melting, and the land being muddy, resulting in the need for agricultural machinery. After the soil thawed, the land was muddy, resulting in poorer seeding quality and a corresponding increase in costs (Figure 1), which also occurred in a trial of the winter sowing of spring wheat in Inner Mongolia, China [7].

4.2. Delayed Sowing Affected Young Spike Differentiation in Limited Late-Sown Wheat, Thus Reducing the Number of Grains per Spike

The number of wheat grains depends largely on the presence of effective florets, which in turn depend on the production and degradation of florets, and the number of florets is closely related to spikelet formation and the differentiation of young spikes into floret primordia and spikelet primordia [30]. Delaying the sowing date reduces factors that favor spikelet growth and development, including the duration of floret and spikelet development, effective cumulative temperature, and cumulative solar radiation. This delay adversely affects the overall process of spikelet differentiation, leading to a reduction in floret and spikelet primordia. Additionally, the reproductive capacity of spikelets after flowering declines, while the number of abortive spikelets increases, ultimately decreasing the number of grains per spike [31,32,33]. In this experiment, extremely late wheat sowing delayed and shortened the period of spikelet differentiation, hindering the growth of young wheat spikes. This resulted in smaller spikelet morphology, a corresponding reduction in spikelet and floret primordia, and a lower rate of floret primordia formation. Consequently, thinner spikelet morphology, fewer spikelets and florets, and an increased number of ineffective spikelets and weaker florets were observed. These factors collectively contributed to a reduction in the number of grains per spike, as shown in Figure 7, Figure 8, Figure 9 and Figure 10 and Table 2. This also became the main reason for the decrease in the yield of the extremely late-sown wheat.
Delaying the sowing date resulted in a decrease in the number of grains per spike, which was consistent with the findings of the studies [34,35]; however, in this experiment, D3 wheat presented the greatest spikelet morphology and a high number of grains per spike. On the one hand, this decrease occurred because of the increase in the rate of floret primordium formation to compensate for the disadvantage of the insufficient number of floret primordia (Figure 9 and Figure 10), and on the other hand, it might have been due to its low seedling emergence rate (Figure 5), low population size, and weak competition. And, the effect of the sowing treatment on the number of grains per spike was smaller than that of the density treatment (the F value of the number of grains per spike in the two years of data in Table 1 was much greater at sowing), which was the result of the promotion effect. However, when D3 was sown, the soil was frozen, and it was difficult to meet the normal sowing requirements. D1 and D2 could meet the high yield requirements of extremely late-sown wheat, but the average daily 4 cm-soil ground temperature during the overwintering period in this experiment was higher than that in previous years (Figure 2), and the seedling rate of extremely late-sown wheat was strongly influenced by the ground temperature conditions of the sowing layer during the overwintering period. The lower the temperature was, the more severely the wheat was subjected to freezing, the lower the seedling rate was, and the greater the yield loss was [36,37]. Therefore, a suitable sowing period should be selected to improve wheat’s frost resistance and guarantee the seedling emergence rate, and the density should also be increased appropriately to resist the risk of a lower seedling emergence rate to ensure wheat yield.

4.3. Extremely Late Wheat Grouting Was Limited by the Canopy Environment of the Population, Which in Turn Reduced the Thousand-Kernel Weight

Wheat grouting is significantly influenced by the canopy environment, with elevated canopy temperatures shortening the grouting duration, which adversely impacts seed development and leads to reductions in the 1000-grain weight and overall yield [38,39]. Delayed sowing causes a lag in wheat growth and development, increases the average daily temperature, and raises the likelihood of hot weather exposure, thereby intensifying the inhibitory effects on grouting [40]. Higher planting density and population size further slow the grouting rate, resulting in a decreased 1000-grain weight and yield [18,41]. In this experiment, extremely late-sown wheat exhibited a slightly lower grouting time rate compared to conventionally sown wheat (Table 4), possibly due to the similarity in environmental conditions during the grouting process (Figure 11). However, the reduced average grouting rate of the extremely late-sown wheat may be attributed to its higher population size (Table 4). While the kernel weight of the extremely late-sown wheat was slightly higher than that of the conventionally sown wheat, all grouting parameters were more favorable for the conventionally sown wheat. This difference can be explained by the focus on main stem spikes for grouting measurements; the extremely late-sown wheat consisted primarily of main stem spikes, whereas the conventionally sown wheat included a proportion of tiller spikes, which had a significantly lower thousand-kernel weight (Figure 4 and Figure 12). Under extremely late sowing conditions, the canopy environment and irrigation schedules were nearly identical (Figure 11, Table 4). However, increased density resulted in a lower irrigation rate and reduced the thousand-grain weight. The high thousand-grain weight observed in D3 can be linked to its low seedling emergence rate (Figure 5) and smaller population size, despite the lower overall yield under these conditions. Ultimately, D3 exhibited the highest thousand-kernel weight and the greatest number of grains per spike; however, the reduced number of harvested spikes prevented the achievement of a high yield target. This outcome also demonstrated the compensatory advantage of increasing planting density to enhance the number of harvested spikes in the extremely late-sown wheat.

5. Conclusions

Under extremely late sowing conditions, wheat did not emerge before winter; the plants were weak; the osmoregulatory substance content was low; and the overwintering mortality rate increased, causing a significant reduction in the rate of emergence in the spring, due to the number of harvested spikes being almost entirely main stem spikes, with no tillers turning into spikes. After raising the density, the number of basic seedlings increased, the main stem spikes increased, and the number of harvested spikes also increased significantly. Delaying the sowing date delayed and shortened the differentiation time of young wheat spikes. The morphology of young spikes became smaller; the number of spikelet primordia and floret primordia decreased, causing the number of spikelets and florets to decrease; and the morphology of wheat spikes became smaller, resulting in a decrease in the number of grains per spike. Higher densities, increased population competition, and lower rates of grain-filling speed and progression led to a reduction in the 1000-grain weight. In terms of yield, increasing the density could compensate for the loss from the reduced number of grains per spike and 1000-grain weight by increasing the number of harvested spikes, resulting in high yields. After comprehensive analysis, we conclude that the northern Xinjiang wheat area planting limit for late-sown wheat should be 4 November (pre-winter cumulative temperature of 47.5 °C) with a sowing density of 450 kg·hm−2 (1.00 × 10⁶ seeds/hm2) for best results.

Author Contributions

W.T.: Conceptualization, Formal analysis, Investigation, Methodology, Writing—original draft preparation; Q.Z.: Visualization, Investigation; Z.Z.: Software, Validation; J.Z. (Jun Zhang): Data curation; S.Y.: Writing—review; J.Z. (Jinshan Zhang): Conceptualization; Funding acquisition; G.C.: Supervision; Writing—review and editing; S.S.: Project administration, Supervision. All authors have read and agreed to the published version of the manuscript.

Funding

This work was supported by the Xinjiang Uygur Autonomous Region Key R&D Program “Research and Demonstration of Key Technologies for Ultra-late Sowing of High-yielding Large Groups of Wheat and Water and Fertiliser Transportation in the Tae Basin, Northern Xinjiang, China” [Grant numbers 2021B02002-1].

Data Availability Statement

Data will be made available on request.

Acknowledgments

The experiment received strong support and assistance from the Agricultural Technology Extension Center and the Agricultural Science Research Institute of Tacheng, Xinjiang.

Conflicts of Interest

The authors have no competing interests to declare that are relevant to the content of this article.

References

  1. Dong, J.; Lu, H.; Wang, Y.; Ye, T.; Yuan, W. Estimating winter wheat yield based on a light use efficiency model and wheat variety data. ISPRS J. Photogramm. 2020, 160, 18–32. [Google Scholar] [CrossRef]
  2. Meng, L.; Liu, Z.; Zhang, L.; Hu, G.; Song, X. Cytological characterization of a thermo-sensitive cytoplasmic male-sterile wheat line having K-type cytoplasm of Aegilops kotschyi. Breed. Sci. 2016, 66, 752–761. [Google Scholar] [CrossRef] [PubMed]
  3. The Food and Agriculture Organization (FAO). FAO Statistics Database. 2020. Available online: https://www.fao.org/faostat/zh/#data/QCL (accessed on 23 January 2025).
  4. Zhao, G. Research on wheat planting regionalization in China (II). J. Triticeae Crop. 2020, 30, 1140–1147. [Google Scholar]
  5. Li, J.; Nie, S.; Niu, K.; Zhao, F.; Liu, M.; Zhang, J. Green, high-yield and efficient cultivation techniques for winter wheat under drip irrigation in the Ta’e Basin. China Agric. Technol. Ext. 2022, 38, 34–36. [Google Scholar]
  6. Wang, B.; Zhang, Y.; Hao, B.; Xu, X.; Zhao, Z.; Wang, Z.; Xue, Q. Grain yield and water use efficiency in extremely-late sown winter wheat cultivars under two irrigation regimes in the North China Plain. PLoS ONE 2016, 11, e0153695. [Google Scholar] [CrossRef]
  7. Dong, Y.; Wei, B.; Wang, L.; Zhang, Y.; Zhang, H.; Zhang, Y. Performance of winter-seeded spring wheat in Inner Mongolia. Agronomy 2019, 9, 507. [Google Scholar] [CrossRef]
  8. Dreccer, M.F.; Chapman, S.C.; Rattey, A.R.; Neal, J.; Song, Y.; Christopher, J.T.; Reynolds, M. Developmental and growth controls of tillering and water-soluble carbohydrate accumulation in contrasting wheat (Triticum aestivum L.) genotypes: Can we dissect them? J. Exp. Bot. 2013, 64, 143–160. [Google Scholar] [CrossRef]
  9. Akhtar, M.; Iqbal, R.M.; Jamil, M.; Akhtar, L.H. Effect of sowing date on emergence, tillering and grain yield of different wheat varieties under Bahawalpur conditions. Pak. J. Agric. Sci. 2012, 49, 255–259. [Google Scholar]
  10. Shah, F.; Coulter, J.A.; Ye, C.; Wu, W. Yield penalty due to delayed sowing of winter wheat and the mitigatory role of increased seeding rate. Eur. J. Agron. 2020, 119, 126120. [Google Scholar] [CrossRef]
  11. Li, C.; Li, W.; Luo, Y.; Jin, M.; Chang, Y.; Cui, H.; Sun, S.; Li, Y.; Wang, Z. Mixed cropping increases grain yield and lodging resistance by improving the canopy light environment of wheat populations. Eur. J. Agron. 2023, 147, 126849. [Google Scholar] [CrossRef]
  12. Zhang, F.; Zhang, D.; Li, L.; Zhang, Z.; Liang, X.; Wen, Q.; Chen, G.; Wu, Q.; Zhai, Y. Effect of planting density on canopy structure, microenvironment, and yields of uniformly sown winter wheat. Agronomy 2023, 13, 870. [Google Scholar] [CrossRef]
  13. Ma, S.; Wang, T.; Guan, X.; Zhang, X. Effect of sowing time and seeding rate on yield components and water use efficiency of winter wheat by regulating the growth redundancy and physiological traits of root and shoot. Field Crop Res. 2018, 221, 166–174. [Google Scholar] [CrossRef]
  14. Gao, Y.; Zhang, M.; Yao, C.; Liu, Y.; Wang, Z.; Zhang, Y. Increasing seeding density under limited irrigation improves crop yield and water productivity of winter wheat by constructing a reasonable population architecture. Agric. Water Manag. 2021, 253, 106951. [Google Scholar] [CrossRef]
  15. Mu, H.; Wang, Z.; Sun, L.; Huang, Y.; Song, Y.; Zhang, R.; Wu, Z.; Fu, K.; Duan, J.; Kang, G. Optimizing nitrogen fertilization and planting density management enhances lodging resistance and wheat yield by promoting carbohydrate accumulation and single spike development. Crop Sci. 2024, 64, 3461–3479. [Google Scholar] [CrossRef]
  16. Lollato, R.P.; Ruiz Diaz, D.A.; DeWolf, E.; Knapp, M.; Peterson, D.E.; Fritz, A.K. Agronomic practices for reducing wheat yield gaps: A quantitative appraisal of progressive producers. Crop Sci. 2019, 59, 333–350. [Google Scholar] [CrossRef]
  17. Zheng, F.; Chu, J.; Guo, X.; Zhang, X.; Ma, J.; He, M.; Dai, X. Combining wide seedling strip planting with a higher plant density results in greater yield gains in winter wheat. Ann. Agric. Sci. 2024, 69, 1–10. [Google Scholar] [CrossRef]
  18. Chen, M.; Zhu, Y.; Ren, M.; Jiang, L.; He, J.; Dong, R. Does belt uniform sowing improve winter wheat yield under high sowing density? Agronomy 2022, 12, 2936. [Google Scholar] [CrossRef]
  19. Coventry, D.R.; Reeves, T.G.; Brooke, H.D.; Cann, D.K. Influence of genotype, sowing date, and seeding rate on wheat development and yield. Aust. J. Exp. Agric. 1993, 33, 751–757. [Google Scholar] [CrossRef]
  20. Yin, L.; Dai, X.; He, M. Delayed sowing improves nitrogen utilization efficiency in winter wheat without impacting yield. Field Crop Res. 2018, 221, 90–97. [Google Scholar] [CrossRef]
  21. Sun, H.; Shao, L.; Chen, S.; Wang, Y.; Zhang, X. Effects of sowing time and rate on crop growth and radiation use efficiency of winter wheat in the North China Plain. Int. J. Plant Prod. 2013, 7, 117–138. [Google Scholar]
  22. Bastos, L.M.; Carciochi, W.; Lollato, R.P.; Jaenisch, B.R.; Rezende, C.R.; Schwalbert, R.; Vara Prasad, P.V.; Zhang, G.; Fritz, A.K.; Foster, C. Winter wheat yield response to plant density as a function of yield environment and tillering potential: A review and field studies. Front. Plant Sci. 2020, 11, 54. [Google Scholar] [CrossRef] [PubMed]
  23. Yao, F.; Li, Q.; Zeng, R.; Shi, S. Effects of different agricultural treatments on narrowing winter wheat yield gap and nitrogen use efficiency in China. J. Integr. Agric. 2021, 20, 383–394. [Google Scholar] [CrossRef]
  24. Li, F. Preliminary study on the superiority of spring wheat winter sowing and field techniques. Chin. Agicr. Sci. 1961, 2, 20. [Google Scholar]
  25. Tulufan County Agricultural Science Institute. Investigation report on the cultivation of egg-wrapped wheat in the First Management Area of Wuxing Commune in Tulufan County. Agric. Sci. 1961, 207–210. [Google Scholar]
  26. Irigoyen, J.J.; Einerich, D.W.; Sánchez-Díaz, M. Water stress induced changes in concentrations of proline and total soluble sugars in nodulated alfalfa (Medicago sativd) plants. Physiol. Plantarum. 1992, 84, 55–60. [Google Scholar] [CrossRef]
  27. Aula, L.; Easterly, A.C.; Creech, C.F. Winter wheat seeding decisions for improved grain yield and yield components. Agronomy 2022, 12, 3061. [Google Scholar] [CrossRef]
  28. Sattar, A.; Nanda, G.; Singh, G.; Jha, R.K.; Bal, S.K. Responses of phenology, yield attributes, and yield of wheat varieties under different sowing times in Indo-Gangetic Plains. Front. Plant Sci. 2023, 14, 1224334. [Google Scholar] [CrossRef]
  29. Zhu, Y.; Liu, J.; Li, J.; Xian, L.; Chu, J.; Liu, H.; Song, J.; Sun, Y.; Dai, Z. Delayed sowing increased dry matter accumulation during stem elongation in winter wheat by improving photosynthetic yield and nitrogen accumulation. Eur. J. Agron. 2023, 151, 127004. [Google Scholar] [CrossRef]
  30. Li, S.; Song, M.; Duan, J.; Yang, J.; Zhu, Y.; Zhou, S. Regulation of spraying 6-BA in the late jointing stage on the fertile floret development and grain setting in winter wheat. Agronomy 2019, 9, 546. [Google Scholar] [CrossRef]
  31. Zhang, Z.; Huang, J.; Gao, Y.; Liu, Y.; Li, J.; Zhou, X.; Yao, C.; Wang, Z.; Sun, Z.; Zhang, Y. Suppressed ABA signal transduction in the spike promotes sucrose use in the stem and reduces grain number in wheat under water stress. J. Exp. Bot. 2020, 71, 7241–7256. [Google Scholar] [CrossRef]
  32. Lin, F.; Li, C.; Xu, B.; Chen, J.; Chen, A.; Hassan, M.A.; Liu, B.; Xu, H.; Chen, X.; Sun, J. Late spring cold reduces grain number at various spike positions by regulating spike growth and assimilate distribution in winter wheat. Crop J. 2023, 11, 1272–1278. [Google Scholar] [CrossRef]
  33. Liu, J.; He, Q.; Zhou, G.; Song, Y.; Guan, Y.; Xiao, X.; Sun, W.; Shi, Y.; Zhou, K.; Zhou, S. Effects of sowing date variation on winter wheat yield: Conclusions for suitable sowing dates for high and stable yield. Agronomy 2023, 13, 991. [Google Scholar] [CrossRef]
  34. Zhou, J.; Zhang, Z.; Xin, Y.; Chen, G.; Wu, Q.; Liang, X.; Zhai, Y. Effects of planting density on root spatial and temporal distribution and yield of winter wheat. Agronomy 2022, 12, 3014. [Google Scholar] [CrossRef]
  35. Sun, Y.; Yang, W.; Wu, Y.; Cui, Y.; Dong, Y.; Dong, Z.; Hai, J. The effects of different sowing density and nitrogen topdressing on wheat were investigated under the cultivation mode of hole sowing. Agronomy 2023, 13, 1733. [Google Scholar] [CrossRef]
  36. Su, W.P.; Wang, H.; Aimulaguli, K.; Zhao, X.; Xue, L.; Zhang, J.; Liu, J.; Sun, S. Comparison of growth characteristics and yields of different wheat varieties planted in the approaching winter in northern Xinjiang. Crops 2021, 37, 108–114. [Google Scholar]
  37. Wang, Z.; Khan, S.; Sun, M.; Ren, A.; Lin, W.; Ding, P.; Noor, H.; Yu, S.; Feng, Y.; Wang, Q. Optimizing the wheat seeding rate for wide-space sowing to improve yield and water and nitrogen utilization. Int. J. Plant Prod. 2021, 15, 553–562. [Google Scholar] [CrossRef]
  38. Cai, D.; Shoukat, M.R.; Zheng, Y.; Tan, H.; Meng, F.; Yan, H. Optimizing center pivot irrigation to regulate field microclimate and wheat physiology under dry-hot wind conditions in the North China Plain. Water 2022, 14, 708. [Google Scholar] [CrossRef]
  39. Yang, J.; Feng, Y.; Chi, T.; Wen, Q.; Liang, P.; Wang, A.; Li, P. Mitigation of elevated CO2 concentration on warming-induced changes in wheat is limited under extreme temperature during the grain filling period. Agronomy 2023, 13, 1379. [Google Scholar] [CrossRef]
  40. Zhang, Z.; Xing, Z.; Zhou, N.; Zhao, C.; Liu, B.; Jia, D.; Wei, H.; Guo, B.; Zhang, H. Effects of post-anthesis temperature and radiation on grain filling and protein quality of wheat (Triticum aestivum L.). Agronomy 2022, 12, 2617. [Google Scholar] [CrossRef]
  41. Wang, T.; Li, L.; Wang, X.; Xue, L.; Zhang, X.; Sun, W.; Wang, H. Effect of snowing date on growth characteristic and yield and quality of spring wheat varieties sowing in winter. J. China Agric. Univ. 2021, 26, 28–40. [Google Scholar]
Figure 1. Daily maximum temperature, average temperature, minimum temperature, rainfall, and snowfall during the wheat sowing stage (15 September 2022–30 November 2022). Note: the shaded area shows that after 10 November 2022, the surface temperature dropped below 0 °C, and the soil in the fields began to show a phenomenon of “melting during the day and freezing at night”.
Agronomy 15 00607 g001
Figure 2. Daily average ground temperature of soil 4 cm underground in the experimental field during the wheat overwintering stage (December 2022–February 2023).
Agronomy 15 00607 g002
Figure 3. Monthly average rainfall and temperature during wheat growth season (September 2022 July 2023).
Agronomy 15 00607 g003
Figure 4. The composition of the number of wheat panicles under different sowing dates and densities. Note—CK: conventionally sown wheat (sowing date, 25 September; sowing amount, 270 kg·hm−2); DM: the average value of each treatment for ultra-late-sown wheat; D1: broadcast on 25 October; D2: broadcast on 4 November; D3: broadcast on 14 November; M1: seeding rate, 337.5 kg·hm−2; M2: seeding rate, 450 kg·hm−2; M3: seeding rate, 562.5 kg·hm−2; M4: 675 kg·hm−2. Different letters in the same group of data indicate significant differences (p < 0.05) between treatments of ultra-late-sown wheat.
Agronomy 15 00607 g004
Figure 5. Seedling emergence of wheat at different sowing dates and densities. Note—CK: conventionally sown wheat (sowing date, 25 September; sowing amount, 270 kg·hm−2); DM: average value of each treatment for ultra-late-sown wheat; D1: broadcast on 25 October; D2: broadcast on 4 November; D3: broadcast on 14 November; M1: seeding rate, 337.5 kg·hm−2; M2: seeding rate, 450 kg·hm−2; M3: seeding rate, 562.5 kg·hm−2; M4: 675 kg·hm−2. Different letters in same group of data indicate significant differences (p < 0.05) between treatments of ultra-late-sown wheat; **: p < 0.01; ns: p > 0.05.
Agronomy 15 00607 g005
Figure 6. Proline and soluble sugar contents and overwintering morphology of wheat plants sown on different sowing dates and at different sowing dates and densities. Note—CK: conventionally sown wheat (sowing date, 25 September; sowing amount, 270 kg·hm−2); DM: average value of each treatment for ultra-late-sown wheat; D1: broadcast on 25 October; D2: broadcast on 4 November; D3: broadcast on 14 November; M1: seeding rate, 337.5 kg·hm−2; M2: seeding rate, 450 kg·hm−2; M3: seeding rate, 562.5 kg·hm−2; M4: 675 kg·hm−2. Different letters in same group of data indicate significant differences (p < 0.05).
Agronomy 15 00607 g006
Figure 7. Front and side photos of wheat spikelets, the number of small flowers, and the number of mature tassels under different sowing dates and densities. Note—CK: conventionally sown wheat (sowing date, 25 September; sowing amount, 270 kg·hm−2); DM: the average value of each treatment for ultra-late-sown wheat; D1: broadcast on 25 October; D2: broadcast on 4 November; D3: broadcast on 14 November; M1: seeding rate, 337.5 kg·hm−2; M2: seeding rate, 450 kg·hm−2; M3: seeding rate, 562.5 kg·hm−2; M4: 675 kg·hm−2. Different letters in the same group of data indicate significant differences (p < 0.05). **: p < 0.01.
Agronomy 15 00607 g007
Figure 8. Wheat spikelet primordia for different sowing dates and densities and frontal photos of spikelet primordia on 1 May 2023. Note—CK: conventionally sown wheat (sowing date, 25 September; sowing amount, 270 kg·hm−2); DM: average value of each treatment for ultra-late-sown wheat; D1: broadcast on 25 October; D2: broadcast on 4 November; D3: broadcast on 14 November; M1: seeding rate, 337.5 kg·hm−2; M2: seeding rate, 450 kg·hm−2; M3: seeding rate, 562.5 kg·hm−2; M4: 675 kg·hm−2.
Agronomy 15 00607 g008
Figure 9. Wheat’s small flower primordia for different sowing dates and densities and side photos of small flower primordia on 4 May 2023. Note—CK: conventionally sown wheat (sowing date, 25 September; sowing amount, 270 kg·hm−2); DM: average value of each treatment for ultra-late-sown wheat; D1: broadcast on 25 October; D2: broadcast on 4 November; D3: broadcast on 14 November; M1: seeding rate, 337.5 kg·hm−2; M2: seeding rate, 450 kg·hm−2; M3: seeding rate, 562.5 kg·hm−2; M4: 675 kg·hm−2.
Agronomy 15 00607 g009
Figure 10. The formation rate of small flower primordia in wheat plants sown on different sowing dates and densities and at different sowing densities and a side-view photo of small flower primordia on 10 May 2023. Note—CK: conventionally sown wheat (sowing date, 25 September; sowing amount, 270 kg·hm−2); DM: the average value of each treatment for ultra-late-sown wheat; D1: broadcast on 25 October; D2: broadcast on 4 November; D3: broadcast on 14 November; M1: seeding rate, 337.5 kg·hm−2; M2: seeding rate, 450 kg·hm−2; M3: seeding rate, 562.5 kg·hm−2; M4: 675 kg·hm−2. Different letters in the same group of data indicate significant differences (p < 0.05) between treatments of ultra-late-sown wheat. **: p < 0.01; ns: p > 0.05.
Agronomy 15 00607 g010
Figure 11. Temperature and humidity of grain-filling canopy. Note—CK: conventionally sown wheat (sowing date, 25 September; sowing amount, 270 kg·hm−2); DM: average value of each treatment for ultra-late-sown wheat.
Agronomy 15 00607 g011
Figure 12. Thousand-grain weights. Note: CK main stem is the 1000-grain weight of the control main stem spike, CK tiller is the 1000-grain weight of the control tiller spike, CK is the 1000-grain weight of the control, and DM is the 1000-kernel weight of the average of the treatments of the ultra-late-sown wheat. Different letters indicate significant differences between different treatments (p < 0.05).
Agronomy 15 00607 g012
Table 1. Soil nutrient conditions in different soil layers.
Soil Layer
(cm)
Organic Matter
(g/kg)
Alkali Hydrolyzed Nitrogen (mg/kg)Olsen-P
(mg/kg)
Available K
(mg/kg)
pHTotal Nitrogen
(g/kg)
Total Phosphorus
(g/kg)
Total Potassium
(g/kg)
0~2025.1945.5015.76164.908.320.341.1414.84
20~4022.0945.0023.60208.008.250.260.8014.62
Note: this experiment was conducted as a two-year field trial in 2021–2023, but due to the limitations of the test conditions, only yield is from the data of the two-year trial, and the rest of the indicators are from the data of the one-year trial.
Table 2. Wheat yield and related components under different sowing dates and densities.
Sowing DateDensity2021–20222022–2023
Spikelet/
(104·hm−2)
Grains per Spike1000-Grain Weight/gYield/
(kg·hm−2)
Spikelet/
(104·hm−2)
Grains per Spike1000-Grain Weight/gYield/
(kg·hm−2)
CK651.17 b50.53 a43.20 a9711.84 a649.88 b51.90 a42.78 a9733.79 a
DM785.74 a31.62 b43.63 a8936.44 b783.56 a31.81 b43.80 a8994.44 b
D1 (10–25)M1611.50 d40.60 a44.94 a9198.06 a616.75 h42.75 a44.92 ab9344.42 ab
M2783.50 c33.80 b44.53 a9290.33 a785.25 e34.05 cd44.68 bc9383.53 ab
M3861.50 b28.13 c42.60 b8943.46 ab866.75 c27.20 ef43.00 fg9041.31 bcd
M4984.67 a23.47 c41.89 b8486.63 b983.63 a23.50 f42.50 g8756.85 cde
Average810.29 b31.50 ab43.49 b8979.62 b813.09 b31.88 ab43.77 b9131.53 a
D2 (11–04)M1651.83 d39.07 a44.33 a9426.29 ab642.63 gh38.65 ab44.45 bcd9380.47 ab
M2835.50 c31.33 b43.98 a9618.30 a829.75 d32.05 cd43.70 def9625.14 a
M3916.67 b26.27 bc42.74 b9218.53 ab914.50 b26.65 ef43.09 efg9199.58 abc
M41036.00 a23.27 c42.64 b8880.26 b1016.50 a22.80 f42.64 g9022.70 bcd
Average860.00 a29.98 b43.42 b9285.84 a850.84 a30.04 b43.47 b9306.97 a
D3 (11–14)M1508.33 d41.73 a45.35 a8180.03 a512.13 i41.70 a45.58 a8230.08 f
M2661.83 c35.93 b44.75 a8504.54 a654.13 g36.05 bc44.50 bcd8451.56 ef
M3735.00 b29.87 c43.83 b8711.32 a737.25 f30.20 de43.90 cde8811.16 cde
M4842.50 a25.93 c42.00 c8779.48 a843.50 cd26.10 ef42.69 g8686.51 def
Average686.92 c33.37 a43.98 a8543.84 c686.75 c33.51 a44.17 a8544.83 b
FD138.30 **5.79 **3.90 *15.05 **198.41 **5.79 **4.09 **21.75 **
M304.28 **75.48 **48.48 **2.43 ns457.63 **78.27 **6.34 **1.90 ns
D×M0.55 ns0.50 ns2.32 *2.87 ns0.94 ns0.50 ns42.71 **2.78 ns
Note: Production is from two years of data, 2021–2023, and the remaining indicators are from one year of data, 2022–2023. CK: conventionally sown wheat (sowing date, 25 September; sowing amount, 270 kg·hm−2); DM: average value of each treatment for ultra-late-sown wheat; different letters in same column of data indicate significant differences (p < 0.05). D1: broadcast on 25 October; D2: broadcast on 4 November; D3: broadcast on 14 November; M1: seeding rate, 337.5 kg·hm−2; M2: seeding rate, 450 kg·hm−2; M3: seeding rate, 562.5 kg·hm−2; M4: 675 kg·hm−2. Different letters in same column of data indicate significant differences (p < 0.05) between treatments of ultra-late-sown wheat. *: p < 0.05; **: p < 0.01; ns: p > 0.05.
Table 3. Fitting and filling processes of logistic equations for wheat under different sowing times and densities.
Sowing DateDensityEquationKabR2
CKy = 54.5758/(1 + e2.8275−0.1888t)54.57582.8275−0.1888RR = 0.9980
DMy = 52.9909/(1 + e2.8449−0.1893t)52.99092.8449−0.1893RR = 0.9987
D1 (10–25)M1y = 55.8181/(1 + e2.7648−0.1835t)55.81812.7648−0.1835RR = 0.9971
M2y = 53.3995/(1 + e2.7838−0.1884t)53.39952.7838−0.1884RR = 0.9985
M3y = 51.2446/(1 + e2.8189−0.1915t)51.24462.8189−0.1915RR = 0.9983
M4y = 48.7770/(1 + e2.8527−0.1967t)48.77702.8527−0.1967RR = 0.9994
Averagey = 52.3098/(1 + e2.8051−0.1900t)52.30982.8051−0.1900RR = 0.9983
D2 (11–04)M1y = 53.7074/(1 + e2.8162−0.1907t)53.70742.8162−0.1907RR = 0.9992
M2y = 52.5196/(1 + e2.8424−0.1925t)52.51962.8424−0.1925RR = 0.9982
M3y = 52.0463/(1 + e2.8000−0.1872t)52.04632.8000−0.1872RR = 0.9984
M4y = 49.9992/(1 + e2.7614−0.1856t)49.99922.7614−0.1856RR = 0.9979
Averagey = 52.0681/(1 + e2.8050−−0.1890t)52.06812.8050−0.1890RR = 0.9984
D3 (11–14)M1y = 55.7547/(1 + e2.9285−0.1932t)55.75472.9285−0.1932RR = 0.9984
M2y = 55.3836/(1 + e2.9299−0.1915t)55.38362.9103−0.1915RR = 0.9987
M3y = 54.4009/(1 + e2.8577−0.1835t)54.40092.8577−0.1835RR = 0.9975
M4y = 53.1286/(1 + e2.9646−0.1877t)53.12862.9642−0.1877RR = 0.9988
Averagey = 54.6670/(1 + e2.9107−−0.1890t)54.66702.9107−0.1890RR = 0.9970
Note—CK: conventionally sown wheat (sowing date, 25 September; sowing amount, 270 kg·hm−2); DM: the average value of each treatment for ultra-late-sown wheat; D1: broadcast on 25 October; D2: broadcast on 4 November; D3: broadcast on 14 November; M1: seeding rate, 337.5 kg·hm−2; M2: seeding rate, 450 kg·hm−2; M3: seeding rate, 562.5 kg·hm−2; M4: 675 kg·hm−2. a and b are parameters, and K is the theoretical maximum grain weight.
Table 4. Wheat-filling parameters under different sowing dates and densities.
Sowing DateDensityt1/(d)t2/(d)t3/(d)Tmax/(d)Vmax/(g∙d−1)Vmean/(g∙d−1)T1T2T3
CK1.470112.480629.84382.576014.97621.82871.470111.010517.3632
DM1.433812.480029.79742.507815.02851.77841.433811.046317.3174
D1 (10–25)M11.634712.718930.58362.560715.06701.82511.634711.084117.8647
M21.555912.424429.82452.515114.77601.79051.555910.868517.4001
M31.465312.288729.40712.453314.72011.74261.465310.823517.1184
M41.365912.024528.69032.398614.50281.70011.365910.658516.6659
Average1.505512.364129.62642.481914.76651.76461.505510.858717.2623
D2 (11–04)M11.476412.335329.52552.560514.76771.81901.476410.858817.1902
M21.414512.268029.29752.527514.76571.79261.414510.853517.0295
M31.534912.535130.04672.435814.95731.73221.534911.000217.5116
M41.622912.568330.23092.320014.87821.65391.622910.945517.6626
Average1.512212.426729.77512.460914.84221.74941.512210.914517.3485
D3 (11–14)M11.254912.378029.34582.693015.15791.89991.254911.123116.9678
M21.298612.455429.57382.651515.19741.87271.187711.156717.1184
M31.454612.899030.76372.495615.57331.76831.504511.444317.8647
M41.227212.805330.27032.493115.79221.75511.112011.578117.4650
Average1.308812.634429.98842.583315.43021.82401.264811.325617.3540
Note—CK: conventionally sown wheat (sowing date, 25 September; sowing amount, 270 kg·hm−2); DM: average value of each treatment for ultra-late-sown wheat; D1: broadcast on 25 October; D2: broadcast on 4 November; D3: broadcast on 14 November; M1: seeding rate, 337.5 kg·hm−2; M2: seeding rate, 450 kg·hm−2; M3: seeding rate, 562.5 kg·hm−2; t1: start time of rapid-increase period; t2: end time of rapid-increase period; t3: end of grouting period; Tmax: time of maximum grouting rate; Vmax: maximum grouting level; Vmean: average grouting rate; T1: gradual-increase period; T2: rapid-increase period; T3: slow-increase period.
Disclaimer/Publisher’s Note: The statements, opinions and data contained in all publications are solely those of the individual author(s) and contributor(s) and not of MDPI and/or the editor(s). MDPI and/or the editor(s) disclaim responsibility for any injury to people or property resulting from any ideas, methods, instructions or products referred to in the content.

