A Preliminary Study on the Use of Remote Sensing Techniques to Determine the Nutritional Status and Productivity of Oats on Spatially Variable Sandy Soils
Abstract
1. Introduction
2. Materials and Methods
2.1. Field and Laboratory Studies
- Analysis of the physical and chemical properties of the soil;
- Sowing of oats and determination of plant density after germination;
- Analysis of selected biomass indices of oat plants at various growth stages;
- Monitoring of the crop using remote sensing techniques throughout the plant’s growing season.
- ➢
- 0–20 cm: for granulometric composition and pH analysis;
- ➢
- 0–30 cm and 31–60 cm: for quantification of available mineral nitrogen in nitrate (N-NO3) and ammonium (N-NH4) forms.
- (a)
- BBCH 31 stage: beginning of stem elongation;
- (b)
- BBCH 49 stage: appearance of the first awns;
- (c)
- BBCH 77 stage: late milk stage of grain maturity;
- (d)
- BBCH 99 stage: grain harvesting and seed dormancy period.
2.2. Application of Remote Sensing Techniques
- ➢
- NDVI (Normalized Difference Vegetation Index) used to quantify photosynthetically active biomass in plants [22];
- ➢
- ➢
- ➢
- EVI (Enhanced Vegetation Index) used to evaluate the vitality and health of plants and accounting for atmospheric conditions and soil background;
- ➢
- NDMI (Normalized Difference Moisture Index) used to determine vegetation water content and often used for monitoring changes in water content of leaves [27];
- ➢
- NDVI = (NIR − RED)/(NIR + RED)
- GNDVI = (NIR–G)/(NIR + G)
- SAVI = (NIR − RED) × (1 + L)/(NIR + RED + L)
- EVI = G × (NIR − RED)/(NIR + C1 × RED − C2 × BLUE + L)
- NDMI = (NIR − SWIR)/(NIR + SWIR)
- MCARI = [(RED_EDGE1 − RED) − 0.2 × (RED_EDGE1 − GREEN)] × (RED_EDGE1/RED)
- ➢
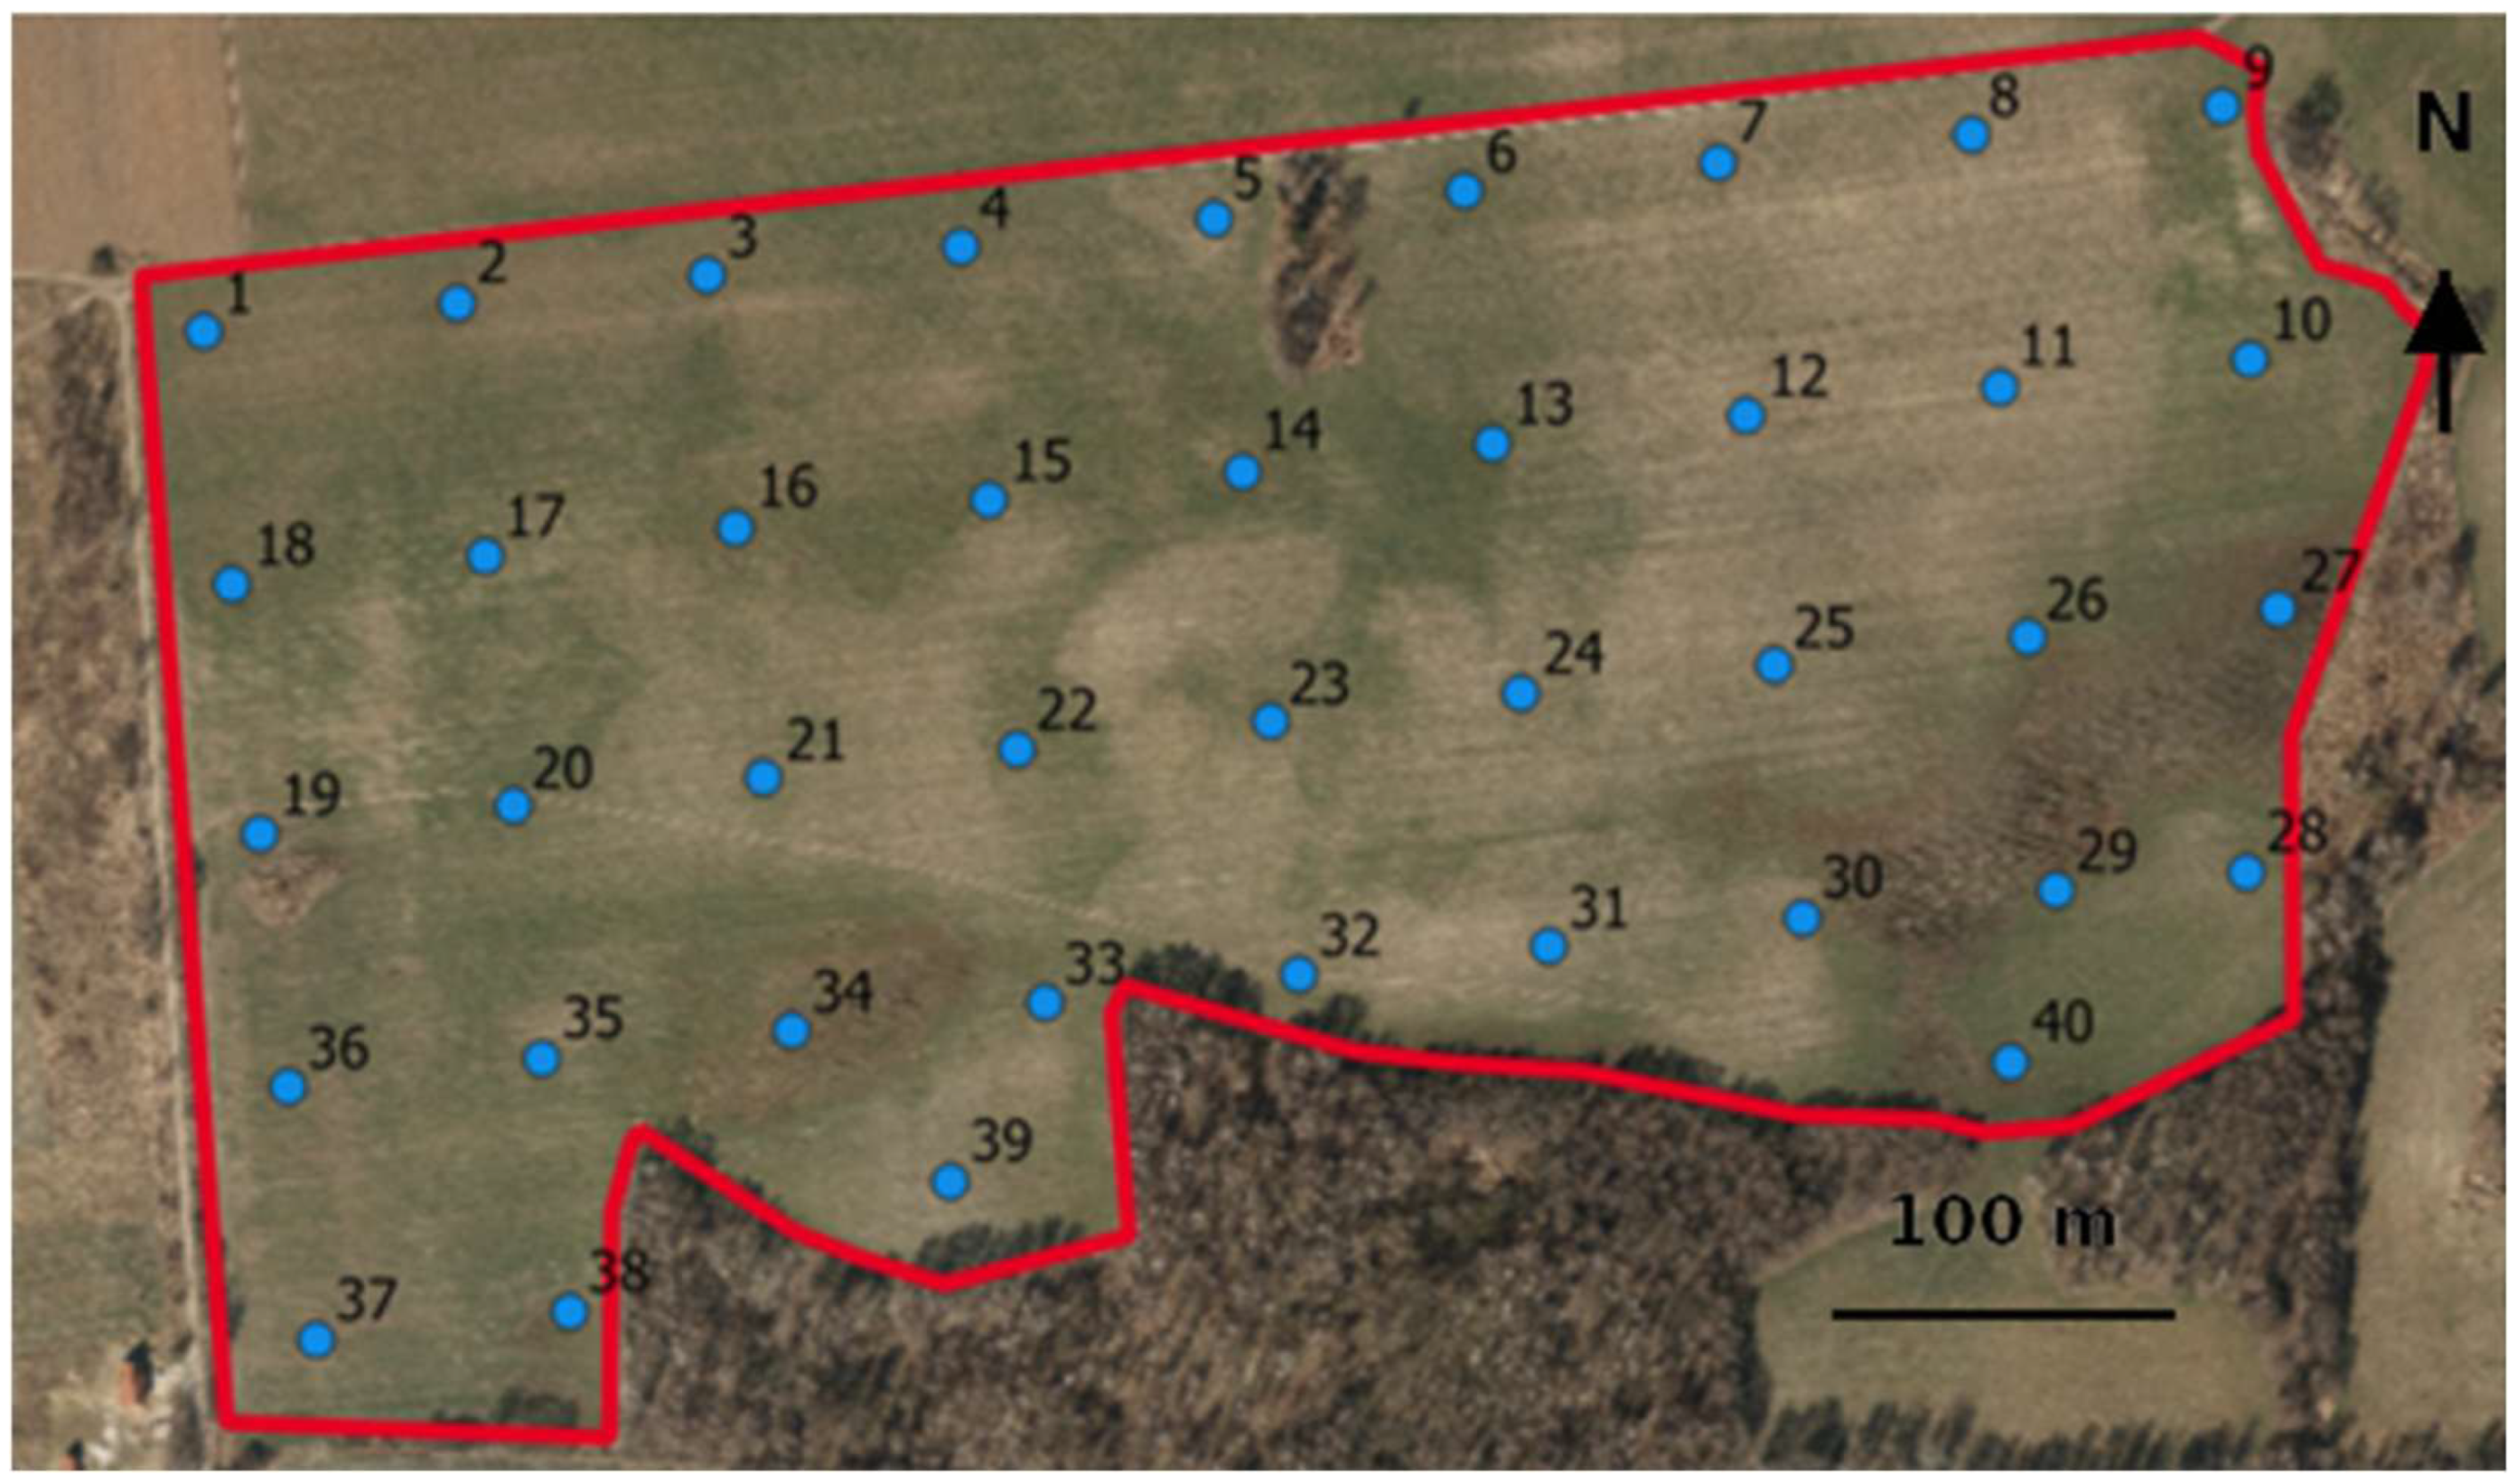
- Preparation of Source Data: Based on field studies, the mineral nitrogen content in the soil was determined at 40 measurement points. The results were recorded in a CSV file containing the coordinates of the measurement points (in the WGS84 coordinate system) and the Nmin content in the soil (in kg N·ha−1).
- ➢
- Importing Data into QGIS: After verifying the completeness and accuracy of the geographic coordinates, the data were imported into QGIS.
- ➢
- Data Processing: The following steps were undertaken during data processing:
- ➢
- Addition of a Basemap: Maps from the geoportal [31] were used as a spatial background.
- ➢
- Import of Point Data: The CSV file was imported as a point layer, and the measurement points were displayed on the map.
- ➢
- Data Interpolation: To represent the spatial distribution of element content, the interpolation tool available in QGIS was employed. The inverse distance weighting (IDW) method was applied, assuming that closer points exert a greater influence on the interpolated value than more distant ones.
- ➢
- Raster Generation and Visualization: Upon completion of the interpolation, a raster representing the spatial distribution of Nmin content in the soil was generated. This raster was overlaid on the basemap, enabling visualization of the data.
2.3. Statistical Analysis
3. Results
4. Discussion
5. Conclusions
Author Contributions
Funding
Data Availability Statement
Acknowledgments
Conflicts of Interest
References
- Bockheim, J.G.; Hartemink, A.E.; Huang, J. Distribution and properties of sandy soils in the conterminous USA—A conceptual thickness model. and taxonomic analysis. Catena 2020, 195, 104746. [Google Scholar] [CrossRef]
- Yost, J.L.; Hartemink, A.E. Soil organic carbon in sandy soils: A review. Adv. Agron. 2019, 158, 217–310. [Google Scholar] [CrossRef]
- FAO WRB 2014. Available online: https://openknowledge.fao.org/server/api/core/bitstreams/bcdecec7-f45f-4dc5-beb1-97022d29fab4/content (accessed on 28 December 2024).
- Huang, J.; Hartemink, A.E. Soil and environmental issues in sandy soils. Earth Sci. Rev. 2020, 208, 103295. [Google Scholar] [CrossRef]
- Hartemink, A.E.; Huting, J. Land cover, extent, and properties of Arenosols in South-ern Africa. Arid. Land Res. Manag. 2008, 22, 134–147. [Google Scholar] [CrossRef]
- Rutkowska, A.; Pikuła, D. Effect of Crop Rotation and Nitrogen Fertilization on the Quality and Quantity of Soil Organic Matter. In Soil Processes and Current Trends in Quality Assessment; Hernandez Soriano, M.C., Ed.; IntechOpen: Rijeka, Croatia, 2013; pp. 249–267. [Google Scholar]
- Usowicz, B.; Lipiec, J. Spatial variability of soil properties and cereal yield in a cultivated field on sandy soil. Soil Tillage Res. 2017, 174, 241–250. [Google Scholar] [CrossRef]
- Pedrera-Parrilla, A.; Brevik, E.C.; Giráldez, J.V.; Vanderlinden, K. Temporal stability of electrical conductivity in a sandy soil. Int. Agrophys. 2016, 30, 349–357. [Google Scholar] [CrossRef][Green Version]
- Gałka, B.; Kabała, C.; Karczewska, A.; Sowiński, J. Variability of soil properties in an intensively cultivated experimental field. Soil Sci. Annu. 2016, 67, 10–16. [Google Scholar] [CrossRef]
- Penuelas, J.; Coello, F.; Sardans, J. A better use of fertilizers is needed for global food security and environmental sustainability. Agric. Food Secur. 2023, 12, 5. [Google Scholar] [CrossRef]
- Sowiński, J.; Kabała, C.; Karczewska, A.; Szydełko-Rabska, E.; Gałka, B. Content of mineral nitrogen in sandy soils after the application of slow-release fertilizers in the sweet sorghum cultivation. J. Elem. 2016, 21, 1127–1139. [Google Scholar] [CrossRef]
- Kabała, C.; Karczewska, A.; Gałka, B.; Cuske, M.; Sowiński, J. Seasonal dynamics of nitrate and ammonium ion concentrations in soil solutions collected using MacroRhizon suction cups. Environ. Monit. Assess. 2017, 189, 304. [Google Scholar] [CrossRef] [PubMed]
- Allwood, J.W.; Martinez-Martin, P.; Xu, Y.; Cowan, A.; Pont, S.; Griffiths, I.; Sungurtas, J.; Clarke, S.; Goodacre, R.; Marshall, A.; et al. Assessing the Impact of Nitrogen Supplementation in Oats across Multiple Growth Locations and Years with Targeted Phenotyping and High-Resolution Metabolite Profiling Approaches. Food Chem. 2021, 355, 129585. [Google Scholar] [CrossRef] [PubMed]
- Zhang, X.; Zou, T.; Lassaletta, L.; Mueller, N.D.; Tubiello, F.N.; Lisk, M.D.; Lu, C.; Conant, R.T.; Dorich, C.D.; Gerber, J.; et al. Quantification of global and national nitrogen budgets for crop production. Nat. Food 2021, 2, 529–540. [Google Scholar] [CrossRef] [PubMed]
- Lassaletta, L.; Billen, G.; Grizzetti, B.; Anglade, J.; Garnier, J. 50 year trends in nitrogen use efficiency of world cropping systems: The relationship between yield and nitrogen input to cropland Environ. Res. Lett. 2014, 9, 105011. [Google Scholar] [CrossRef]
- Zha, H.; Miao, Y.; Wang, T.; Li, Y.; Zhang, J.; Sun, W.; Feng, Z.; Kusnierek, K. Improving Unmanned Aerial Vehicle Remote Sensing-Based Rice Nitrogen Nutrition Index Prediction with Machine Learning. Remote Sens. 2020, 12, 215. [Google Scholar] [CrossRef]
- Available online: https://www.agricolus.com (accessed on 7 January 2024).
- Rao, M.S.; Reddy, V.R. Nutrient management in cereal crops: The early growth phases and their impact on yield. Agron. J. 2016, 108, 2376–2389. [Google Scholar]
- Meier, U. Growth Stages of Mono and Dicotyledonous Plants; BBCH Monograph, Federal Biological Research Centre for Agriculture and Forestry: Bonn, Germany, 2001; p. 204. [Google Scholar]
- Amin, M.; Flowers, T.H. Evaluation of Kjeldahl digestion method. J. Res. Sci. 2004, 15, 159–179. [Google Scholar]
- Vidican, R.; Mălinaș, A.; Ranta, O.; Moldovan, C.; Marian, O.; Ghețe, A.; Ghișe, C.R.; Popovici, F.; Cătunescu, G.M. Using Remote Sensing Vegetation Indices for the Discrimination and Monitoring of Agricultural Crops: A Critical Review. Agronomy 2023, 13, 3040. [Google Scholar] [CrossRef]
- Rouse, J.W.; Haas, R.H.; Schell, J.A.; Deering, D.W. Monitoring vegetation systems in the Great Plains with ERTS. In Proceedings of the Third Earth Resources Technology Satellite-1 Symposium, Washington, DC, USA, 10–14 December 1973; Tom 1, pp. 309–317. [Google Scholar]
- Gitelson, A.A.; Merzlyak, M.N. Signature analysis of leaf reflectance spectra and a new method for estimating chlorophyll content in higher plants. Remote Sens. Environ. 1996, 58, 293–305. [Google Scholar]
- Zarco-Tejada, P.J.; Ustin, S.L. Water stress detection using a vegetation index in combination with soil line and canopy background reflectance. Int. J. Remote Sens. 2001, 22, 3875–3890. [Google Scholar]
- Huete, A.R. A soil-adjusted vegetation index (SAVI). Remote Sens. Environ. 1988, 25, 295–309. [Google Scholar] [CrossRef]
- Huete, A.R.; Jackson, R.D. Soil and vegetation effects on reflectance of the vegetation index. Remote Sens. Environ. 1989, 29, 229–238. [Google Scholar]
- Gao, B.C. NDWI—A normalized difference water index for remote sensing of vegetation liquid water from space. Remote Sens. Environ. 1996, 58, 257–266. [Google Scholar] [CrossRef]
- Datt, B. Visible/near infrared reflectance and chlorophyll content in Eucalyptus leaves. Remote Sens. Environ. 1999, 61, 250–263. [Google Scholar] [CrossRef]
- Haboudane, D.; Miller, J.R.; Pattey, E. Hyperspectral vegetation indices for the detection of plant chlorophyll content: Review and applications. Remote Sens. Environ. 2002, 81, 224–234. [Google Scholar]
- Daughtry, C.S.T.; Walthall, C.L.; Kim, M.S.; Colstoun, E.B.D.; Mcmurtrey, J.E.I. Estimation of chlorophyll concentration in maize leaves based on leaf and crown light reflection. Remote Sens. Environ. 2000, 74, 229–239. [Google Scholar] [CrossRef]
- Geoportal. Available online: https://www.geoportal.gov.pl/ (accessed on 28 December 2024).
- Qin, C.-C.; Abdalkarim, S.Y.H.; Zhou, Y.; Yu, H.-Y.; He, X. Ultrahigh water-retention cellulose hydrogels as soil amendments for early seed germination under harsh conditions. J. Clean. Prod. 2022, 370, 133602. [Google Scholar] [CrossRef]
- Nagy, A.; Szabó, A.; Adeniyi, O.D.; Tamás, J. Wheat Yield Forecasting for the Tisza River Catchment Using Landsat 8 NDVI and SAVI Time Series and Reported Crop Statistics. Agronomy 2021, 11, 652. [Google Scholar] [CrossRef]
- Blaes, X.; Chomé, G.; Lambert, M.-J.; Traore, P.C.S.; Schut, A.G.T.; Defoury, P. Quantifying fertilizer application response variability with VHR satellite time-series in a rainfed smallholder cropping system of Mali. Remote Sens. 2016, 8, rs8060531. [Google Scholar] [CrossRef]
- Farias, G.D.; Dubeux, J.C.B.; Savian, J.V.; Duarte, L.P.; Martins, A.P.; Tiecher, T. Integrated crop-livestock system with system fertilization approach improves food production and resource-use efficiency in agricultural lands. Agron. Sustain. Dev. 2020, 40, 39. [Google Scholar] [CrossRef]
- Sanaeifar, A.; Yang, C.; Min, A.; Jones, C.R.; Michaels, T.E.; Krueger, Q.J.; Barnes, R.; Velte, T.J. Noninvasive Early Detection of Nutrient Deficiencies in Greenhouse-Grown Industrial Hemp Using Hyperspectral Imaging. Remote Sens. 2024, 16, 187. [Google Scholar] [CrossRef]
- Chai, J.; Wang, L. A Comparative Study of Vegetation Indices for Predicting Vegetation Biomass and Nitrogen Content in Crops. Agronomy 2020, 10, 317. [Google Scholar] [CrossRef]
- Berca, M.; Horoiaș, R. NDMI use in recognition of water stress issues, related to winter wheat yields in southern Romania. Scientific Papers Series Management. Econ. Eng. Agric. Rural. Dev. 2022, 22, 105–111. [Google Scholar]
- Deng, X.; Li, Z.; Xie, Y. Use of Vegetation Indices for Crop Monitoring and Yield Prediction. Remote Sens. 2020, 12, 2459. [Google Scholar] [CrossRef]
- Harfenmeister, K.; Itzerott, S.; Weltzien, C.; Spengler, D. Detecting Phenological Development of Winter Wheat and Winter Barley Using Time Series of Sentinel-1 and Sentinel-2. Remote Sens. 2021, 13, 5036. [Google Scholar] [CrossRef]



| Field Measurement Date (BBCH) | Type of Measurement | Remote Sensing Data Collection | Remote Sensing Indices |
|---|---|---|---|
| 2 April 2024 (BBCH 12) | 1. Plant density 2. Soil moisture in two layers (0–7 and 14–21 cm) | 9 April 2024 | NDVI, GNDVI, SAVI, EVI, NDMI, MCARI |
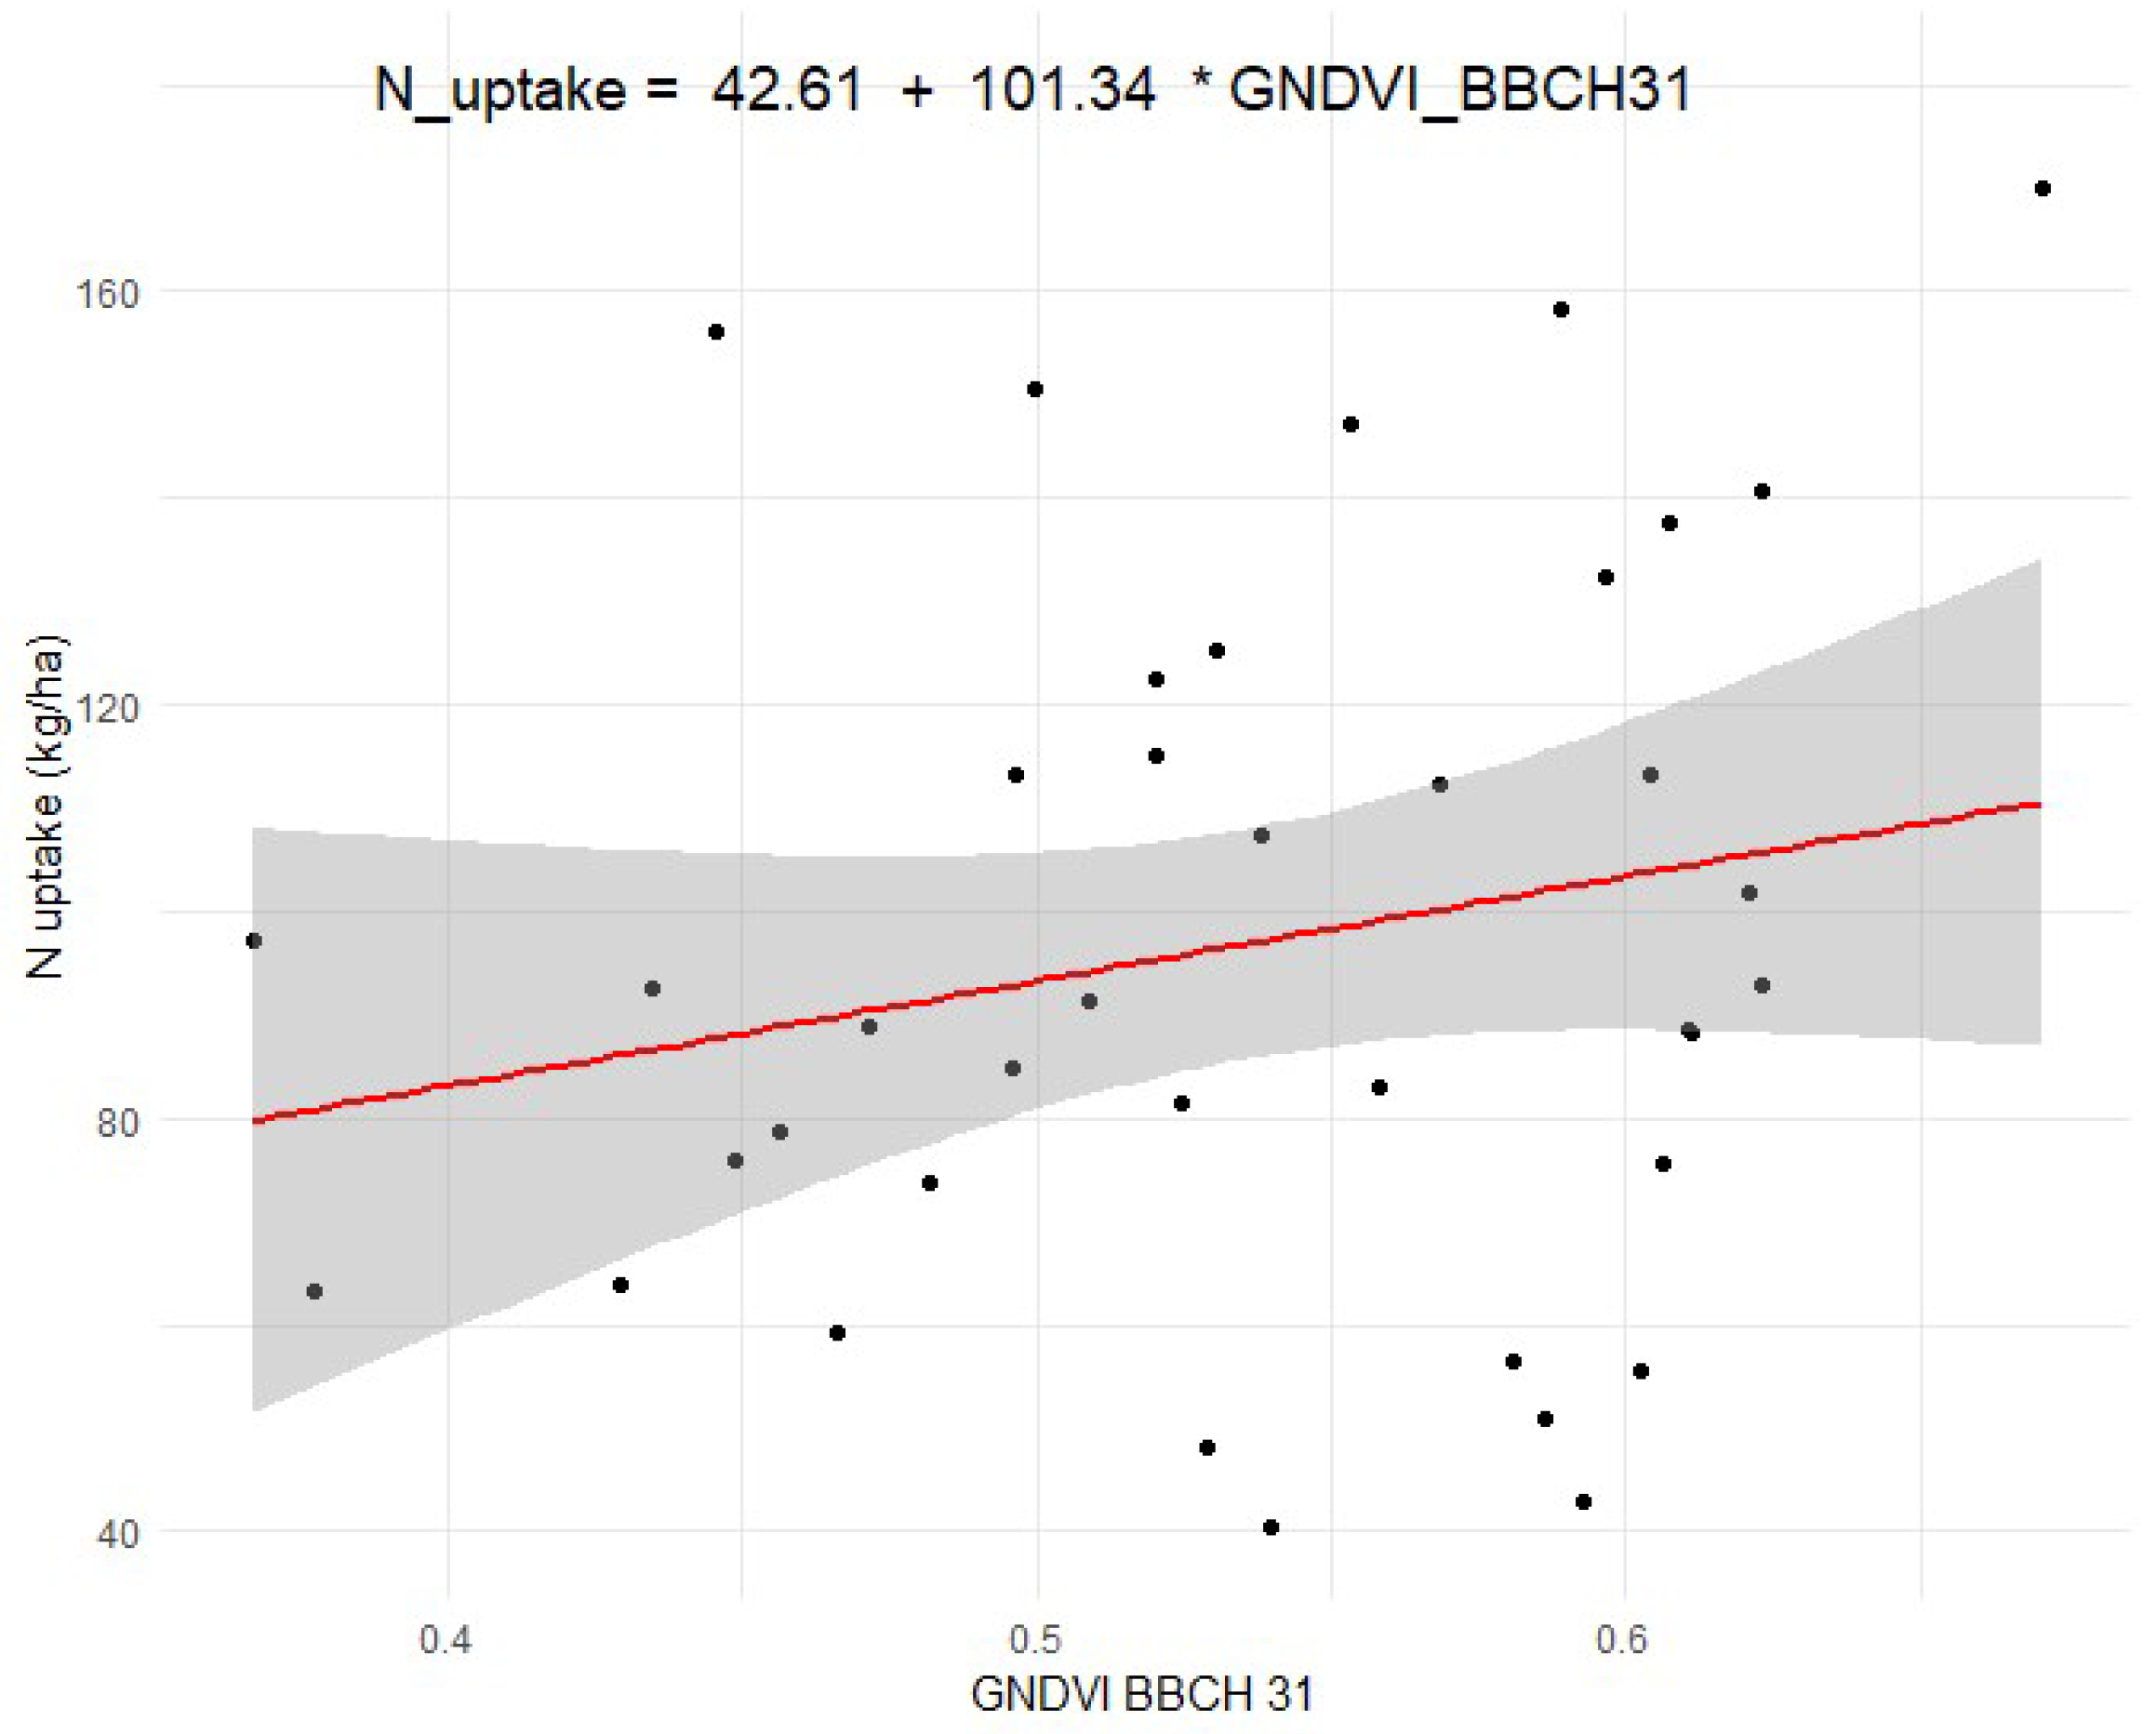
| 25 April 2024 (BBCH 31) | 1. Soil moisture in two layers (0–7 and 14–21 cm) 2. SPAD 3. Biomass yield and N uptake (laboratory analysis) | 4 May 2024 | |
| 15 May 2024 (BBCH 49) | 1. Soil moisture in two layers (0–7 and 14–21 cm) 2. SPAD 3. Canopy height 3. Biomass yield and N uptake (laboratory analysis | 15 May 2024 | |
| 6 June 2024 (BBCH 77) | 1. Soil moisture in two layers (0–7 and 14–21 cm) 2. SPAD 3. Canopy height 3. Biomass yield and N uptake (laboratory analysis) | 29 May 2024 | |
| 15 July 2024 (BBCH 99) | 1. Soil moisture in two layers (0–7 and 14–21 cm) 2. Biomass yield and N uptake (laboratory analysis) | 9 April 2024, 4 May 2024, 15 May 2024, 29 May 2024 |
| Statistic Parameters | Min | Max | Average | Median | σ | V | |
|---|---|---|---|---|---|---|---|
| Soil Particles | |||||||
| Sand–total | 44 | 95 | 85.9 | 90.5 | 12.2 | 14.2 | |
| Silt–total | 2 | 28 | 9.9 | 7.5 | 6.4 | 64.1 | |
| Clay | 0 | 28 | 4.2 | 3.0 | 6.3 | 149.5 | |
| Statistic Parameters | Min | Max | Average | Median | σ | V | |
|---|---|---|---|---|---|---|---|
| N–min (kg·ha−1) | |||||||
| February | 21.8 | 110.0 | 48.8 | 46.2 | 16.4 | 33.6 | |
| September | 10.2 | 168.6 | 47.6 | 46.1 | 25.4 | 53.3 | |
| Differences (February:September in %) | −53.2 | 53.3 | 2.5 | 0.2 | 54.8 | 58.8 | |
| Statistic Parameters | Min | Max | Average | Median | σ | V | |
|---|---|---|---|---|---|---|---|
| Field Parameters and Indices | |||||||
| Plant density | 85 | 504 | 341 | 348 | 102 | 30 | |
| Soil moisture (0–7 cm) | 2 | 34 | 12 | 10 | 8 | 67 | |
| Soil moisture (14–21 cm) | 6 | 42 | 17 | 14 | 9 | 53 | |
| NDVI | 0.207 | 0.368 | 0.267 | 0.261 | 0.037 | 14 | |
| GNDVI | 0.292 | 0.399 | 0.336 | 0.328 | 0.03 | 9 | |
| SAVI | 0.32 | 0.808 | 0.409 | 0.391 | 0.083 | 20 | |
| EVI | 0.491 | 1.697 | 0.695 | 0.656 | 0.202 | 29 | |
| NDMI | −0.129 | 0.076 | −0.051 | −0.062 | 0.044 | −86 | |
| MCARI | 530.68 | 6073.74 | 1772.21 | 1613.36 | 939.89 | 53 | |
| Statistic Parameters | Min | Max | Average | Median | σ | V | |
|---|---|---|---|---|---|---|---|
| Field Parameters and Indices | |||||||
| Soil moisture (0–7 cm) | 0.2 | 31.2 | 7.5 | 4.0 | 8.3 | 110 | |
| Soil moisture (14–21 cm) | 4.2 | 37.6 | 14.2 | 11.3 | 8.6 | 61 | |
| SPAD | 4.23 | 14.3 | 8.62 | 8.33 | 2.5 | 29 | |
| Dry matter yield (t·ha−1) | 0 | 0.7 | 0.3 | 0.3 | 0.2 | 48 | |
| Oats biomass N uptake (kg·ha−1) | 0.02 | 43.59 | 20.22 | 20.98 | 9.28 | 46 | |
| NDVI | 0.283 | 0.727 | 0.583 | 0.6 | 0.106 | 18 | |
| GNDVI | 0.367 | 0.623 | 0.532 | 0.534 | 0.07 | 13 | |
| SAVI | 0.424 | 1.12 | 0.869 | 0.876 | 0.169 | 19 | |
| EVI | 0.595 | 2.281 | 1.596 | 1.589 | 0.407 | 25 | |
| NDMI | −0.042 | 0.323 | 0.166 | 0.169 | 0.089 | 54 | |
| MCARI | 1387.47 | 12,535.84 | 7089.78 | 7234.35 | 2599.82 | 37 | |
| Statistic Parameters | Min | Max | Average | Median | σ | V | |
|---|---|---|---|---|---|---|---|
| Field Parameters and Indices | |||||||
| Soil moisture (0–7 cm) | 0.0 | 19.0 | 1.6 | 0.0 | 3.9 | 244 | |
| Soil moisture (14–21 cm) | 0.0 | 33.6 | 5.0 | 2.0 | 7.1 | 141 | |
| SPAD | 7.2 | 46.9 | 20.2 | 18.8 | 8.4 | 42 | |
| Dry matter yield (t·ha−1) | 0.5 | 3.4 | 1.5 | 1.4 | 0.6 | 41 | |
| Oats biomass N uptake (kg·ha−1) | 20.25 | 77.86 | 46.89 | 45.03 | 14.09 | 30 | |
| NDVI | 0.331 | 0.883 | 0.656 | 0.655 | 0.119 | 18 | |
| GNDVI | 0.38 | 0.78 | 0.609 | 0.612 | 0.087 | 14 | |
| SAVI | 0.454 | 1.319 | 0.997 | 1.06 | 0.188 | 19 | |
| EVI | 0.802 | 2.556 | 1.739 | 1.701 | 0.439 | 25 | |
| NDMI | −0.159 | 0.509 | 0.232 | 0.225 | 0.126 | 54 | |
| MCARI | 1539.3 | 13,035.18 | 7506.86 | 7403.08 | 2842.85 | 38 | |
| Statistic Parameters | Min | Max | Average | Median | σ | V | |
|---|---|---|---|---|---|---|---|
| Field Parameters and Indices | |||||||
| Soil moisture (0–7 cm) | 0.1 | 25.9 | 5.7 | 3.7 | 5.7 | 100 | |
| Soil moisture (14–21 cm) | 3.5 | 28.4 | 11.3 | 9.8 | 6.3 | 56 | |
| SPAD | 7.9 | 79.5 | 32.2 | 26.8 | 16.7 | 52 | |
| Dry matter yield (t·ha−1) | 1.4 | 6.4 | 3.6 | 3.2 | 1.5 | 42 | |
| Oats biomass N uptake (kg·ha−1) | 56.18 | 222.83 | 104.04 | 90.94 | 41.25 | 40 | |
| NDVI | 0.425 | 0.906 | 0.667 | 0.683 | 0.13 | 19 | |
| GNDVI | 0.471 | 0.826 | 0.64 | 0.655 | 0.091 | 14 | |
| SAVI | 0.629 | 1.353 | 0.997 | 1.031 | 0.189 | 19 | |
| EVI | 0.872 | 2.821 | 1.833 | 1.875 | 0.536 | 29 | |
| NDMI | 0.05 | 0.576 | 0.274 | 0.267 | 0.125 | 46 | |
| MCARI | 2996.17 | 9988.4 | 5186.84 | 5025.93 | 1593.29 | 31 | |
| Statistic Parameters | Min | Max | Average | Median | σ | V | |
|---|---|---|---|---|---|---|---|
| Field Parameters and Indices | |||||||
| Soil moisture (0–7 cm) | 0.0 | 40.8 | 8.5 | 6.6 | 8.4 | 99 | |
| Soil moisture (14–21 cm) | 3.6 | 35.1 | 12.9 | 10.9 | 7.8 | 61 | |
| Dry matter yield (t·ha−1) | 1.8 | 9.5 | 5.2 | 5.3 | 2.1 | 41 | |
| Oats biomass N uptake (kg·ha−1) | 40.41 | 169.91 | 96.87 | 91.23 | 34.7 | 36 | |
Disclaimer/Publisher’s Note: The statements, opinions and data contained in all publications are solely those of the individual author(s) and contributor(s) and not of MDPI and/or the editor(s). MDPI and/or the editor(s) disclaim responsibility for any injury to people or property resulting from any ideas, methods, instructions or products referred to in the content. |
© 2025 by the authors. Licensee MDPI, Basel, Switzerland. This article is an open access article distributed under the terms and conditions of the Creative Commons Attribution (CC BY) license (https://creativecommons.org/licenses/by/4.0/).
Share and Cite
Franz, A.; Sowiński, J.; Głogowski, A.; Fiałkiewicz, W. A Preliminary Study on the Use of Remote Sensing Techniques to Determine the Nutritional Status and Productivity of Oats on Spatially Variable Sandy Soils. Agronomy 2025, 15, 616. https://doi.org/10.3390/agronomy15030616
Franz A, Sowiński J, Głogowski A, Fiałkiewicz W. A Preliminary Study on the Use of Remote Sensing Techniques to Determine the Nutritional Status and Productivity of Oats on Spatially Variable Sandy Soils. Agronomy. 2025; 15(3):616. https://doi.org/10.3390/agronomy15030616
Chicago/Turabian StyleFranz, Aleksandra, Józef Sowiński, Arkadiusz Głogowski, and Wieslaw Fiałkiewicz. 2025. "A Preliminary Study on the Use of Remote Sensing Techniques to Determine the Nutritional Status and Productivity of Oats on Spatially Variable Sandy Soils" Agronomy 15, no. 3: 616. https://doi.org/10.3390/agronomy15030616
APA StyleFranz, A., Sowiński, J., Głogowski, A., & Fiałkiewicz, W. (2025). A Preliminary Study on the Use of Remote Sensing Techniques to Determine the Nutritional Status and Productivity of Oats on Spatially Variable Sandy Soils. Agronomy, 15(3), 616. https://doi.org/10.3390/agronomy15030616


