Article

Genetic Variation and Assessment of Seven Salt-Tolerance Genes in an Indica/Xian Rice Population

1
State Key Laboratory of Hybrid Rice, Hubei Hongshan Laboratory, College of Life Sciences, Wuhan University, Wuhan 430072, China
2
Hubei Key Laboratory of Food Crop Germplasm and Genetic Improvement, Institute of Food Crops, Hubei Academy of Agricultural Sciences, Wuhan 430064, China
3
State Key Laboratory of Wheat Improvement, College of Agronomy, Shandong Agricultural University, Taian 271018, China
4
School of Life Science and Technology, Wuhan Polytechnic University, Wuhan 430023, China
5
Ezhou Seed Technology Institute of Hubei Province, Ezhou 436043, China
6
Jining Academy of Agricultural Sciences, Jining 272031, China
*
Author to whom correspondence should be addressed.
Agronomy 2025, 15(3), 570; https://doi.org/10.3390/agronomy15030570
Submission received: 27 January 2025 / Revised: 24 February 2025 / Accepted: 24 February 2025 / Published: 25 February 2025
(This article belongs to the Special Issue New Insights into Pest and Disease Control in Rice)

Abstract

:
Natural variations conferring salt tolerance (ST) are of great value for breeding salt-tolerant rice varieties. The major ST genes, including SKC1, RST1, OsWRKY53 and STG5, have been identified to contain or be associated with a specific single nucleotide polymorphism (SNP). However, the distribution and genetic effects of those ST genes in rice cultivars remain poorly understood. Here, we investigated the distribution of seven cloned ST genes, including SKC1 (P140A, R184H), RST1 (A530G, E611G), OsWRKY53 (A173G), STG5 (I12S), OsHKT1;1 (L94K), OsHKT2;3 (I77T) and OsSTL1 (P289S), which contain one or two ST-related SNPs in a sequenced Indica/Xian rice population comprising 550 accessions. On the basis of the SNPs, the population was categorized into 21 haplotypes (Haps), each of which contained at least four out of seven ST genes. To precisely evaluate each SNP, grouped rice varieties that only differed at one SNP were chosen from two Haps for salt treatment with 150 mM NaCl for 7 d. The results revealed that RST1611G showed up to 88.6% improvement in salt tolerance considering the relative shoot fresh weight (rSFW). Alternatively, OsWRKY53173G, OsHKT2;377T, SKC1140A and SKC1184H showed an improvement in rSFW of 38.6%, 37%, 27.5% and 19.0%, respectively, indicating that they contribute different genetic effects for ST. OsHKT1;194K showed no function with salt treatment for 7 d, but showed a 37.9% rSFW improvement with salt treatment for 14 d. Furthermore, we found that the expression of OsWRKY53173G was positively correlated with SKC1 and conditionally participated in ST dependent on SKC1140A. Interestingly, RST1530A was previously reported to be associated with salt sensitivity, but it was found to be associated with salt tolerance in this study. Overall, our results provide further insight into the mechanism and marker-assisted selection improvement of ST in Indica/Xian rice.

1. Introduction

Soil salinity is one of the key abiotic stressors impairing crop productivity worldwide [1,2,3]. Salinized land is estimated to cover approximately 1 billion ha, occupying approximately 7% of the Earth’s land surface, and causes great loss of grain yield [4]. Rice, the most important staple food crop, is adversely affected by soil salinity in approximately 30% of the rice growing area [1,5,6]. A high level of salinity stress destroys intracellular ion and osmotic balance, thus causing a series of metabolic disorders and oxidative stress to rice [3]. The morphological damage of rice caused by salt stress was obvious, with effects such as decreased root activity, effective tillering, early dead leaves and a significantly reduced setting rate [7,8]. Therefore, it is essential to develop salt-tolerant cultivars for rice breeding programs” [9,10].
The salt tolerance (ST) of rice is a quantitative trait controlled by multiple genes involved in diverse regulatory pathways [3,11,12,13]. To date, only a few ST genes have been identified and isolated via a positive genetic cloning strategy from natural variations or ethyl methanesulfonate (EMS) mutant lines [10]. For example, a major quantitative trait locus (QTL) for controlling shoot K+ content, SKC1, was first cloned from an F2 population cross between Nona Bokra and Koshihikari [14]; SKC1 encodes a high-affinity K+ transporter (HKT) family protein of OsHKT1;5 associated with the maintenance of the cellular Na+/K+ balance under salt stress [14]. SKC1 was previously confirmed to function by removing Na+ from the xylem sap under salt stress, thus limiting Na+ levels in the shoots [15]. However, recent studies have suggested that the activation of other regulatory mechanisms is also necessary for the function of SKC1 [16,17,18]. The natural variation of OsHKT1;1 was confirmed to be associated with ST [19] and to encode a Na+ transporter that maintains the cellular Na+/K+ homeostasis regulated by diverse transcription factors, such as OsMYBc, OsMADS27 and STG5 [20,21,22]. WRKY genes encode a large family of transcription factors that regulate diverse biological functions to defend against biotic and abiotic stress [23,24]. On the basis of a genome-wide association study (GWAS), OsWRKY53 was identified as a major ST gene, acting as a negative regulator that represses the transcription of OsMKK10.2 and SKC1 under salt stress [25]. RST1, encoding an auxin response factor of OsARF18, was found to negatively regulate ST by reducing the efficiency of nitrogen utilization through inhibiting the expression of OsAS1 [26]. Compared with the WT line, the rst1 mutant line presented increased grain yields in normal fields and resulted in less yield loss in saline soil [26]. Combined with transcriptome profiling and GWAS, STG5 was revealed to be strongly associated with ST [22]. ST can regulate the homeostasis of Na+ and K+ by modulating multiple members of the OsHKT genes at the transcriptional level [22]. Additionally, OsSTL1 was selected as a candidate gene associated with the dead leaf rate under salt stress [27]. OsHKT2;3 was identified as an essential candidate gene whose expression is induced by salt stress and other ST-related genes [22,28,29]. Several single nucleotide polymorphisms (SNPs) in OsHKT2;3 were revealed to be associated with STs in some GWASs [25,30]. The salt tolerance functions of either pairs of near-isogenic lines (NILs) or transgenic lines have been well documented; however, the evaluation of ST genes in natural rice cultivars is still limited.
On the basis of high-throughput sequencing technology, millions of SNPs have been identified in the rice genome [31,32]. Specific SNPs have been utilized to investigate associations between the phenotyping and genotyping of ST and to accelerate marker-assisted selection (MAS) breeding [33,34,35]. For example, four nonsynonymous variations, including SKC1P140A, SKC1R184H, SKC1H332D and SKC1L395V, were found in the coding region of SKC1 between Koshihikari and Nona Bokra [14]. The variations were then used for genotyping categorization, structural analysis, and the breeding of ST rice varieties [36,37]. Four linked nonsynonymous SNPs at +1743 bp, +1830 bp, +1986 bp and +2102 bp in RST1 were found to be associated with the Na+ level, Na+/K+ ratio and 1000-grain weight [26]. Three haplotypes were categorized with four variations in 2913 rice accessions [26]. On the basis of pairwise linkage disequilibrium analysis, a nonsynonymous variation at +729 bp in OsWRKY53 was shown to be significantly associated with water content under salt stress [25]. Six linked SNPs at −4916 bp, −318 bp, −299 bp, −294 bp, −281 bp and +122 bp in STG5 were revealed to impact the survival rate and dead leaf rate under salt stress [22]. Four distinct haplotypes were identified on the basis of loci at Chr_04 30726420, Chr_04 30726432, Chr_04 30726688 and Chr_04 30726879 in the OsHKT1;1 coding region [19]. Hap2 of OsHKT1;1, with a unique transition of base G to base A at Chr_04 30726688, was found to be more salt tolerant than other haplotypes were [19]. Additionally, the candidate gene, OsSTL1, was found to have an ST-associated variation located at Chr_04 619903, which might indicate ST [27]. Four SNPs associated with shoot potassium concentration and leaf chlorophyll content (SPAD) were identified for OsHKT2;3 via haplotype analysis in Indian wild rice germplasm [30]. Eight SNPs were found in OsHKT2;3 via GWAS in a diverse rice population with 268 accessions [25]. OsHKT2;3I77T and OsHKT2;3I157T were detected repeatedly in these two studies and, therefore, led to a preference for further research [25,30].
Here, we aim to evaluate the genetic effects for ST from natural resources, which helps to select effective haplotypes for maker-assistant selection (MAS) breeding. We selected nine ST-related SNPs conferring nonsynonymous variations located in the above seven nominated natural variation ST genes, including SKC1P140A, SKC1R184H, OsHKT2;3I77T, OsHKT1;1L94K, OsSTL1P289S, RST1A530G and RST1E611G OsWRKY53A173G and STG5I12S [14,19,22,25,26,27,30]. On the basis of nine SNPs, we performed cluster analysis among 550 diverse Indica/Xian rice accessions, which were classified into 21 haplotypes. We subsequently compared ST between specific haplotype groups and multiple natural rice varieties at the seedling stage to evaluate the functions of individual SNPs. These results will assist in the design of pyramiding strategies for improving rice ST via MAS breeding.

2. Materials and Methods

2.1. Germplasms and Genotyping Analysis

As previously reported [38], 550 Indica/Xian rice accessions were collected from all over the world, with 327 accessions being from the 3K Rice Genome Project (3K RGP) [32]. Nine SNPs for seven ST genes were mined and collected from published literature [14,19,22,25,26,27,30]. The seven ST genes used for assessment are listed with their accession numbers: SKC1 (LOC_Os01g20160), OsHKT1;1 (LOC_Os04g51820), OsHKT2;3 (LOC_Os01g34850), OsSTL1 (LOC_Os04g02000), RST1 (LOC_Os06g47150), OsWRKY53 (LOC_Os05g27730) and STG5 (LOC_Os05g49700). The resequencing data were downloaded from a public database and reanalyzed to identify SNPs, with the genome of Nipponbare used as a reference, via the classical Genome Analysis Toolkit pipeline (GATK4). Then, we detected SNPs related to ST of the above genes according to their relative physical position in the reference genome and genotypes reported in previous studies [14,19,22,25,26,27,30]. Furthermore, we categorized these accessions into different haplotypes on the basis of the genotypes of all loci related to ST. Notably, accessions with any heterozygous SNPs were ignored.

2.2. Plant Growth Conditions

Seeds were treated with 75% ethanol for 30 s to sterilize them and then soaked in deionized distilled water (ddH2O) for germination in an incubator at 37 °C for 2 d. The sprouted seeds were cultured in a 96-well black plastic plant box containing 0.575 mg/L of Yoshida rice nutrient salts (Coolaber Technology Co., Ltd., Beijing, China), and the pH was adjusted to 6.0. The nutrient mixture was changed every three days. Rice seedlings were grown in the phytotron of a plant growth breeding system (PGBS, Wuhan Greenfafa Institute of Novel Genechip R and D Co., Ltd., Wuhan, China) greenhouse at the State Key Laboratory of Hybrid Rice, Wuhan University with 12 h of light at 30 °C and 12 h of darkness at 26 °C, and the humidity was maintained at 70% [39].

2.3. Phenotypic Assessment of Salt Tolerance

Each haplotype contained 3 to 6 rice varieties randomly selected from the 550 accessions (Tables S1 and S2) and was planted according to the methods described above. Each variety contained 8 seedlings as control and 8 seedlings for salt treatment. After 5 d growth, the medium was replaced with Yoshida medium supplemented with 150 mM NaCl for the treatment group. Images were obtained after salt treatment for 7 d or longer, as specifically described, with rehydration for another 2 d. According to previously described methods [40], each seedling’s shoot fresh weight (SFW) was measured. For each variety, we took the mean SFW of 8 seedlings in the control group as cSFW, and the SFW of each seedling in treatment group was used as tSFW. For each variety, we used the data of tSFW to divide cSFW, respectively, to obtain the relative SFW (rSFW). The data of rSFW were documented for each corresponding variety. For dead leaf rate (DLR), we counted the total leaves (TL) and dead leaves (DL) of each seedling in the treated group, and used the ratio of DL/TL as DLR. Then, varieties belonging to the same haplotype were gathered together, and the rSFW and DLR of all seedlings were used as the quantitative index of salt tolerance for each haplotype. Box plots and violin plots were used to represent rSFW and DLR, respectively, in origin2021 (OriginLab Software, Northampton, MA, USA).

2.4. RNA Extraction and Quantitative Real-Time PCR

Total RNA was extracted from rice seedlings via an OminiPlant RNA Kit (DNase I) (CWBIO, Beijing, China), and cDNA was synthesized using a HiFiScript gDNA Removal cDNA Synthesis Kit (CWBIO, Beijing, China) following the manufacturer’s instructions. Quantitative real-time PCR (qRT–PCR) was performed using MagicSYBR Mixture (CWBIO) on an Archimed X4 real-time fluorescent quantitative PCR system (Rocgene, Beijing, China). The thermal cycling program was predenaturing at 95 °C for 5 min, followed by 40 cycles of 95 °C for 15 s and 60 °C for 30 s. OsACTIN was used as the internal control to normalize the expression level of target genes [41]. Each qRT–PCR assay was repeated 3 times. The relative quantitative 2−ΔΔCt method was used to analyze relative gene expression [41]. All the qRT–PCR primers according to the previous reference used are listed in Table S2 [25].

2.5. Protein Structure Predication

The amino acid sequence of the target protein was translated from the reference genome, Nipponbare, downloaded from National Center for Biotechnology Information (https://www.ncbi.nlm.nih.gov/ (accessed on 5 June 2024)). Then, the sequence was uploaded to SWISS-MODEL (https://swissmodel.expasy.org/ (accessed on 5 June 2024)) for structural predication. The structure with 100% coverage of sequence identity is downloaded as the predicated one.

2.6. Statistical Analysis

Independent samples t tests were used to analyze significant differences. The significance level was judged by the two-tailed p value. p < 0.05 was considered statistically significant. All data analysis was performed using IBM SPSS Statistics 20.0 (IBM Software, Armonk, NY, USA).

3. Results

3.1. Distribution of ST Genes in 550 Indica/Xian Rice Accessions

To identify the distribution of ST genes in the rice population, as shown in Figure 1, we selected nine ST-related SNPs in seven reported genes, including STG5I12S, SKC1P140A, SKC1R184H, OsHKT2;3I77T, OsHKT1;1L94K, OsWRKY53A173G, OsSTL1P289S, RST1A530G and RST1E611G, which have been identified as key sites conferring ST in rice [14,19,22,25,26,27,30]. We subsequently investigated the proportion of allelic SNPs (tolerance/sensitive, T/S) in a resequencing population of 550 Indica/Xian rice accessions [38]. The findings indicated that six T-SNPs were highly conserved in this population, including SKC1140A (79.27%), RST1611G (93.82%), OsWRKY53173G (92.55%), STG512S (92.91%), OsSTL1289S (100%), and OsHKT2;377T (88.55%). The remaining three elite alleles, SKC1184H (31.63%), RST1530G (6.36%), and OsHKT1;194K (19.82%), accounted for relatively rare proportions (Table 1).
Furthermore, we divided all 550 accessions into 21 haplotypes on the basis of the T/S types of the nine SNPs, among which Hap1 and Hap2 were two major haplotypes consisting of 202 and 105 cultivars containing six and seven ST-related SNPs, respectively (Figure 1). Interestingly, rice is highly sensitive to salt stress [22,25]; however, each Indica/Xian rice accession was found to carry at least four out of seven detected ST genes, and cultivars of Hap3 and Hap5 carried all seven reported ST genes (Figure 1).

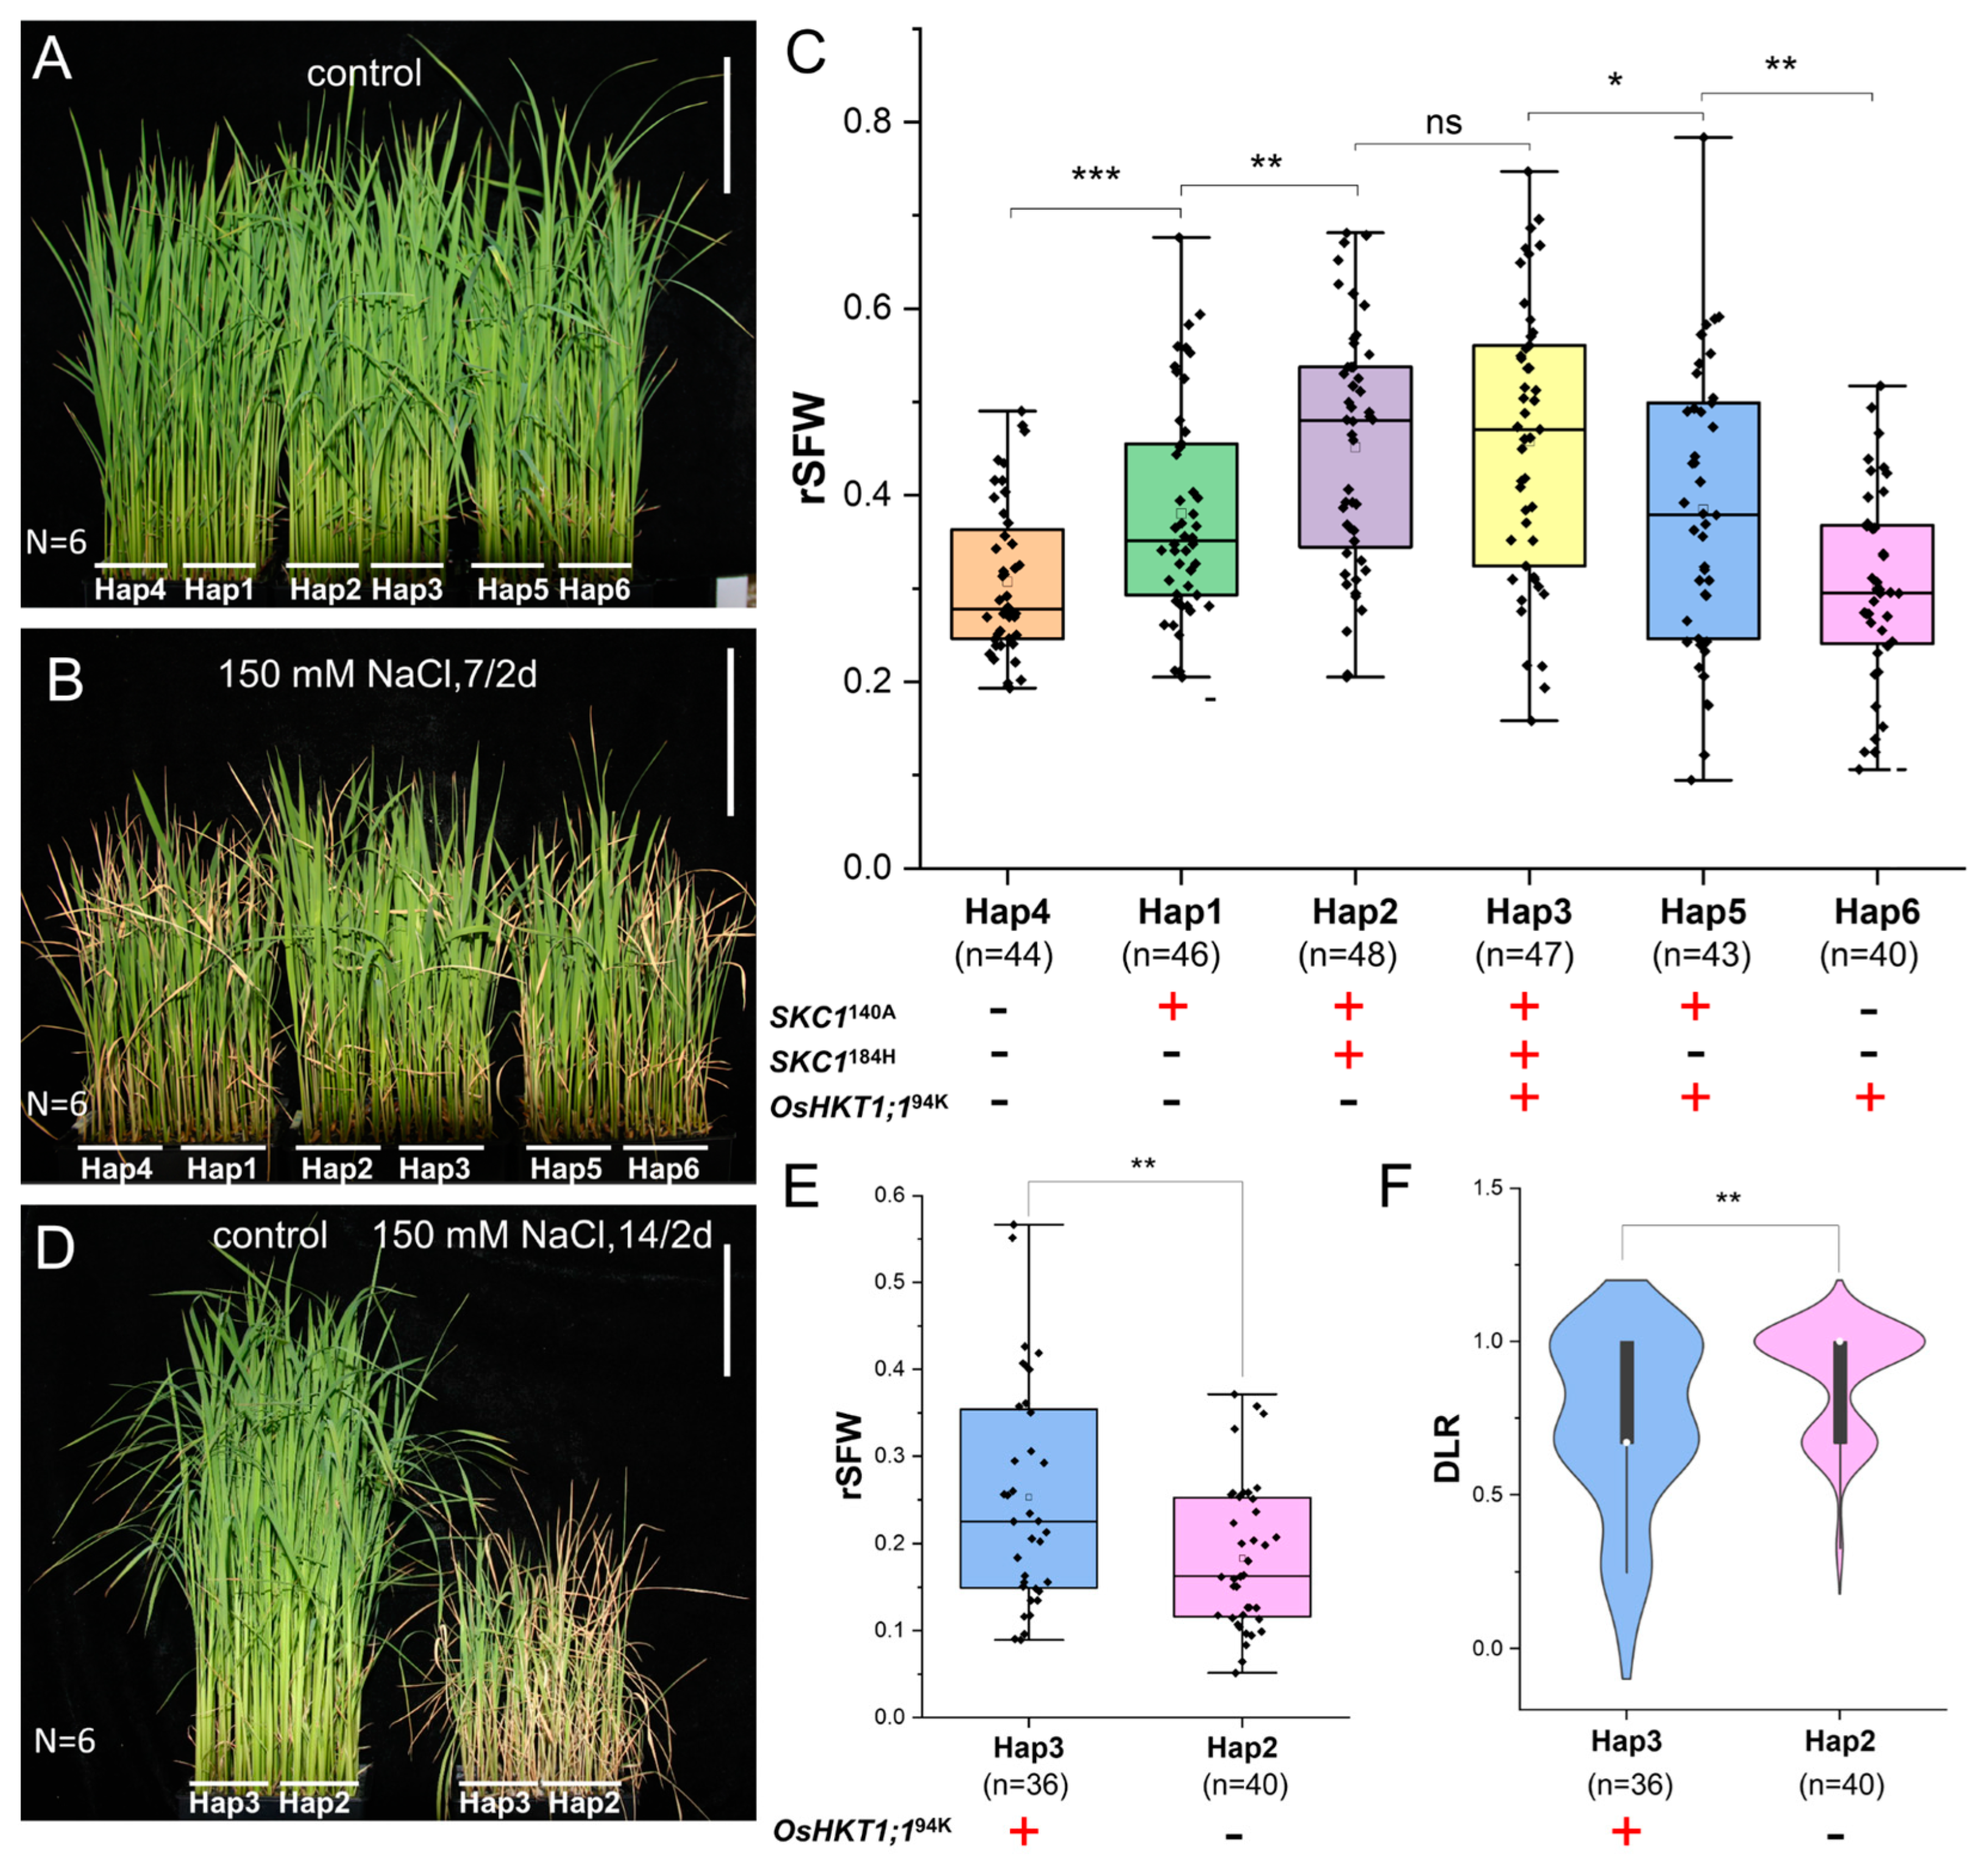
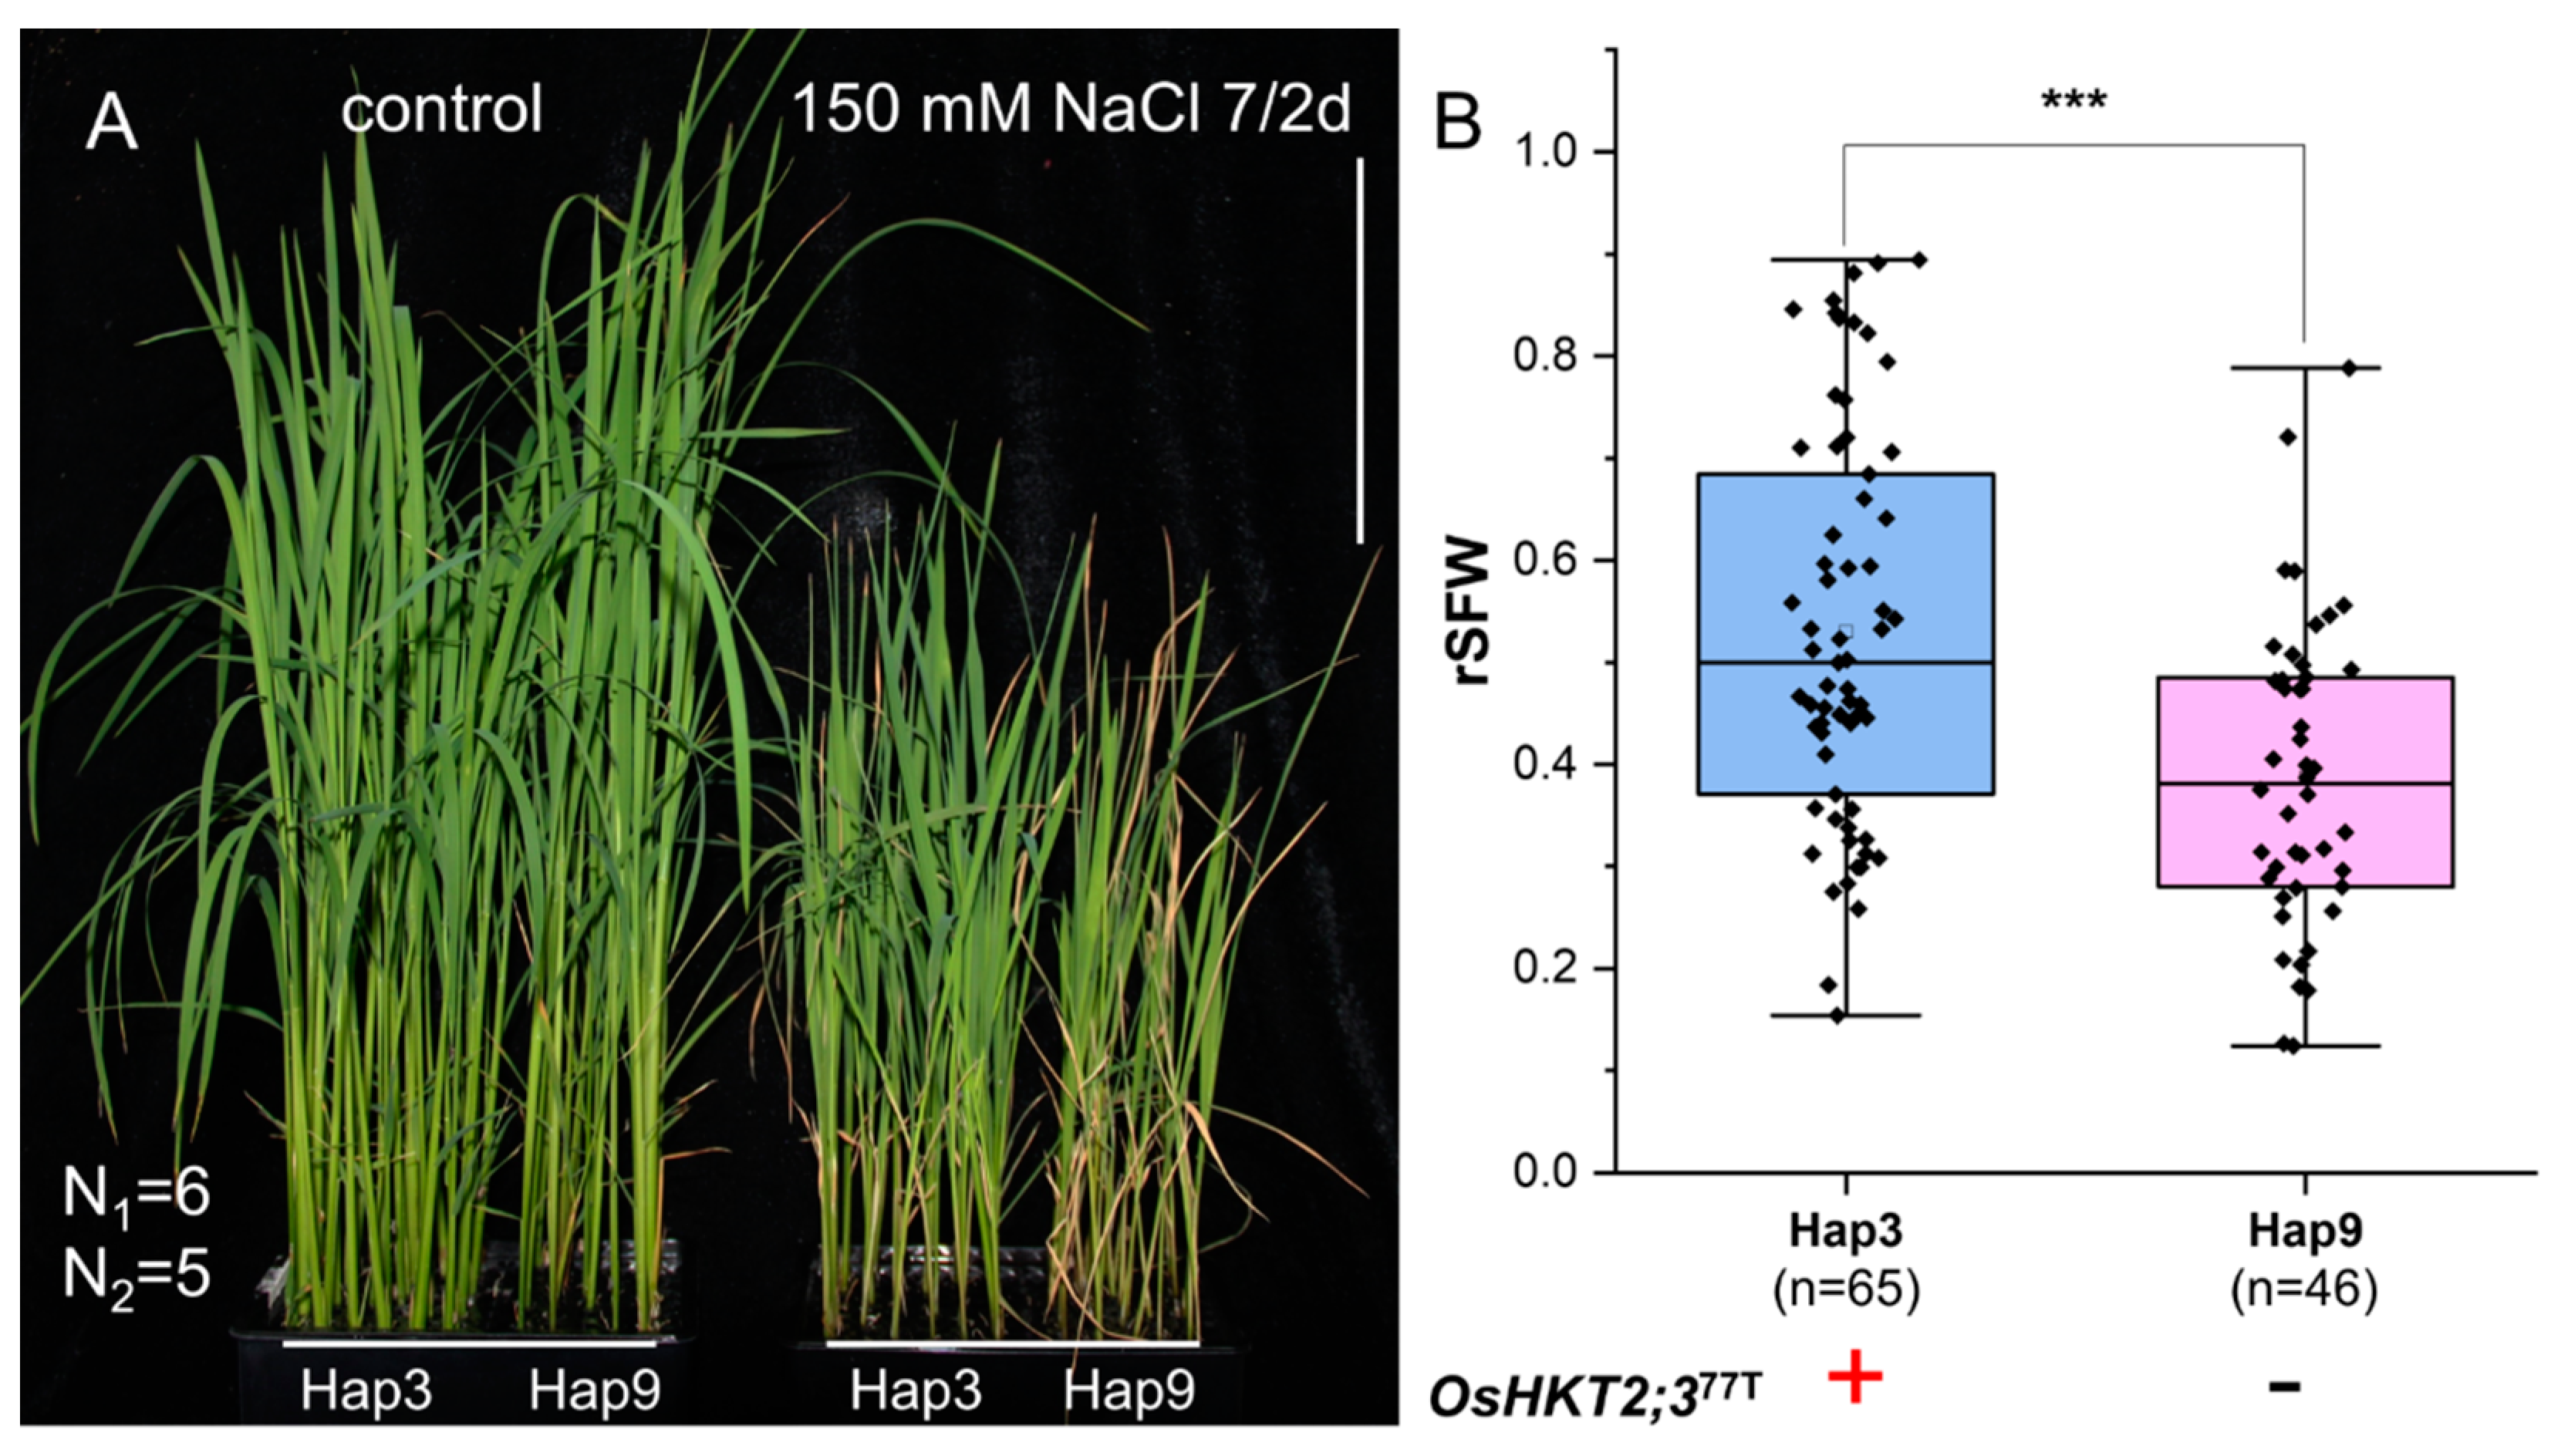
3.2. Assessment of the Functions of Three OsHKT Family Genes

SKC1 and OsHKT1;1 are both HKT family genes that have been verified to facilitate the export of Na+ to maintain the cellular ion balance during saltwater stress [14,19,20,42]. To evaluate the functions of SKC1140A, SKC1184H and OsHKT1;194K, we compared ST at the seeding stage between two haplotypes whose T-SNPs were identical except for the target haplotype. Hap1-Hap6 commonly contained five T-SNPs, namely, STG512S, OsHKT2;377T, OsWRKY53173G, OsSTL1289S and RST1611G. Compared with Hap4 rice accessions, which carry only the above five common T-SNPs, Hap1 and Hap6 rice accessions carry additional T-SNPs of SKC1140A and OsHKT1;194K, respectively. Compared with Hap1 rice accessions, Hap2 and Hap5 rice accessions carry one more T-SNP of SKC1184H or OsHKT1;194K, respectively, and Hap3 rice accessions carry both T-SNPs of SKC1184H and OsHKT1;194K (Figure 1).
Eight plants selected from six random cultivars of each haplotype were subjected to ST comparison treatment (Table S1). After 150 mM NaCl treatment for 7 d and rehydration for 2 d, obvious damage was observed in the tested groups compared with the control group (Figure 2A,B). The relative shoot fresh weight (rSFW) was subsequently used as the ST index. Compared with the Hap4 plants, the increased rSFW was approximately 23.8% greater for the plants from Hap1, representing the ST contribution of SKC1140A. Consistent with the results of the comparison between the Hap1 and Hap4 groups, the rSFW of Hap5 was approximately 27.5% greater than that of Hap6 (Figure 2C). These results suggested that the haplotype SKC1140A could increase the ST in all the tested genetic backgrounds. Similar to the results of the analysis of rSFW for the other groups, Hap2 and Hap3 improved by approximately 18.9% and 19.0%, respectively, over Hap1 and Hap5 (Figure 2C). On the basis of the previously predicted structure of SKC1 [14], the amino acid variations of SKC1140A and SKC1184H were both located in a cytoplasm-exposed loop (Figure S1), indicating that SKC1184H likely contributed to ST through synergistic effects with SKC1140A. However, no significant differences were detected between the two comparison haplotypes of groups Hap6 and Hap4, Hap5 and Hap1, or Hap3 and Hap2, indicating that the rice varieties that carried OsHKT1;194K did not contribute to increased ST under these treatment conditions (Figure 2C). Because OsHKT1;194K has been shown to enhance ST in several previous reports [20,21,22], an extended treatment was performed between Hap2 and Hap3 (Figure 2D). After 14 d of treatment, a 37.9% improvement in rSFW and a 17.4% decrease in the dead leaf rate (DLR) were detected in Hap3 compared with Hap2 (Figure 2E,F).
Several SNPs located in OsHKT2;3 were revealed to be associated with ST traits via GWAS, among which OsHKT2;3I77T was detected twice in different studies [25,30]. Therefore, the ST of OsHKT2;377T might be worthy of evaluation. According to the haplotype groups, Hap3 and Hap9 were found to differ only in OsHKT2;377T (Figure 1). Six cultivars of Hap3 (OsHKT2;377T) and five cultivars of Hap9 (OsHKT2;377I) were selected for rSFW comparison (Table S1). Compared with the Hap3 plants, the Hap9 plants significantly improved after 150 mM NaCl treatment, suggesting the importance of OsHKT2;377T for the maintenance of ST in Indica/Xian cultivars (Figure 3A,B). Structural analysis showed that the substitution of OsHKT2;3I77T was located in an α-helix within the transmembrane domain of OsHKT2;3 (Figure S2). Thus, the variation in SNPs probably leads to changes in the efficiency of ions transport and causes a significant difference in salt tolerance.

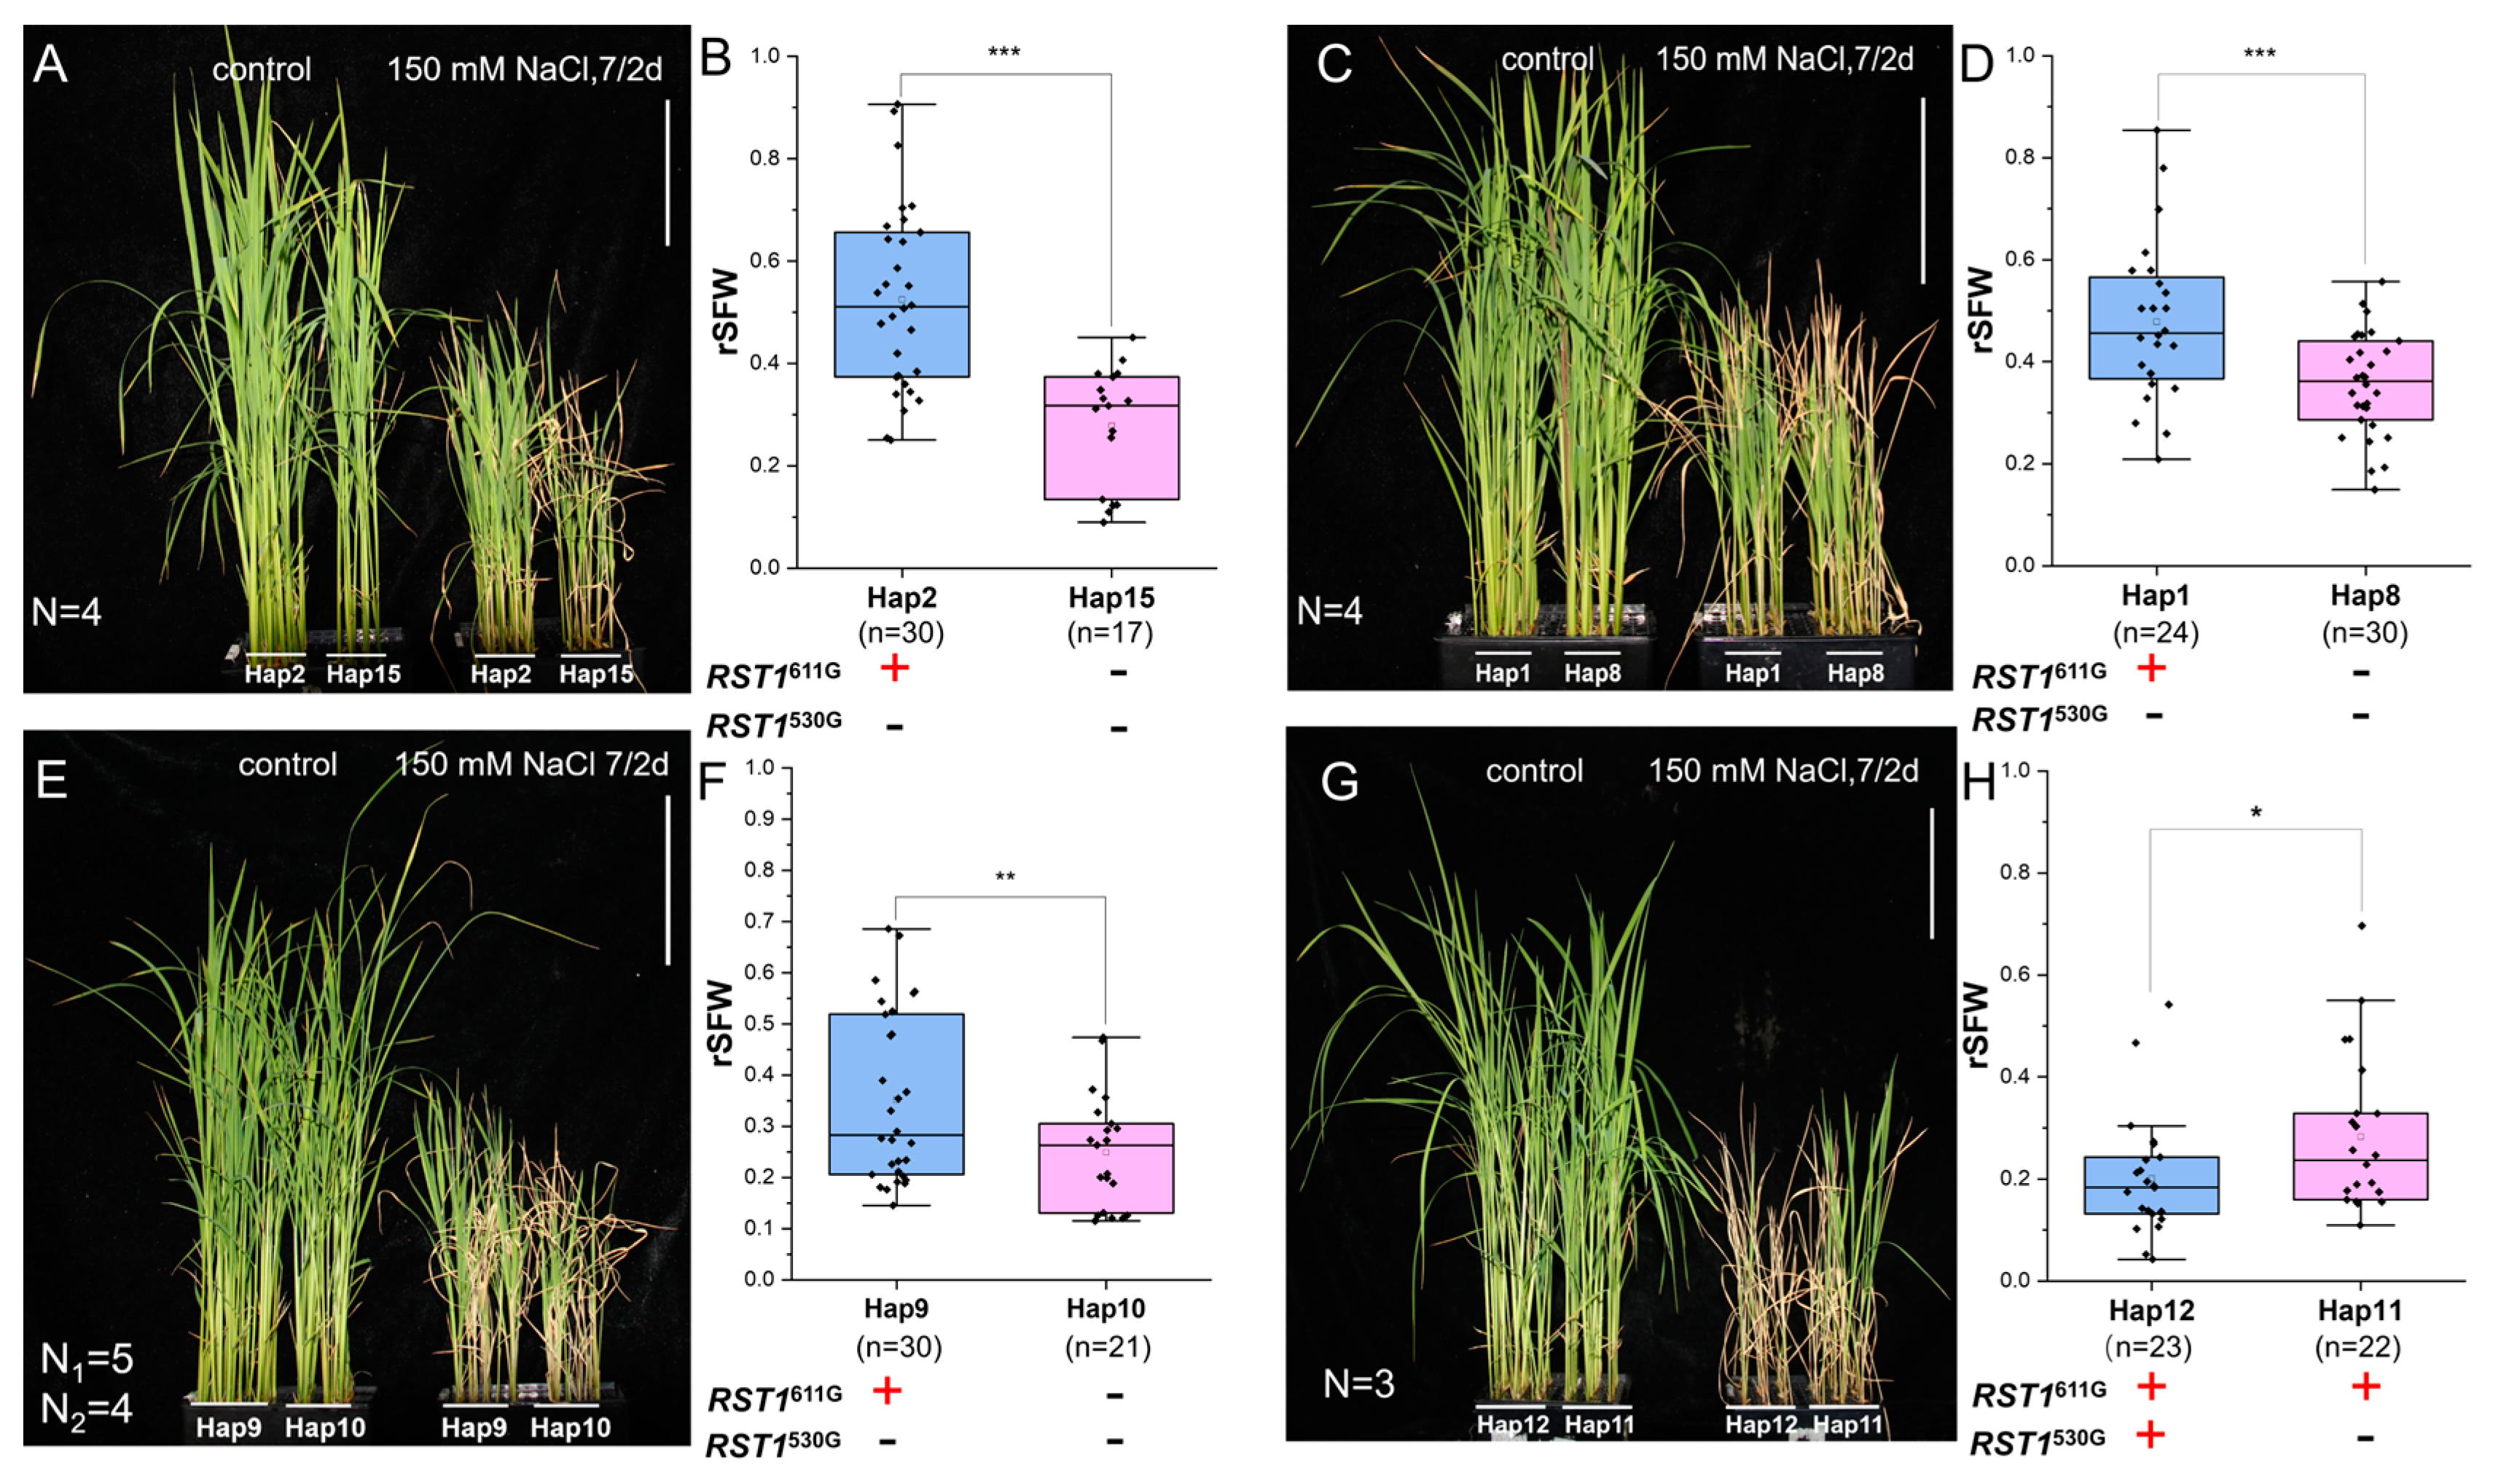
3.3. Functional Evaluation of RST1

RST1 is a major ST gene that encodes a negative regulator of OsARF18 and affects NH4+ metabolism. An evaluation was performed with RST1611G and RST1530G, two key T-SNPs detected via GWAS [26]. Our haplotype analysis revealed that Hap2, Hap1 and Hap9 were distinguished from Hap15, Hap8 and Hap10 only at RST1611G, respectively (Figure 1), and Hap12 was distinguished from Hap11 at RST1530G (Figure 1). Thus, a comparison analysis of ST was performed for each of the four pairs of groups. As shown in Figure 4, significant ST was observed on Hap2, Hap1 and Hap9 plants compared with that of Hap15, Hap8 and Hap10 plants (Figure 4A,C,E), with 88.6%, 34.2% and 41.1% improvements in rSFW (Table S1), respectively, after 150 mM NaCl treatment for 7 d and rehydration for another 2 d (Figure 4B,D,F). To our surprise, Hap12 plants that carried the T-SNP RST1530G were more sensitive to salt treatment than Hap11 plants that carried RST1530A (Figure 4G). The statistical analysis of rSFW also revealed that the Hap12 haplotype was lower than the Hap11 haplotype (Figure 4H and Figure S3; Table S1). These findings suggest that the ST of Hap11 plants is associated with RST1530A rather than RST1530G. Alternatively, we identified 504 and 516 varieties from 550 accessions that carried RST1530A and RST1611G, respectively (Figure 1). A total of 478 out of 504 accessions of RST1530A simultaneously carried the T-SNP of RST1611G, suggesting that they collaboratively contributed to ST and were tightly linked during the development of ST.

3.4. Evaluation of Salt Tolerance of OsWRKY53173G

The natural variation in OsWRKY53173G confers ST, which was shown to repress the expression of SKC1 and OsMPKK10.2 in tolerant rice varieties [25]. For the functional evaluation of OsWRKY53173G, salt treatment was performed as described above. Three groups of haplotypes contained the elite allele of OsWRKY53173G, including Hap2, Hap1 and Hap4, each comprising three rice varieties, which were separately compared with Hap18, Hap21 and Hap17, which contained the other identical ST genes and the sensitive allele of OsWRKY53173G (Figure 5A–F, Table S1). After 7 d of treatment with 150 mM NaCl followed by rehydration for 2 d, all the varieties from Hap2 (Figure 5A) and Hap1 (Figure 5C) were more tolerant to salt stress than were the control varieties from the Hap18 and Hap21 groups, with 38.6% and 33.7% improvements in the rSFW in each group compared with those in the control group, respectively (Figure 5B,D). However, there was no obvious difference for all the varieties in the comparison of Hap4 and Hap17 (Figure 5E,F; Table S1). Comparing the ST genes in all three groups, in addition to OsWRKY53173G, we found that additional SKC1140A and/or SKC1184H genes were present in the comparison groups Hap2 to Hap18 and Hap1 to Hap21 but not in Hap4 to Hap17. Therefore, OsWRKY53173G may play a role in ST that is genetically dependent on SKC1140A and/or SKC1184H.
OsWRKY53 negatively regulates ST and functions as a trans-repressor of SKC1 [25]. In addition, we found that the natural variation of OsWRK53173G increased ST and was genetically dependent on SKC1140A and/or SKC1184H (Figure 5A–F). However, whether natural variation in the ST alleles of OsWRK53173G can repress the expression of SKC1 remains unclear. Here, we selected two rice varieties from each of the six haplotypes shown in Figure 5A–F and performed a quantitative analysis of the relative expression of OsWRKY53 and SKC1 in roots without or with 150 mM NaCl for 8 h. As shown in Figure 5G, 10 out of the 12 rice varieties that contained OsWRK53173G or not presented an upregulated expression of SKC1, and only two varieties, Hap4#-1 and Hap17#2, presented a downregulated expression after salt treatment (Figure 5G). Moreover, 8, 1 and 3 of the 12 rice varieties presented upregulated expression, downregulated expression and no significant changes in the expression of OsWRKY53, respectively, after salt treatment (Figure 5H). Interestingly, the salt-regulated expression of SKC1 was correlated with that of OsWRKY53 (R2 = 0.8020, p < 0.01). Overall, we did not observe the repressed expression of SKC1 caused by either OsWRKY53173G or OsWRKY53173A in natural variations under salt treatment.

4. Discussion

4.1. Cloned ST Genes Broadly Distributed in Indica/Xian Rice Accessions

Soil salinization has affected farmlands worldwide for a long period of time and has severely hindered sustainable agriculture. Although many genes associated with ST have been identified, only a few have been identified from natural variation and applied for rice breeding [40,43]. Because ST is controlled mainly by QTLs, previous studies revealed that the effects of ST genes are dependent on transgenic strategies or parallel analyses of sensitive receptors and tolerant NILs [14,42,44,45,46,47,48,49]. The genetic effects of many genes may be amplified, which hinders the understanding of their practical effects on ST in natural backgrounds. Therefore, the functional evaluation of these genes in cultivar accessions is urgently needed for breeding applications. Here, we investigated the distribution of seven genes related to ST on the basis of nine SNPs and further verified their effects in several Indica/Xian rice accessions. To our surprise, five out of the seven ST genes were distributed in approximately 90% of the Indica/Xian rice accessions (Table 1). If we divided SKC1140A and SKC1184H into two ST loci and corrected RST1530A to the ST haplotype in Table 1 and Figure 1, more than 70.7% (389 rice accessions comprising Hap1, Hap2, Hap3, Hap5, Hap6, Hap9, Hap10 and Hap15) of the rice cultivars carried at least six of the investigated ST genes. Two haplotypes, Hap3 and Hap5, comprised 9.3% of the rice accessions and even carried all seven ST genes (Figure 1). On the one hand, the tested ST genes had positive effects on rice seedling salt stress, which is broadly distributed among Indica/Xian accessions, indicating that the genetic resources for the ST genes are very narrow and that the variation in Indica/Xian rice accessions is limited. On the other hand, the tested rice varieties are still highly sensitive to salt stress at the seedling stage, indicating that the contributions of ST are minor genetic effects for all the cloned ST genes. Together, these findings could explain why no genotypes presented the same tolerance level as the two landraces Pokkali and Bokra that have been identified for a long period [40]. To develop salt-tolerant Indica/Xian rice varieties, more unique ST genes from rare mutagenesis populations or wild species, such as hst1 [42,50], need to be identified and combined into pyramids with cloned ST genes.

4.2. Two Haplotypes of SKC1 Synergistically Regulate Salt Tolerance

The genetic effects of natural variation are important for ST breeding. The functions of seven ST genes in the improvement of ST have been validated via complementary assays [14,22,25]. Here, we evaluated the ST contributions of five genes, including three OsHKTs, RST1 and OsWRKY53, by using multiple natural varieties mimicking the NILs. Four ST genes positively contributed to the improvement of rSFW after salt treatment with 150 mM NaCl for 7 d. Among these genes, RST1611G had the strongest effect, with an 88.6% improvement in rSFW from the comparative groups of Hap15 and Hap2 (Figure 4A,B). The contributions of OsHKT2;377T, SKC1140A and SKC1184H were 33%, 18.9% to 27.5%, and 18.9% to 19.0%, respectively. Otherwise, OsWRKY53173G and OsHKT1;194K were found to conditionally improve ST (Figure 2D and Figure 5). Additionally, since few varieties were identified for the sensitive STG512S and the OsSTL1289P haplotypes from the population, the functions of STG5 and OsSTL1 could not be assessed in this study.
SKC1 was the first cloned gene conferring ST, encoding an HKT family protein of OsHKT1;5, which acts as a Na+-selective transporter and maintains shoot K+/Na+ homeostasis under salt stress [14,15]. Distinctions in the ST of rice varieties are determined by allelic variation in SKC1 [14,51]. The haplotypes of SKC1140A and SKC1184H were significantly associated with ST [52]. On the basis of the putative structure of SKC1, SKC1P140A and SKC1R184H were located on two sides of a cytoplasm-exposed loop, suggesting their relatively independent effects on regulation (Figure S1). According to previous studies, SKC1140A could significantly increase the probability of phosphorylation at SKC1141T and SKC1142T, and SKC1184H could affect transporter regulation [52]. Correspondingly, our findings demonstrated that both SKC1140A and SKC1184H additively enhanced ST (Figure 2), indicating independent and synergistic functions in accordance with their distinct domain locations and biochemical functions. Additionally, 79.27% of the rice cultivars carried SKC1140A, whereas only 31.63% carried SKC1184H. Intriguingly, we discovered that all cultivars of SKC1184H (174 rice accessions consisting of Hap2, Hap3, Hap9, Hap10, Hap15, Hap18, and those with heterozygous alleles) were carried concurrently with SKC1140A (Figure 1). Conversely, SKC1140A existed independently in 262 rice accessions. Thus, SKC1184H might have originated and evolved after SKC1140A to contend with the increasing soil salinity. Alternatively, because of the ST collaboration between SKC1140A and SKC1184H, the 174 rice accessions carrying both SNPs were proposed to be excellent donors for breeding salt-tolerant rice varieties.

4.3. Genetic Analysis of Natural Variations Assists in the Exploration of the Mechanism of ST

SNP-based GWASs have been prevalently employed for mapping genes related to diverse agronomic traits in natural populations over the past two decades [19,25,27,53,54,55,56]. Despite their considerable convenience for locating the key single locus influencing the targeted trait, the drawback is also evident: The differential genetic background and complex population structure increase the probability of detecting spurious associations. Therefore, it is crucial to narrow the genetic background for further verification of identified loci. Here, we conducted a haplotype analysis on the identified ST genes and then assessed a locus by comparing traits between specific haplotypes that had alleles with identical loci with the exception of the target gene. As previously reported, RST1530G is a highly infrequent allele in an Indica/Xian rice population and was associated with high ST [26]. However, with the more precise validation of a single locus in multiple natural varieties, RST1530A was confirmed as an elite allele conserved in this Indica/Xian rice population. The results indicated a significant need for functional amendments to the identified loci. On the basis of this correction, two loci in RST1 were identified to synergistically defend against salt stress in Indica/Xian rice accessions. Additionally, in the 550 Indica/Xian rice population, we found RST1G530A was 100% associated with another SNP, RST1G650S (Table S1; heterozygotes at the two sites are excluded). According to a previous study, RST1 contained a Phox and Beml (PB1) domain in the C-terminal, while RST1E611G was just three amino acids away from the PB1 domain and RST1G650S was located in the PB1 domain. Therefore, we presumed that the PB1 domain was one of the key parts for RST1 to regulate salt tolerance.
The validation of regulatory pathways has largely relied on transgenic and biochemical tools. Previously, OsWRKY53 was shown to be a negative regulator of ST via GWAS [25]. This gene was shown to increase salt tolerance via CRISPR knockout and reduce tolerance after overexpression in Japonica/Geng rice ZH11 [25]. The expression of OsWRKY53 in sensitive and tolerant accessions was upregulated under salt treatment [25,57]. The elite haplotype of OsWRKY53173G in a chromosome segment substitution line (CSSL) of CSSL118 presented a slightly attenuated inducible expression compared with that of the recipient parent Nipponbare [57]. Moreover, OsWRKY53 directly binds to the promoters of SKC1/OsHKT1;5 and OsMKK10.2 and represses the expression of these two targets [25]. In our three parallel group comparative analyses of ST (Figure 5), rice varieties containing the elite haplotype of OsWRKY53173G from Hap2 and Hap1 were more tolerant to salt than those from Hap18 and Hap21. However, the Hap4 rice varieties containing OsWRKY53173G did not significantly differ from the Hap17 rice varieties carrying the sensitive haplotype of OsWRKY53. These findings suggest that the effects of OsWRKY53173G on ST are affected by different rice genetic backgrounds. A comparative analysis of other ST genes between Hap17 and Hap18/Hap21 revealed that the elite alleles of SKC1 may be required for OsWRKY53173G-mediated ST. Interestingly, the transcriptional analysis of SKC1 and OsWRKY53 was performed in 12 rice cultivars randomly selected from six haplotypes (Figure 5G,H). WRKY53 and SKC1 showed salt-inducible expression patterns in most rice varieties, independent of the genotype of the T-SNP or S-SNP for the OsWRKY53 alleles. Additionally, we revealed a positive correlation of salt-induced expression between the two genes (Figure 5G,H), suggesting a more complex mechanism for salt-tolerance regulation than the trans-repressed module of OsWRKY53-SKC1 previously reported [25]. Overall, these findings could be conducive to understanding the regulation of ST genes under natural conditions and assisting in breeding selection.

5. Conclusions

In this study, we investigated the distribution of nine ST-related SNPs from seven cloned ST genes, including OsSTL1P298S, RST1E611G, STG5I12S, OsWRKY53A173G, OsHKT2;3I77T, SKC1P140A, SKC1R184H, RST1A530G and OsHKT1;1L94K. The T-type proportion of them was in order from highest (100%) to lowest (6.36%) in an Indica/Xian population. Seven of them were validated to have varying degrees of contributions to salt-tolerance improvement. The results showed that RST1611G was most associated with salt tolerance, explaining up to 88.6% of the rSFW. Additionally, the correlation evidence suggests that the PB1 domain in RST1 plays an important role in regulating salt tolerance. Additionally, we revealed that both SKC1140A and SKC1184H are required for the elite allele of OsWRKY53173G-mediated ST and have an intragenic additive effect on ST. These results provide further insight into the mechanism and may assist to select appropriate molecular markers for breeding salt-tolerant rice varieties.

Supplementary Materials

The following supporting information can be downloaded at https://www.mdpi.com/article/10.3390/agronomy15030570/s1. Figure S1: Predicated structure of SKC1 model on SWISS-MODEL (expasy.org); Figure S2: Predicated structure of OsHKT2;3 model on SWISS-MODEL (expasy.org); Figure S3: Comparison of DLR between Hap12 and Hap11. n represents the number of plants in an assay used for each haplotype; Table S1: The ST variation types in each variety of 550 Indica/Xian rice accessions; Table S2: Varieties used in the experiment and phenotyping data of ST. Table S3: Primers used in the experiment.

Author Contributions

Conceptualization, Z.C. and Z.H.; methodology, Y.C. and Y.W.; software, T.W.; validation, Y.C. and Y.W.; formal analysis, H.L. and X.C.; investigation, Y.C., X.Z. and W.F.; resources, X.Z., Z.H. and Y.D.; data curation, T.W. and Z.C.; writing—original draft preparation, Y.C.; writing—review and editing, X.C., X.Z., Y.D., Z.H. and Z.C.; visualization, Y.C.; supervision, Z.C.; project administration, H.L.; funding acquisition, Z.C. and W.F. All authors have read and agreed to the published version of the manuscript.

Funding

This research was funded by the Key Research and Development Program of Hubei Province (2022BFE003), the Science and Technology Innovation Team of Hubei Province, and the Shandong Modern Agricultural Technology and Industry System (SDAIT-17-06). Y.C. supported by the Student Innovation Research and Entrepreneurship Training Program of Hubei Province (S202310486115). W.F. supported by the Key Research and Development Program of Jining, Shandong Province (2024NYNS015).

Data Availability Statement

All data that support the findings in this study are available in this article and its supplementary files. Raw whole genome sequencing reads of 550 accessions were previously published and can be download from NCBI (https://www.ncbi.nlm.nih.gov/ (accessed on 20 April 2024)) with the BioProject ID PRJNA321462, PRJNA331215 and 3K RGP (https://registry.opendata.aws/3kricegenome/ (accessed on 20 April 2024)).

Acknowledgments

We thank the Core Facility of State Key Laboratory of Hybrid Rice and the computer cluster platform at Wuhan University for the technical support and the running computations.

Conflicts of Interest

The authors declare no conflicts of interest.

Abbreviations

The following abbreviations are used in this manuscript:
CSSLChromosome segment substitution line (CSSL)
DLRDead leaf rate
GWASGenome-wide association study
EMSEthyl methanesulfonate
HapsHaplotypes
HKTHigh-affinity K+ transporter
MASMarker-assisted selection
NILsNear-isogenic lines
qRT–PCRQuantitative real-time PCR
QTLQuantitative trait locus
rSFWRelative shoot fresh weight
SNPSingle nucleotide polymorphism
STSalt tolerance

References

  1. Negrão, S.; Courtois, B.; Ahmadi, N.; Abreu, I.; Saibo, N.; Oliveira, M.M. Recent updates on salinity stress in rice: From physiological to molecular responses. Crit. Rev. Plant Sci. 2011, 30, 329–377. [Google Scholar] [CrossRef]
  2. Hopmans, J.W.; Qureshi, A.S.; Kisekka, I.; Munns, R.; Grattan, S.R.; Rengasamy, P.; Ben-Gal, A.; Assouline, S.; Javaux, M.; Minhas, P.S.; et al. Critical knowledge gaps and research priorities in global soil salinity. In Advances in Agronomy; Sparks, D.L., Ed.; Academic Press Inc.: Cambridge, MA, USA, 2021; Volume 169, pp. 1–191. [Google Scholar]
  3. Liu, C.; Mao, B.; Yuan, D.; Chu, C.; Duan, M. Salt tolerance in rice: Physiological responses and molecular mechanisms. Crop J. 2022, 10, 13–25. [Google Scholar] [CrossRef]
  4. Hassani, A.; Azapagic, A.; Shokri, N. Global predictions of primary soil salinization under changing climate in the 21st century. Nat. Commun. 2021, 12, 6663. [Google Scholar] [CrossRef] [PubMed]
  5. Fang, X.; Mo, J.; Zhou, H.; Shen, X.; Xie, Y.; Xu, J.; Yang, S. Comparative transcriptome analysis of gene responses of salt-tolerant and salt-sensitive rice cultivars to salt stress. Sci. Rep. 2023, 13, 19065. [Google Scholar] [CrossRef] [PubMed]
  6. Khan, Z.; Jan, R.; Asif, S.; Farooq, M.; Jang, Y.H.; Kim, E.G.; Kim, N.; Kim, K.M. Exogenous melatonin induces salt and drought stress tolerance in rice by promoting plant growth and defense system. Sci. Rep. 2024, 14, 1214. [Google Scholar] [CrossRef] [PubMed]
  7. Singh, R.K.; Kota, S.; Flowers, T.J. Salt tolerance in rice: Seedling and reproductive stage QTL mapping come of age. Theor. Appl. Genet. 2021, 134, 3495–3533. [Google Scholar] [CrossRef]
  8. Chapagain, S.; Pruthi, R.; Singh, L.; Subudhi, P.K. Comparison of the genetic basis of salt tolerance at germination, seedling, and reproductive stages in an introgression line population of rice. Mol. Biol. Rep. 2024, 51, 252. [Google Scholar] [CrossRef] [PubMed]
  9. Padmavathi, G.; Bangale, U.; Rao, K.N.; Balakrishnan, D.; Arun, M.N.; Singh, R.K.; Sundaram, R.M. Progress and prospects in harnessing wild relatives for genetic enhancement of salt tolerance in rice. Front. Plant Sci. 2023, 14, 1253726. [Google Scholar] [CrossRef]
  10. Tiwari, K.; Tiwari, S.; Kumar, N.; Sinha, S.; Krishnamurthy, S.L.; Singh, R.; Kalia, S.; Singh, N.K.; Rai, V. QTLs and genes for salt stress tolerance: A journey from seed to seed continued. Plants 2024, 13, 1099. [Google Scholar] [CrossRef]
  11. Zhu, J. Plant salt tolerance. Trends Plant Sci. 2001, 6, 66–71. [Google Scholar] [CrossRef]
  12. Deinlein, U.; Stephan, A.B.; Horie, T.; Luo, W.; Xu, G.; Schroeder, J.I. Plant salt-tolerance mechanisms. Trends Plant Sci. 2014, 19, 371–379. [Google Scholar] [CrossRef] [PubMed]
  13. Zhao, C.; Zhang, H.; Song, C.; Zhu, J.K.; Shabala, S. Mechanisms of plant responses and adaptation to soil salinity. Innovation 2020, 1, 100017. [Google Scholar] [CrossRef] [PubMed]
  14. Ren, Z.; Gao, J.; Li, L.; Cai, X.; Huang, W.; Chao, D.; Zhu, M.; Wang, Z.; Luan, S.; Lin, H. A rice quantitative trait locus for salt tolerance encodes a sodium transporter. Nat. Genet. 2005, 37, 1141–1146. [Google Scholar] [CrossRef]
  15. Kobayashi, N.I.; Yamaji, N.; Yamamoto, H.; Okubo, K.; Ueno, H.; Costa, A.; Tanoi, K.; Matsumura, H.; Fujii-Kashino, M.; Horiuchi, T.; et al. OsHKT1;5 mediates Na+ exclusion in the vasculature to protect leaf blades and reproductive tissues from salt toxicity in rice. Plant J. 2017, 91, 657–670. [Google Scholar] [CrossRef] [PubMed]
  16. Platten, J.D.; Egdane, J.A.; Ismail, A.M. Salinity tolerance, Na+ exclusion and allele mining of HKT1;5 in Oryza sativa and O. glaberrima: Many sources, many genes, one mechanism? BMC Plant Biol. 2013, 13, 32. [Google Scholar] [CrossRef]
  17. Wang, J.; Nan, N.; Li, N.; Liu, Y.; Wang, T.J.; Hwang, I.; Liu, B.; Xu, Z.Y. A DNA methylation reader-chaperone regulator-transcription factor complex activates OsHKT1;5 expression during salinity stress. Plant Cell 2020, 32, 3535–3558. [Google Scholar] [CrossRef] [PubMed]
  18. Venkataraman, G.; Shabala, S.; Véry, A.A.; Hariharan, G.N.; Somasundaram, S.; Pulipati, S.; Sellamuthu, G.; Harikrishnan, M.; Kumari, K.; Shabala, L.; et al. To exclude or to accumulate? Revealing the role of the sodium HKT1;5 transporter in plant adaptive responses to varying soil salinity. Plant Physiol. Biochem. 2021, 169, 333–342. [Google Scholar] [CrossRef]
  19. Lv, Y.; Ma, J.; Wei, H.; Xiao, F.; Wang, Y.; Jahan, N.; Hazman, M.; Qian, Q.; Shang, L.; Guo, L. Combining GWAS, genome-wide domestication and a transcriptomic analysis reveals the loci and natural alleles of salt tolerance in rice (Oryza sativa L.). Front. Plant Sci. 2022, 13, 912637. [Google Scholar] [CrossRef]
  20. Wang, R.; Jing, W.; Xiao, L.; Jin, Y.; Shen, L.; Zhang, W. The rice high-affinity potassium transporter1;1 is involved in salt tolerance and regulated by an MYB-type transcription factor. Plant Physiol. 2015, 168, 1076–1090. [Google Scholar] [CrossRef] [PubMed]
  21. Alfatih, A.; Zhang, J.; Song, Y.; Jan, S.U.; Zhang, Z.S.; Xia, J.Q.; Zhang, Z.Y.; Nazish, T.; Wu, J.; Zhao, P.X.; et al. Nitrate-responsive OsMADS27 promotes salt tolerance in rice. Plant Commun. 2023, 4, 100458. [Google Scholar] [CrossRef] [PubMed]
  22. Wei, H.; Wang, X.; Zhang, Z.; Yang, L.; Zhang, Q.; Li, Y.; He, H.; Chen, D.; Zhang, B.; Zheng, C.; et al. Uncovering key salt-tolerant regulators through a combined eQTL and GWAS analysis using the super pan-genome in rice. Natl. Sci. Rev. 2024, 11, nwae043. [Google Scholar] [CrossRef] [PubMed]
  23. Chen, F.; Hu, Y.; Vannozzi, A.; Wu, K.; Cai, H.; Qin, Y.; Mullis, A.; Lin, Z.; Zhang, L. The WRKY transcription factor family in model plants and crops. Crit. Rev. Plant Sci. 2018, 36, 311–335. [Google Scholar] [CrossRef]
  24. Wani, S.H.; Anand, S.; Singh, B.; Bohra, A.; Joshi, R. WRKY transcription factors and plant defense responses: Latest discoveries and future prospects. Plant Cell Rep. 2021, 40, 1071–1085. [Google Scholar] [CrossRef]
  25. Yu, J.; Zhu, C.; Xuan, W.; An, H.; Tian, Y.; Wang, B.; Chi, W.; Chen, G.; Ge, Y.; Li, J.; et al. Genome-wide association studies identify OsWRKY53 as a key regulator of salt tolerance in rice. Nat. Commun. 2023, 14, 3550. [Google Scholar] [CrossRef]
  26. Deng, P.; Jing, W.; Cao, C.; Sun, M.; Chi, W.; Zhao, S.; Dai, J.; Shi, X.; Wu, Q.; Zhang, B.; et al. Transcriptional repressor RST1 controls salt tolerance and grain yield in rice by regulating gene expression of asparagine synthetase. Proc. Natl. Acad. Sci. USA 2022, 119, e2210338119. [Google Scholar] [CrossRef]
  27. Yuan, J.; Wang, X.; Zhao, Y.; Khan, N.U.; Zhao, Z.; Zhang, Y.; Wen, X.; Tang, F.; Wang, F.; Li, Z. Genetic basis and identification of candidate genes for salt tolerance in rice by GWAS. Sci. Rep. 2020, 10, 9958. [Google Scholar] [CrossRef] [PubMed]
  28. Garciadeblás, B.; Senn, M.E.; Bañuelos, M.A.; Rodríguez-Navarro, A. Sodium transport and HKT transporters: The rice model. Plant J. 2003, 34, 788–801. [Google Scholar] [CrossRef] [PubMed]
  29. Zhang, Y.; Fang, J.; Wu, X.; Dong, L. Na+/K+ balance and transport regulatory mechanisms in weedy and cultivated rice (Oryza sativa L.) under salt stress. BMC Plant Biol. 2018, 18, 375. [Google Scholar] [CrossRef] [PubMed]
  30. Mishra, S.; Singh, B.; Panda, K.; Singh, B.P.; Singh, N.; Misra, P.; Rai, V.; Singh, N.K. Association of SNP haplotypes of HKT family genes with salt tolerance in Indian wild rice germplasm. Rice 2016, 9, 15. [Google Scholar] [CrossRef]
  31. Rafalski, A. Applications of single nucleotide polymorphisms in crop genetics. Curr. Opin. Plant Biol. 2002, 5, 94–100. [Google Scholar] [CrossRef] [PubMed]
  32. Wang, W.; Mauleon, R.; Hu, Z.; Chebotarov, D.; Tai, S.; Wu, Z.; Li, M.; Zheng, T.; Fuentes, R.R.; Zhang, F.; et al. Genomic variation in 3010 diverse accessions of Asian cultivated rice. Nature 2018, 557, 43–49. [Google Scholar] [CrossRef] [PubMed]
  33. Yuan, J.H.; Li, J.H.; Huang, X.C.; Li, S.; Gao, W.J. Advance of SNP analysis based on whole genome resequencing in crop gene mapping. Agri. Food Sci. 2015, 51, 1400–1404. [Google Scholar]
  34. Chen, C.; Norton, G.J.; Price, A.H. Genome-wide association mapping for salt tolerance of rice seedlings grown in hydroponic and soil systems using the Bengal and Assam Aus panel. Front. Plant Sci. 2020, 11, 576479. [Google Scholar] [CrossRef]
  35. Chen, G.; Hu, K.; Zhao, J.; Guo, F.; Shan, W.; Jiang, Q.; Zhang, J.; Guo, Z.; Feng, Z.; Chen, Z.; et al. Genome-wide association analysis for salt-induced phenotypic and physiologic responses in rice at seedling and reproductive stages. Front. Plant Sci. 2022, 13, 822618. [Google Scholar] [CrossRef]
  36. Shohan, M.U.S.; Sinha, S.; Nabila, F.H.; Dastidar, S.G.; Seraj, Z.I. HKT1;5 transporter gene expression and association of amino acid substitutions with salt tolerance across rice genotypes. Front. Plant Sci. 2019, 10, 101420. [Google Scholar] [CrossRef] [PubMed]
  37. Gao, R.; Jia, Y.; Xu, X.; Fu, P.; Zhou, J.; Yang, G. Structural insights into the Oryza sativa cation transporters HKTs in salt tolerance. J. Integr. Plant Biol. 2024, 66, 700–708. [Google Scholar] [CrossRef]
  38. Meng, B.; Wang, T.; Luo, Y.; Xu, D.; Li, L.; Diao, Y.; Gao, Z.; Hu, Z.; Zheng, X. Genome-wide association study identified novel candidate loci/genes affecting lodging resistance in rice. Genes 2021, 12, 718. [Google Scholar] [CrossRef]
  39. Liu, P.; Feng, W.; Wang, T.; Zhang, H.; Mao, S.; Zhang, H.; Huang, W.; Liu, H.; Feng, S.; Chu, Z. Investigation of imidazolinone herbicide resistance gene with KASP markers for Japonica/Geng rice varieties in the Huanghuaihai Region of China. Plants 2024, 13, 1097. [Google Scholar] [CrossRef]
  40. Chen, T.; Niu, Y.; Yang, C.; Liang, Y.; Xu, J. Screening of rice (Oryza sativa L.) genotypes for salinity tolerance and dissecting determinants of tolerance mechanism. Plants 2024, 13, 1036. [Google Scholar] [CrossRef] [PubMed]
  41. Bi, Y.; Yu, Y.; Mao, S.; Wu, T.; Wang, T.; Zhou, Y.; Xie, K.; Zhang, H.; Liu, L.; Chu, Z. Comparative transcriptomic profiling of the two-stage response of rice to Xanthomonas oryzae pv. oryzicola interaction with two different pathogenic strains. BMC Plant Biol. 2024, 24, 347. [Google Scholar]
  42. Takagi, H.; Tamiru, M.; Abe, A.; Yoshida, K.; Uemura, A.; Yaegashi, H.; Obara, T.; Oikawa, K.; Utsushi, H.; Kanzaki, E.; et al. MutMap accelerates breeding of a salt-tolerant rice cultivar. Nat. Biotechnol. 2015, 33, 445–449. [Google Scholar] [CrossRef]
  43. Ponce, K.S.; Meng, L.; Guo, L.; Leng, Y.; Ye, G. Advances in sensing, response and regulation mechanism of salt tolerance in rice. Int. J. Mol. Sci. 2021, 22, 2254. [Google Scholar] [CrossRef] [PubMed]
  44. Soda, N.; Kushwaha, H.R.; Soni, P.; Singla-Pareek, S.L.; Pareek, A. A suite of new genes defining salinity stress tolerance in seedlings of contrasting rice genotypes. Funct. Integr. Genom. 2013, 13, 351–365. [Google Scholar] [CrossRef] [PubMed]
  45. Mohammadi, R.; Mendioro, M.S.; Diaz, G.Q.; Gregorio, G.B.; Singh, R.K. Mapping quantitative trait loci associated with yield and yield components under reproductive stage salinity stress in rice (Oryza sativa L.). J. Genet. 2013, 92, 433–443. [Google Scholar] [CrossRef] [PubMed]
  46. Zhou, J.; Wang, F.; Deng, P.; Jing, W.; Zhang, W. Characterization and mapping of a salt-sensitive mutant in rice (Oryza sativa L.). J. Integr. Plant Biol. 2013, 55, 504–513. [Google Scholar] [CrossRef]
  47. He, Y.; Yang, B.; He, Y.; Zhan, C.; Cheng, Y.; Zhang, J.; Zhang, H.; Cheng, J.; Wang, Z. A quantitative trait locus, qSE3, promotes seed germination and seedling establishment under salinity stress in rice. Plant J. 2019, 97, 1089–1104. [Google Scholar] [CrossRef] [PubMed]
  48. Geng, L.; Zhang, W.; Zou, T.; Du, Q.; Ma, X.; Cui, D.; Han, B.; Zhang, Q.; Han, L. Integrating linkage mapping and comparative transcriptome analysis for discovering candidate genes associated with salt tolerance in rice. Front. Plant Sci. 2023, 14, 1065334. [Google Scholar] [CrossRef]
  49. Gao, Q.; Wang, H.; Yin, X.; Wang, F.; Hu, S.; Liu, W.; Chen, L.; Dai, X.; Liang, M. Identification of salt tolerance related candidate genes in ‘Sea Rice 86’ at the seedling and reproductive stages using QTL-Seq and BSA-Seq. Genes 2023, 14, 458. [Google Scholar] [CrossRef]
  50. Rana, M.M.; Takamatsu, T.; Baslam, M.; Kaneko, K.; Itoh, K.; Harada, N.; Sugiyama, T.; Ohnishi, T.; Kinoshita, T.; Takagi, H.; et al. Salt tolerance improvement in rice through efficient SNP marker-assisted selection coupled with speed-breeding. Int. J. Mol. Sci. 2019, 20, 2585. [Google Scholar] [CrossRef] [PubMed]
  51. Mickelbart, M.V.; Hasegawa, P.M.; Bailey-Serres, J. Genetic mechanisms of abiotic stress tolerance that translate to crop yield stability. Nat. Rev. Genet. 2015, 16, 237–251. [Google Scholar] [CrossRef]
  52. Negrão, S.; Almadanim, M.C.; Pires, I.S.; Abreu, I.A.; Maroco, J.; Courtois, B.; Gregorio, G.B.; McNally, K.L.; Oliveira, M.M. New allelic variants found in key rice salt-tolerance genes: An association study. Plant Biotechnol. J. 2013, 11, 87–100. [Google Scholar] [CrossRef]
  53. Huang, X.; Wei, X.; Sang, T.; Zhao, Q.; Feng, Q.; Zhao, Y.; Li, C.; Zhu, C.; Lu, T.; Zhang, Z.; et al. Genome-wide association studies of 14 agronomic traits in rice landraces. Nat. Genet. 2010, 42, 961–967. [Google Scholar] [CrossRef] [PubMed]
  54. Huang, X.; Zhao, Y.; Wei, X.; Li, C.; Wang, A.; Zhao, Q.; Li, W.; Guo, Y.; Deng, L.; Zhu, C.; et al. Genome-wide association study of flowering time and grain yield traits in a worldwide collection of rice germplasm. Nat. Genet. 2011, 44, 32–39. [Google Scholar] [CrossRef] [PubMed]
  55. Yano, K.; Yamamoto, E.; Aya, K.; Takeuchi, H.; Lo, P.C.; Hu, L.; Yamasaki, M.; Yoshida, S.; Kitano, H.; Hirano, K.; et al. Genome-wide association study using whole-genome sequencing rapidly identifies new genes influencing agronomic traits in rice. Nat. Genet. 2016, 48, 927–934. [Google Scholar] [CrossRef] [PubMed]
  56. Sivabharathi, R.C.; Rajagopalan, V.R.; Suresh, R.; Sudha, M.; Karthikeyan, G.; Jayakanthan, M.; Raveendran, M. Haplotype-based breeding: A new insight in crop improvement. Plant Sci. 2024, 34, 112129. [Google Scholar] [CrossRef]
  57. Xing, M.; Nie, Y.; Huang, J.; Li, Y.; Zhao, M.; Wang, S.; Wang, Y.; Chen, W.; Chen, Z.; Zhang, L.; et al. A wild rice CSSL population facilitated identification of salt tolerance genes and rice germplasm innovation. Physiol. Plant. 2024, 176, e14301. [Google Scholar] [CrossRef] [PubMed]
Figure 1. Twenty-one haplotypes were classified for 550 Indica/Xian accessions on the basis of nine SNPs from seven ST genes. Salt-tolerant and salt-sensitive SNPs are highlighted in red and black, respectively. The location of each SNP is marked in the corresponding gene.
Agronomy 15 00570 g001
Figure 2. Functional assessment of ST for SKC1140A, SKC1184H and OsHKT1;194K. A Phenotypes of Hap4, Hap1, Hap2, Hap3, Hap5 and Hap6 grown under normal conditions (A) and salt stress (B). (C) Statistical analysis of the rSFW for (A,B). Phenotype (D), rSFW (E) and DLR (F) comparisons between Hap3 and Hap2. N represents the number of rice cultivars, and n represents the number of plants in an assay used for each haplotype. +/− indicates the presence or absence of specific ST-related SNPs. Scale bar = 10 cm. Independent sample t tests were used to analyze significant differences. *** p < 0.001, ** p < 0.01, * p < 0.05, ns p ≥ 0.05.
Agronomy 15 00570 g002
Figure 3. Functional assessment of OsHKT2;377T. Phenotypes (A) and rSFW (B) of Hap3 and Hap9 harboring OsHKT2;377T or not treated with 150 mM NaCl for 7 d. N1 and N2 represent the number of rice cultivars for Hap3 and Hap9, respectively, and n represents the number of plants in an assay used for each haplotype. +/− indicates that the SNPs for OsHKT2;377T were carried or not. Scale bar = 10 cm. Independent sample t tests were used to analyze significant differences. *** p < 0.001.
Agronomy 15 00570 g003
Figure 4. Determination of salt tolerance in rice varieties harboring RST1611G and RST1530G. Phenotypes (A) and rSFW (B) for the comparison between Hap2 and Hap15. Phenotypes (C) and rSFW (D) for the comparison between Hap1 and Hap8. Phenotypes (E) and rSFW (F) for the comparison between Hap9 and Hap10. Phenotypes (G) and rSFW (H) for the comparison between Hap12 and Hap11. N represents the number of rice cultivars, and n represents the number of plants in an assay used for each haplotype. N1 and N2 represent the number of rice cultivars for Hap9 and Hap10, respectively, in E. The seedling plants were treated with 150 mM NaCl for 7 d and then rehydrated for 2 d. +/− indicates the presence or absence of specific ST-related SNPs. Scale bar = 10 cm. Independent sample t tests were used to analyze significant differences. *** p < 0.001, ** p < 0.01,* p < 0.05.
Agronomy 15 00570 g004
Figure 5. Assessment of the ST functions of OsWRKY173G. Phenotypes (A) and rSFW (B) for Hap2 and Hap18. Phenotypes (C) and rSFW (D) for Hap1 and Hap21. Phenotypes (E) and rSFW (F) for Hap4 and Hap17 under salt stress. Relative expression of SKC1 (G) and OsWRKY53 (H) in roots under salt treatment for 8 h in rice varieties selected from Hap2, Hap18, Hap1, Hap21, Hap4 and Hap17. N/n represents the number of rice cultivars and individual plants in an assay used for each haplotype. +/− indicates the presence or absence of specific ST-related SNPs. Scale bar = 10 cm. Independent sample t tests were used to analyze significant differences. *** p < 0.001, ** p < 0.01, ns p ≥ 0.05.
Agronomy 15 00570 g005
Table 1. Distribution of nine SNPs in the 550 Indica/Xian accessions.
SNP AllelesBase Type (S/T) 1Homozygous (S)HeterozygousHomozygous (T)Percentages of T (%)
STG5I12SA/C30951192.91
SKC1P140AC/G951943679.27
SKC1R184HG/A3581817431.63
OsHKT1;1L94KG/A4281310919.82
OsHKT2;3I77TT/C56748788.55
OsWRKY53A173GC/G37450992.55
OsSTL1P298SG/A00550100
RST1A530GC/G50411356.36
RST1E611GA/G32251693.82
1 S/T represents the salt-sensitive and salt-tolerant type, respectively.
Disclaimer/Publisher’s Note: The statements, opinions and data contained in all publications are solely those of the individual author(s) and contributor(s) and not of MDPI and/or the editor(s). MDPI and/or the editor(s) disclaim responsibility for any injury to people or property resulting from any ideas, methods, instructions or products referred to in the content.

