Article

Impact of Deficit Drip Irrigation with Brackish Water on Soil Water–Salt Dynamics and Maize Yield in Film-Mulched Fields

1
Center for Agricultural Water Research in China, China Agricultural University, Beijing 100083, China
2
National Field Scientific Observation and Research Station on Efficient Water Use of Oasis Agriculture, Wuwei 733000, China
*
Author to whom correspondence should be addressed.
Agronomy 2025, 15(2), 379; https://doi.org/10.3390/agronomy15020379
Submission received: 3 January 2025 / Revised: 28 January 2025 / Accepted: 30 January 2025 / Published: 31 January 2025
(This article belongs to the Section Water Use and Irrigation)

Abstract

:
Maize production in the arid and semi-arid regions of northwest China is limited by water scarcity, while the abundance of brackish water highlights the opportunity for its effective and sustainable utilization. A 2-year field experiment (2022–2023) was conducted in the Shiyang River Basin to investigate the impacts of deficit irrigation with brackish water on soil moisture, salinity, temperature, crop growth index, yield, and water productivity. Six treatments were implemented, consisting of two irrigation levels (W1: 75%I, W2: 100%I) and three water quality gradients (S0: 0.7 g L−1, S1: 3.7 g L−1, S2: 5.7 g L−1 in 2022 and 7.7 g L−1 in 2023). Results indicated that brackish irrigation (except S0) increased soil salinity, keeping the soil water storage at higher levels, while decreased maize yield, and water productivity (WP). Compared with full irrigation at the same salinity level, deficit irrigation decreased soil salinity, keeping the soil water storage at lower levels, while increasing soil temperature, which led to lower maize yield but resulted in higher WP. Path analysis of soil hydrothermal salinity and crop growth indicators demonstrated that soil salinity changes play a crucial role in determining maize plant height and yield. S0W2 (100% irrigation, 0.7 g L−1) achieved the highest maize yield, with S0W1 yielding 5.15% less. However, the water productivity (WP) of S0W1 was 17.66% higher than that of S0W2. Therefore, considering the combined factors of maize yield, water productivity, and water-saving benefits, the use of S0W1 (75% irrigation, 0.7 g L−1) is recommended.

1. Introduction

Agricultural production in arid and semi-arid regions faces profound challenges under the pressures of global climate change and escalating water scarcity. This is particularly evident in northwestern China, where both severe water shortages and soil salinization critically undermine crop stability and sustainable development [1,2,3]. Although advanced water-saving irrigation systems and efficient water use technologies have been introduced to curtail agricultural water consumption, they remain inadequate to address the intensifying water demands driven by agricultural expansion [4]. As a compensatory measure, brackish water is increasingly employed to mitigate water scarcity and alleviate the growing imbalance in freshwater availability [5,6,7]. However, improper application of brackish water for irrigation accelerates soil salinity accumulation and exerts detrimental effects on crop health and productivity [8]. Thus, mitigating the adverse impacts of soil salinity on crop growth and yield while simultaneously enhancing water use efficiency has emerged as a paramount priority in agricultural research.
Maize is a cornerstone of global food security, with China ranking as the second-largest producer and the largest consumer worldwide [9]. In arid and semi-arid regions, irrigation is indispensable for managing soil salinity and sustaining crop growth under challenging environmental conditions. Well-designed irrigation regimes not only enhance maize productivity but also reduce soil salt accumulation, alleviate water–salt stress interactions, and optimize yield outcomes [10,11]. Among these methods, film-mulched drip irrigation has gained widespread recognition for its ability to elevate soil temperature, conserve soil moisture, and minimize deep percolation losses, making it a transformative water conservation technology in resource-limited regions [12].
Recent years have seen a growing focus on combining film-mulched drip irrigation with brackish water [13,14,15]. Ren et al. (2021) recommended using saline water at 3 g L−1 for cotton irrigation, as it enhances transpiration, net photosynthesis, yield, and provides optimal water conditions [16]. Wang et al. (2015a) analyzed how irrigation water quantity and salinity impact winter wheat yield and soil salinity distribution, identifying a quadratic relationship between yield and water quantity [17]. Yuan et al. (2019) observed that irrigation water quality and quantity significantly influence soil salinity distribution. They found that when salinity was below 3 g L−1 and irrigation volume was 370 mm, maize water productivity improved without significantly reducing yield [18]. Qiu et al. (2021) showed that deficit irrigation with brackish water significantly affects the dry matter and water productivity of alfafa due to water and salt stress. They also established a linear relationship between mean ECe (electrical conductivity of the saturated paste) and total biomass, indicating ECe as a reliable predictor for alfalfa yield in saline regions [19]. Although short-term brackish water irrigation does not cause significant reduction in yield, prolonged irrigation with brackish water reduces soil organic matter, decreases soil fertility, and increases soil salinity, especially in arid areas with high evapotranspiration rates like northwest China [20,21]. Previous studies have investigated the impact of brackish water irrigation on the soil water and salinity conditions and crop yield across different crop species, with various irrigation salinity thresholds proposed for different crops. Crop phenology is a critical determinant of plant growth and reproductive success, and extensive research has highlighted the significant influence of air temperature on phenological development [22,23]. In certain instances, soil temperature provides a more accurate explanation of crop phenology than air temperature [24]. However, further investigation is necessary to elucidate the interactive effects of water quality and irrigation volume on soil water, heat, and salt distribution, as well as on maize growth and yield. Gaining a deeper understanding of these interactions will aid in the development of optimal drip irrigation strategies under plastic film across varying water quality conditions.
Path analysis identifies causal relationships and quantifies the direct and indirect effects of variables on the dependent variable, enhancing the reliability and interpretability of results. Xiao et al. (2023) applied pathway analysis to identify boll number as the primary growth variable influencing cotton yield, with soil salinity having the most significant impact on boll number [25]. Gong et al. (2020) identified net radiation as the primary meteorological factor influencing crop ETc across different irrigation treatments using pathway analysis [26]. Gao et al. (2024) used pathway analysis to identify ear grain number as a key factor influencing maize yield [27]. Wang et al. (2024) applied pathway analysis to examine energy partitioning and distribution pathways on farms [28].
In order to quantify the effects of irrigation water quality and quantity on soil water, heat, and salt changes, and maize yield, and to identify the critical and limiting factors influencing maize production, a 2-year field experiment was conducted with various irrigation water and salinity treatments, and based on the experimental results, we (1) examined the effects of varying irrigation water quantity and quality on soil moisture, temperature, and salinity distribution; (2) analyzed their impacts on maize growth, yield, and water productivity; and (3) quantified the direct and indirect effects of soil water, heat, and salts on growth indicators and their overall contribution to maize production.

2. Materials and Methods

2.1. Experimental Site

The field experiment was carried out from 2022 to 2023 at the National Field Scientific Observatory for Efficient Water Use in Agriculture, located in Wuwei, Gansu Province, China (37°52′20″ N, 102°50′50″ E; altitude 1582 m). The region experiences a temperate, continental arid desert climate, characterized by over 3000 h of annual sunshine and a frost-free period longer than 150 days. The average annual temperature is 8 °C, with 164 mm of precipitation and 2400 mm of potential evaporation, underscoring a severe scarcity of water resources. The average groundwater table is below 30 m [29]. Groundwater is the primary source of irrigation in this region, with salinity levels ranging from 0.5 to 9 g/L, and in some areas, it can reach up to 10 g L−1 [30]. The predominant cations in the groundwater of this region are Na+ and Ca2+, while the main anions are Cl and SO42− [31].

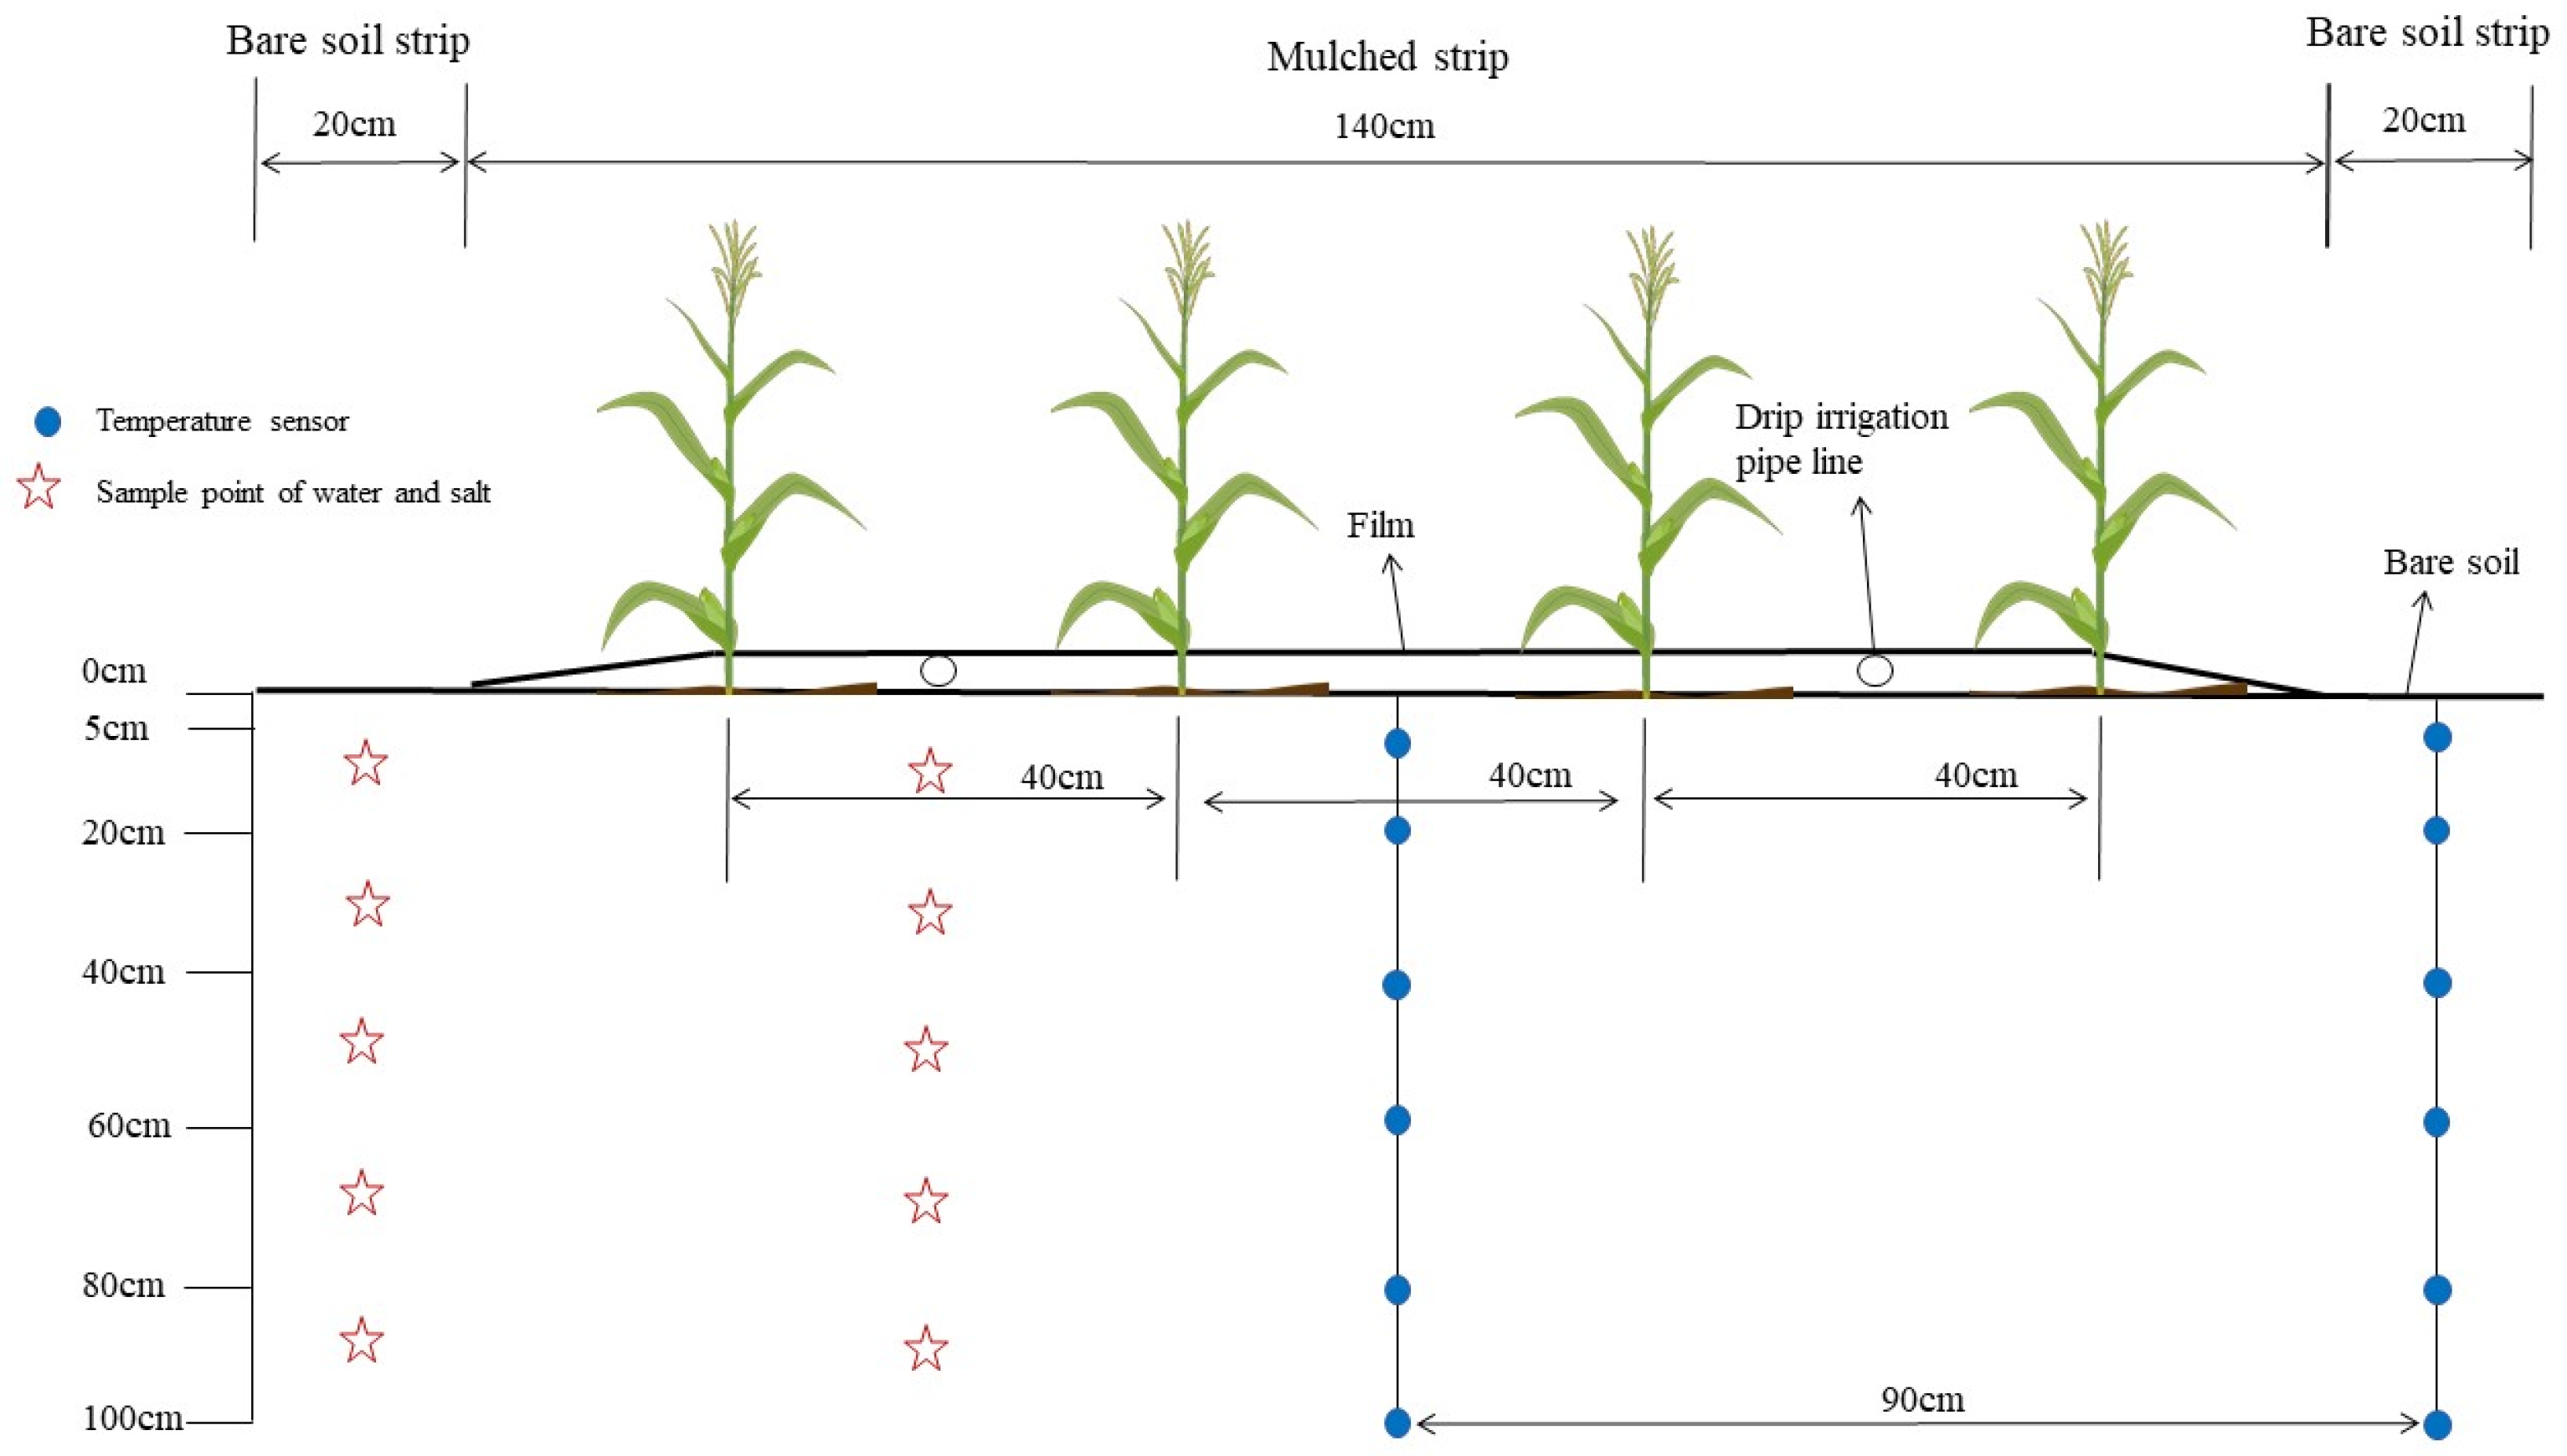
2.2. Experimental Design

There were six treatments including two irrigation levels and three water salinity levels. Each treatment had three replicates, and 18 plots were arranged using a randomized block design. Three water quality gradients were applied: 0.7 g L−1 (S0), 3.7 g L−1 (S1), and 5.7 g L−1 (S2). In the second year, the S2 treatment was adjusted to a higher salinity level of 7.7 g L−1 to evaluate the potential value of brackish water. Freshwater was from local groundwater, and the brackish water was prepared by mixing groundwater with NaCl in a specified mass ratio [32]. Two irrigation levels, 100% (W2) and 75% (W1) of the full irrigation, were applied, with equal irrigation amounts for both brackish and freshwater treatments. The W2 treatment triggered irrigation when the average soil water content (SWC) at 0~60 cm reached about 65~70% FC. The irrigation quota was calculated as the difference between the mean SWC and the 95% of the mean FC of the root zone [33]. Deficit irrigation (W1) was applied concurrently with the W2 treatment, at 75% of the W2 irrigation volume. The full irrigation amount for W2 in 2022 and 2023 was 270 mm (5 times) and 370 mm (7 times), respectively (Figure 1). Each experimental plot measured 32.4 m2 (5.4 m × 6 m) and each treatment included three replicates. Plots were spaced over 2 m apart to minimize lateral interactions of water and salt migration. The fundamental physical properties of the soil are presented in Table 1. The farmland was equipped with a film-mulched drip irrigation system, where one piece of film (width: 140 cm) and two lines of irrigation tube were placed for every four crop rows. As described by Haraguchi et al. (2003) [34], 80% of the rainfall passes through emergence holes to reach the crop root zone. The two lines were spaced 80 cm apart, with drippers positioned at 30 cm intervals and a flow rate of 2.5 L h−1. The crop rows were 40 cm apart, and in each row the crops were planted at 25 cm intervals (Figure 2). The maize seeds of variety “Xianyu 1225” were sown on 27 April 2022 and 27 April 2023, and they were harvested on 5 September 2022 and 15 September 2023.
Fertilizer application methods were consistent across all experimental plots and years. Before sowing, base fertilizers, including compound fertilizers and diammonium phosphate, were manually broadcasted at rates of 121.5 kg N ha−1, 98.85 kg P ha−1, and 22.35 kg K ha−1, followed by rotary tilling to incorporate the fertilizers into the soil. During the jointing and tasseling stages, a total of two applications of nitrogen fertilizer (urea, CO(NH2)2) were made at rates of 126 kg N ha−1 and 83 kg N ha−1, respectively, and delivered to the crop’s root zone via drip irrigation.
Meteorological data, including temperature and precipitation, were obtained from the meteorological station (Hobo, Onest Cumputerdata Corp., Bourne, MA, USA) at the experimental site, with total precipitation of 175 mm and 66.6 mm during the two growing seasons (Figure 1).

2.3. Sampling and Measurement

2.3.1. Soil Physical Parameters

Soil samples were collected at depths of 0–20, 20–40, 40–60, 60–80, and 80–100 cm using a soil auger before sowing, after harvest, and before and after each irrigation during the maize growing seasons in 2022 and 2023. Soil mass water content was measured by an oven drying method and converted to soil volumetric water content (SWC) by multiplying the soil bulk density. The air-dried soil were sieved through a 1 mm mesh, and 10 g of the sieved soil was weighed and mixed with deionized water at a soil-to-water ratio of 1:5 to prepare a slurry. The electrical conductivity (EC1:5) of the resulting mixture was measured using a FE38 conductivity meter (Mettler Toledo, Greifensee, Zürich, Switzerland). The soil salt content (SSC) was then calculated using the equation S = 0.0275EC1:5 + 0.1366 [35]. Soil temperature (ST) was recorded every 30 min using a soil temperature recorder (HZ-TJ1, Beijing, China), with temperature probes buried at depths of 5, 20, 40, 60, 80, and 100 cm. The rate of change in soil salinity (ΔS) was calculated as the difference between soil salinity at the end and the beginning of the crop growth period.

2.3.2. Determination of Maize Growth and Yield

Plant height (PH), stem diameter (SD), and leaf area index (LAI) were measured on three randomly selected maize plants at the nodulation, staminate, irrigation, and maturity stages. Aboveground dry matter accumulation (DMA) was determined by drying the samples at 105 °C to inactivate enzymes and at 85 °C to a constant weight. At harvest, 1 m × 2.5 m sample plots were randomly selected for harvesting manually, and 100-kernel weight, number of ears, and number of grains per ear were measured to calculate crop yield. The harvest index (HI) was calculated as the ratio of crop yield to DMA.
Water productivity (WP) is calculated as follows:
WP = 100 · Y / ET
where WP is water productivity (kg m−3), Y is maize yield (t ha−1), and ET is crop evapotranspiration(mm).
Evapotranspiration (ET) is calculated based on the water balance of the root zone (0–100 cm):
ET = P Δ P + U + I D R Δ W
where P is the precipitation during the reproductive period (mm), ∆P is precipitation retention (mm), including both canopy and ground cover retention, U is the upward flow from the bottom of root zone rise (mm), I is the total irrigation water applied (mm), D is the deep percolation (mm), R is the runoff volume (mm), and ∆W is the increase in soil water storage from pre-sowing to the post-harvest stage for the root zone (mm), with a positive value indicating an increase. Soil water storage in the root zone was obtained based on the area weighted value of the measured soil water content (0–100 cm) in the bare soil and under the mulch. U, D, and R can be considered negligible due to the small single irrigation volume and deep groundwater table.

2.4. Path Analysis

In multivariate response systems, the relationships between variables are often complex, with potential correlations between any two variables. Accurately explaining the relationship between two variables is often difficult by merely calculating their simple correlation coefficients. The pathway analysis method, based on correlation and regression analysis, decomposes the correlation coefficients into direct and indirect effects to reveal the influence of each factor on the dependent variable. The calculation assumes the existence of p independent variables (x1, x2, …, xp) and a dependent variable, y. The correlation coefficients between each pair of independent variables are defined as rij (i = 1, 2, …, p; j = 1,2,…, p). These coefficients, along with the simple correlation coefficients between rij and y, are used to construct the normalized equations for calculating the path coefficients.
r 11 ρ 1 + r 12 ρ 2 + r 1 p ρ p = r 1 y r 21 ρ 1 + r 22 ρ 2 + r 2 p ρ p = r 2 y r p 1 ρ 1 + r p 2 ρ 2 + r pp ρ p = r py
where ρ1, ρ2, …, ρp are the direct path coefficients from xi to y. Let the matrix in Equation (4) be denoted as r. Then, ρi (i = 1, 2, …, p) can be obtained by calculating the inverse matrix (c) of r, expressed as:
ρ 1 ρ 2 ρ p = c 11 c 12 c 1 p c 21 c 22 c 2 p c p 1 c p 2 c pp r 1 y r 2 y r py
where c is the inverse matrix of the correlation coefficient matrix, r. The indirect coefficients are derived from the product of the direct path coefficients and the correlation coefficients. Additionally, we introduce the decision coefficient, R2(i), which reflects the integrated determination of the correlation network from xi through x1, x2, …, xp, and xi to y.

2.5. Statistical Analysis

Analysis of variance(ANOVA) was performed using IBM SPSS Statistics 21, with Duncan’s multiple range test applied at a significance level of p < 0.05. Pass-through analysis was conducted using the entry method. Graphs were plotted using Origin 2024 software.

3. Results

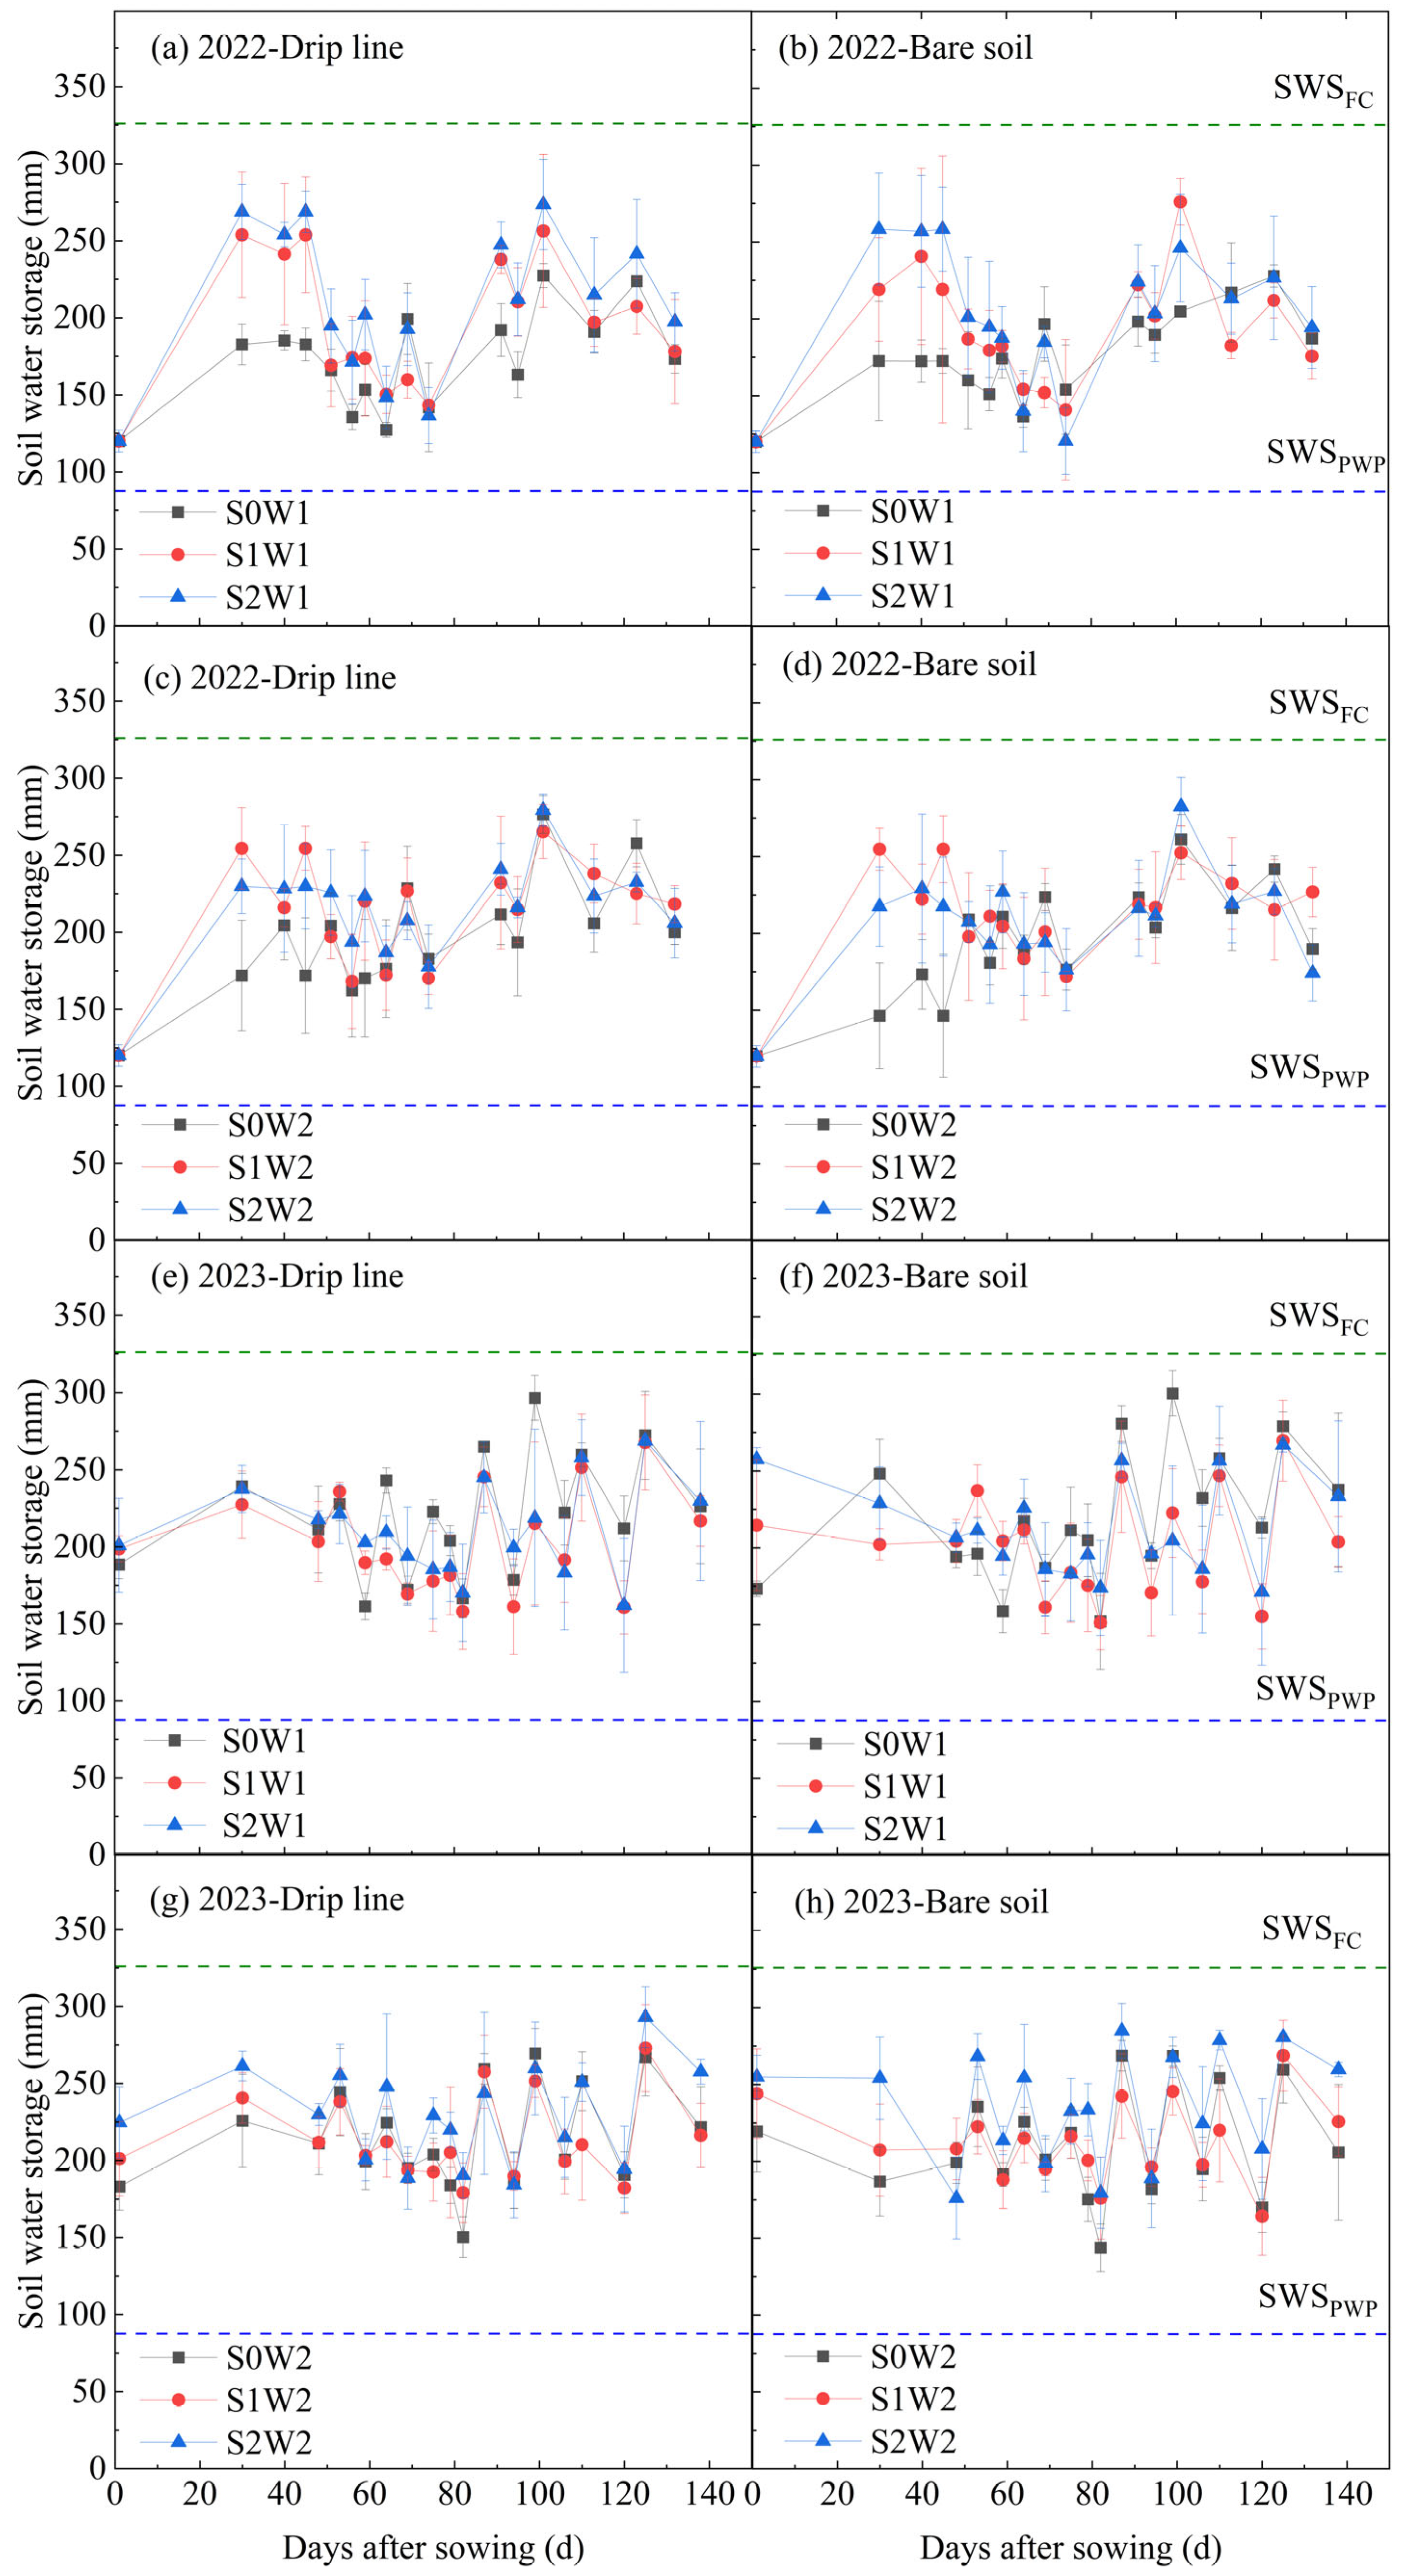
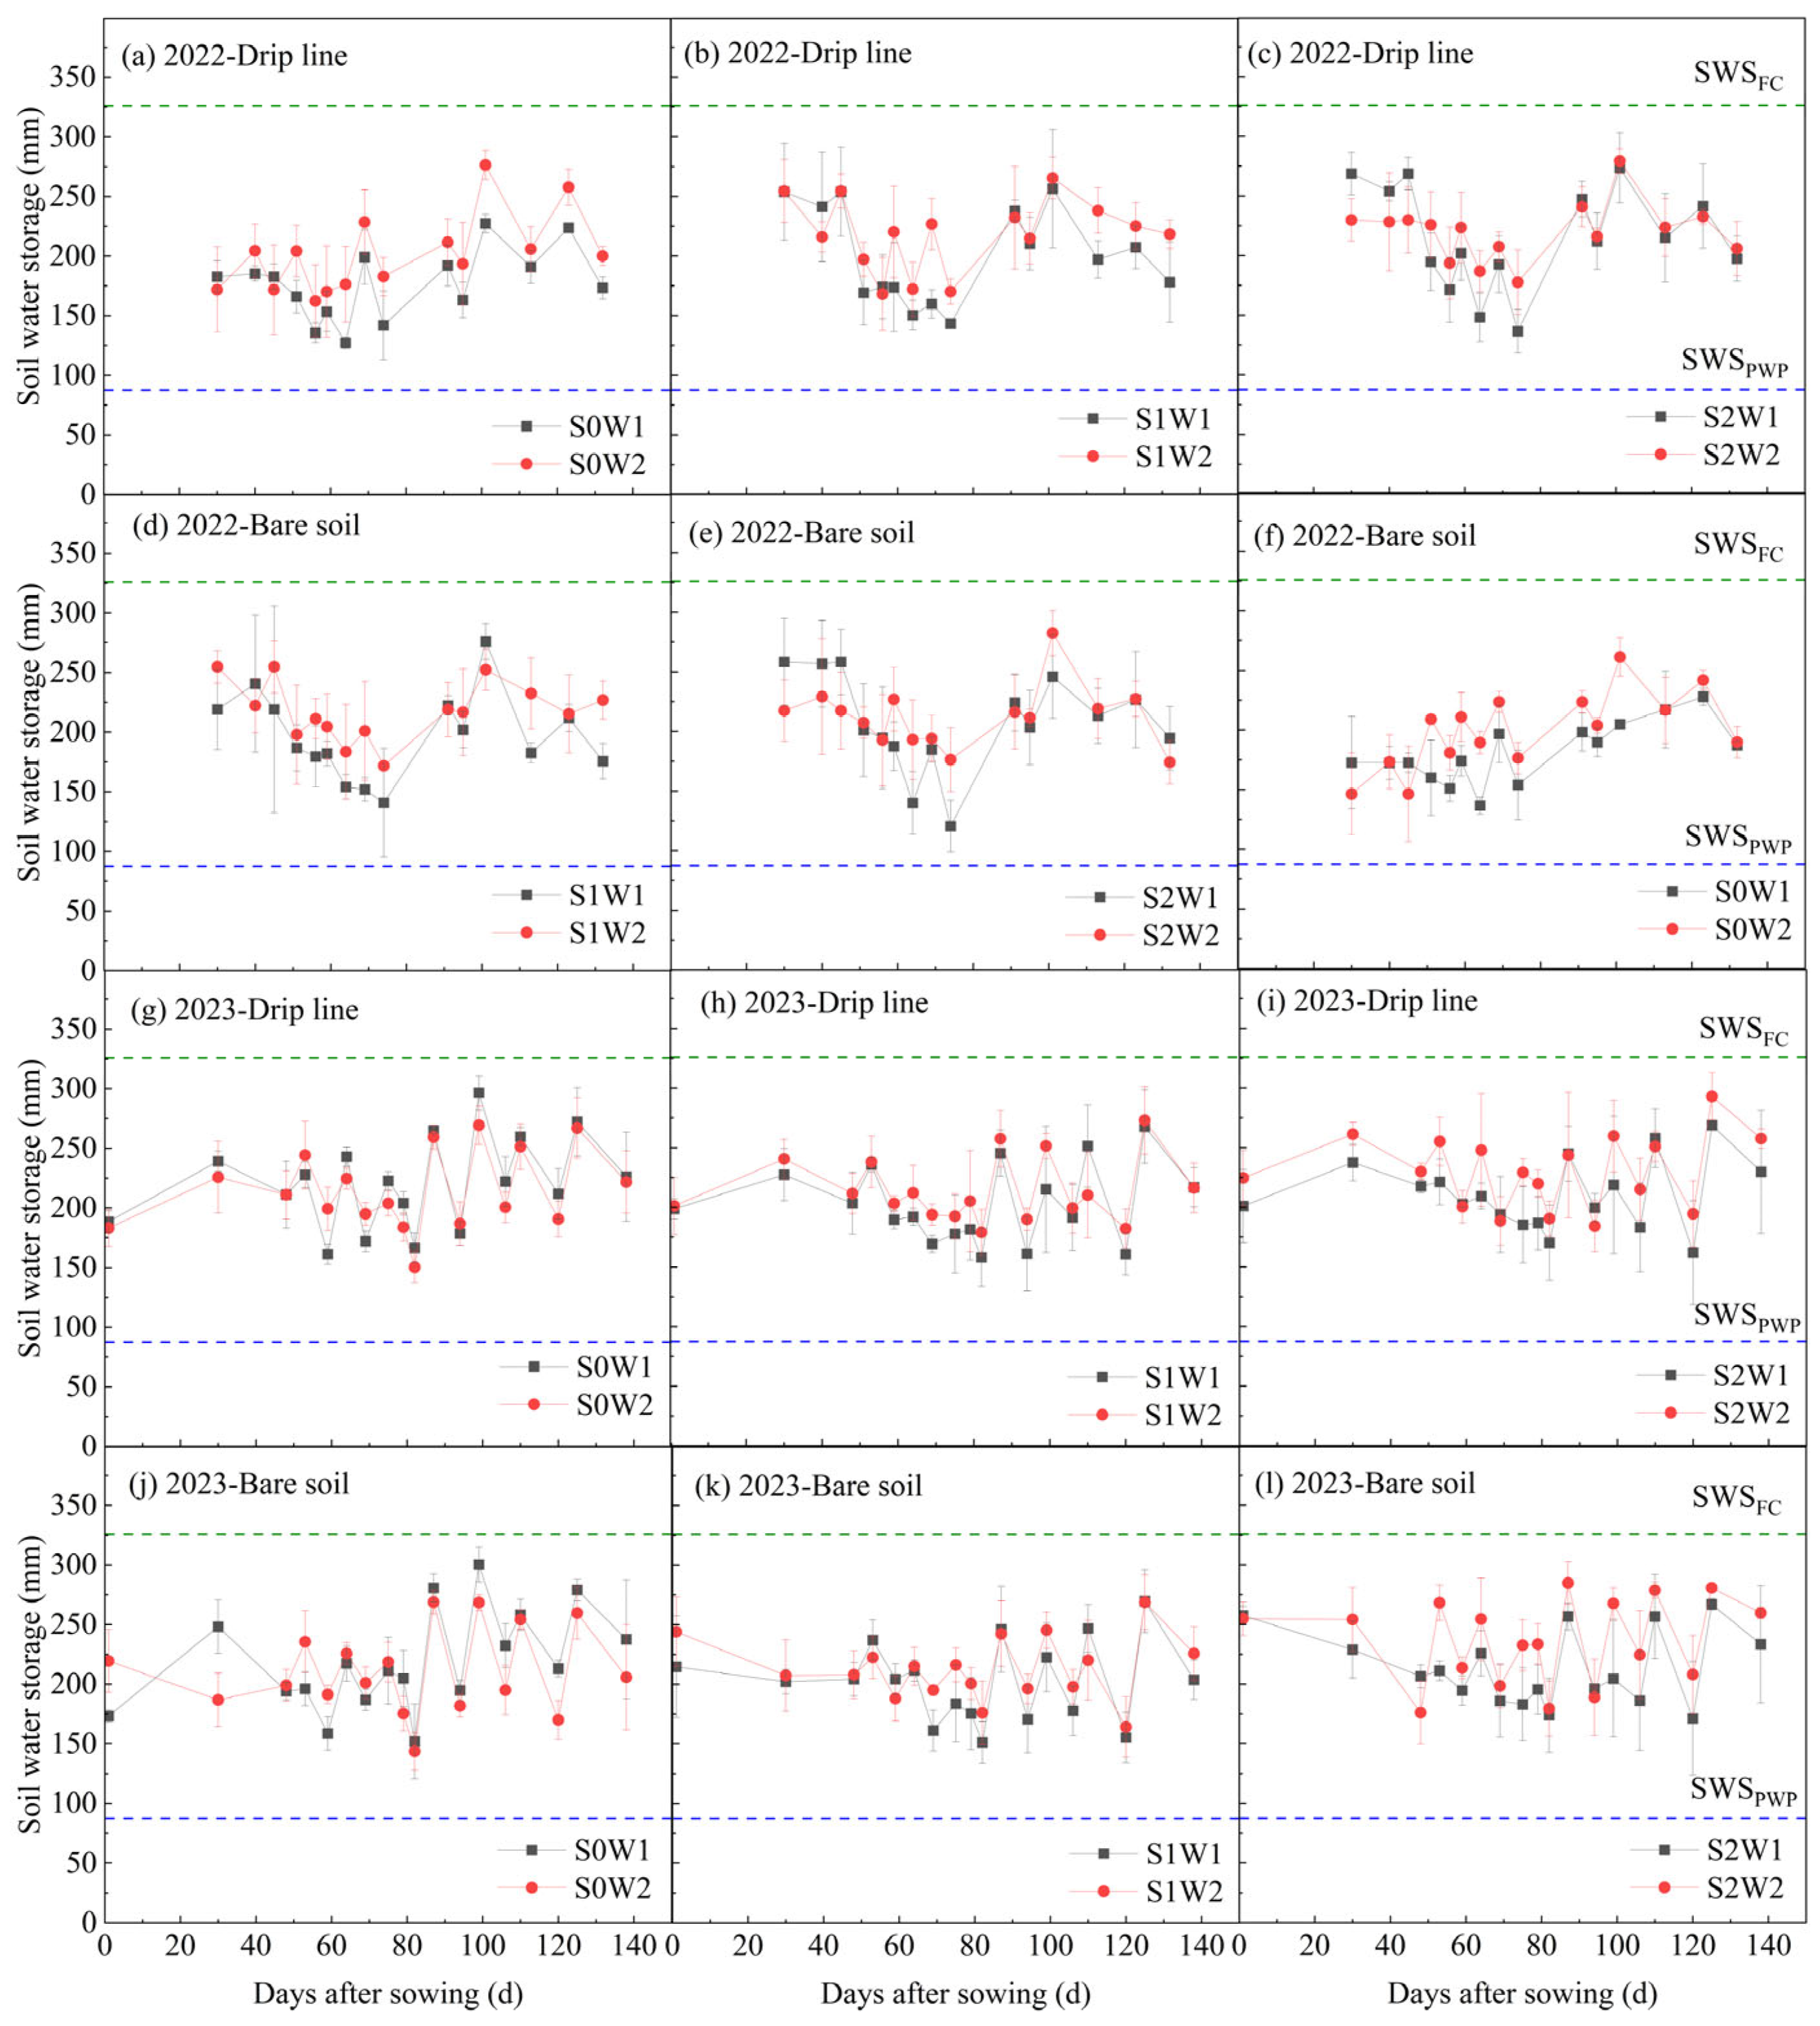
3.1. Soil Water Storage
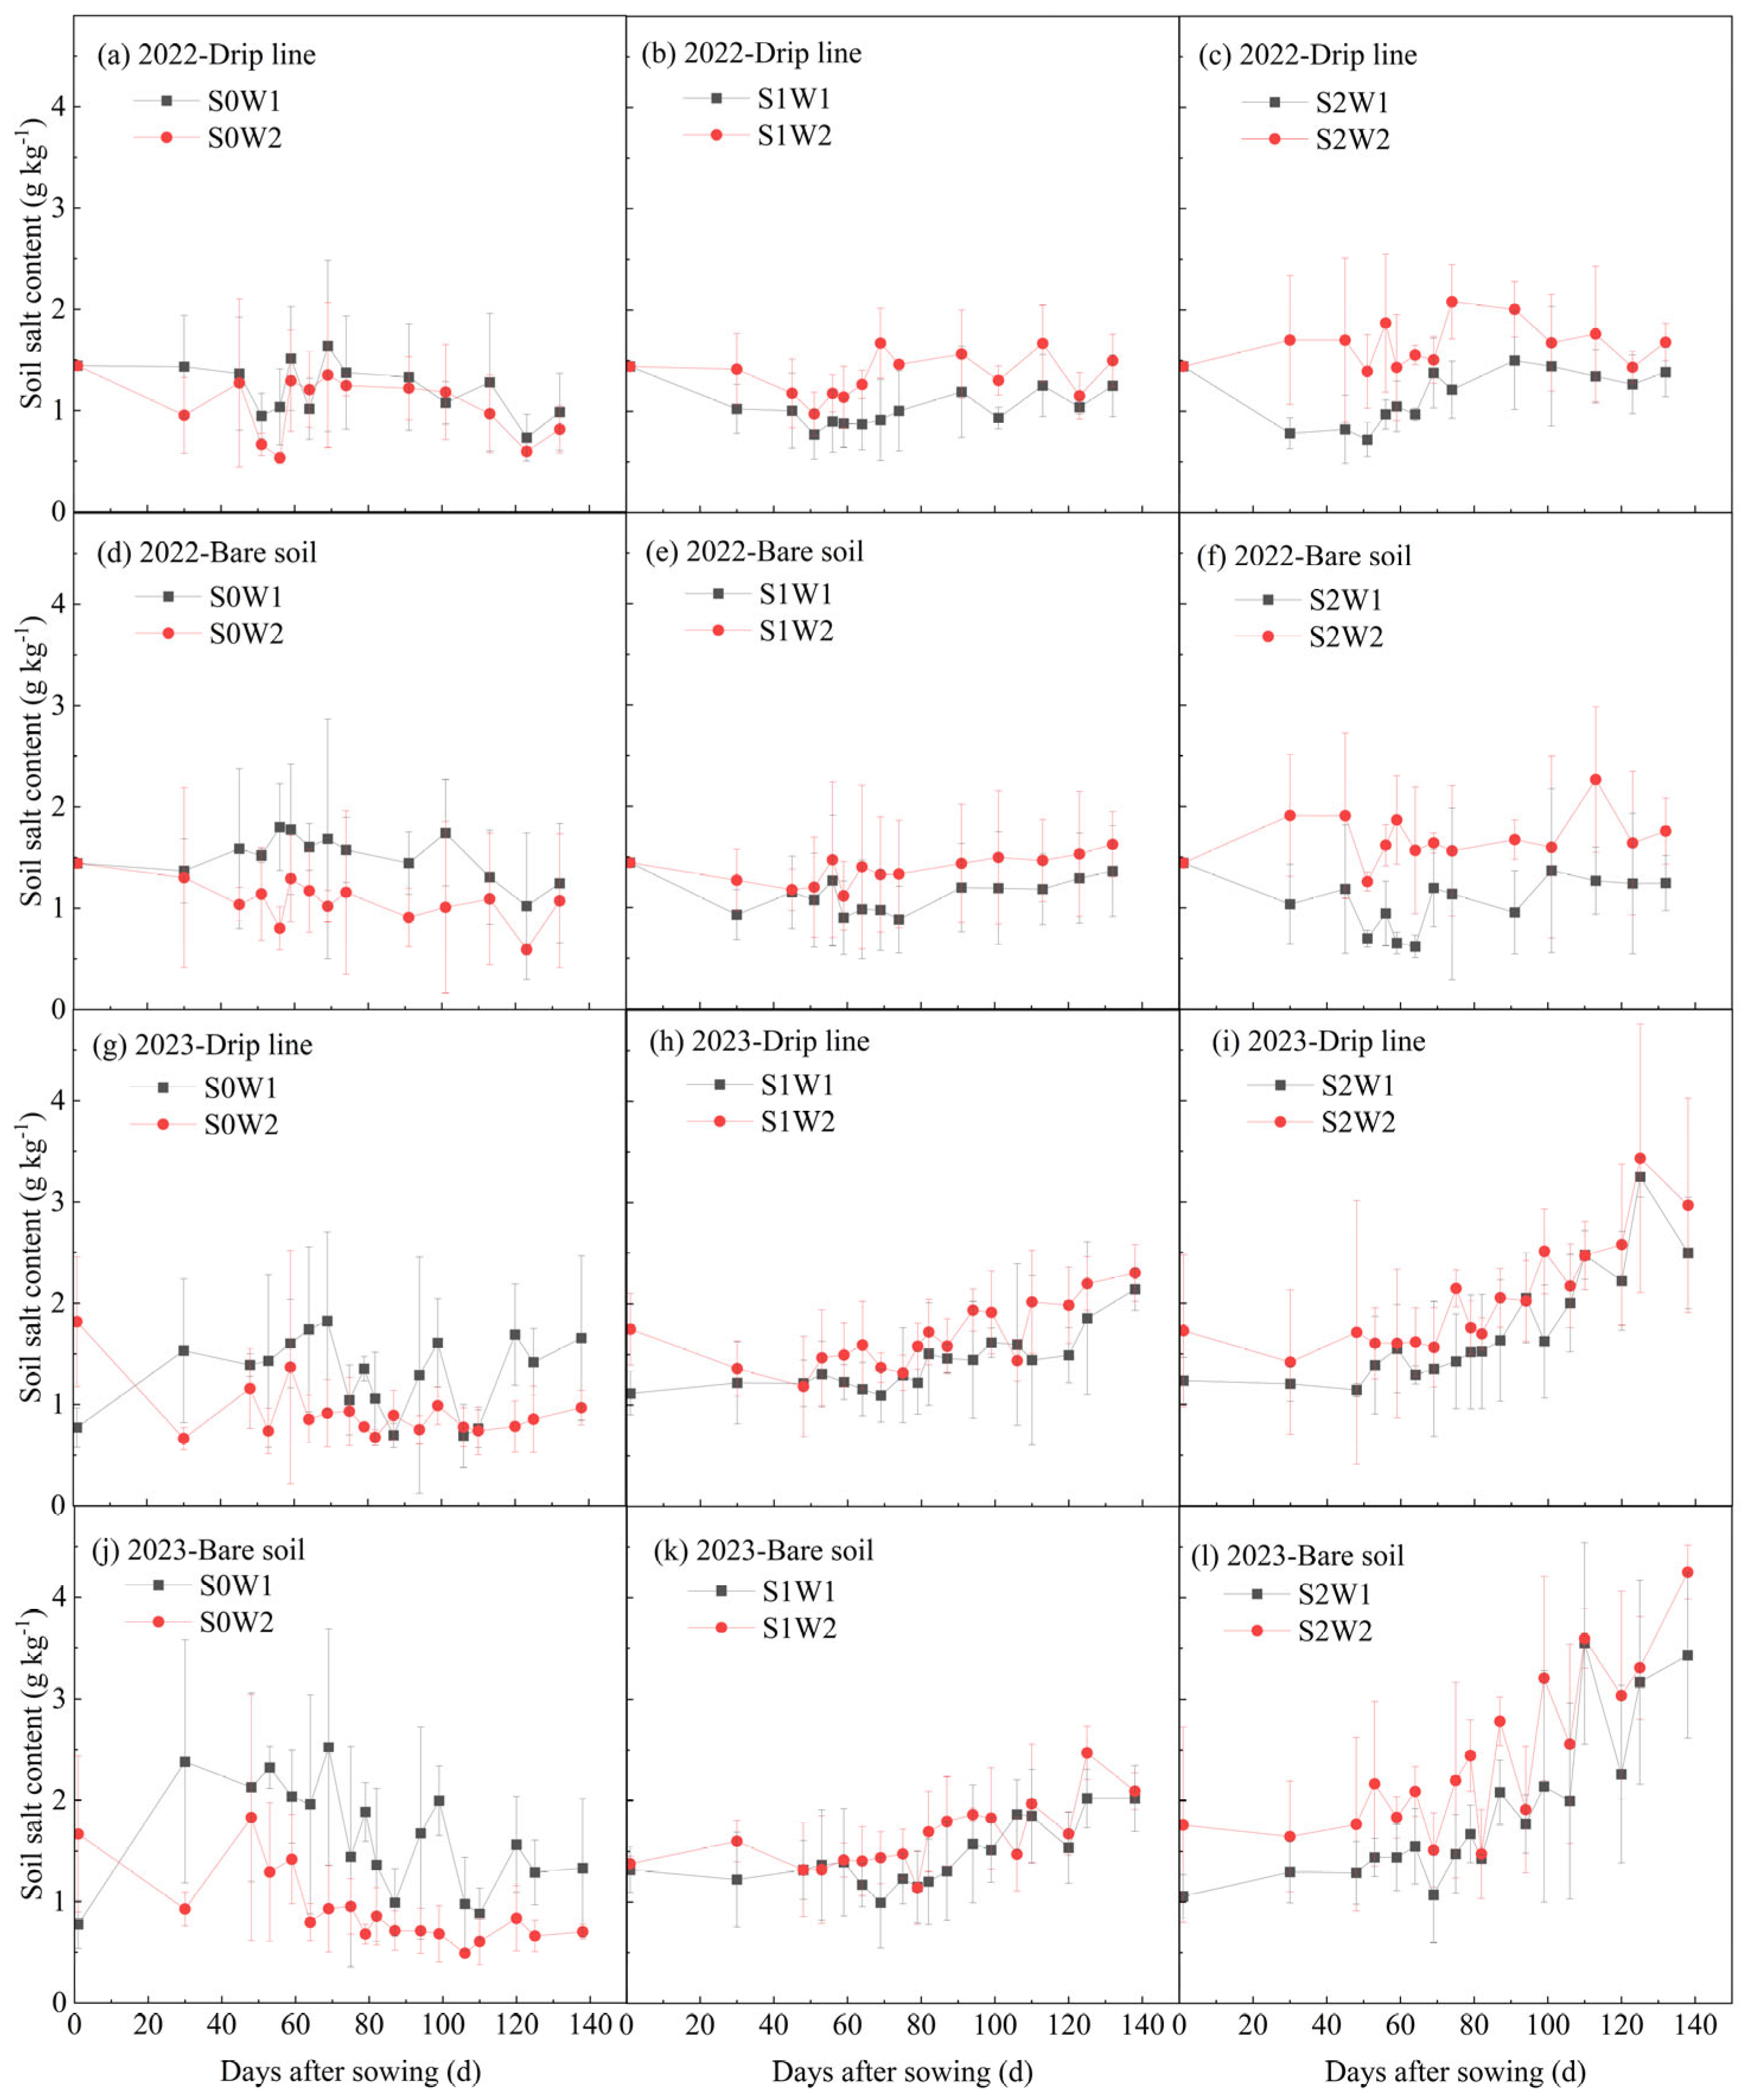
Figure 3 and Figure 4 show the evolution of soil water storage below the drip line and bare soil during crop season under varying irrigation volumes and salinities in 2022 and 2023. Figure 3 demonstrates that soil water storage exhibits significant yearly variation, with inconsistent trends observed between 2022 and 2023. Under the same irrigation level, the treatment with higher irrigation salinity showed a higher level of soil water storage in 2022, especially during the early reproductive stage. The average soil water storage values over the entire reproductive period for S1 and S2 were 10.46% and 14.61% higher than S0, respectively, compared to 8.44% and 9.88% for the bare soil location. In 2023, under fully irrigated conditions, S2 was higher than S0, while the difference between S0 and S1 was insignificant. Under W1 conditions, freshwater irrigation (S0) outperformed brackish water irrigation (S1 and S2). In the whole crop season, the averaged soil water storage for S1 and S2 was 8.21% and 4.50% lower than S0, respectively, compared to 7.63% and 2.66% for the bare soil location. The changes in soil water storage were similar for both bare soil and drip line. Figure 4 shows that soil water storage increased with higher irrigation water at the same salinity level. The average soil water storage at three irrigation salinities showed that, in 2022, W2 at the drip line was 7.77% higher than W1, while the bare soil location was 7.39% higher. In 2023, the values were 4.11% and 4.20%, respectively.

3.2. Soil Salinity

Figure 5 and Figure 6 show the soil salinity at the drip line and bare soil during the crop growth stages under varying irrigation volumes and salinities in 2022 and 2023. Figure 5 illustrates that soil salinity fluctuated significantly between years, showing similar trends in 2022 and 2023 for the drip line, but with a distinct difference at the bare soil. Under the same irrigation volume, salt accumulation was more pronounced at the drip line under deficit irrigation (W1) with freshwater (S0) during the early growth stage, while soil salinity gradually increased with higher irrigation salinity in the late growth stage. Under full irrigation (W2), soil salinity increased throughout the growing season with higher irrigation salinity. At the bare soil, under deficit irrigation in 2022, soil salinity decreased with increasing irrigation salinity. In the early growth stage of 2023, salt accumulation was higher with freshwater irrigation compared to brackish water irrigation, while in the late growth stage, salt accumulation increased with higher irrigation salinity. Under full irrigation (W2), soil salinity at the bare soil increased with higher irrigation salinity, and salt accumulation was greater in 2023 than in 2022. As shown in Figure 6, at the same irrigation salinity, soil salinity decreased with increasing freshwater irrigation volume. In contrast, with brackish water irrigation, soil salinity increased with higher irrigation volume. The trends at the bare soil and drip line were similar.
Figure 7 illustrates the distribution of ΔS across different soil layers and locations. In 2022, the desalination depth in the S0 irrigation zone under drip irrigation was 0–80 cm, including both W1 and W2 treatments. For all brackish water irrigation, desalination occurred at depths of 0–20 cm, with slight salt accumulation observed between 20 and 60 cm. The S2W2 treatment exhibited the most significant salt accumulation. In the bare soil area, all treatments showed desalination within the 0–20 cm range, while salt accumulation was evident at 20–40 cm. In 2023, the S0W2 treatment showed desalination across the entire 0–100 cm depth in both the drip irrigation zone and bare soil. In contrast, S0W1 exhibited desalination in the drip irrigation zone and bare soil to a depth of 60 cm, with salt accumulation occurring from 60 to 100 cm. Other treatments showed salt accumulation within the 0–100 cm range, with the most pronounced accumulation observed in the bare soil area under S2W1.

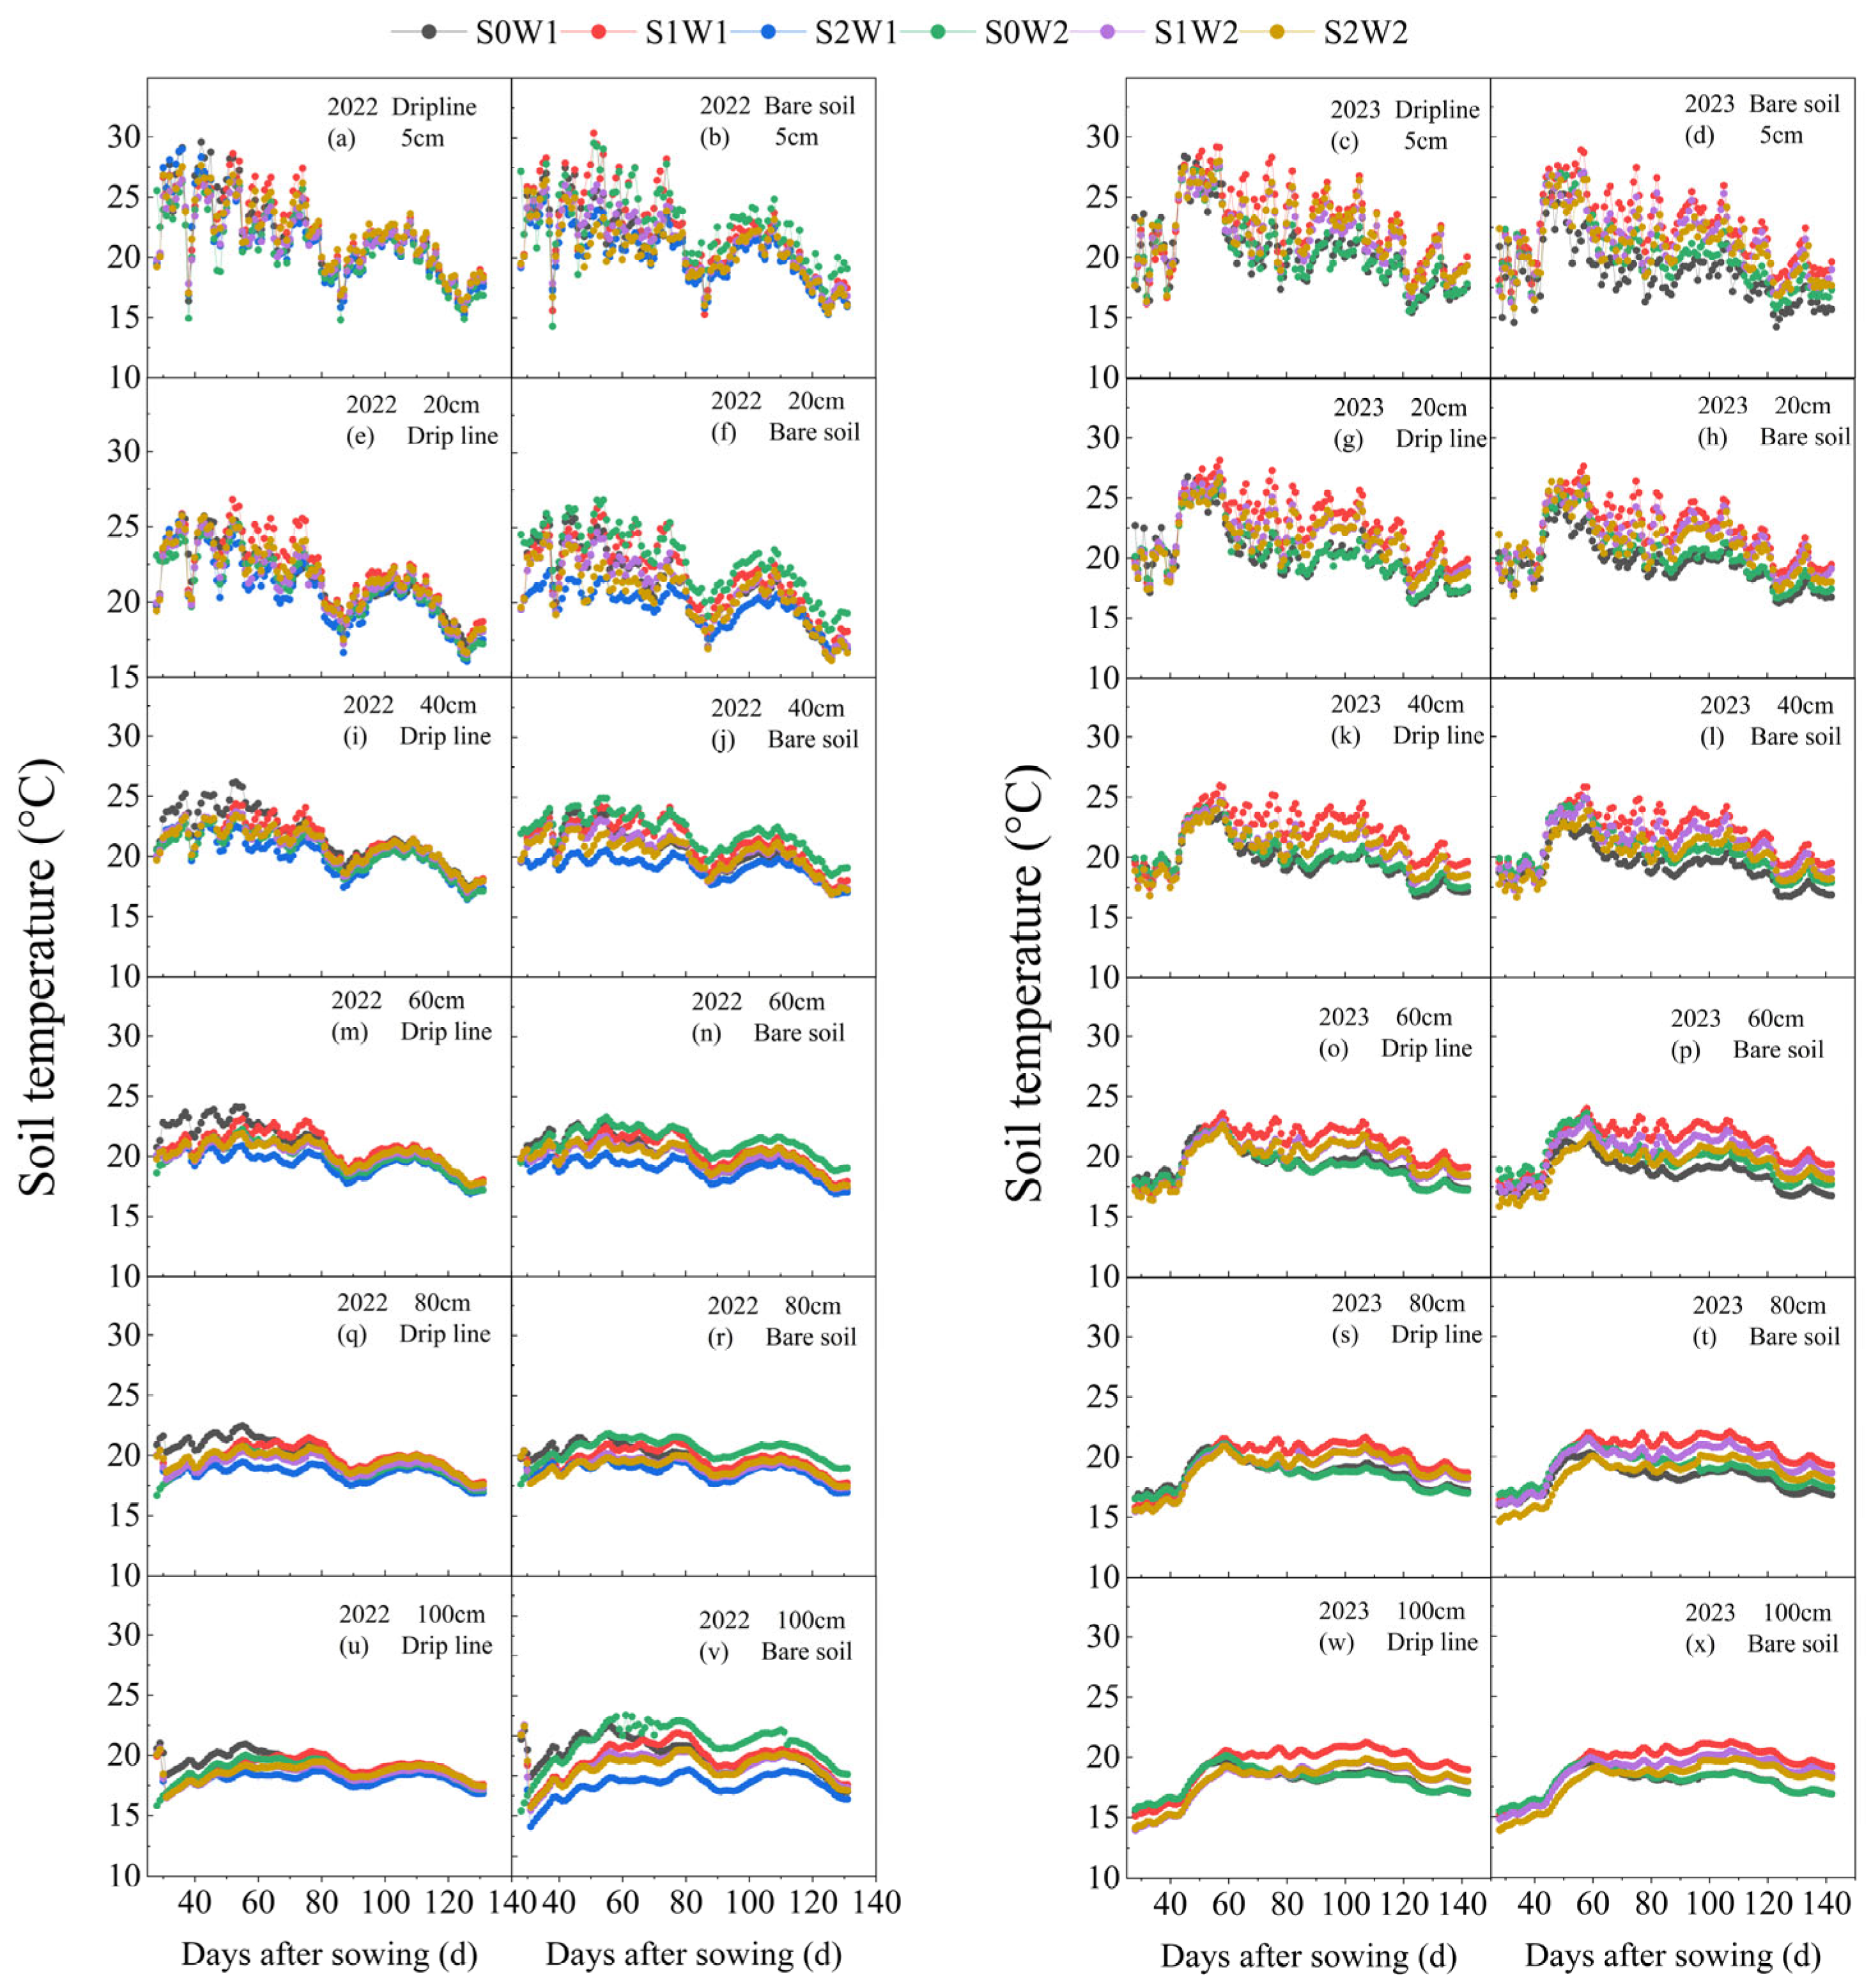
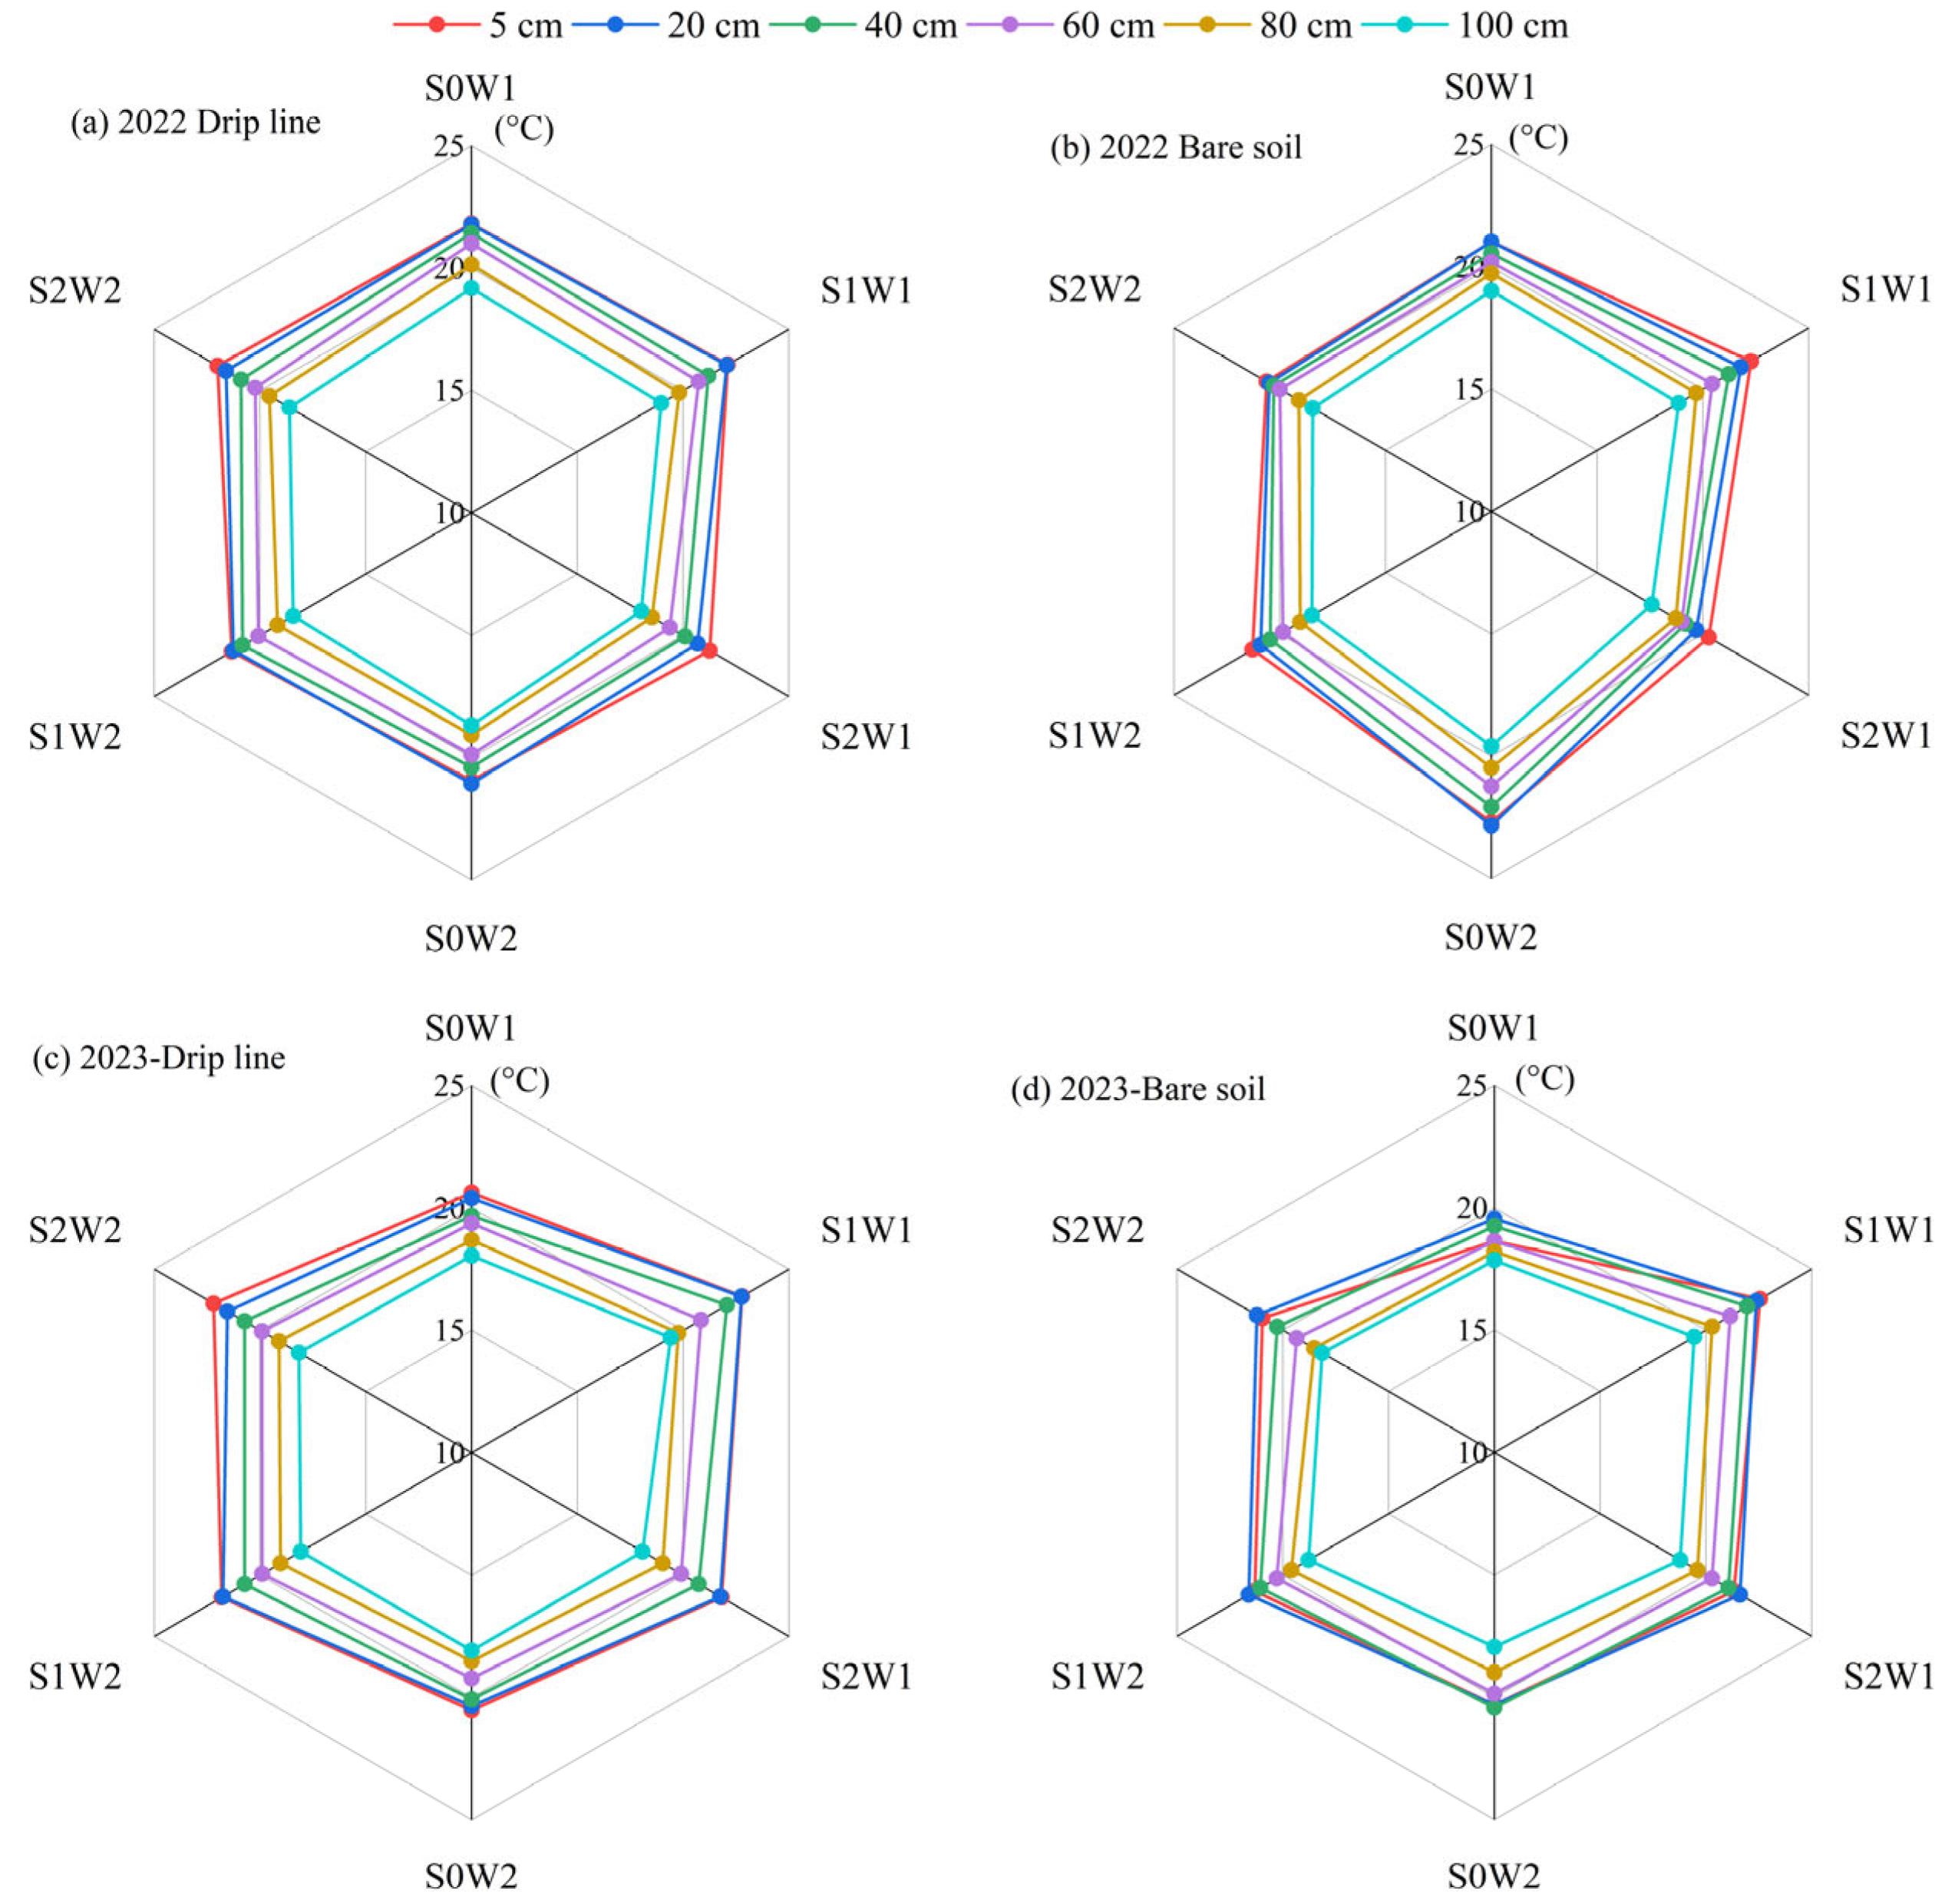
3.3. Soil Temperature

Figure 8 shows the variation in soil temperature at different layers under various irrigation water quantity and salinity treatments, While Figure 9 illustrates the changes in average soil temperature during crop growth. In the crop root zone, the average temperature of each soil layer decreased by 1.14% in 2022 and 1.65% in 2023 under full irrigation (W2) compared to deficit irrigation (W1). In the bare soil area, the average temperature of each soil layer increased by 2.09% in 2022 and decreased by 1.03% in 2023 under full irrigation (W2) compared to deficit irrigation (W1). In 2022, for light saline irrigation (S1), the average soil temperature increased by 0.45–1.60% in the 0–60 cm layer compared to freshwater irrigation (S0), whereas in the 80–100 cm layer, it decreased by 0.60–1.24%. Under moderate saline irrigation (S2), the temperature increased by 1.59% at 5 cm and decreased by 1.32–3.25% at 20–100 cm compared to freshwater irrigation (S0). In 2023, light saline irrigation (S1) and moderate saline irrigation (S2) increased soil temperature by 3.73–9.19% and 0.30–6.97%, respectively, compared to freshwater irrigation (S0). The trend of soil temperature change over time was similar for all treatments at different depths, with temperatures being higher in the early reproductive stage and gradually decreasing thereafter. Soil temperature fluctuation also decreased with increasing soil depth. The temperature fluctuation in bare soil was greater than that in the root zone. The highest average soil temperatures in both 2022 and 2023 occurred in the S1W1 treatment.

3.4. Maize Growth

Figure 10 presents data on PH, SD, LAI, and DMA for 2022 and 2023. PH decreased with increasing irrigation salinity but increased with higher irrigation volume. PH significantly decreased with increasing irrigation salinity, except under deficit irrigation (W1) conditions in 2022, where no significant difference was observed in the effect of salinity on PH. The highest PH was observed in the S0W2 treatment. In 2022, brackish water treatments (S1, S2) resulted in decreases of 3.36% and 6.60%, respectively, compared to freshwater irrigation (S0). Deficit irrigation (W1) reduced PH by 2.18% compared to full irrigation (W2). In 2023, brackish water treatments (S1, S2) decreased PH by 32.24% and 36.26%, respectively, compared to freshwater irrigation (S0). Deficit irrigation (W1) resulted in a 5.90% decrease in PH compared to full irrigation (W2). No significant difference in SD was observed in 2022. In 2023, brackish water treatments (S1, S2) significantly reduced SD compared to freshwater irrigation (S0), with reductions of 6.10% and 4.08%, respectively. The maximum LAI was observed in the S0W2 treatment, with no significant differences between treatments in 2022. In 2023, irrigation salinity significantly reduced LAI, with reductions of 21.22% and 24.2% in brackish water treatments (S1, S2) compared to freshwater irrigation (S0). DMA was highest in the S0W2 treatment, with no significant differences between treatments in 2022. In 2023, irrigation salinity significantly reduced DMA, with a reduction of 25.89% in brackish water treatments (S1, S2) compared to freshwater irrigation (S0) and 38.59% overall. Overall, PH, SD, LAI, and DMA decreased with increasing irrigation salinity but increased with a higher irrigation volume.

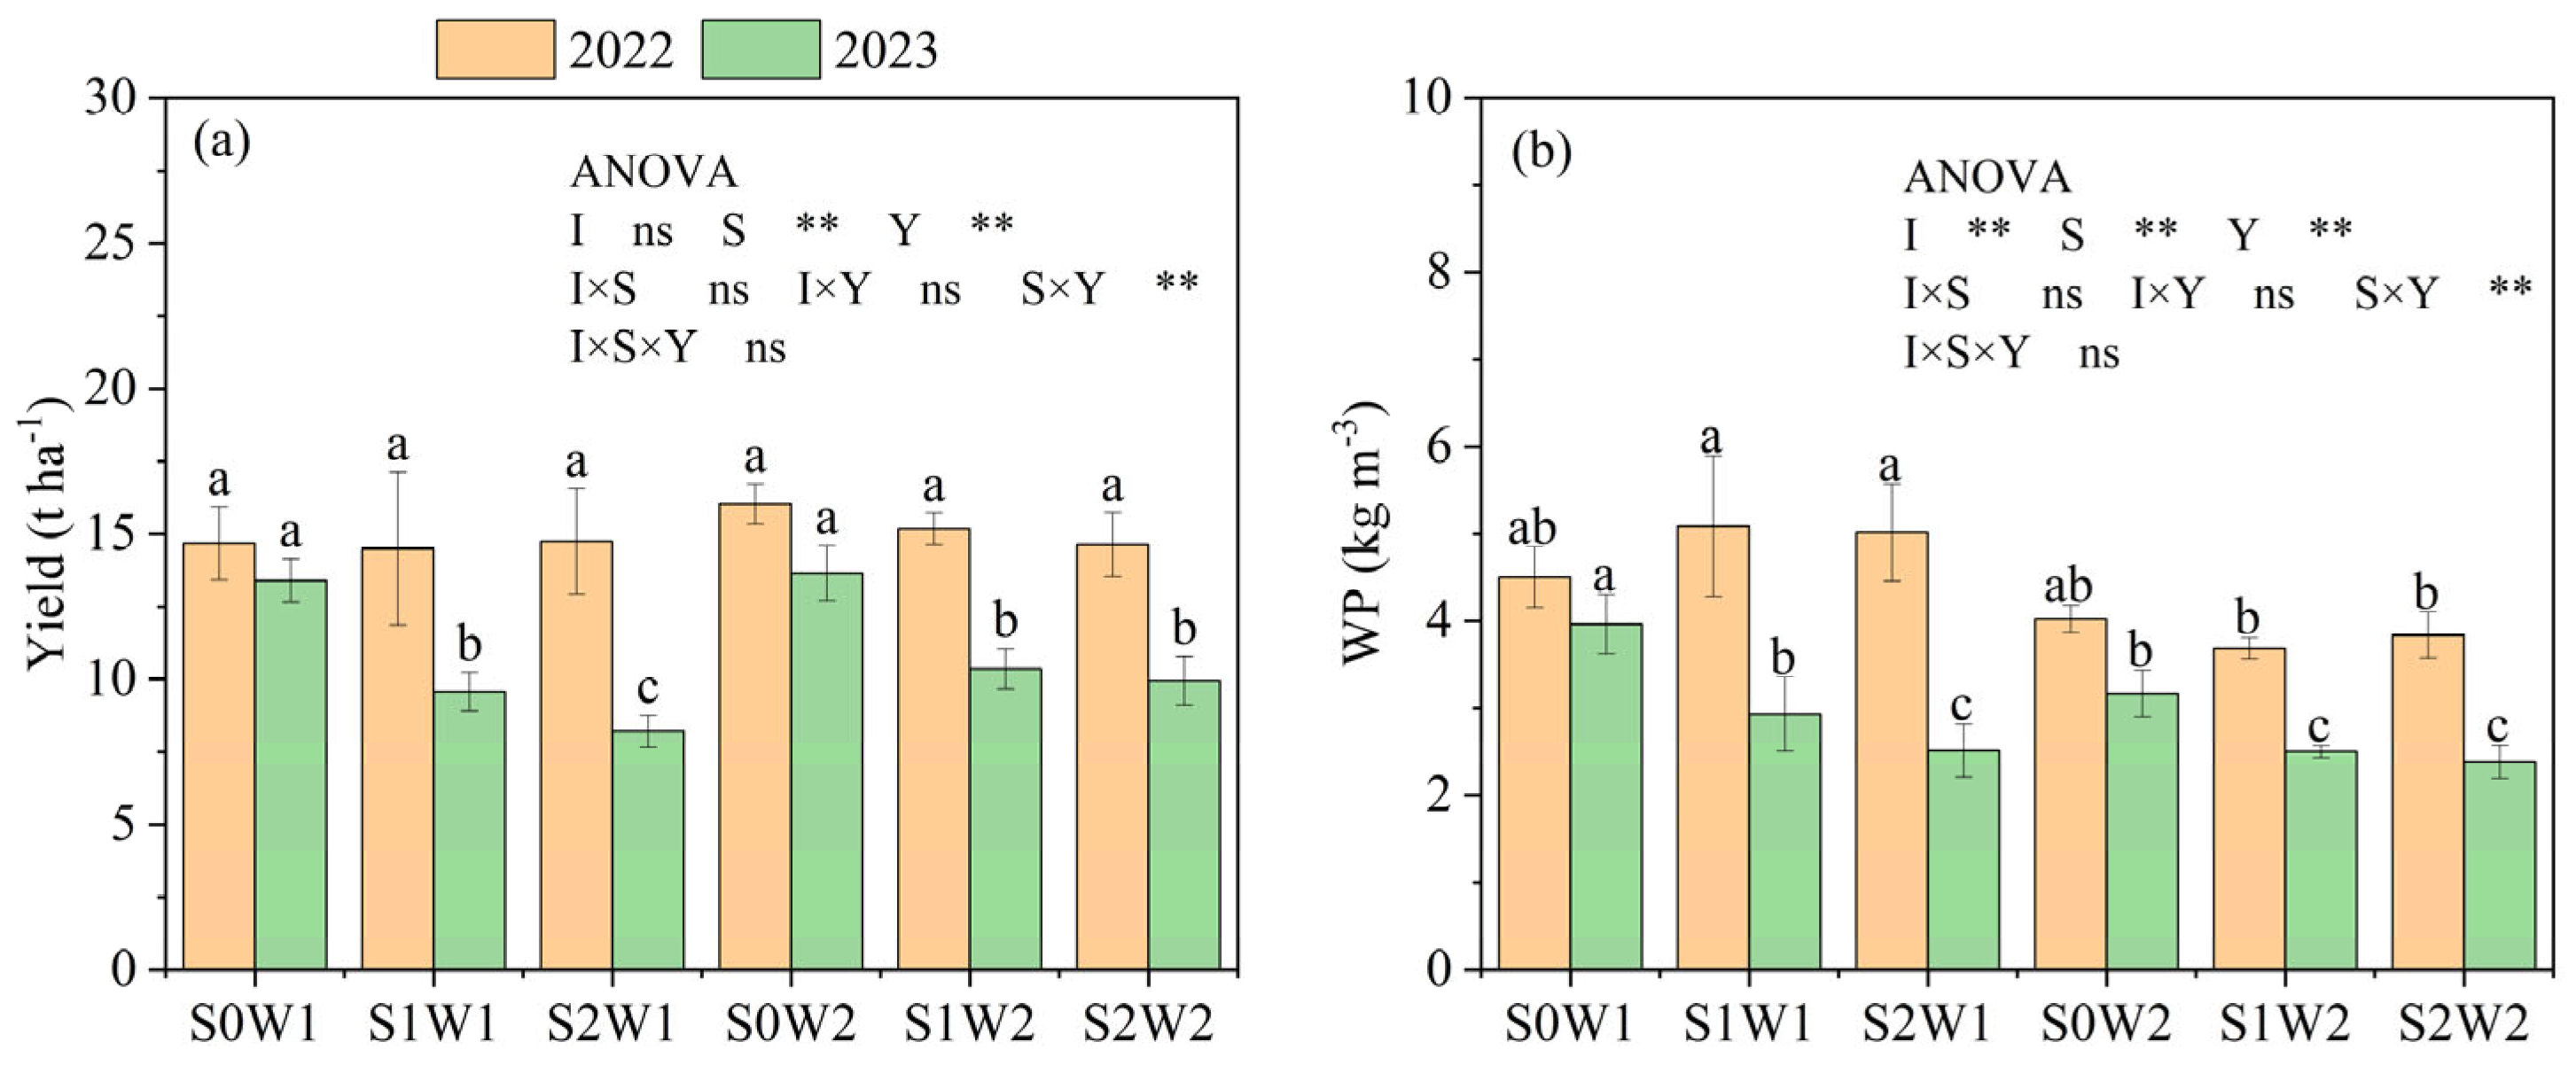
3.5. Maize Yield and Water Productivity

Figure 11 illustrates the effect of varying irrigation water quantity and quality on maize yield and WP. For the same irrigation volume, yield tended to decrease as the irrigation water salinity increased in both 2022 and 2023. At the same irrigation water salinity level, maize yield increased with higher irrigation volumes. The brackish water treatments (S1 and S2) resulted in a 3.35–35.1% and 4.32–40.9% reduction in yield, respectively, compared to freshwater irrigation (S0). While deficit irrigation (W1) resulted in a 4.20–8.14% reduction in yield compared to full irrigation (W2), The highest yield was observed in the S0W2 treatment. ANOVA results indicated that maize yield was significantly influenced by both irrigation mineralization and inter-annual variability.
WP decreased with increasing irrigation salinity and irrigation volume, except for deficit irrigation (W1) in 2022. In 2022, WP under deficit irrigation (W1) gradually increased with increasing irrigation water salinity. This increase was 12.99% and 11.41% in S1W1 and S2W1, respectively, compared to S0W1. In all treatments, Full irrigation (W2) resulted in a 16.28% decrease in WP compared to deficit irrigation (W1). Brackish water treatments (S1 and S2) increased WP by 1.96–2.57% in 2022 compared to freshwater irrigation (S0), respectively. However, in 2023, they decreased by 23.89–31.34%, with the highest WP observed in the S0W1 treatment. ANOVA results indicated that maize WP was significantly influenced by irrigation water volume, water mineralization, and inter-annual variability.

3.6. Direct Correlation Coefficients Between Maize Yield and Growth Indicators

The path analysis results of growth indicators and yield for different treatments are presented in Table 2. The correlation coefficients of the four growth indicators with yield were ranked as PH > SD > LAI > DMA. PH had the largest direct path coefficient, followed by SD. LAI and DMA exhibited negative path coefficients, with DMA having the smallest direct path coefficient but the largest indirect path coefficient, followed by LAI and SD. The decision coefficients showed that, of all measured growth indicators, PH exhibited the strongest relationship with yield, although other factors such as LAI, SD, and DMA also contributed.
The impact of soil water, heat, and salt conditions on growth indicators was also analyzed. SSC showed a negative correlation with all four growth indicators. SSC exhibited the largest direct path coefficient and the highest coefficient of determination for PH, LAI, and DMA, indicating that soil salinity was the most significant factor affecting PH, LAI, and DMA. SWC exhibited the largest direct path coefficient and the highest coefficient of determination for SD, suggesting that SWC was the key determinant of SD. Therefore, irrigation water quantity and quality play a crucial role in influencing maize growth in arid regions.

4. Discussion

4.1. Effects of Brackish Water Deficit Irrigation on Soil Water Salinity

This study found that both irrigation water quantity and salinity play a crucial role in the distribution of soil water and salt. Irrigation volume and salinity significantly influenced soil water storage, with higher soil water storage induced by the increase in not only irrigation volume but also soil salinity (Figure 3 and Figure 4). These findings are consistent with previous studies of [36,37]. The underlying mechanism is that brackish water irrigation raises soil salinity, which in turn decreases the soil’s osmotic potential. This salt stress impairs root water uptake, leading to higher soil water retention at the root zone. Irrigation salinity and volume significantly affected soil salinity. Under brackish water irrigation, the increase in soil salinity was positively correlated with both irrigation salinity and the amount of brackish water applied, whereas under freshwater irrigation, soil salinity decreased with an increasing irrigation volume (Figure 3 and Figure 4). Furthermore, we observed differences in soil water and salinity distribution between the two years. The variation in soil moisture between brackish water and freshwater irrigation was significantly higher in 2022 than in 2023, while the difference in soil salinity was lower in 2022 than in 2023. These differences can be attributed to variations in meteorological factors, with 175 mm of rainfall in 2022 compared to 66.6 mm in 2023 (Figure 1), as well as the increased range of irrigation water salinity in 2023. Soil water storage varied more in the drip irrigation zones than in the bare soil areas, while soil salinity was lower in the drip irrigation zones. This is because freshwater irrigation (S0) created a desalination zone in the mulched areas of the shallow soil, while a salt accumulation zone formed in the bare soil. The desalination zone expanded with increasing irrigation volume, as the film mulching reduced surface soil moisture evaporation and inhibited the migration of salts to the surface, whereas salt content increased in the uncovered areas. These results are consistent with those of [38,39].
The relatively large error bars in the soil water–salt data likely result from several factors, including uneven distribution from the drip irrigation system, soil heterogeneity, interactions between water and salt content, environmental fluctuations, and potential issues with experimental design and sampling. We recommend optimizing the drip irrigation system, increasing experimental replications, standardizing soil sampling methods, and controlling environmental variations during data analysis in future studies to reduce data variability and enhance the reliability of results.

4.2. Effect of Brackish Water Deficit Irrigation on Soil Temperature

Soil temperature is a crucial factor influencing crop growth. Our findings show that irrigation water volume and salinity significantly influence soil temperature variations. Irrigation water volume influenced soil water storage, showing that higher irrigation volumes resulted in wetter soils with greater heat capacity, which slowed the rise in soil temperature during the day, whereas lower irrigation volumes allowed for rapid warming [40]. It is also related to the fact that the irrigation water comes from cooler groundwater. Conversely, water deficit (W1) restricted crop growth, reduced canopy cover, and allowed larger solar radiation to reach the soil, resulting in greater temperature fluctuations compared to full irrigation (W2). Additionally, increased irrigation water salinity raised soil salinity, causing salt stress and limiting crop growth. This promoted rapid soil warming during the day, but the higher salinity also increased soil water storage, leading to a slower temperature rise. This may account for the larger temperature increase in S1 relative to S0 and the smaller difference observed with S2.

4.3. Effects of Brackish Water Deficit Irrigation on Growth, Yield, and WP of Maize

The results of this study indicated that both irrigation water quantity and salinity significantly influenced crop growth and WP. PH, SD, LAI, DMA, and yield were highest under full freshwater irrigation (S0W2), but irrigation water salinity significantly suppressed these growth indicators (Figure 10 and Figure 11). These findings are consistent with patterns of crop growth under water and salt stress reported by [41]. This effect was more pronounced in 2023, a dry year. In relatively dry years, irrigation plays a critical role in maintaining crop growth, as it requires higher volumes of irrigation water, which increases salt inputs. The combined pressures of water and salt stress lead to more pronounced suppression of crop growth.
Brackish water irrigation (S1, S2) significantly reduced maize yield and WP compared with freshwater irrigation (S0), particularly in 2023. These results are consistent with [42] reported findings on maize yield under saline irrigation. However, WP increased under deficit irrigation with brackish water (Figure 11b). This can be explained by the fact that a slight water and salt stress decreased evapotranspiration and increased WP via osmotic adjustment and regulation of stomatal conductance. Additionally, soil water, heat, and salt conditions may have coupled impacts on crop growth. For example, drought stress is typically accompanied by heat stress on crops, and drought also often leads to salt stress due to the upward migration of salts to the surface soil by strong evaporation effect. Elevated soil temperatures, in turn, lead to higher crop transpiration, which exacerbates water stress conditions. Increased salt concentration inhibits root water uptake, leading to physiological drought in the plant, which ultimately reduces yield.

4.4. Effect of Soil Water–Heat–Salt Conditions on Growth and Yield of Maize

As shown in Table 2, pH had the most positive effect on crop yield, followed by SD and DMA. In contrast, LAI showed a negative relationship with yield. This may be due to the fact that PH directly determines the spatial distribution of leaves, and taller plants tend to have a higher photosynthetic rate [43]. In contrast, a larger LAI indicates that the crop undergoes more nutrient growth, which detracts from yield formation [44]. Irrigation water quantity and salinity affect soil water, heat, and salt conditions, which varies significantly based on the irrigation method and frequency [45]. We found that SSC was the primary factor affecting PH (Table 3), with maize being particularly sensitive to and more affected by salt stress [46,47]. The reduction in transpiration rate was more pronounced under salt stress than under drought stress [48]. Additionally, SSC was the primary factor affecting LAI and DMA. Under drought stress, maize mitigates stress by reducing stomatal conductance to limit transpiration [49]. In contrast, under salt stress, the higher Na+ concentration in the soil decreased the soil osmotic potential, preventing maize roots from absorbing water and inhibiting nutrient uptake, particularly for K+. This disrupts the ionic balance within plant cells, leading to increased osmotic stress and cytotoxicity [50,51]. The most influential factor on SD is SWC, as it directly affects cell expansion pressure, which determines cell elongation and growth [52]. In contrast, salinity influences plant growth indirectly by altering osmotic potential and ionic balance [53] (Li et al., 2023a), while temperature affects the plant’s physiological metabolic rate [54] (Taylor et al., 1998). This indicates that changes in soil salinity induced by deficit irrigation with brackish water are the most critical factor affecting maize yield, with soil salinity being influenced by both irrigation water volume and salinity. Therefore, when using brackish water for irrigation in arid zones, its impact on soil salinity should be carefully considered. Among crop growth indicators, PH is a key determinant of yield, with the nodulation period being the critical fertility stage that influences maize plant height. Consequently, brackish water irrigation during the nodulation stage is not recommended to maintain stable maize yields. The highest yield was achieved with S0W2 (100%I, 0.7 g L−1), but comprehensively considering water productivity, maize yield, and water-saving benefits, we recommend the S0W1 (75%I, 0.7 g L−1) treatment. Specifically, the irrigation volume was 75% of the standard, the salinity of the irrigation water did not exceed 3.7 g L−1, and brackish water irrigation was applied after the jointing stage.

5. Conclusions

In this study, we explored the response of soil water–heat–salt dynamics, maize growth and yield, and water productivity to irrigation volume and irrigation salinity under film-mulched drip irrigation in maize farmland of an arid region. Irrigation with brackish water (S1 and S2) increased soil salinity, keeping the soil water storage at higher levels, and it inhibited maize growth and reduced maize yield and WP. Deficit irrigation reduced both soil salt inputs and soil water storage for brackish irrigation relative to full irrigation, further inhibiting maize growth and yield but increasing WP. Path analysis indicated that soil salinity condition was critical for crop plant height and were a major influence on maize yield. A recommended irrigation rate of 75%I and irrigation salinity of no more than 3.7 g L−1 as well as brackish water irrigation after the jointing stage will lead to better-maintained maize yields and increased WP.

Author Contributions

Conceptualization, T.G. and X.M.; methodology, T.G.; data curation, X.H.; writing—original draft, T.G.; writing—review and editing, X.M.; visualization, T.G.; supervision, X.M.; project administration, X.M.; funding acquisition, X.M.; Data curation, K.F. All authors have read and agreed to the published version of the manuscript.

Funding

This work was supported by the National Key Research and Development Program (2021YFD1900801) and National Natural Science Foundation of China Yellow River Water Science Research Joint Fund (U2443209).

Data Availability Statement

Data is contained within the article.

Conflicts of Interest

The authors declare no conflicts of interest.

References

  1. Cheng, M.; Wang, H.; Fan, J.; Wang, X.; Sun, X.; Yang, L.; Zhang, S.; Xiang, Y.; Zhang, F. Crop yield and water productivity under salty water irrigation: A global meta-analysis. Agric. Water Manag. 2021, 256, 107105. [Google Scholar] [CrossRef]
  2. Jiang, Q.; Peng, J.; Biswas, A.; Hu, J.; Zhao, R.; He, K.; Shi, Z. Characterising dryland salinity in three dimensions. Sci. Total Environ. 2019, 682, 190–199. [Google Scholar] [CrossRef] [PubMed]
  3. van Zelm, E.; Zhang, Y.; Testerink, C. Salt Tolerance Mechanisms of Plants. Annu. Rev. Plant Biol. 2020, 71, 403–433. [Google Scholar] [CrossRef] [PubMed]
  4. Ray, D.K.; Mueller, N.D.; West, P.C.; Foley, J.A. Yield Trends Are Insufficient to Double Global Crop Production by 2050. PLoS ONE 2013, 8, e66428. [Google Scholar] [CrossRef] [PubMed]
  5. Dong, X.; Wang, J.; Zhang, X.; Dang, H.; Singh, B.P.; Liu, X.; Sun, H. Long-term saline water irrigation decreased soil organic carbon and inorganic carbon contents. Agric. Water Manag. 2022, 270, 107760. [Google Scholar] [CrossRef]
  6. Wang, H.; Zheng, C.; Ning, S.; Cao, C.; Li, K.; Dang, H.; Wu, Y.; Zhang, J. Impacts of long-term saline water irrigation on soil properties and crop yields under maize-wheat crop rotation. Agric. Water Manag. 2023, 286, 108383. [Google Scholar] [CrossRef]
  7. Wei, K.; Zhang, J.; Wang, Q.; Guo, Y.; Mu, W. Irrigation with ionized brackish water affects cotton yield and water use efficiency. Ind. Crops Prod. 2022, 175, 114244. [Google Scholar] [CrossRef]
  8. Beltrano, J.; Ruscitti, M.; Arango, M.C.; Ronco, M. Effects of arbuscular mycorrhiza inoculation on plant growth, biological and physiological parameters and mineral nutrition in pepper grown under different salinity and p levels. J. Soil Sci. Plant Nutr. 2013, 13, 123–141. [Google Scholar] [CrossRef]
  9. Bai, Y.; Zhang, T.; Zhai, Y.; Shen, X.; Ma, X.; Zhang, R.; Ji, C.; Hong, J. Water footprint coupled economic impact assessment for maize production in China. Sci. Total Environ. 2021, 752, 141963. [Google Scholar] [CrossRef]
  10. Kisekka, I.; Schlegel, A.; Ma, L.; Gowda, P.H.; Prasad, P.V.V. Optimizing preplant irrigation for maize under limited water in the High Plains. Agric. Water Manag. 2017, 187, 154–163. [Google Scholar] [CrossRef]
  11. Wang, F.; Meng, H.; Xie, R.; Wang, K.; Ming, B.; Hou, P.; Xue, J.; Li, S. Optimizing deficit irrigation and regulated deficit irrigation methods increases water productivity in maize. Agric. Water Manag. 2023, 280, 108205. [Google Scholar] [CrossRef]
  12. He, Q.; Li, S.; Kang, S.; Yang, H.; Qin, S. Simulation of water balance in a maize field under film-mulching drip irrigation. Agric. Water Manag. 2018, 210, 252–260. [Google Scholar] [CrossRef]
  13. Ma, K.; Wang, Z.; Li, H.; Wang, T.; Chen, R. Effects of nitrogen application and brackish water irrigation on yield and quality of cotton. Agric. Water Manag. 2022, 264, 107512. [Google Scholar] [CrossRef]
  14. Ma, Z.; Liu, J.; Zhang, J.; Yin, F.; Guo, L.; Wen, Y.; Song, L.; Zhu, Y.; Liang, Y.; Wang, Z. Ultra-wide film mulching with moderate irrigation water salinity enhances cotton growth under drip irrigation in Xinjiang, China. Field Crops Res. 2024, 315, 109485. [Google Scholar] [CrossRef]
  15. Yavuz, D.; Kılıç, E.; Seymen, M.; Dal, Y.; Kayak, N.; Kal, Ü.; Yavuz, N. The effect of irrigation water salinity on the morph-physiological and biochemical properties of spinach under deficit irrigation conditions. Sci. Hortic. 2022, 304, 111272. [Google Scholar] [CrossRef]
  16. Ren, F.; Yang, G.; Li, W.; He, X.; Gao, Y.; Tian, L.; Li, F.; Wang, Z.; Liu, S. Yield-compatible salinity level for growing cotton (Gossypium hirsutum L.) under mulched drip irrigation using saline water. Agric. Water Manag. 2021, 250, 106859. [Google Scholar] [CrossRef]
  17. Wang, X.; Yang, J.; Liu, G.; Yao, R.; Yu, S. Impact of irrigation volume and water salinity on winter wheat productivity and soil salinity distribution. Agric. Water Manag. 2015, 149, 44–54. [Google Scholar] [CrossRef]
  18. Yuan, C.; Feng, S.; Huo, Z.; Ji, Q. Effects of deficit irrigation with saline water on soil water-salt distribution and water use efficiency of maize for seed production in arid Northwest China. Agric. Water Manag. 2019, 212, 424–432. [Google Scholar] [CrossRef]
  19. Qiu, Y.; Fan, Y.; Chen, Y.; Hao, X.; Li, S.; Kang, S. Response of dry matter and water use efficiency of alfalfa to water and salinity stress in arid and semiarid regions of Northwest China. Agric. Water Manag. 2021, 254, 106934. [Google Scholar] [CrossRef]
  20. Hu, Y.; Li, X.; Jin, M.; Wang, R.; Chen, J.; Guo, S. Reduced co-occurrence and ion-specific preferences of soil microbial hub species after ten years of irrigation with brackish water. Soil Tillage Res. 2020, 199, 104599. [Google Scholar] [CrossRef]
  21. Wang, Z.; Li, Z.; Zhan, H.; Yang, S. Effect of long-term saline mulched drip irrigation on soil-groundwater environment in arid Northwest China. Sci. Total Environ. 2022, 820, 153222. [Google Scholar] [CrossRef] [PubMed]
  22. Paltineanu, C.; Chitu, E. Climate change impact on phenological stages of sweet and sour cherry trees in a continental climate environment. Sci. Hortic. 2020, 261, 109011. [Google Scholar] [CrossRef]
  23. Schuster, C.; Estrella, N.; Menzel, A. Shifting and extension of phenological periods with increasing temperature along elevational transects in southern Bavaria. Plant Biol. 2014, 16, 332–344. [Google Scholar] [CrossRef] [PubMed]
  24. McMaster, G.S.; Wilhelm, W.W. Is soil temperature better than air temperature for predicting winter wheat phenology? Agronomy 1998, 90, 602–607. [Google Scholar] [CrossRef]
  25. Xiao, C.; Ji, Q.; Zhang, F.; Li, Y.; Fan, J.; Hou, X.; Yan, F.; Liu, X.; Gong, K. Effects of various soil water potential thresholds for drip irrigation on soil salinity, seed cotton yield and water productivity of cotton in northwest China. Agric. Water Manag. 2023, 279, 108172. [Google Scholar] [CrossRef]
  26. Gong, X.; Qiu, R.; Sun, J.; Ge, J.; Li, Y.; Wang, S. Evapotranspiration and crop coefficient of tomato grown in a solar greenhouse under full and deficit irrigation. Agric. Water Manag. 2020, 235, 106154. [Google Scholar] [CrossRef]
  27. Gao, J.; Liu, N.; Wang, X.; Niu, Z.; Liao, Q.; Ding, R.; Du, T.; Kang, S.; Tong, L. Maintaining grain number by reducing grain abortion is the key to improve water use efficiency of maize under deficit irrigation and salt stress. Agric. Water Manag. 2024, 294, 108727. [Google Scholar] [CrossRef]
  28. Wang, W.; Rong, Y.; Dai, X.; Zhang, C.; Wang, C.; Huo, Z. Variation and attribution of energy distribution for salinized sunflower farmland in arid area. Agric. Water Manag. 2024, 297, 108833. [Google Scholar] [CrossRef]
  29. Ding, R.S.; Kang, S.Z.; Li, F.S.; Zhang, Y.Q.; Tong, L. Evapotranspiration measurement and estimation using modified Priestley-Taylor model in an irrigated maize field with mulching. Agric. Meteorol. 2013, 168, 140–148. [Google Scholar] [CrossRef]
  30. Huo, Z.; Feng, S.; Kang, S.; Dai, X.; Li, W.; Chen, S. The Response of Water-Land Environment to Human Activities in Arid Minqin Oasis, Northwest China. Arid Soil Res. Rehabil. 2007, 21, 21–36. [Google Scholar] [CrossRef]
  31. Zhang, W.; Zhu, G.; Zhao, L.; Wang, L.; Qiu, D.; Ye, L.; Lu, S.; Lin, X. Quantifying the changes in solute transport caused by human influence on river connectivity in inland river basins. CATENA 2024, 246, 108360. [Google Scholar] [CrossRef]
  32. Liao, Q.; Ding, R.; Du, T.; Kang, S.; Tong, L.; Li, S. Salinity-specific stomatal conductance model parameters are reduced by stomatal saturation conductance and area via leaf nitrogen. Sci. Total Environ. 2023, 876, 162584. [Google Scholar] [CrossRef] [PubMed]
  33. Chen, Y.; Wang, L.; Tong, L.; Hao, X.; Ding, R.S.; Kang, S.Z.; Li, S. Effects of biochar addition and deficit irrigation with brackish water on yield-scaled N2O emissions under drip irrigation with mulching. Agric. Water Manag. 2023, 277, 108129. [Google Scholar] [CrossRef]
  34. Haraguchi, T.; Marui, A.; Mori, K.; Nokano, Y. Movement of water collected by bgetables in pastic-mulching field. J. Fac. Agric. Kyushu Univ. 2003, 48, 237–245. [Google Scholar] [CrossRef]
  35. Wang, Q.; Huo, Z.; Zhang, L.; Wang, J.; Zhao, Y. Impact of saline water irrigation on water use efficiency and soil salt accumulation for spring maize in arid regions of China. Agric. Water Manag. 2016, 163, 125–138. [Google Scholar] [CrossRef]
  36. Han, W.; Jia, J.; Hu, Y.; Liu, J.; Guo, J.; Shi, Y.; Huo, H.; Gong, H. Maintenance of root water uptake contributes to salt-tolerance of a wild tomato species under salt stress. Arch. Agron. Soil Sci. 2021, 67, 205–217. [Google Scholar] [CrossRef]
  37. Wang, Q.; Huo, Z.; Feng, S.; Yuan, C.; Wang, J. Comparison of Spring Maize Root Water Uptake Models Under Water and Salinity Stress Validated with Field Experiment Data. Irrig. Drain. 2015, 64, 669–682. [Google Scholar] [CrossRef]
  38. Li, Y.; Yu, Q.; Ning, H.; Gao, Y.; Sun, J. Simulation of soil water, heat, and salt adsorptive transport under film mulched drip irrigation in an arid saline-alkali area using HYDRUS-2D. Agric. Water Manag. 2023, 290, 108585. [Google Scholar] [CrossRef]
  39. Qi, Z.; Feng, H.; Zhao, Y.; Zhang, T.; Yang, A.; Zhang, Z. Spatial distribution and simulation of soil moisture and salinity under mulched drip irrigation combined with tillage in an arid saline irrigation district, northwest China. Agric. Water Manag. 2018, 201, 219–231. [Google Scholar] [CrossRef]
  40. Quan, H.; Feng, H.; Zhang, T.; Wu, L.; Dong, Q.; Siddique, K.H.M. Response of soil water, temperature, and maize productivity to different irrigation practices in an arid region. Soil Tillage Res. 2024, 237, 105962. [Google Scholar] [CrossRef]
  41. Amer, K.H. Corn crop response under managing different irrigation and salinity levels. Agric. Water Manag. 2010, 97, 1553–1563. [Google Scholar] [CrossRef]
  42. Liao, Q.; Ding, R.; Du, T.; Kang, S.; Tong, L.; Gu, S.; Gao, S.; Gao, J. Stomatal conductance modulates maize yield through water use and yield components under salinity stress. Agric. Water Manag. 2024, 294, 108717. [Google Scholar] [CrossRef]
  43. Tahjib-Ul-Arif, M.; Siddiqui, M.N.; Sohag, A.A.M.; Sakil, M.A.; Rahman, M.M.; Polash, M.A.S.; Mostofa, M.G.; Tran, L.-S.P. Salicylic Acid-Mediated Enhancement of Photosynthesis Attributes and Antioxidant Capacity Contributes to Yield Improvement of Maize Plants Under Salt Stress. J. Plant Growth Regul. 2018, 37, 1318–1330. [Google Scholar] [CrossRef]
  44. Chen, X.; Qi, Z.; Gui, D.; Sima, M.W.; Zeng, F.; Li, L.; Li, X.; Feng, S. Responses of cotton photosynthesis and growth to a new irrigation control method under deficit irrigation. Field Crops Res. 2022, 275, 108373. [Google Scholar] [CrossRef]
  45. Jiang, J.; Huo, Z.; Feng, S.; Zhang, C. Effect of irrigation amount and water salinity on water consumption and water productivity of spring wheat in Northwest China. Field Crops Res. 2012, 137, 78–88. [Google Scholar] [CrossRef]
  46. Leogrande, R.; Vitti, C.; Lopedota, O.; Ventrella, D.; Montemurro, F. Effects of Irrigation Volume and Saline Water On Maize Yield and Soil in Southern Italy. Irrig. Drain. 2016, 65, 243–253. [Google Scholar] [CrossRef]
  47. Luo, M.; Zhao, Y.; Zhang, R.; Xing, J.; Duan, M.; Li, J.; Wang, N.; Wang, W.; Zhang, S.; Chen, Z.; et al. Mapping of a major QTL for salt tolerance of mature field-grown maize plants based on SNP markers. BMC Plant Biol. 2017, 17, 140. [Google Scholar] [CrossRef]
  48. Hütsch, B.W.; Jung, S.; Schubert, S. Comparison of Salt and Drought-Stress Effects on Maize Growth and Yield Formation with Regard to Acid Invertase Activity in the Kernels. J. Agron. Crop Sci. 2015, 201, 353–367. [Google Scholar] [CrossRef]
  49. Liao, Q.; Gu, S.; Kang, S.; Du, T.; Tong, L.; Wood, J.D.; Ding, R. Mild water and salt stress improve water use efficiency by decreasing stomatal conductance via osmotic adjustment in field maize. Sci. Total Environ. 2022, 805, 150364. [Google Scholar] [CrossRef]
  50. Gao, Y.; Lu, Y.; Wu, M.; Liang, E.; Li, Y.; Zhang, D.; Yin, Z.; Ren, X.; Dai, Y.; Deng, D.; et al. Ability to Remove Na+ and Retain K+ Correlates with Salt Tolerance in Two Maize Inbred Lines Seedlings. Front. Plant Sci. 2016, 7, 1716. [Google Scholar] [CrossRef]
  51. Zhang, T.; Ji, X.; Zhan, X.; Ding, Y.; Zou, Y.; Kisekka, I.; Chau, H.W.; Feng, H. Maize is stressed by salt rather than water under drip irrigation with soil matric potential higher than −50 kPa in an arid saline area. J. Agron. Crop Sci. 2021, 207, 654–668. [Google Scholar] [CrossRef]
  52. Frensch, J.; Hsiao, T.C. Transient Responses of Cell Turgor and Growth of Maize Roots as Affected by Changes in Water Potential. Plant Physiol. 1994, 104, 247–254. [Google Scholar] [CrossRef] [PubMed]
  53. Li, J.; Zhu, Q.; Jiao, F.; Yan, Z.; Zhang, H.; Zhang, Y.; Ding, Z.; Mu, C.; Liu, X.; Li, Y.; et al. Research Progress on the Mechanism of Salt Tolerance in Maize: A Classic Field That Needs New Efforts. Plants 2023, 12, 2356. [Google Scholar] [CrossRef] [PubMed]
  54. Taylor, D.K.; Rank, D.R.; Keiser, D.R.; Smith, B.N.; Criddle, R.S.; Hansen, L.D. Modelling temperature effects on growth–respiration relations of maize. Plant Cell Environ. 1998, 21, 1143–1151. [Google Scholar] [CrossRef]
Figure 1. Daily maximum and minimum temperatures, precipitation, and full irrigation amount during the growing seasons of maize in 2022 and 2023.
Agronomy 15 00379 g001
Figure 2. Schematic of planting patterns and sampling points.
Agronomy 15 00379 g002
Figure 3. Soil water storage at different irrigation salinities with the same irrigation amount for drip line and bare soil (0–1m). (SWSFC, soil water storage at field capacity; SWSPWP, soil water storage at permanent wilting point).
Agronomy 15 00379 g003
Figure 4. Soil water storage at different irrigation amount with the same irrigation salinities for drip line and bare soil (0–1 m). (SWSFC, soil water storage at field capacity; SWSPWP, soil water storage at permanent wilting point).
Agronomy 15 00379 g004
Figure 5. Soil salt content at different irrigation salinities with the same irrigation amount for drip line and bare soil (0–1 m).
Agronomy 15 00379 g005
Figure 6. Soil salt content at different irrigation amount with the same irrigation salinities for drip line and bare soil (0–1 m).
Agronomy 15 00379 g006
Figure 7. Distribution of ΔS for different soil layers and locations (ΔS, the difference between soil salinity at the end and the beginning of the crop growth period).
Agronomy 15 00379 g007
Figure 8. Changes in mean soil temperature between different soil depths during the growing season under different irrigation levels and salinity treatments in 2022 and 2023.
Agronomy 15 00379 g008
Figure 9. Changes in mean soil temperature during the growing season under different irrigation levels and salinity treatments in 2022 and 2023.
Agronomy 15 00379 g009
Figure 10. Plant height, stem diameter, leaf area index, and dry matter accumulation in 2022 and 2023 under different irrigation levels and salinity treatments. Note: ‘ns’ indicates non-significant, ‘*’ denotes significant (p < 0.05), and ‘**’ represents highly significant (p < 0.01), while other letters (e.g., a, b, c) represent different groups with varying significance levels.
Agronomy 15 00379 g010
Figure 11. Crop yield and water productivity in 2022 and 2023. Note: ‘ns’ indicates non-significant, and ‘**’ represents highly significant (p < 0.01), while other letters (e.g., a, b, c) represent different groups with varying significance levels.
Agronomy 15 00379 g011
Table 1. Fundamental physical properties of soil.
Soil DepthSoil Particle Size Distribution (%)Soil TextureSoil Bulk Density
(g cm−3)
Field Capacity
(cm3 cm−3)
Saturated Water Content
(cm3 cm−3)
Wilting Point
(cm3 cm−3)
Sand
(0.05–2 mm)
Silt
(0.05–0.002 mm)
Clay
(<0.002 mm)
0–20 cm27.1563.589.27Silty loam1.530.280.420.074
20–40 cm30.1760.419.42Silty loam1.480.310.460.096
40–60 cm17.9271.1210.96Silty loam1.460.340.470.075
60–80 cm16.9773.049.99Silty loam1.580.340.460.096
80–100 cm35.1757.077.76Silty loam1.500.360.510.097
Table 2. Results of path analysis of maize yield in relation to plant height, stem diameter, leaf area index, and dry matter accumulation.
Growth IndicatorsPearson Correlation CoefficientDirect Path CoefficientIndirect Path CoefficientDecision Coefficient
TotalPHSDLAIDMA
PH0.8430.886−0.043 0.027−0.0800.0100.709
SD0.4060.0660.3140.362 −0.046−0.0030.050
LAI0.272−0.1680.4400.4240.008 −0.009−0.120
DMA−0.192−0.053−0.138−0.1700.004−0.028 0.018
Table 3. Results of path analysis on plant height, stem diameter, leaf area index, dry matter accumulation, and soil water, heat, and salt conditions.
Growth IndicatorsFactorsPearson Correlation CoefficientDirect Path CoefficientIndirect Path CoefficientDecision Coefficient
TotalSWCSTSCC
PHSWC−0.451−0.312−0.139 0.081−0.2190.184
ST−0.362−0.264−0.0980.095 −0.1940.121
SSC−0.783−0.576−0.208−0.119−0.089 0.570
SDSWC−0.544−0.759−0.265 −0.141−0.1240.250
ST0.1720.4630.1220.231 −0.109−0.055
SSC−0.215−0.325−0.134−0.2890.156 0.034
LAISWC−0.339−0.066−0.379 −0.166−0.2130.040
ST0.0260.544−0.1680.002 −0.188−0.268
SSC−0.520−0.5600.158−0.0250.183 0.269
DMASWC0.1030.251−0.148 0.078−0.226−0.011
ST−0.533−0.257−0.276−0.077 −0.2000.208
SSC−0.585−0.5940.0090.096−0.086 0.342
Disclaimer/Publisher’s Note: The statements, opinions and data contained in all publications are solely those of the individual author(s) and contributor(s) and not of MDPI and/or the editor(s). MDPI and/or the editor(s) disclaim responsibility for any injury to people or property resulting from any ideas, methods, instructions or products referred to in the content.

