Article

Zero-Tillage Induces Reduced Bio-Efficacy Against Weed Species Amaranthus retroflexus L. Dependent on Atrazine Formulation

by
D. Luke R. Wardak
1,*,
Faheem N. Padia
2,
Martine I. de Heer
2,
Craig J. Sturrock
1 and
Sacha J. Mooney
1
1
Division of Agriculture and Environmental Sciences, School of Biosciences, University of Nottingham, Sutton Bonington, Loughborough LE12 5RD, UK
2
Jealotts Hill Research Centre, Syngenta Ltd., Bracknell RG42 6EY, UK
*
Author to whom correspondence should be addressed.
Agronomy 2025, 15(2), 360; https://doi.org/10.3390/agronomy15020360
Submission received: 9 December 2024 / Revised: 25 January 2025 / Accepted: 27 January 2025 / Published: 30 January 2025
(This article belongs to the Special Issue Weed Management and Herbicide Efficacy Based on Future Climates)

Abstract

:
Zero-tillage (ZT) is a conservation soil management approach which relies more heavily on herbicide application for weed control than in ploughed soil. Changes in soil management can influence the structure and organisation of pore space in soil, which drives changes in the transport of particulates and dissolved substances. Formulation of pesticides can be used to change the delivery of active ingredients to soil; however, it is currently unknown how changing the formulation of an herbicide can influence the transport properties between ZT vs. ploughing. We investigated the bioefficacy of two formulations of the herbicide atrazine, a pre- and post-emergence herbicide that inhibits photosystem II. Bioefficacy was assessed using physical measures and survival analysis of an early photosynthesis-dependent weed species, Amaranthus retroflexus L., over time, and soil pore network structure was assessed by analysing three-dimensional images produced by X-ray Computed Tomography. Increasing the herbicide application rate generally improved bioefficacy, though it was reduced in soils managed under ZT. Under herbicide-treated ZT samples, survival time was higher, ranging from 13.4 to 18.2 days compared with 12.6 to 15.4 days in ploughed samples, the mean dry plant mass was higher, ranging from 0.5 to 2.5 mg compared with 0.05 to 0.68 mg in ploughed samples, and the mean total plant length was higher, ranging from 1.73 to 12.1 mm compared with 0.2 to 5.45 mm in ploughed samples. Changes in the soil pore network previously demonstrated to be indicators of preferential transport were correlated with measures of bioefficacy, including pore thickness and connectivity density. Reduced atrazine efficacy under ZT is problematic considering the inherent reliance on chemical methods for weed control, we suggest that pursuing formulation strategies to alleviate potential risks of loss via preferential transport may be fruitful.

1. Introduction

Across the United Kingdom (UK), the increasing legislative and industrial pressures to adopt conservation agricultural practices is pushing farmers to consider reducing or eliminating soil tillage [1,2]. One of the biggest challenges to the adoption of zero-tillage (ZT) is controlling weed pressure without mechanical means, which somewhat explains the low uptake in the UK and Europe [3,4]. One survey of pesticide usage in the UK shows slight increases in total herbicide application on arable cropland since 2014 [5], though this did not distinguish between pesticide practices across contrasting management schemes. However, despite advocates of conservation approaches promoting the reduction in pesticide usage through integrated pest management [6], European surveys report increased herbicide usage and costs associated with weed control under reduced tillage systems [7]. Further, there is no mention of tillage within the DEFRA [8] or DAERA [9] code of practice for using plant protection products. Yet under ‘Section 3.1.3 Choosing the right pesticide’, DEFRA [8], the code of practice states that it is essential to discuss with a qualified advisor to check that the product, among other things, “presents the least overall risk to… the environment (including surface water and groundwater)”. It is paramount then, if ZT does harbour increased pesticide leaching and groundwater contamination risks, that these are properly understood and can be demonstrated across a variety of relevant scales, soil types, and environmental conditions.
Pesticide behaviour in soil is well studied, with chemicals being modified or lost from the soil system depending on pesticide physico-chemistry, volatilisation, adsorption/desorption to residue and soil particles, photodegradation, chemical or microbial degradation, soil water content, particulate runoff, leaching, soil type/texture, and rainfall or flow rate under experimental conditions [10,11,12,13,14,15]. Adopting conservation practices can influence the need for pesticides by providing alternate pest, disease and weed pressures, and secondly, drive differences in soil physical and functional properties, which could impact the properties that govern pesticide performance, as outlined above [16]. For instance, Elias et al. [17] identified greater concentration and loads under ZT in their review of pesticide loss via runoff. Whereas Silburn [14] commented that, while results are mixed, retaining soil cover with ZT is typically effective at reducing losses via runoff. Hall et al. [18] showed that the runoff of herbicides including atrazine under ZT was lower than that under conventional tillage, but loss via leaching was up to six times greater. Elliott et al. [19] showed the amounts of six herbicides transported via leaching was higher following a ‘worst-case’ irrigation scenario in ZT when compared with conventional tillage, with greater transport of more soluble and less strongly adsorbed herbicides under ZT. Higher pesticide leaching under ZT may result from the emergent physical properties of the pore network in long-term undisturbed soil. For example, the generation and stabilisation of tubelike pores via biological activity under cover crops that act to provide preferential flow paths for the quicker vertical transport of solutes and suspended particles [20,21,22]. More soluble, less sorbing, soil-applied pesticides are therefore at an increased risk of loss by preferential transport, which tends to be increased under conservation approaches [10,13].
X-ray Computed Tomography (XRCT) has been used extensively to understand and quantify differences in imaged pore network structure across a variety of soils [23,24], including between soils under ZT and those under ploughing [25]. Relationships between structural properties of the imaged pore network and indicators of preferential transport, such as the 5%-arrival time of solute breakthrough curves, have been identified previously [26,27], and specifically in the experimental site used in our current study [22].
Atrazine interferes with the photosystem II protein complex, resulting in plant growth suppression, after which the plant experiences toxic effects of reactive radical accumulation that overwhelm the capacity of photo-protective components of the plant, resulting in severe damage and death [28]. However, atrazine has also been shown to exhibit effects as an endocrine disruptor in animals, with moderate risks of interfering with aquatic wildlife reproduction and development (see Ref: G 30027) [29,30]. Due to these potential hazards, atrazine is currently not authorised for use in plant protection products in Europe due to a failure to demonstrate required safe levels (<0.1 µg/L) of groundwater contamination in monitoring data [31]. Nevertheless, atrazine is still widely used in other parts of the world, including the US, where it ranked as the second highest most applied pesticide (39% by national cultivated area) after glyphosate (63%), but ranked the highest for pesticide losses, with 27% of the total amount applied lost from farm fields [32], likely due to its moderate soil mobility and persistence in the environment.
The transport of atrazine via leaching has been demonstrated using soil columns, with atrazine breakthrough curves showing indicators characteristic of preferential transport [32,33,34,35]. However, Motoya et al. [35] showed no effect of ZT in recovered atrazine concentrations from leached column effluent, and ultimately relate increased losses of atrazine to soils with higher organic matter, but comment that ZT soil breakthrough curves demonstrate earlier arrival times.
There are few studies which report the performance of alternate formulations of the same active ingredient [36,37,38], with both increases and decreases in atrazine losses under ZT. It is unclear what properties may induce these differences in formulation performance, so it is difficult to predict the effect of formulation on atrazine bio-efficacy. Considering the risks associated with environmental atrazine and its likelihood for leaching, as outlined above, combined with the tendency of eliminating tillage to enhance preferential flow, it is of great importance for the protection of environmental and human health to demonstrate a formulation of atrazine capable of reducing leaching risk under ZT while maintaining bioefficacy. It has been shown that small-seeded species, and specifically Amaranthus retroflexus L. (used in this study), are almost totally reliant on the photosynthetic role of cotyledons during seedling development [39] and thus represents an ideal target and problematic weed species [40] with which to investigate the efficacy of atrazine across different treatments.
Two formulations of atrazine, one particulate-based suspension concentrate (SC) currently licenced under the name AAtrex® 4L and one R&D solution-based emulsifiable concentrate (EC), were tested against a target weed species, A. retroflexus L. The plants were grown in undisturbed and repacked columns taken from an experimental field site that has previously demonstrated enhanced preferential flow under ZT. The following hypotheses were tested: (i) atrazine applied to samples taken from ZT soil will demonstrate reduced bio-efficacy, determined by the inhibition of the weed species A. retroflexus L. when compared with samples from ploughed soil, (ii) the bio-efficacy will not be different between the SC and EC formulation, and (iii) the bio-efficacy of atrazine will correlate with pore characteristics.

2. Materials and Methods

2.1. Site and Sampling

The sampling site consisted of a field trial in a randomised block design on the University of Nottingham experimental farm at Sutton Bonington, Leicestershire, UK (52°50′30.8″ N 1°15′16.4″ W, 39 m a.s.l.). All plots were established in 2014 from a previous history of ploughed cultivation, and subsequently managed with ZT, minimum tillage or ploughing. For samples used in this study, the crop residue was cut and retained on the surface of plots. The soil type is sandy loam from the Dunnington Heath Series (FAO Stagno Gleyic Luvisol). Conventional ploughing at a depth of 30 cm involved one pass of a 4-furrow Lemken Jewel plough followed by pressing with a Lemken VarioPack 110 furrow press (Lemken GmbH, Alpen, Germany). Minimum tillage used a David Brown 9-leg grubber cultivator, which disturbed the soil surface down to the depth of 10 cm. Zero-tillage soil plots were left uncultivated before seeding. The crop rotation for the previous 9 years on the site included winter wheat (2014), triticale (2015), beans (2016), winter wheat (2017, variety: Revelation), grass (2018), winter wheat (2019), winter wheat (2020, variety: Skyfall), faba beans (2021, variety: Tundra) and winter wheat (2022, variety: Champion). Further details on the site history and treatments, including a diagram of the plots can be found in Alskaf et al. [41] and in Alskaf [42]. A total of 64 undisturbed cores (noting that minimal disturbance is necessary during sampling) were collected on the 17th of October 2023, 1 week after tillage, 32 each from the ZT and ploughed treatments. Weather conditions immediately prior to sampling included 2 full days without rain to ensure adequate drainage from previous rainfall events, including 2 mm/h over 12 h on 12th October 2023. The cores were specially designed polyvinylchloride (PVC-U) tubes (64 mm ID, 68 mm OD, 110 mm length, RS Group plc, London, UK), where the cutting edge of the tube was sharpened to reduce the force required to push the columns into soil and reduce the disturbed soil area during sampling [43], and the inner surface was coated with petroleum jelly to reduce preferential flow along the column walls [44]. After positioning, a wooden block was placed on top of the core and gentle pressure was applied to push the core into the soil to distribute force more evenly across the column surface. Subsequently, cores were removed from the ground by excavating around the sample. Loose soil was collected in large sample bags from the minimum till treatment to provide soil material for the 32 repacked columns. Loose soil was air-dried for two days to a 1.8% water content, sieved to 2 mm, rehydrated to a 15% water content, and repacked to 1.25 g/cm3, which was higher than field bulk density (~1.0 g/cm3), to prevent soil slumping within the column. The bottom of each column was secured with nylon mesh to minimise particulate losses and stabilise soil. Columns were then saturated bottom-up over 6 h and allowed to drain via gravity for 72 h and then on paper towels for a further 72 h; they were then stored at 5 °C until XRCT scanning and solute breakthrough could take place. The moisture content before storage was not different to the moisture content after storage due to samples being covered with plastic film.

2.2. X-Ray CT Scanning and Image Processing

X-ray Computed Tomography (XRCT) was performed at the Hounsfield Facility, University of Nottingham using a v|tome|x M 240 kV dual-tube XRCT system (Waygate Technologies, Baker Hughes Company, Wunstorf, Germany). Of the 32 repacked columns, only 8 of the repacked columns were scanned, owing to the assumption that the imaged pore network would be consistent within the treatment. Scans were conducted in ‘Fast mode’ (single radiograph per projection, no image averaging), with each scan collecting 4444 projection images using an X-ray potential energy of 120 kV, a 170 μA current and a detector timing of 334 ms at a voxel resolution of 49 μm. The total scan time was 25 min per sample. The cores were reconstructed using Datos|x REC software (version 2, Waygate Technologies, Baker Hughes Company, Wunstorf, Germany). Volume data were automatically reconstructed using batch mode in 16-bit format, correcting for any sample movement, applying a beam hardening correction filter (strength value = 8), and excluding the Feldcamp region. Segmentation was performed using pixel classification in ilastik [45] (version 1.4.0rc2), a machine learning tool for image analysis. A subset of 6 images, 1 from each treatment combination, were selected randomly, within which a small region of interest was obtained to act as a training image set for ilastik. Training image data were labelled manually either as soil or pores, focussing specifically on regions in which the software returned the highest levels of uncertainty, which typically fell around object boundaries and novel types of organic matter. After training, pixel classification was validated by comparing alongside manually segmented and original greyscale images, then applied using the ilastik plugin (version 1.8.3) for FIJI [46] (version 2.14.0/1.54f). This resulted in binary images representing either soil material or the pore network, with organic matter included in the soil phase, which was validated visually for segmentation quality. These images were masked to a cylinder to exclude the column wall material, and the soil surface within binary images was also masked to discard unwanted pixel information of the atmosphere surrounding the top and bottom of the soil, while maximising useful pixel information of the soil, this was achieved by running erode, fill, and dilate functions in AvizoFire 6.3.1 [22]. Quantification of the imaged pore networks, as detailed below, was repeated according to Wardak et al. [22] using BoneJ [47] (version 7.0.17) to measure the connectivity density of the largest macropore cluster (LMC), which represents the number of redundant connections per mm3 in the most voluminous connected pore structure, alongside the average pore thickness of the LMC and the pore size distribution of the entire imaged network. To assess the shape of pore size distribution curves, coefficients of uniformity (Cu), sorting order (So) and gradient of curvature (Cc) were calculated using the following ratios:
PSDCu = δ60/δ10; PSDSo = √δ75/δ25; PSDCc = δ302/(δ10 × δ60)
The Euler density was also calculated by dividing the Euler number of the entire imaged pore network by the volume of the masked region of interest for each sample, which represents the mean Euler number per mm3 in the entire network.

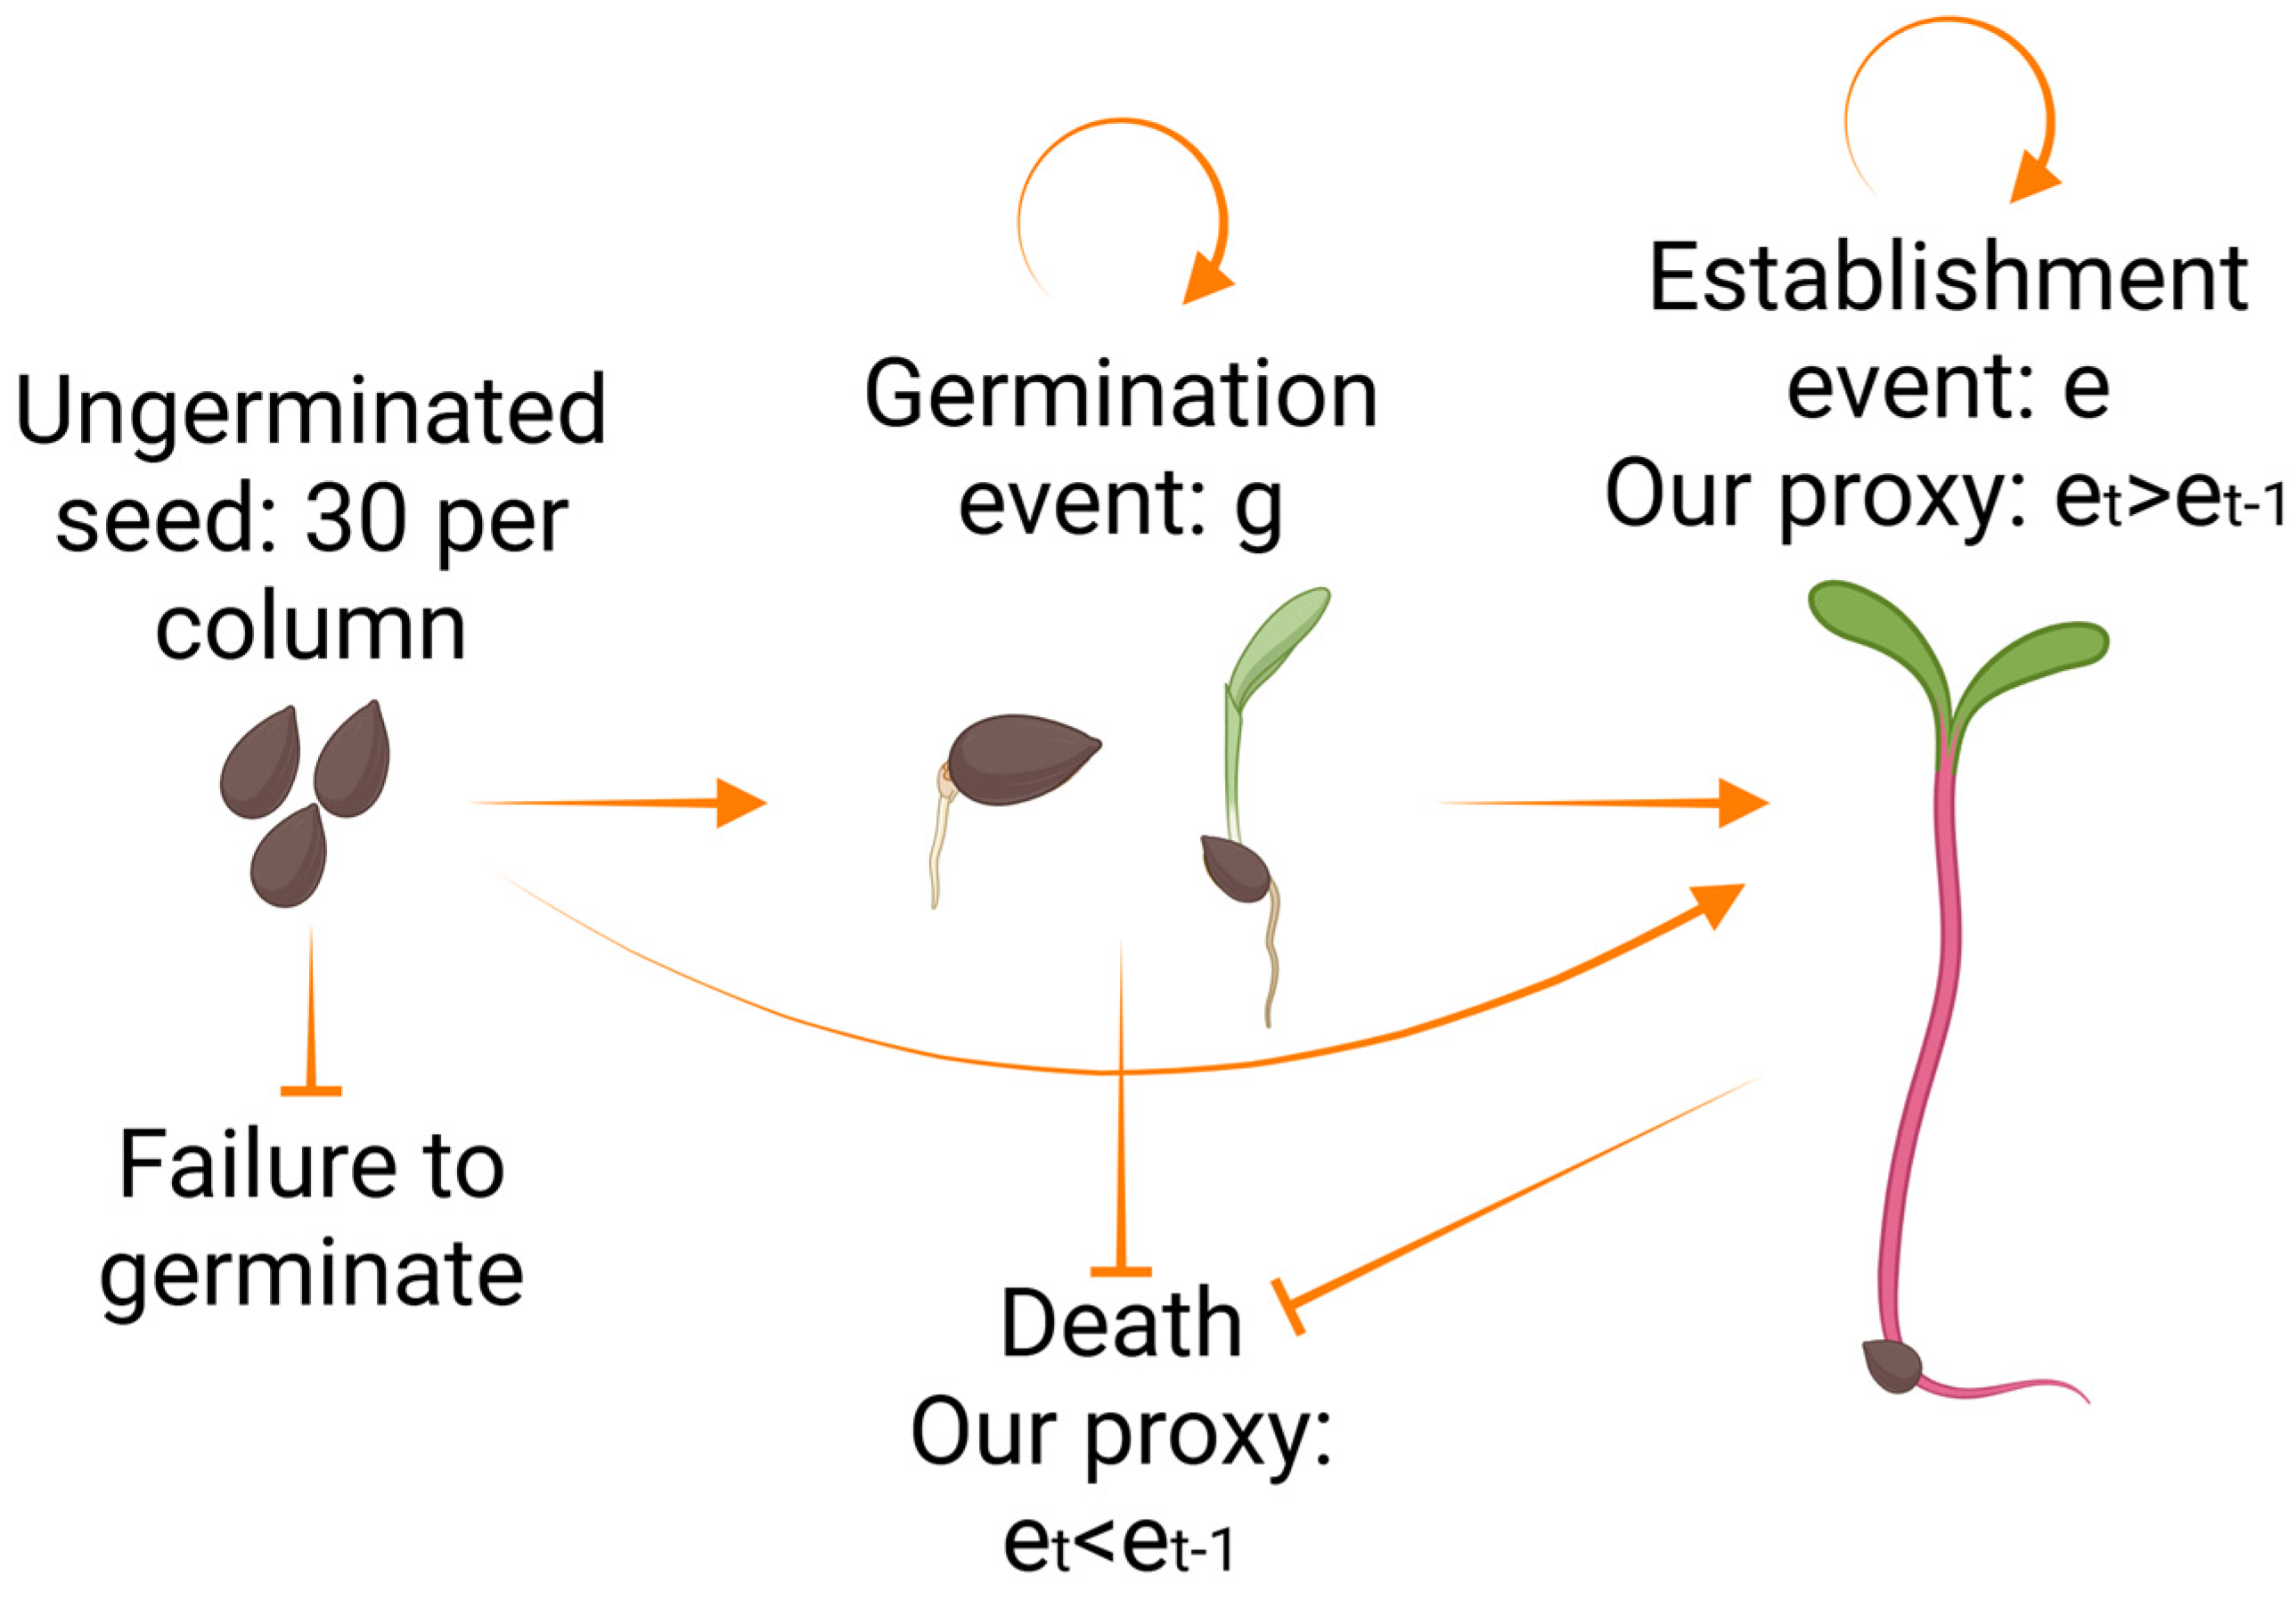
2.3. Bioefficacy Assessment

Seeds of Amaranthus retroflexus L., a common weed species, were first sterilised by soaking for 2 min using 5 mL of 25% solution of bleach [48], drained and rinsed 5 times with dH2O, then soaked in 2 mL dH2O in the dark at 2 °C for 3 days according to a method for breaking dormancy in Arabidopsis seeds by Wang et al. [49]. Exactly 30 seeds were sown in each of the 96 columns by scattering across the surface of soil. Non-target plant species were removed upon identification using morphological characteristics after germination. Allelopathic effects on the germination rate were not considered due to the short duration of the experiment, and the number of non-target species was minimal in comparison to that of target species, which were removed quickly after identification. It was not feasible to track each individual plant due to the potential of 2880 plants across 96 columns; thus, the number of events were tracked every day according to the following rules: A germination event was defined as any seed which showed signs of root or shoot growth where the cotyledons had not yet separated, and an establishment event was defined as any plant which showed continued growth upon the separation of the two cotyledons. A dilution series was prepared from the two formulations of the active herbicide ingredient atrazine. One formulation was prepared as a particulate-based suspension concentrate (SC; 48% active ingredient) and is currently licenced under the name AAtrex® 4L, and the other was prepared as an R&D solution-based emulsifiable concentrate (EC; 5% active ingredient); both were supplied by Syngenta. Dilutions of the concentrated formulation were prepared to meet the target application rates of 500 g/ha, 250 g/ha, and 125 g/ha across the 32.17 cm2 soil surface of columns, and were applied as a 2 mL solution in dH2O as soon as possible after sowing using a pipette while ensuring coverage of the entire soil surface. The 500 g/ha top standard was equivalent to 0.335 µL and 3.217 µL of the SC and EC formulations, respectively, per column, from which other application rates were prepared via serial dilution with dH2O. Approximately 70 h after chemical application, an irrigation step of 6 mL H2O was applied to each column every 30 min for 4 h, representing a locally high intensity and duration of rainfall (equivalent precipitation of 3.7 mm/h). Changes in moisture content of each column was tracked by weight every day, after which water was sprayed onto the surface of each column and all columns were kept under clear plastic domes to prevent excessive surface evaporation. The formulation treatment was not subject to experimental randomisation; thus, there may have been some effect of environmental variability between boxes used to prevent excessive evaporation of soil water, contributing to the formulation effect identified. This does not allow us to determine a direct formulation effect from this experiment, only tillage and concentration effects within formulation treatments.
The experiment was terminated 25 days after sowing; then, wet and dry plant mass was obtained by removing any aboveground plant material and weighing and drying it in the oven at 65 °C for 72 h according to a standardised determination of above-ground biomass [50]. Shoot length was measured for each germinated individual using a graduated ruler [51] and summed, giving the total length of plants in each soil column.

2.4. Basic Soil Properties

Three samples were taken from each plot on 29th June 2023 for the determination of bulk density using a stainless-steel ring (6.5 cm diameter 5 cm height) and stored at 4 °C. Soil was weighed before and after drying at 105 °C until samples reached constant mass [52]. The bulk density (g cm−3) was calculated according to the equation below:
BD = Wdry/V
where Wdry is the mass of soil (g) after drying and V is the volume (cm3) of the bulk density ring.
Loss on ignition was adopted for the approximation of soil organic matter (SOM, %) [53]; 5 g of soil was taken from the oven dried soil used for the calculation of bulk density, as above. This soil was weighed before being placed into a furnace at 550 °C for four hours to calculate loss on ignition as follows:
SOM = 100 × (Sdry − Sburn)/Sdry
where Sdry is the mass of dry soil (g) before loss on ignition and Sburn is the mass of soil (g) after loss on ignition.

2.5. Gravimetric Water Content

Each column was weighed at saturation at the onset of the experiment, every day, and again at termination after removing soil from columns and drying it at 105 °C for 48–72 h until the mass was constant. Gravimetric water content (θg) was calculated according to the following equation [54]:
θg = 100 × (mw − ms)/ms
where mw is the mass (g) of soil at saturation, and ms is the mass (g) of the soil after oven drying.

2.6. Data Handling and Statistics

Data were recorded in Excel and saved as .csv for importing into Rstudio for R [55,56]. Key packages included ggplot2 [57], survminer [58], flexsurv [59], and survival [60]. Distributions of data representing the imaged pore network structure were significantly different from normal when using the Shapiro–Wilks test, so to investigate the significance of differences between treatments, data were analysed using unpaired two-sample Wilcoxon rank-sum tests. Data distributions for measurements of water content in soil columns were not significantly different from normal, so they were analysed further with a t-test. Additionally, p-values were adjusted with a Bonferroni correction to account for error during multiple comparisons of the imaged pore network structure or water content between ploughed, ZT and repacked soil columns.
The data gathered over the course of the experiment on plant establishment were divided into two Kaplan–Meier curves, one which represented probability of establishment, and another which represented probability of survival (established plants not being succeeded by death events). Individuals remaining ungerminated or surviving past the experimental endpoint were considered right-censored data [61], which were added to the establishment curve at a final time point representing the number of plants that did not establish at any point, from the total number of seeds added to each column, and to the survival curve at final time point representing the number of plants that were still living. Due to the nature of the experiment lacking the ability to track individuals, combined with interval censoring, new establishment events could only be confidently tracked when the number of establishment events at a specific time point was higher than that at a previous time point (et > et−1). Conversely, plant death could only be recorded when the number of new establishment events was lower than that at the previous time point (et < et−1). It is important to note that using this method, interval censoring may appear when a number of new establishments occur simultaneously with plant death. For example, when ten established plants were recorded at et−1 and eleven established plants were recorded at et, it was impossible to determine if only one plant established, or three new plants established and two died. Additionally, while germination was tracked, it was impossible to add censored data according to these numbers due to establishment events being semi-dependent on germination events (Figure 1). These curves were analysed using the log rank test, which uses the sum of the chi-squared between groups to test for significant differences between population distributions [62], and curves were summarised using the restricted mean survival time [63]. No competing risks were identified in this dataset. However, non-proportional hazards were identified by assessing the Schoenfeld residuals of cox models [64]. Survival and establishment curves were instead modelled using a Weibull distribution, and the model fit was validated using visual analysis of Cox–Snell residuals along a line with intercept 0 and slope 1.
Relationships between measures of plant success (dry plant mass, total plant height, and restricted mean survival time) and treatments including formulation, concentration and tillage were investigated using linear modelling, and different possible models were assessed using AIC model selection. Data representing dry plant mass and total plant height were transformed using a cube root and square root respectively, to account for proportionality between the mean and variability. Linear models were graphically validated to highlight any outliers and ensure residual normality, homoscedasticity, and low leverage. Values representing the treatment of applied herbicide were transformed with a natural log scale; however, to avoid zero values, which represented the control treatment, a constant of 1.0 was added to all concentrations.
Soil columns under the repacked treatment including controls did not behave as expected, showing a lack of germination throughout the experiment, until the last 2 days, where a small peak of germination events occurred. As a result, measures of biomass, plant height, survival and establishment data for the repacked treatment were removed from further analysis. One replicate sample from the ZT, high-concentration, and EC formulation treatment demonstrated no establishment events, and thus RMST could not be calculated for this sample.

3. Results

3.1. Basic Soil Properties

Bulk density was significantly different between ZT and ploughed soil (Table 1, W(4,4) = 16, p = 0.029), and soil organic matter was not significantly different between ZT and ploughed soil (W(4,3) = 2, p = 0.229).

3.2. Water Content over Time

Water content was tracked by changes in mass for each column each day over the course of the experiment. Water content between ploughed, repacked and ZT samples (n = 32) was significantly different in the first two days, with repacked cores demonstrating the highest water content of 65.7% at the start of the experiment. After this, ploughed samples demonstrated significantly lower water content compared with ZT and repacked samples for the remainder of the experiment (Figure S1).

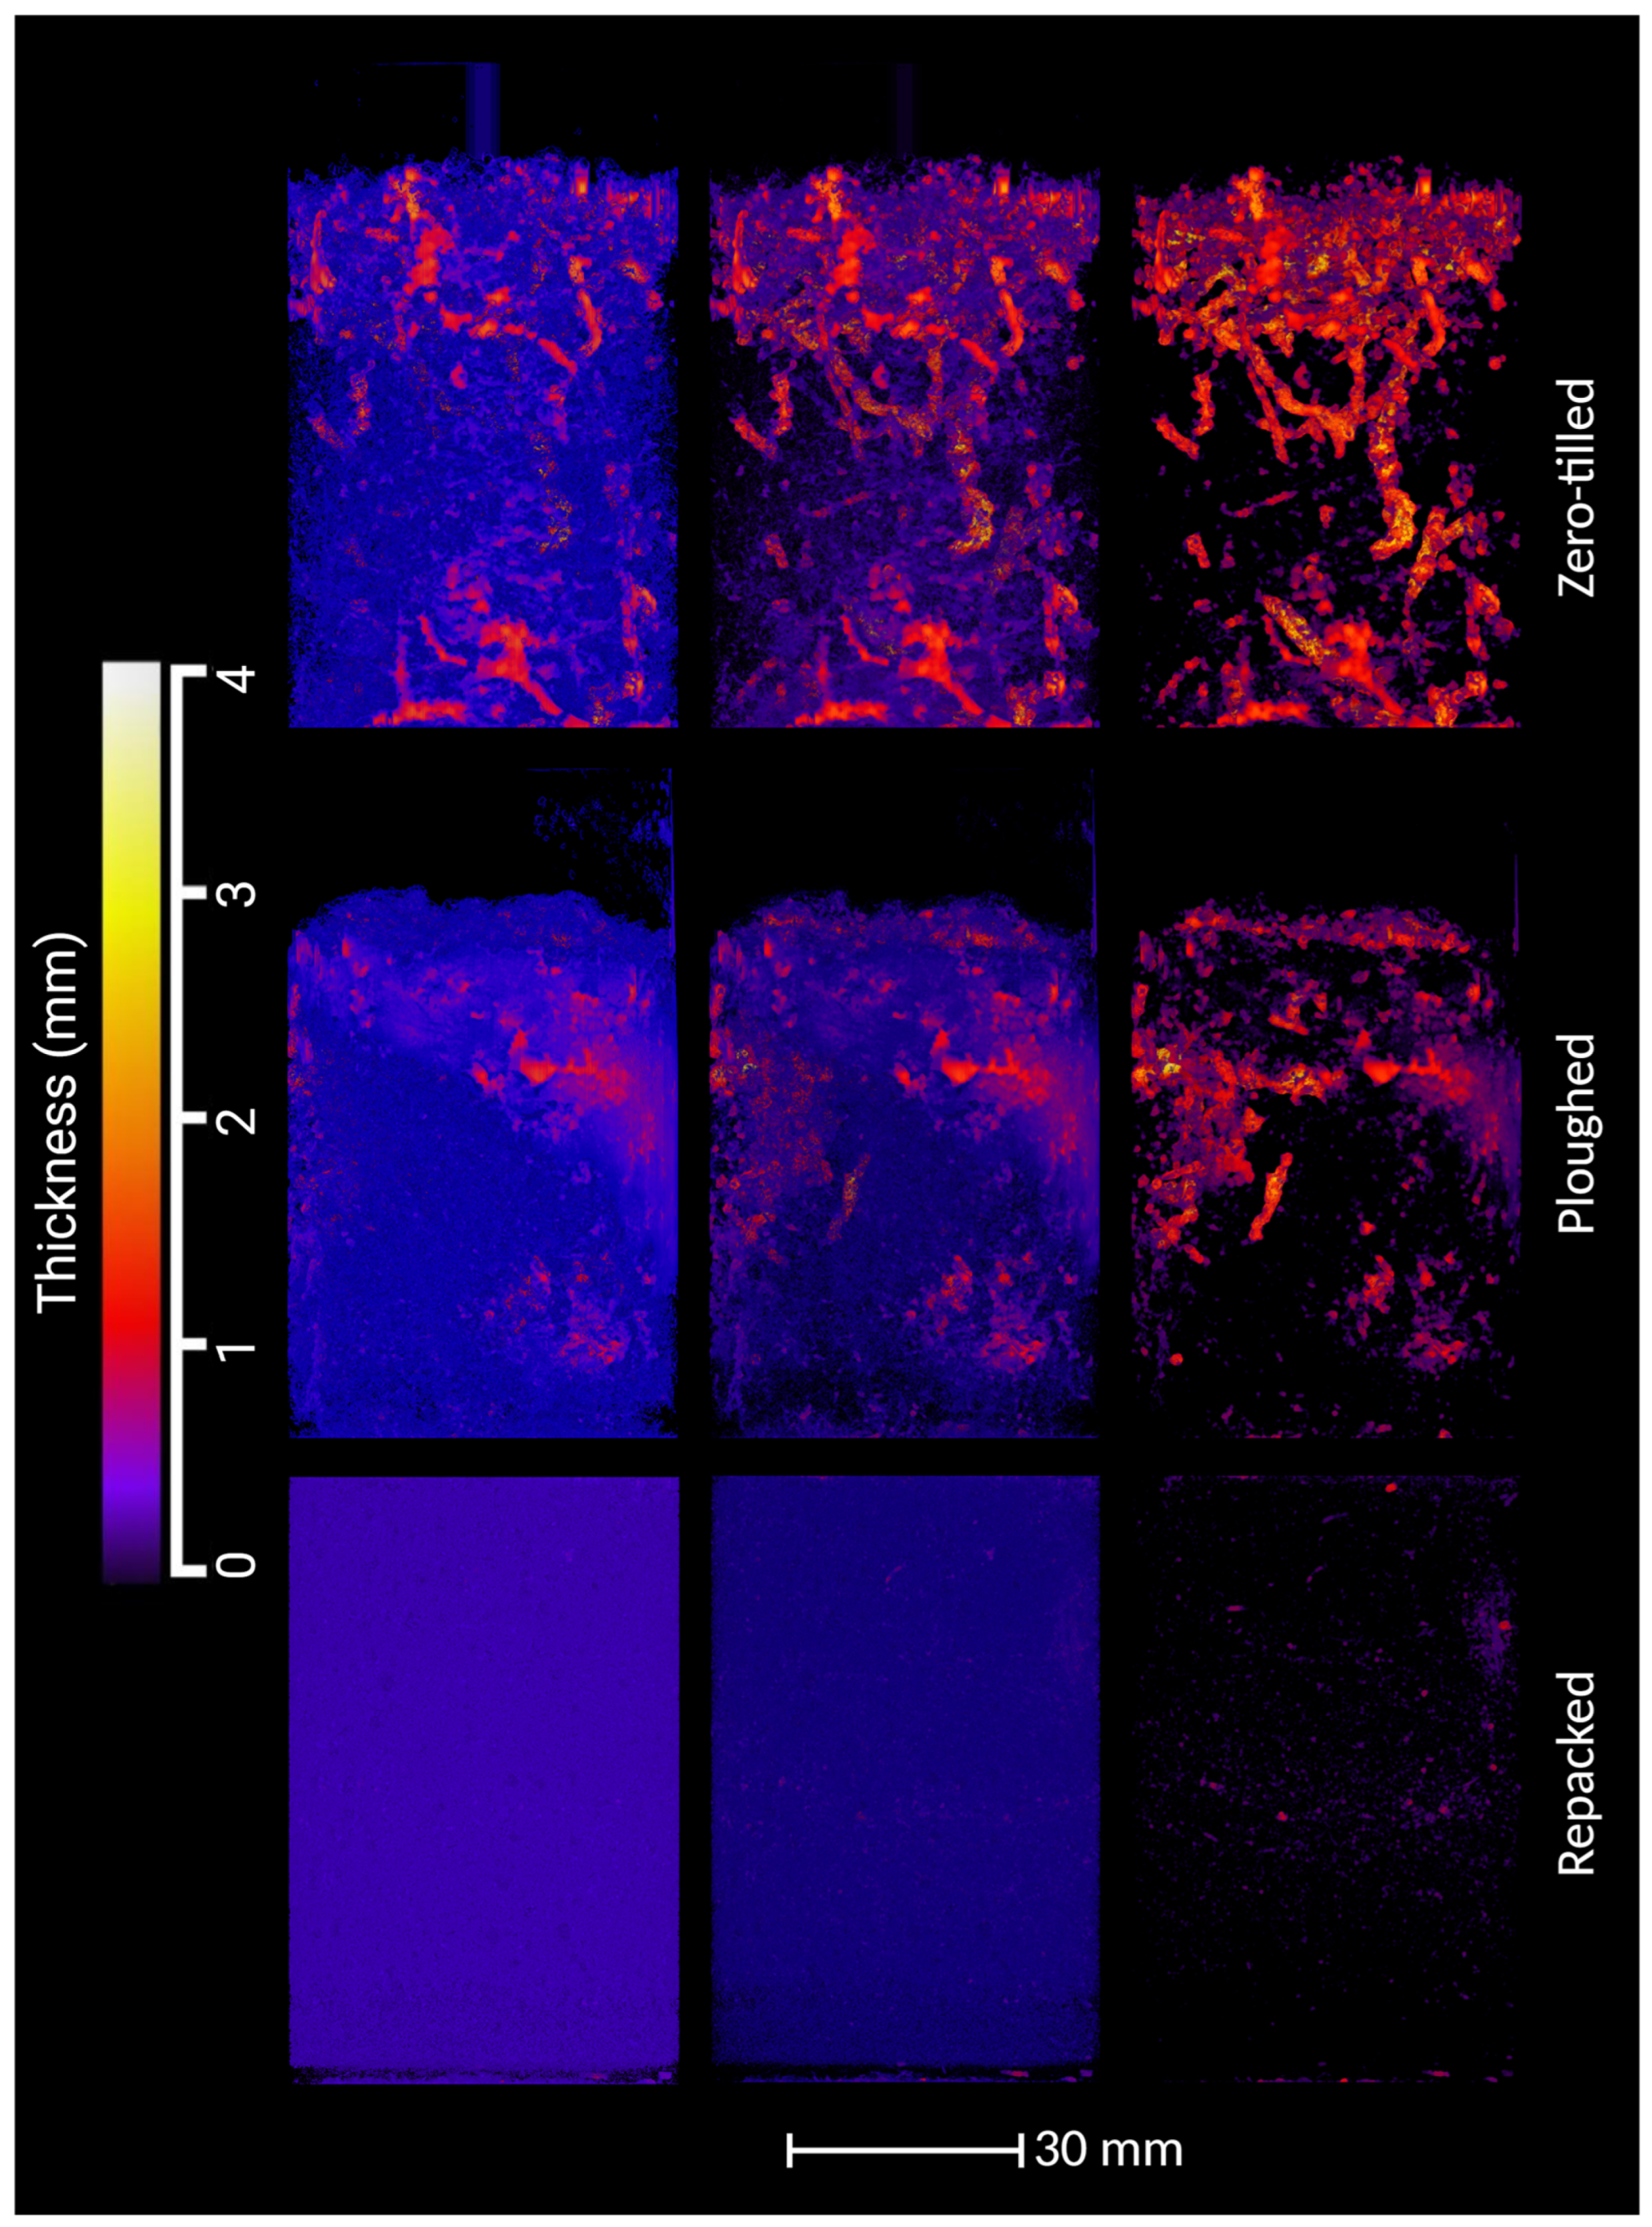
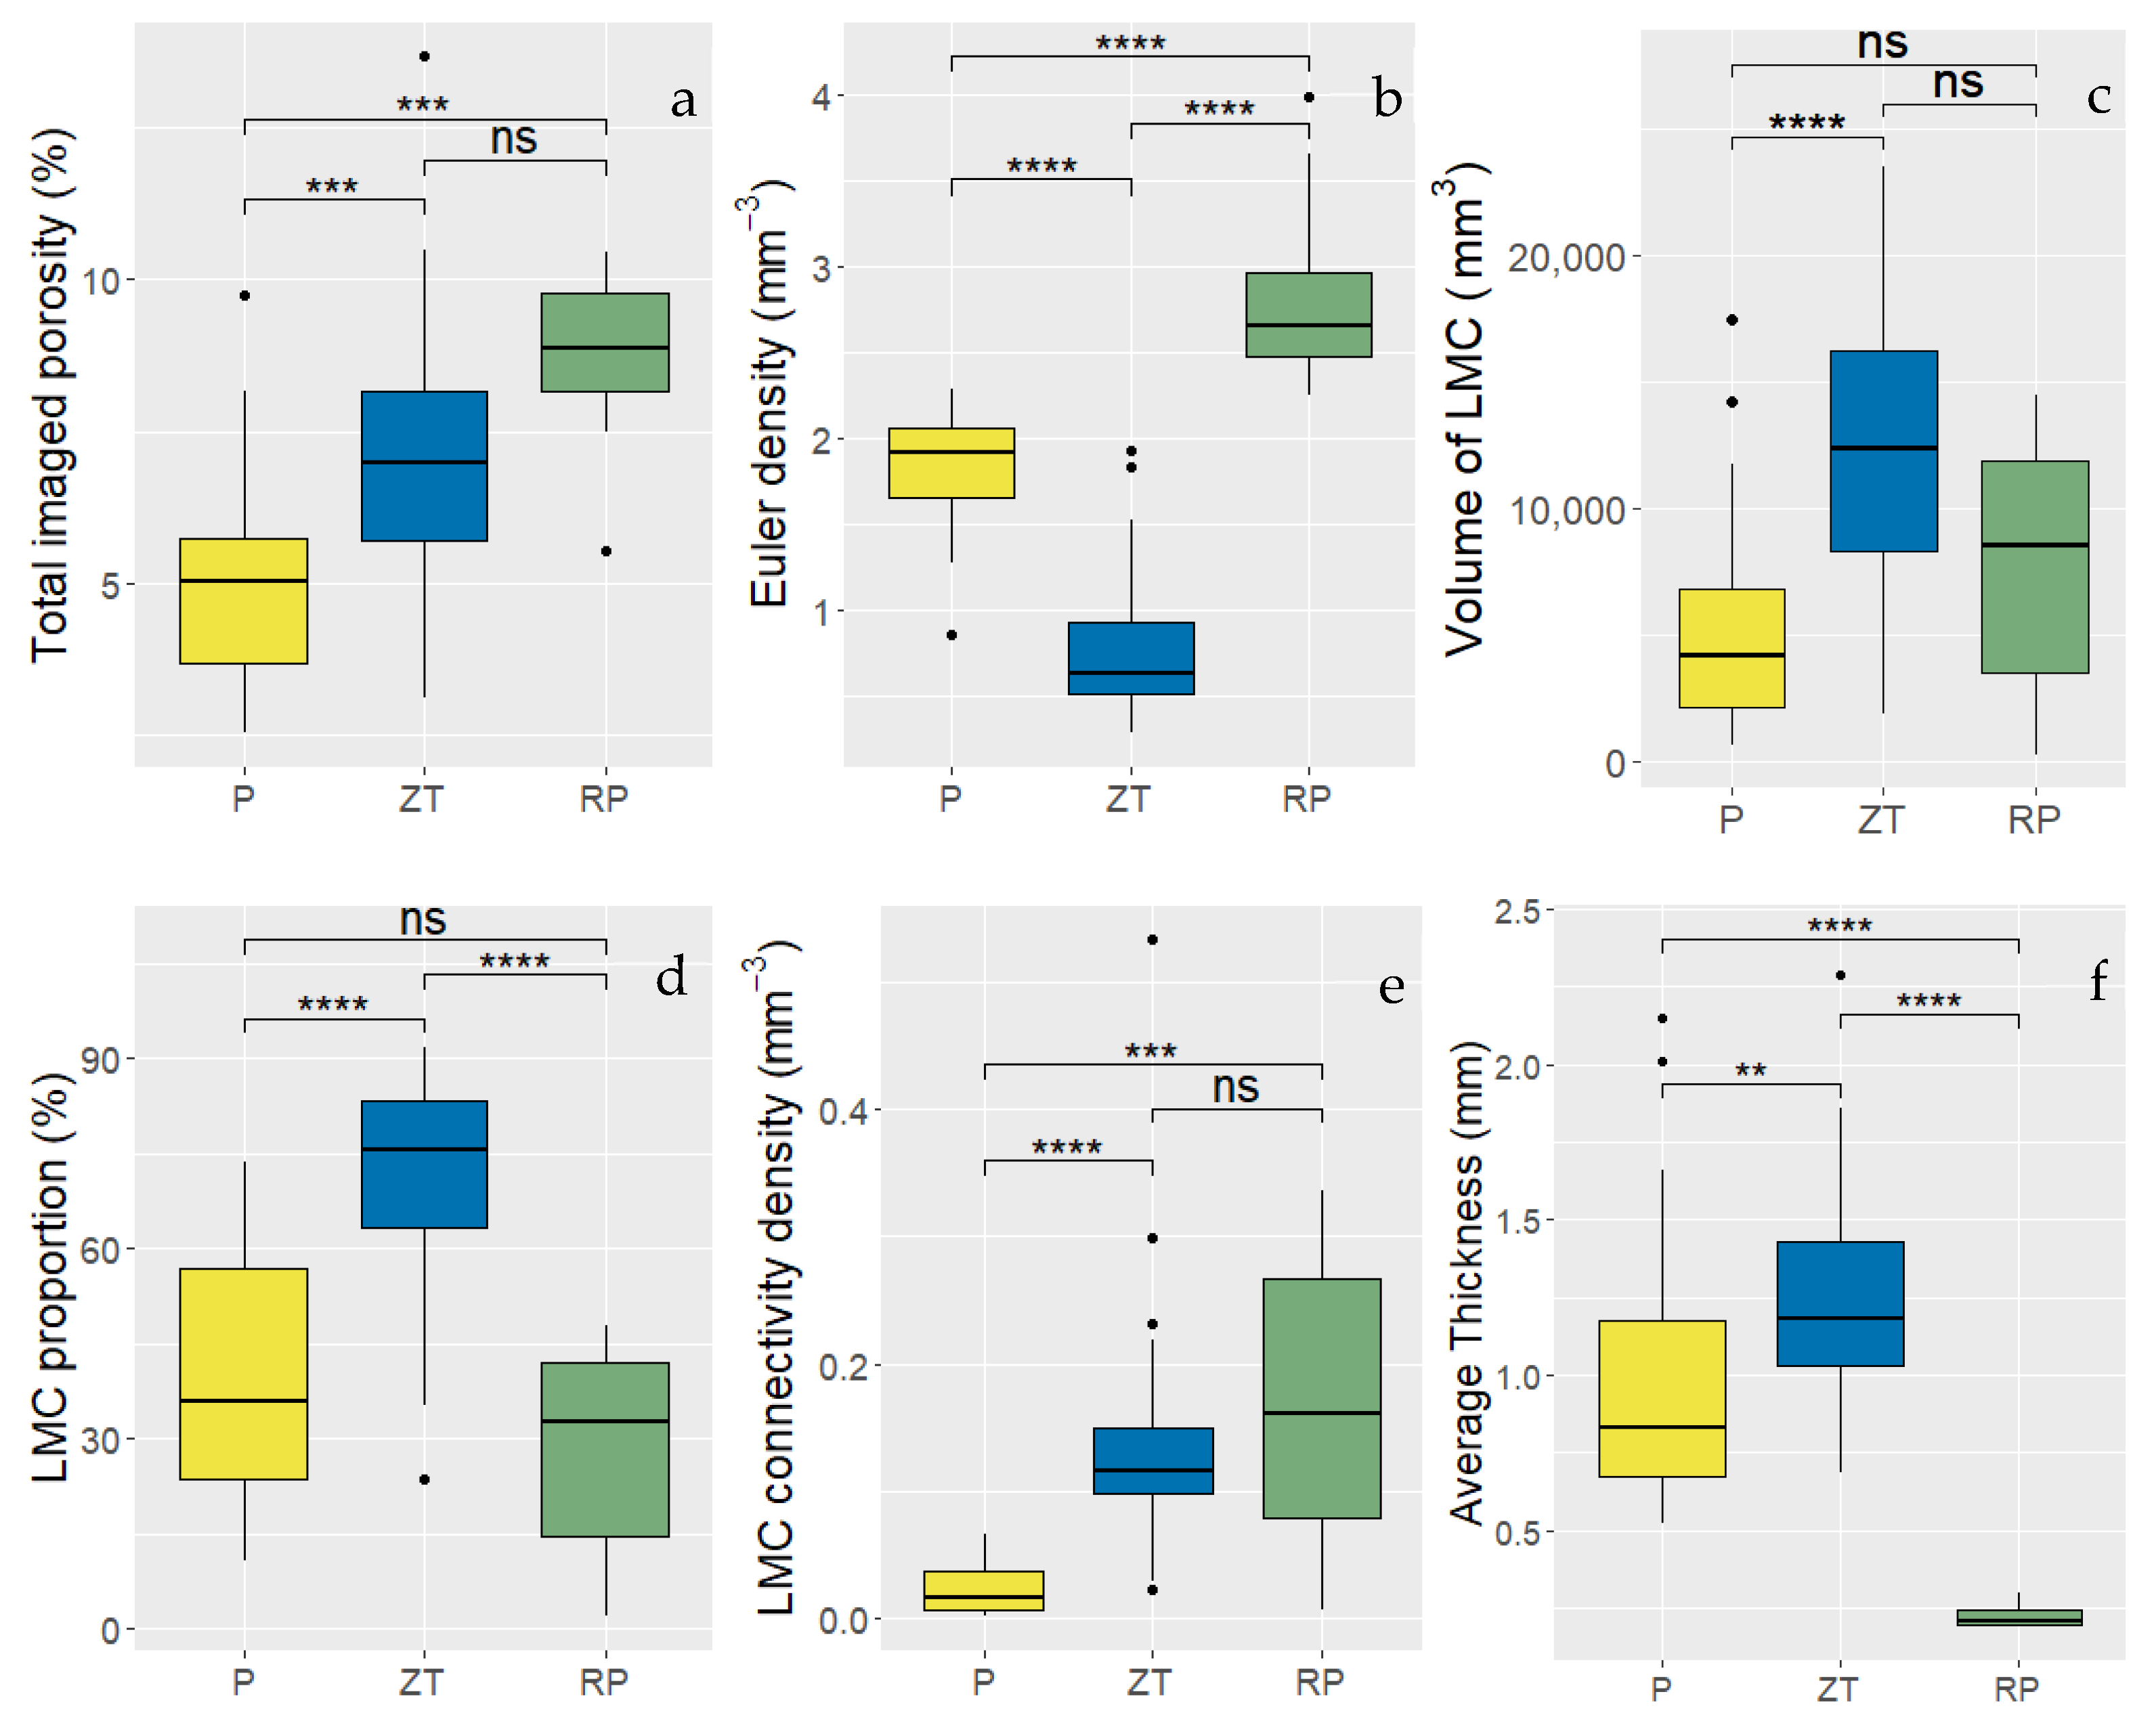
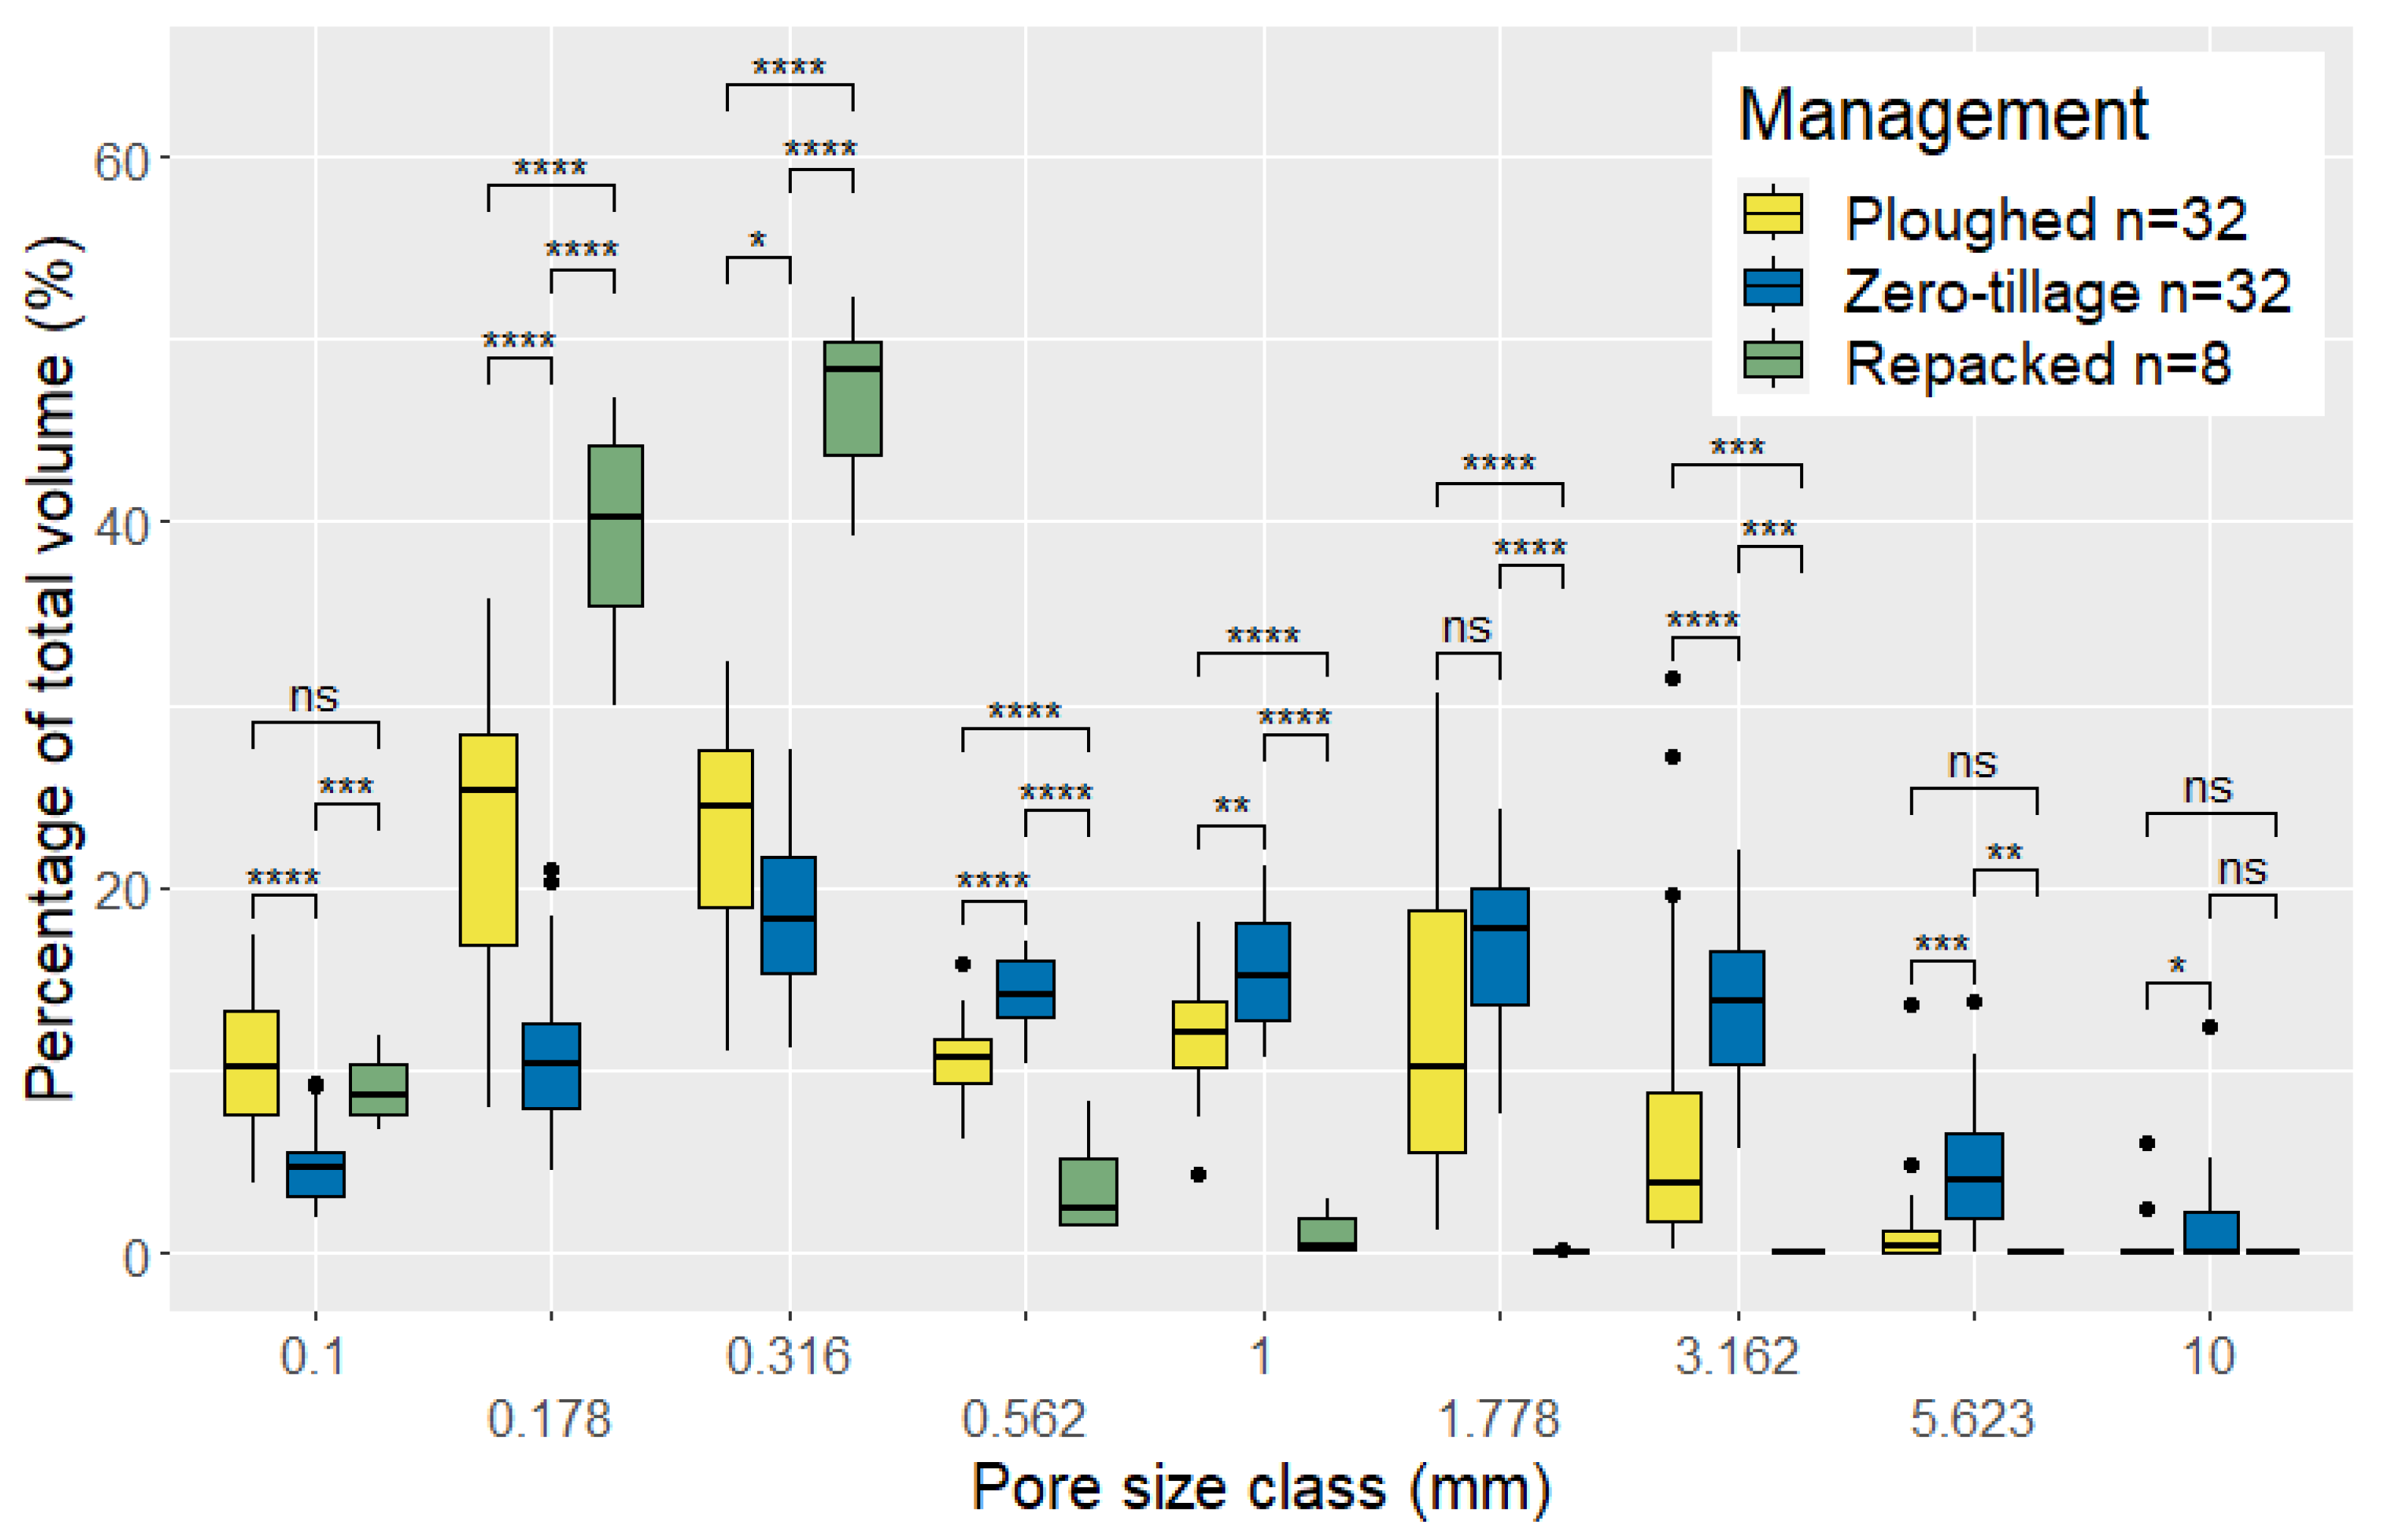
3.3. Structural Differences in Pore Networks Between Ploughed and ZT Soils

Repacked soil columns generally consisted of a dense network of small non-connected pores, with the largest macropore cluster (LMC) typically spanning the central 5 cm section of each column (Figure 2). A proportion of each ploughed sample generally demonstrated similarities with the repacked columns, with a slightly less dense network of small non-connected pores. However, in ploughed columns, the LMC followed no discernible trend, and was characterised either by small subsurface clusters, one dominant surface-connected object, or a biopore network (identified in 9 of 32 columns). Biopore networks identified in 7 of 9 of the ploughed samples were extensive and clustered around the edges of the imaged region. ZT soils demonstrated a scarcity of small, disconnected pores, which often resulted in the ability to track the presence of biopores much more easily (Figure 2). Indeed, biopore networks within ZT soils tended to be located towards the centre of columns, which connected several areas with a higher density of smaller connected pores, with only one column demonstrating an extensive edge-dominated biopore network. Repacked columns demonstrated the highest total imaged porosity, which was significantly different than what was observed for ploughed (Figure 3a, W = 19, p = 0.081) but not ZT (W = 63, p = 1) samples, with that of ZT samples being significantly higher than that of ploughed samples (W = 223, p = 0.0002) (see summary statistics—Table 2).
The Euler density of the entire imaged pore network was significantly different between ploughed and ZT (Figure 3b, W = 981, p < 0.0001), ploughed and repacked (W = 2, p < 0.0001), and ZT and repacked (W = 0, p < 0.0001) samples. The volume of the isolated largest macropore cluster (LMC) was significantly different between ploughed and ZT (Figure 3c, W = 157, p < 0.0001), but not between ZT and repacked (W = 85, p = 0.459) or ploughed and repacked (W = 186, p = 0.153) samples. The LMC represented a broad range between 1.8 and 91.8% of the total imaged volume in all columns. The proportion of the LMC was significantly different between ploughed and ZT samples (Figure 3d, W = 121, p < 0.0001) and significantly different between ZT and repacked samples (W = 242, p < 0.0001), but not significantly different between ploughed and repacked samples (W = 159, p = 0.9271). The connectivity density of the LMC was significantly different between the ploughed and ZT (Figure 3e, W = 49, p < 0.0001) and ploughed and repacked samples (W = 26, p < 0.0001), but not between ZT and repacked samples (W = 110, p = 1). The average thickness of the LMC was significantly different between ploughed and ZT (Figure 3f, W = 254, p = 0.00164), ploughed and repacked (W = 256, p < 0.0001), and ZT and repacked samples (W = 256, p < 0.0001).
The representative volume of pores in most size classes was significantly different between ZT, ploughed and repacked soil samples (Figure 4). Primarily, the repacked treatment was summarised by a unimodal pore size distribution with a dominant peak between 0.178 and 0.316 mm size classes. Ploughed and ZT soil were each described by a bimodal distribution, with peaks between the 0.178 and 0.316 mm classes, and 1 and 1.778 mm classes, which were more prominent in ZT soil, with an equal distribution of small and large pores, whereas ploughed soil demonstrated a shift towards smaller pore size classes. Coefficients representing proportions of the pore size distribution curve for imaged soil pore networks were significantly different between ZT, ploughed and repacked soil samples (Figure S2). The mean coefficient of uniformity was 6.10 (SD = 1.27) for ZT, 4.70 (SD = 2.55) for ploughed, and 2.06 (SD = 0.10) for repacked samples, the mean coefficient of sorting order was 2.41 (SD = 0.26) for ZT, 2.14 (SD = 0.44) for ploughed, and 1.39 (SD > 0.01) for repacked samples, and the mean coefficient of gradient curvature was 0.73 (SD = 0.13) for ZT, 0.81 (SD = 0.16) for ploughed, and 0.96 (SD = 0.03) for repacked samples.

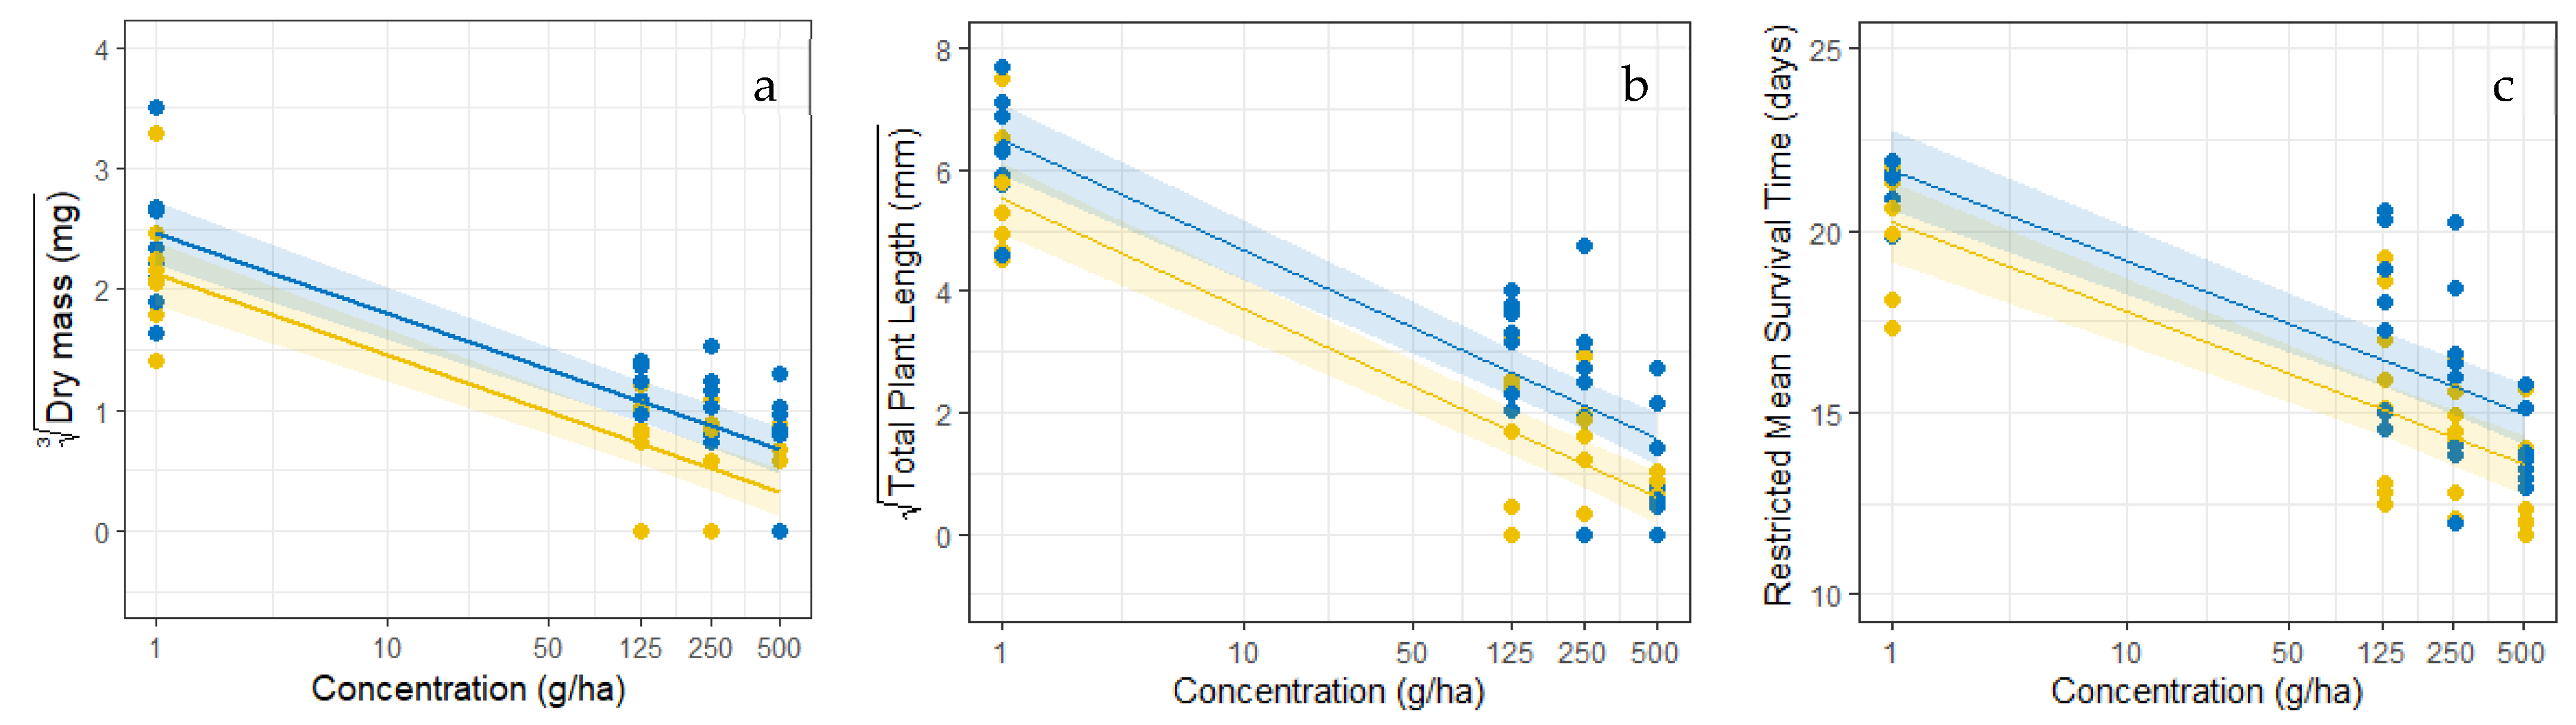
3.4. The Effect of Formulation Concentration on Bio-Efficacy

Two destructive measures of plant growth were obtained at the experimental endpoint (22 days after sowing), the mass of dry plant matter and the total height of plant matter. The mean dry mass of plant material under the control treatment was 15.7 (SE = 4.3) mg for ZT, and for ploughed columns was 12.3 (SE = 3.6) mg, which was not significantly different (Figure 5a, W(8,8) = 24, p = 1). The mean total plant height in columns under the control treatment was 40.9 (SE = 4.2) mm for ZT, and for ploughed columns was 31.2 (SE = 4.5) mm, which was also not significantly different (Figure 5b, W(8,8) = 18, p = 0.483). Remaining summary statistics for each treatment combination are available in Table S1. Relationships between treatments and measures of plant success were investigated with linear modelling. The best fitted regression model for dry plant mass (DPM) in mg was DPM = (2.12 − 0.29 ln(C) + 0.35T)3, where C is the concentration in g/ha and T is the effect of the tillage treatment, where ploughed is 0 and ZT is 1. This overall regression was statistically significant (Figure 6a, R2 = 0.70, F(2,61) = 76.17, p < 0.0001) and carried 50% of the cumulative Akaike weight (AICc = 91.12). Dry plant mass was significantly predicted by the concentration of atrazine (p < 0.0001), and by soil tillage (p = 0.0055). The best fitted regression model for total plant height (TPH) in cm was TPH = (5.53 − 0.79 ln(C) + 0.96T)2. This overall regression was statistically significant (Figure 6b, R2 = 0.78, F(2,61) = 115.5, p < 0.0001) and carried 55% of the cumulative Akaike weight (AICc = 193.34). Total plant height was significantly predicted by the concentration of atrazine (p < 0.0001), and by soil tillage (p = 0.0005). The best fitted regression model for restricted mean survival time (RMST) in days was RMST = 20.27 − 1.08 ln(C) + 1.41T after 22 days. This overall regression was statistically significant (Figure 6c, R2 = 0.66, F(2,60) = 60.03, p < 0.0001) and accounted for 39% of the cumulative Akaike weight (AICc = 270.97). Total plant height was significantly predicted by the concentration of atrazine (p < 0.0001), and by soil tillage (p = 0.0067). When pooling the effects of tillage and formulation to assess the effect of concentration on establishment and survival, there was a statistically significant indication that curves from different concentrations of herbicide originated from different population distributions in establishment probability (Figure S3a, χ2(3) = 23.47, p < 0.0001) and survival probability (Figure S3b, χ2(3) = 215.22, p < 0.0001).

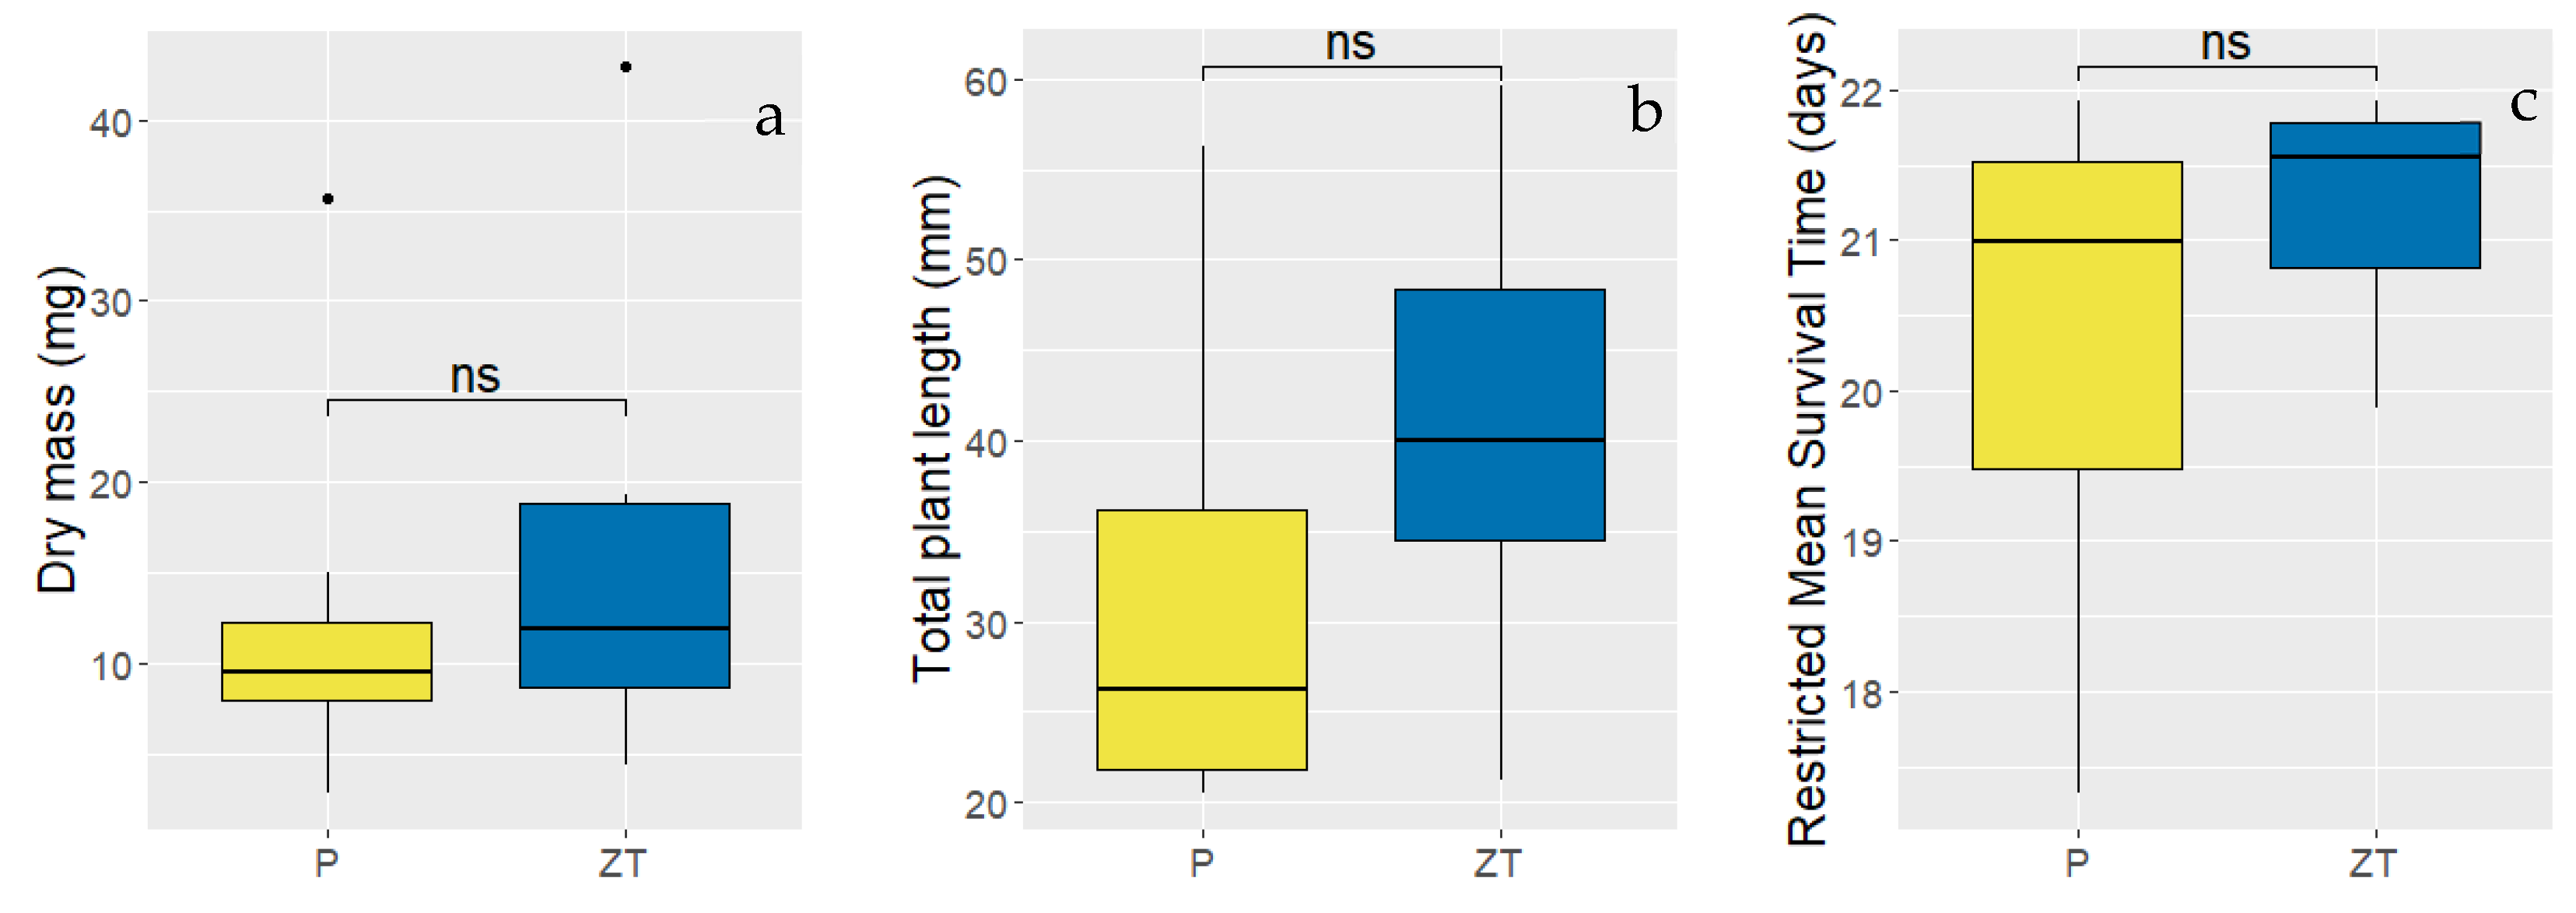
3.5. Effect of Tillage and Soil Structure on Formulation Bioefficacy

There was a statistically significant indication that survival curves from ZT and ploughed columns treated with atrazine at any concentration originated from different population distributions within the SC formulation (Figure 7a, χ2(1) = 14.81, p = 0.00012) and EC formulation (Figure 7b, χ2(1) = 7.69, p = 0.0056). There was no statistically significant indication that between ZT and ploughed samples, while untreated columns grouped with the SC (χ2(1) = 3.67, p = 0.055) and EC (χ2(1) = 0.96, p = 0.33) formulations originated from different population distributions.
Structural properties of the pore network correlated with measures of plant success at different concentrations of the SC and EC formulations of atrazine. For instance, RMST was significantly positively correlated with the pore size distribution coefficient of the sorting order (Figure S4a, R2 = 0.69, p = 0.011) and maximum thickness of the entire imaged pore network (Figure S4b, R2 = 0.75, p = 0.0058) at a low concentration of the SC formulation. Whereas, in the EC formulation, total plant height and dry plant mass were significantly positively correlated with the connectivity density of the LMC at a medium concentration (respectively, Figure S4c, R2 = 0.84, p = 0.0012; Figure S4e, R2 = 0.60, p = 0.0023), and RMST was significantly negatively correlated with the pore size distribution coefficient of uniformity at a low concentration (Figure S4d, R2 = 0.56, p = 0.033). Measures of plant success within control treatments did not show significantly positive or negative correlations with any quantified imaged pore network structural trait.

4. Discussion

4.1. Structural Differences Between Ploughed, ZT and Repacked Soil Columns

ZT and ploughed soil pore network properties were more like one another than they were like repacked columns. In this experiment and elsewhere, it has been observed that initiating a wetting/drying cycle in soil columns can have contrasting effects on columns under different treatments [65,66]. Here, after saturation and drainage, ploughed soil visibly shrank away from the boundary of the sample column, with likely meaningful implications for the generation of alternate pore network properties. Visual analysis of imaged pore networks revealed a small proportion of ploughed columns harbouring connected cylindrical pores that extended around the sample boundaries. This indicated that organisms were present in the columns during sampling and likely responsible for generating biopores. It was expected that the ploughed soil would be relatively homogenous due to the recent tillage operation, like the repacked treatment, but the ploughed soil represented the lowest imaged porosity of soil investigated, and repacked soil the highest. It is likely, then, that the ploughing operation performed before sampling brought the soil structure into an unstable temporary state, resulting in the restructuring of the pore network and the collapse of smaller pores during saturation and subsequent draining.
Specific differences between soil management in pore network properties were mainly observed in the analysis of the largest macropore cluster, which had previously shown strong correlations with the degree of preferential transport in the solute transport experiment [22]. As expected, the LMC of ZT soil exhibited a higher average thickness than ploughed soil. However, the total porosity and the volume of the largest macropore between ZT and ploughed soil were different, whereas no differences had been identified before. As previously explained, the poor stability of ploughed soil likely led to some restructuring, primarily from slumping, a property typical of transient ploughed soil structure [67]. This had a subsequent effect on differences identified in connectivity density, as measures of connectivity density and the size of the connected object are inherently linked. Previously, ploughed soil exhibited a higher number of connections per unit area than ZT soil. However, likely because of the smaller representation of the pore network by the largest macropore cluster, ploughed soil exhibited a smaller connectivity density than ZT soil.

4.2. Herbicide Performance Under Experimental Conditions

There were no differences identified in the assessments of plant growth in control treatments between ploughed and ZT, but variability between samples within the same treatment was very high. This is potentially explained by the ‘bet-hedging’ evolutionary strategy of some plants [68], which trades off uniformity of germination to instead provide advantages to individuals of a population to survive under a wider range of environmental pressures. While attempts were made to account for this variability by breaking dormancy using short cold stratification, a recent study used a much longer period of cold stratification but ultimately identified better pre-germination seed treatments of gibberellic acid or ultrasonication [69]. The proportion of seeds that germinated in the control plots over 22 days was 32%, whereas Ahmadnia et al. [69] showed up to 100% germination in many of their seed treatments. It would be advantageous for any further research using A. retroflexus L. to break seed dormancy and improve germination rates by using these recently assessed methods. The soil surface of ploughed and ZT soils was highly non-uniform, which provided many small cracks for seeds to fall into, likely enabling better seed to soil contact over repacked columns, in which germination and establishment rates were severely stunted. For instance, Harper et al. [70] demonstrated a reliance of seeds on soil surface topology for protecting water content and influencing germination, and while not quantified, seeds in repacked columns were observed to sit at the surface of soil and may have dried out quickly, preventing germination. Changes in soil water content over time between repacked and ZT samples were only significantly different at the first two time points, but were otherwise similar throughout the remaining 20 days, meaning that water content was unlikely to have caused any stress on the seeds in repacked columns.
The modelled relationships between plant growth and concentration indicated concentration and tillage as effectors. The mean and variability describing measures of plant success were correlated with one another, and thus transformed to account for this. The lower variabilities seen in higher concentrations are likely to be an effect of simplifying the number of determinant stressors on individuals. For instance, plants grown in the control treatment are subject to many stressors of variable intensity, including variations in local water and soil nutrient content, proximity to the nearest competing plant, energy within seed reserve, etc. Whereas under the highest application rate, accumulating phytotoxic effects of atrazine outcompeted other stresses on each plant, reducing the influence of other factors on individuals. These variance-stabilised measures of plant success demonstrated significant negative log-linear relationships with concentration, and a significant positive effect of ZT. This means that increasing the atrazine application rate reduced total plant height, dry plant mass and restricted mean survival time, which was also confirmed in the Weibull modelling of survival curve data. Of course, it is expected that increasing the application rate of atrazine would induce a reduction in measures of plant success traits, and seedling fresh weight has been demonstrated to negatively correlate with the concentration of atrazine in soil [71]. Additionally, compared to ploughing, ZT led to a higher total plant height, dry plant mass and restricted mean survival time. It is believed that the lower bioefficacy in ZT columns could have partially resulted from the higher water content identified throughout the experiment, providing an environment to enable faster microbial degradation of atrazine, as higher soil moisture content has been shown to increase the biodegradation of atrazine to the non-toxic metabolite hydroxyatrazine [72,73].
An unexpected effect of increasing the concentration of atrazine was the reduced probability of establishment in the latter half of the experiment. An establishment event was defined as a plant that demonstrated separated cotyledons. It is posited that because atrazine is an inhibitor of the photosynthetic pathway, and because the seed is strongly reliant on photosynthesis due to small seed energy reserves, the plant may promote excessive elongation to the shoot and cause stems to have weak structural integrity, typical of etiolation, to maximise chances of finding light, as if the plant were growing in the dark. This was also identified in Arabidopsis under exposure to bromoxynil, another inhibitor of photosystem II [74]. This generation of new plant tissue during etiolation may put more pressure on the photosynthetic system to provide ATP, resulting in plants becoming limited in their capacity to generate secondary protective metabolites. Larger seeds with a higher energy reserve may have overcome the initial phytotoxic effect of high-concentration atrazine, giving rise to the first linear part of the establishment curve, whereas smaller seeds may have germinated but were unable to survive until the cotyledons are visibly separated, potentially explaining the lag in the inhibitive effect of atrazine on the establishment rate. The effect of atrazine on establishment may be inhibitory, but etiolation may have provided the temporary means for treated columns to mimic the establishment rate of the control columns. Although not quantified, reduced stem integrity of seedlings, typical of etiolation, was generally apparent at higher concentrations. Alternatively, there may have been another hidden cause of this inhibition of establishment at higher concentrations. Specifically, the decreased survival probability observed at higher concentrations may have provided a higher degree of data censoring in the establishment curve, meaning the ability to track new germination may have been negatively impacted. For instance, in the control plots, there was a relatively low number of plants that established and subsequently died, whereas the number of established plants generally increased linearly throughout the experiment. In the highest concentrations, the small number of new establishment events may have been hidden by the larger number of previously established plants subsequently undergoing death events. This censoring could be minimised with an alternate experimental approach, such as using time lapse photography to track individuals rather than calculating the number of events per column per day from total counts.

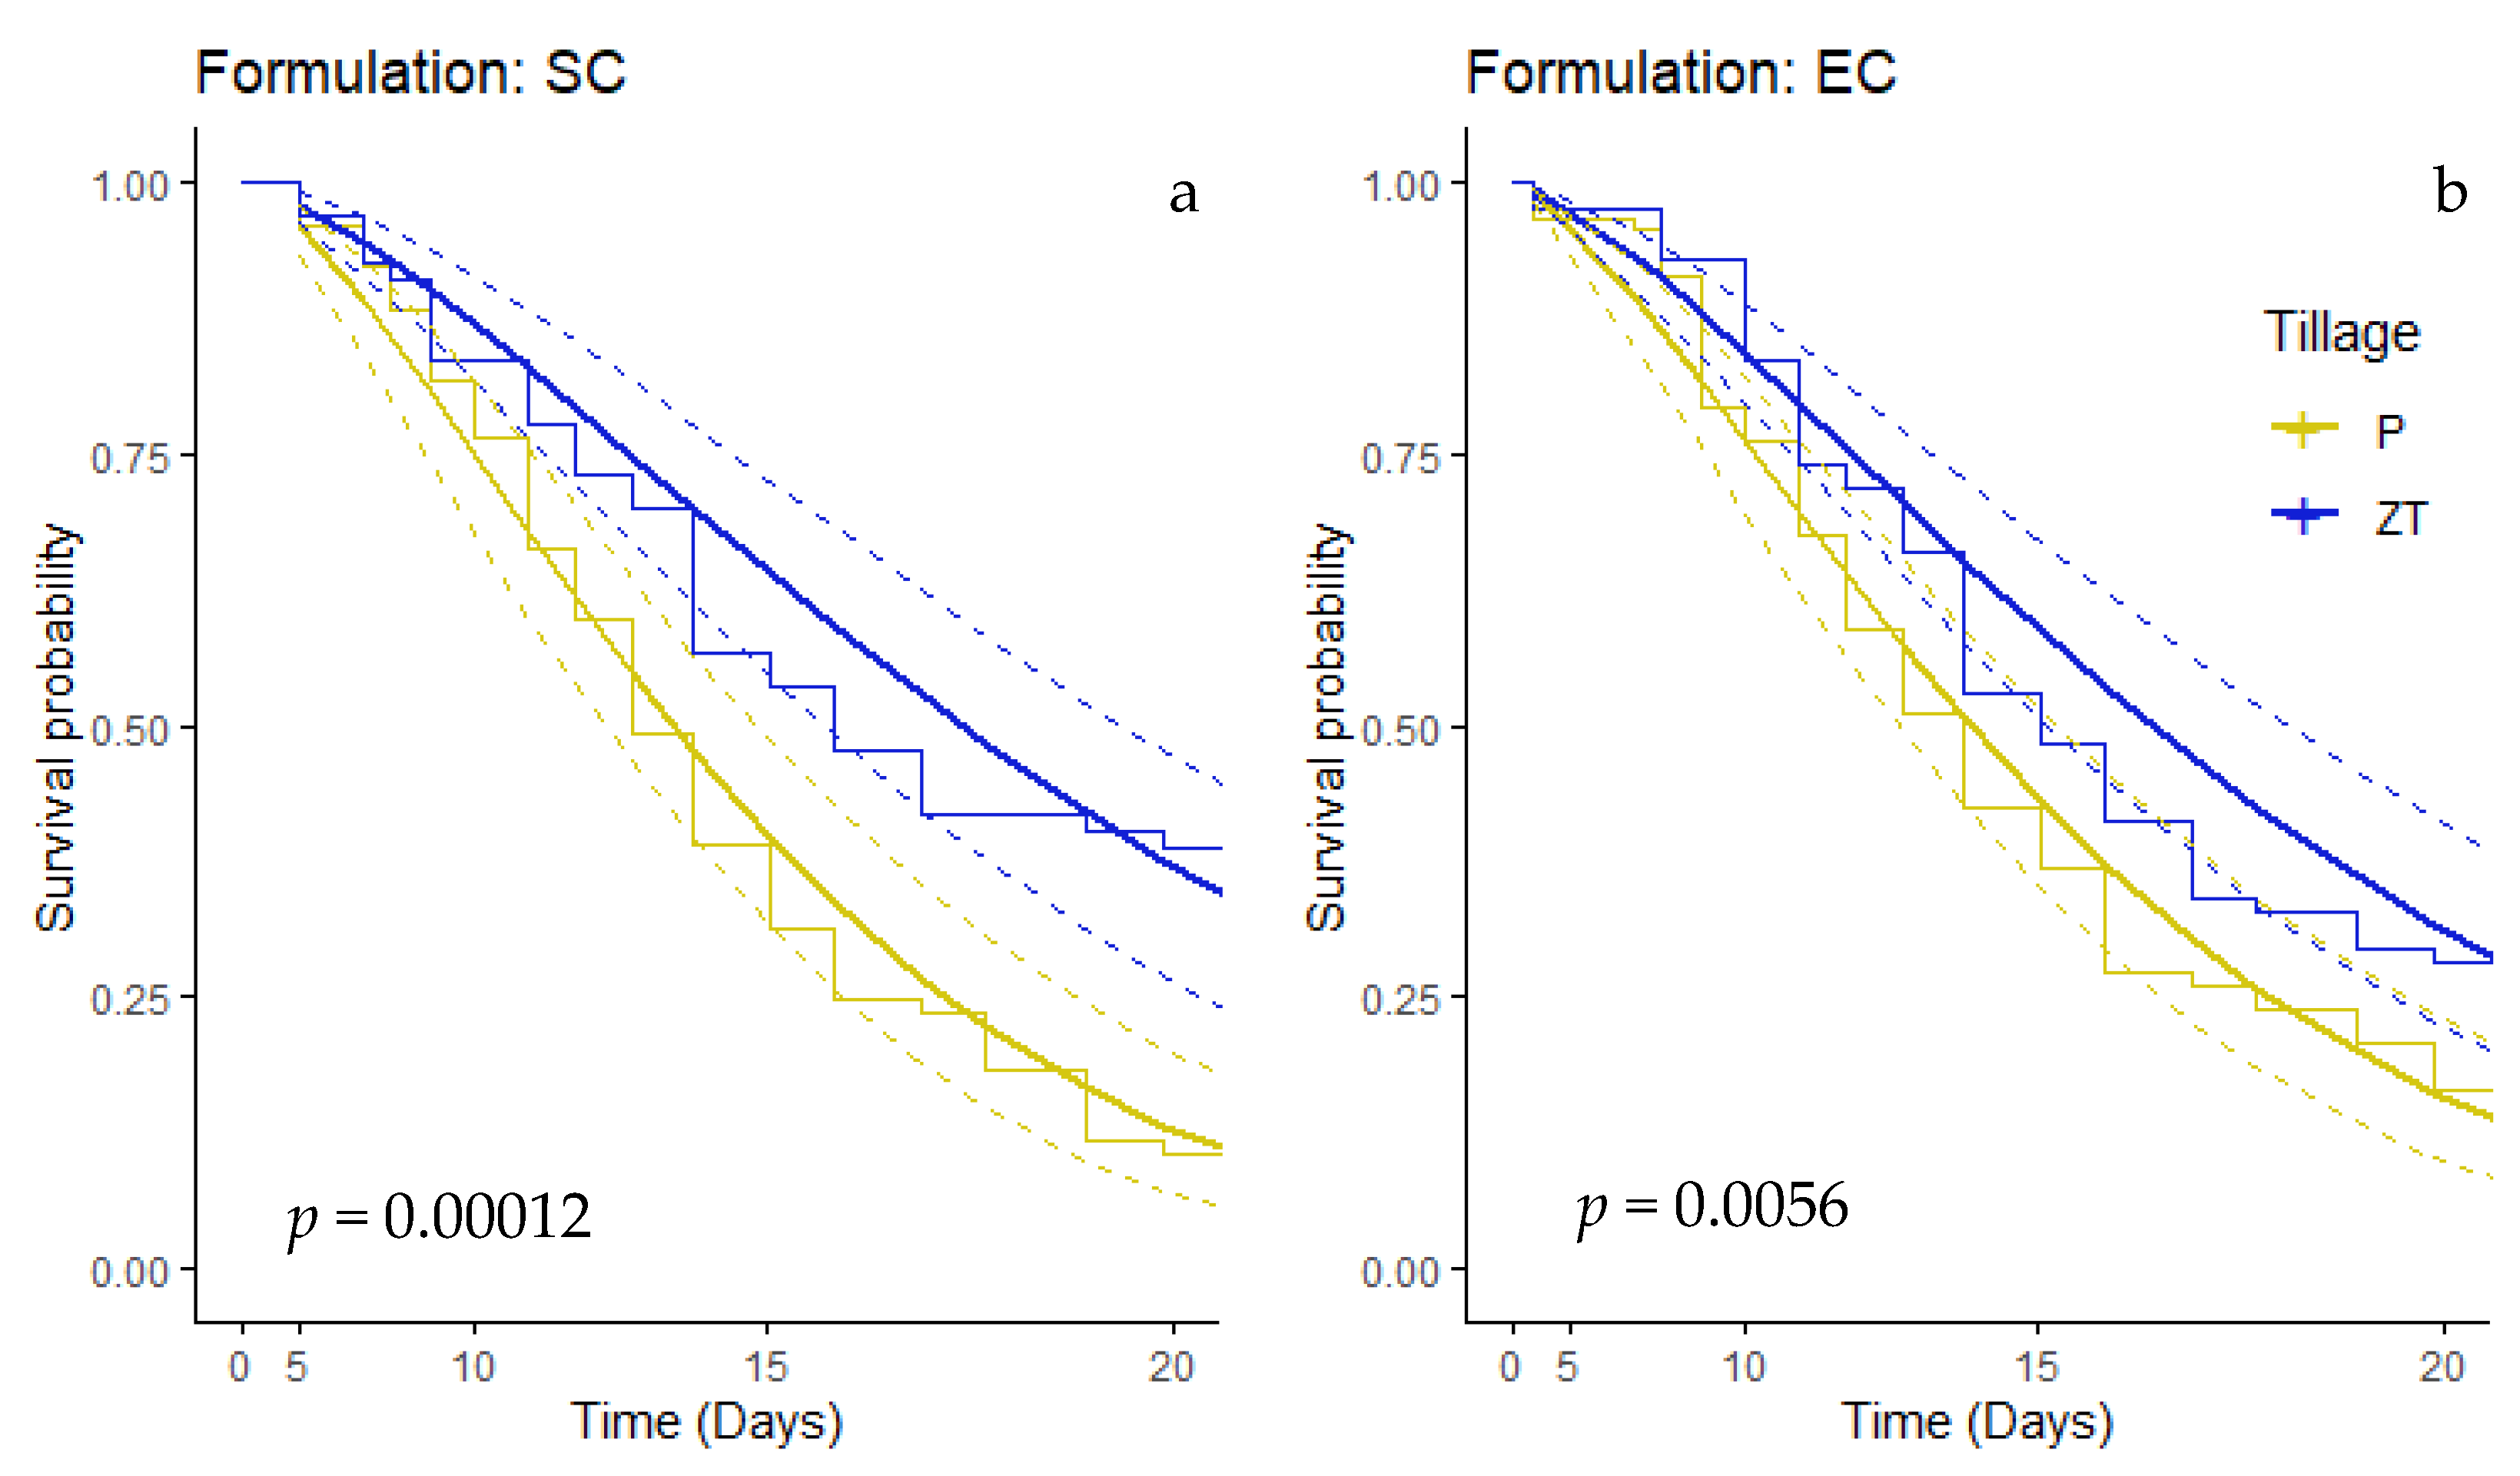
4.3. Formulation Bioefficacy Dependent on Tillage

In the commercial suspension concentrate (SC) formulation of atrazine, plants growing in ZT soil exhibited a higher survival probability over those in ploughed soil. In the emulsifiable concentrate (EC) non-commercial formulation, however, there was a smaller but still significant difference between ZT and ploughing. This may indicate an effect of formulation on the performance of a pesticide across contrasting tillage regimes. It follows then, that the organisation of the pore network across different tillage treatments may have differential transport implications on particulate- and solution-based chemicals. It has been demonstrated here and previously that tillage affects the soil pore network [22,25], and others have demonstrated that pore size can affect particulate transport and distribution in soil [75]; thus, particulate-based formulations may behave differently than solution-based formulations under contrasting soil management practices. Grayling et al. [75] demonstrated that particles in suspension are likely to become entrapped/immobilised on the surface layers of soil or pores within size ranges of 0.5–50 µm. This could explain the higher bioefficacy in the ploughed soil under the SC formulation, as a higher proportion of smaller pores will provide an abundance of locations for particulate immobilisation. Conversely, cylindrical macropores pores have been shown to support bypass over 90% of bulk soil during transport [76] and are thus likely to provide preferential transport pathways for both suspension and emulsifiable formulations, explaining the higher survival rates in ZT samples.
Correlations between pesticide bioefficacy and aspects of the imaged pore network were investigated and were previously shown to have relationships with the degree of preferential transport, such as the thickness of the imaged pore network and the connectivity density of the largest macropore cluster. No significant relationships were identified in the control treatment between measures of plant success and physical leaching indicators, meaning that in the control treatment, plant success was relatively uniform regardless of differences in the imaged pore network structural properties, representing natural soil structural heterogeneity. However, as concentration increased, some relationships were identified at different concentrations. For instance, a positive correlation was observed between the maximum imaged pore thickness and the pore size distribution coefficient of sorting order with RMST in the low-concentration SC formulation, and a negative correlation was observed between RMST with the pore size distribution of the coefficient of gradient curvature in the low concentration SC formulation. It is likely that properties previously identified to correlate with preferential transport indicate better survivability, as chemicals are more quickly made unavailable for plant root uptake in the root zone due to the presence of thicker pores. The following question remains: why are significant correlations not continuously observed at higher concentrations? Perhaps, at the highest concentration, despite differences in the degree of preferential transport carrying away varying proportions of the active ingredient, they are still high enough to uniformly impact growth. So, at higher concentrations, preferential transport may play a less important role in the distribution of chemicals away from the roots of germinating seeds. This interpretation that higher preferential flow means higher survivability based on correlations with physical indicators of preferential transport was only made for the SC formulation, with the opposing relationships being true for the EC formulation. The connectivity density of the LMC was previously demonstrated to correlate positively with the 5% arrival time of solute breakthrough, meaning that a lower connectivity density was related to faster preferential transport and, in turn, should drive plant success, as determined with plant biomass and total plant height. This relationship was also observed for the pore size distribution (coefficient of uniformity), supporting the idea that EC efficacy may be driven by alternate transport mechanisms. This warrants more specific, targeted investigation to disentangle potential changing relationships between application rate and chemical leaching.
Due to the restrictions placed on atrazine in the UK, it was not possible to carry out a field trial, as is typically performed to assess herbicide bioefficacy [77]. Here, we focussed on the influence of soil pore network structure on atrazine transport and performance under different tillage regimes and believe this to be the first study directly involving the use of X-ray Computed Tomography to understand herbicide bioefficacy [78]. However, due to the inherent complexity of soil systems, there may be other interplaying factors influencing the dynamics of bioefficacy in this study or elsewhere. Particularly, the sorption and degradation rates of herbicides associated with zero-tilled and ploughed soil has been shown to exhibit differences [79] potentially explained by differences in microbial decomposition [80]. And considering the relatively short half-life associated with atrazine in soil [81], the alternative microbiological degradation of herbicides between tillage practices may play an important role in environmental fate. The approach used here could be relevant for other products that are under pressure due to leaching to groundwater.
While atrazine (Aatrex® 4L) labels bear no mention of the required precipitation for herbicide activation, generally, plant protection products applied to soil are activated by some form of irrigation or rainfall [82]. The differences in bioefficacy between ZT and ploughed soil may be due, in part, to the static difference in water content between treatments throughout the experiment, which is inseparably linked to the pore size distribution [83]. The implications of the lower efficacy of both tested formulations of atrazine on soil managed with ZT are particularly problematic due to the lack of weed control options available, causing an inherent reliance on herbicides when adopting ZT for farm management.

5. Conclusions and Perspectives

Our results show that the bioefficacy of atrazine is dependent on soil tillage, with plants of the weed species of interest, Amaranthus retroflexus L., demonstrating higher plant success, in terms of the survival time, dry mass, and total length of plants in ZT, than in ploughed soil. Given that ZT practices may increase the dependence on chemical weed control, this finding could be of concern, particularly if similar trends are observed with other soil applied herbicides. Atrazine is currently banned in the EU and UK due to its failure to demonstrate safe levels in groundwater, yet there is limited published work on the effect of herbicide formulations on transport dynamics and pesticide fate. Here, we indicate the that changing the formulation of atrazine can influence pesticide bioefficacy. However, further work involving field-applied formulations and groundwater testing is necessary to explore the generalisability of these results. As expected, increasing the concentration of applied atrazine resulted in lower plant success. Relationships between measures of plant success and soil structural properties were only identified in some low- and medium-concentration subgroups, and followed contrasting explanations in the suspension and emulsifiable concentrate formulations. Thus, further clarification is needed to understand if this effect originates directly from variation in preferential transport pathways, or some indirect effect of an alternate pore size distribution generating different water distribution and chemical degradation properties. Considering the growing interest in the adoption of conservation approaches which eliminate tillage, there is also potentially a growing demand for the development and testing of land use-specific formulations.

Supplementary Materials

The following supporting information can be downloaded at https://www.mdpi.com/article/10.3390/agronomy15020360/s1: Figure S1: Soil water content time-series. Figure S2: PSD coefficients. Figure S3: Kaplan-Meier curves for plant establishment and survival. Figure S4: Correlations between plant success and pore network properties. Table S1: Summary statistics for plant success.

Author Contributions

Conceptualisation and writing—review and editing, D.L.R.W., S.J.M., C.J.S., F.N.P. and M.I.d.H.; methodology, D.L.R.W., C.J.S. and F.N.P.; software, validation, formal analysis, investigation, visualisation, project administration and writing—original draft preparation, D.L.R.W.; resources, supervision and funding acquisition, S.J.M., C.J.S., F.N.P. and M.I.d.H. All authors have read and agreed to the published version of the manuscript.

Funding

Author Daniel Luke Reuben Wardak declares that this study received funding from Syngenta Ltd. and the BBSRC. The authors declare that this research was co-funded by Biotechnology and Biological Sciences Research Council (UKRI–Government Research Organisation) and Syngenta as part of a doctoral training programme, grant number BB/T0083690/1. The APC was funded by the University of Nottingham.

Data Availability Statement

The original image data obtained and presented in the study have been made openly available in the Soil Structure Library (https://structurelib.ufz.de/lit/). Other data are available upon request to the corresponding author.

Acknowledgments

Authors recognise and appreciate the contributions of Bethany O’Sullivan for contributing bulk density and soil organic matter data from her experimental work; also of staff at the University of Nottingham for the technical assistance provided by Brian Atkinson, discussions regarding survival analysis with Johnatan Vilasboa, and plant physiology with Darren Wells.

Conflicts of Interest

Authors Martine de Heer and Faheem Padia were employed by the company Syngenta International Ltd. The remaining authors declare that the research was conducted in the absence of any commercial or financial relationships that could be construed as a potential conflict of interest. The BBSRC had no involvement with the study. Syngenta Ltd. had the following involvement with the study: Employees of Syngenta and co-authors Faheem Padia and Martine de Heer were involved in the design of methods, supply of agrochemical formulations, decision to publish, and had some oversight on the project through regular project meetings.

References

  1. DEFRA. Technical Annex: The Combined Environmental Land Management Offer, Agricultural Transition Plan 2021 to 2024. 2020. Available online: https://www.gov.uk/government/publications/agricultural-transition-plan-2021-to-2024 (accessed on 25 November 2024).
  2. Ogieriakhi, M.O.; Woodward, R.T. Understanding Why Farmers Adopt Soil Conservation Tillage: A Systematic Review. Soil Secur. 2022, 9, 100077. [Google Scholar] [CrossRef]
  3. Soane, B.D.; Ball, B.C.; Arvidsson, J.; Basch, G.; Moreno, F.; Roger-Estrade, J. No-till in Northern, Western and South-Western Europe: A Review of Problems and Opportunities for Crop Production and the Environment. Soil Tillage Res. 2012, 118, 66–87. [Google Scholar] [CrossRef]
  4. Alskaf, K.; Sparkes, D.L.; Mooney, S.J.; Sjögersten, S.; Wilson, P. The Uptake of Different Tillage Practices in England. Soil Use Manag. 2020, 36, 27–44. [Google Scholar] [CrossRef]
  5. Ridley, L.; Parrish, G.; Chantry, T.; Richmond, A.; MacArthur, R.; Garthwaite, D. Arable Crops in the UK 2022; Fera: York, UK, 2024; Available online: https://pusstats.fera.co.uk/api/report-download/699 (accessed on 25 November 2024).
  6. European Commission. Joint Research Centre. Scientific Evidence Showing the Impacts of Nature Restoration Actions on Food Productivity; Publications Office: Luxembourg, 2022.
  7. Melander, B.; Munier-Jolain, N.; Charles, R.; Wirth, J.; Schwarz, J.; Van Der Weide, R.; Bonin, L.; Jensen, P.K.; Kudsk, P. European Perspectives on the Adoption of Nonchemical Weed Management in Reduced-Tillage Systems for Arable Crops. Weed Technol. 2013, 27, 231–240. [Google Scholar] [CrossRef]
  8. DEFRA. Code of Practice for Using Plant Protection Products. 2006. Available online: https://www.hse.gov.uk/pesticides/assets/docs/Code_of_Practice_for_using_Plant_Protection_Products_-_Complete20Code.pdf (accessed on 25 November 2024).
  9. DAERA. Code of Practice for Using Plant Protection Products; Department of Agriculture and Rural Development: Belfast, Northern Ireland, 2011; ISBN 978-1-84807-210-7. [Google Scholar]
  10. Flury, M. Experimental Evidence of Transport of Pesticides through Field Soils—A Review. J. Environ. Qual. 1996, 25, 25–45. [Google Scholar] [CrossRef]
  11. Arias-Estévez, M.; López-Periago, E.; Martínez-Carballo, E.; Simal-Gándara, J.; Mejuto, J.-C.; García-Río, L. The Mobility and Degradation of Pesticides in Soils and the Pollution of Groundwater Resources. Agric. Ecosyst. Environ. 2008, 123, 247–260. [Google Scholar] [CrossRef]
  12. Beltran, J.; Gerritse, R.G.; Hernandez, F. Effect of Flow Rate on the Adsorption and Desorption of Glyphosate, Simazine and Atrazine in Columns of Sandy Soils. Eur. J. Soil Sci. 1998, 49, 149–156. [Google Scholar] [CrossRef]
  13. Alletto, L.; Coquet, Y.; Benoit, P.; Heddadj, D.; Barriuso, E. Tillage Management Effects on Pesticide Fate in Soils. A Review. Agron. Sustain. Dev. 2010, 30, 367–400. [Google Scholar] [CrossRef]
  14. Silburn, D.M. Pesticide Retention, Degradation, and Transport Off-Farm. In No-Till Farming Systems for Sustainable Agriculture; Dang, Y.P., Dalal, R.C., Menzies, N.W., Eds.; Springer: Cham, Switzerland, 2020; pp. 281–297. ISBN 978-3-030-46408-0. [Google Scholar]
  15. Rasool, S.; Rasool, T.; Gani, K.M. A Review of Interactions of Pesticides within Various Interfaces of Intrinsic and Organic Residue Amended Soil Environment. Chem. Eng. J. Adv. 2022, 11, 100301. [Google Scholar] [CrossRef]
  16. Holland, J.M. The Environmental Consequences of Adopting Conservation Tillage in Europe: Reviewing the Evidence. Agric. Ecosyst. Environ. 2004, 103, 1–25. [Google Scholar] [CrossRef]
  17. Elias, D.; Wang, L.; Jacinthe, P.-A. A Meta-Analysis of Pesticide Loss in Runoff under Conventional Tillage and No-till Management. Environ. Monit. Assess. 2018, 190, 79. [Google Scholar] [CrossRef] [PubMed]
  18. Hall, J.K.; Mumma, R.O.; Watts, D.W. Leaching and Runoff Losses of Herbicides in a Tilled and Untilled Field. Agric. Ecosyst. Environ. 1991, 37, 303–314. [Google Scholar] [CrossRef]
  19. Elliott, J.A.; Cessna, A.J.; Nicholaichuk, W.; Tollefson, L.C. Leaching Rates and Preferential Flow of Selected Herbicides through Tilled and Untilled Soil. J. Environ. Qual. 2000, 29, 1650–1656. [Google Scholar] [CrossRef]
  20. Chen, X.; Bai, B. Experimental Investigation and Modeling of Particulate Transportation and Deposition in Vertical and Horizontal Flows. Hydrogeol. J. 2015, 23, 365–375. [Google Scholar] [CrossRef]
  21. Lucas, M.; Nguyen, L.T.T.; Guber, A.; Kravchenko, A.N. Cover Crop Influence on Pore Size Distribution and Biopore Dynamics: Enumerating Root and Soil Faunal Effects. Front. Plant Sci. 2022, 13, 928569. [Google Scholar] [CrossRef]
  22. Wardak, D.L.R.; Padia, F.N.; De Heer, M.I.; Sturrock, C.J.; Mooney, S.J. Zero-Tillage Induces Significant Changes to the Soil Pore Network and Hydraulic Function after 7 Years. Geoderma 2024, 447, 116934. [Google Scholar] [CrossRef]
  23. Taina, I.A.; Heck, R.J.; Elliot, T.R. Application of X-Ray Computed Tomography to Soil Science: A Literature Review. Can. J. Soil Sci. 2008, 88, 1–19. [Google Scholar] [CrossRef]
  24. Ghosh, T.; Maity, P.P.; Rabbi, S.M.F.; Das, T.K.; Bhattacharyya, R. Application of X-Ray Computed Tomography in Soil and Plant -a Review. Front. Environ. Sci. 2023, 11, 1216630. [Google Scholar] [CrossRef]
  25. Wardak, D.L.R.; Padia, F.N.; De Heer, M.I.; Sturrock, C.J.; Mooney, S.J. Zero Tillage Has Important Consequences for Soil Pore Architecture and Hydraulic Transport: A Review. Geoderma 2022, 422, 115927. [Google Scholar] [CrossRef]
  26. Köhne, J.M.; Schlüter, S.; Vogel, H.-J. Predicting Solute Transport in Structured Soil Using Pore Network Models. Vadose Zone J. 2011, 10, 1082–1096. [Google Scholar] [CrossRef]
  27. Soto-Gómez, D.; Pérez-Rodríguez, P.; Vázquez-Juiz, L.; López-Periago, J.E.; Paradelo, M. Linking Pore Network Characteristics Extracted from CT Images to the Transport of Solute and Colloid Tracers in Soils under Different Tillage Managements. Soil Tillage Res. 2018, 177, 145–154. [Google Scholar] [CrossRef]
  28. Zhu, J.; Patzoldt, W.L.; Radwan, O.; Tranel, P.J.; Clough, S.J. Effects of Photosystem-II-Interfering Herbicides Atrazine and Bentazon on the Soybean Transcriptome. Plant Genome 2009, 2, 91–205. [Google Scholar] [CrossRef]
  29. Lewis, K.A.; Tzilivakis, J.; Warner, D.J.; Green, A. An International Database for Pesticide Risk Assessments and Management. Hum. Ecol. Risk Assess. Int. J. 2016, 22, 1050–1064. [Google Scholar] [CrossRef]
  30. Wirbisky, S.; Freeman, J. Atrazine Exposure and Reproductive Dysfunction through the Hypothalamus-Pituitary-Gonadal (HPG) Axis. Toxics 2015, 3, 414–450. [Google Scholar] [CrossRef]
  31. European Commission. Commission Decision of 10 March 2004 Concerning the Non-Inclusion of Atrazine in Annex I to Council Directive 91/414/EEC and the Withdrawal of Authorisations for Plant Protection Products Containing This Active Substance, 2004/248/EC. Off. J. Eur. Union 2004, 78, 53–55. [Google Scholar]
  32. USDA-NRCS. Effects of Conservation Practices on Water Erosion and Loss of Sediment at the Edge of the Field: A National Assessment Based on the 2003-06 CEAP Survey and APEX Modeling Databases; U.S. Department of Agriculture: Singapore; Natural Resources Conservation Service: Washington, DC, USA, 2017. Available online: https://www.nrcs.usda.gov/publications/ceap-crop-2017-sediment-loss.pdf (accessed on 25 November 2024).
  33. Ma, L.; Selim, H.M. Atrazine Retention and Transport in Soils. In Reviews of Environmental Contamination and Toxicology; Ware, G.W., Gunther, F.A., Eds.; Reviews of Environmental Contamination and Toxicology; Springer: New York, NY, USA, 1996; Volume 145, pp. 129–173. ISBN 978-1-4612-7513-8. [Google Scholar]
  34. Sadeghi, A.M.; Isensee, A.R.; Shirmohammadi, A. Influence of Soil Texture and Tillage on Herbicide Transport. Chemosphere 2000, 41, 1327–1332. [Google Scholar] [CrossRef] [PubMed]
  35. Montoya, J.C.; Costa, J.L.; Liedl, R.; Bedmar, F.; Daniel, P. Effects of Soil Type and Tillage Practice on Atrazine Transport through Intact Soil Cores. Geoderma 2006, 137, 161–173. [Google Scholar] [CrossRef]
  36. Khan, M.A.; Brown, C.D. Influence of Commercial Formulation on Leaching of Four Pesticides through Soil. Sci. Total Environ. 2016, 573, 1573–1579. [Google Scholar] [CrossRef]
  37. Gish, T.J.; Shirmohammadi, A.; Vyravipillai, R.; Wienhold, B.J. Herbicide Leaching under Tilled and No-Tillage Fields. Soil Sci. Soc. Am. J. 1995, 59, 895–901. [Google Scholar] [CrossRef]
  38. Hall, J.K.; Jones, G.A.; Hickman, M.V.; Amistadi, M.K.; Bogus, E.R.; Mumma, R.O.; Hartwig, N.L.; Hoffman, L.D. Formulation and Adjuvant Effects on Leaching of Atrazine and Metolachlor. J. Environ. Qual. 1998, 27, 1334–1347. [Google Scholar] [CrossRef]
  39. Zhang, H.; Zhou, D.; Matthew, C.; Wang, P.; Zheng, W. Photosynthetic Contribution of Cotyledons to Early Seedling Development in Cynoglossum divaricatum and Amaranthus retroflexus. N. Z. J. Bot. 2008, 46, 39–48. [Google Scholar] [CrossRef]
  40. Hamidzadeh Moghadam, S.; Alebrahim, M.T.; Tobeh, A.; Mohebodini, M.; Werck-Reichhart, D.; MacGregor, D.R.; Tseng, T.M. Redroot Pigweed (Amaranthus retroflexus L.) and Lamb’s Quarters (Chenopodium album L.) Populations Exhibit a High Degree of Morphological and Biochemical Diversity. Front. Plant Sci. 2021, 12, 593037. [Google Scholar] [CrossRef]
  41. Alskaf, K.; Mooney, S.J.; Sparkes, D.L.; Wilson, P.; Sjögersten, S. Short-Term Impacts of Different Tillage Practices and Plant Residue Retention on Soil Physical Properties and Greenhouse Gas Emissions. Soil Tillage Res. 2021, 206, 104803. [Google Scholar] [CrossRef]
  42. Alskaf, K. Conservation Agriculture for Sustainable Land Use: The Agronomic and Environmental Impacts of Different Tillage Practices and Plant Residue Retention: Farmer Uptake of Reduced Tillage in England. Ph.D. Thesis, University of Nottingham, Nottingham, UK, 2018. Available online: https://eprints.nottingham.ac.uk/51902/ (accessed on 25 November 2024).
  43. Shogaki, T. Mechanism of Sample Disturbance Caused by Tube Penetration: Model Tests on Toyoura Sand. Soils Found. 2017, 57, 527–542. [Google Scholar] [CrossRef]
  44. Williams, M.R.; McAfee, S.J.; Kent, B.E. Dye Tracers Reveal Potential Edge-Flow Effects in Undisturbed Lysimeters Sealed with Petrolatum. Vadose Zone J. 2019, 18, 1–9. [Google Scholar] [CrossRef]
  45. Berg, S.; Kutra, D.; Kroeger, T.; Straehle, C.N.; Kausler, B.X.; Haubold, C.; Schiegg, M.; Ales, J.; Beier, T.; Rudy, M.; et al. Ilastik: Interactive Machine Learning for (Bio)Image Analysis. Nat. Methods 2019, 16, 1226–1232. [Google Scholar] [CrossRef] [PubMed]
  46. Schindelin, J.; Arganda-Carreras, I.; Frise, E.; Kaynig, V.; Longair, M.; Pietzsch, T.; Preibisch, S.; Rueden, C.; Saalfeld, S.; Schmid, B.; et al. Fiji: An Open-Source Platform for Biological-Image Analysis. Nat. Methods 2012, 9, 676–682. [Google Scholar] [CrossRef]
  47. Domander, R.; Felder, A.A.; Doube, M. BoneJ2–Refactoring Established Research Software. Wellcome Open Res. 2021, 6, 37. [Google Scholar] [CrossRef]
  48. Lindsey III, B.E.; Rivero, L.; Calhoun, C.S.; Grotewold, E.; Brkljacic, J. Standardized Method for High-Throughput Sterilization of Arabidopsis Seeds. JoVE 2017, 128, 56587. [Google Scholar] [CrossRef]
  49. Wang, X.; Yesbergenova-Cuny, Z.; Biniek, C.; Bailly, C.; El-Maarouf-Bouteau, H.; Corbineau, F. Revisiting the Role of Ethylene and N-End Rule Pathway on Chilling-Induced Dormancy Release in Arabidopsis Seeds. Int. J. Mol. Sci. 2018, 19, 3577. [Google Scholar] [CrossRef]
  50. Halbritter, A.H.; De Boeck, H.J.; Eycott, A.E.; Reinsch, S.; Robinson, D.A.; Vicca, S.; Berauer, B.; Christiansen, C.T.; Estiarte, M.; Grünzweig, J.M.; et al. The Handbook for Standardized Field and Laboratory Measurements in Terrestrial Climate Change Experiments and Observational Studies (ClimEx). Methods Ecol. Evol. 2020, 11, 22–37. [Google Scholar] [CrossRef]
  51. Brunes, A.P.; Araújo, Á.D.S.; Dias, L.W.; Villela, F.A.; Aumonde, T.Z. Seedling Length in Wheat Determined by Image Processing Using Mathematical Tools. Rev. Ciência Agronômica 2016, 47, 374–379. [Google Scholar] [CrossRef]
  52. Pribyl, D.W. A Critical Review of the Conventional SOC to SOM Conversion Factor. Geoderma 2010, 156, 75–83. [Google Scholar] [CrossRef]
  53. Dettmann, U.; Kraft, N.N.; Rech, R.; Heidkamp, A.; Tiemeyer, B. Analysis of Peat Soil Organic Carbon, Total Nitrogen, Soil Water Content and Basal Respiration: Is There a ‘Best’ Drying Temperature? Geoderma 2021, 403, 115231. [Google Scholar] [CrossRef]
  54. O’Kelly, B.C. Oven-Drying Characteristics of Soils of Different Origins. Dry. Technol. 2005, 23, 1141–1149. [Google Scholar] [CrossRef]
  55. R Core Team. R: A Language and Environment for Statistical Computing; R Foundation for Statistical Computing: Vienna, Austria, 2023; Available online: https://www.R-project.org/ (accessed on 25 November 2024).
  56. Posit Team. RStudio: Integrated Development Environment for R; Posit Software; PBC: Boston, MA, USA, 2024; Available online: http://www.posit.co/ (accessed on 25 November 2024).
  57. Wickham, H. Ggplot2: Elegant Graphics for Data Analysis; Springer: New York, NY, USA, 2016; ISBN 978-3-319-24277-4. [Google Scholar]
  58. Kassambara, A.; Kosinski, M.; Biecek, P. Survminer: Drawing Survival Curves Using “Ggplot2”. 2024. Available online: https://CRAN.R-project.org/package=survminer (accessed on 25 November 2024).
  59. Jackson, C. Flexsurv: A Platform for Parametric Survival Modeling in R. J. Stat. Softw. 2016, 70, i08. [Google Scholar] [CrossRef] [PubMed]
  60. Therneau, T.M.; Grambsch, P.M. Modeling Survival Data: Extending the Cox Model; Springer: New York, NY, USA, 2000; ISBN 0-387-98784-3. [Google Scholar]
  61. Dey, T.; Mukherjee, A.; Chakraborty, S. A Practical Overview and Reporting Strategies for Statistical Analysis of Survival Studies. Chest 2020, 158, S39–S48. [Google Scholar] [CrossRef] [PubMed]
  62. Rich, J.T.; Neely, J.G.; Paniello, R.C.; Voelker, C.C.J.; Nussenbaum, B.; Wang, E.W. A Practical Guide to Understanding Kaplan-Meier Curves. Otolaryngol.-Head Neck Surg. 2010, 143, 331–336. [Google Scholar] [CrossRef] [PubMed]
  63. Damuzzo, V.; Agnoletto, L.; Leonardi, L.; Chiumente, M.; Mengato, D.; Messori, A. Analysis of Survival Curves: Statistical Methods Accounting for the Presence of Long-Term Survivors. Front. Oncol. 2019, 9, 453. [Google Scholar] [CrossRef] [PubMed]
  64. Cox, D.R.; Oakes, D. Analysis of Survival Data; Monographs on Statistics and Applied Probability; Chapman and Hall/CRC: New York, NY, USA, 1984; ISBN 0-412-224490-X. [Google Scholar]
  65. Pires, L.F.; Auler, A.C.; Roque, W.L.; Mooney, S.J. X-Ray Microtomography Analysis of Soil Pore Structure Dynamics under Wetting and Drying Cycles. Geoderma 2020, 362, 114103. [Google Scholar] [CrossRef] [PubMed]
  66. de Oliveira, J.A.T.; Cássaro, F.A.M.; Pires, L.F. Estimating Soil Porosity and Pore Size Distribution Changes Due to Wetting-Drying Cycles by Morphometric Image Analysis. Soil Tillage Res. 2021, 205, 104814. [Google Scholar] [CrossRef]
  67. Hao, H.; Hartmann, C.; Apichart, J.; Siwaporn, S.; Promsakha, S.; Richard, G.; Bruand, A.; Dexter, A.R. Slumping Dynamics in Tilled Sandy Soils under Natural Rainfall and Experimental Flooding. Soil Tillage Res. 2011, 114, 9–17. [Google Scholar] [CrossRef]
  68. Mitchell, J.; Johnston, I.G.; Bassel, G.W. Variability in Seeds: Biological, Ecological, and Agricultural Implications. J. Exp. Bot. 2017, 68, 809–817. [Google Scholar] [CrossRef] [PubMed]
  69. Ahmadnia, F.; Alebrahim, M.T.; Nabati Souha, L.; MacGregor, D.R. Evaluation of Techniques to Break Seed Dormancy in Redroot Pigweed (Amaranthus Retroflexus). Food Sci. Nutr. 2024, 12, 2334–2345. [Google Scholar] [CrossRef] [PubMed]
  70. Harper, J.L.; Williams, J.T.; Sagar, G.R. The Behaviour of Seeds in Soil: I. The Heterogeneity of Soil Surfaces and Its Role in Determining the Establishment of Plants from Seed. J. Ecol. 1965, 53, 273. [Google Scholar] [CrossRef]
  71. Ramezanpoor, M.; Salehian, H.; Babanezhad, E.; Rezvani, M. The Leaching of Atrazine and Plant Species Sensitivity to Atrazine Using Bioassays and Chemical Analyses. Soil Sediment Contam. Int. J. 2022, 31, 456–467. [Google Scholar] [CrossRef]
  72. Kolekar, P.D.; Phugare, S.S.; Jadhav, J.P. Biodegradation of Atrazine by Rhodococcus Sp. BCH2 to N-Isopropylammelide with Subsequent Assessment of Toxicity of Biodegraded Metabolites. Environ. Sci. Pollut. Res. 2014, 21, 2334–2345. [Google Scholar] [CrossRef] [PubMed]
  73. Barrios, R.E.; Gaonkar, O.; Snow, D.; Li, Y.; Li, X.; Bartelt-Hunt, S.L. Enhanced Biodegradation of Atrazine at High Infiltration Rates in Agricultural Soils. Environ. Sci. Process. Impacts 2019, 21, 999–1010. [Google Scholar] [CrossRef] [PubMed]
  74. Shen, J.; Yang, Q.; Hao, L.; Zhang, L.; Li, X.; Zheng, M. The Metabolism of a Novel Cytochrome P450 (CYP77B34) in Tribenuron-Methyl-Resistant Descurainia Sophia L. to Herbicides with Different Mode of Actions. Int. J. Mol. Sci. 2022, 23, 5812. [Google Scholar] [CrossRef]
  75. Grayling, K.M.; Young, S.D.; Roberts, C.J.; de Heer, M.I.; Shirley, I.M.; Sturrock, C.J.; Mooney, S.J. The Application of X-Ray Micro Computed Tomography Imaging for Tracing Particle Movement in Soil. Geoderma 2018, 321, 8–14. [Google Scholar] [CrossRef]
  76. Koestel, J.; Larsbo, M. Imaging and Quantification of Preferential Solute Transport in Soil Macropores. Water Resour. Res. 2014, 50, 4357–4378. [Google Scholar] [CrossRef]
  77. Singh, M.; Kumar, M.; Tomar, I.S.; Morya, J. Evaluation of Atrazine 50% WP Herbicide for Weed Control in Maize (Zea mays L.) of Jhabua Hills Zone of M.P. JAS 2021, 8, 311–317. [Google Scholar] [CrossRef]
  78. Kumar, S.; Chakraborty, P.; Anderson, S. X-Ray Computed Tomography for Studying Solute Transport in Soils. In X-Ray Imaging of the Soil Porous Architecture; Jon Mooney, S., Young, I.M., Heck, R.J., Peth, S., Eds.; Springer: Cham, Switzerland, 2022; pp. 99–112. ISBN 978-3-031-12175-3. [Google Scholar]
  79. Larsbo, M.; Stenström, J.; Etana, A.; Börjesson, E.; Jarvis, N.J. Herbicide Sorption, Degradation, and Leaching in Three Swedish Soils under Long-Term Conventional and Reduced Tillage. Soil Tillage Res. 2009, 105, 200–208. [Google Scholar] [CrossRef]
  80. Zablotowicz, R.M.; Locke, M.A.; Gaston, L.A. Tillage and Cover Effects on Soil Microbial Properties and Fluometuron Degradation. Biol. Fertil. Soils 2007, 44, 27–35. [Google Scholar] [CrossRef]
  81. Chowdhury, I.F.; Rohan, M.; Stodart, B.J.; Chen, C.; Wu, H.; Doran, G.S. Persistence of Atrazine and Trifluralin in a Clay Loam Soil Undergoing Different Temperature and Moisture Conditions. Environ. Pollut. 2021, 276, 116687. [Google Scholar] [CrossRef]
  82. Johnson, B.; Zimmer, M. Soil Applied Herbicides and Rainfall for Activation. In Pest&Crop Newsletter; Purdue University: West Lafayette, IN, USA, 2023. [Google Scholar]
  83. Nimmo, J.R. Porosity and Pore Size Distribution. In Reference Module in Earth Systems and Environmental Sciences; Elsevier: Amsterdam, The Netherlands, 2013; ISBN 978-0-12-409548-9. [Google Scholar] [CrossRef]
Figure 1. Potential censoring pathways during plant event progression, including our proxies for assessment, where et represents the number of established plants (e) at time point t, and et-1 is the number of observed established plants at the previous time point. Circular arrows represent no changing in plant state and T junction arrows indicate a termination of event progression. (Created with Biorender.com).
Agronomy 15 00360 g001
Figure 2. Three-dimensional thickness map of the imaged pore network in one sample from ZT (top), ploughed (middle), and repacked (bottom) samples. Smaller pores in purple have been removed iteratively from left to right, leaving large pores visible: (left) all pores visible; (middle) smallest pores (thickness < 0.35 mm) removed; (right) only largest pores (thickness > 0.55 mm) remain visible. Created with Biorender.com.
Agronomy 15 00360 g002
Figure 3. Differences in (a) total imaged porosity, (b) the Euler density of the entire imaged pore network, and differences in properties of the largest macropore cluster (LMC), including (c) volume, (d) proportion of total pore network volume, (e) connectivity density, and (f) average thickness between ploughed columns in yellow (P, n = 32), zero-tilled columns in blue (ZT, n = 32) and repacked columns in green (RP, n = 8). Asterisks denote statistical significance at the following levels: **, p ≤ 0.01; ***, p ≤ 0.001; ****, p ≤ 0.0001. The whiskers extend to the minimum and maximum data points within of 1.5 × interquartile range, with dots representing data outside of this range, and ns indicating no statistical significance.
Agronomy 15 00360 g003
Figure 4. Three-dimensional pore size distribution for ploughed samples (n = 32), in yellow, ZT samples (n = 32), in blue, and repacked samples (n = 8), in green, with each class (represented by a single value along the x-axis) generated from the thickness map histogram, containing a range of values from the previous class (i.e., 0.316 = 0.178-0.316). One exception is the smallest class range, which runs from the limit of detection, 0.098 (2x voxel height/width of 0.049), to 0.1. Asterisks denote statistical significance at the following levels: *, p ≤ 0.05; **, p ≤ 0.01; ***, p ≤ 0.001; ****, p ≤ 0.0001. The whiskers extend to the minimum and maximum data points within of 1.5 × interquartile range, with dots representing data outside of this range, and ns indicating no statistical significance.
Agronomy 15 00360 g004
Figure 5. Differences in the measures of plant success in the control treatments (no Atrazine): (a) dry plant mass and (b) total plant height and (c) restricted mean survival time between ploughed samples, in yellow (n = 8), and ZT samples, in blue (n = 8). ns indicating no statistical significance.
Agronomy 15 00360 g005
Figure 6. Effects of modelled relationships between concentration and measures of plant success including (a) dry plant mass, (b) total plant height and (c) restricted mean survival time between ZT, in blue (n = 32), and ploughed, in yellow (n = 32) with observations represented by dots. The x-axes were transformed using the cube root and square root functions for dry plant mass and total plant height, respectively, to account for correlations between mean and variance, and with a natural logarithm for the concentration of all plots.
Agronomy 15 00360 g006
Figure 7. Kaplan–Meier curves with Weibull distribution model showing significant population distribution deviation of tillage in both SC (a) and EC (b) formulations with ploughed samples (P, n = 12) in yellow and zero-tillage samples (ZT, n = 12) in blue. Curved lines indicate a potential formulation effect on the survival probability over time, dependent on tillage, and dotted lines represent the 95% confidence interval.
Agronomy 15 00360 g007
Table 1. Summary statistics for bulk density (BD) and soil organic matter (SOM) determined by loss on ignition between zero-tilled (ZT) and ploughed (P) soil. Letters in italics represent significant differences between treatments, and groups sharing the same letter indicate no significant difference.
nBDSDnOMSD
ZT40.953 a0.01736.31 a0.60
P41.016 b0.03145.52 a0.39
Table 2. Summary statistics for total imaged network properties and properties of the largest macropore cluster (LMC), including mean and standard deviation (SD). Letters in italics represent significant differences between treatments (ploughed—P, n = 32; zero-tilled—ZT, n = 32; and repacked—RP, n = 8), with groups sharing the same letter indicating no significant difference.
Total Imaged Porosity (%)Euler Density (mm−3)
TillageMean SDMean SD
P 4.94a1.651.83a0.33
ZT6.98b2.260.769b0.404
RP8.67b1.602.85c0.63
Volume of LMC (mm3)Proportion of LMC (%)
TillageMean SDMean SD
P5160a421338.8a19.1
ZT12571b600470.2ab17.1
RP7825ab517128.7b17.0
LMC connectivity density (mm−3)LMC average thickness (mm)
TillageMean SDMean SD
P0.0244a0.02120.970a0.402
ZT0.136b0.0951.24b0.33
RP0.174b0.1250.224c0.039
Disclaimer/Publisher’s Note: The statements, opinions and data contained in all publications are solely those of the individual author(s) and contributor(s) and not of MDPI and/or the editor(s). MDPI and/or the editor(s) disclaim responsibility for any injury to people or property resulting from any ideas, methods, instructions or products referred to in the content.

