Article

Non-Destructive Detection of pH Value During Secondary Fermentation of Maize Silage Using Colorimetric Sensor Array Combined with Hyperspectral Imaging Technology

1
College of Mechanical and Electrical Engineering, Inner Mongolia Agricultural University, Hohhot 010018, China
2
Inner Mongolia Engineering Research Center of Intelligent Equipment for the Entire Process of Forage and Feed Production, Hohhot 010018, China
*
Author to whom correspondence should be addressed.
Agronomy 2025, 15(2), 285; https://doi.org/10.3390/agronomy15020285
Submission received: 2 January 2025 / Revised: 20 January 2025 / Accepted: 22 January 2025 / Published: 23 January 2025
(This article belongs to the Section Precision and Digital Agriculture)

Abstract

:
The pH value of maize silage can accurately reflect its quality. In this study, a colorimetric sensor array (CSA) combined with hyperspectral imaging (HSI) was used to predict the pH value of maize silage during secondary fermentation. Seventeen color-sensitive dyes were used to construct the CSA, which was subsequently applied to capture the volatile odor profiles of maize silage samples. Hyperspectral images of the color-sensitive dyes on the CSA were acquired using the HSI technique. Different algorithms were used to preprocess the raw spectral data of each dye, and a partial least squares regression (PLSR) model was built for each dye separately. Subsequently, the adaptive bacterial foraging optimization (ABFO) algorithm was employed to identify three color-sensitive dyes that demonstrated heightened sensitivity to pH variations in maize silage. This study further compared the capabilities of individual dyes, as well as their combinations, in predicting the pH value of maize silage. Additionally, a novel feature wavelength extraction method based on the ABFO algorithm was proposed, which was then compared with two traditional feature extraction algorithms. These methods were combined with PLSR and backpropagation neural network (BPNN) algorithms to construct a quantitative prediction model for the pH value of maize silage. The results show that the quantitative prediction model constructed based on three dyes was more accurate than that constructed based on an individual dye. Among them, the ABFO-BPNN model constructed on the basis of combined dyes had the best prediction performance, with prediction correlation coefficient ( R P 2 ), root mean square error of the prediction set (RMSEP), and ratio of performance deviation (RPD) values of 0.9348, 0.3976, and 3.9695, respectively. The aim of this study was to develop a reliable evaluation model to achieve fast and accurate predictions of silage pH.

1. Introduction

Maize, as one of the most extensively cultivated and prolific food crops globally, not only plays a pivotal role in the human food supply chain but also serves as the primary feed ingredient in the livestock industry [1]. As a vital feed resource, maize silage plays a crucial role in enhancing the productivity and economic efficiency of livestock farming [2,3]. Silage is an agricultural feed preservation technology designed to maintain and enhance the nutritional value of green feed through an anaerobic fermentation environment [4,5]. Converting the whole maize plant into high-quality feed through silage technology not only maximizes the nutritional value of the maize plant but also effectively improves the comprehensive utilization rate of feed resources and provides a strong support for the sustainable development of the animal husbandry industry [6]. During this process, the sugars in the feed are converted into lactic and other organic acids, which lowers the pH of the feed, thereby inhibiting the growth of spoilage microorganisms and ensuring the safety of the feed [7,8]. Secondary fermentation describes the undesirable metabolic processes triggered when silage is exposed to air following the completion of primary anaerobic fermentation. This phenomenon often leads to nutrient loss, spoilage, and a pH increase, which compromise the quality and safety of the silage. Consequently, pH is a crucial index for assessing the quality of maize silage. However, a number of factors in the preparation, packaging, and storage of maize silage can lead to the exposure of the feed to air, leading to secondary fermentation and, consequently, spoilage. The use of spoiled feed for livestock can cause diseases and, subsequently, economic losses [9]. Given these considerations, prioritizing the development of a rapid and accurate method to measure pH levels during the secondary fermentation of maize silage is important to ensure its quality and safety.
Currently, the primary approach for determining the pH of maize silage relies on a laboratory analysis [10]. The method is accurate, but it has problems such as a complex detection process, a slow detection speed, a high cost, and a destructive effect. Therefore, there is an urgent need to develop a simple, non-destructive, and low-cost technique for the pH testing of maize silage.
A colorimetric sensor array (CSA) is a non-destructive, rapid detection technique that has emerged in recent years [11,12,13]. The technology recognizes complex volatile compounds by mimicking the olfactory system of animals, ultimately enabling the differentiation and detection of chemical substances. Compared to traditional electronic nose technology, CSAs offer higher sensitivity, have no sensor aging problems, and are less affected by environmental factors [14]. In addition, the information obtained through CSAs can be combined with chemometric methods for the quantitative detection of targets. To date, CSA technology has been successfully applied in the field of food quality analysis, such as for the classification and identification of beer and vinegar [15,16] and the prediction of the freshness of meat and seafood [17,18,19,20]. This technique usually extracts the R, G, and B of the color-sensitive dyes in the CSA image for analysis. However, the extracted color values are limited in the information that they can provide and thus do not offer enough information to express the reaction between the dye and the volatile compounds [21,22]. Therefore, it is necessary to incorporate a new approach to provide higher-dimensional information.
Hyperspectral imaging (HSI) is an advanced imaging technique that captures the full spectrum of each pixel in an image. The data acquisition of color-sensitive dyes on a CSA using HSI can yield a great deal of characterization information [23,24]. To date, CSA combined with spectroscopy have been successfully applied for the rapid determination of black tea aroma and the classification of matcha quality [25,26,27]. Preprocessing methods for spectra refer to the algorithmic processing of raw spectral data to reduce noise and normalize spectral signals to ensure the reliability of subsequent modeling efforts. However, relatively little research has been conducted on the optimal pretreatment methods for different dyes [28]. Meanwhile, the feature extraction algorithms used in previous studies are conventional methods [29]. Consequently, it is necessary to screen the best preprocessing methods for different dyes and introduce a new feature extraction algorithm to mine targeted combinations of feature wavelengths more efficiently to obtain more reliable chemometric models.
The hypotheses of this study were as follows: a CSA combined with HSI can provide an accurate prediction of pH during the secondary fermentation of maize silage; the prediction performance of the regression model can be improved by processing the CSA spectral data with suitable preprocessing algorithms and feature variable screening algorithms; and dye combinations selected based on the ABFO algorithm provide superior modeling accuracy and robustness to individual dyes. This study aimed to establish a non-destructive, rapid, and accurate approach to predict the pH value of maize silage during secondary fermentation by integrating a colorimetric sensor array with hyperspectral imaging technology. The main work of this study included the following: (1) A CSA was prepared with seventeen color-sensitive dyes. Subsequently, the volatile odor information of the samples was captured using the CSA, and the spectral data of the dyes on the CSA were acquired using an HSI system. (2) Five algorithms, including SNV, were used to preprocess the raw spectra and establish a PLSR model to screen the best preprocessing algorithm for each dye. Additionally, the ABFO algorithm was employed to select the three dyes exhibiting the best response to the pH of maize silage. (3) A feature wavelength screening method based on the ABFO algorithm was proposed, while hyperspectral feature variables were extracted using the competitive adaptive reweighted sampling (CARS) and uninformative variable elimination (UVE) algorithms. (4) Using the feature wavelengths extracted by the different algorithms as inputs, PLSR and BPNN prediction models for maize silage pH were constructed, the prediction performances of individual and combinatorial dyes were compared, and the best regression method was selected for accurate prediction.

2. Materials and Methods

2.1. Preparation of Maize Silage Samples

To ensure this study’s representativeness, maize silage samples were collected from two major agricultural regions with distinct climatic conditions and soil characteristics. Specifically, samples were sourced from the Inner Mongolia Autonomous Region and Anhui Province, with two varieties from each region. The maize silage varieties procured in Inner Mongolia were Long 1217 and Kehe 696, which were stored in glass jars and cellars, respectively; the varieties procured in Anhui Province were Jingza 442 and Hongsai 4, both of which were stored using the film-wrapping method. A total of 200 kg of maize silage was purchased, with 50 kg for each variety. Glass jars are typically used for small-scale silage storage or research, utilizing airtight containers to create a controlled anaerobic environment. Cellaring involves the preservation of compacted silage in underground or semi-underground cellars to minimize air exposure and preserve quality effectively. The film-wrapping method entails encasing compacted silage in plastic film to sustain anaerobic conditions, thereby effectively preventing spoilage.
Upon the arrival of each batch of feed, we immediately checked for spoilage, mold, and odor to ensure initial quality. The maize silage samples were processed, and quality indices were determined at the Laboratory of Agricultural Mechanization Engineering Discipline of Inner Mongolia Agricultural University (111°43′ E, 40°49′ N). In preparing the samples, the silage was subdivided using the quartering method. The quartering method is a statistical sampling method whereby well-mixed silage is spread in a circle and divided diagonally into four equal parts, and the two opposite diagonal parts are selected; this process is repeated until the desired sample size is achieved. In this study, each batch of silage samples was divided into 16 portions (3 kg each) using this method and then placed in polyethylene boxes. Additionally, the samples collected were subjected to aerobic exposure for 0 to 7 days in order to simulate the secondary fermentation process of maize silage. For each day of sampling, two randomly selected boxes of maize silage were partitioned into three equal sections within the polyethylene box, with one sample extracted from each section. Daily, 6 samples were collected and analyzed, culminating in a total of 192 samples. To collect the samples needed for pH and CSA information, the collected maize silage samples were reduced to 60.0 g using the quartering method, of which 50 g was used for the CSA reaction, and 10 g was used for pH determination.

2.2. Preparation of CSA

In this study, the CSA used for detection was prepared with color-sensitive dyes. In the pre-experimental stage, we performed a preliminary screening of color-sensitive dyes and eliminated those with poor dyeing and diffusion properties based on their diffusion effects. Ultimately, a total of seventeen color-sensitive dyes were selected, comprising eight TPPS dyes and nine pH indicators. Their positional distribution is shown in Figure 1c. Basic information of the 17 dyes is shown in the Supplementary Materials (Table S1).
The CSA was prepared as follows: (1) 10 mg of porphyrin and a pH indicator were dissolved in 5 mL of dichloromethane and anhydrous ethanol, respectively, to produce a mass concentration of 2 mg/mL of each solution. (2) The configured solution was sonicated in a sonicator for 20 min for thorough mixing, after which it was placed in a brown bottle and stored at a low temperature away from light. (3) A C2 reverse-phase silica gel plate was chosen as the substrate for the sensor array. Initially, it was cut into a 4 cm × 3 cm rectangle. Subsequently, 1 μL of solution was extracted using a 100 × 0.3 mm capillary instrument and dotted on the front side of the substrate to construct a 5 × 4 sensor array.

2.3. pH Determination

The pH of the maize silage was measured in accordance with the Chinese national standard (GB/T 5009.237-2016) [30] and a local standard (DB15/T 1458-2018) [31]. These standards provide specific protocols for sample preparation and measurement procedures to ensure the accuracy and repeatability of the maize silage pH measurements. Specifically, the procedure was as follows: The prepared 10 g of maize silage was placed in a 300 mL glass; then, 90 mL of distilled water was poured into the glass, mixed well with the sample, and left to stand for 0.5 h. After standing, the samples were filtered using four layers of gauze, followed immediately by a pH measurement of the filtrate using a pH meter (PHS-3CB, Shanghai Yue Ping Technology Co., Ltd., Shanghai, China). Each measurement was repeated three times, and the average of the three measurements was used as the final pH value. The measurement process is shown in Figure 1a.

2.4. Hyperspectral Image Acquisition of CSA

Figure 1b illustrates the process of odor detection and data acquisition for CSA-based maize silage. A pre-weighed 50 g sample of maize silage was placed in a 60 mm diameter glass beaker. The sensor was attached to the parafilm, and the parafilm was sealed over the beaker’s opening. This setup ensured that the color-sensitive dyes on the sensor reacted adequately with the volatile compounds. The reaction was carried out at room temperature for 15 min. At the end of the reaction, spectral data were acquired using the HSI system.
The system primarily comprises a hyperspectral image spectrometer (ImSpector Model V10E, Spectral Imaging Ltd., Oulu, FL, USA), a CCD camera (IGV-B1620, Imperx, Boca Raton, FL, USA), and a mobile control platform (IRCP0076-1COM, ISUZU Optics Co., Ltd., Zhubei City, Taiwan, China). The spectral acquisition range of the hyperspectral camera is from 383 to 1004 nm. However, due to the obvious noise at the front and back ends, we only chose the wavelength range of 400 to 1000 nm for modeling. Before data acquisition, the HSI system was turned on in advance to warm up for 30 min. A full white calibration spectral image was obtained using a standard whiteboard, the lens was covered to obtain a full black calibration spectral image, and the spectral image of the original sample was corrected according to the following equation:
R = I B W B
Here, R refers to the hyperspectral image data after correction, I is the raw hyperspectral image data, B is the hyperspectral image data of the blackboard, and W is the hyperspectral image data of the whiteboard. After calibration, each dye region in the CSA hyperspectral image was treated as a region of interest (ROI), and the average spectral data of the ROI were extracted using ENVI 5.6 (ITT Visual Information Solutions, Boulder, CO, USA).

2.5. Data Analysis Methods

2.5.1. Spectral Data Preprocessing

Hyperspectral information contains not only useful physical and chemical information but also interfering signals such as instrumental noise and electrical noise. Therefore, preprocessing of the raw spectra is required to eliminate sample-irrelevant information [32]. In this study, five algorithms were employed to preprocess the raw spectra: the standard normal variate (SNV) method, Savitzky–Golay (SG) smoothing, the first-order derivation method (FD), multiplicative scatter correction (MSC), and the second-order derivation method (SD). Before spectral preprocessing, the data often need to be divided into two datasets for training and prediction. The Kennard–Stone (K-S) algorithm was employed to partition each dataset into training and prediction sets in a 4:1 ratio, resulting in 154 samples for training and 38 samples for prediction [33]. This method ensures the independence and representativeness of the training and prediction sets.

2.5.2. Feature Variable Screening

Although the full-band information source is more comprehensive, the redundant information from overlapping band information may lead to a lower prediction accuracy of the model [34]. In this study, the ABFO, CARS, and UVE algorithms were used to optimize the characteristic wavelengths, and effective spectral information was used to build a prediction model to simplify the model complexity.
The CARS algorithm uses the absolute magnitude of the regression coefficients in the PLS model as an evaluation index of the importance of the variables, and it selects the optimal combination of characteristic variables based on the size of the root mean squared error in the cross-validation of the PLS model [35]. The core of the algorithm is the use of an adaptive reweighting strategy that selects variables through a competitive mechanism. At each iteration step, the algorithm evaluates the contribution of all variables and weights them according to their contribution to the model performance. Low-contributing variables are given lower weights and may be eliminated in subsequent iterations, thus achieving an effective reduction in the number of variables. This method can reduce the interference of redundant data so that the optimized combination of variables can be selected to improve the stability and prediction effect of the model. For the CARS algorithm, the numbers of Monte Carlo samples and cross-validations were set to 50 and 5, respectively.
The UVE algorithm is also widely used in spectral analyses. This algorithm is a spectral line screening method established based on PLS regression coefficients that can effectively screen out useful feature spectral lines and simplify the model [36]. The core concept involves artificially adding a random noise matrix, building a PLS model through cross-validation, and calculating the ratio of the mean regression coefficient for each variable in the coefficient matrix to its standard deviation. The maximum ratio from the noise matrix serves as a threshold, and spectral lines with ratios below this threshold are discarded as irrelevant information. For feature wavelength selection with UVE, the number of latent variables used in the partial least squares regression was set to 10, and the number of repetitions of the UVE algorithm for stability selection was set to 20.

2.5.3. Adaptive Bacterial Foraging Optimization (ABFO)

ABFO is a heuristic global optimization algorithm inspired by the foraging behavior of microorganisms such as E. coli. This algorithm simulates the process of bacteria searching for nutrients by swimming and tumbling. The ABFO algorithm is an improvement in the standard bacterial foraging optimization (BFO) algorithm as the lifecycle of bacteria, a social learning mechanism, and an adaptive search step size are introduced to enhance performance. This improvement allows the ABFO algorithm to exhibit better search capabilities and higher efficiency when handling problems of higher complexity and greater dimensionality [37].
In this study, a support vector regressor (SVR) was integrated into the ABFO algorithm to identify the characteristic wavelengths of the color-sensitive dyes most closely correlated with the pH of maize silage. The root mean square error of prediction (RMSEP) on the prediction set of the SVR model is used as the objective function of the ABFO algorithm, which aims to find the optimal solution by minimizing the RMSEP. For a bacterial population of a given size, each bacterium is considered as a solution in the search space. First, the position of each bacterium is randomly initialized in the search space. During each iteration, the bacteria adjust their positions following the algorithm’s rules. The iteration process continues until the maximum number of iterations is reached. Through the above steps, the ABFO algorithm can be gradually optimized to obtain the optimal solution. Additionally, the algorithm was executed independently 50 times, with the frequency of feature selection and information on the optimal bacteria recorded for each run. When applying the ABFO algorithm, the bacterial population size was set to 50, and the maximum number of iterations of the algorithm was 100.

2.5.4. Establishment of Models

In this study, a partial least squares regression (PLSR) model was built using the post-pretreatment spectral data of each dye as the input to investigate the optimal pretreatment method for each dye. Using the characteristic spectral data as the input, BPNN and PLSR prediction models were established to explore the relationship between the characteristic spectral data and the pH value of maize silage and to identify the optimal prediction model.
PLSR is a statistical method specifically designed to handle datasets with multicollinearity [38]. PLSR combines the features of a principal component analysis (PCA) and multiple linear regression to construct a model by extracting the latent variables from the predictor variables that have the largest covariance with the response variable. These latent variables are generated by linearly combining the original variables with the aim of reducing the dimensionality of the data while retaining the most important variance and predictive information. This method is particularly suitable for situations where the number of predictor variables is large, the variables are highly correlated, or the number of observations is small.
BPNN, a concept introduced in 1986 by scientists led by Rumelhart and McClelland, is a multilayer feedforward neural network trained according to the error backpropagation algorithm. This neural network propagates forward by processing the input signal layer by layer and outputting the result, where the state of each neuron only affects the state of the neuron in the next layer. If the predicted output does not match the desired output, it is backpropagated, adjusting the weights and thresholds between neurons to minimize the error and gradually approach the desired output [39]. During model training, the model learning rate is set to 0.1, and the maximum number of training iterations is 1000.

2.5.5. Model Evaluation

To evaluate the performance of the model, the model predictions are assessed via the training set coefficient of determination ( R C 2 ), the training set root mean square error (RMSEC), the prediction set coefficient of determination ( R P 2 ), the root mean square error of the prediction set (RMSEP), and the ratio of performance deviation (RPD). The larger the R C 2 , R P 2 , and RPD values, the better the predictive performance of the model. An RPD value greater than 3 indicates that the model demonstrates high stability [40]. An increase in the RPD value reflects the enhanced predictive performance of the model [41].

3. Results

3.1. pH Changes During the Secondary Fermentation Process

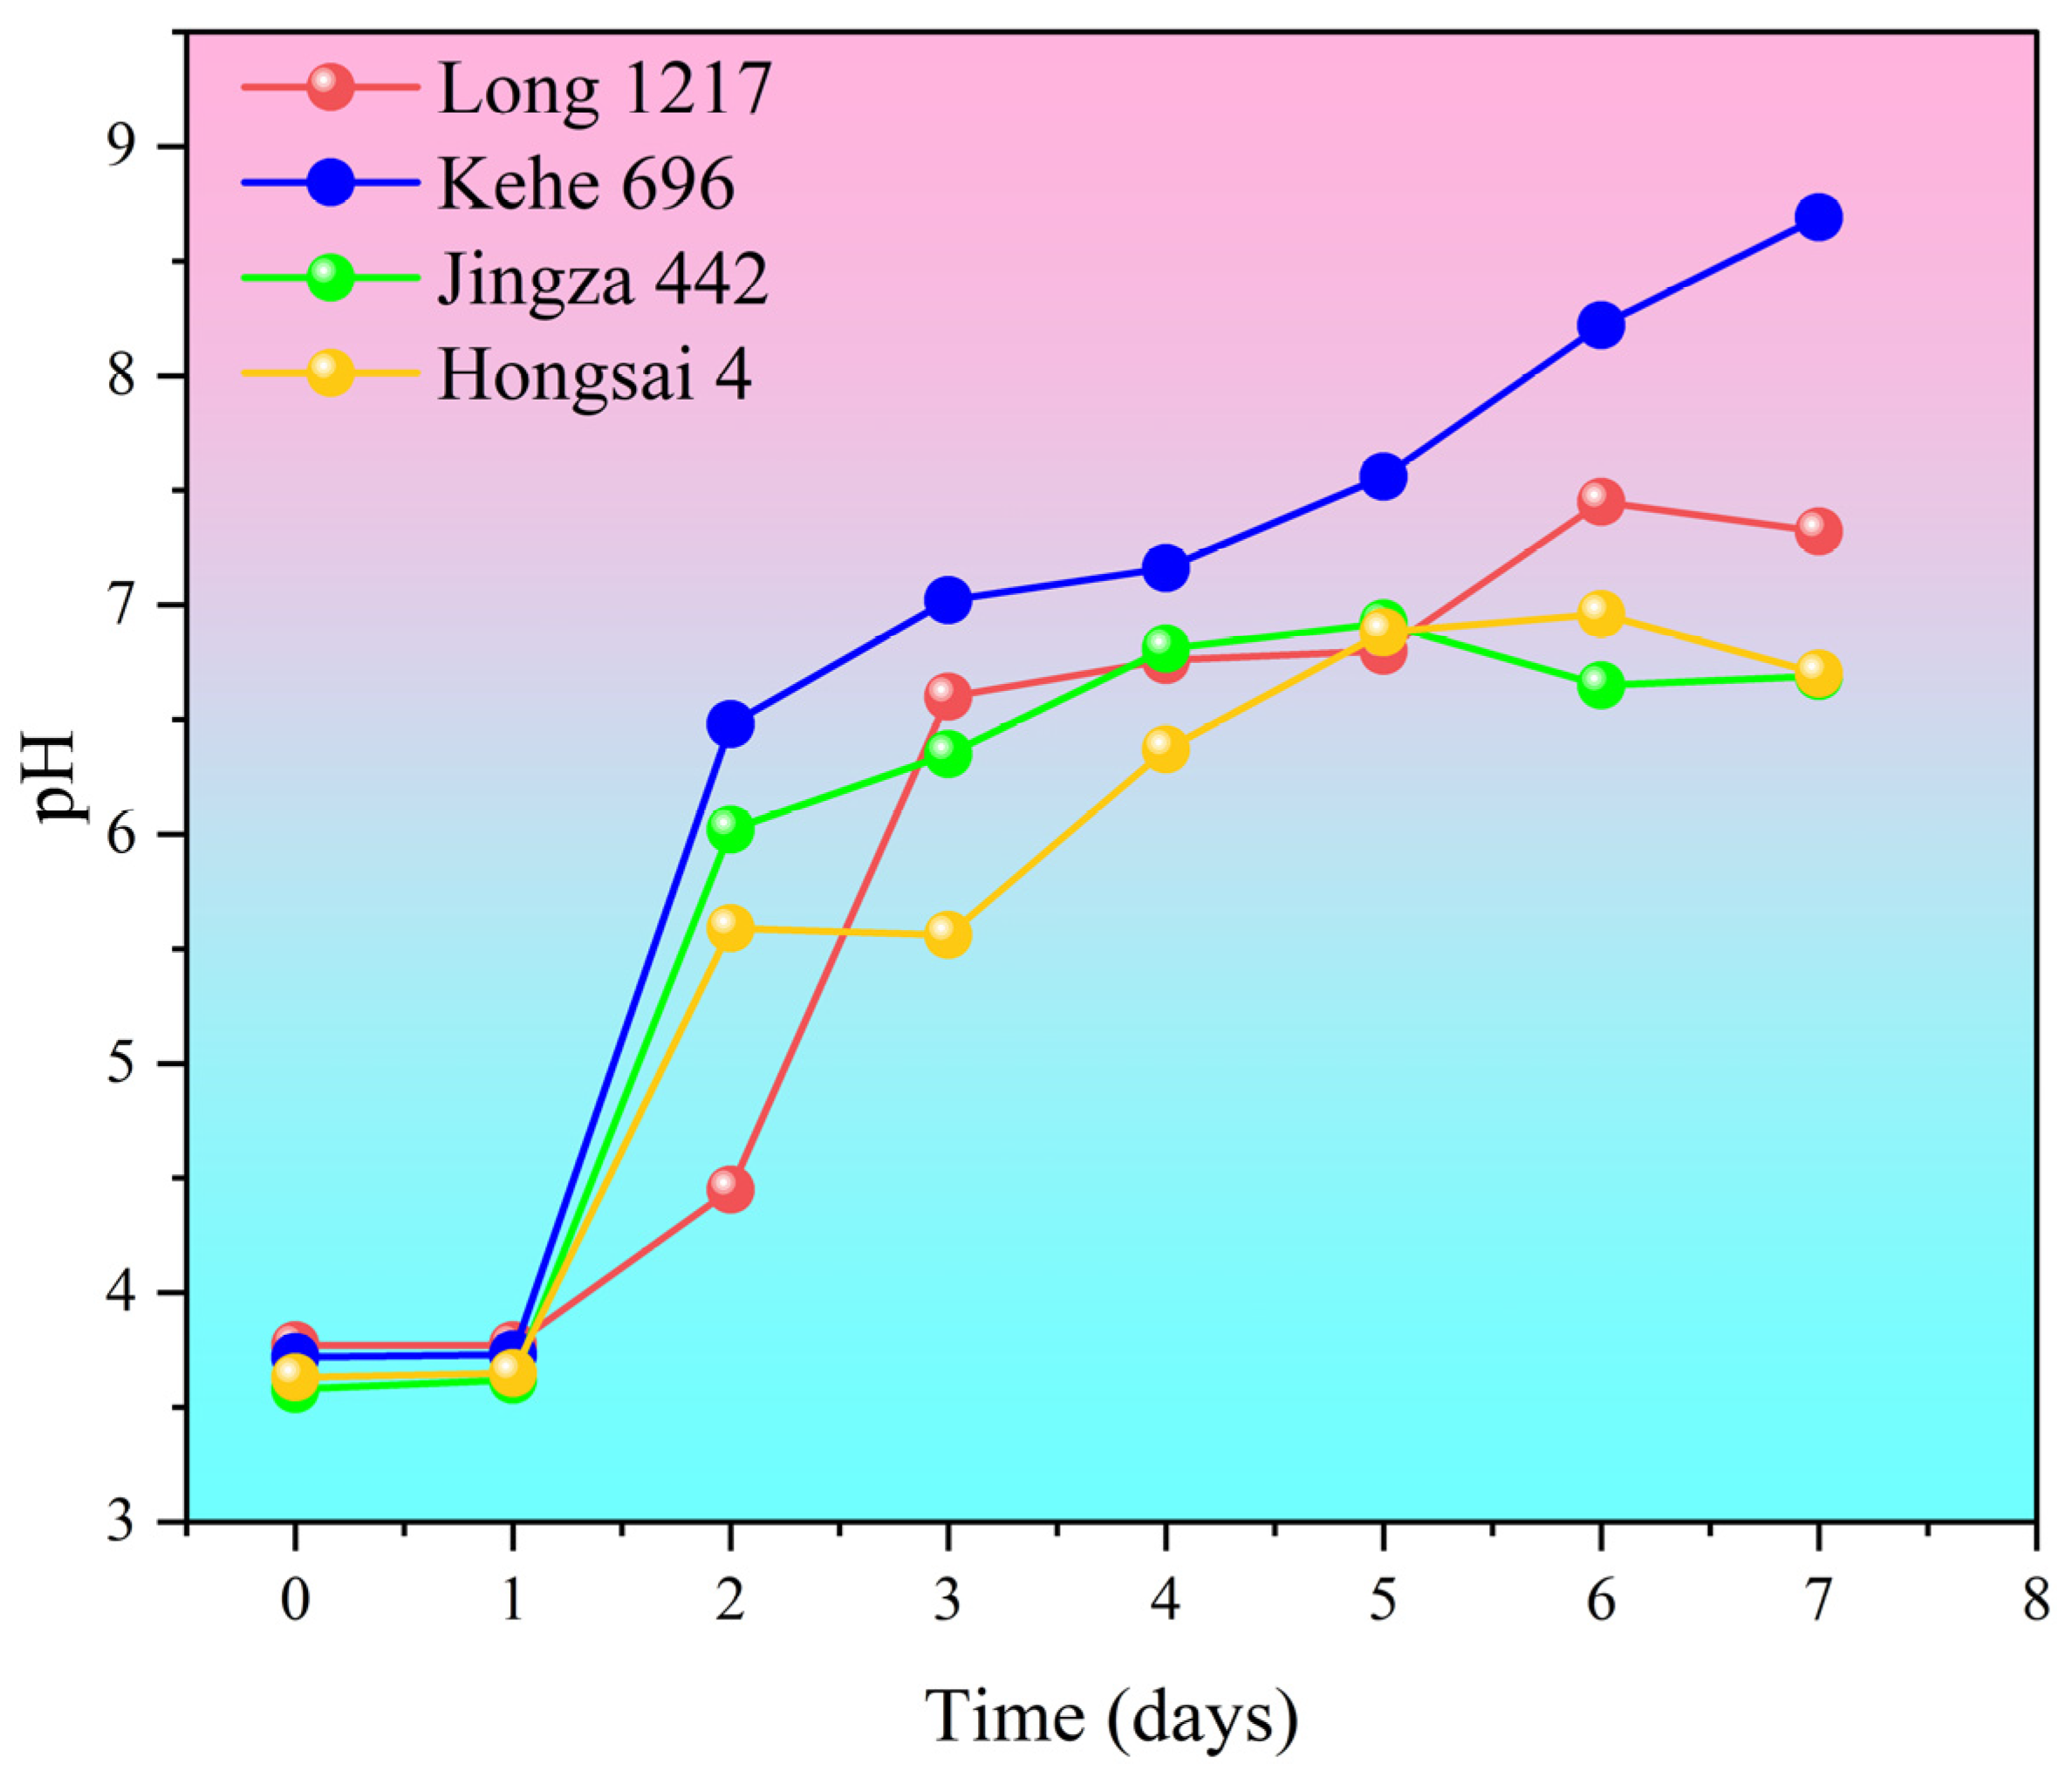
Figure 2 presents pH variation curves of the maize silage samples throughout the secondary fermentation stage. As the duration of aerobic exposure increased, the pH showed an increasing trend. During the first two days, the pH of the feed showed a relatively small change, remaining essentially around 4. Stability during this period may mean that there were no significant changes in the chemical composition of the feed at the start. From day 2 onwards, the sensory characteristics began to deteriorate, and the pH began to rise sharply, increasing significantly to approximately 6.5 by day 4. The rapid rise at this stage may be due to the proliferation of aerobic microorganisms, resulting in a large consumption of lactic acid in the maize silage. From days 4 to 8, the pH of the feed continued to rise. Except for Kehe 696, the pH of the other varieties stabilized around day 8, at which point the silage became moldy, emitted an unpleasant odor, developed a greasy texture, and changed color. As the duration of aerobic exposure increased, the maize silage changed from an initial slight sweet or fruity flavor to a rancid odor.

3.2. Data Preprocessing Results

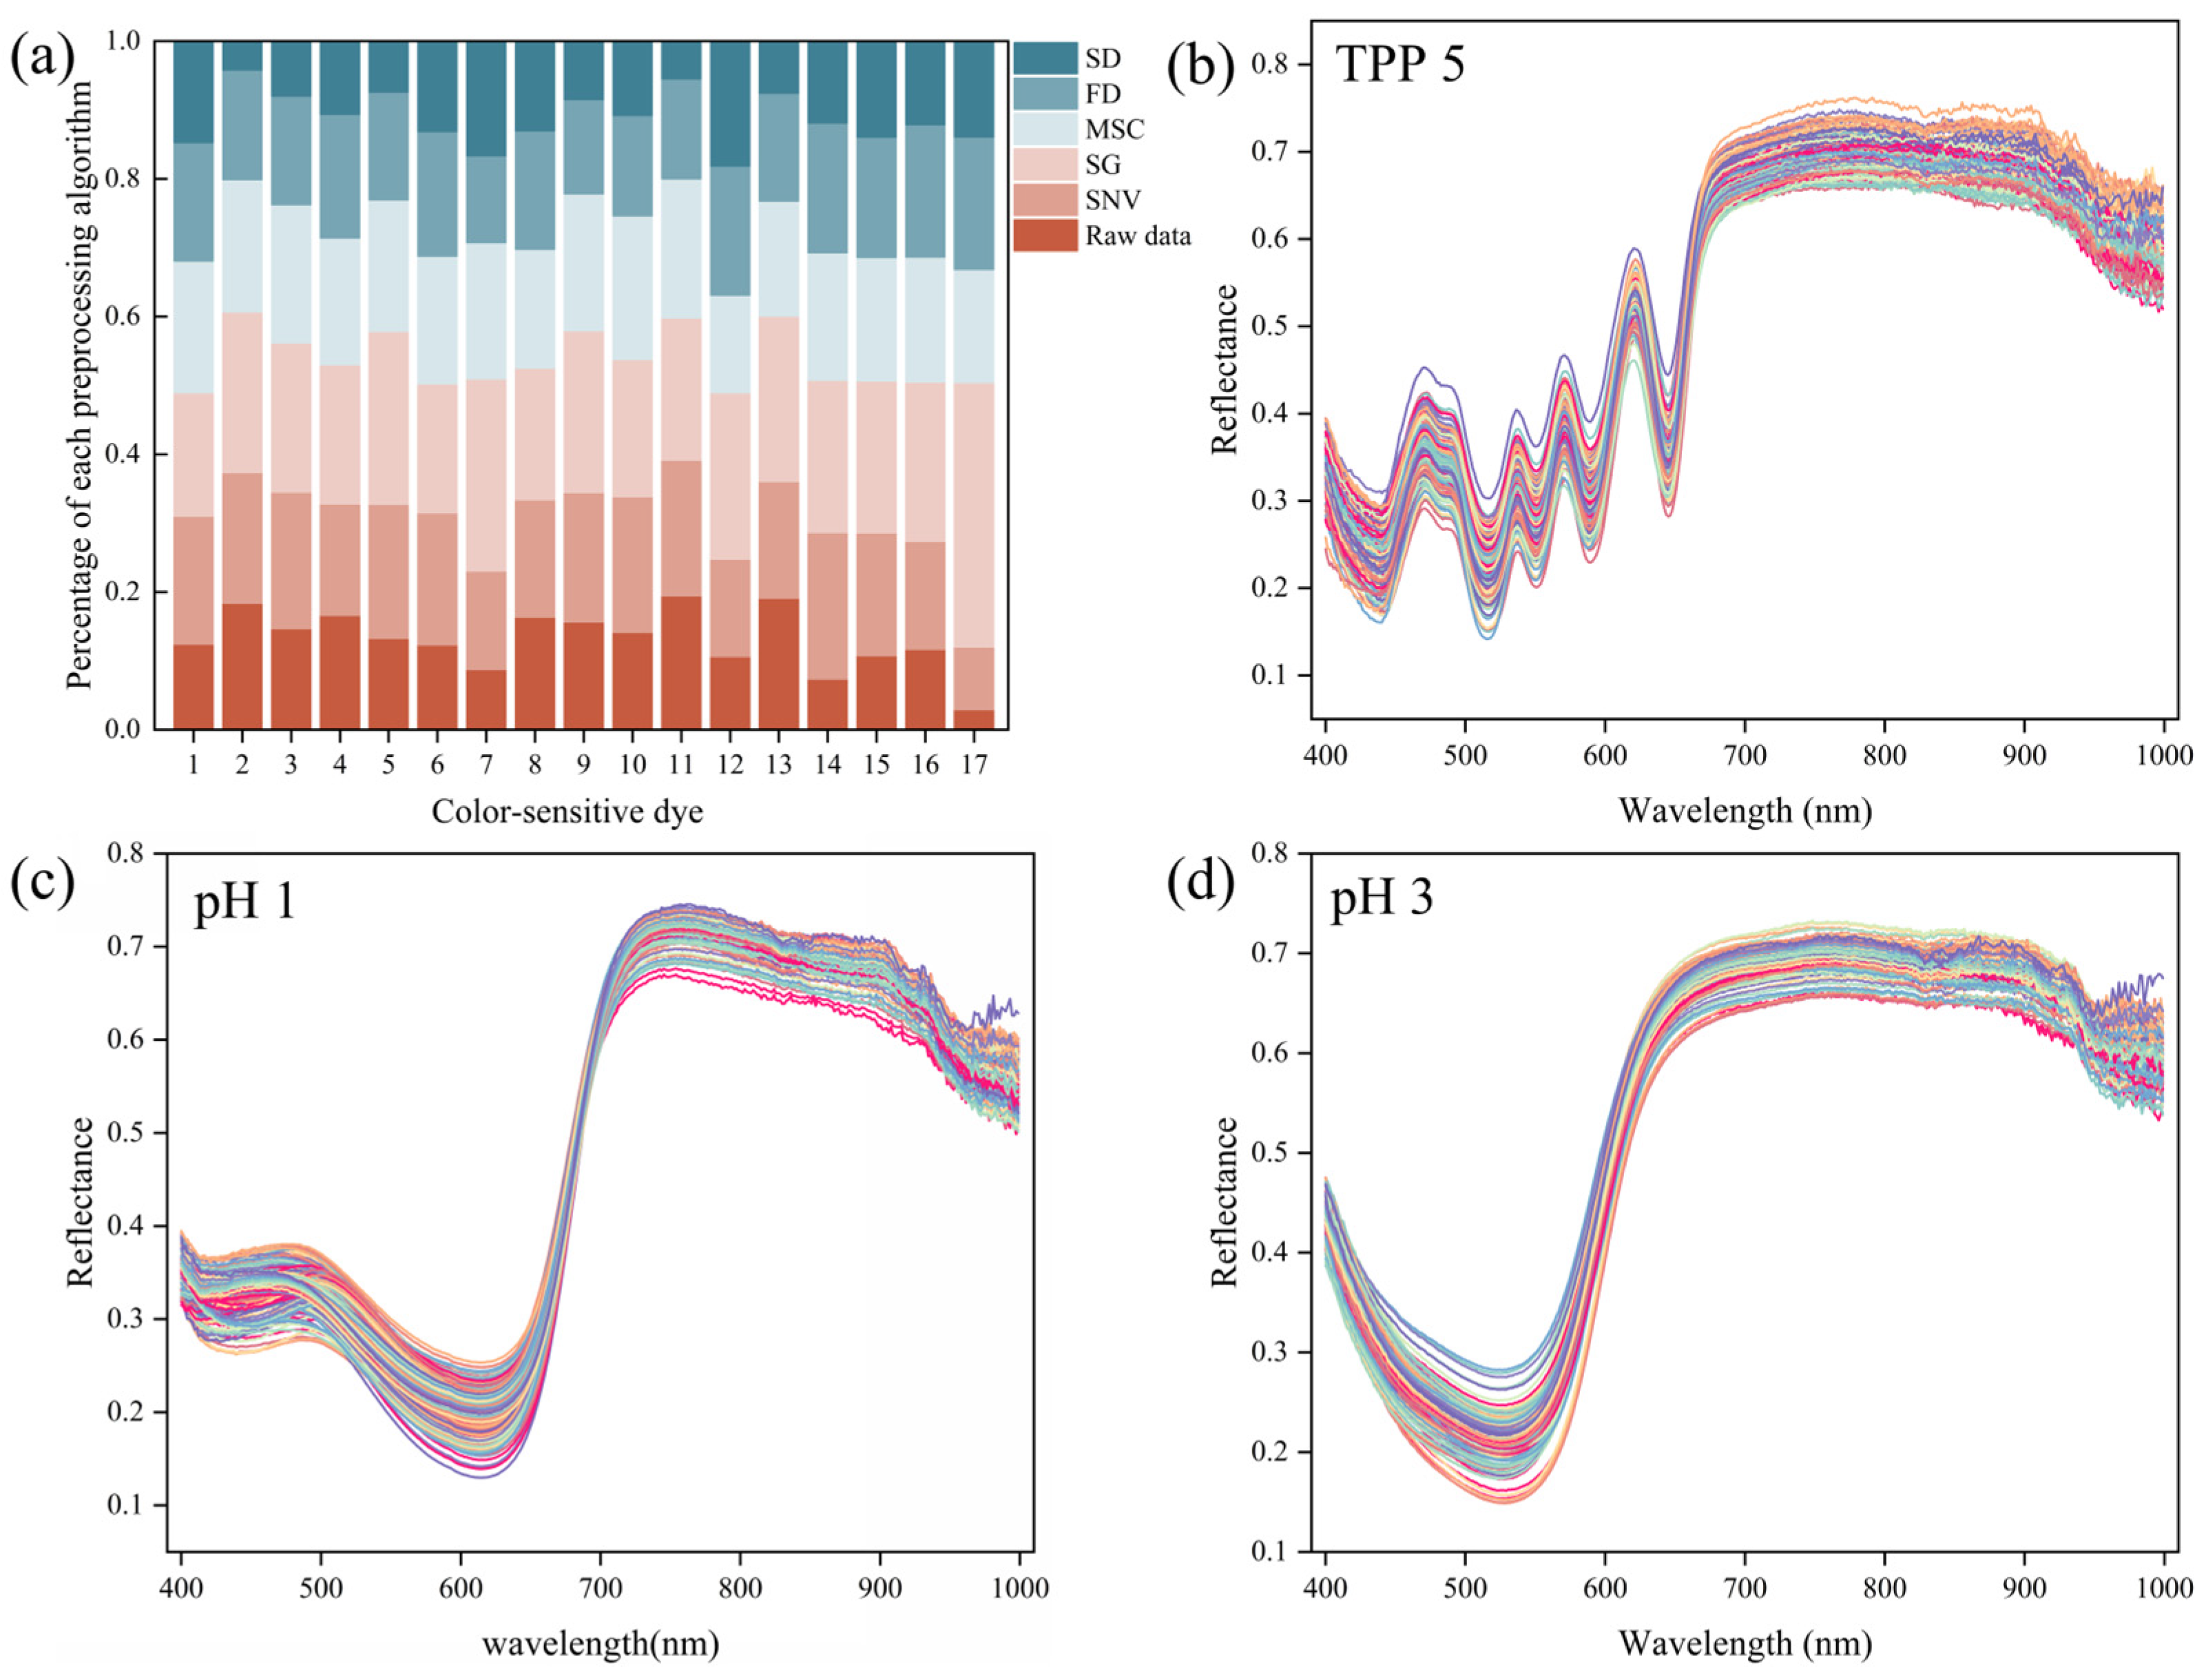
In the model evaluation process, R 2 indicates the goodness of fit of the model. R P 2 is the coefficient of determination of the prediction set; the larger the value, the better the model prediction. Table 1 demonstrates the PLSR modeling results for the raw data of each dye and for the different preprocessing algorithms. Figure 3a illustrates the percentage of R P 2 values for the different preprocessing algorithms for each dye, clearly revealing the strength of the impact of the various preprocessing algorithms on model performance. Compared to the raw spectra, spectral information subjected to SG, SNV, and MSC preprocessing exhibited enhanced pH prediction capabilities across most dyes. Conversely, the FD and SD algorithms demonstrated a trend towards reduced modeling accuracy for some dyes, likely due to noise amplification within the spectral data that subsequently diminished the modeling precision. It was conclusively determined that TPP#1 and pH#2 yielded the most favorable outcomes after preprocessing with the MSC algorithm, likely because this method effectively reduced scattering variance in the spectra. Similarly, TPP #6 achieved optimal results with the SNV algorithm, likely due to its ability to mitigate the effects of diffuse reflections caused by surface scattering and variations in the optical path. For the remaining dyes, the SG algorithm proved to be the best preprocessing method, as it efficiently smoothed out the noise in the spectrum. This study conducted an analysis based on the preprocessing methods selected from the screening.

3.3. Results of ABFO Algorithm for Sensitive Dye Screening

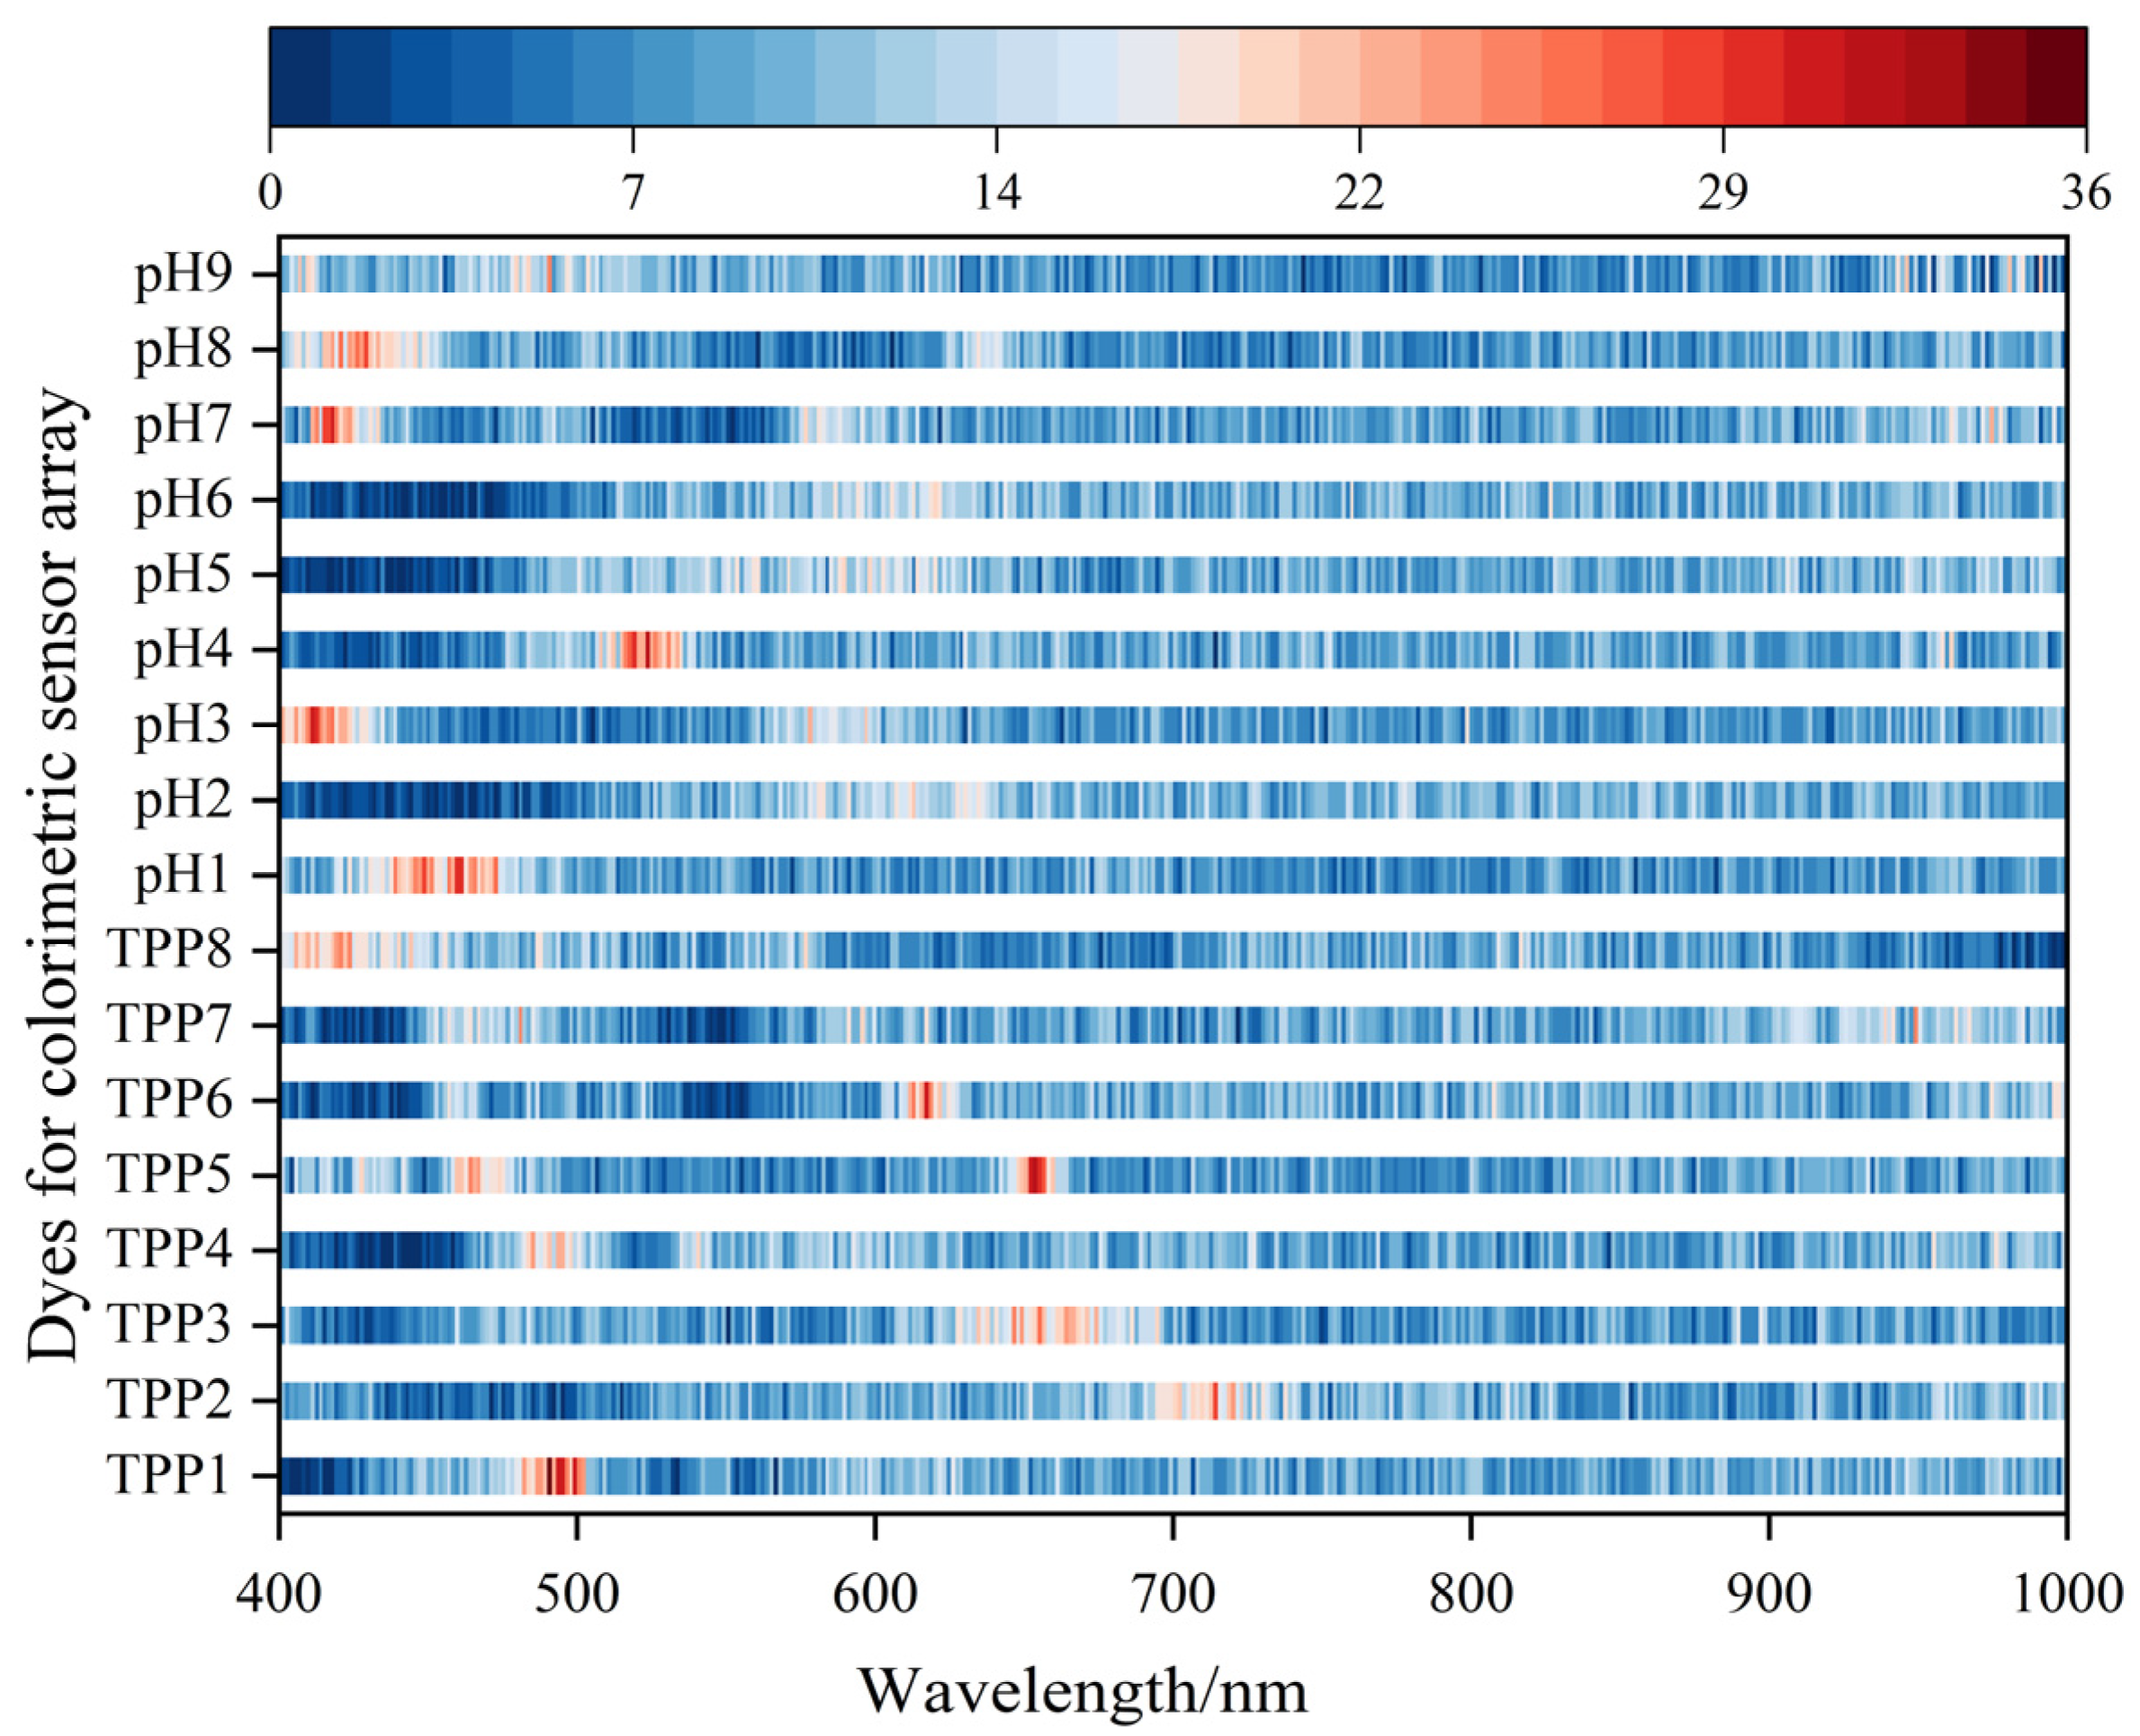
In this study, the ABFO algorithm was utilized to screen the color-sensitive dyes. The algorithm was run independently 50 times, after which the results were comprehensively summarized. Figure 4 presents the aggregated statistics of the total selections per band for each dye, following 50 iterations of the ABFO algorithm. As illustrated in Figure 4, the wavelengths corresponding to multiple dyes were selected repeatedly following the 50 independent runs of the ABFO algorithm. For instance, for TPP#5, five wavelengths were selected more than 25 times; for pH#1, nine wavelengths were selected more than 25 times; and for pH#3, five wavelengths were selected more than 25 times. From a mathematical perspective, it can be hypothesized that dyes with wavelengths selected repeatedly exhibit greater sensitivity to pH changes in maize silage. Consequently, TPP#5, pH#1, and 3 were selected for further study. The pretreatment spectra of the three dyes are shown in Figure 3b–d.

3.4. Results of Feature Variable Screening

Given the high dimensionality and redundancy of the hyperspectral data and the strong correlation between bands, the preprocessed full-band spectra needed to be downscaled. Based on the pre-screening, the raw spectra of the three dyes were preprocessed using the SG algorithm. In this study, the ABFO, UVE, and CARS algorithms were used to extract the characteristic wavelengths from the preprocessed spectral data, and the results of the screening variables are shown in Figure 5. As can be seen in the figure, there were significant differences in the numbers and locations of wavelengths screened when using the different screening methods.
After the variable screening using the ABFO algorithm, TPP#5 screened 78 wavelengths, accounting for 18.9% of the full spectrum; pH#1 screened 84 wavelengths, accounting for 20.4%; and pH#3 screened 83 wavelengths, accounting for 20.2%. After screening using the CARS algorithm, TPP#5 screened 64 wavelengths, accounting for 15.6% of the full spectrum; pH#1 screened 48 wavelengths, accounting for 11.7%; and pH#3 screened 41 wavelengths, accounting for 10%. After variable screening using the UVE algorithm, TPP#5 screened 166 wavelengths, accounting for 40.3% of the full spectrum; pH#1 screened 179 wavelengths, accounting for 43.5%; and pH#3 screened 107 wavelengths, accounting for 26%.
Figure 5a–c show the results of the wavelengths selected by the different algorithms for the three dyes, and it can be seen that the UVE algorithm selected the most wavelengths, which suggests that more redundant information is retained when the difference in the spectral data is small. For the three dyes, ABFO selected a significantly higher number of wavelengths at the absorption peaks than CARS.

3.5. Results of the Two Regression Models

After extracting the characteristic wavelengths using the three methods, the characteristic wavelengths of individual dyes and combinatorial dyes were used as inputs, and a quantitative prediction model of maize silage pH was established by combining the PLSR and BPNN algorithms; the results are shown in Table 2. The accuracy of the model built with the three feature extraction algorithms showed a significant improvement over that of the model built with the raw spectral data.
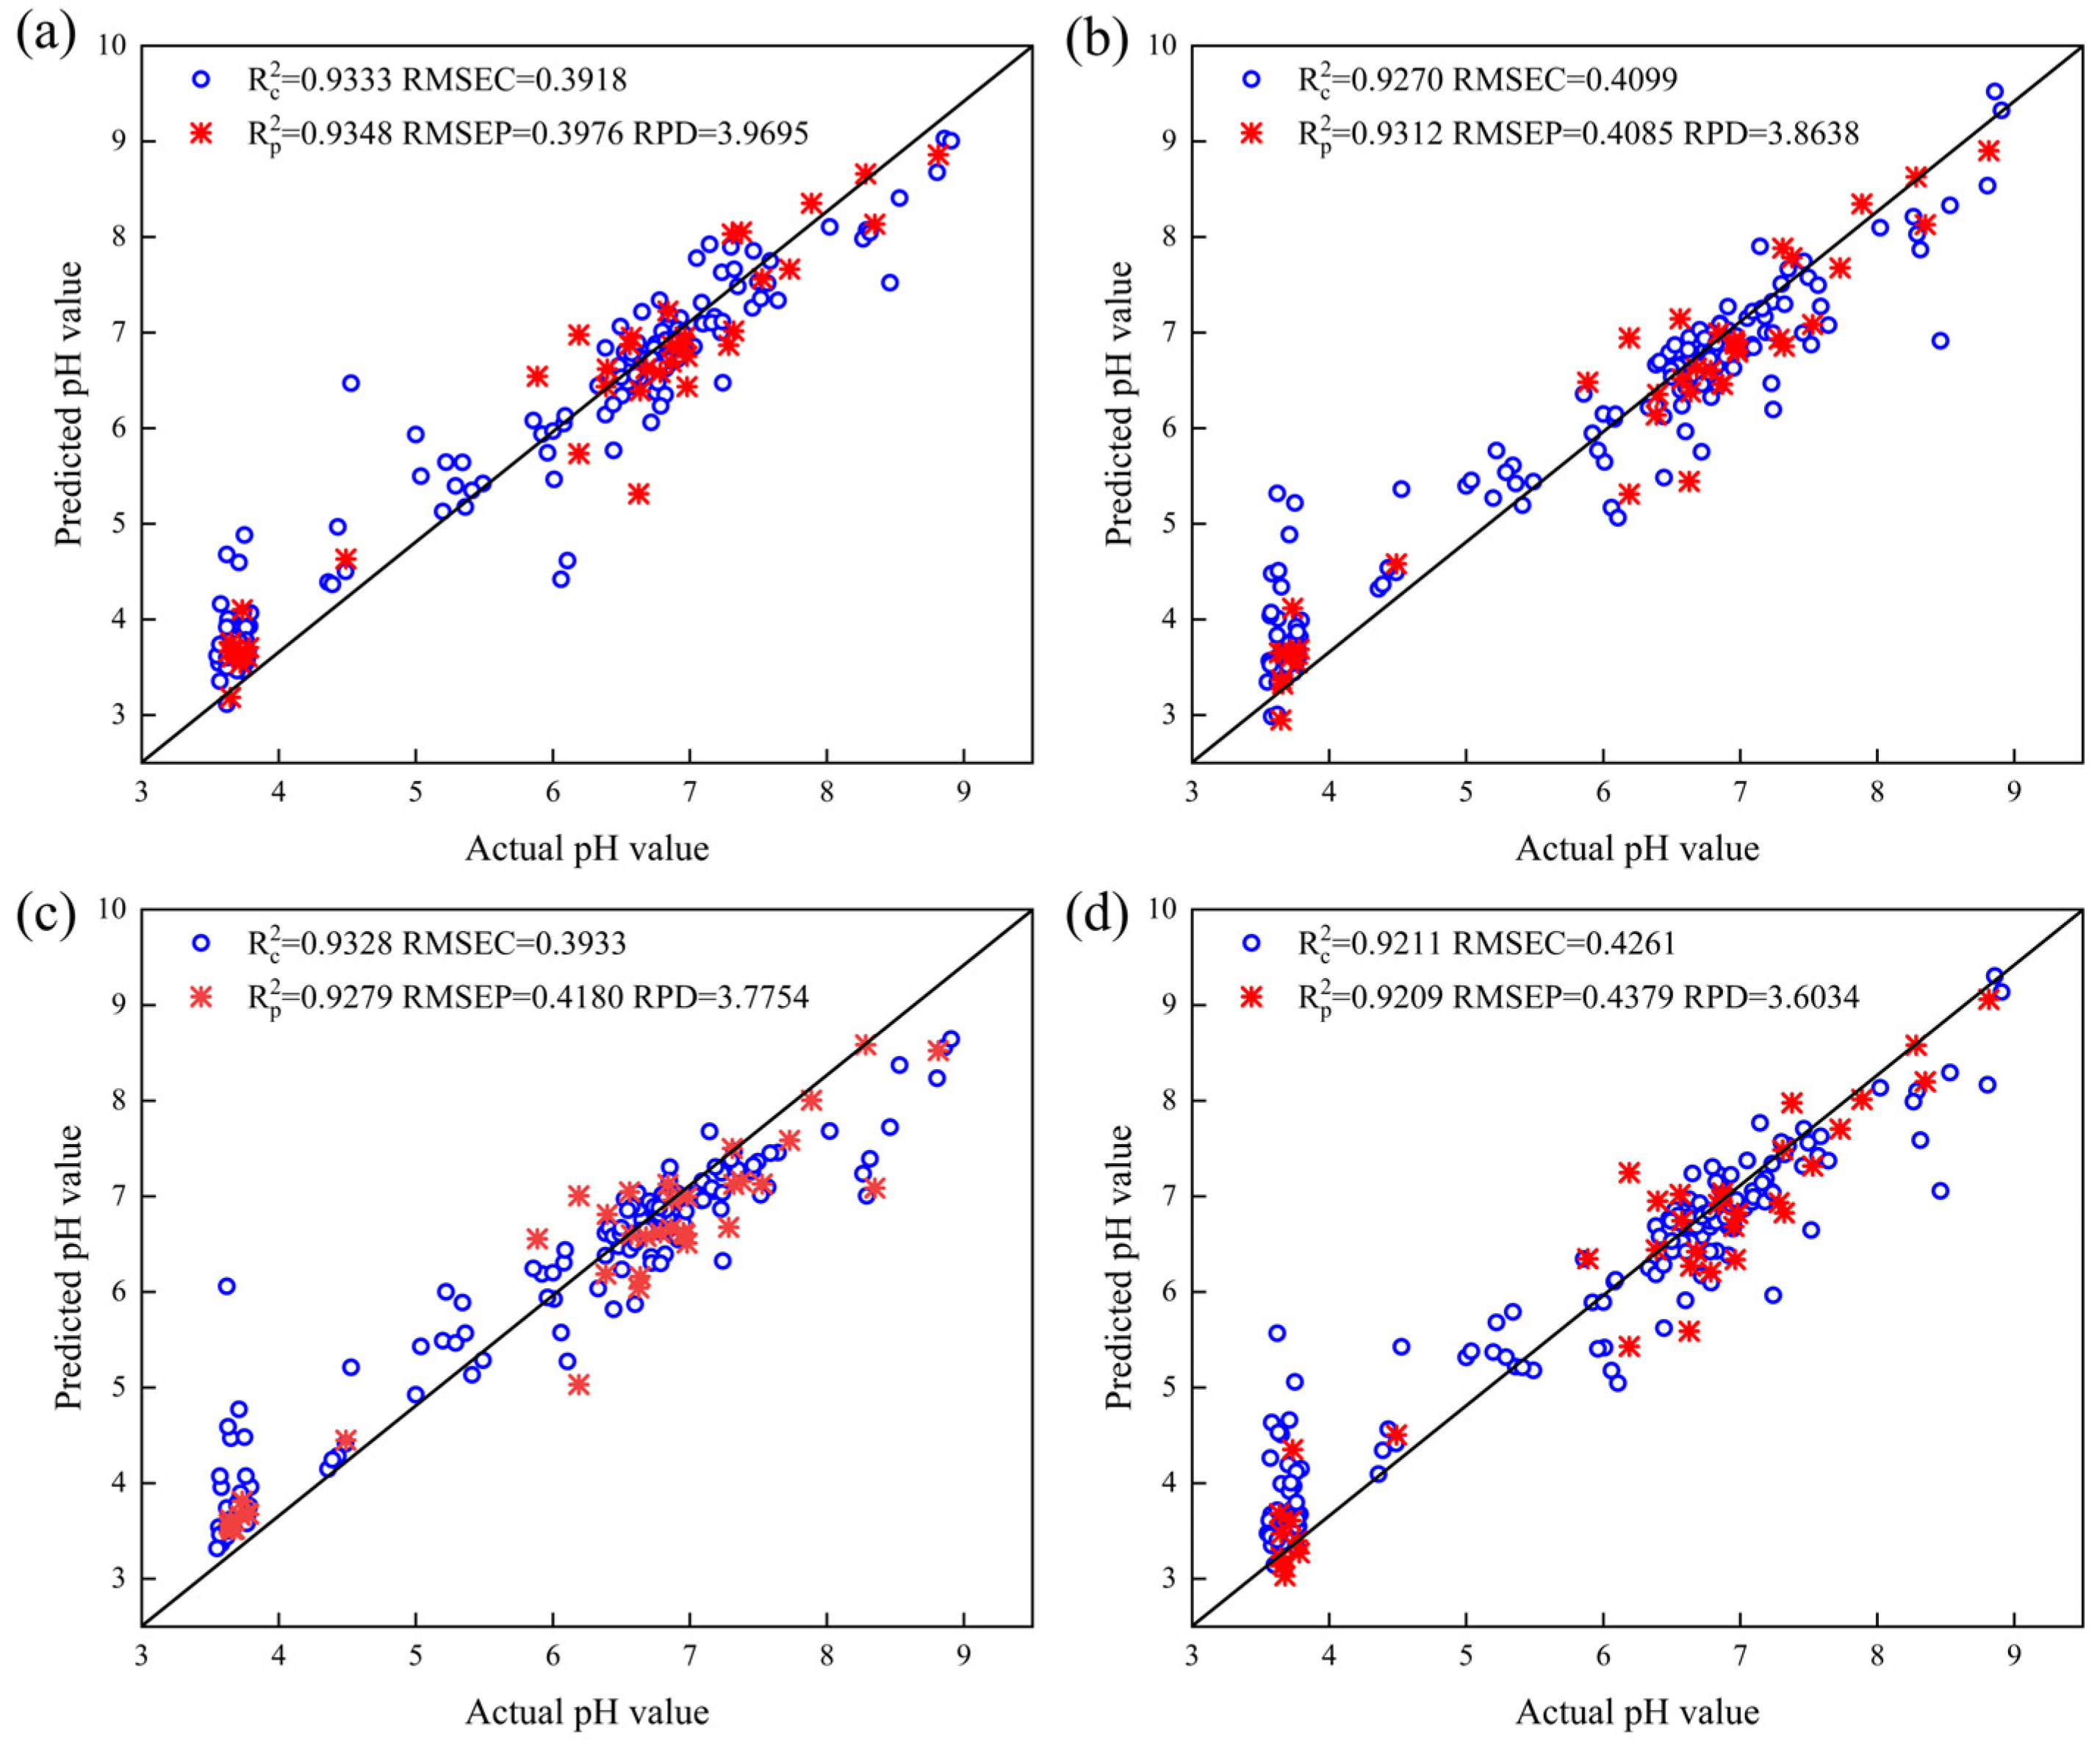
As shown in Figure 6a,c, among the BPNN models, the ABFO-BPNN model with combinatorial dyes gave the best prediction, with R C 2 , R P 2 , RMSEC, RMSEP, and RPD values of 0.9333, 0.9348, 0.3918, 0.3976, and 3.9695, respectively, which indicates that it has a strong generalization ability. When using individual dyes for prediction, the ABFO-BPNN model of pH#3 had the best prediction, with R C 2 , R P 2 , RMSEC, RMSEP, and RPD values of 0.9328, 0.9279, 0.3933, 0.4180, and 3.7754, respectively.
As shown in Figure 6b,d, among the PLSR models, the ABFO-PLSR model with combinatorial dyes presented the best predictive performance, with R C 2 , R P 2 , RMSEC, RMSEP, and RPD values of 0.9270, 0.9312, 0.4099, 0.4085, and 3.8638, respectively. When modeling with individual dyes, the CARS-PLSR model of pH#3 was the best for pH prediction, with R C 2 , R P 2 , RMSEC, RMSEP, and RPD values of 0.9211, 0.9209, 0.4261, 0.4379, and 3.6034, respectively.

3.6. Model Comparison

This study developed quantitative prediction models for maize silage pH based on selected feature wavelengths, utilizing BPNN and PLSR. The modeling prediction results based on different characteristic wavelengths are shown in Table 2.
In both the BPNN and PLSR models with the same feature extraction algorithm, the model prediction results based on the combination of dyes outperformed those based on individual dyes. Therefore, compared to modeling using individual dyes, modeling using a combination of dyes can effectively improve the prediction accuracy of the model. When modeling using combinatorial dyes, the RPD values of the models that were screened for characteristic variables consistently exceeded 3, which is indicative of strong predictive capabilities. Notably, when using pH1 and pH3 for modeling, the CARS-PLSR model demonstrated higher predictive performance, while the overall predictive performance of the ABFO-PLSR model was slightly inferior. However, the ABFO algorithm consistently demonstrated high predictive performance in the BPNN model. For the quantitative prediction of pH, both the ABFO-BPNN and ABFO-PLSR models of the combinatorial dyes gave satisfactory predictions. As the ABFO-BPNN model had smaller RMSEP and higher R P 2 and RPD values, this indicates that the model had better stability and robustness. This suggests a potential advantage of the ABFO algorithm in extracting feature wavelengths. The ABFO-BPNN model of the combinatorial dyes has obvious advantages in terms of the accuracy and reliability of predicting pH, and the higher coefficient of determination indicates that it can capture the variability of the data well; additionally, it has higher practical value and efficiency in practical applications.

4. Discussion

In this study, a maize silage pH prediction model was constructed based on a CSA combined with HSI. Guan et al. [21] developed a freshness recognition model for oysters using colorimetric sensor image data and visible near-infrared data, and the results showed that the model based on visible near-infrared data had better performance. Li et al. [42] used a camera and a hyperspectral imaging system to collect the image data and spectral data of a CSA, respectively, in order to establish an SVM qualitative model of the degree of fermentation of black tea; the results showed that the accuracy of the model established based on hyperspectral data was higher than that of the model established based on color data. This suggests that spectroscopic data can provide CSAs with richer information to express the reactions between dyes and volatile compounds. Although the aforementioned researchers demonstrated the potential of CSA spectral data to enhance model accuracy, they insufficiently explored the optimization of CSA dye selection. In this study, a novel color-sensitive dye screening method based on the ABFO algorithm was proposed and utilized to screen three dyes sensitive to pH. We found that models constructed based on combinations of dyes had a higher prediction accuracy than those constructed based on an individual dye. It was further verified that a CSA combined with HSI could accurately predict the pH of maize silage.
In addition, most previous studies only used a single algorithm to preprocess the spectral data of multiple dyes without considering the impact of different preprocessing algorithms on modeling accuracy [21,25,43]. In contrast, our study evaluated and selected the best preprocessing method for each dye, which facilitated the optimization of spectral performance.
pH is an important indicator reflecting the quality of maize silage [44]. The main factor contributing to the pH changes observed during silage quality deterioration is the change in the lactic acid content. Lactic acid is the most effective fermentation acid for lowering silage pH; it inhibits the growth of harmful microorganisms and is an important chemical for stabilizing silage fermentation. The exposure of maize silage to air initiates secondary fermentation, allowing aerobic microorganisms to proliferate, disrupting the fermentation balance, and significantly reducing the lactic acid content [45,46], which consequently results in an increase in pH.

5. Conclusions

This study used a colorimetric sensor array combined with hyperspectral imaging to successfully predict the pH of maize silage during secondary fermentation. By comparing the modeling results of five preprocessing algorithms applied to different dyes, it was found that selecting an appropriate spectral preprocessing algorithm for each dye helped to optimize spectral performance, reduce the impact of background noise interference, and effectively improve modeling accuracy. The ABFO algorithm effectively screened color-sensitive dyes, and a combination of dyes better predicted the pH changes in maize silage during secondary fermentation than individual dyes. Compared to other feature extraction algorithms, the ABFO algorithm was more capable of extracting the key information between dye spectra and pH. The BPNN model demonstrated superior capabilities in quantitatively analyzing the relationship between dye spectral information and pH to other models. Among them, the ABFO-BPNN model was the best model for predicting pH, demonstrating a better generalization ability and prediction accuracy. This study provides a new idea for maize silage quality testing, and the success of this technique is expected to provide a non-destructive and rapid detection method for cumbersome and time-consuming pH testing.

Supplementary Materials

The following supporting information can be downloaded at: https://www.mdpi.com/article/10.3390/agronomy15020285/s1. Table S1. Information on the dyes used to construct the CSA.

Author Contributions

Conceptualization, X.X. and H.T.; methodology, X.X. and H.T.; software, X.X. and Y.Y.; validation, H.T. and K.Z.; formal analysis, X.X., Z.X. and D.W.; investigation, C.Z., D.W. and Y.Y.; resources, Y.Y. and Z.X.; data curation, X.X.; writing—original draft preparation, X.X. and H.T.; writing—review and editing, X.X., H.T. and K.Z.; visualization, X.X.; supervision, H.T.; project administration, H.T.; funding acquisition, H.T. All authors have read and agreed to the published version of the manuscript.

Funding

This work was supported by the National Natural Science Foundation of China [32071893], the National Natural Science Foundation of China [52365035], the Natural Science Foundation of Inner Mongolia Autonomous Region [2024MS03019], the First-Class Discipline Research Special Projects of the Inner Mongolia Autonomous Region [YLXKZX-NND-046], and the Innovation Calibration Program for College Students of Inner Mongolia Autonomous Region [202310129026].

Data Availability Statement

The data provided in this study are available upon request from the corresponding author. The data are not publicly available due to privacy needs.

Conflicts of Interest

The authors declare no conflicts of interest.

References

  1. García-Chávez, I.; Meraz-Romero, E.; Castelán-Ortega, O.; Zaragoza Esparza, J.; Osorio Avalos, J.; Robles Jimenez, L.E.; González-Ronquillo, M. Corn Silage, Meta-Analysis of The Quality and Yield of Different Regions in the World. 2020. Available online: https://www.preprints.org/manuscript/202010.0094 (accessed on 14 July 2024).
  2. Ma, X.; Sun, J.; Zhao, J.; Jv, X.; Dong, J.; Yang, W.; Jiang, Y.; Li, Y.; Yang, L.; Jiang, S. Effects of Different Dietary Inclusions of Whole-Plant Corn Silage on Growth Performance, Nutrient Availability and Jejunal Development in Growing-Finishing Pigs. Czech J. Anim. Sci. 2024, 69, 48–58. [Google Scholar] [CrossRef]
  3. Gallo, A.; Giuberti, G.; Bruschi, S.; Fortunati, P.; Masoero, F. Use of Principal Factor Analysis to Generate a Corn Silage Fermentative Quality Index to Rank Well- or Poorly Preserved Forages. J. Sci. Food Agric. 2016, 96, 1686–1696. [Google Scholar] [CrossRef]
  4. Borreani, G.; Tabacco, E.; Schmidt, R.J.; Holmes, B.J.; Muck, R.E. Silage Review: Factors Affecting Dry Matter and Quality Losses in Silages. J. Dairy Sci. 2018, 101, 3952–3979. [Google Scholar] [CrossRef]
  5. Ferraretto, L.F.; Shaver, R.D.; Luck, B.D. Silage Review: Recent Advances and Future Technologies for Whole-Plant and Fractionated Corn Silage Harvesting. J. Dairy Sci. 2018, 101, 3937–3951. [Google Scholar] [CrossRef]
  6. Yin, X.; Wang, P.; Yan, Z.; Yang, Q.; Huang, X.; Gun, S. Effects of Whole-Plant Corn Silage on Growth Performance, Serum Biochemical Indices, and Fecal Microorganisms in Hezuo Pigs. Animals 2024, 14, 662. [Google Scholar] [CrossRef]
  7. Jiang, F.; Cheng, H.; Liu, D.; Wei, C.; An, W.; Wang, Y.; Sun, H.; Song, E. Treatment of Whole-Plant Corn Silage with Lactic Acid Bacteria and Organic Acid Enhances Quality by Elevating Acid Content, Reducing pH, and Inhibiting Undesirable Microorganisms. Front. Microbiol. 2020, 11, 593088. [Google Scholar] [CrossRef]
  8. Zhang, H.; Wu, J.; Gao, L.; Yu, J.; Yuan, X.; Zhu, W.; Wang, X.; Cui, Z. Aerobic Deterioration of Corn Stalk Silage and Its Effect on Methane Production and Microbial Community Dynamics in Anaerobic Digestion. Bioresour. Technol. 2018, 250, 828–837. [Google Scholar] [CrossRef] [PubMed]
  9. Serva, L.; Andrighetto, I.; Segato, S.; Marchesini, G.; Chinello, M.; Magrin, L. Assessment of Maize Silage Quality under Different Pre-Ensiling Conditions. Data 2023, 8, 117. [Google Scholar] [CrossRef]
  10. Pereira-Crespo, S.; Sainz-Ramírez, A.; Plata-Reyes, D.A.; Gómez-Miranda, A.; González-Alcántara, F.; Botana, A.; González, L.; Veiga, M.; Resch, C.; Lorenzana, R.; et al. Predicción de la calidad fermentativa de ensilados de girasol mediante espectroscopía de reflectancia en el infrarrojo cercano (NIRS) sobre muestras secas. Rev. Mex. Cienc. Pecu. 2021, 12, 609–620. [Google Scholar] [CrossRef]
  11. Pastore, A.; Badocco, D.; Pastore, P. Determination of the Relevant Equilibrium Constants Working in pH Colorimetric Sensor Arrays (CSAs). Microchem. J. 2022, 177, 107288. [Google Scholar] [CrossRef]
  12. Sun, W.; Li, H.; Wang, H.; Xiao, S.; Wang, J.; Feng, L. Sensitivity Enhancement of pH Indicator and Its Application in the Evaluation of Fish Freshness. Talanta 2015, 143, 127–131. [Google Scholar] [CrossRef] [PubMed]
  13. Elrasheid Tahir, H.; Komla Mahunu, G.; Arslan, M.; Zhihua, L.; Wen, Z.; Xiaobo, Z.; Adam Mariod, A.; Jiyong, S. Feasibility Study for the Use of Colorimetric Sensor Arrays, NIR and FT-IR Spectroscopy in the Quantitative Analysis of Volatile Components in Honey. Microchem. J. 2021, 160, 105730. [Google Scholar] [CrossRef]
  14. Wojnowski, W.; Majchrzak, T.; Dymerski, T.; Gębicki, J.; Namieśnik, J. Electronic Noses: Powerful Tools in Meat Quality Assessment. Meat Sci. 2017, 131, 119–131. [Google Scholar] [CrossRef] [PubMed]
  15. Yang, M.; Zhai, X.; Huang, X.; Li, Z.; Shi, J.; Li, Q.; Zou, X.; Battino, M. Rapid Discrimination of Beer Based on Quantitative Aroma Determination Using Colorimetric Sensor Array. Food Chem. 2021, 363, 130297. [Google Scholar] [CrossRef]
  16. Lin, H.; Lin, J.; Man, Z.; Jin, H.; Kutsanedzie, F.Y.H.; Chen, Q. Development of Colorimetric Detection of 2,4,5-Trimethyloxazole in Volatile Organic Compounds Based on Porphyrin Complexes for Vinegar Storage Time Discrimination. Food Anal. Methods 2020, 13, 2192–2203. [Google Scholar] [CrossRef]
  17. Nie, W.; Chen, Y.; Zhang, H.; Liu, J.; Peng, Z.; Li, Y. A Novel Colorimetric Sensor Array for Real-Time and on-Site Monitoring of Meat Freshness. Anal. Bioanal. Chem. 2022, 414, 6017–6027. [Google Scholar] [CrossRef]
  18. Magnaghi, L.R.; Capone, F.; Zanoni, C.; Alberti, G.; Quadrelli, P.; Biesuz, R. Colorimetric Sensor Array for Monitoring, Modelling and Comparing Spoilage Processes of Different Meat and Fish Foods. Foods 2020, 9, 684. [Google Scholar] [CrossRef]
  19. Xu, W.; He, Y.; Li, J.; Deng, Y.; Xu, E.; Feng, J.; Ding, T.; Liu, D.; Wang, W. Non-Destructive Determination of Beef Freshness Based on Colorimetric Sensor Array and Multivariate Analysis. Sens. Actuators B Chem. 2022, 369, 132282. [Google Scholar] [CrossRef]
  20. Du, L.; Lao, Y.; Sasaki, Y.; Lyu, X.; Gao, P.; Wu, S.; Minami, T.; Liu, Y. Freshness Monitoring of Raw Fish by Detecting Biogenic Amines Using a Gold Nanoparticle-Based Colorimetric Sensor Array. RSC Adv. 2022, 12, 6803–6810. [Google Scholar] [CrossRef] [PubMed]
  21. Guan, B.; Kang, W.; Jiang, H.; Zhou, M.; Lin, H. Freshness Identification of Oysters Based on Colorimetric Sensor Array Combined with Image Processing and Visible Near-Infrared Spectroscopy. Sensors 2022, 22, 683. [Google Scholar] [CrossRef]
  22. Wei, W.; Li, H.; Haruna, S.A.; Wu, J.; Chen, Q. Monitoring the Freshness of Pork during Storage via Near-Infrared Spectroscopy Based on Colorimetric Sensor Array Coupled with Efficient Multivariable Calibration. J. Food Compos. Anal. 2022, 113, 104726. [Google Scholar] [CrossRef]
  23. Wang, S.; Chen, Q.; Han, Y.; Huang, S.; Wu, J.; Jiao, T.; Wei, J.; Chen, X.; Chen, Q. Non-Destructive Prediction of the Total Viable Count (TVC) in Fujian Oysters (Crassostrea Angulata) Based on the Colorimetric Sensor Array. Microchem. J. 2024, 197, 109911. [Google Scholar] [CrossRef]
  24. Li, H.; Chen, Q.; Zhao, J.; Wu, M. Nondestructive Detection of Total Volatile Basic Nitrogen (TVB-N) Content in Pork Meat by Integrating Hyperspectral Imaging and Colorimetric Sensor Combined with a Nonlinear Data Fusion. LWT—Food Sci. Technol. 2015, 63, 268–274. [Google Scholar] [CrossRef]
  25. An, T.; Li, Y.; Tian, X.; Fan, S.; Duan, D.; Zhao, C.; Huang, W.; Dong, C. Evaluation of Aroma Quality Using Multidimensional Olfactory Information during Black Tea Fermentation. Sens. Actuators B Chem. 2022, 371, 132518. [Google Scholar] [CrossRef]
  26. Ouyang, Q.; Rong, Y.; Wu, J.; Wang, Z.; Lin, H.; Chen, Q. Application of Colorimetric Sensor Array Combined with Visible Near-Infrared Spectroscopy for the Matcha Classification. Food Chem. 2023, 420, 136078. [Google Scholar] [CrossRef] [PubMed]
  27. Li, L.; Li, M.; Cui, Q.; Liu, Y.; Chen, Y.; Wang, Y.; Zhang, Z.; Chen, Q.; Ning, J. Rapid Monitoring of Black Tea Fermentation Quality Based on a Solution-Phase Sensor Array Combined with UV-Visible Spectroscopy. Food Chem. 2022, 377, 131974. [Google Scholar] [CrossRef] [PubMed]
  28. Lin, H.; Wang, Z.; Ahmad, W.; Man, Z.; Duan, Y. Identification of Rice Storage Time Based on Colorimetric Sensor Array Combined Hyperspectral Imaging Technology. J. Stored Prod. Res. 2020, 85, 101523. [Google Scholar] [CrossRef]
  29. Xu, F.; Huang, X.; Tian, X.; Yu, S.; Zhang, X.; Zareef, M. Application of Hyperspectral Imaging and Colorimetric Sensor Array Coupled with Multivariate Analysis for Quality Detection during Salted Duck Eggs Processing. J. Food Process Eng. 2024, 47, e14589. [Google Scholar] [CrossRef]
  30. GB/T 5009.237-2016; National Standard for Food Safety Determination of pH Value of Food. National Health and Family Planning Commission of the People’s Republic of China: Beijing, China, 2016.
  31. DB15/T 1458-2018; Determination of pH Value, Organic Acid and Ammonium Nitrogen in Silage. Inner Mongolia Autonomous Region Bureau of Quality and Technical Supervision: Hohhot, China, 2018.
  32. He, H.-J. Simultaneous Quantifying and Visualizing Moisture, Ash and Protein Distribution in Sweet Potato [Ipomoea batatas (L.) Lam] by NIR Hyperspectral Imaging. Food Chem. 2023, 18, 100631. [Google Scholar] [CrossRef] [PubMed]
  33. Soares, F.L.F.; Marcelo, M.C.A.; Porte, L.M.F.; Pontes, O.F.S.; Kaiser, S. Inline Simultaneous Quantitation of Tobacco Chemical Composition by Infrared Hyperspectral Image Associated with Chemometrics. Microchem. J. 2019, 151, 104225. [Google Scholar] [CrossRef]
  34. Ma, J.; Sun, D.-W. Prediction of Monounsaturated and Polyunsaturated Fatty Acids of Various Processed Pork Meats Using Improved Hyperspectral Imaging Technique. Food Chem. 2020, 321, 126695. [Google Scholar] [CrossRef] [PubMed]
  35. Li, H.; Liang, Y.; Xu, Q.; Cao, D. Key Wavelengths Screening Using Competitive Adaptive Reweighted Sampling Method for Multivariate Calibration. Anal. Chim. Acta 2009, 648, 77–84. [Google Scholar] [CrossRef] [PubMed]
  36. Centner, V.; Massart, D.-L.; De Noord, O.E.; De Jong, S.; Vandeginste, B.M.; Sterna, C. Elimination of Uninformative Variables for Multivariate Calibration. Anal. Chem. 1996, 68, 3851–3858. [Google Scholar] [CrossRef]
  37. Nguyen, T.; Nguyen, B.M.; Nguyen, G. Building Resource Auto-Scaler with Functional-Link Neural Network and Adaptive Bacterial Foraging Optimization. In Theory and Applications of Models of Computation; Gopal, T.V., Watada, J., Eds.; Lecture Notes in Computer Science; Springer International Publishing: Cham, Switzerland, 2019; Volume 11436, pp. 501–517. ISBN 978-3-030-14811-9. [Google Scholar]
  38. Wold, S.; Ruhe, A.; Wold, H.; Dunn, W.J., III. The Collinearity Problem in Linear Regression. The Partial Least Squares (PLS) Approach to Generalized Inverses. SIAM J. Sci. Stat. Comput. 1984, 5, 735–743. [Google Scholar] [CrossRef]
  39. Zhao, J.; Yan, H.; Huang, L. A Joint Method of Spatial–Spectral Features and BP Neural Network for Hyperspectral Image Classification. Egypt. J. Remote Sens. Space Sci. 2023, 26, 107–115. [Google Scholar] [CrossRef]
  40. Díaz, E.O. Combined Analysis of Near-Infrared Spectra, Colour and Physicochemical Information of Brown Rice to Develop Accurate Calibration Models for Determining Amylose Content. Food Chem. 2019, 286, 297–306. [Google Scholar] [CrossRef] [PubMed]
  41. Prieto, N.; Pawluczyk, O.; Dugan, M.E.R.; Aalhus, J.L. A Review of the Principles and Applications of Near-Infrared Spectroscopy to Characterize Meat, Fat, and Meat Products. Appl. Spectrosc. 2017, 71, 1403–1426. [Google Scholar] [CrossRef] [PubMed]
  42. Li, L.; Li, M.; Liu, Y.; Cui, Q.; Bi, K.; Jin, S.; Wang, Y.; Ning, J.; Zhang, Z. High-Sensitivity Hyperspectral Coupled Self-Assembled Nanoporphyrin Sensor for Monitoring Black Tea Fermentation. Sens. Actuators B Chem. 2021, 346, 130541. [Google Scholar] [CrossRef]
  43. Kang, W.; Lin, H.; Jiang, R.; Yan, Y.; Ahmad, W.; Ouyang, Q.; Chen, Q. Emerging Applications of Nano-Optical Sensors Combined with near-Infrared Spectroscopy for Detecting Tea Extract Fermentation Aroma under Ultrasound-Assisted Sonication. Ultrason. Sonochem. 2022, 88, 106095. [Google Scholar] [CrossRef]
  44. Wang, C.; Han, H.; Sun, L.; Na, N.; Xu, H.; Chang, S.; Jiang, Y.; Xue, Y. Bacterial Succession Pattern during the Fermentation Process in Whole-Plant Corn Silage Processed in Different Geographical Areas of Northern China. Processes 2021, 9, 900. [Google Scholar] [CrossRef]
  45. Brüning, D.; Gerlach, K.; Weiß, K.; Südekum, K.-H. Effect of Compaction, Delayed Sealing and Aerobic Exposure on Maize Silage Quality and on Formation of Volatile Organic Compounds. Grass Forage Sci. 2018, 73, 53–66. [Google Scholar] [CrossRef]
  46. Wilkinson, J.M.; Davies, D.R. The Aerobic Stability of Silage: Key Findings and Recent Developments. Grass Forage Sci. 2013, 68, 1–19. [Google Scholar] [CrossRef]
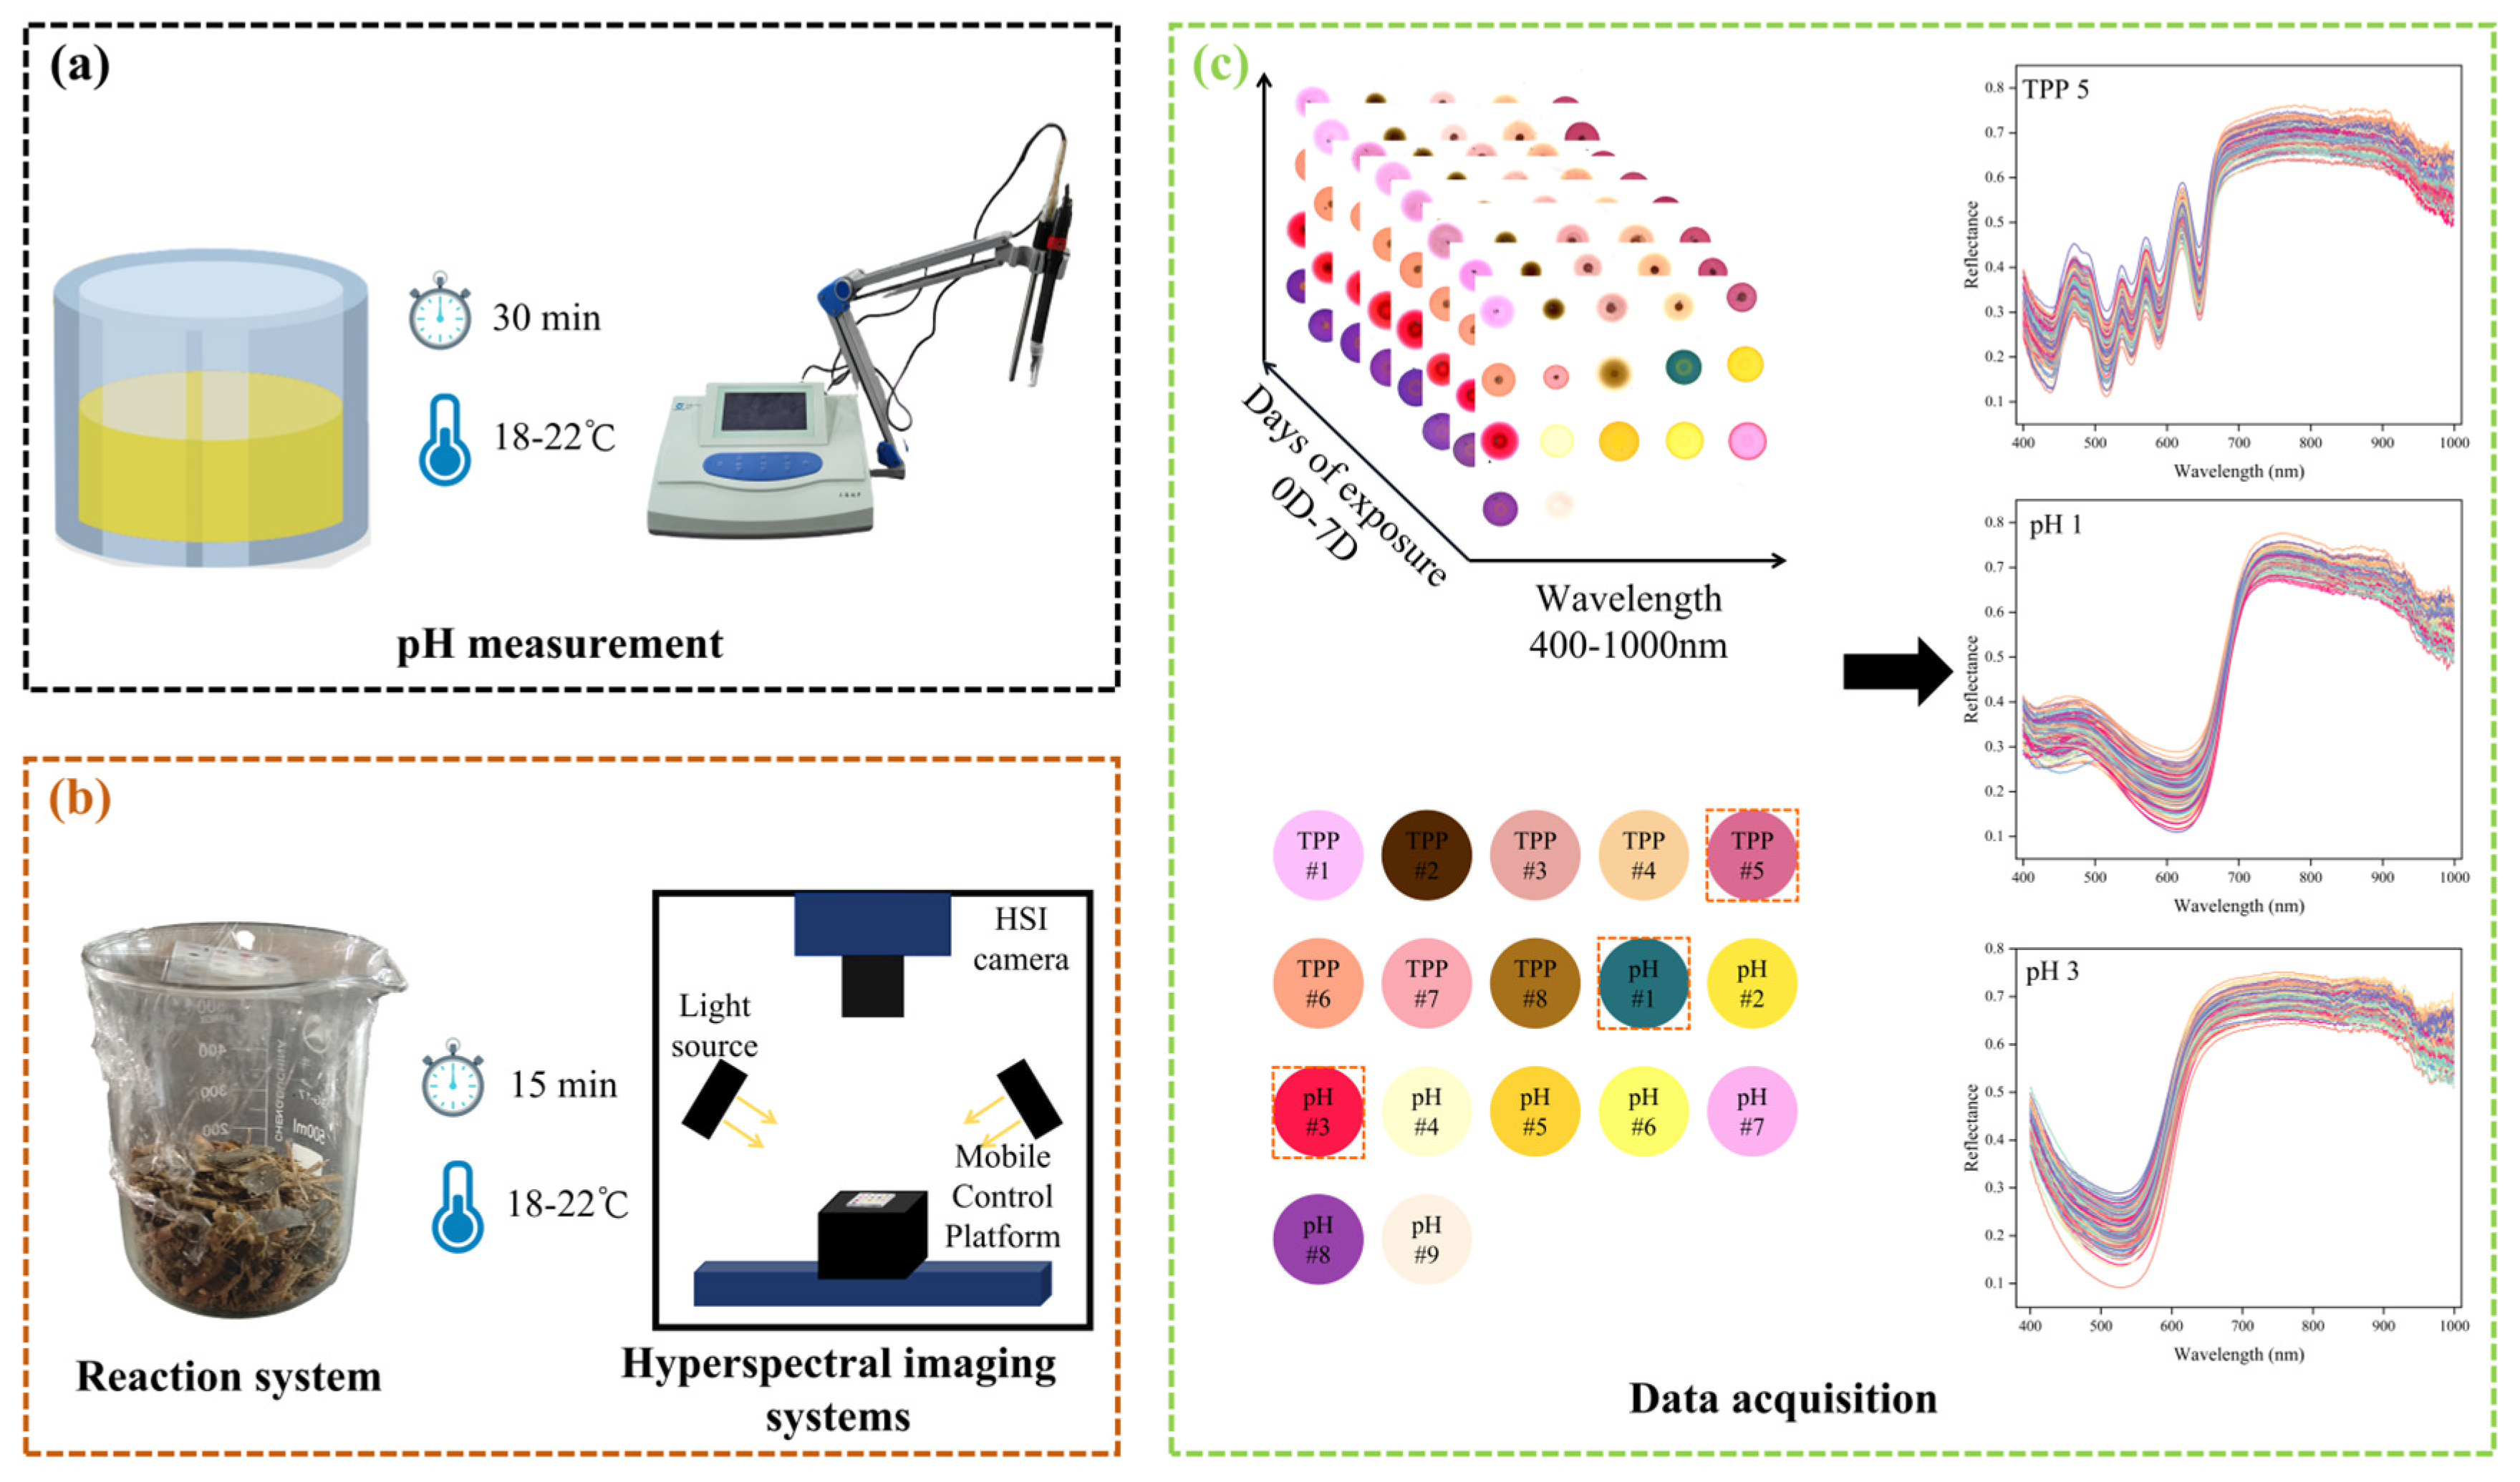
Figure 1. Schematic diagram of the test: (a) measurement of pH of maize silage filtrate; (b) reaction system and hyperspectral image acquisition of CSA; (c) positional distribution of sensor color-sensitive dyes and spectral data extraction.
Agronomy 15 00285 g001
Figure 2. pH value change curves of different maize silage samples during secondary fermentation.
Agronomy 15 00285 g002
Figure 3. Performance comparison of preprocessing algorithms for 17 dyes and preprocessing spectra of 3 dyes screened using the ABFO algorithm. (a) The percentage of R P 2 values for different preprocessing algorithms for each dye. (b) Pretreatment spectra of TPP5. (c) Pretreatment spectra of pH1. (d) Pretreatment spectra of pH3.
Agronomy 15 00285 g003
Figure 4. Frequency statistics of selection of different dye wavelengths after 50 iterations of the ABFO algorithm.
Agronomy 15 00285 g004
Figure 5. Results of different dye variables selected based on adaptive bacterial foraging optimization (ABFO) algorithm, competitive adaptive weighted sampling (CARS) algorithm, and uninformative variable elimination (UVE) algorithm: (a) distribution of characteristic wavelengths of TPP5 identified using different algorithms, (b) distribution of characteristic wavelengths of pH1 identified using different algorithms, and (c) distribution of characteristic wavelengths of pH3 identified using different algorithms.
Agronomy 15 00285 g005
Figure 6. Optimal regression model performance based on combinatorial dyes: (a) ABFO-BPNN modeling of combinatorial dyes. (b) ABFO-PLSR modeling of combinatorial dyes. Optimal regression model performance based on an individual dye: (c) ABFO-BPNN modeling of pH3. (d) CARS-PLSR modeling of pH3.
Agronomy 15 00285 g006
Table 1. PLSR modeling results for different preprocessing algorithms for each dye.
DyeRaw dataSNVSGMSCFDSD
R C 2 R P 2 R C 2 R P 2 R C 2 R P 2 R C 2 R P 2 R C 2 R P 2 R C 2 R P 2
TPP10.68050.55830.88830.83400.94710.80470.90610.85880.92300.77210.96710.6606
TPP20.71780.59220.75480.61210.93330.75270.83310.61940.97550.51350.98820.1351
TPP30.87170.55010.92310.74250.94140.81210.90160.75160.96790.59000.86250.2988
TPP40.92920.68830.85000.67150.92410.83810.95290.76240.91940.74510.84440.4399
TPP50.86150.44380.83140.64940.88870.83890.87610.63660.91570.52300.66890.2466
TPP60.80840.45320.83240.70530.91020.69000.84350.68230.84940.66520.83300.4829
TPP70.70260.27630.87670.45270.93040.88260.81030.62510.69130.39970.96030.5261
TPP80.86100.65910.75220.68630.92840.77030.75260.69380.93630.69300.92310.5244
pH10.78510.55250.95180.66460.82020.82900.91190.70210.84640.48310.90710.2994
pH20.69960.54660.85010.76120.95710.76910.90530.80740.73420.56270.63190.4167
pH30.84960.81080.87420.82260.97720.86130.84220.84200.84930.60490.91320.2286
pH40.84300.38810.76110.51520.93910.88180.81450.51650.90110.68330.84780.6617
pH50.72180.63650.83120.56480.88540.79960.79100.55620.89620.52170.68340.2517
pH60.72170.27880.90240.80380.91100.83630.65140.69910.80670.71240.64080.4489
pH70.82640.42300.72190.70250.92170.86810.93360.70580.80120.68720.83010.5485
pH80.69280.39180.97610.52530.95480.77600.88450.60810.95860.64480.90650.4062
pH90.61690.05850.66630.18290.93670.77220.82090.33010.78000.38620.63920.2796
Table 2. Results and comparison of the backpropagation neural network (BPNN) model and partial least squares regression (PLSR) model.
DyeExtraction
Method
BPNNPLSR
R C 2 RMSEC R P 2 RMSEPRPD R C 2 RMSEC R P 2 RMSEPRPD
TPP5RAW0.87720.53160.85620.59062.67210.88870.50590.83890.62512.5249
ABFO0.92530.41470.90560.47863.29750.93010.40120.88260.53352.9581
CARS0.91810.43420.88940.51793.04750.87890.52800.86360.57522.7437
UVE0.90090.47740.87880.54232.91040.90450.46880.86450.57342.7527
pH1RAW0.89100.50070.86960.56242.80650.82020.64320.82900.64392.4510
ABFO0.91690.43710.89450.50593.11970.89110.50070.85760.58772.6856
CARS0.90070.47790.88780.52163.02560.92290.42120.91630.45063.5025
UVE0.90660.46350.88090.53762.93590.91640.43870.89370.50783.1080
pH3RAW0.92450.41690.86230.57782.73140.97720.22880.86130.57992.7212
ABFO0.93280.39330.92790.41803.77540.90790.46020.88020.53912.9277
CARS0.94350.36050.90070.49073.21630.92110.42610.92090.43793.6034
UVE0.92140.42530.89110.51393.07090.92230.42280.88490.52832.9876
Combinatorial dyesRAW0.94510.35550.87690.54632.88900.94110.36810.90630.47673.3111
ABFO0.93330.39180.93480.39763.96950.92700.40990.93120.40853.8638
CARS0.95080.33640.90970.46793.37270.93060.39970.93010.41193.8317
UVE0.94360.36030.90290.48523.25290.91970.42990.91410.45653.4574
Disclaimer/Publisher’s Note: The statements, opinions and data contained in all publications are solely those of the individual author(s) and contributor(s) and not of MDPI and/or the editor(s). MDPI and/or the editor(s) disclaim responsibility for any injury to people or property resulting from any ideas, methods, instructions or products referred to in the content.