Abstract
Imbalanced and excessive fertilization leads to low nutrient utilization efficiency and wastage of fertilizer resources in processing tomatoes in Xinjiang. Determining nutrient requirements is vital for devising fertilization strategies that enhance yield, profitability, and environmental sustainability. This study utilized observational data from 181 farms across Xinjiang’s major processing tomato production areas from 2003 to 2023 to explore the relationship between fruit yield and nutrient uptake in aboveground dry matter. The Quantitative Evaluation of the Fertility of Tropical Soils (QUEFTS) model was employed to estimate nutrient requirements. The results indicated that when the target yield reached 60–70% of its potential, nutrient uptake by processing tomatoes increased linearly with fruit yield. To produce 1000 kg of fruit, the aboveground parts required 1.95 kg of nitrogen, 0.33 kg of phosphorus, and 2.28 kg of potassium, reflecting a N:P:K ratio of 1:0.17:1.17. In contrast, during harvesting, alternative plant parts required 1.31 kg of nitrogen, 0.21 kg of phosphorus, and 0.71 kg of potassium, with fruit nutrient uptake rates of 67.3%, 65.6%, and 74.9%, respectively. Field validation showed a strong correlation between the observed and simulated nutrient uptake rates, demonstrating the model’s accuracy in predicting nutrient demands. These findings provide critical insights for developing optimized fertilization strategies to enhance yield and nutrient use efficiency in Xinjiang’s processing tomato production.
1. Introduction
Processing tomato (Solanum lycopersicum L.) is one of the most widely cultivated horticultural crops, primarily used for producing tomato sauce. Xinjiang, the largest processing tomato-producing region in China, accounts for approximately 90% of the nation’s production and sales, ranking first in the country [1]. The region benefits from favorable soil, irrigation, and climatic conditions, including extended sunlight hours during the growing season and significant day-to-night temperature variations. These factors result in high yields, elevated soluble solid contents, and increased lycopene levels, making the tomatoes ideal for producing high-quality products [2]. With an export volume of 1.028 million tons, Xinjiang’s tomato products are distributed to regions such as Europe, America, Africa, and Central Asia, highlighting the crop’s domestic and international significance [3].
However, achieving high yields has often come at the cost of excessive fertilization, leading to low nutrient use efficiency and significant environmental consequences [4,5]. In China, open-field vegetable production applies an average of 859.5 kg ha−1 of nutrients (N + P2O5 + K2O) from chemical fertilizers, which is 2.6 times higher than the national average for all crops [6]. Despite this intensive input, nutrient utilization rates remain low, with nitrogen, phosphorus, and potassium efficiencies ranging from 18.4 to 34.0%, 6.1 to 17.4%, and 13.0 to 36.9%, respectively [7]. In Xinjiang, unbalanced and excessive fertilization not only causes nutrient losses and soil degradation but also threatens the sustainability of oasis agriculture. Timely application of recommended fertilizers must be prioritized to eliminate the widespread phenomenon of regional fertilization neglect [8]. Therefore, it is crucial to develop scientifically sound and efficient nutrient management strategies that enhance fertilizer use efficiency, sustain high yields, and minimize environmental impacts.
Numerous studies on processing tomato nutrient management and recommended fertilization practices have been conducted worldwide, significantly advancing the field [9,10,11]. Processing tomatoes, with their high nutrient demands, are particularly vulnerable to nutrient deficiencies [10,11]. Traditionally, fertilizer application has relied on assessing soil nutrients based solely on individual nutrient uptake parameters (N, P, or K). However, in Xinjiang, characterized by extensive cultivation areas and diverse ecological conditions, such approaches often fail to deliver tailored and rational fertilization recommendations that address the specific needs of different regions and crops. This limitation not only restricts the potential yield of high-yielding varieties but also adversely affects fertilizer utilization efficiency [12]. Consequently, addressing regional nutrient management challenges necessitates the integration of a comprehensive database with a reliable fertilizer application model, representing a new direction and trend in the development of effective fertilization strategies.
The application of crop growth models to estimate nutrient uptake is essential for balanced fertilization, which is critical to achieving target yields, maintaining soil fertility, and reducing environmental pollution [13,14]. Fertilizer recommendations based on data from limited experimental sites often target specific plots but lack scientific validity for broader regional applications, as the relationship between nutrient efficiency and yield is not linear [15]. Effective recommendations must account for diverse soil types, crop nutrient requirements, and regional climatic conditions. The QUEFTS (Quantitative Evaluation of the Fertility of Tropical Soils) model provides a robust solution by calculating nutrient uptake in aboveground biomass and fruit at varying yield potentials and targets while considering interactions among nitrogen (N), phosphorus (P), and potassium (K). Its reliance on extensive field trial data reduces biases from localized experiments, making it widely applicable across diverse ecological conditions [16]. Originally developed to predict maize yields in tropical regions under unfertilized conditions, the model has been refined for various crops to calculate nutrient requirements for specific yield targets [16]. A key feature of QUEFTS is its ability to account for the pairwise interactions of N, P, and K, ensuring accurate predictions for nutrient uptake. While the model has been successfully used internationally for nutrient management in various crops [17,18,19], it has yet to be applied to processing tomatoes, despite their high nutrient demands and susceptibility to deficiencies.
From 2003 to 2023, field experiments were conducted across regions with varying climates, soil types, and processing tomato varieties to support the development of the QUEFTS model. Data collected between 2021 and 2023 were used to validate the model. The objectives of this study were to (1) establish functions describing the relationship between processing tomato yields and nutrient uptake in aboveground biomass; (2) apply the QUEFTS model to determine the optimal nutrient requirements for nitrogen (N), phosphorus (P), and potassium (K) in processing tomatoes; and (3) assess the accuracy of the model’s predictions for N, P, and K uptake through field validation trials.
2. Materials and Methods
2.1. Data Source
The processing tomato field trial data summarized in this study were obtained from 181 fertilizer trials conducted across 13 processing tomato-growing counties in Xinjiang from 2003 to 2023. These trials were part of the research projects of this group, the Xinjiang Soil Testing and Formulation Fertilizer Application Project, and academic papers published by peer experts in journals. The experimental sites reflected a range of nutrient management practices commonly employed by farmers in Xinjiang, resulting in diverse scenarios of nutrient dilution and accumulation. These practices included standard methods used by farmers, optimal nutrient management strategies, varying fertilizer rate treatments, and nutrient omission treatments. Utilizing these data, we constructed a processing tomato nutrient management database, analyzed the characteristics of nutrient uptake in processing tomatoes, and simulated nutrient uptake under different potential and target yields of processing tomatoes in Xinjiang using the QUEFTS model. This approach aimed to establish a quantitative relationship between yield and nutrient uptake, thereby determining optimal nutrient requirements. The processing tomato yield data recorded totaled 1,106, with the processing tomato nitrogen, phosphorus, and potassium nutrient uptake data totaling 882, 793, and 968, respectively (Table 1).
Table 1.
Soil properties of processing tomato experimental sites in Xinjiang.
2.2. Development of the QUEFTS Model
Previous studies have extensively described the computational steps of the QUEFTS model. In this study, the key steps of the model’s application are outlined as follows:
Step 1: Selecting an Appropriate Dataset
The first step was to select a suitable dataset of processing tomato trials to meet the boundary conditions required by the QUEFTS model. The dataset consisted of field trial data from processing tomato production in Xinjiang, spanning diverse soil conditions, nutrient management practices, and yield levels. This dataset ensured that the model captured variations in nutrient uptake and yield under different agronomic conditions. A key criterion for dataset inclusion was the availability of comprehensive nutrient uptake data for nitrogen (N), phosphorus (P), and potassium (K), as well as yield records. Additionally, data from trials affected by biotic or abiotic stressors, such as drought, pests, or diseases, were excluded to ensure that crop growth was influenced solely by nutrient availability [16,20].
Step 2: Defining Parameters for Nutrient Accumulation and Dilution
The second step involved defining the two key parameters of the QUEFTS model:
Maximum nutrient accumulation (a): the ratio of crop yield to nutrient uptake in the state of maximum accumulation.
Maximum nutrient dilution (d): the ratio of crop yield to nutrient uptake in the state of maximum dilution.
Internal efficiency (IE, kg kg−1) was used to quantify the economic yield produced per unit of nutrient uptake. To establish accurate nutrient accumulation and dilution boundaries, the upper and lower 2.5%, 5.0%, and 7.5% percentiles of all calculated IE values for N, P, and K were used. These percentiles reflected realistic ranges of nutrient use efficiency under varying conditions. Data with a harvest index (HI) below 0.4 kg kg−1 were excluded, as they indicated that crop growth was likely influenced by non-nutrient stress factors, such as flooding or pest infestation. By defining these boundaries, the model ensured precise simulations of nutrient uptake under both optimal and suboptimal conditions [16,20,21,22].
Step 3: Simulating Optimal Nutrient Requirements
Using the defined parameters, the QUEFTS model was applied to simulate the optimal nutrient uptake required for different potential and target yields of processing tomatoes. The model assumes that IE values remain constant until the target yield reaches 70–80% of the potential yield, reflecting the linear relationship between nutrient uptake and yield within this range. Simulations were conducted using Microsoft Excel’s Solver tool. This tool optimized the nutrient uptake for N, P, and K to achieve specific target yields while minimizing over-fertilization and nutrient loss. The Solver process calculated the optimal nutrient uptake curves for processing tomatoes under different yield scenarios, providing a scientific basis for balanced fertilization strategies. These simulations enabled the development of efficient and sustainable nutrient management recommendations tailored to local agronomic conditions [16,20].
Step 4: Validating Model Predictions
The final step was to validate the QUEFTS model by comparing its simulated nutrient uptake values with observed field data from processing tomato trials conducted in Xinjiang between 2021 and 2023. Field validation trials measured the nutrient uptake of N, P, and K in aboveground biomass at harvest and compared these values with the model’s predictions [16,20].
2.3. Field Validation
Field trials were conducted between 2021 and 2023 at seven locations in the Changji, Bazhou, and Tacheng regions of Xinjiang, with a total of 23 trials. The aim was to analyze the relationship between the actual nutrient absorption of aboveground biomass in processing tomatoes and the nutrient uptake predicted by the QUEFTS model. Processing tomatoes were grown in a plastic-covered field using locally popular varieties, and all fields were cultivated with optimized management practices. Transplanting occurred from April to mid-May, with harvests taking place from early August to early September. Each trial plot covered an area of 42 m2 and followed a randomized block design. The plots were mulched with four layers of plastic film, with two drip irrigation lines placed beneath one of the layers. Each plastic film covered two rows of plants, with a plant spacing of 28 cm and a row spacing of 60 cm.
The Nutrient Expert (NE) system provides fertilizer recommendations, developed by the International Plant Nutrition Institute (IPNI) as a decision support tool for nutrient management. This system utilizes an enhanced version of the SSNM (Site-Specific Nutrient Management) model and the QUEFTS model to determine the optimal nutrient requirements for processing tomatoes [23,24]. Within the Nutrient Expert system, nitrogen (N) fertilizer recommendations are based on the observed yield responses, which compare the yields of plots with adequate N, P, and K fertilization to those without nitrogen. The agronomic efficiency of N fertilizer application also plays a key role. The application rates for phosphorus (P) and potassium (K) are derived from both the yield response and reciprocal internal efficiency (RIE), with nutrient balances being maintained as part of the QUEFTS model’s simulation of nutrient management. This model ensures that the P and K applications are aligned with both yield response and RIE to preserve soil fertility [25]. The treatments in this study included balanced NE (Nutrient Expert-based fertilization) and NE (10% OF), where 10% of the chemical nitrogen fertilizer was substituted with organic nitrogen. The recommended fertilizer application rates ranged from 260 to 353 kg Nha−1, 95 to 141 kg P2O5ha−1, and 108 to 174 kg K2Oha−1. During the growing season of processing tomatoes, urea (46% N) was applied as a nitrogen fertilizer through drip irrigation, divided into seven applications (12.5:15:15:20:15:12.5:10). A total of 70% of the phosphate fertilizer, using calcium superphosphate as the base fertilizer, was broadcast and incorporated into the soil before processing tomato transplanting. The remaining 30% of the phosphate fertilizer, in the form of monoammonium phosphate, was applied through fertigation during the seedling stage. Potash fertilizer was applied three times, namely 30% in the early fruiting stage, 40% in the pre-fruiting stage, and 30% in the late fruiting stage, through fertigation using soluble potash sulfate (50% K2O).
At the time of processing tomato harvest, the number of processing tomato plants with an area of 2.4 × 3 = 7.2 m2 was investigated in each plot, and 12 plants were harvested to measure the number of processing tomato fruits per plant and the weight of a single fruit, and to calculate the yield. The fruit and canopy samples were harvested, dried at 70 °C, and then weighed. A portion of the samples was ground and digested using a H2SO4-H2O2 mixture. Total nitrogen and phosphorus were quantified using a flow analyzer, while total potassium was measured by flame photometry. The total accumulation of nitrogen (N), phosphorus (P), and potassium (K) in the entire plant was calculated by multiplying the nutrient concentrations by the dry matter weight.
2.4. Statistical Analysis
To evaluate the accuracy of the QUEFTS model’s simulations, two statistical metrics were employed to compare the simulated and observed nutrient uptake values for the entire plant: root mean square error (RMSE) and normalized root mean square error (nRMSE). The significance of the results was analyzed using ANOVA at a 0.05 probability level, performed with SPSS 18.0 software. The formulae were calculated as follows:
Here, si and mi denote the simulated and observed values, respectively; n represents the total number of observations; and refers to the average of the measured data [26].
3. Results
3.1. Fruit Yield and Nutrient Uptake
Among the 1,106 farm observations, the average fruit yield of processing tomatoes was 91,169 kg ha−1, with a wide range from 18,933 to 213,556 kg ha−1 (Table 2). The average harvest index (HI) was 0.54, ranging from 0.23 to 0.82. The average concentrations of nitrogen (N), phosphorus (P), and potassium (K) in the fruit were 25.4 g N kg−1, 4.4 g P kg−1, and 34.5 g K kg−1, with ranges of 9.0 to 54.0 g N kg−1, 1.3 to 9.2 g P kg−1, and 12.1 to 55.2 g K kg−1. These concentrations were higher than those found in the canopy, which had average values of 18.9 g N kg−1, 3.4 g P kg−1, and 15.5 g K kg−1, with ranges of 5.5 to 37.7 g N kg−1, 0.9 to 8.3 g P kg−1, and 4.9 to 6.9 g K kg−1. The average total nutrient uptake by the plant was 224.0 kg·ha−1 for N, 39.3 kg·ha−1 for P, and 250.8 kg·ha−1 for K, with ranges of 27.0–584.0 kg·ha−1 for N, 3.8–125.3 kg·ha−1 for P, and 30.4–810.0 kg·ha−1 for K. This variation in nutrient accumulation reflects differences in environmental conditions and tillage practices. The average harvest indices (HIs) for N, P, and K were 0.59, 0.59, and 0.71, respectively, indicating that about 59% of N, 59% of P, and 71% of K were stored in the fruit (Table 2).
Table 2.
Analysis of all processing tomato yield and nutrient uptake data in Xinjiang, China, from 2003 to 2023.
3.2. Characteristics of Internal Efficiency and Reciprocal Internal Efficiency
The QUEFTS model utilized internal efficiency (IE) and reciprocal internal efficiency (RIE) to analyze the relationship between processing tomato yield and the uptake of nitrogen (N), phosphorus (P), and potassium (K) in the aboveground parts of the plant, considering the nutrient transport efficiency from the plant to the fruit (Table 3). In this study, the datasets for IE and RIE were derived from various treatments, such as optimal treatment, omission treatment, and farmer’s practices treatment. The average internal efficiencies (IEs) of N, P, and K were 489, 2934, and 429 kg kg−1, respectively, with N ranging from 217 to 1169 kg kg−1, P from 1145 to 9410 kg kg−1, and K from 185 to 906 kg kg−1. Similarly, the average reciprocal internal efficiency (RIE) values required for N, P, and K were 2.21, 0.39, and 2.48 kg, respectively, with ranges of 0.86–4.62 kg for N, 0.11–0.87 kg for P, and 1.10–5.41 kg for K.
Table 3.
Characteristics of internal efficiency (IE) and reciprocal internal efficiency (RIE) of processing tomatoes in Xinjiang, China.
3.3. Determining the Parameters to Adapt the QUEFTS Model
In the QUEFTS model, two important parameters are the maximum nutrient accumulation boundary (a) and the maximum nutrient dilution boundary (d). The model uses intrinsic nutrient efficiency (IE) to represent these two parameters, applying the upper and lower 2.5%, 5.0%, and 7.5% of all calculated IE values to estimate the optimal nutrient requirements based on the maximum nutrient dilution and accumulation boundaries (Table 4). Sets I, II, and III select intrinsic nutrient efficiency values at the upper and lower bounds of 2.5% and 97.5%, 5% and 95%, and 7.5% and 92.5% to determine the a and d values for N, P, and K in processing tomatoes.
Table 4.
Characteristic of internal efficiency (IE) and reciprocal internal efficiency (RIE) of processing tomatoes in Xinjiang, China.
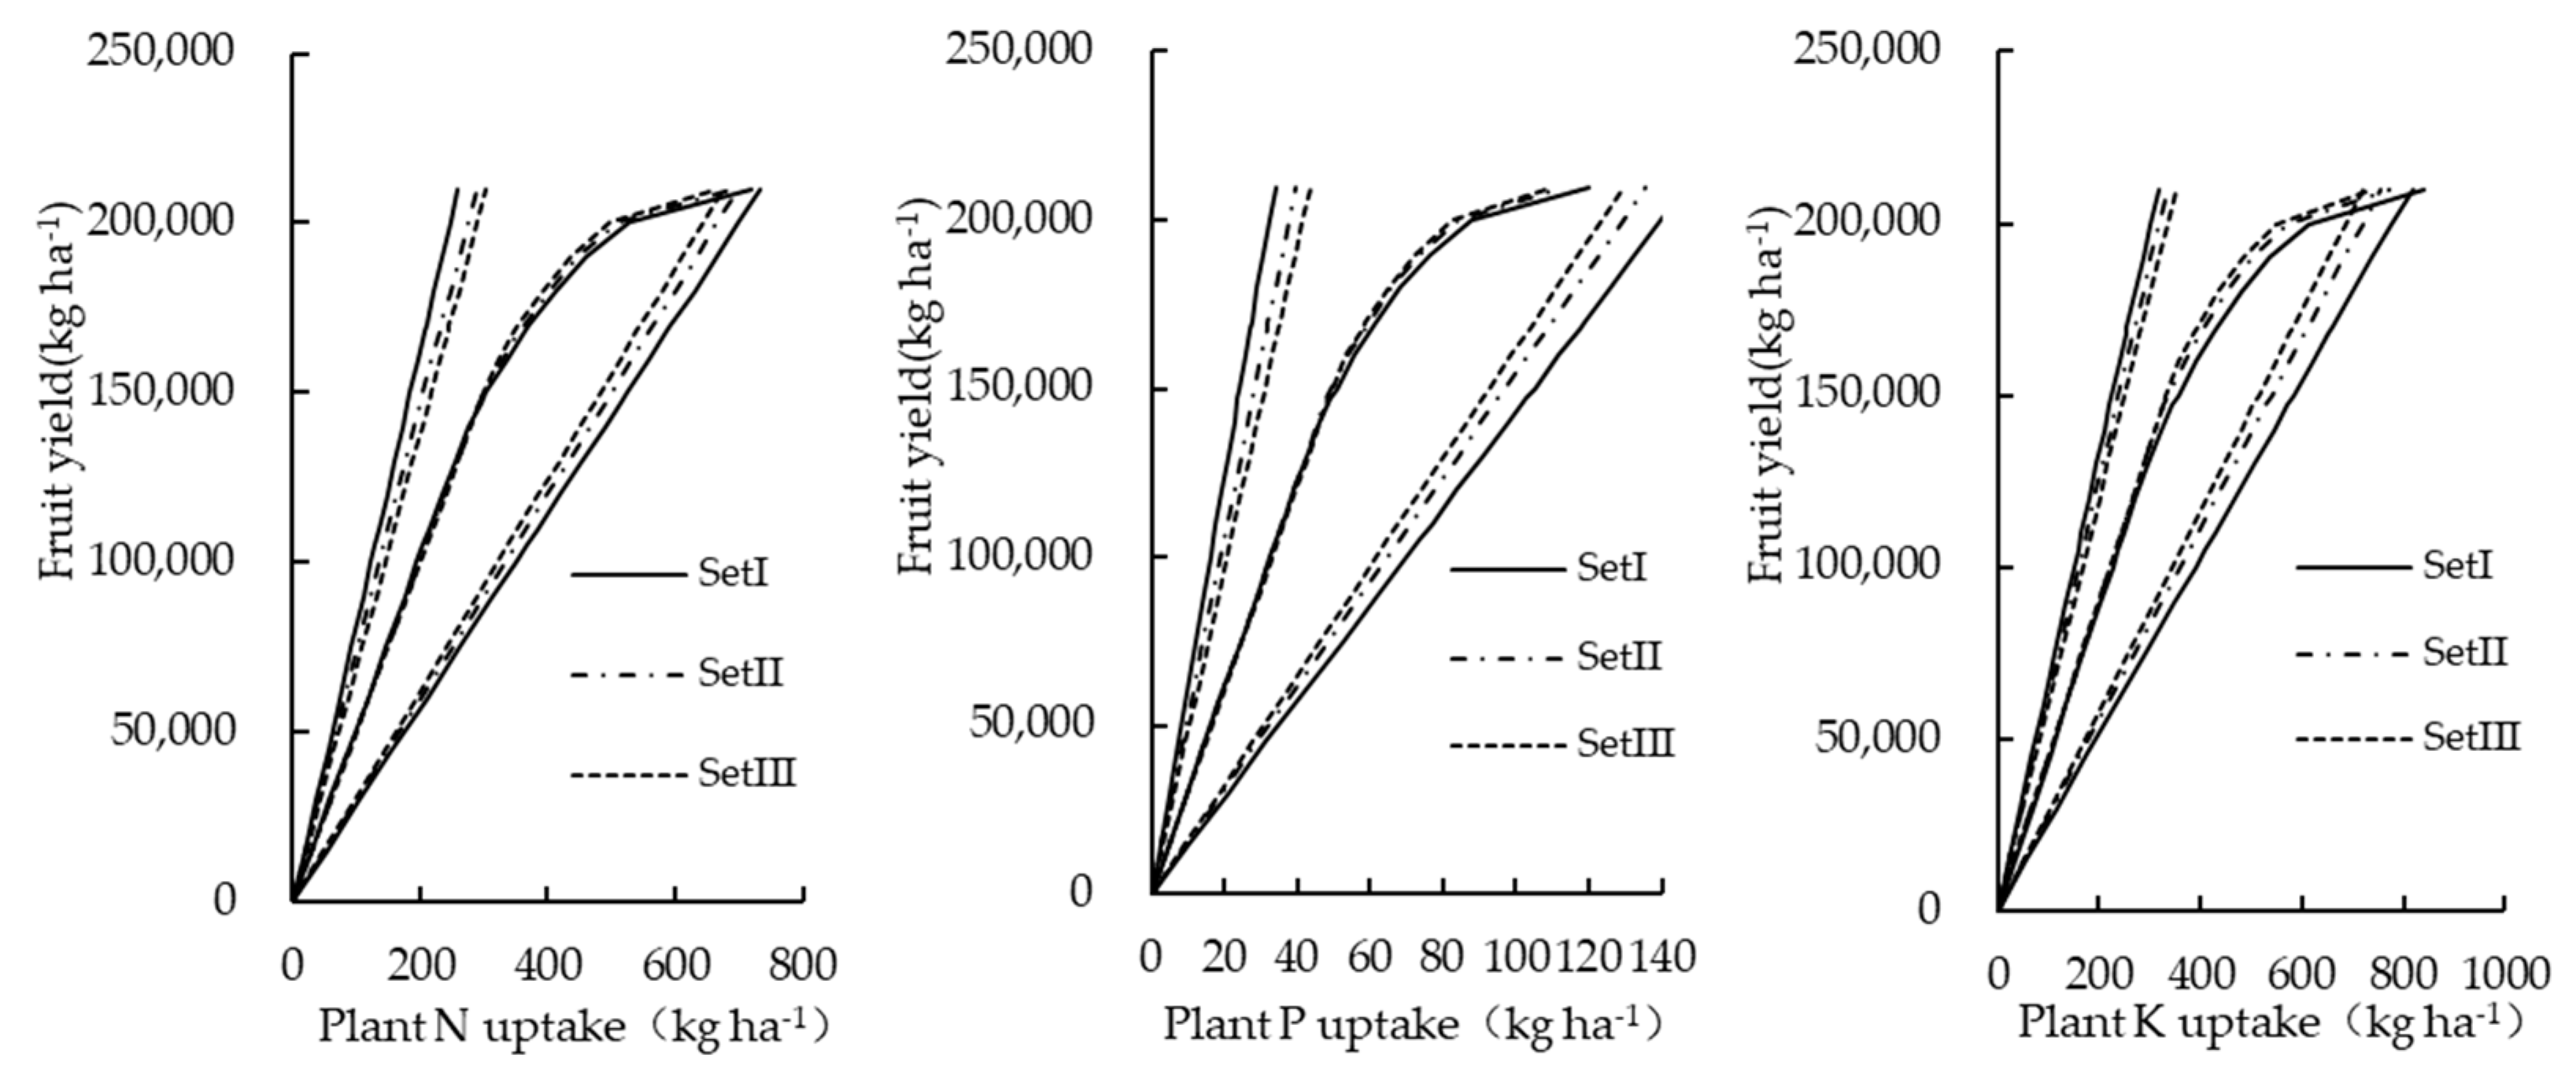
Figure 1 illustrates that the optimal nutrient absorption curves derived from the three sets of parameters are quite similar, with differences only evident near the potential yield. Given that Set I covers a broader range, it was used to estimate balanced nutrient uptake and examine the relationship between processing tomato yield and nutrient absorption in the aboveground parts of the plant.
Figure 1.
Relationships between fruit yield and nutrient uptake of processing tomatoes under different constant sets of a and d: Sets I, II, and III excluding the upper and lower 2.5th, 5.0th, and 7.5th percentiles of internal efficiency (IE) data.
3.4. Estimation of the Optimal Nutrient Uptake
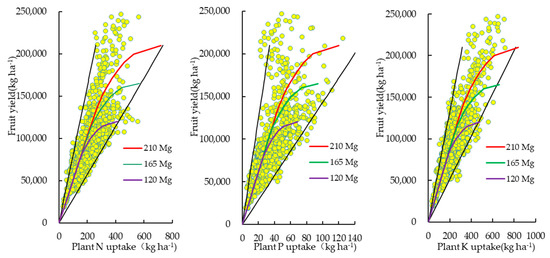
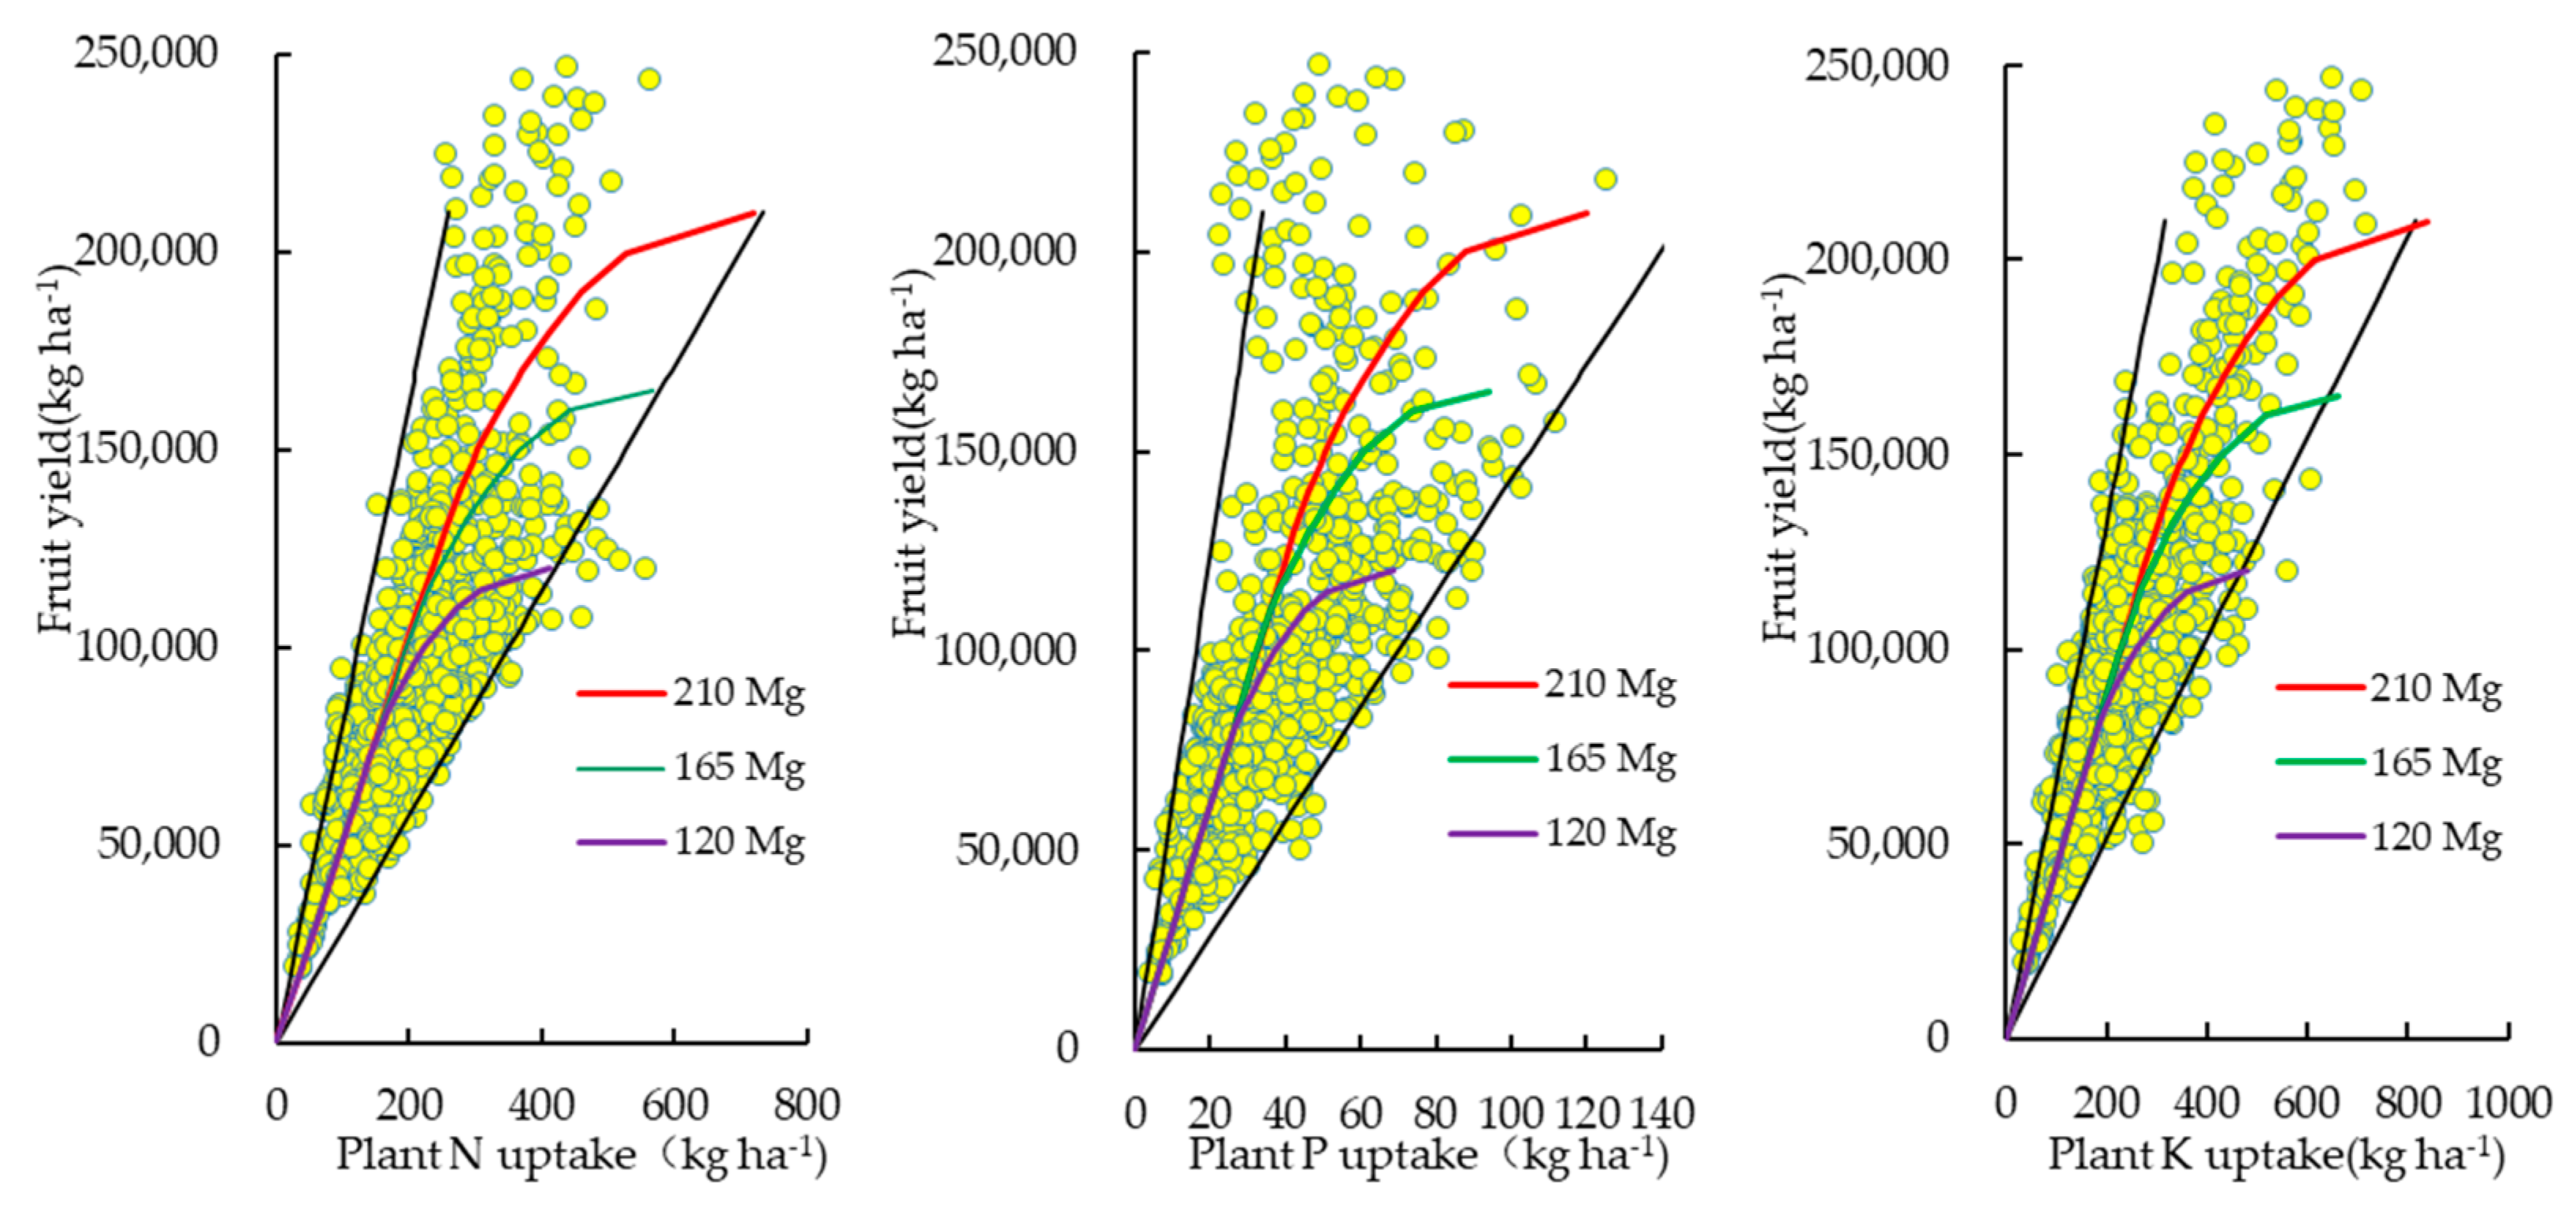
The QUEFTS model was applied to estimate optimal nutrient requirements for various target yields ranging from 120 to 210 Mg ha−1, using Set I values for a and d. Considering that the average processing tomato yield in Xinjiang ranges from 18 to 213 Mg ha−1, a potential yield of 210 Mg ha−1 was chosen to simulate the plant’s N, P, and K uptake, as yields in this region rarely exceed this level. The model indicated a linear relationship between target yield and optimal nutrient uptake up to approximately 60–70% of the potential yield (Figure 2). Beyond this threshold, achieving higher yields required greater nutrient input, leading to a decline in internal efficiency (IE) as the target yield approached the potential yield. As a result, optimal nutrient requirements for N, P, and K varied significantly depending on the target yields.
Figure 2.
Optimal nutrient uptake in Xinjiang processing tomatoes under different potential yields simulated by QUEFTS model. The upper and lower black line represent the maximum nutrient accumulation boundary and the maximum nutrient dilution boundary of above-ground plant with target yield 210 Mg ha−1, respectively.
The QUEFTS model predicted that the balanced nutrient uptake needed to produce 1000 kg of processing tomatoes was 1.95 kg of N, 0.33 kg of P, and 2.28 kg of K when the yield reached approximately 60–70% of the target yield. The corresponding internal efficiency (IE) values were 512.3 kg for N, 3076.4 kg for P, and 439.1 kg for K. The optimal N:P:K ratios were calculated to be 1:0.17:1.17 for the entire processing tomato plant and 1:0.16:1.30 for the fruit. These ratios were comparable to the measured N:P:K uptake ratios of 1:0.17:1.12 obtained from field experiments.
Additionally, the QUEFTS model was used to simulate the nutrient requirements for the fruit, taking into account the nutrients removed during the harvest of processing tomatoes (or other plant parts). This approach helps to determine the appropriate fertilizer application, reducing waste and avoiding over-fertilization. The model estimated that the nutrient requirements for fruits at different target yields were closely aligned with the nutrient uptake of the entire plant, maintaining a linear relationship up to approximately 60–70% of the potential yield (Table 5). Specifically, to produce 1 Mg of processing tomatoes at around 60–70% of the target yield, the required nutrient uptake was 1.31 kg of N, 0.21 kg of P, and 1.71 kg of K, with corresponding internal efficiency (IE) values of 761.3 kg for N, 4688.4 kg for P, and 586.3 kg for K.
Table 5.
Simulated balanced nutrient uptake requirements and internal efficiencies (IEs) of N, P, and K, as determined by the QUEFTS model, to achieve target yields of processing tomatoes, with a potential yield of 210 Mg ha−1.
3.5. Field Validation
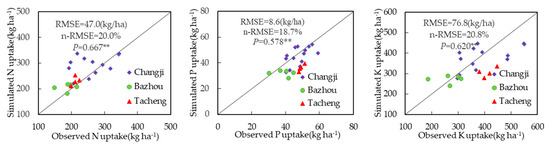
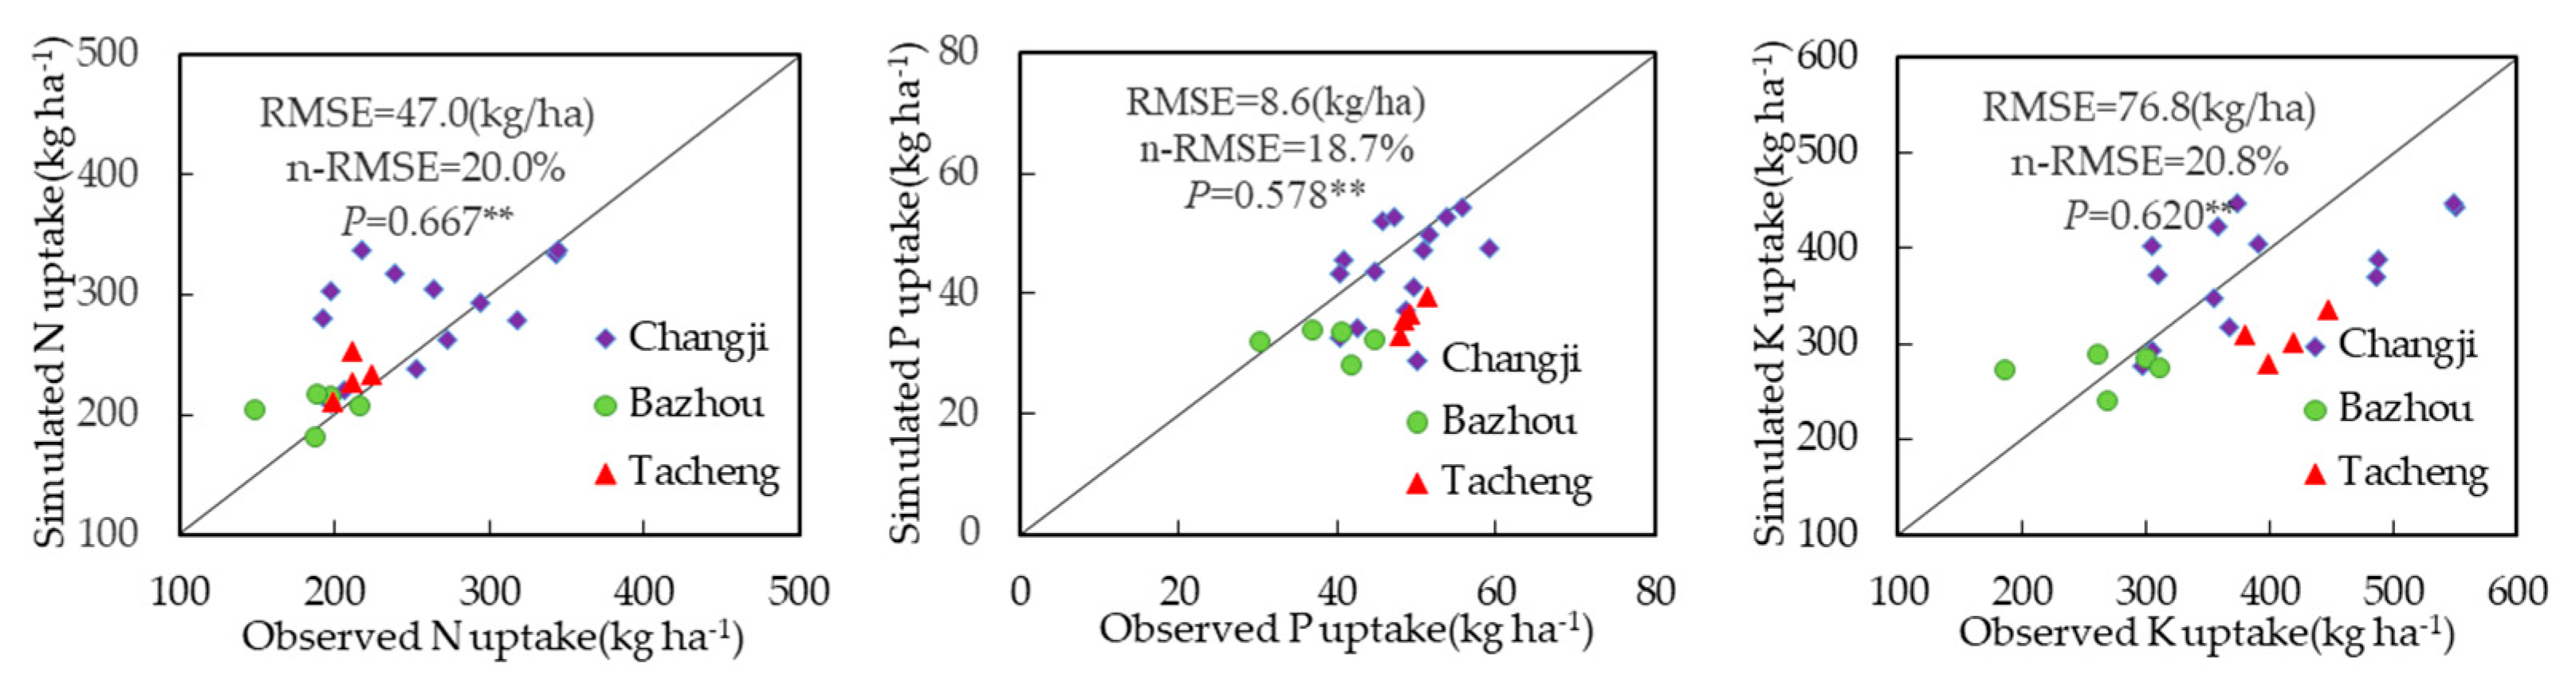
To calibrate and validate the QUEFTS model, field trials were conducted in 2021 and 2023 across key processing tomato production regions in Xinjiang using the NE system. Data for validation were collected from these experiments, where nitrogen (N) and potassium (K) application rates were determined based on the NE system, which integrates recommendations from both the SSNM and QUEFTS models. Fertilizer applications were carried out throughout the crop’s growth cycle. The model’s performance was assessed using RMSE and n-RMSE metrics. The P-values for observed versus simulated N, P, and K uptake were 0.667, 0.578, and 0.620, respectively. The RMSE values for N, P, and K were 47.0, 8.6, and 76.8 kg ha−1, with corresponding n-RMSE values of 20.0%, 18.7%, and 20.8%. These relatively low RMSE and n-RMSE values indicate strong agreement between the simulated and observed nutrient uptake levels. Although no significant differences in nutrient uptake rates were detected, deviations in certain potassium uptake values from the 1:1 line suggested instances of luxury K uptake, likely due to high initial soil K availability. Overall, the findings confirm the QUEFTS model’s reliability and suitability for guiding fertilization strategies for processing tomatoes in Xinjiang.
4. Discussion
Due to variations in climate types, soil fertility conditions, processing tomato varieties, and nutrient management practices across different regions, there was considerable variability in the yield and nutrient uptake of processing tomatoes [27,28,29]. In this study, the average fruit yield was 91.1 Mg ha−1, which is lower than the 119.4 Mg ha−1 reported in the Xinjiang Statistical Yearbook (2021). This discrepancy may be due to differences in the processing tomato varieties and field management practices between the experimental database and those used by local farmers. Significant variability in nutrient content was observed within processing tomato fruits and canopies, with higher nutrient levels typically resulting from excessive fertilization, while lower levels were found in control plots with no nutrient application.
The internal efficiencies (IE-N and IE-K) calculated from field experiments in the processing tomato database were much lower (489 and 429 kg kg−1, respectively) compared to IE-P (2934 kg kg−1), indicating that nitrogen and potassium efficiencies are more influenced by nutrient management practices. This aligns with previous research on vegetables and cereal crops [15,30]. The variability in IE values calculated from field trials in the processing tomato database reflects differences in environmental climate conditions (such as temperature, rainfall, and solar radiation), characteristics of processing tomato varieties, and field management practices, including irrigation and pest control. Therefore, a more reliable, quantitative, and model-based simulation method is needed to estimate the optimal nutrient requirements for processing tomatoes at various target yields.
This study utilizes the QUEFTS model to estimate the optimal nutrient requirements for processing tomatoes by analyzing multi-year and multi-site field trial data from major production areas. This method provides a quantitative evaluation of the relationship between processing tomato yield and nutrient uptake, effectively reducing biases associated with limited nutrient uptake data. The approach used to determine the a and d values for the QUEFTS model parameters aligns with methodologies applied in previous research on cereal crops, cassava, and sweet potatoes [15,31,32], involving the removal of the upper and lower 2.5%, 5.0%, and 7.5% of IE values to calculate the a and d values for radish N, P, and K, excluding data with a harvest index less than 0.40. The results revealed the minimal impact of these three sets of parameters on the nutrient uptake curve of processing tomatoes, showing only minor differences near the potential yield, consistent with previous research [20,33]. As the boundaries including a wider range are used when removing the upper and lower 2.5% of IE values, these a and d values were chosen as the parameters for the QUEFTS model to predict nutrient uptake in processing tomatoes. The simulated QUEFTS model values for IE-N, IE-P, and IE-K (512, 3076, and 439 kg kg−1, respectively) differ from those calculated through field experiments in the processing tomato database (489, 2934, and 429 kg kg−1, respectively), possibly due to imbalanced nutrient application in field trials and varying potential yields across different regions. Additionally, the simulation results found that within the target yield range of 70% of the potential yield, the nutrient uptake of fleshy roots increased linearly with yield, i.e., IE and RIE values remained constant, indicating that crop growth is primarily limited by nutrient availability. As the potential yield is approached, the IE values drop sharply, consistent with previous studies [34,35,36].
The field validation results indicated that the observed nutrient uptake closely aligned with the 1:1 line (Figure 3), demonstrating good agreement between the simulated and observed data. Moreover, there were no significant differences between the two datasets. These findings validate the QUEFTS model’s applicability in predicting nutrient and fertilizer requirements for cotton cultivation.
Figure 3.
Comparison of simulated and observed N, P, and K uptake in total processing tomato dry matter (2021–2023). This figure compares the simulated nutrient uptake data, estimated using the QUEFTS model, with the observed data collected from experimental field plots using the NE decision support system. The ** symbol indicates p < 0.01.
Farmers in the processing tomato industry often pursue high yields with excessive fertilization, significantly reducing nutrient internal efficiency. However, this study shows that maximizing nutrient use efficiency through balanced application of nitrogen, phosphorus, and potassium is more beneficial than aiming for higher yields close to the potential yield. Therefore, enhancing nutrient internal efficiency through balanced fertilization is crucial for achieving high yields and efficiency in processing tomato production in Xinjiang.
5. Conclusions
This study applied the QUEFTS model to estimate nutrient requirements for processing tomatoes in Xinjiang. The model demonstrated strong agreement between the simulated and observed nutrient uptake, with low RMSE values for N, P, and K uptake. The results showed a linear increase in nutrient uptake with yield up to 60–70% of the potential yield, requiring 1.95 kg N, 0.33 kg P, and 2.28 kg K per 1000 kg of fruit. The findings emphasize the importance of balanced fertilization for improving nutrient use efficiency and minimizing losses. By providing accurate nutrient recommendations, the QUEFTS model supports the development of sustainable fertilization strategies, enhancing yield, reducing environmental impacts, and promoting sustainable processing tomato production in Xinjiang.
Author Contributions
Data collection and investigation were performed by H.Y., Q.L. and Y.Z.; formal analysis was conducted by H.Y. and X.X.; original draft preparation was carried out by H.Y.; study design, supervision, manuscript revision, and approval for publication were overseen by J.G., Y.Z., P.H. and X.Y. All authors have reviewed and approved the final version of the manuscript.
Funding
This study was funded by the National agricultural science and technology project (20221805).
Data Availability Statement
The data generated and analyzed in this study can be requested from the corresponding author. Public access to the data is restricted due to shared ownership among the research collaborators.
Conflicts of Interest
The authors declare no conflicts of interest.
References
- Xu, J.; Wan, W.; Zhu, X.; Zhao, Y.; Chai, Y.; Guan, S.; Diao, M. Effect of regulated deficit irrigation on the growth, yield, and irrigation water productivity of processing tomatoes under drip irrigation and mulching. Agronomy 2023, 13, 2862. [Google Scholar] [CrossRef]
- Zhao, D.; Wang, Z.; Zhang, J.; Li, W.; Zhou, B. Improving yield and quality of processing tomato (Lycopersicon esculentum Miller) using alternate partial root-zone drip irrigation in arid northwest China. Water 2019, 11, 1503. [Google Scholar] [CrossRef]
- Li, S.; Fan, Y.; Han, J.; Liu, F.; Ding, Y.; Li, X.; Yu, E.; Wang, S.; Wang, F.; Wang, C. Foodborne pathogen and microbial community differences in fresh processing tomatoes in Xinjiang, China. Foodborne Pathog. Dis. 2024, 21, 236–247. [Google Scholar] [CrossRef] [PubMed]
- Dumas, Y.; Dadomo, M.; Di Lucca, G.; Grolier, P. Effects of environmental factors and agricultural techniques on antioxidant content of tomatoes. J. Sci. Food Agric. 2003, 83, 369–382. [Google Scholar] [CrossRef]
- Truffault, V.; Marlene, R.; Brajeul, E.; Vercambre, G.; Gautier, H. To stop nitrogen overdose in soilless tomato crops: A way to promote fruit quality without affecting fruit yield. Agronomy 2019, 9, 80. [Google Scholar] [CrossRef]
- Huang, S.W.; Tang, J.W.; Li, C.H.; Zhang, H.Z.; Yuan, S. Potential and scientific application strategies for reducing chemical fertilizer use in vegetables in China. J. Plant Nutr. Fertil. 2017, 23, 1480–1493. [Google Scholar]
- Huang, Z.C.; Liu, S.J.; Sun, H.; Hou, L.Z.; Wu, R.; Xue, W.T. Current status of vegetable fertilizer utilization rates in China and strategies for improvement. Vegetables 2021, 43, 43–50. [Google Scholar]
- Pramanick, B.; Choudhary, S.; Kumar, M.; Singh, S.K.; Jha, R.K.; Singh, S.K.; Salmen, S.H.; Ansari, M.J.; Hossain, A. Can site-specific nutrient management improve the productivity and resource use efficiency of climate-resilient finger millet in calcareous soils in India? Heliyon 2024, 10, e32774. [Google Scholar] [CrossRef]
- Farneselli, M.; Tosti, G.; Onofri, A.; Benincasa, P.; Guiducci, M.; Pannacci, E.; Tei, F. Effects of N sources and management strategies on crop growth, yield, and potential N leaching in processing tomato. Eur. J. Agron. 2018, 98, 46–54. [Google Scholar] [CrossRef]
- Hartz, T.K. The challenge of nutrition management of processing tomatoes in an era of rising yield expectations. In Proceedings of the XIV International Symposium on Processing Tomato, Santiago, Chile, 6–9 March 2016; ISHS Acta Horticulturae 1159. pp. 1–6. [Google Scholar]
- Thompson, R.B.; Voogt, W.; Incrocci, L.; Fink, M.; De Neve, S. Strategies for optimal fertiliser management of vegetable crops in Europe. Acta Hortic. 2018, 1192, 129–140. [Google Scholar] [CrossRef]
- Ravensbergen, A.P.P.; Chamberlin, J.; Craufurd, P.; Shehu, B.M.; Hijbeek, R. Adapting the QUEFTS model to predict attainable yields when training data are characterized by imperfect management. Field Crops Res. 2021, 266, 108126. [Google Scholar] [CrossRef]
- Pathak, H. Mitigating greenhouse gas and nitrogen loss with improved fertilizer management in rice: Quantification and economic assessment. Nutr. Cycl. Agroecosyst. 2010, 87, 443–454. [Google Scholar] [CrossRef]
- Darzi-Naftchali, A.; Motevali, A.; Layani, G.; Keikha, M.; Bagherian-Jelodar, M.; Nadi, M.; Firouzjaeian, A.A.; Pirdashti, H. Optimizing cropping pattern through reducing environmental issues and improving socio-economic indicators. Environ. Dev. Sustain. 2024, 26, 13041–13068. [Google Scholar] [CrossRef]
- Witt, C.; Dobermann, A.; Abdulrachman, S.; Gines, H.; Guanghuo, W.; Nagarajan, R.; Satawatananont, S.; Son, T.T.; Tan, P.S.; Van Tiem, L.; et al. Internal nutrient efficiencies of irrigated lowland rice in tropical and subtropical Asia. Field Crops Res. 1999, 63, 113–138. [Google Scholar] [CrossRef]
- Janssen, B.H.; Guiking, F.C.T.; Vander, E.D.; Smaling, E.; Wolf, J.; van Reuler, H. A system for quantitative evaluation of the fertility of tropical soils (QUEFTS). Geoderma 1990, 46, 299–318. [Google Scholar] [CrossRef]
- Remya Remesh, K.R.; Byju, G. Estimation of nutrient uptake requirements for yams in India based on QUEFTS model. J. Root Crops 2018, 44, 12–22. [Google Scholar]
- Shi, H.; Wang, M.; Zhao, J.; Zhang, Z.; Xu, X.; Liu, Z. Construction and validation of apple Nutrient Expert system based on yield response and agronomic efficiency. J. Plant Nutr. Fertil. 2023, 29, 496–510. [Google Scholar]
- Shehu, B.M.; Lawan, B.A.; Jibrin, J.M.; Kamara, A.Y.; Mohammed, I.B.; Rurinda, J.; Zingore, S.; Craufurd, P.; Vanlauwe, B.; Adam, A.M.; et al. Balanced nutrient requirements for maize in the Northern Nigerian Savanna: Parameterization and validation of QUEFTS model. Field Crops Res. 2019, 241, 107585. [Google Scholar] [CrossRef]
- Byju, G.; Nedunchezhiyan, M.; Ravindran, C.S.; Mithra, V.S.S.; Ravi, V.; Naskar, S.K. Modeling the response of cassava to fertilizers: A site-specific nutrient management approach for greater tuberous root yield. Commun. Soil Sci. Plant Anal. 2012, 43, 1149–1162. [Google Scholar] [CrossRef]
- Breure, M.S.; Van Eynde, E.; Kempen, B.; Comans, R.N.; Hoffland, E. Transfer functions for phosphorus and potassium soil tests and implications for the QUEFTS model. Geoderma 2022, 406, 115458. [Google Scholar] [CrossRef]
- Kang, F.; Wang, Z.; Xiong, H.; Li, Y.; Wang, Y.; Fan, Z.; Zhao, H.; Kuang, D.; Chen, Z.; Wang, J.; et al. Estimation of watermelon nutrient requirements based on the QUEFTS model. Agronomy 2020, 10, 1776. [Google Scholar] [CrossRef]
- Antwi, M.; Duker, A.; Fosu, M.; Abaidoo, R.C. Simulation of major soil nutrients requirement for maize production using the QUEFTS model in the Northern region of Ghana. Direct Res. J. Agric. Food Sci. 2017, 5, 133–140. [Google Scholar]
- Pampolino, M.F.; Witt, C.; Pasuquin, J.M.; Johnston, A.; Fisher, M.J. Development approach and evaluation of the Nutrient Expert software for nutrient management in cereal crops. Comput. Electron. Agric. 2012, 88, 103–110. [Google Scholar] [CrossRef]
- Jiang, W.; Liu, X.; Qi, W.; Xu, X.; Zhu, Y. Using QUEFTS model for estimating nutrient requirements of maize in the Northeast China. Plant Soil Environ. 2017, 63, 481–487. [Google Scholar] [CrossRef]
- Liu, H.L.; Yang, J.Y.; Drury, C.F.; Reynolds, W.D.; Tan, C.S.; Bai, Y.L.; He, P.; Jin, J.; Hoogenboom, G. Using the DSSAT-CERES-Maize model to simulate crop yield and nitrogen cycling in fields under long-term continuous maize production. Nutr. Cycl. Agroecosyst. 2010, 89, 313–328. [Google Scholar] [CrossRef]
- Min, Y.H.; Blackwell, M.; Rahn, C.; Chen, Q. Fertilization and catch crop strategies for improving tomato production in North China. Pedosphere 2015, 25, 364–371. [Google Scholar]
- Ronga, D.; Pentangelo, A.; Parisi, M. Optimizing N fertilization to improve yield, technological and nutritional quality of tomato grown in high fertility soil conditions. Plants 2020, 9, 575. [Google Scholar] [CrossRef]
- Singh, D.V.; Mukhi, S.K.; Mishra, S.N. Impact of integrated nutrient management on tomato yield under farmers field conditions. Int. J. Agric. Environ. Biotechnol. 2016, 9, 567–572. [Google Scholar] [CrossRef]
- Wei, J.; Li, S.; He, P.; Xu, X.; Tan, D.; Li, Y.; Li, G.; Guo, Y.; Cui, R. QUEFTS model-based estimation of the nutrient requirements and fertilizer recommendation for Chinese onion. HortScience 2022, 57, 297–303. [Google Scholar] [CrossRef]
- Kumar, P.; Dua, V.K.; Sharma, J.; Byju, G.; Minhas, J.S.; Chakrabarti, S.K. Site-specific nutrient requirements of NPK for potato (Solanum tuberosum L.) in Western Indo-Gangetic Plains of India based on QUEFTS. J. Plant Nutr. 2018, 41, 1988–2000. [Google Scholar] [CrossRef]
- Ezui, K.S.; Franke, A.C.; Mando, A.; Ahiabor, B.D.; Tetteh, F.M.; Sogbedji, J.; Janssen, B.H.; Giller, K.E. Fertilizer requirements for balanced nutrition of cassava across eight locations in West Africa. Field Crops Res. 2015, 185, 69–78. [Google Scholar] [CrossRef]
- Pathak, H.; Aggarwal, P.K.; Roetter, R.; Kalra, N.; Bandyopadhaya, S.; Prasad, S.; Van Keulen, H. Modelling the quantitative evaluation of soil nutrient supply, nutrient use efficiency, and fertilizer requirements of wheat in India. Nutr. Cycl. Agroecosyst. 2003, 65, 105–131. [Google Scholar] [CrossRef]
- Yimer, T.; Abera, G.; Beyene, S.; Ravensbergen, A.P.P.; Ukato, A.; Rasche, F. Optimizing fertilization schemes to narrow the maize yield gap in smallholder farming systems in southern Ethiopia. Heliyon 2024, 10, e33926. [Google Scholar] [CrossRef]
- Mohammad Nezhad, Y.; Basirat, M.; HajiAbaee, H.; Torabi, B. Determining the fertilizer requirement for irrigated wheat in Golestan Dam fields, using the QUEFTS model. J. Crops Improv. 2020, 22, 433–443. [Google Scholar]
- Pushpalatha, R.; Byju, G. QUEFTS model, a tool for site-specific nutrient management of crops: A review. Commun. Soil Sci. Plant Anal. 2022, 53, 2339–2352. [Google Scholar] [CrossRef]


Disclaimer/Publisher’s Note: The statements, opinions and data contained in all publications are solely those of the individual author(s) and contributor(s) and not of MDPI and/or the editor(s). MDPI and/or the editor(s) disclaim responsibility for any injury to people or property resulting from any ideas, methods, instructions or products referred to in the content. |
© 2025 by the authors. Licensee MDPI, Basel, Switzerland. This article is an open access article distributed under the terms and conditions of the Creative Commons Attribution (CC BY) license (https://creativecommons.org/licenses/by/4.0/).