Article

Quantitative Source Apportionment and Source-Oriented Health Risk of Heavy Metals in Soils: A Case Study of Yutian County in the Southern Margin of Tarim Basin, China

1
College of Geography and Remote Sensing Science, Xinjiang University, Urumqi 830046, China
2
Xinjiang Key Laboratory of Oasis Ecology, Xinjiang University, Urumqi 830046, China
3
College of Water Conservancy and Civil Engineering, Xinjiang Agricultural University, Urumqi 830052, China
4
No. 2 Hydrogeology and Engineering Geology Party, Xinjiang Bureau of Geology and Mineral Resources Exploration and Development, Changji 831100, China
*
Author to whom correspondence should be addressed.
Agronomy 2025, 15(12), 2721; https://doi.org/10.3390/agronomy15122721
Submission received: 30 October 2025 / Revised: 23 November 2025 / Accepted: 24 November 2025 / Published: 26 November 2025
(This article belongs to the Section Agricultural Biosystem and Biological Engineering)

Abstract

To explore the pollution sources and health risks of heavy metals in the soil of the southern margin of the Tarim Basin, 1231 soil samples were collected and analyzed for pH and eight heavy metals (Cr, Cd, Pb, Zn, Cu, Ni, As, and Hg). The self-organizing map (SOM) and positive matrix factorization (PMF) models were used to analyze the sources of heavy metals in the soil of the southern Tarim Basin, and a Monte Carlo method-based health risk assessment model was used to quantify the human health risks of different sources of pollution. The results showed that the average contents of all elements did not exceed the local soil background values, except Cd and Hg. The content of As in 0.24% samples was higher than the national risk screening value of China, and the content of the other heavy metals was lower than the Chinese national risk screening value. The main sources of heavy metal pollution were natural–traffic–agricultural mixed sources (60.9%), atmospheric dust fall sources (18.4%), and agricultural sources (20.7%). Soil As, Cr, Pb, Zn, Cu, and Ni were mainly influenced by natural–traffic–agricultural mixed sources. Hg was influenced by atmospheric dust fall (55%) and agricultural sources (45%). Cd was mainly influenced by natural–traffic–agricultural mixed sources (61.6%) and agricultural sources (37.8%). The levels of heavy metals in the soil in Yutian County did not pose a non-carcinogenic risk to humans, but they pose an alert carcinogenic risk to children and adults. Cr is identified as the priority pollutant for human health risk control, while the mixed sources from natural, traffic, and agricultural activities are recognized as the primary targets for pollution control. This study provides a reference for the precise prevention and control of soil heavy metal pollution in the southern margin of the Tarim Basin.

1. Introduction

Soil quality is affected by climate, soil parent material, water, biology, and time [1]. With the acceleration of urbanization, industrialization, and agricultural intensification, soil heavy metal pollution has gradually become a major social concern [2,3,4]. Heavy metals in soil are basic indicators of soil quality, as well as crucial parameters threatening soil health and food security [5]. The presence of heavy metals in soil reduces soil quality and affects crop yield and quality, and poses a risk to human health through food chain accumulation, inhalation of dust, and skin contact [6,7]. Source apportionment and determination of pollution sources and their contribution rates through traceability models are important prerequisites for remediation of contaminated soils and assessment of the impact of heavy metal exposure on human health because soil heavy metal pollution has the characteristics of concealment and complexity [8,9].
Currently, the positive matrix factorization (PMF) model, absolute factor analysis/multiple linear regression receptor model, as well as correlation and principal component analyses have been widely used for the traceability of heavy metals in soil [10,11,12]. Integrating the PMF model and a machine learning algorithm enables accurate traceability of heavy metal pollution to comprehensively, objectively, scientifically, and effectively quantify the pollution sources for different heavy metals [13,14]. The self-organizing map (SOM) is an unsupervised machine learning algorithm that can efficiently perform spatial clustering, interpretation, and visualization of heavy metal data [15,16]. On the basis of SOM network clustering, combined with the quantitative analysis of the PMF model, the accuracy of pollution source allocation can be improved and the credibility of pollution source interpretation results can be enhanced [17], thereby providing a scientific basis for precise pollution control. Therefore, the combined application of SOM and PMF can further promote the apportionment of multiple pollution sources and support the contribution of different pollution sources obtained by PMF, which will help to identify the complex sources of heavy metals in soil. Health risk assessment models recommended by the United States Environmental Protection Agency are commonly used for soil health risk assessment [18]. Probabilistic risk assessment has proven to be a more accurate method for assessing differences in pollution distribution based on the Monte Carlo model [19]. Existing health risk assessments fail to identify the main sources of pollution and associated risks, and they do not distinguish between pollutants that pose serious health hazards [20]. The introduction of source apportionment results into the risk assessment model can address the aforementioned problems and realize the effective identification and control of target pollutants and their sources, which is of great significance for pollution control under limited resources and costs [21].
Yutian County, Xinjiang China, is a state-level major development county in the oasis belt of the southern margin of the Tarim Basin, which is mainly agricultural and combines agriculture with animal husbandry. It is a crucial dry fruit and grain planting area in Xinjiang. Studies have indicated that the soil in Xinjiang is polluted to some extent by heavy metals such as Cd, Hg, and Pb [22,23]. The existing research on soil heavy metals in the study area mainly focuses on the spatial distribution characteristics and ecological risk, and is limited to concentration characterization or simple risk analysis. The contribution of mixed anthropogenic impacts to the sources of heavy metals in soils in the region and the health risks posed by specific sources of pollution are not well understood. Conducting soil heavy metal pollution traceability and precise control is an important basis for realizing regional agricultural safety production. A combined approach employing SOM and PMF can enhance our understanding of pollution areas in soil and help identify pollution sources, facilitating efficient management and planning in Yutian County. This study aimed to (1) determine the contents and spatial distribution characteristics of soil pH, Cr, Cd, Pb, Zn, Cu, Ni, As, and Hg; (2) use SOM and PMF models to reveal the sources of eight heavy metals in soil and quantify their relative contributions; (3) quantify the non-carcinogenic and carcinogenic probabilistic risks of heavy metals from different sources to adults and children, using the human health risk assessment model. The goal was to identify priority pollutants and pollution sources for early warning and control of regional soil heavy metal pollution, thereby providing a foundational basis for targeted management strategies.

2. Materials and Methods

2.1. Study Area

The study area is located in Yutian County, in the southwestern Chinese region of the Xinjiang Uygur Autonomous Region, on the southern edge of the Taklamakan Desert. The climate of the study area is warm, temperate, and continental arid. The annual average temperature is 12.2 °C, and the annual precipitation is 33.5 mm. The study area comprises six different land use types: woodland, grassland, cultivated land, water area, bare land, and artificial surface (Figure 1). Cultivated land is mainly distributed in the middle of the study area. The main soil types are brown desert, aeolian sandy, meadow, and irrigated silt soils (Figure S1). The types of soil parent materials include alluvium, alluvium-alluvium, calcareous alluvium, and sandy loess parent materials (Figure S2). Yutian County is an agricultural region, with wheat, corn, rice, and cotton as its main crops. The Yutian County Industrial Park, located in the east of the study area, focuses on processing of agricultural and sideline products, livestock products, and building materials. The main mineral resources in the county are iron, copper, gold, and jade.

2.2. Sample Collection and Treatment

In July 2016, 1231 groups of surface soil samples (0–20 cm) were collected from the study area (Figure 1). The sampling density of cultivated land was 1 group/km2, and that of other land use types was 1 group/4 km2. The Global Positioning System coordinates of each sampling point were recorded, and sampling was conducted according to the technical specification for soil environmental monitoring (HJ/T 166-2004) [24]. Litter was removed before sampling, and information on soil type and origin was recorded in detail. The original weight of the sample was >1 kg. The sample was sealed in a cloth bag covered with a polyethylene plastic bag, dried, screened using a 10 mesh (aperture 2 mm) nylon, and stored in a box for rain and moisture protection. Soil samples were obtained from the Ministry of Land and Resources of the People’s Republic of China by the Xinjiang Mineral Resources Supervision and Testing Center.
Sample analysis was performed in accordance with the Multi-objective Regional Geochemical Survey Specification (1:250,000) (DZ/T 0258-2014) [25]. Soil pH was determined by mixing soil with deionized water at 1:2.5 (w/v), and the pH was measured using a pH meter (PHS-3C, Shanghai, China). Approximately 100 mg of soil was digested using 3 mL concentrated HNO3 and 1 mL HF in PTFE sealed digestion tanks for 12 h at 180 °C. The contents of Ni, Cu, Zn, Pb, and Cd were determined using inductively coupled plasma mass spectrometry (X-series 2, Thermo Scientific, Waltham, MA, USA). The detection limits were 0.74 mg/kg, 0.95 mg/kg, 0.64 mg/kg, 0.65 mg/kg, and 0.002 mg/kg, respectively. The As, Cr, and Hg contents were determined using Atomic fluorescence spectroscopy (AFS, AFS-9230, Beijing, China). The detection limits were 0.11 mg/kg, 3.51 mg/kg, and 0.0005 mg/kg, respectively. Quality control measures were meticulously implemented employing GSS-18 (GBW07447, National Research Center, Beijing, China). Moreover, three analytical duplicates of soil samples were analyzed, ensuring that the relative standard deviation remained below 10%. The pass rate of accuracy and precision of each element was greater than 98%.

2.3. Self-Organizing Map (SOM)

Self-organizing map neural networks, proposed by Kohonen in 1981, are based on unsupervised learning methods [26]. SOMs can map the topological structure of points in a high-dimensional space to a low-dimensional space, and preserves the original distance or similarity relationship as much as possible [27,28]. SOM has been widely used in hydrology, environmental studies, and other related fields [29,30,31]. SOM addresses the shortcomings of traditional classification, effectively managing strong variability and distinguishing complex soil potential pollution sources. Therefore, it is widely used in classifying soil heavy metal pollution sources [32,33]. Nine indicators (Cr, Cd, Pb, Zn, Cu, Ni, As, Hg, and pH) of the 1231 soil samples were used as the input layer of SOM to train the neural network, and heuristic rules were used to select the map size, i.e., 5 n , in which n is the number of samples [34]. Considering the quantization and terrain errors, the final neural matrix consisted of 16 × 11 neurons. The combination of SOM and K-means can reduce the dimension of complex data and achieve optimal classification visualization [35]. The K-means clustering algorithm was used to classify the soil samples according to the optimal number of clusters determined by the minimum Davies–Bouldin Index (DBI) [36]. Visualization of the SOM was conducted using Matlab R2019a.

2.4. Positive Matrix Factorization

The positive matrix factorization model is a quantitative source analysis model based on multivariate factor analysis [37]. It is used to identify the source contributions of chemicals in the atmosphere, soil, and sediments [38,39]. EPA PMF (version 5.0) [40] was used to identify the sources of heavy metals in the surface soil of the study area. The model can be expressed as follows:
x i j   =   k   =   1 p g i k f k j   +   e i j
where x i j ,   g i k , and f k j are the content of the jth element in the ith soil sample (mg/kg), contribution concentration of the jth chemical component of source k (mg/kg), respectively. The residual matrix e i j can be calculated according to the minimum value of the objective function Q(E):
Q ( E )   =   i   =   1 n   j   =   1 m e i j μ i j 2
where μ i j is the uncertainty of the jth chemical component of the ith sample. The uncertainty was calculated from the method detection limit (MDL) and error score of the surrogate standard. When the concentration of a parameter was less than or equal to the MDL, the uncertainty was calculated as follows:
μ i j   =   5 6   ×   M D L
Otherwise, it was calculated as:
μ i j =   E r r o r   f r a c t i o n   ×   x i j 2   +   0.5   ×   M D L 2

2.5. Health Risk Assessment Based on Pollution Sources

The PMF and human health risk assessment models were used to assess the health risks of heavy metals in soil [41]. For adults and children, soil heavy metals enter the human body mainly as follows: oral ingestion, skin contact, and respiratory inhalation. This results in non-carcinogenic and carcinogenic risks to the human body [42]. The PMF model was used to determine the source contribution of heavy metals at each sampling point using the following formula:
C m j k   =     C m j k   × C m
where C m j k  represents the mass contribution of the jth heavy metal from the kth source in sample m;   C m j k represents the determined contribution of the jth heavy metal from the kth source in sample m, and C m represents the contents (mg/kg) of heavy metals in the soil sample m.
The average daily exposure dose of heavy metals from the kth source of the jth heavy metal in sample m can be computed as:
A D D m j i n g k   =   C m j k × I n g R × E F × E D B W × A T × 10 6
A D D m j i n h k = C m j k × I n h R × E F × E D P E F × B W × A T
A D D m j d e r m a l k = C m j k × S A × A F × A B S × E F × E D B W × A T × 10 6
where ADDing, ADDinh, and ADDdermal represent the average daily exposure dose from soil ingestion, inhalation and dermal absorption, respectively (mg/kg·day). The meanings and values of the exposure assessment parameters are shown in Table S1 [43,44,45,46].
The non-carcinogenic risk was calculated using the total hazard index (THI), which is the sum of hazard indices generated by the sum of hazard quotients (HQ) [39]. The formula is as follows:
H I   =   H Q m j i k = A D D m j i k R f D i
T H I = H I = A D D m j i n g k R f D i n g + A D D m j i n h k R f D i n h + A D D m j d e r m a l k R f D d e r m a l
where H Q m j i k represents the HQ on the ith exposure route from the kth origin of the jth heavy metal in sample m. If THI > 1, the public may suffer from non-carcinogenic effects that are considered acceptable levels [47].
The total cancer risk index (TCR) is similar to the THI and is calculated as follows:
C R   =   C R m j i k = A D D m j i k × S F i
T C R = C R = ( A D D m j i n g k × S F i n g ) + ( A D D m j i n h k × S F i n h ) + ( A D D m j d e r m a l k × S F d e r m a l )
where C R m j i k represents the cancer risk on the ith exposure route from the kth origin of the jth heavy metal in sample m. If the values of TCR are within the range of 10−6 to 10−4, it indicates an acceptable cancer risk; if the values of TCR > 10−4, it reveals that human beings experience a carcinogenic risk [48]. The reference dose (RfD) and slope factor (SF) of the different heavy metals are shown in Table S2 [43,44].

2.6. Monte Carlo Model

To avoid overestimation or underestimation of health risk assessment results caused by the direct use of deterministic parameters, this study used the Monte Carlo method to address the uncertainty caused by probabilistic parameters in health risk assessment [49]. Oracle Crystal Ball 11.1 software was used for data processing, and the number of iterations per run was set to 10,000. Combined with sensitivity analysis, the non-carcinogenic and carcinogenic risks of different pollution sources were calculated to obtain the contribution of heavy metals from different pollution sources to the total uncertainty [50].

3. Results and Discussion

3.1. Concentrations and Distribution of Soil Heavy Metals

The descriptive statistics of the soil heavy metal concentrations and pH in the study area are shown in Table 1. The soil pH ranged from 7.25 to 10.8, with an average of 8.64. Affected by the geographical location and climate driving factors, the soil pH value was generally high, showing obvious alkaline characteristics. However, the optimum pH range for most crops is usually between 5.5 and 7.5 [51], and higher pH values may adversely affect crop yield [52,53]. At the same time, alkaline soil conditions can reduce the mobility of heavy metals [54]. The average concentrations of Cr, Cd, Pb, Zn, Cu, Ni, As, and Hg were 47.73 mg/kg, 0.13 mg/kg, 17 mg/kg, 52.3 mg/kg, 17.83 mg/kg, 23.21 mg/kg, 9.15 mg/kg, and 0.02 mg/kg, respectively. Except for Cd and Hg, the average values of the other elements did not exceed the background values of soil in Xinjiang [55]. The results indicated that the contents of Cd and Hg in soil were affected by natural and external factors [39]. Specifically, the concentrations of Cr, Cd, Pb, Zn, Cu, Ni, As, and Hg in 38.5%, 47.5%,5.4%, 3.3%, 0.7%,19.6%, 20.0%, and 22.0% of the soil samples exceeded the corresponding background values (Table 1), respectively. In addition, the As concentration of 0.24% soil samples was higher than the risk screening value and the maximum value of other heavy metals was lower than the risk screening value. It indicated that the risk of soil pollution in the study area was low, and the whole was in a relatively safe state.
The average content of heavy metals in the study area was generally lower than that in other regions in China (Table 1). The coefficient of variation from high to low was: Hg > As > Cd > Ni > Zn > Cr > Cu > Pb. According to Costa et al. [56], the coefficient of variation of Hg in the study area was >30%, indicating high spatial heterogeneity and a strong influence of local human activities [14]. Cr, Cd, Zn, Ni, and As showed median variations, indicating that they may be affected by anthropogenic activities and natural factors [57]. Similar results of heavy metal accumulation in soils have been reported in other regions of Xinjiang [23,58,59,60,61]. Previous studies have shown that agricultural activities, integrated energy consumption, and industrial production affect the levels of Pb and Cd in Xinjiang soils [23]. Hg emissions from fossil fuels in China are considered to be the largest anthropogenic source of Hg, which made China the world’s largest emitter of Hg [62,63].
Table 1. Statistical characteristics of soil pH and heavy metal concentrations (mg/kg).
CrCdPbZnCuNiAsHga pH
Min27.100.0712.5036.8011.9015.303.300.017.25
Max97.100.2729.7093.8035.5067.2039.600.0710.80
Mean47.730.1317.0052.3017.8323.219.150.028.64
Median46.500.1216.8051.4017.2022.308.500.028.61
Standard deviation7.700.021.468.612.854.122.620.010.38
Coefficient of variation (%)16.1418.528.5616.4516.0017.7528.5830.274.37
Soil background in Xinjiang [55]49.300.1219.4068.8026.7026.6011.200.02-
b Soil environmental screening standard value (GB 15618-2018) 250.000.60170.00300.00100.00190.0025.003.40
Mean value of Weining County, Guizhou Province [32]167.435.69109.26314.99137.8177.1222.590.125.67
Mean value of Baoqing County, Heilongjiang Province [33]70.80.0825.4965.1625.0330.61-0.046.35
Mean value of Anqing City, Anhui Province [50]59.510.3446.0190.0225.73-12.910.32-
a Dimensionless for pH. b The National Environmental Quality Standards for soil in China (GB15618-2018) [64].
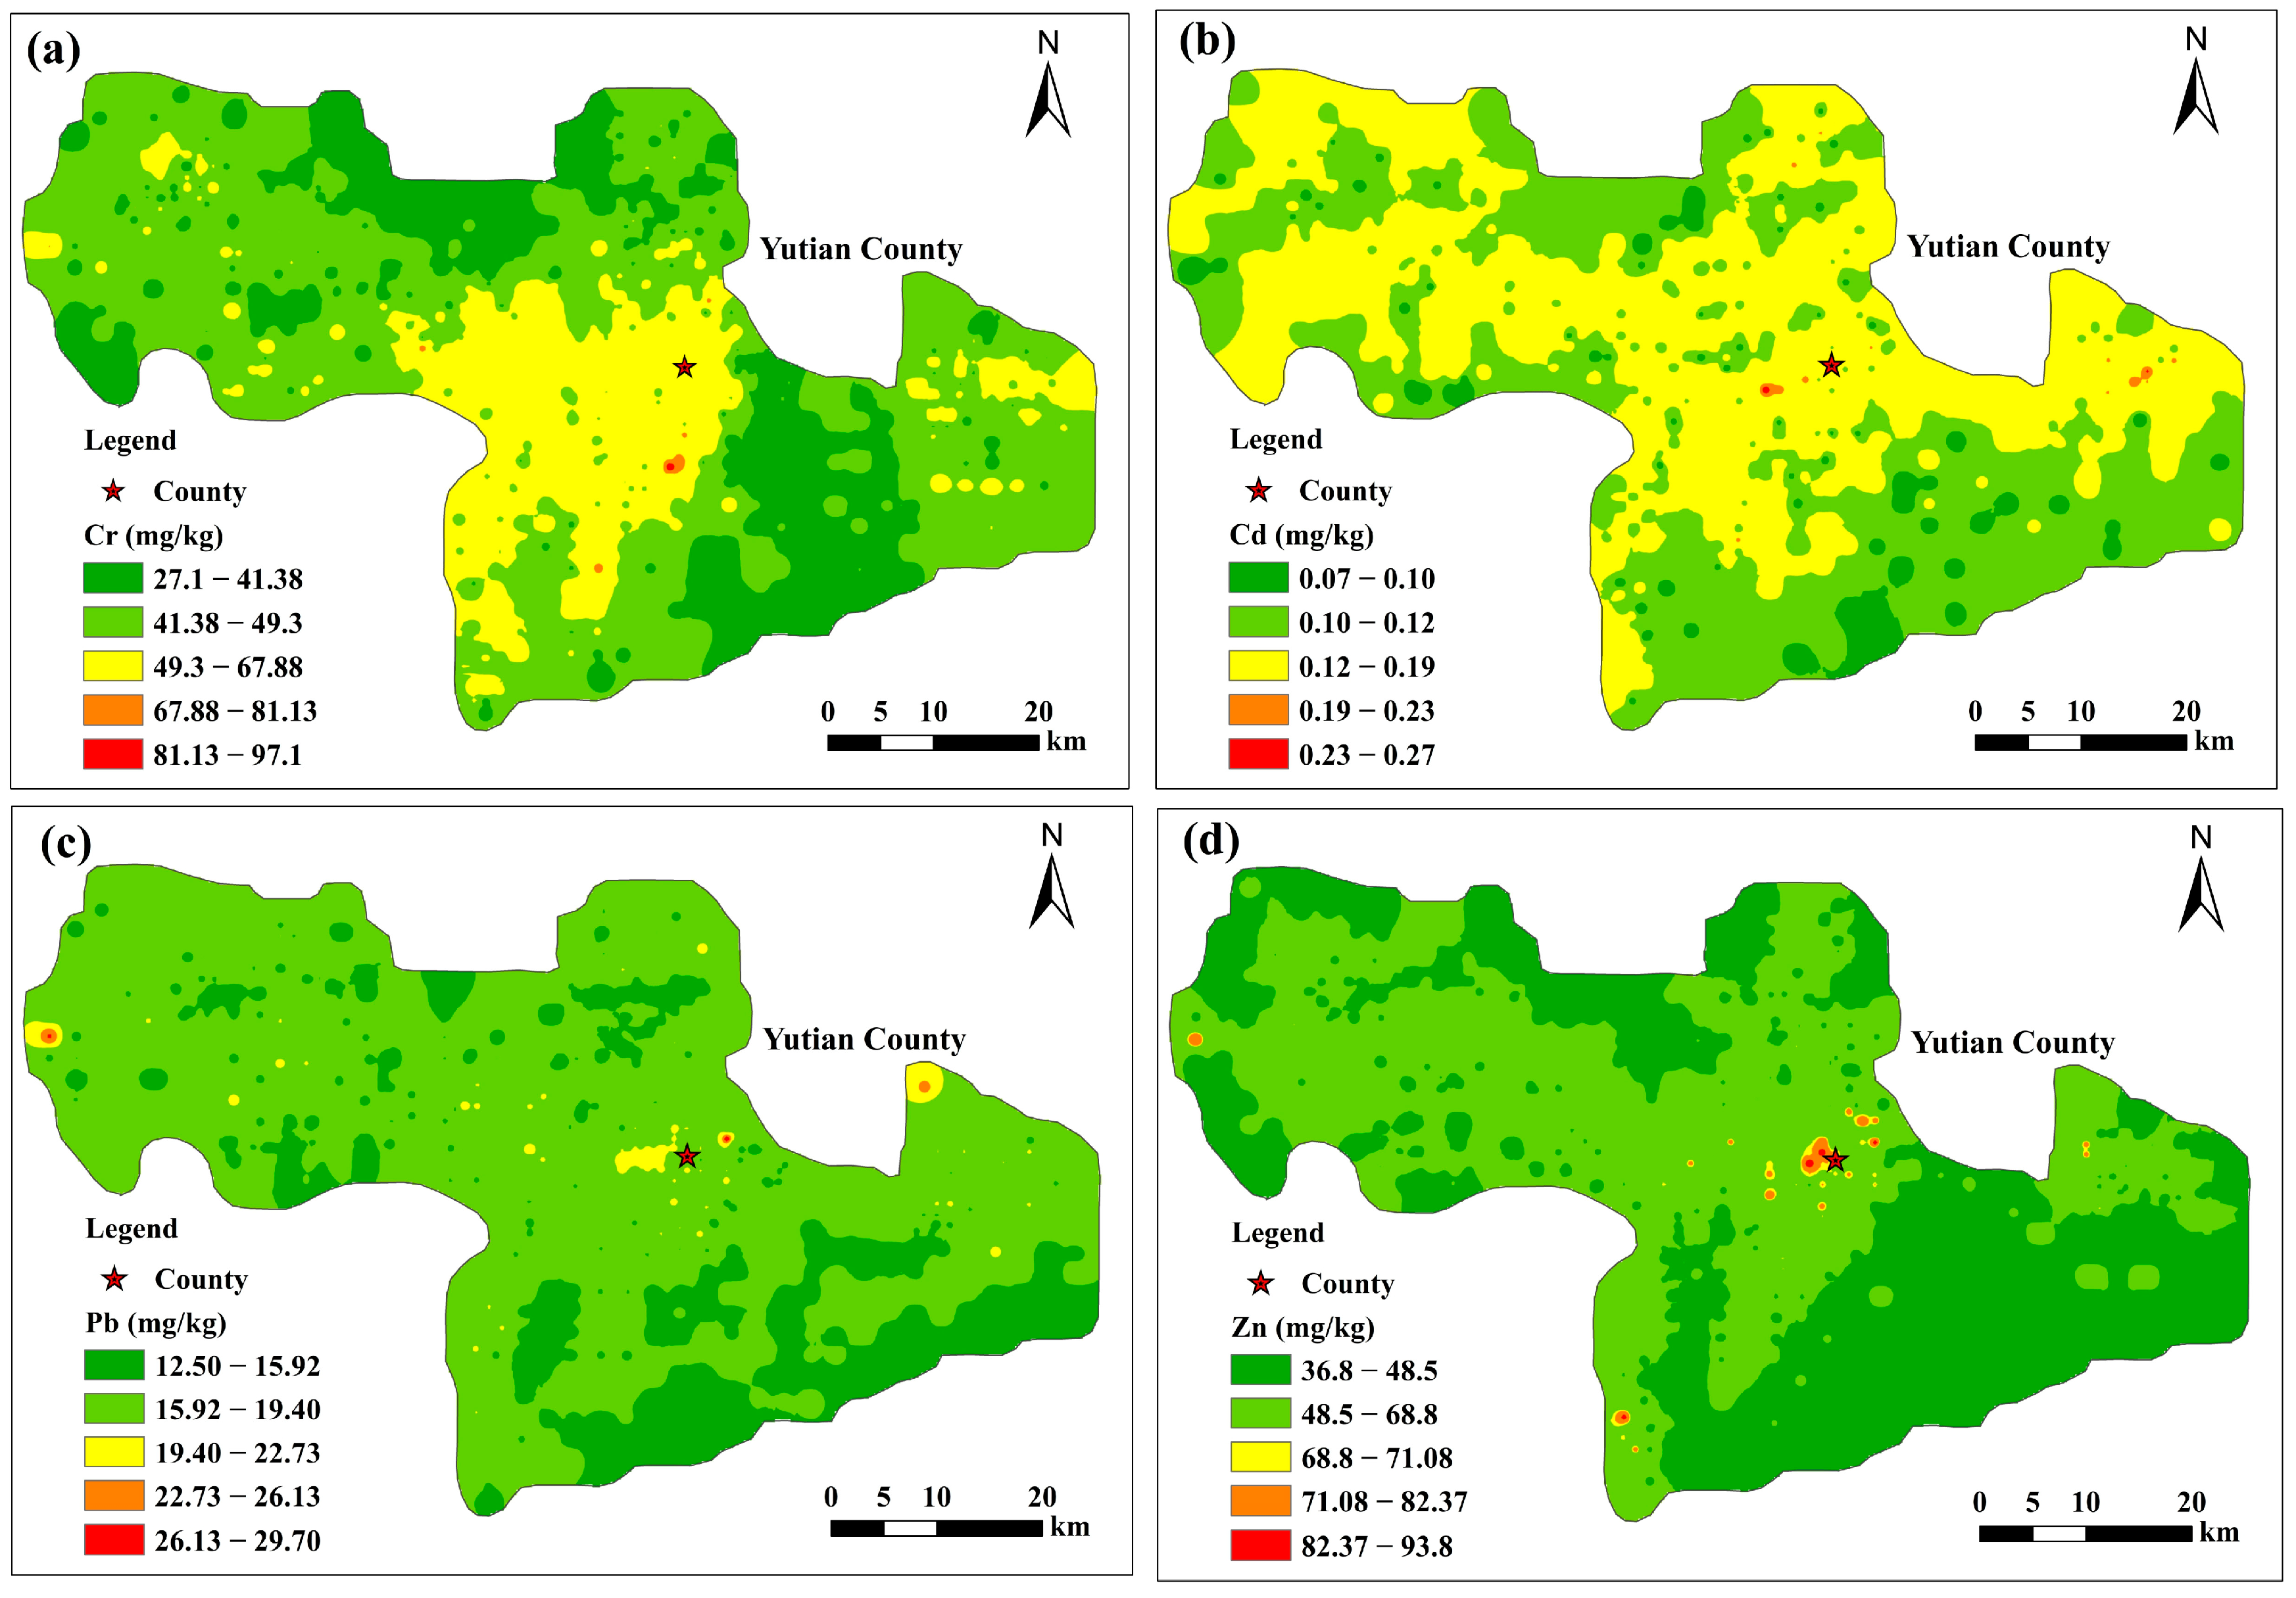
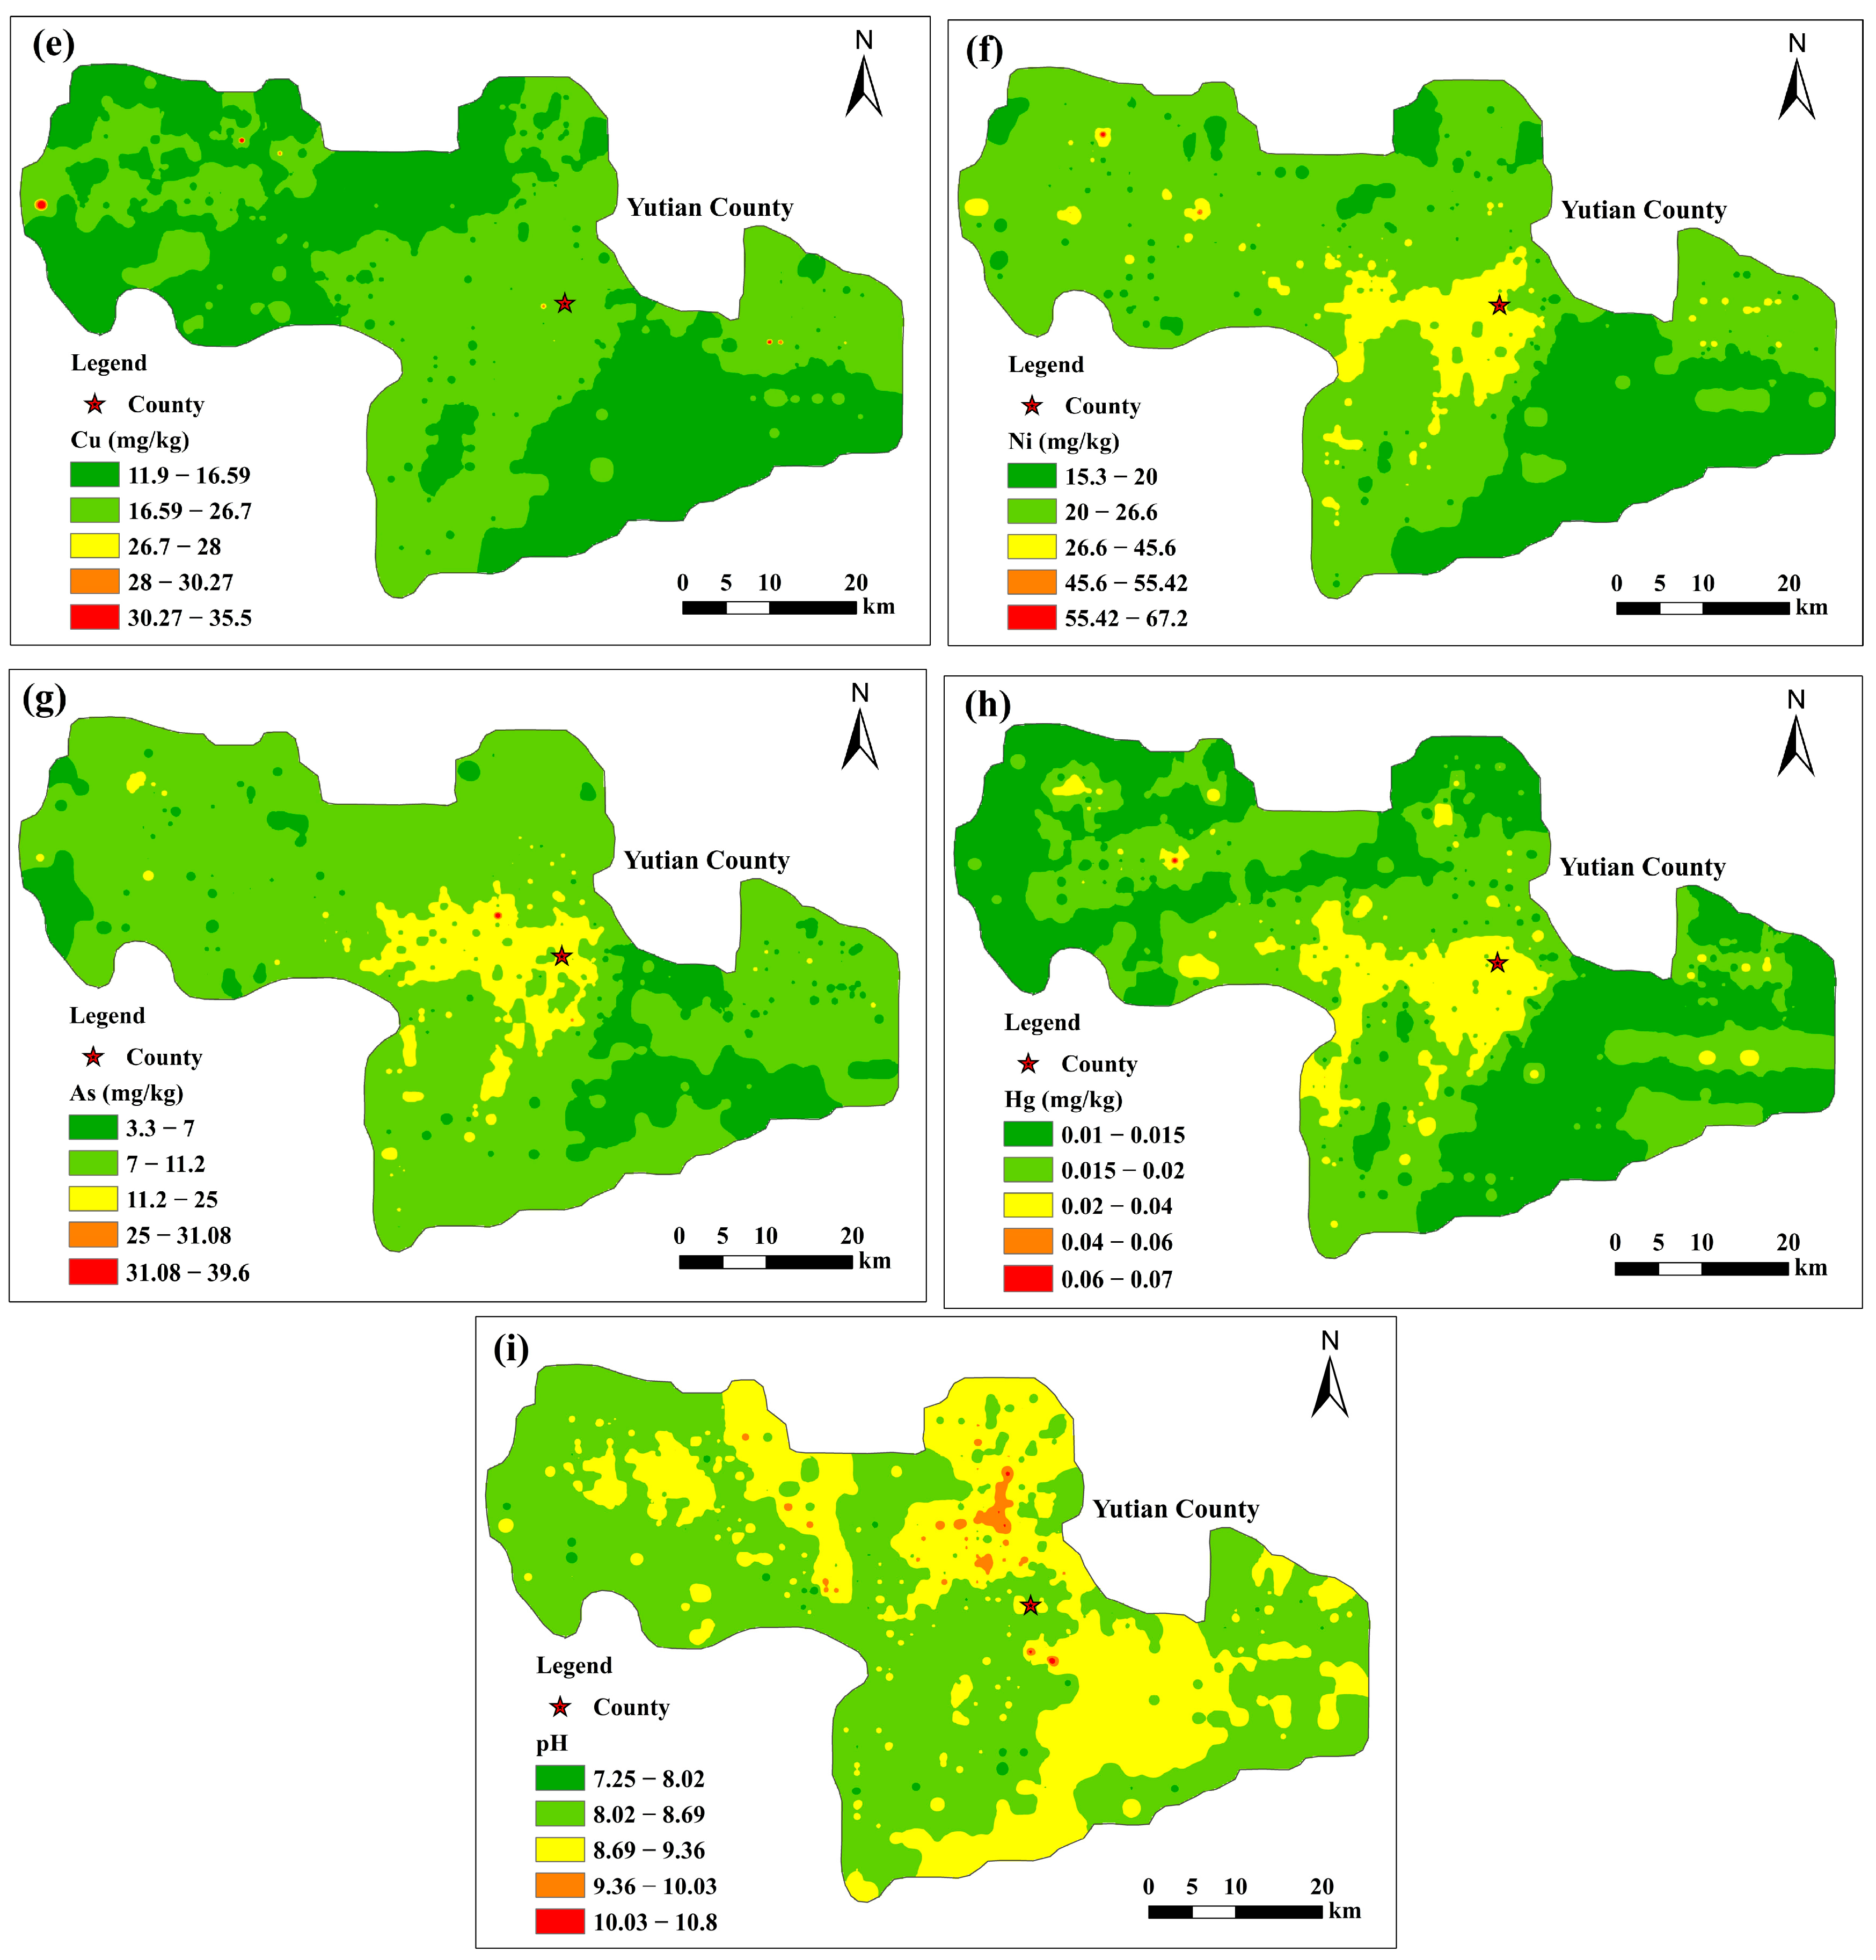
The inverse distance weighting is widely used in spatial interpolation and geographic information system. It can greatly retain the extreme value information, the interpolation effect is detailed, and it is easier to operate [65,66]. Especially, it is more effective when the sample points are distributed uniformly and densely [67]. Therefore, IDW was selected to map the spatial distribution of heavy metals in soil in this study. Figure 2 shows the spatial distribution of the eight heavy metals and soil pH. Green areas indicate where heavy metal concentrations are below the Xinjiang soil background. Spatially, the heavy metal content in the soil is higher in the middle and lower toward the periphery. The spatial distributions of Ni, As, and Hg are similar, and the high-value area is mainly concentrated in the middle of the study area. High Cu and Pb values are scattered in the west and east. The high-value area of Zn is mainly distributed in the vicinity of the county seat. The high-value area of Cd is widely distributed, and the high-value area of Cr is mainly distributed in the central and eastern parts of the study area. The soil pH in the northern part of the study area is higher, and the entire soil is alkaline.

3.2. SOM Results

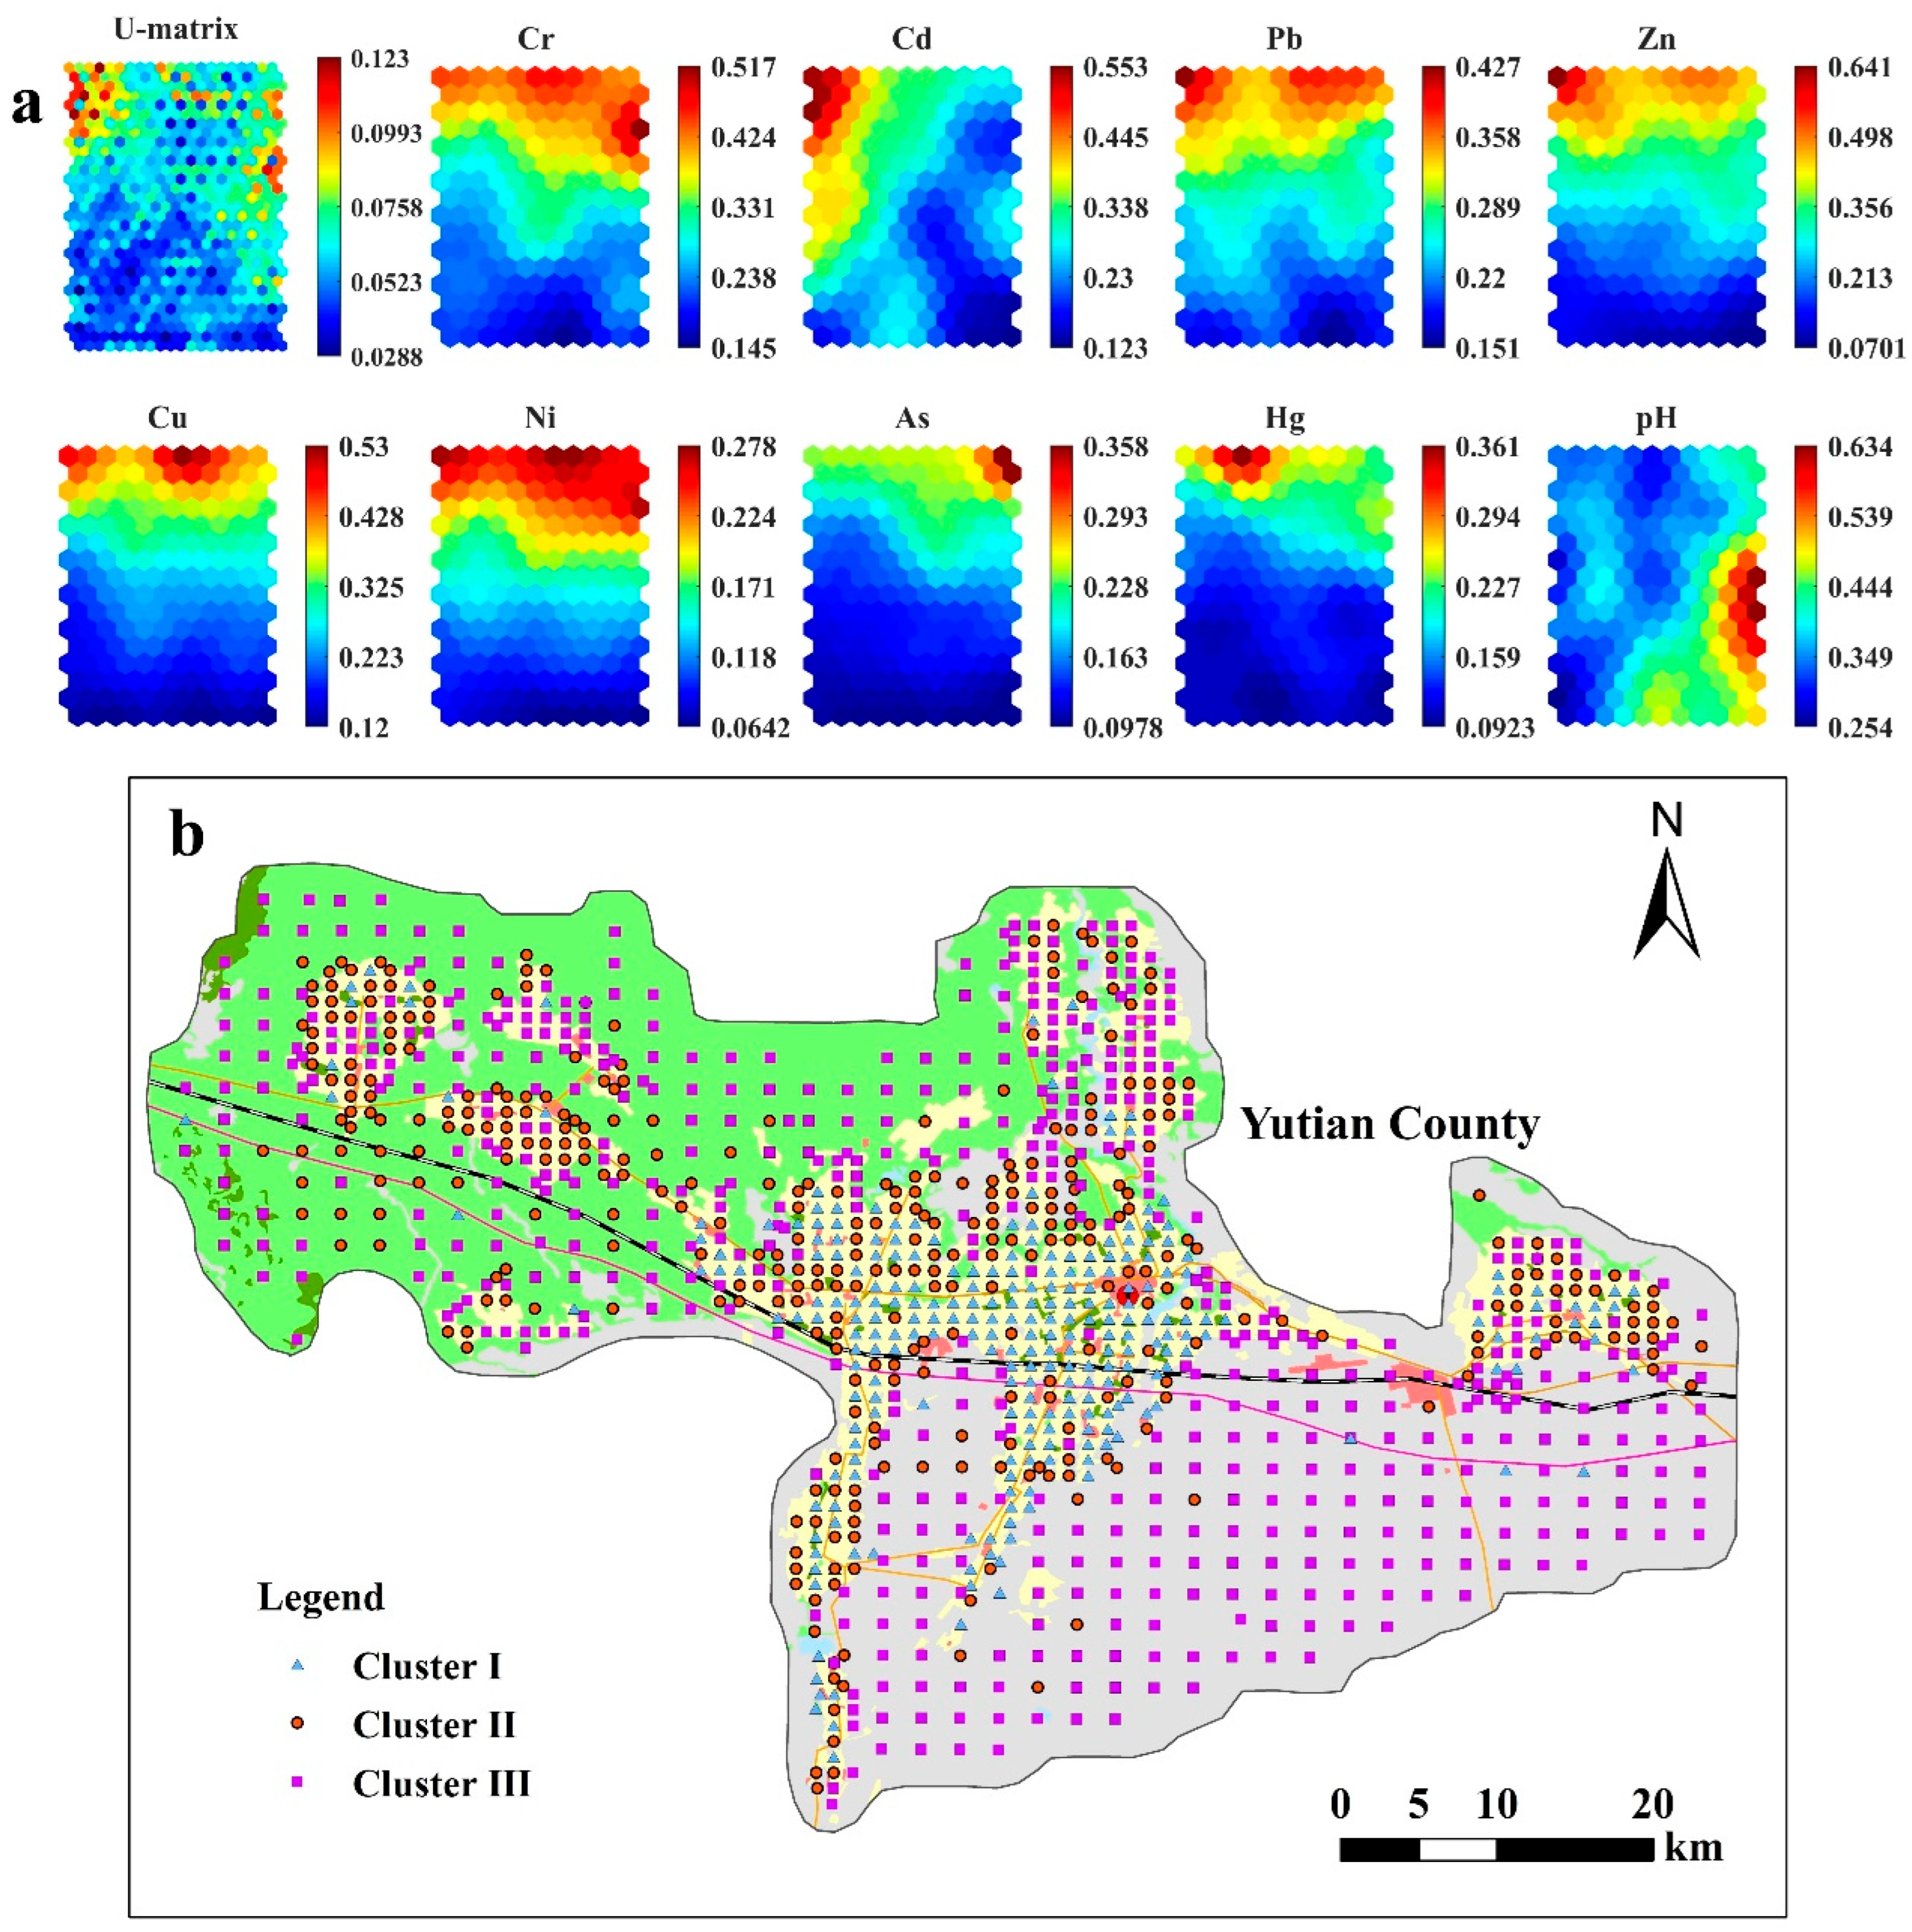
Figure 3 shows the results of the SOM analysis of the eight heavy metals and pH in the topsoil. Through the color gradient comparison SOM diagram, intuitively reflected the qualitative relationship between heavy metals. According to the K-means clustering algorithm and DBI, 1231 topsoil samples were classified into three clusters (Figure S3). As shown in Figure 3, Pb and Zn exhibited similar distribution patterns. The location with higher Cu content coincided with the location with higher Ni content, whereas the location with higher Cd content coincided with the location with higher Pb and Zn contents. This indicates that the factors affecting the content and distribution of these heavy metals may be related. However, the color gradients of Cr, As, and Hg varied, indicating that the factors affecting their distribution and sources were different from those of other heavy metals. Due to various human and natural factors affecting soil formation and heavy metal content, it is almost impossible to form completely isolated clusters in the distribution map [68]. In general, samples with higher heavy metal content were mainly distributed in Cluster 1, whereas samples with the highest pH value were mainly distributed in Clusters 2 and 3. Cluster 1 consisted of approximately 23.4% of the samples in the study area. Figure S1 shows that the distribution of samples in Cluster 1 is consistent with the distribution of irrigation and silting soil types in the study area, and these samples are mainly distributed in the cultivated land. The results indicate that the source and distribution of these heavy metals may be affected by agricultural activities. Clusters 2 and 3 contained 28.8% and 47.8% of the samples, respectively. The distribution characteristics of Cluster 2 were similar to those of Cluster 1, most of which were located in the cultivated land of the study area, and the samples of Cluster 3 were widely distributed in the entire study area.
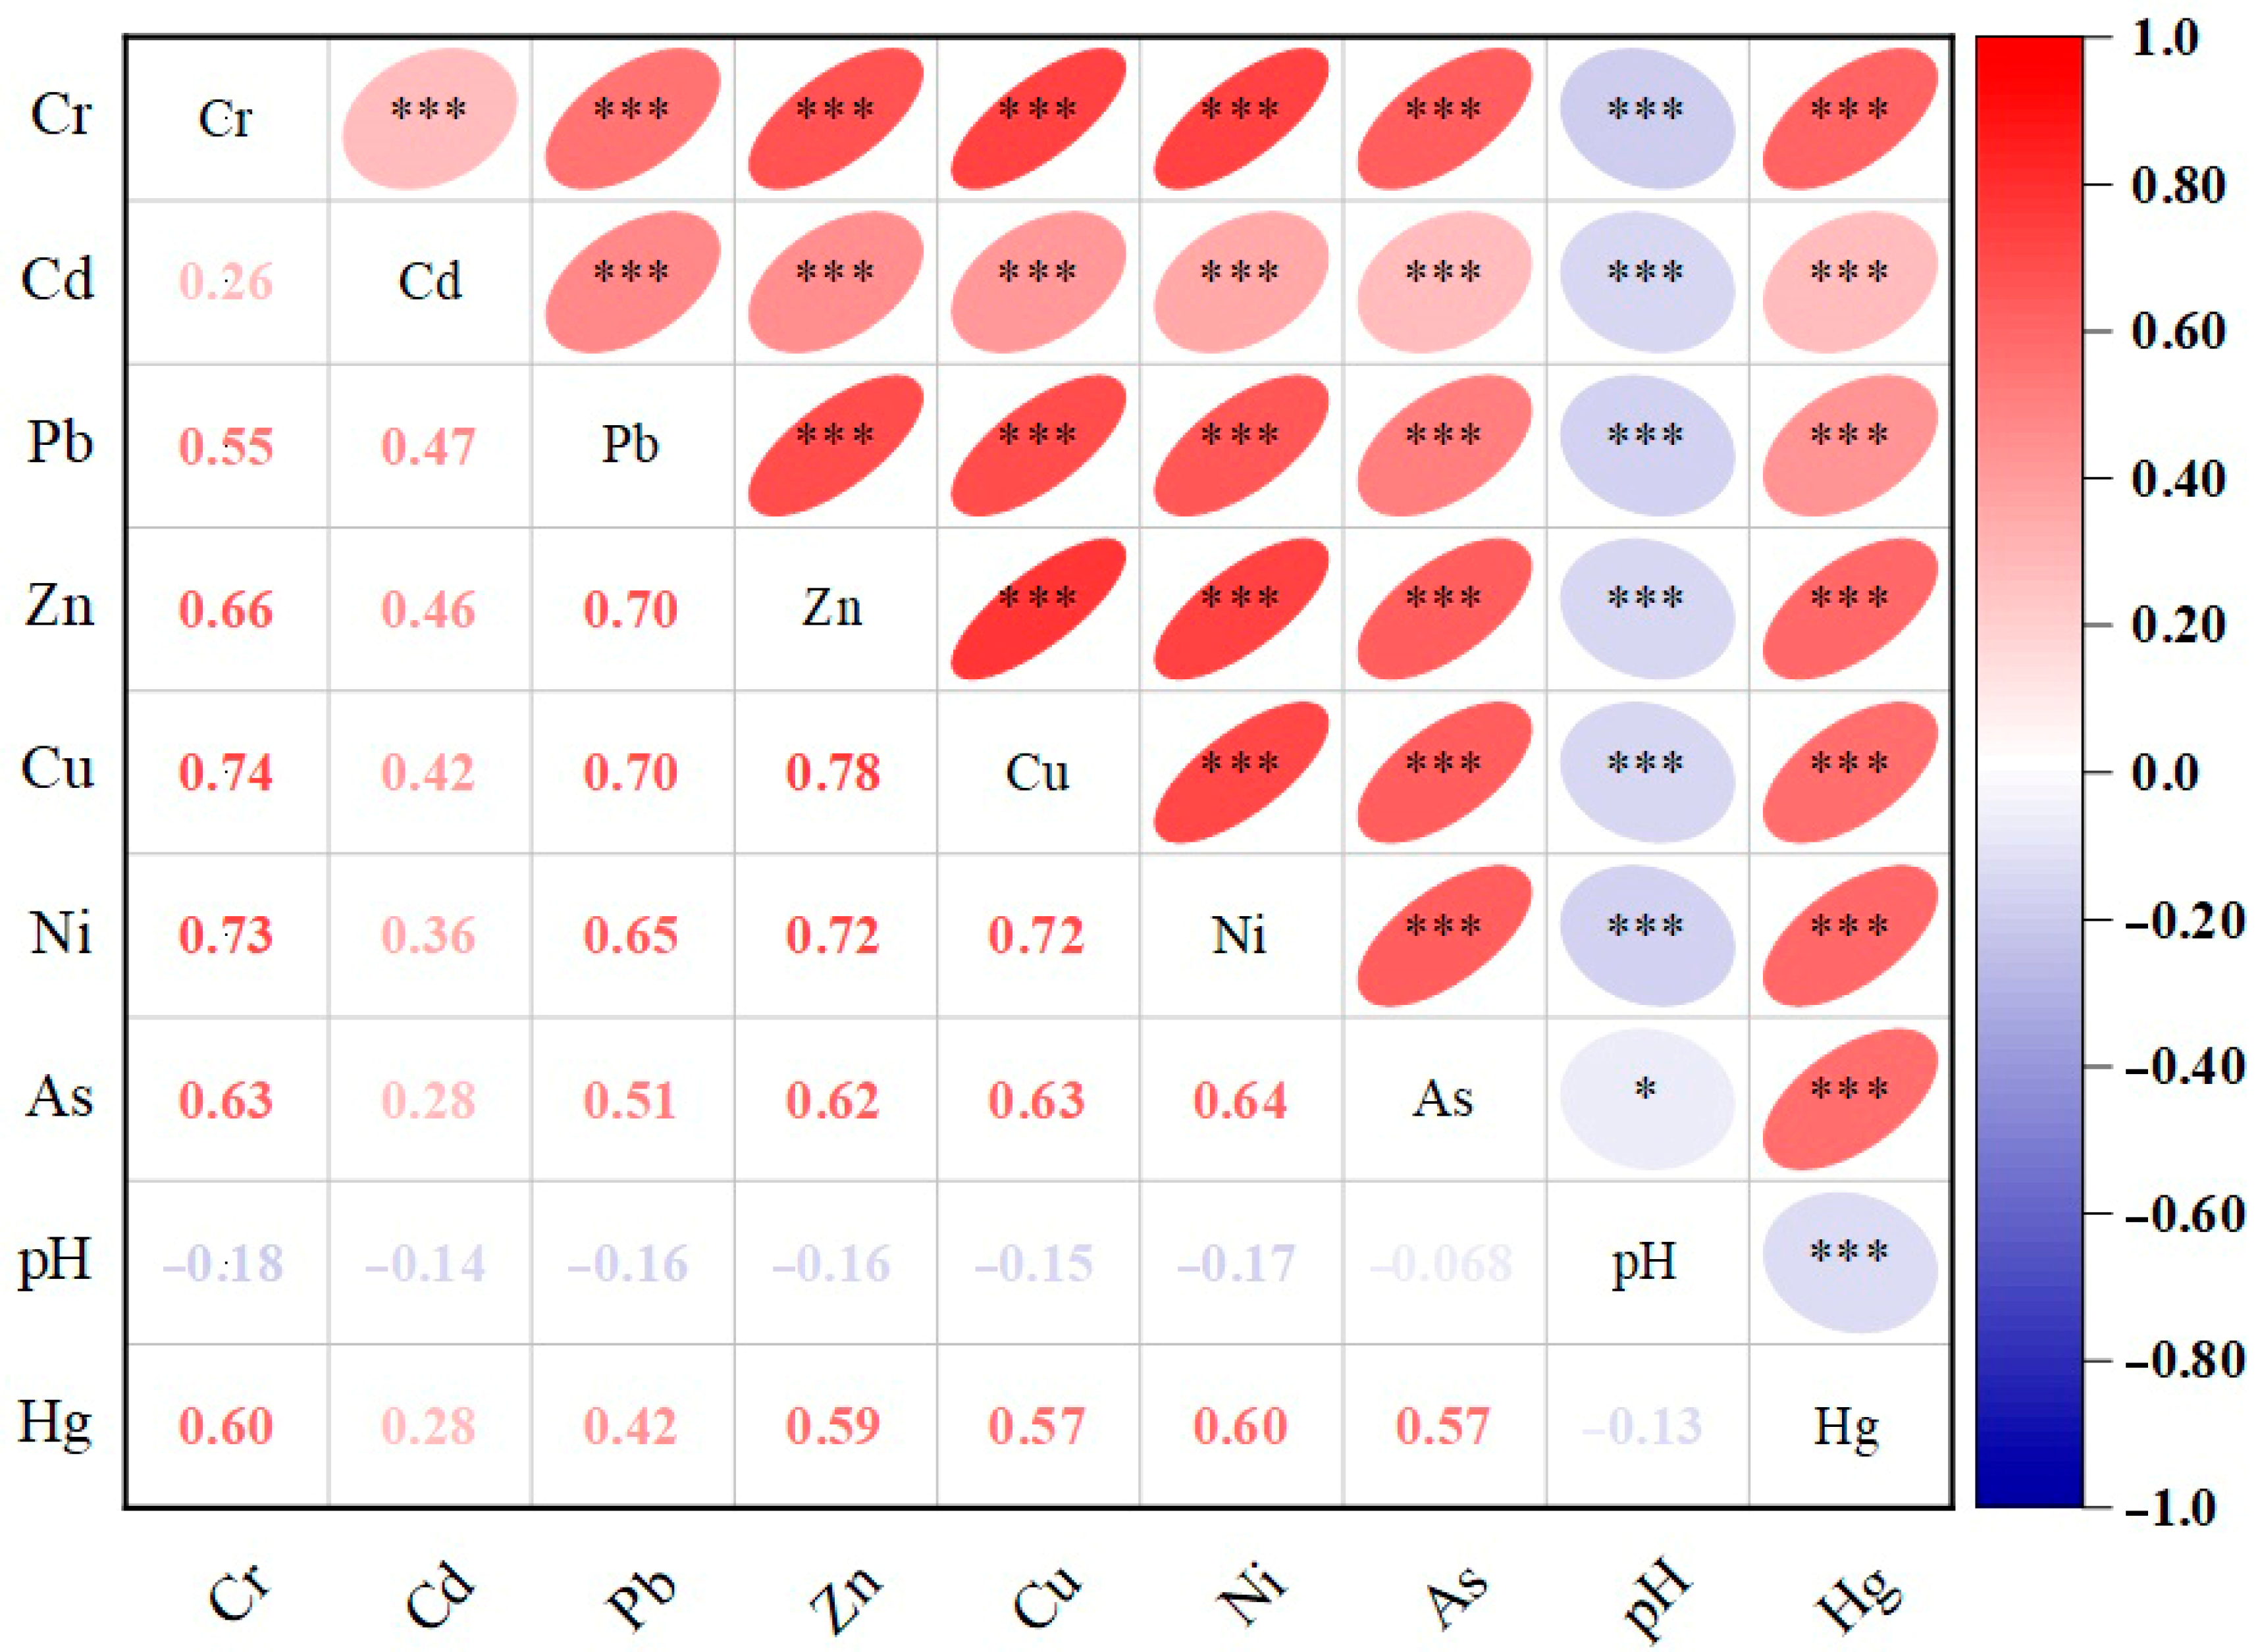
Figure 4 shows the results of the correlation analysis between the elements. A significant positive correlation was observed between Cu and Zn, Ni, Cr, and Pb (p ≤ 0.001, 0.70 ≤ r ≤ 0.78). It is indicated that these heavy metals have the same or similar sources. According to previous studies, Cr and Ni in soil were mainly affected by geological factors [69]. Therefore, soil Cr and Ni in the study area may be controlled by soil parent materials, and human influence was relatively small. A moderate positive correlation was observed between As and Cr, Cu, Zn, and Ni (p ≤ 0.001, 0.62 ≤ r ≤ 0.64), indicating that there may be a source of similarity between them. A significant positive correlation was observed between Hg and Ni, Cr, and Zn (p ≤ 0.001, 0.59 ≤ r ≤ 0.60). A high correlation coefficient indicates that the elements may have homology [45]. The solubility and mobility of heavy metals depend on soil pH and soil type [70]. In order to scientifically evaluate the sources of heavy metals in soil, it is necessary to monitor the key physical and chemical properties of soil. In this study, a weak negative correlation was observed between the pH and heavy metal elements. It shows that the heavy metal elements were more easily dissolved in the higher pH, and with the loss of rainfall, resulting in the lower content of soil. Cd was positively correlated with Pb and Zn (p ≤ 0.001, 0.46 ≤ r ≤ 0.47). The correlation between Cd and the other elements was weak. It indicates that the pollution sources are relatively independent and may be related to different industrial activities, anthropogenic inputs or natural geological background. This result further emphasized the multi-source characteristics of soil heavy metal pollution in the study area.

3.3. Source Apportionment of Soil Heavy Metal

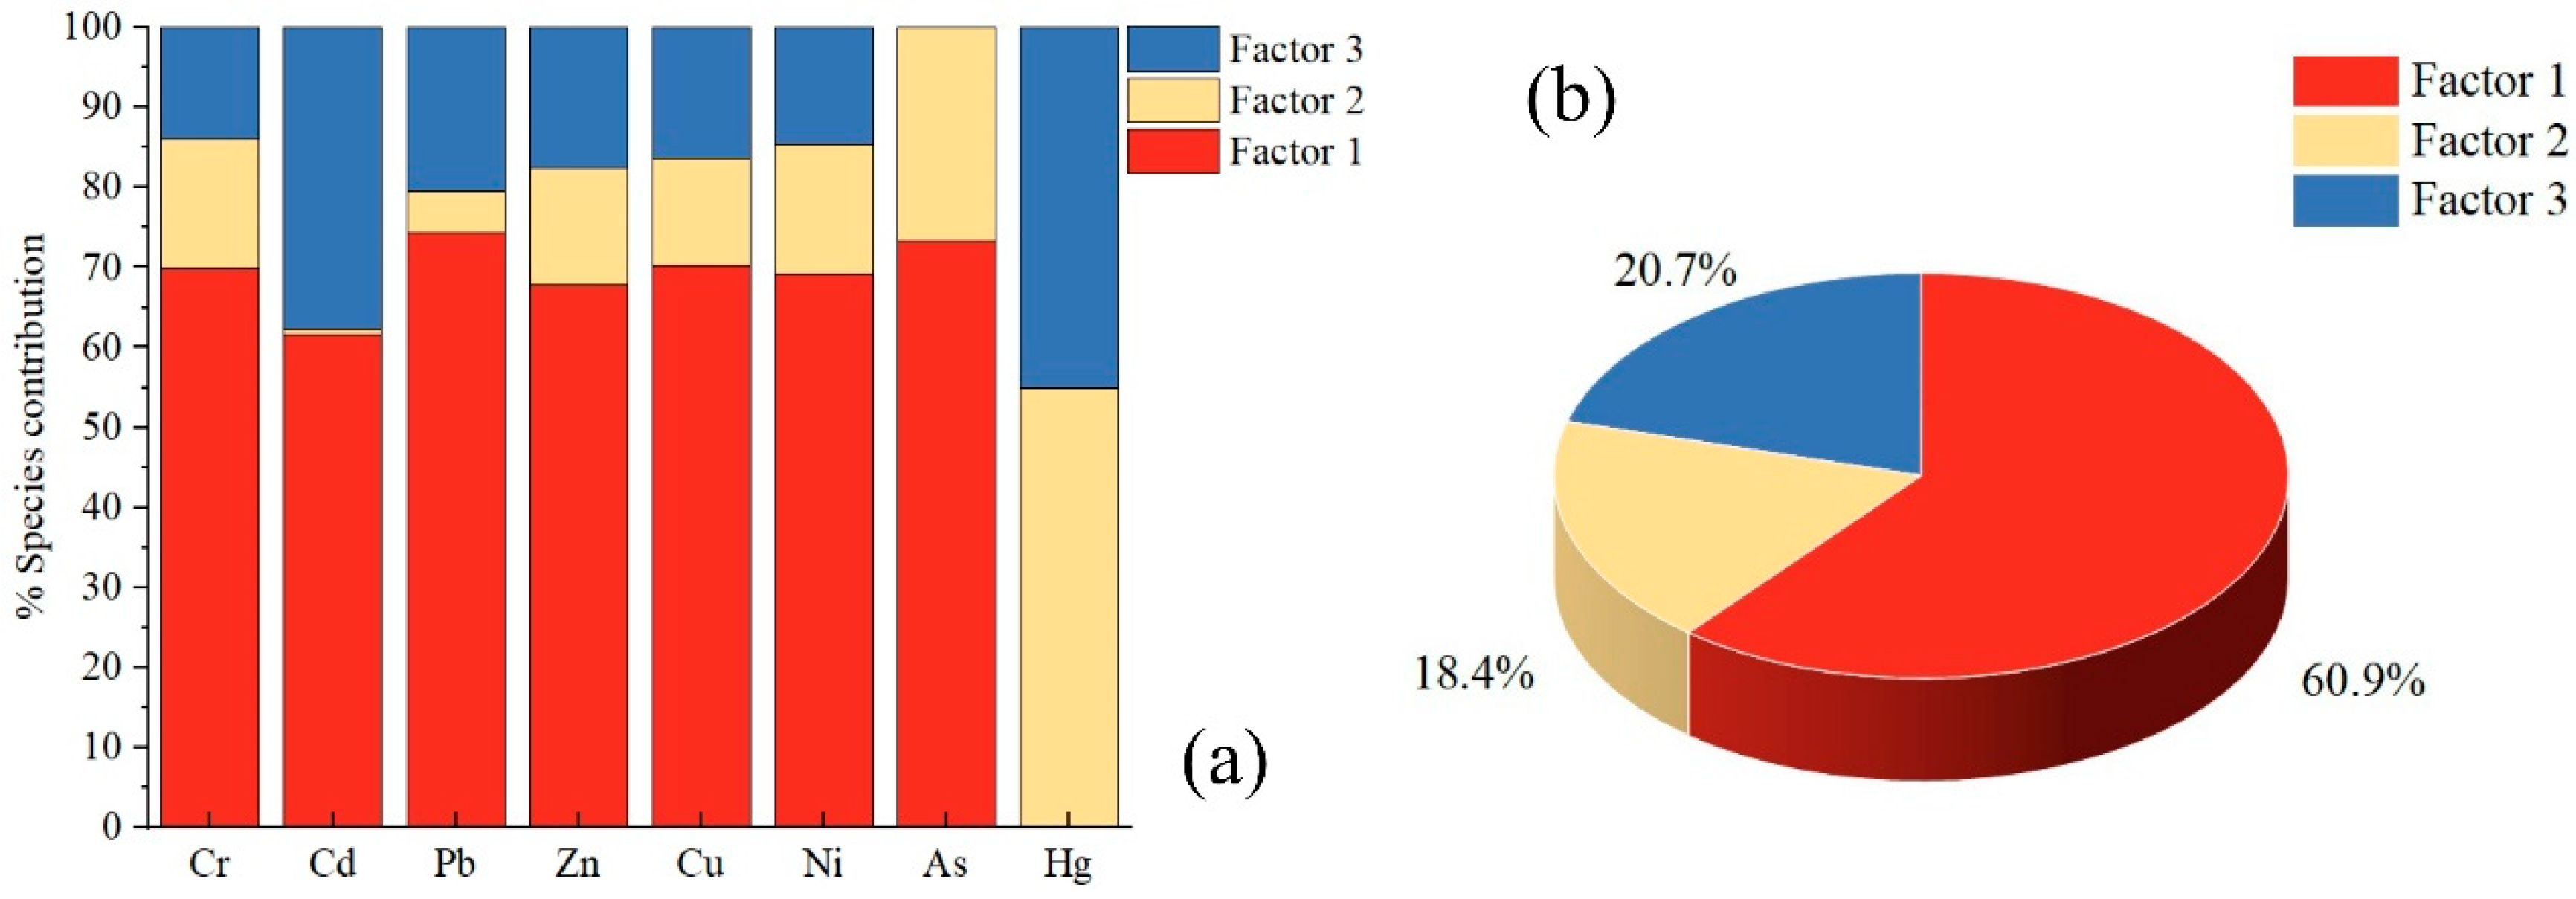
To further quantify the sources of heavy metals in the soil. A PMF model was used to analyze the sources of eight heavy metals in soil. Element concentration and uncertainty were imported into the USEPA PMF 5.0 software. The signal-to-noise ratio of the eight heavy metal elements was greater than eight, the number of operations was set to 20, and 3–6 factors were set to determine the optimal solution [71,72]. Three factors were determined based on the minimum and stable objective function q (Figure 5). By fitting the measured and predicted values of the model, the determination coefficient R2 of the element fitting was obtained, which ranged from 0.64 to 0.99, and the reliability of the model fitting effect was verified. The results of the PMF analysis are shown in Figure 5. Figure 6 shows the spatial distribution of the normalized source contributions of soil heavy metals based on the PMF model, as shown for source apportionment.
Factor 1 accounted for 60.9% of the total factors. Except for Hg, the other heavy metals were dominant. Among them, Pb (74.3%), As (73.4%), and Cu (70.2%) contributed the most, followed by Cr (69.9%), Ni (69.3%), Zn (67.9%), and Cd (61.6%). Studies have shown that traffic exhaust emissions are a major source of Pb in soil [73,74]. Zn and Cu are additive materials used in automotive brakes, engines, tires, and other components. Cd, Zn, and Cu are released into the environment as a result of the combustion of lubricating oil, tire wear, and brake friction [75]. As an important logistics node city on the Silk Road Economic Belt in Xinjiang, the study area has excellent transportation facilities, such as national highways, expressways, and railways. In addition, the national highway passes through the Yutian County seat of the study area, and the wear of tires and exhaust emissions from motor vehicles produce Pb, Cd, Zn, and Cu particles. These heavy metal particles are deposited into the soil through wet and dry deposition. The spatial distribution showed that (Figure 2) the high Pb, Cu, and Zn content areas were mainly scattered near the national highway.
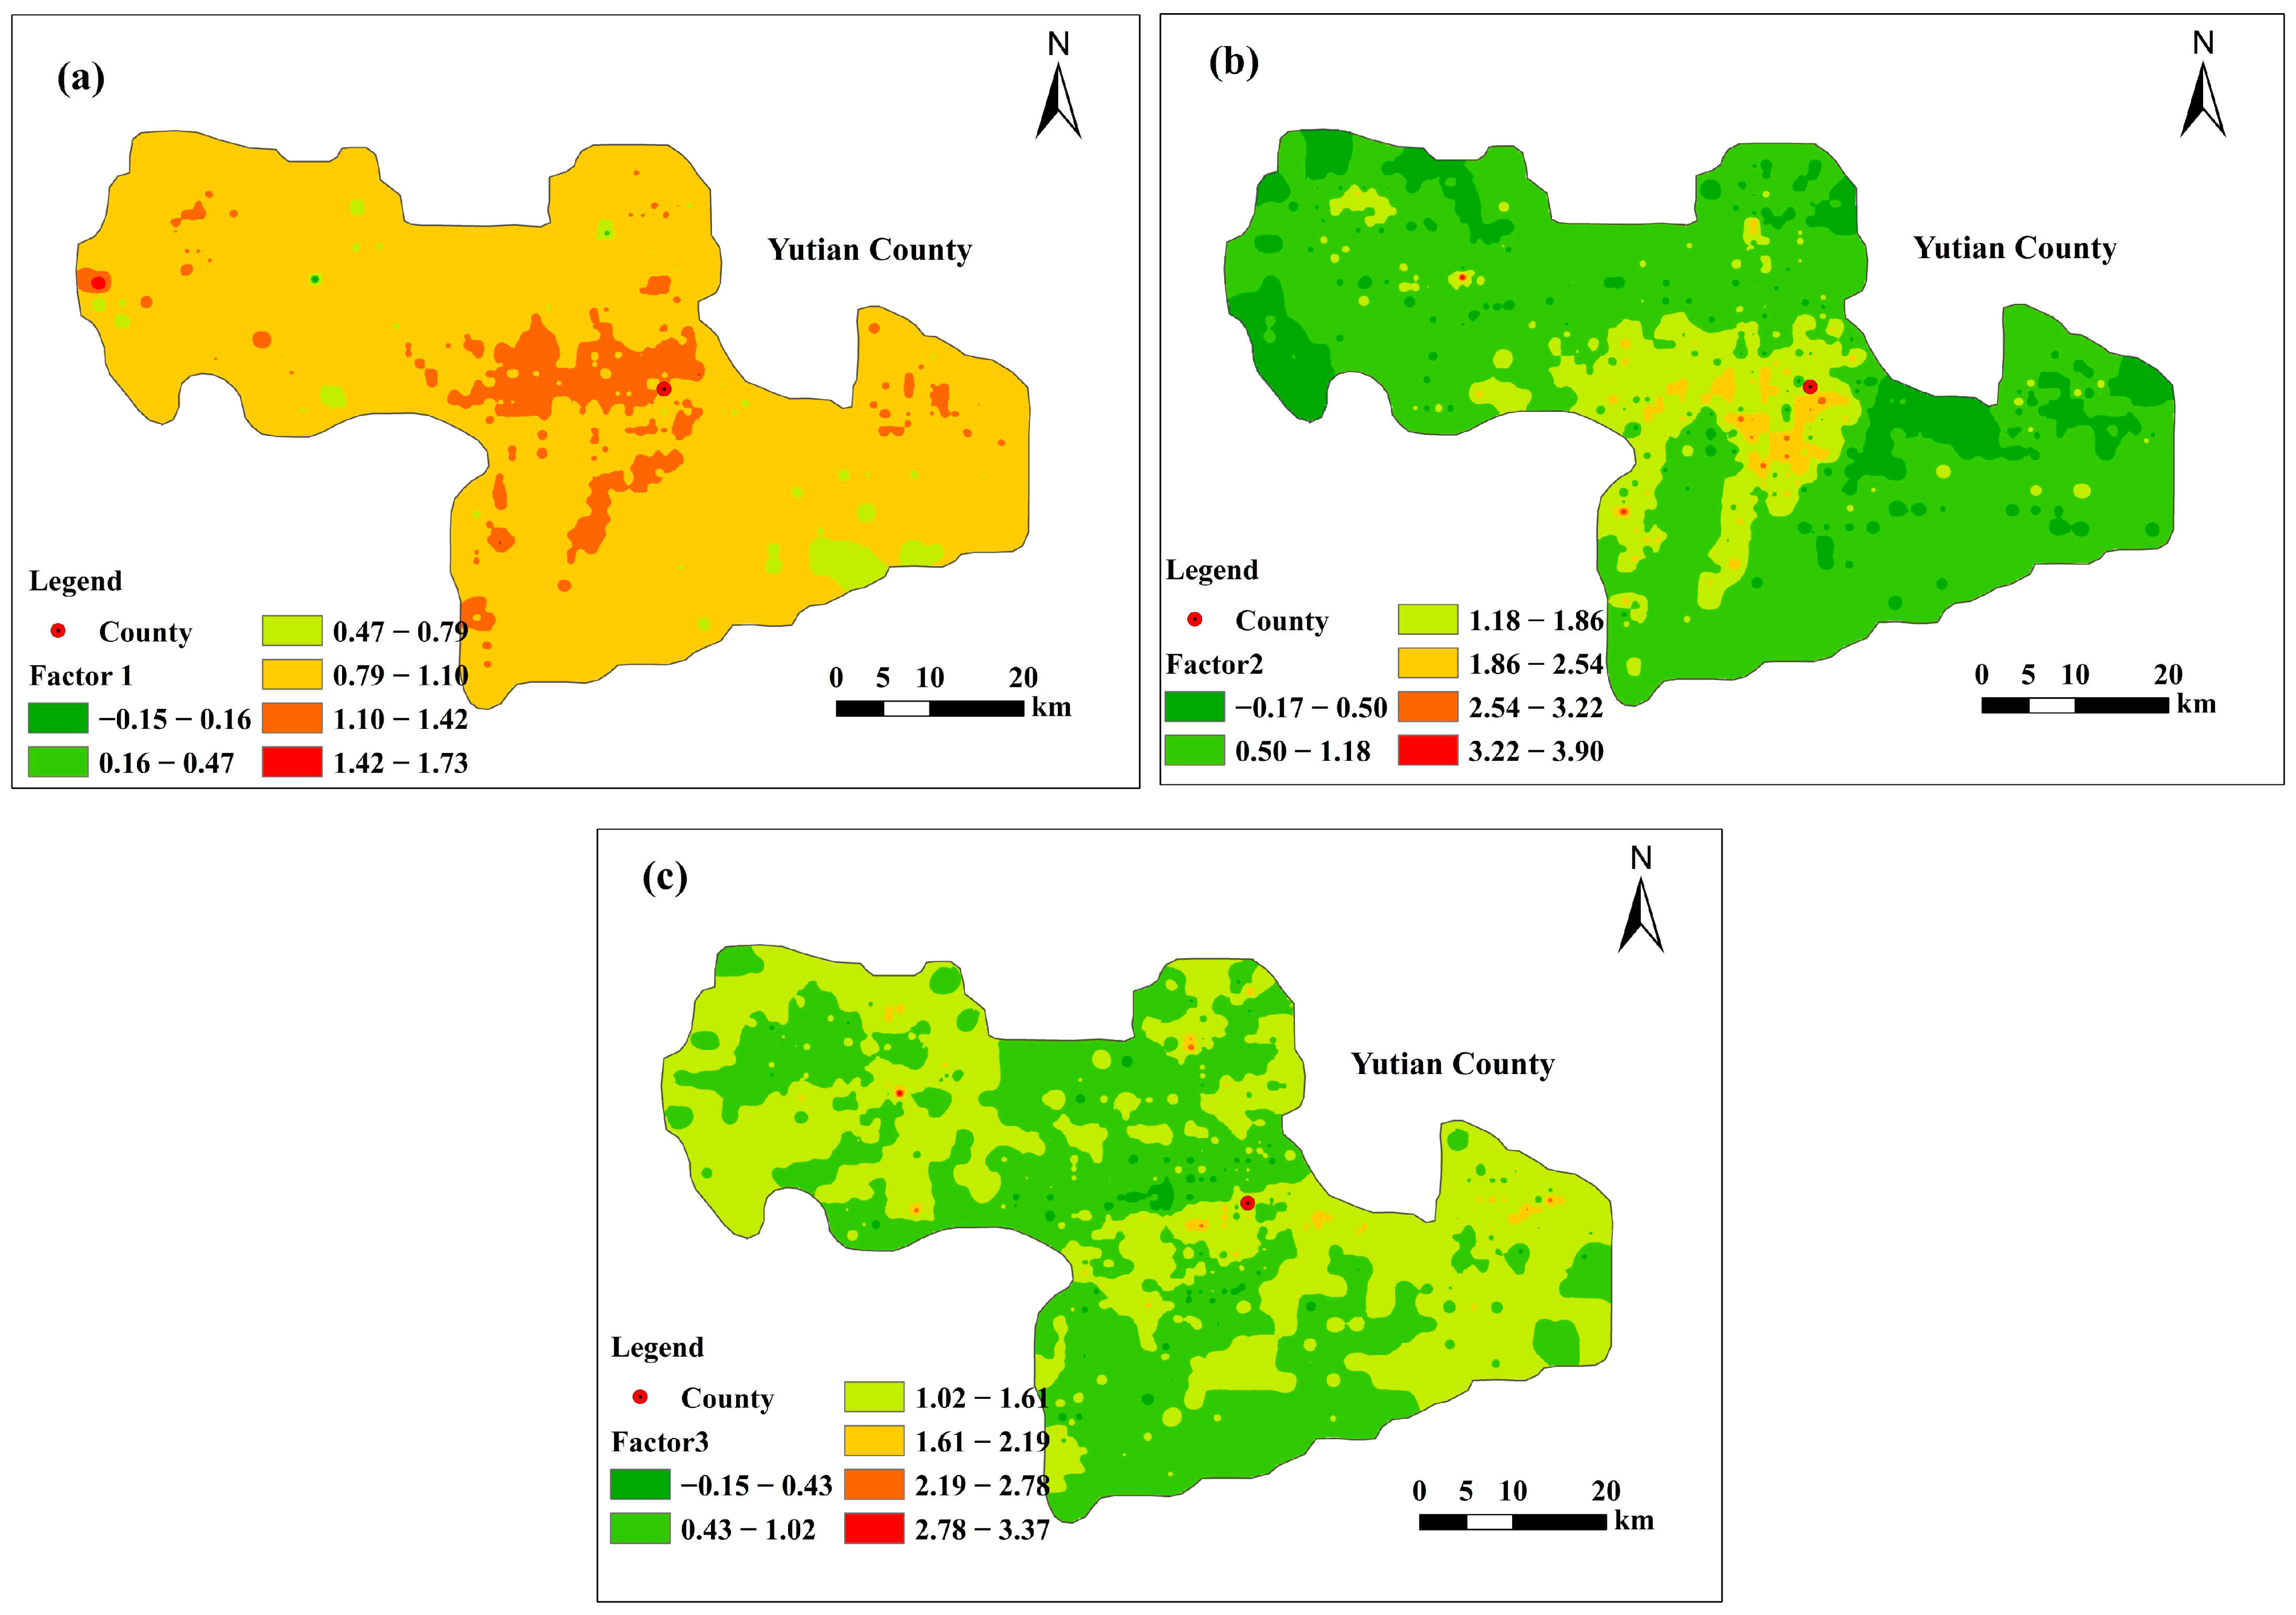
The average As content was lower than the background value of soil in Xinjiang. It is widely distributed in the Earth’s crust and may be related to natural sources [76]. The spatial variability of Cr and Ni in the soil was minimal, indicating that they maintained their original natural state. Studies have shown that the presence of Cr and Ni in soils is influenced by natural factors and soil parent material [77,78]. However, 38.5% and 20% of the soil samples contained Cr and As above their background values in this study, respectively, indicating that Cr and As have other exogenous sources [79]. Simultaneously, the spatial variability of As was consistent with the characteristics of moderate variability, indicating that As is influenced to a certain degree by non-geological factors. Yutian County has large-scale livestock and poultry breeding areas and characteristic agricultural planting areas. Studies have shown that As, Cr, and other elements can be influenced to a certain extent by human and livestock feces, pesticides, and fertilizers, and spread into the environment through leaching [80]. Figure 2 and Figure 6a show that the spatial distributions of As, Cr, and Ni concentrations were similar to that of the Factor 1 normalized contribution. Therefore, Factor 1 represents the combined effects of mixed and natural sources caused by various anthropogenic factors, such as traffic emissions and agricultural activities (mixed sources).
Factor 2 accounted for 18.4% of the total contribution and was characterized by Hg (55%). A significant negative correlation was observed between Hg and soil pH in the study area, and the variation was moderate. Due to its high volatility, Hg is usually used as an atmospheric indicator of the effects of volatile diffusion of industrial gases such as coal combustion, as well as atmospheric dry and wet deposition [81,82]. The spatial distribution of Hg shows that it is higher in the central part of the study area than in the surrounding areas, and the local high-value areas are scattered in the built-up land in the northwest of the study area (Figure 2). Hg is emitted during winter owing to heating and coal combustion in industrial production in the study area. In addition, Hg may be influenced by dust emissions and deposition after mining [83]. It is a volatile element that migrates over long-distances, leading to heterogeneity in its spatial distribution in soil. The contribution of As in Factor 2 was 26.6%. Coal contains As, and coal burning and mining activities contribute to the accumulation of heavy metals, such as As. Figure 2 and Figure 6b show that the spatial distribution of Hg content is similar to that of the Factor 2 normalized contribution. Therefore, Factor 2 is considered to be the atmospheric dust fall source of coal combustion.
Factor 3 accounted for 20.7% of the total contribution and was characterized by Hg (45%) and Cd (37.8%). The spatial distribution characteristics of Hg in the study area showed that the enrichment area of Hg was mainly in agricultural land. Studies have shown that Hg is derived from agricultural activities, such as the overuse of pesticides and fertilizers [84]. Cd is found in phosphate fertilizers and is often used as a marker element in agricultural production [85,86,87]. Figure 2 and Figure 6c shows that the spatial distribution of Cd content is similar to that of the Factor 3 normalized contribution. Therefore, Factor 3 may be related to agricultural activities. The presence of an element in multiple factorial loadings indicates multiple sources [88]. Hg was present in Factors 2 and 3, indicating that it is influenced by atmospheric deposition and agricultural activities. Cd was present in Factors 1 and 3, indicating that it is influenced by agricultural activities in addition to traffic emissions.
The SOM and PMF results in Figure 3b and Figure 6 show that the heavy metal pollution sources in the normalized source contribution map of Factors 1 and 3 showed similar distribution patterns of heavy metals in Clusters 1 and 2 obtained in the above SOM analysis, respectively. The results show that the combination of the SOM and PMF models yields high precision for the source apportionment of heavy metals in soil [32]. The results of SOM classification can provide a reference for the regional distribution of heavy metal pollution in soil and the preliminary determination of potential sources.
Receptor models are effective tools for assigning heavy metal sources based on the spatial distribution of heavy metals in soils, especially for the inability to obtain detailed information about the sources of emissions [35]. However, source factors obtained from receptor models are interpreted based on previous studies and experience [50]. In order to further explain the source factors in the receptor model, the SOM model is used to study the spatial correlation between pollution factors, which can assist the source resolution of each factor in the receptor model. There are many successful cases of using SOM combined with PMF model to identify the sources of heavy metals in soils of different regions. Wang et al. (2022) [39] used SOM and PMF methods for source apportionment in the Tibetan Plateau, and the results showed that Cu was mainly derived from industrial activities, Cd from agricultural activities, Cr from parent material, and Pb and Zn from traffic emissions. Li et al. (2022) [32] study in the zinc smelting area of northwestern Guizhou province found that Cd and Zn are associated with zinc smelting activities, Cu from agricultural activities, Pb from traffic emissions and smelting, Hg and As from industrial activities and coal combustion, and Cr and Ni are derived from parent materials. There are discrepancies between these studies and our source apportionment results, which are due to differences in local environmental and historical characteristics, such that pollution sources of specific elements may differ between different geographical locations [16].

3.4. Health Risk Evaluation of Pollution Sources Based on Monte Carlo Simulation

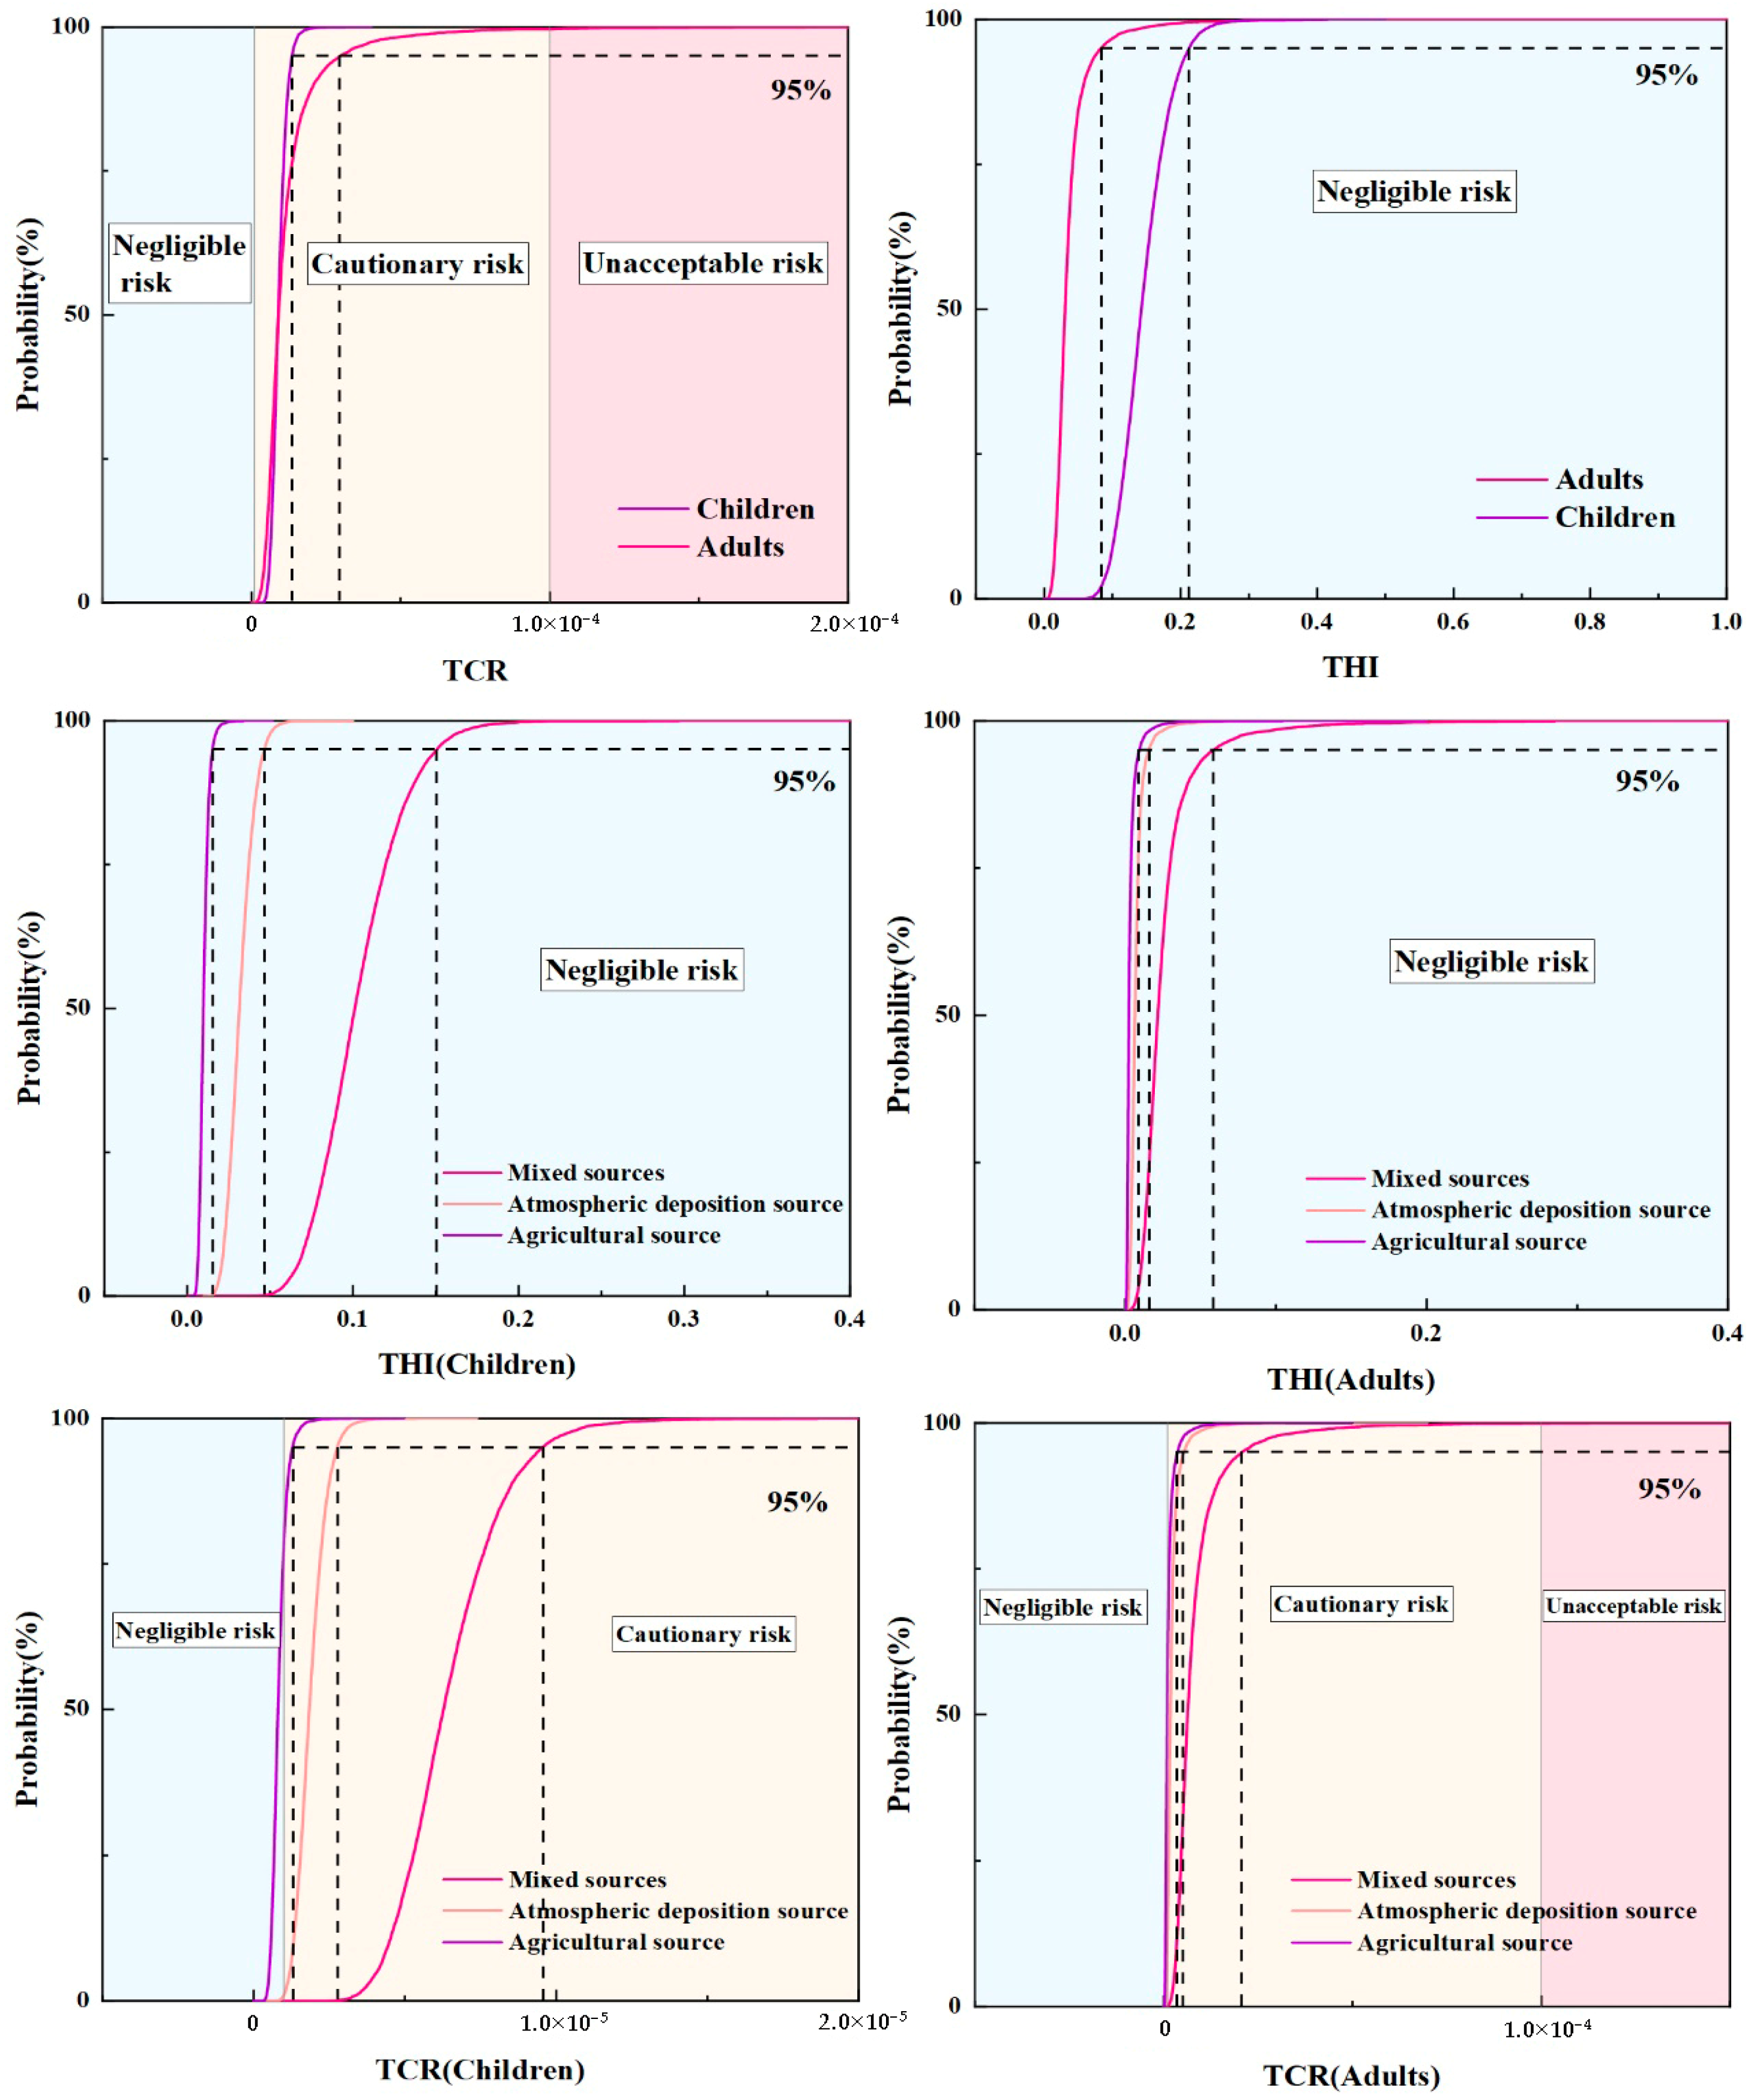
After 10,000 iterations of the Monte Carlo model, the health risk probability distributions of heavy metals from different sources to adults and children were obtained (Figure 7). Huang et al. [78] showed that when the 95% quantile value of non-carcinogenic risk is below the acceptable risk threshold (THI = 1), the non-carcinogenic risk caused by soil heavy metals is considered to be below the acceptable level. Therefore, the non-carcinogenic risk to adults and children in the study area was negligible. Although the 95% quantile values of cancer risk in adults and children did not exceed the risk threshold (1.0 × 10⁻⁴), they posed a certain degree of threat to human health. The carcinogenic risk of heavy metals in soil for adults was higher than that for children.
The results of the source-oriented health risk assessment showed that the THI values of the three pollution sources for adults and children were all within the negligible risk range for non-carcinogenic risks. The results indicated that heavy metals in soils from different pollution sources posed no non-carcinogenic risk to human health. The 95% quantile values of TCR for adults and children for all three sources did not exceed the threshold (1.0 × 10⁻⁴), but were within the alert carcinogenic risk range for carcinogenic risk (1.0 × 10⁻⁶ < TCR < 1.0 × 10⁻⁴). Several hidden health risks were identified. It is necessary to focus on the sources and pollution levels of these three heavy metals. Targeted control should be implemented to reduce health risks to the population in production activities. The 95% quantile values of non-carcinogenic and carcinogenic risks of the three pollution sources for adults and children showed the same trend, which was mixed source > atmospheric dust source > agricultural source. Among them, the 95% quantile value of cancer risk in adults was greater than that in children, indicating that the cancer risk of mixed sources in adults was higher. This may be due to the longer duration of receptor exposure and higher daily air intake in adults than in children. This is contrary to the conclusion of previous health risk assessment studies of common heavy metals that the health risk of children is higher than that of adults. Xue et al. [89] have similar conclusions. Cr in mixed sources poses a potential carcinogenic risk to children and adults (Figure S4). In general, different pollution sources do not pose non-carcinogenic health risks to adults and children, but Cr poses an alert carcinogenic risk to adults and children. Therefore, Cr is the priority control pollution element for human health risk, whereas mixed source is the priority control pollution source. Continuous monitoring and control of Cr should be strengthened to ensure the health and safety of adults and children.

4. Conclusions

A self-organizing neural network and PMF models were used to quantitatively analyze the sources and contribution rates of heavy metal pollution in soils at the southern margin of the Tarim Basin. The human health risk of heavy metals in soil was quantified according to the pollution sources. Except for Cd and Hg, the average values of the other elements in the soil of the study area did not exceed the background values of soil in Xinjiang. The average contents of Cr, Cd, Pb, Zn, Cu, Ni, As, and Hg in soils were lower than the screening values of soil environmental standards. The spatial distribution of heavy metal content was different, with high contents found in areas with intensive human activities. The spatial heterogeneity of Hg content was strong, indicating that it is influenced by human activities. Based on the correlation analysis as well as SOM and PMF models, the following main sources of heavy metal pollution were identified in the study area: natural–traffic–agricultural mixed (60.9%), atmospheric dust fall (18.4%), and agricultural sources (20.7%). Soil As, Cr, Pb, Zn, Cu, and Ni were mainly influenced by natural–traffic–agricultural mixed sources. Hg was influenced by atmospheric dust fall and agricultural sources. Cd was mainly influenced by natural–traffic–agricultural mixed sources and agricultural sources. The classification results of the SOM model are consistent with the source analysis results of the PMF model. The health risk analysis based on source apportionment showed that Cr from natural–traffic–agricultural mixed sources was the main carcinogenic risk factor. The source of heavy metals, the degree of pollution, and the toxicity of elements should be considered comprehensively when controlling the source of heavy metals in the soil of the study area. Therefore, it is necessary to strengthen the monitoring and source management of soil Cr to reduce the exposure risk and ensure the protection of human health and ecological environment safety.

Supplementary Materials

The following supporting information can be downloaded at: https://www.mdpi.com/article/10.3390/agronomy15122721/s1, Figure S1: Map of soil types in the study area; Figure S2: Map of soil parent material in the study area; Figure S3: The pattern classification map for 3 clusters based on SOM; Figure S4: Carcinogenic risk of heavy metals from mixed sources in adults and children. Table S1: Soil heavy metal exposure parameters and values based on Monte Carlo simulation; Table S2: RfD and SF values of soil heavy metals under different exposure routes.

Author Contributions

W.F.: Conceptualization, Roles/Writing—original draft, and Methodology. J.Z. (Jinlong Zhou): Data curation, Supervision, Funding, and Validation. J.Z. (Jianghua Zheng): Supervision, and Writing—Review & editing. S.W.: Investigation and resources. J.D.: Investigation and resources. L.H.: Visualization and software. R.S.: Investigation and resources. L.Z.: Visualization and software. All authors have read and agreed to the published version of the manuscript.

Funding

This research was financially supported by the Natural Science Foundation of Xinjiang Autonomous Region (2021D01C110) and the Central Repatriation Fund Project of China Geological Survey ‘1:250,000 Land Quality Geochemical Survey in Hetian-Ruoqiang Oasis Belt of Xinjiang (S15-1-LQ)’.

Data Availability Statement

The data presented in this study are available on request from the corresponding author due to the policies and confidentiality agreements adhered to in the laboratory.

Conflicts of Interest

The authors declare that they have no known competing financial interests or personal relationships that could have appeared to influence the work reported in this paper.

References

  1. Qin, G.; Niu, Z.; Yu, J.; Li, Z.; Ma, J.; Xiang, P. Soil heavy metal pollution and food safety in China: Effects, sources and removing technology. Chemosphere 2021, 267, 129205. [Google Scholar] [CrossRef] [PubMed]
  2. Lv, J.S. Multivariate receptor models and robust geostatistics to estimate source apportionment of heavy metals in soils. Environ. Pollut. 2019, 244, 72–83. [Google Scholar] [CrossRef]
  3. Taghavi, M.; Darvishiyan, M.; Momeni, M.; Eslami, H.; Fallahzadeh, R.A.; Zarei, A. Ecological risk assessment of trace elements (TEs) pollution and human health risk exposure in agricultural soils used for saffron cultivation. Sci. Rep. 2023, 13, 4556. [Google Scholar] [CrossRef]
  4. Yang, S.; Feng, W.; Wang, S.; Chen, L.; Zheng, X.; Li, X.; Zhou, D. Farmland heavy metals can migrate to deep soil at a regional scale: A case study on a wastewater-irrigated area in China. Environ. Pollut. 2021, 281, 116977. [Google Scholar] [CrossRef] [PubMed]
  5. Wu, Q.M.; Hu, W.Y.; Wang, H.F.; Liu, P.; Wang, X.K.; Huang, B. Spatial distribution, ecological risk and sources of heavy metals in soils from a typical economic development area, Southeastern China. Sci. Total Environ. 2021, 780, 146557. [Google Scholar] [CrossRef]
  6. Xu, X.B.; Hu, X.Y.; Wang, T.; Sun, M.X.; Wang, L.; Zhang, L.X. Non-inverted U-shaped challenges to regional sustainability: The health risk of soil heavy metals in coastal China. J. Clean. Prod. 2021, 279, 123746. [Google Scholar] [CrossRef]
  7. Yang, Q.Q.; Li, Z.Y.; Lu, X.N.; Duan, Q.N.; Huang, L.; Jun, B.J. A review of soil heavy metal pollution from industrial and agricultural regions in China: Pollution and risk assessment. Sci. Total Environ. 2018, 642, 690–700. [Google Scholar] [CrossRef]
  8. Zheng, J.T.; Wang, P.; Shi, H.Y.; Zhuang, C.W.; Deng, Y.R.; Yang, X.J.; Xiao, R.B. Quantitative source apportionment and driver identification of soil heavy metals using advanced machine learning techniques. Sci. Total Environ. 2023, 873, 162371. [Google Scholar] [CrossRef]
  9. Cheng, W.; Lei, S.; Bian, Z.; Zhao, Y.; Li, Y.; Gan, Y. Geographic distribution of heavy metals and identification of their sources in soils near large, open-pit coal mines using Positive Matrix Factorization. J. Hazard. Mater. 2020, 387, 121666. [Google Scholar] [CrossRef]
  10. Fu, X.Y.; Chen, X.; Xie, F.Z.; Zhang, Z.H.; Ma, T.Q.; Dong, X.; Zheng, L.G. Combining APCS-MLR model to evaluate the distribution and sources of rare earth elements in a large catchment. Environ. Pollut. 2024, 363, 125256. [Google Scholar] [CrossRef]
  11. Wang, S.Y.; Zhang, Y.B.; Cheng, J.L.; Li, Y.; Li, F.; Li, Y.; Shi, Z. Pollution assessment and source apportionment of soil heavy metals in a coastal industrial city, Zhejiang, Southeastern China. Int. J. Environ. Res. Public Health 2022, 19, 3335. [Google Scholar] [CrossRef]
  12. Wiseman, C.L.; Zereini, F.; Püttmann, W. Metal and metalloid accumulation in cultivated urban soils: A medium-term study of trends in Toronto, Canada. Sci. Total Environ. 2015, 538, 564–572. [Google Scholar] [CrossRef]
  13. Shi, T.R.; Zhang, J.R.; Shen, W.J.; Wang, J.; Li, X.Y. Machine learning can identify the sources of heavy metals in agricultural soil: A case study in northern Guangdong Province, China. Ecotoxicol. Environ. Saf. 2022, 246, 114192. [Google Scholar] [CrossRef]
  14. Wang, Y.T.; Guo, G.H.; Zhang, D.G.; Lei, M. An integrated method for source apportionment of heavy metal(loid)s in agricultural soils and model uncertainty analysis. Environ. Pollut. 2021, 276, 116666. [Google Scholar] [CrossRef] [PubMed]
  15. Licen, S.; Astel, A.; Tsakovski, S. Self-organizing map algorithm for assessing spatial and temporal patterns of pollutants in environmental compartments: A review. Sci. Total Environ. 2023, 878, 163084. [Google Scholar] [CrossRef] [PubMed]
  16. Gao, L.; Zhang, W.; Liu, Q.; Lin, X.; Huang, Y.; Zhang, X. Machine learning based on the graph convolutional self-organizing map method increases the accuracy of pollution source identification: A case study of trace metal (loid)s in soils of Jiangmen City, south China. Ecotoxicol. Environ. Saf. 2023, 250, 114467. [Google Scholar] [CrossRef]
  17. Yao, C.; Shen, Z.J.; Wang, Y.M.; Mei, N.; Li, C.X.; Liu, Y.J.; Ma, W.B.; Zhang, C.; Wang, D.Y. Tracing and quantifying the source of heavy metals in agricultural soils in a coal gangue stacking area: Insights from isotope fingerprints and receptor models. Sci. Total Environ. 2023, 863, 160882. [Google Scholar] [CrossRef]
  18. Xiang, M.T.; Li, Y.; Yang, J.Y.; Lei, K.G.; Li, Y.; Li, F.; Zheng, D.F.; Fang, X.Q.; Cao, Y. Heavy metal contamination risk assessment and correlation analysis of heavy metal contents in soil and crops. Environ. Pollut. 2021, 278, 116911. [Google Scholar] [CrossRef] [PubMed]
  19. Zhong, X.; Chen, Z.W.; Li, Y.Y.; Ding, K.B.; Liu, W.S.; Liu, Y.; Yuan, Y.Q.; Zhang, M.Y.; Baker, A.J.M.; Yang, W.J.; et al. Factors influencing heavy metal availability and risk assessment of soils at typical metal mines in Eastern China. J. Hazard. Mater. 2020, 400, 123289. [Google Scholar] [CrossRef]
  20. Varol, M.; Gündüz, K.; Sünbül, M.R. Pollution status, potential sources and health risk assessment of arsenic and trace metals in agricultural soils: A case study in Malatya province, Turkey. Environ. Res. 2021, 202, 111806. [Google Scholar] [CrossRef]
  21. Shi, X.M.; Liu, S.; Song, L.; Wu, C.S.; Yang, B.; Lu, H.Z.; Wang, X.; Zakari, S. Contamination and source-specific risk analysis of soil heavy metals in a typical coal industrial city, central China. Sci. Total Environ. 2022, 836, 155694. [Google Scholar] [CrossRef] [PubMed]
  22. Xu, X.L.; Liu, Y.F.; Liu, Q.; Gui, D.W.; Cui, B.C.; Chen, X.N.; Abd, S.K. Spatial distribution characteristics and risk assessment of heavy metals in soils of Southern Xinjiang oases. Env. Monit Assess 2025, 197, 395. [Google Scholar] [CrossRef]
  23. Li, Y.W.; Xue, J.P.; Cai, J.X.; Zhang, Y.C.; Li, F.X.; Zha, X.H.; Fang, G.D. The spatial distribution and influencing factors of heavy metals in soil in Xinjiang, China. Sustainability 2023, 15, 16379. [Google Scholar] [CrossRef]
  24. HJ/T 166-2004; The Technical Specification for Soil Environmental Monitoring. Ministry of Environmental Protection of the People’s Republic of China: Beijing, China, 2004.
  25. DZ/T 0258-2014; Specification of Multi-Purpose Regional Geochemical Survey (1:250,000). Ministry of Land and Resources of the People’s Republic of China: Beijing, China, 2014.
  26. Kohonen, T. Self-organized formation of topologically correct feature maps. Biol. Cybern. 1982, 43, 59–69. [Google Scholar] [CrossRef]
  27. Mao, H.R.; Wang, G.C.; Rao, Z.; Liao, F.; Shi, Z.M.; Huang, X.J.; Chen, X.L.; Yang, Y. Deciphering spatial pattern of groundwater chemistry and nitrogen pollution in Poyang Lake Basin (eastern China) using self-organizing map and multivariate statistics. J. Clean. Profuction 2021, 329, 129697. [Google Scholar] [CrossRef]
  28. Souid, F.; Telahigue, F.; Agoubi, B.; Kharroubi, A. Isotopic behavior and self-organizing maps for identifying groundwater salinization processes in Jerba Island, Tunisia. Environ. Earth Sci. 2020, 79, 1–10. [Google Scholar] [CrossRef]
  29. Hossain Bhuiyan, M.A.; Chandra Karmaker, S.; Bodrud-Doza, M.; Rakib, M.A.; Saha, B.B. Enrichment, sources and ecological risk mapping of heavy metals in agricultural soils of dhaka district employing SOM, PMF and GIS methods. Chemosphere 2021, 263, 128339. [Google Scholar] [CrossRef]
  30. Wang, Z.; Xiao, J.; Wang, L.; Liang, T.; Guo, Q.; Guan, Y.; Rinklebe, J. Elucidating the differentiation of soil heavy metals under different land uses with geographically weighted regression and self-organizing map. Environ. Pollut. 2020, 260, 114065. [Google Scholar] [CrossRef]
  31. Zou, H.; Ren, B.Z. Analyzing topsoil heavy metal pollution sources and ecological risks around antimony mine waste sites by a joint methodology. Ecol. Indicators. 2023, 154, 110761. [Google Scholar] [CrossRef]
  32. Li, X.X.; Liu, H.Y.; Meng, W.; Liu, N.T.; Wu, P. Accumulation and source apportionment of heavy metal(loid)s in agricultural soils based on GIS, SOM and PMF: A case study in superposition areas of geochemical anomalies and zinc smelting, Southwest China. Process Saf. Environ. Prot. 2022, 159, 964–977. [Google Scholar] [CrossRef]
  33. Meng, Y.Y.; Kong, F.P.; Liu, X.J.; Dai, L.J.; Liu, H.B.; He, J.B.; Zhao, J.; Wang, L.Q. An integrated approach for quantifying trace metal sources in surface soils of a typical farmland in the three rivers plain, China. Environ. Pollut. 2023, 337, 122614. [Google Scholar] [CrossRef] [PubMed]
  34. Vesanto, J.; Alhoniemi, E. Clustering of the self-organizing map. IEEE Trans. Neural Netw. 2000, 11, 586–600. [Google Scholar] [CrossRef] [PubMed]
  35. Guo, G.H.; Li, K.; Zhang, D.G.; Lei, M. Quantitative source apportionment and associated driving factor identification for soil potential toxicity elements via combining receptor models, SOM, and geo-detector method. Sci. Total Environ. 2022, 830, 154721. [Google Scholar] [CrossRef]
  36. Davies, D.L.; Bouldin, D.W. A cluster separation measure. IEEE Trans. Pattern Anal. Mach. Intell. 1979, 1, 224–227. [Google Scholar] [CrossRef]
  37. Paatero, P.; Tapper, U. Positive matrix factorization: A non-negative factor model with optimal utilization of error estimates of data values. Environmentrics 1994, 5, 111–126. [Google Scholar] [CrossRef]
  38. Ding, D.; Kong, L.; Jiang, D.; Wei, J.; Cao, S.; Li, X.; Zheng, L.; Deng, S. Source apportionment and health risk assessment of chemicals of concern in soil, water and sediment at a large strontium slag pile area. J. Environ. Manag. 2022, 304, 114228. [Google Scholar] [CrossRef]
  39. Wang, X.; Wang, L.; Zhang, Q.; Liang, T.; Li, J.; Hansen, H.C.B.; Shaheen, S.M.; Antoniadis, V.; Bolan, N.; Rinklebe, J. Integrated assessment of the impact of land use types on soil pollution by potentially toxic elements and the associated ecological and human health risk. Environ. Pollut. 2022, 299, 118911. [Google Scholar] [CrossRef] [PubMed]
  40. US EPA. Positive Matrix Factorization Model for Environmental Data Analyses. U.S. Environmental Protection Agency Office of Research and Development. 2014. Available online: https://www.epa.gov/air-research/positive-matrix-factorization-model-environmental-data-analyses#overview (accessed on 1 June 2025).
  41. Zeng, J.; Han, G.; Yang, K. Assessment and sources of heavy metals in suspended particulate matter in a tropical catchment, northeast Thailand. J. Clean. Prod. 2020, 265, 121898. [Google Scholar] [CrossRef]
  42. Ghosh, S.; Banerjee, S.; Prajapati, J.; Mandal, J.; Mukherjee, A.; Bhattacharyya, P. Pollution and health risk assessment of mine tailings contaminated soils in India from toxic elements with statistical approaches. Chemosphere 2023, 324, 138267. [Google Scholar] [CrossRef]
  43. USEPA. Exposure Factors Handbook, final ed.; US Environmental Protection Agency: Washington, DC, USA, 2011; [EPA/600/R-09/052F].
  44. Jiang, H.H.; Cai, L.M.; Hu, G.C.; Wen, H.H.; Luo, J.; Xu, H.Q.; Chen, L.G. An integrated exploration on health risk assessment quantification of potentially hazardous elements in soils from the perspective of sources. Ecotoxicol. Environ. Saf. 2021, 208, 111489. [Google Scholar] [CrossRef]
  45. Huang, H.R.; Su, H.; Li, X.; Li, Y.; Jiang, J.J.; Liu, K.; Xie, X.F.; Jia, Z.Y.; Zhang, H.C.; Wang, G.M.; et al. A Monte Carlo simulation-based health risk assessment of heavy metals in soils of the tropical region in southern China. Environ. Geochem Health 2024, 46, 234. [Google Scholar] [CrossRef]
  46. Chen, R.H.; Chen, H.Y.; Song, L.T.; Yao, Z.P.; Meng, F.S.; Teng, Y.G. Characterization and source apportionment of heavy metals in the sediments of Lake Tai (China) and its surrounding soils. Sci. Total Environ. 2019, 694, 133819. [Google Scholar] [CrossRef]
  47. Zhang, R.; Chen, T.; Zhang, Y.; Hou, Y.; Chang, Q. Health risk assessment of heavy metals in agricultural soils and identification of main influencing factors in a typical industrial park in northwest China. Chemosphere 2020, 252, 126591. [Google Scholar] [CrossRef] [PubMed]
  48. Chen, H.Y.; Teng, Y.G.; Lu, S.J.; Wang, Y.Y.; Wang, J.S. Contamination features and health risk of soil heavy metals in China. Sci. Total Environ. 2015, 512–513, 143–153. [Google Scholar] [CrossRef]
  49. Chen, H.Y.; Teng, Y.G.; Lu, S.J.; Wang, Y.Y.; Wu, J.; Wang, J.S. Source apportionment and health risk assessment of trace metals in surface soils of Beijing metropolitan, China. Chemosphere 2016, 144, 1002–1011. [Google Scholar] [CrossRef]
  50. Sun, J.X.; Zhao, M.L.; Huang, J.L.; Liu, Y.F.; Wu, Y.Y.; Cai, B.Y.; Han, Z.W.; Huang, H.H.; Fan, Z.Q. Determination of priority control factors for the management of soil trace metal(loid)s based on source-oriented health risk assessment. J. Hazard. Mater. 2022, 423, 127116. [Google Scholar] [CrossRef]
  51. Oshunsanya, S.O. Introductory chapter: Relevance of soil pH to agriculture. In Soil pH for Nutrient Availability and Crop Performance; IntechOpen: London, UK, 2018. [Google Scholar]
  52. Rao, Y.; Peng, T.; Xue, S.W. Mechanisms of plant saline-alkaline tolerance. J. Plant Physiol. 2023, 281, 153916. [Google Scholar] [CrossRef] [PubMed]
  53. Brautigan, D.J.; Rengasamy, P.; Chittleborough, D.J. Aluminium speciation and phytotoxicity in alkaline soils. Plant Soil 2012, 360, 187–196. [Google Scholar] [CrossRef]
  54. Acosta, J.A.; Jansen, B.; Kalbitz, K.; Faz, A.; Martínez-Martínez, S. Salinity increases mobility of heavy metals in soils. Chemosphere 2011, 85, 1318–1324. [Google Scholar] [CrossRef]
  55. Fan, W.; Zhou, J.L.; Zhou, Y.Z.; Wang, S.T.; Du, J.Y.; Chen, Y.F.; Zeng, Y.Y.; Wei, X. Heavy metal pollution and health risk assessment of agricultural land in the Southern Margin of Tarim Basin in Xinjiang, China. Int. J. Environ. Health Res. 2021, 31, 835–847. [Google Scholar] [CrossRef]
  56. Costa, B.; Oldoni, H.; Silva, W.A.; Martins, R.L.; Bassoi, L.H. Temporal variation and spatial distribution of relative indices of leaf chlorophyll in grapevine cv. chardonnay. Eng. Agric. 2019, 39, 74–84. [Google Scholar] [CrossRef]
  57. Xu, Y.M.; Wang, X.X.; Cui, G.N.; Li, K.; Liu, Y.F.; Li, B.; Yao, Z.L. Source apportionment and ecological and health risk mapping of soil heavy metals based on PMF, SOM, and GIS methods in Hulan River Watershed, Northeastern China. Environ. Monit Assess 2022, 194, 181. [Google Scholar] [CrossRef] [PubMed]
  58. Hu, Q.R.; Li, J.B.; Wang, Y.Z.; Huang, P.C.; He, X.M. Evaluation and source analysis of heavy metal pollution in grassland soils under different management modes in Altay, Xinjiang. Agronomy 2023, 13, 2621. [Google Scholar] [CrossRef]
  59. Yang, D.J.; Wang, M.Y.; Gao, X.; Zhu, H.W.; Zhang, Y. Environmental capacity simulation and source analysis of toxic metals in soils of Wucaiwan mining area, Xinjiang, China. Environ. Earth Sci. 2024, 83, 614. [Google Scholar] [CrossRef]
  60. Abliz, A.; Shi, Q.D.; Abulizi, A. Contamination status and health risk assessment of soil heavy metals in the northern slope of eastern Tianshan Mountains industrial belt in Xinjiang, northwest China. Forests 2023, 13, 1914. [Google Scholar] [CrossRef]
  61. Baishan, K.; Wang, X.M.; Huang, X.Y.; Eziz, M. Health risk assessment and source analysis of toxic element pollution in cultivated soils of the Weigan and Kuqa Rivers oasis in Xinjiang, China. Pol. J. Environ. Stud. 2023, 32, 3501–3514. [Google Scholar] [CrossRef] [PubMed]
  62. Jiang, G.B.; Shi, J.B.; Feng, X.B. Mercury pollution in China. Environ. Sci. Technol. 2006, 40, 3672–3678. [Google Scholar] [CrossRef]
  63. Pirrone, N.; Cinnirella, S.; Feng, X.; Finkelman, R.B.; Friedli, H.R.; Leaner, J.; Mason, R.; Mukherjee, A.B.; Stracher, G.B.; Streets, D.G.; et al. Global mercury emissions to the atmosphere from anthropogenic and natural sources. Atmos. Chem. Phys. 2010, 10, 5951–5964. [Google Scholar] [CrossRef]
  64. GB15618-2018; Soil Environmental Quality-Risk Control Standard for Soil Contamination of Agricultural Land. Ministry of Ecology and Environment: Beijing, China, 2018.
  65. Shokr, M.S.; Abdellatif, M.A.; EIBehairy, R.A.; Abdelhameed, H.H.; EIBaroudy, A.A.; Mohamed, E.S.; Rebouh, N.Y.; Ding, Z.L.; Abuzaid, A.S. Assessment of potential heavy metal contamination hazards based on GIS and multivariate analysis in some mediterranean zones. Agronomy 2022, 12, 3220. [Google Scholar] [CrossRef]
  66. Mohamoud, A.M.; Halder, B.; Shakir, H.S.; Yaseen, Z.M. Soil heavy metal contamination analysis: A representative case study in New Zealand. J. Environ. Chem. Eng. 2025, 13, 116808. [Google Scholar] [CrossRef]
  67. Liu, G.; Zhou, X.; Li, Q.; Shi, Y.; Guo, G.L.; Zhao, L.; Wang, J.; Su, Y.Q.; Zhang, C. Spatial distribution prediction of soil as in a large-scale arsenic slag contaminated site based on an integrated model and multi-source environmental data. Environ. Pollut. 2020, 267, 115631. [Google Scholar] [CrossRef]
  68. Kebonye, N.M.; Eze, P.N.; John, K.; Gholizadeh, A.; Dajčl, J.; Drábek, O.; Němeček, K.; Borůvka, L. Self-organizing map artificial neural networks and sequential Gaussian simulation technique for mapping potentially toxic element hotspots in polluted mining soils. J. Geochem. Explor. 2021, 222, 106680. [Google Scholar] [CrossRef]
  69. Boruvka, L.; Vacek, O.; Jehlicka, J. Principal component analysis as a tool to indicate the origin of potentially toxic elements in soils. Geoderma 2005, 128, 289–300. [Google Scholar] [CrossRef]
  70. Hasan, M.; Kausar, D.; Akhter, G.; Shah, M.H. Evaluation of the mobility and pollution index of selected essential/toxic metals in paddy soil by sequential extraction method. Ecotoxicol. Environ. Saf. 2018, 147, 283–291. [Google Scholar] [CrossRef]
  71. Chai, L.; Wang, Y.; Wang, X.; Ma, L.; Cheng, Z.; Su, L.; Liu, M. Quantitative source apportionment of heavy metals in cultivated soil and associated model uncertainty. Ecotoxicol. Environ. Saf. 2021, 215, 112150. [Google Scholar] [CrossRef]
  72. Banerjee, S.; Ghosh, S.; Jha, S.; Kumar, S.; Mondal, G.; Sarkar, D.; Datta, R.; Mukherjee, A.; Bhattacharyya, P. Assessing pollution and health risks from chromite mine tailings contaminated soils in India by employing synergistic statistical approaches. Sci. Total Environ. 2023, 880, 163228. [Google Scholar] [CrossRef] [PubMed]
  73. Fei, X.F.; Lou, Z.H.; Xiao, R.; Ren, Z.Q.; Lv, X.N. Source analysis and source-oriented risk assessment of heavy metal pollution in agricultural soils of different cultivated land qualities. J. Clean. Prod. 2022, 341, 130942. [Google Scholar] [CrossRef]
  74. Sun, L.; Guo, D.K.; Liu, K.; Meng, H.; Zheng, Y.J.; Yuan, F.Q.; Zhu, G.H. Levels, sources, and spatial distribution of heavy metals in soils from a typical coal industrial city of Tangshan, China. Catena 2019, 175, 101–109. [Google Scholar] [CrossRef]
  75. Guo, G.H.; Chen, S.Q.; Li, K.; Lei, M.; Ju, T.N.; Tian, L.Y. Determining the priority control sources of heavy metals in the roadside soils in a typical industrial city of North China. J. Hazard. Mater. 2024, 480, 136347. [Google Scholar] [CrossRef] [PubMed]
  76. Šajn, R.; Halamić, J.; Peh, Z.; Galović, L.; Alijagić, J. Assessment of the natural and anthropogenic sources of chemical elements in alluvial soils from the Drava River using multivariate statistical methods. J. Geochem. Explor. 2011, 110, 278–289. [Google Scholar] [CrossRef]
  77. Chai, L.; Wang, Y.H.; Wang, X.; Ma, L.; Cheng, Z.X.; Su, L.M. Pollution characteristics, spatial distributions, and source apportionment of heavy metals in cultivated soil in Lanzhou, China. Ecol. Indic. 2021, 125, 107507. [Google Scholar] [CrossRef]
  78. Huang, J.; Wu, Y.; Sun, J.; Li, X.; Geng, X.; Zhao, M.; Sun, T.; Fan, Z. Health risk assessment of heavy metal(loid)s in park soils of the largest megacity in China by using Monte Carlo simulation coupled with Positive matrix factorization model. J. Hazard. Mater. 2021, 415, 125629. [Google Scholar] [CrossRef]
  79. Guan, Q.; Wang, F.; Xu, C.; Pan, N.; Lin, J.; Zhao, R.; Yang, Y.; Luo, H. Source apportionment of heavy metals in agricultural soil based on PMF: A case study in Hexi Corridor, northwest China. Chemosphere 2018, 193, 189–197. [Google Scholar] [CrossRef]
  80. Fan, P.; Lu, X.W.; Yu, B.; Fan, X.Y.; Wang, L.Q.; Lei, K.; Yang, Y.F.; Zuo, L.; Rinklebe, J. Spatial distribution, risk estimation and source apportionment of potentially toxic metal(loid)s in resuspended megacity street dust. Environ. Int. 2022, 160, 107073. [Google Scholar] [CrossRef]
  81. An, S.W.; Liu, N.T.; Li, X.M.; Zeng, S.F.; Wang, X.; Wang, D.Y. Understanding heavy metal accumulation in roadside soils along major roads in the Tibet Plateau. Sci. Total Environ. 2022, 802, 149865. [Google Scholar] [CrossRef]
  82. Schneider, L.; Rose, N.L.; Myllyvirta, L.; Haberle, S.; Lintern, A.; Yuan, J.J.; Sinclair, D.; Holley, C.; Zawadzki, A.; Sun, R.Y. Mercury atmospheric emission, deposition and isotopic fingerprinting from major coal-fired power plants in Australia: Insights from palaeo-environmental analysis from sediment cores. Environ. Pollut. 2021, 287, 117596. [Google Scholar] [CrossRef]
  83. Duan, X.C.; Yu, H.H.; Ye, T.R.; Huang, Y.; Li, J.; Yuan, G.L.; Albanese, S. Geostatistical mapping and quantitative source apportionment of potentially toxic elements in top- and sub-soils: A case of suburban area in Beijing, China. Ecol. Indic. 2020, 112, 106085. [Google Scholar] [CrossRef]
  84. Luo, L.; Ma, Y.; Zhang, S.; Wei, D.; Zhu, Y.G. An inventory of trace element inputs to agricultural soils in China. J. Environ. Manag. 2009, 90, 2524–2530. [Google Scholar] [CrossRef] [PubMed]
  85. Hu, B.F.; Shao, S.; Ni, H.; Fu, Z.Y.; Hu, L.S.; Zhou, Y.; Min, X.X.; She, S.F.; Chen, S.C.; Huang, M.X.; et al. Current status, spatial features, health risks, and potential driving factors of soil heavy metal pollution in China at province level. Environ. Pollut. 2020, 266, 114961. [Google Scholar] [CrossRef]
  86. Baltas, H.; Sirin, M.; Gökbayrak, E.; Ozcelik, A.E. A case study on pollution and a human health risk assessment of heavy metals in agricultural soils around Sinop province Turkey. Chemosphere 2020, 241, 125015. [Google Scholar] [CrossRef]
  87. Wu, Y.F.; Li, X.; Yu, L.; Wang, T.Q.; Wang, J.N.; Liu, T.T. Review of soil heavy metal pollution in China: Spatial distribution, primary sources, and remediation alternatives. Resour. Conserv. Recycl. 2022, 181, 106261. [Google Scholar] [CrossRef]
  88. Liu, Z.P.; Wang, L.; Yan, M.J.; Ma, B.; Cao, R.X. Source apportionment of soil heavy metals based on multivariate statistical analysis and the PMF model: A case study of the Nanyang Basin, China. Environ. Technol. Innov. 2024, 33, 103537. [Google Scholar] [CrossRef]
  89. Xue, S.G.; Korna, R.; Fan, J.R.; Ke, W.S.; Lou, W.; Wang, J.T.; Zhu, F. Spatial distribution, environmental risks, and sources of potentially toxic elements in soils from a typical abandoned antimony smelting site. J. Environ. Sci. 2023, 127, 780–790. [Google Scholar] [CrossRef] [PubMed]
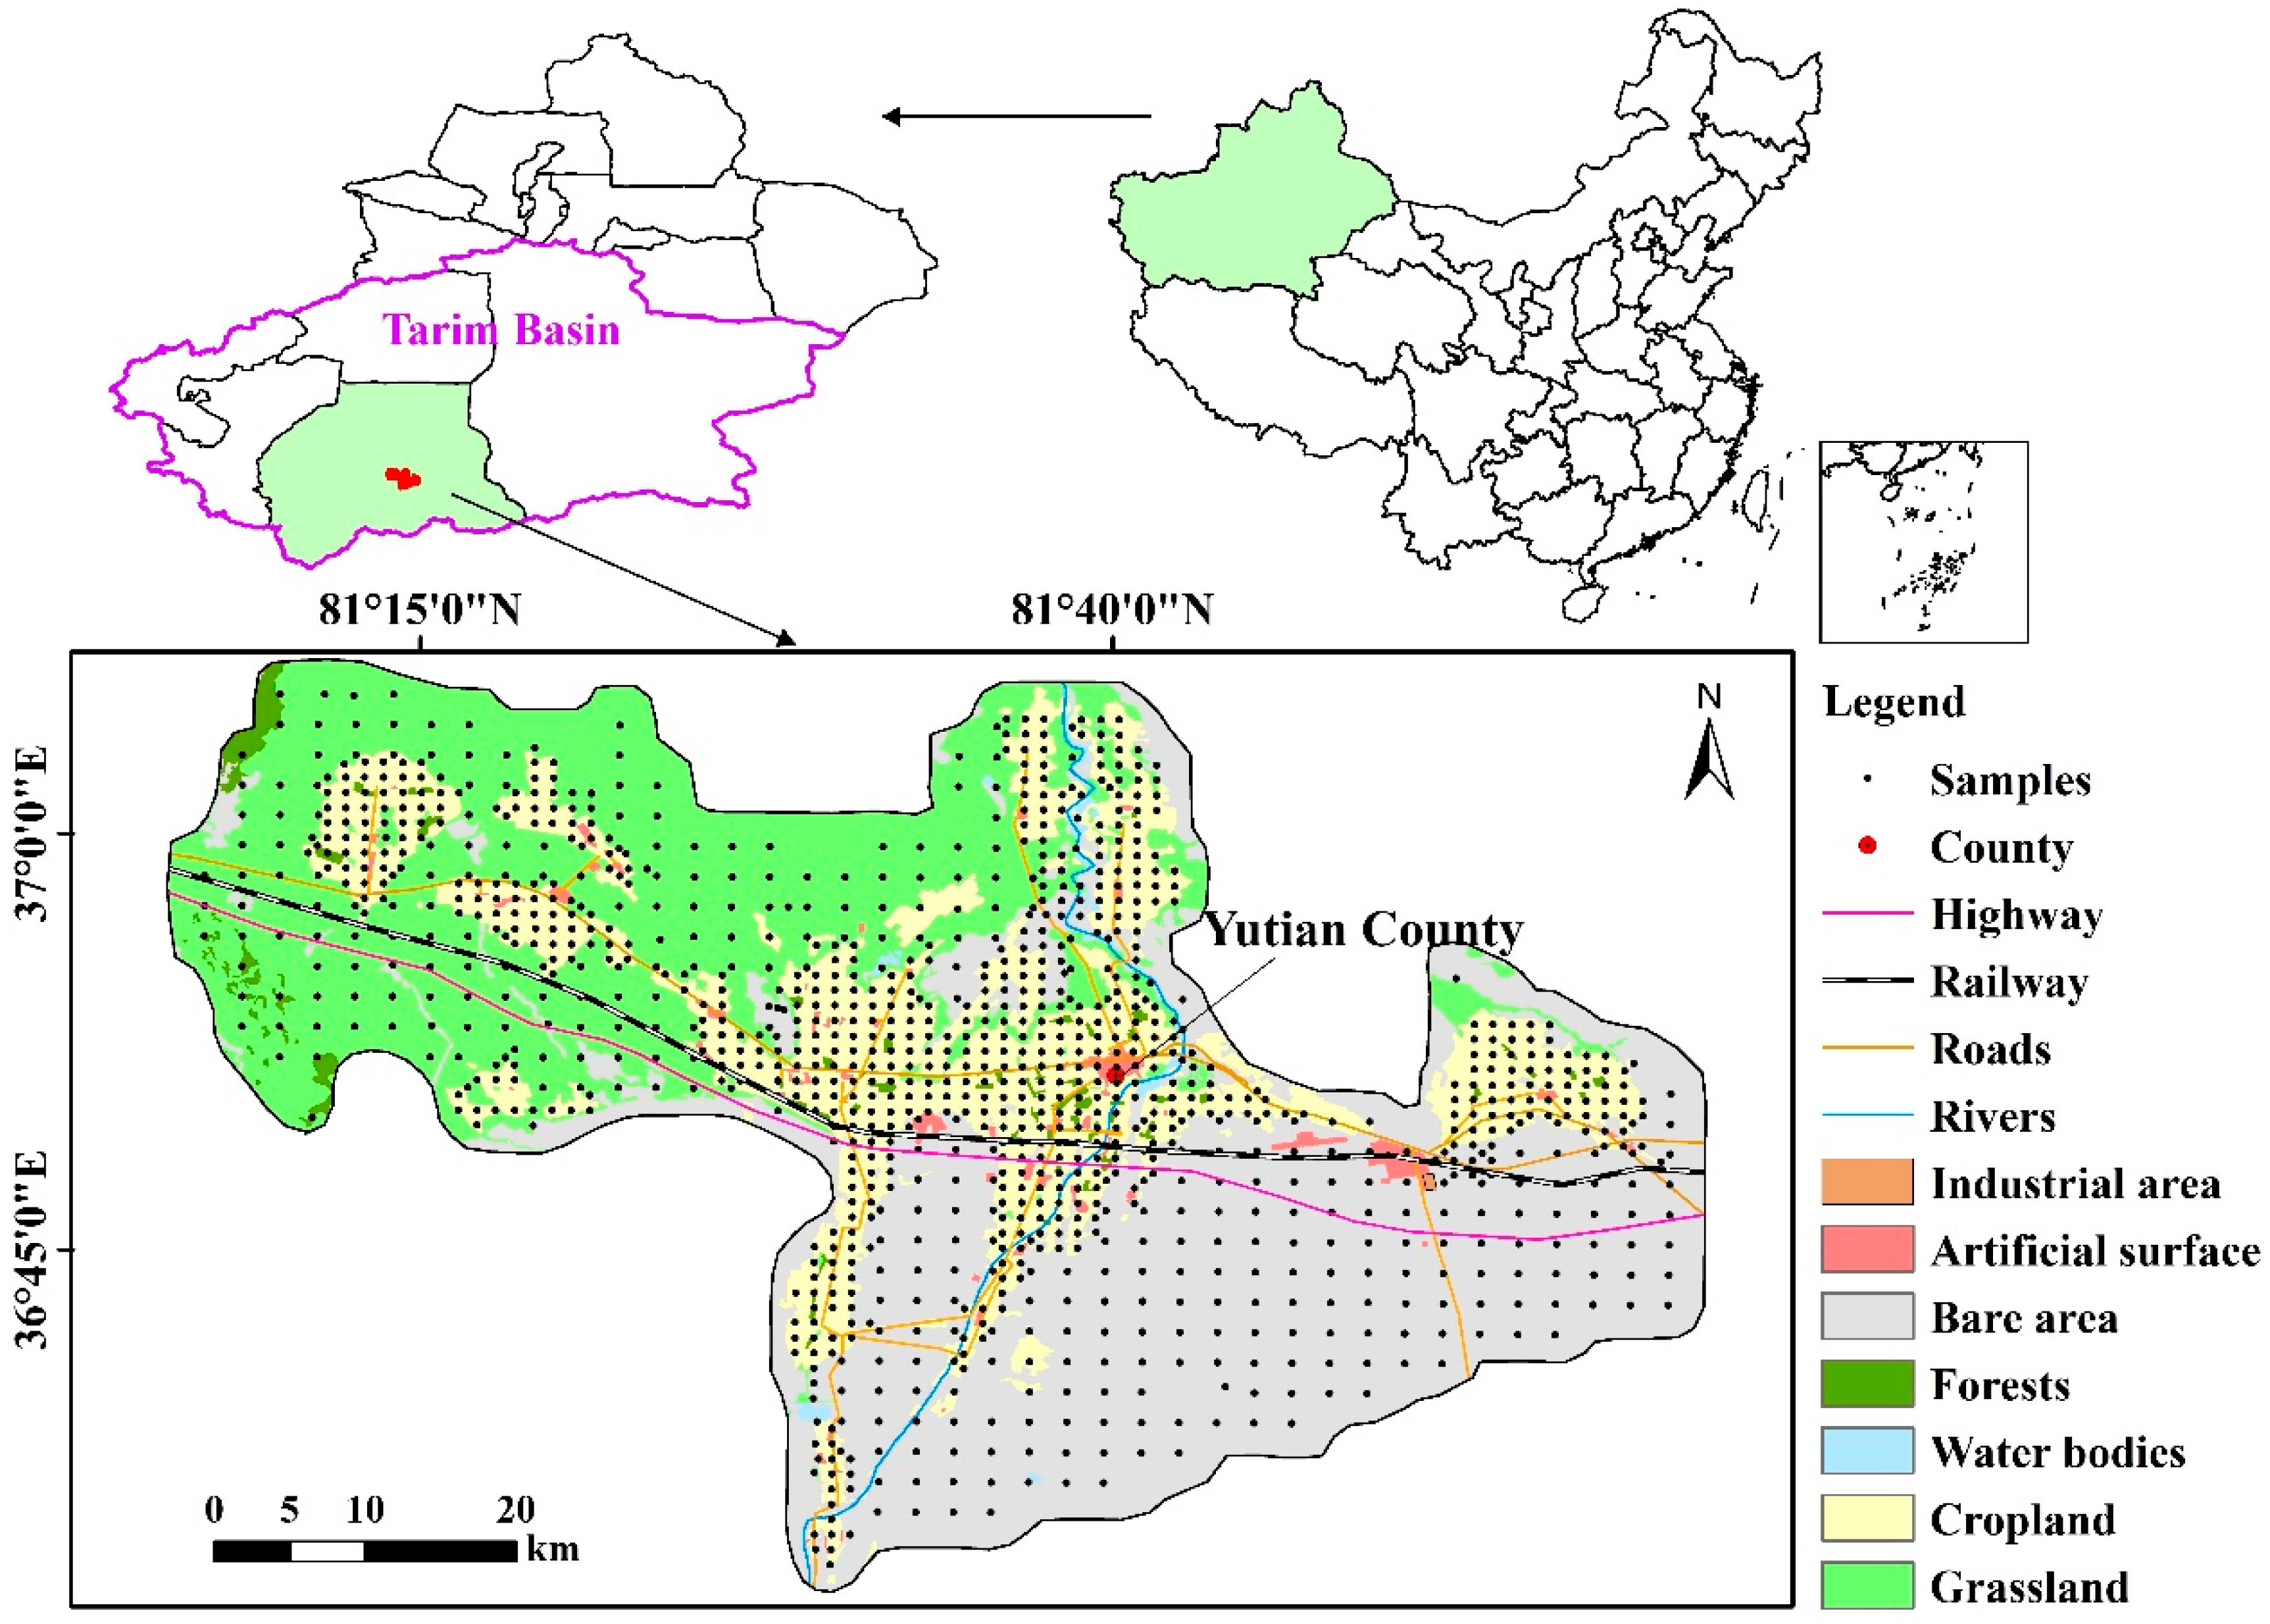
Figure 1. Location of the study area and the sampling sites.
Agronomy 15 02721 g001
Figure 2. Spatial distribution of soil heavy metals (a) Cr, (b) Cd, (c) Pb, (d) Zn, (e) Cu, (f) Ni, (g) As, (h) Hg, (i) pH.
Agronomy 15 02721 g002aAgronomy 15 02721 g002b
Figure 3. (a) SOMs of soil heavy metal concentrations. Different colors represent different variable values (normalized). The blue and red colors correspond to low and high values, respectively. A similar color distribution of planes indicates a positive correlation between variables. (b) Classification diagram of K-means clustering sampling points based on Geographic Information System (GIS).
Agronomy 15 02721 g003
Figure 4. Pearson correlation coefficients among heavy metals. (* p ≤ 0.05, *** p ≤ 0.001).
Agronomy 15 02721 g004
Figure 5. Source apportionment of heavy metals in soils of the study area. (a) Factor profiles of heavy metals in soils derived from the positive matrix factorization (PMF) model; (b) Percentage of contribution for each factor by the PMF model.
Agronomy 15 02721 g005
Figure 6. Spatial distribution of normalized source contribution of soil heavy metals based on the PMF model (a). Factor 1, (b). Factor 2, (c). Factor 3. The values in the legend indicate the factor scores.
Agronomy 15 02721 g006
Figure 7. Probability distributions of carcinogenic and non-carcinogenic risks to adults and children from heavy metal concentrations and different sources of pollution.
Agronomy 15 02721 g007
Disclaimer/Publisher’s Note: The statements, opinions and data contained in all publications are solely those of the individual author(s) and contributor(s) and not of MDPI and/or the editor(s). MDPI and/or the editor(s) disclaim responsibility for any injury to people or property resulting from any ideas, methods, instructions or products referred to in the content.