Article

Development of an Optimization Method for Dry-Type Rice Straw Modeling Considering Mechanical Properties Using the Discrete Element Method

1
Department of Bio-Industrial Machinery Engineering, Pusan National University, Miryang 50463, Republic of Korea
2
Department of Smart Agricultural Systems and Mechanical Engineering, Chungnam National University, Daejeon 34134, Republic of Korea
3
Department of Smart Agriculture Systems, Chungnam National University, Daejeon 34134, Republic of Korea
*
Author to whom correspondence should be addressed.
Agronomy 2025, 15(12), 2712; https://doi.org/10.3390/agronomy15122712
Submission received: 26 October 2025 / Revised: 15 November 2025 / Accepted: 24 November 2025 / Published: 25 November 2025
(This article belongs to the Special Issue Research Progress in Agricultural Robots in Arable Farming)

Abstract

Accurate load prediction is essential for optimizing the performance and design of agricultural machinery. However, obtaining field-based load data is challenging due to the limited harvesting period of crops. To address this, the Discrete Element Method (DEM) has been widely applied to simulate crop–machine interactions under controlled virtual conditions. Previous DEM studies on rice straw often assumed uniform mechanical properties throughout the stem, neglecting sectional heterogeneity and limiting the accuracy of tensile and shear response prediction. This study developed an optimized DEM-based modeling approach by dividing rice straw into four sections—Top, Mid, Node, and Bottom—and experimentally determining their mechanical properties for model calibration. The Mid section exhibited the highest average tensile strength (178.71 N), while the Node showed the greatest shear resistance (114.08 N). One-way ANOVA confirmed significant sectional differences in both tensile (F = 18.12, p < 0.001) and shear (F = 23.61, p < 0.001) strengths. Two DEM models were validated: a multi-particle (Model A) and a simplified single-particle (Model B) configuration. Both achieved over 95% prediction accuracy, with Model B reducing computation time by 77.5% (80→18 min). Although the modeling was based on fully dried straw, future studies should incorporate moisture-dependent properties to enhance predictive fidelity. The proposed approach improves both accuracy and efficiency, providing a foundation for raking and baling load simulations.

1. Introduction

Most crops are harvested and processed according to their growth cycles, and the mechanical loads generated during these operations are critical for evaluating and improving the performance of agricultural machinery. These load data are also essential for developing reliable control strategies for agricultural robots and implements [1,2,3]. However, harvester and processing machines operate only during specific seasons, limiting opportunities to collect sufficient load data under diverse field conditions. In addition, field loads vary with soil properties, crop conditions, and operating speeds, making it difficult to obtain reproducible and comprehensive datasets through experiments alone. These limitations highlight the need for simulation-based load prediction methods that overcome temporal and environmental constraints. In this context, the Discrete Element Method (DEM) has become a valuable tool for modeling crop–machine interactions in controlled virtual environments, enabling precise load evaluation even when field measurements are limited.
Bae et al. [4] predicted the traction forces generated during tillage operations under various soil textures using a soil model based on the DEM (discrete element method). Kim et al. [5] quantitatively evaluated the effects of tillage depth and environmental conditions on operational performance and load through field-based load analysis of a moldboard plow system.
In agricultural simulation, modeling crops is an important factor for accurate load prediction [6,7]. Agricultural machinery interacts with a variety of crops during operation [8]. To effectively simulate the loads generated by these interactions, it is necessary to develop optimized models of both the crop and the implement [9,10]. The discrete element method is a numerical technique widely used to simulate particle-based interactions, and is particularly suitable for modeling granular materials such as crops, soil, rocks, and fluids [11,12]. In the modeling process of discrete element method software, particle number and size significantly influence the total simulation time; thus, selecting the appropriate particle shape and size is crucial for improving computational efficiency [6,13]. Rice straw, a byproduct of rice harvesting, is commonly utilized as livestock feed and fertilizer [14,15]. It frequently comes into direct contact with machinery during harvesting and processing, generating mechanical loads [8,16]. These loads vary depending on the physical and mechanical properties of the rice straw [17,18]. Therefore, to accurately reflect these characteristics in simulations, crop modeling should be based on experimentally measured properties of rice straw [19,20].
Tang et al. [11] simulated the compression process of rice straw using DEM models composed of overlapping spheres, applying the EEPA contact model to evaluate voidage and pressure under vibrational and non-vibrational conditions. Xu et al. [9] developed a double-bonded bimodal DEM model of corn straw that distinguished between the mechanical properties of the outer skin and inner pulp, providing a more realistic structural representation through experimental calibration. Li et al. [20] proposed a fracture-oriented DEM model of wheat straw using the Hertz-Mindlin bonding V2 model, successfully replicating the ring-collapse and breakage behavior validated by mechanical tests. Despite recent advances, research on DEM-based modeling of rice straw remains limited compared to that of corn and wheat straw, and current approaches exhibit several critical limitations. Most existing studies assign uniform mechanical properties along the entire stem, neglecting the distinct sectional variation inherent to rice straw due to its hollow internodes and structurally reinforced nodes. This oversimplification limits the ability of these models to accurately reproduce the tensile and shear behavior, as well as the fracture patterns, observed in physical experiments. In addition, existing rice straw DEM models often require a large number of particles to represent the hollow cylindrical geometry, resulting in extended computation times—often several hours per simulation—which constrains their application to large-scale scenarios such as raking, baling, or iterative parametric analysis. Therefore, there is a clear need for a modeling framework that reflects the mechanical heterogeneity along the rice straw stem, improves computational efficiency, and enhances predictive accuracy. This study addresses these challenges by segmenting rice straw into four distinct sections based on experimentally measured tensile and shear properties, and by developing an efficient DEM model that achieves over 95% agreement with laboratory test results while reducing simulation time by more than 75%.

2. Materials and Methods

2.1. Rice Straw Properties Measurement

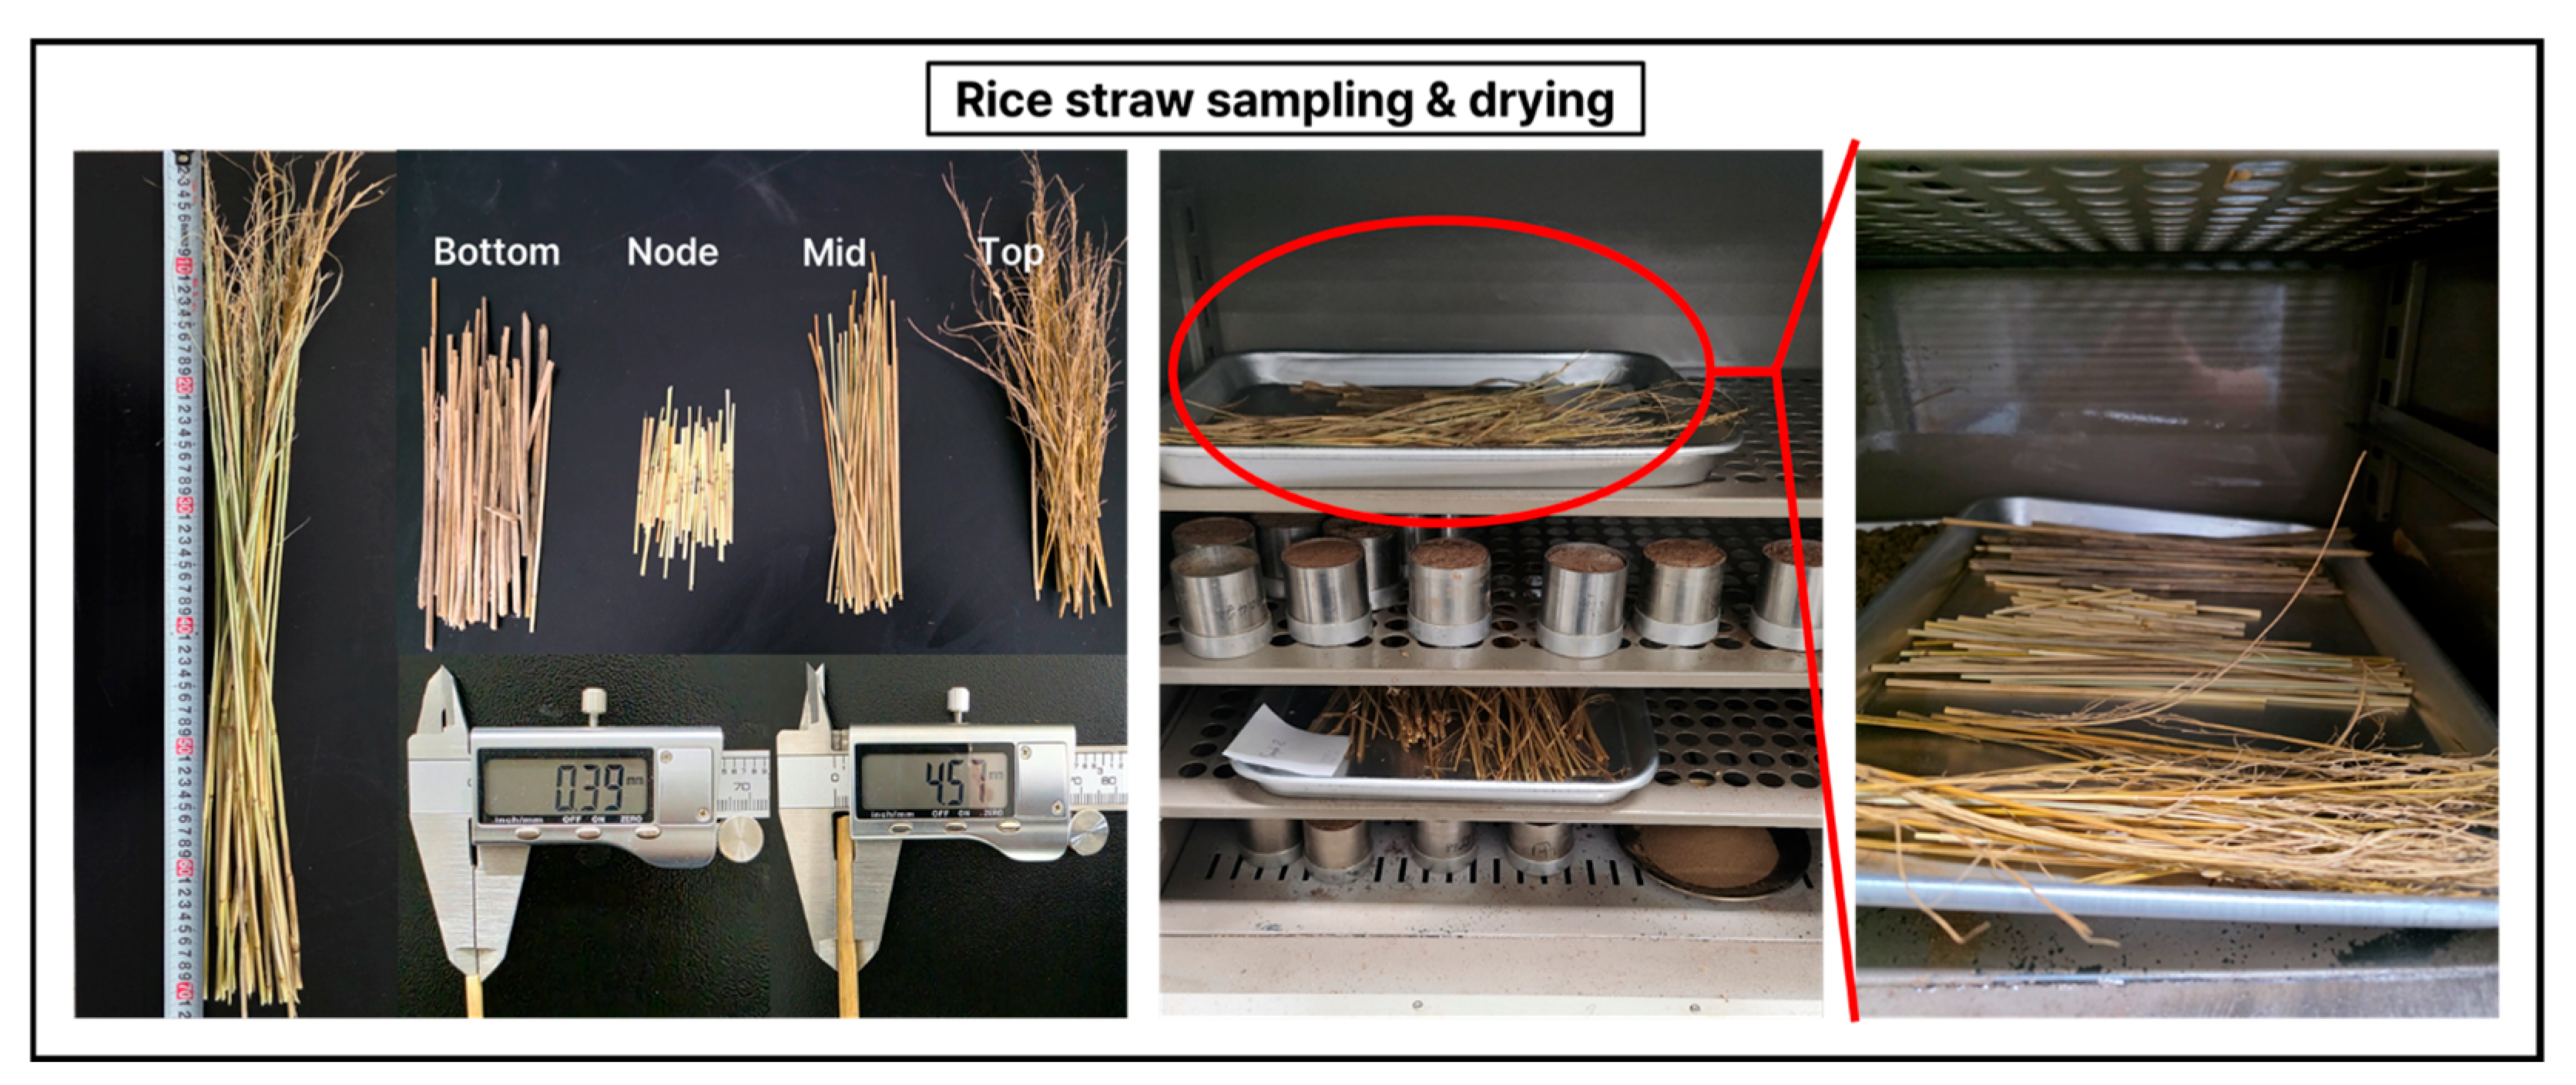
To model crops using the discrete element method, modeling parameters such as particle shape, length, and inter-particle interactions must be defined. These parameters are selected based on the measured physical and mechanical properties of the actual crop to be modeled. The rice straw modeling using DEM was conducted according to the procedure shown in Figure 1. The overall process consists of two stages: measurement of the physical properties of rice straw and DEM-based modeling. The rice straw samples were divided into four sections—Top, Mid, Node, and Bottom—according to node positions, as illustrated in Figure 2. To minimize variation in physical properties caused by moisture content, the samples were oven-dried at 80 °C for 8 h per cycle, repeated three times (totaling 24 h). After drying, the outer diameter, inner diameter, and total length of each sample were measured.
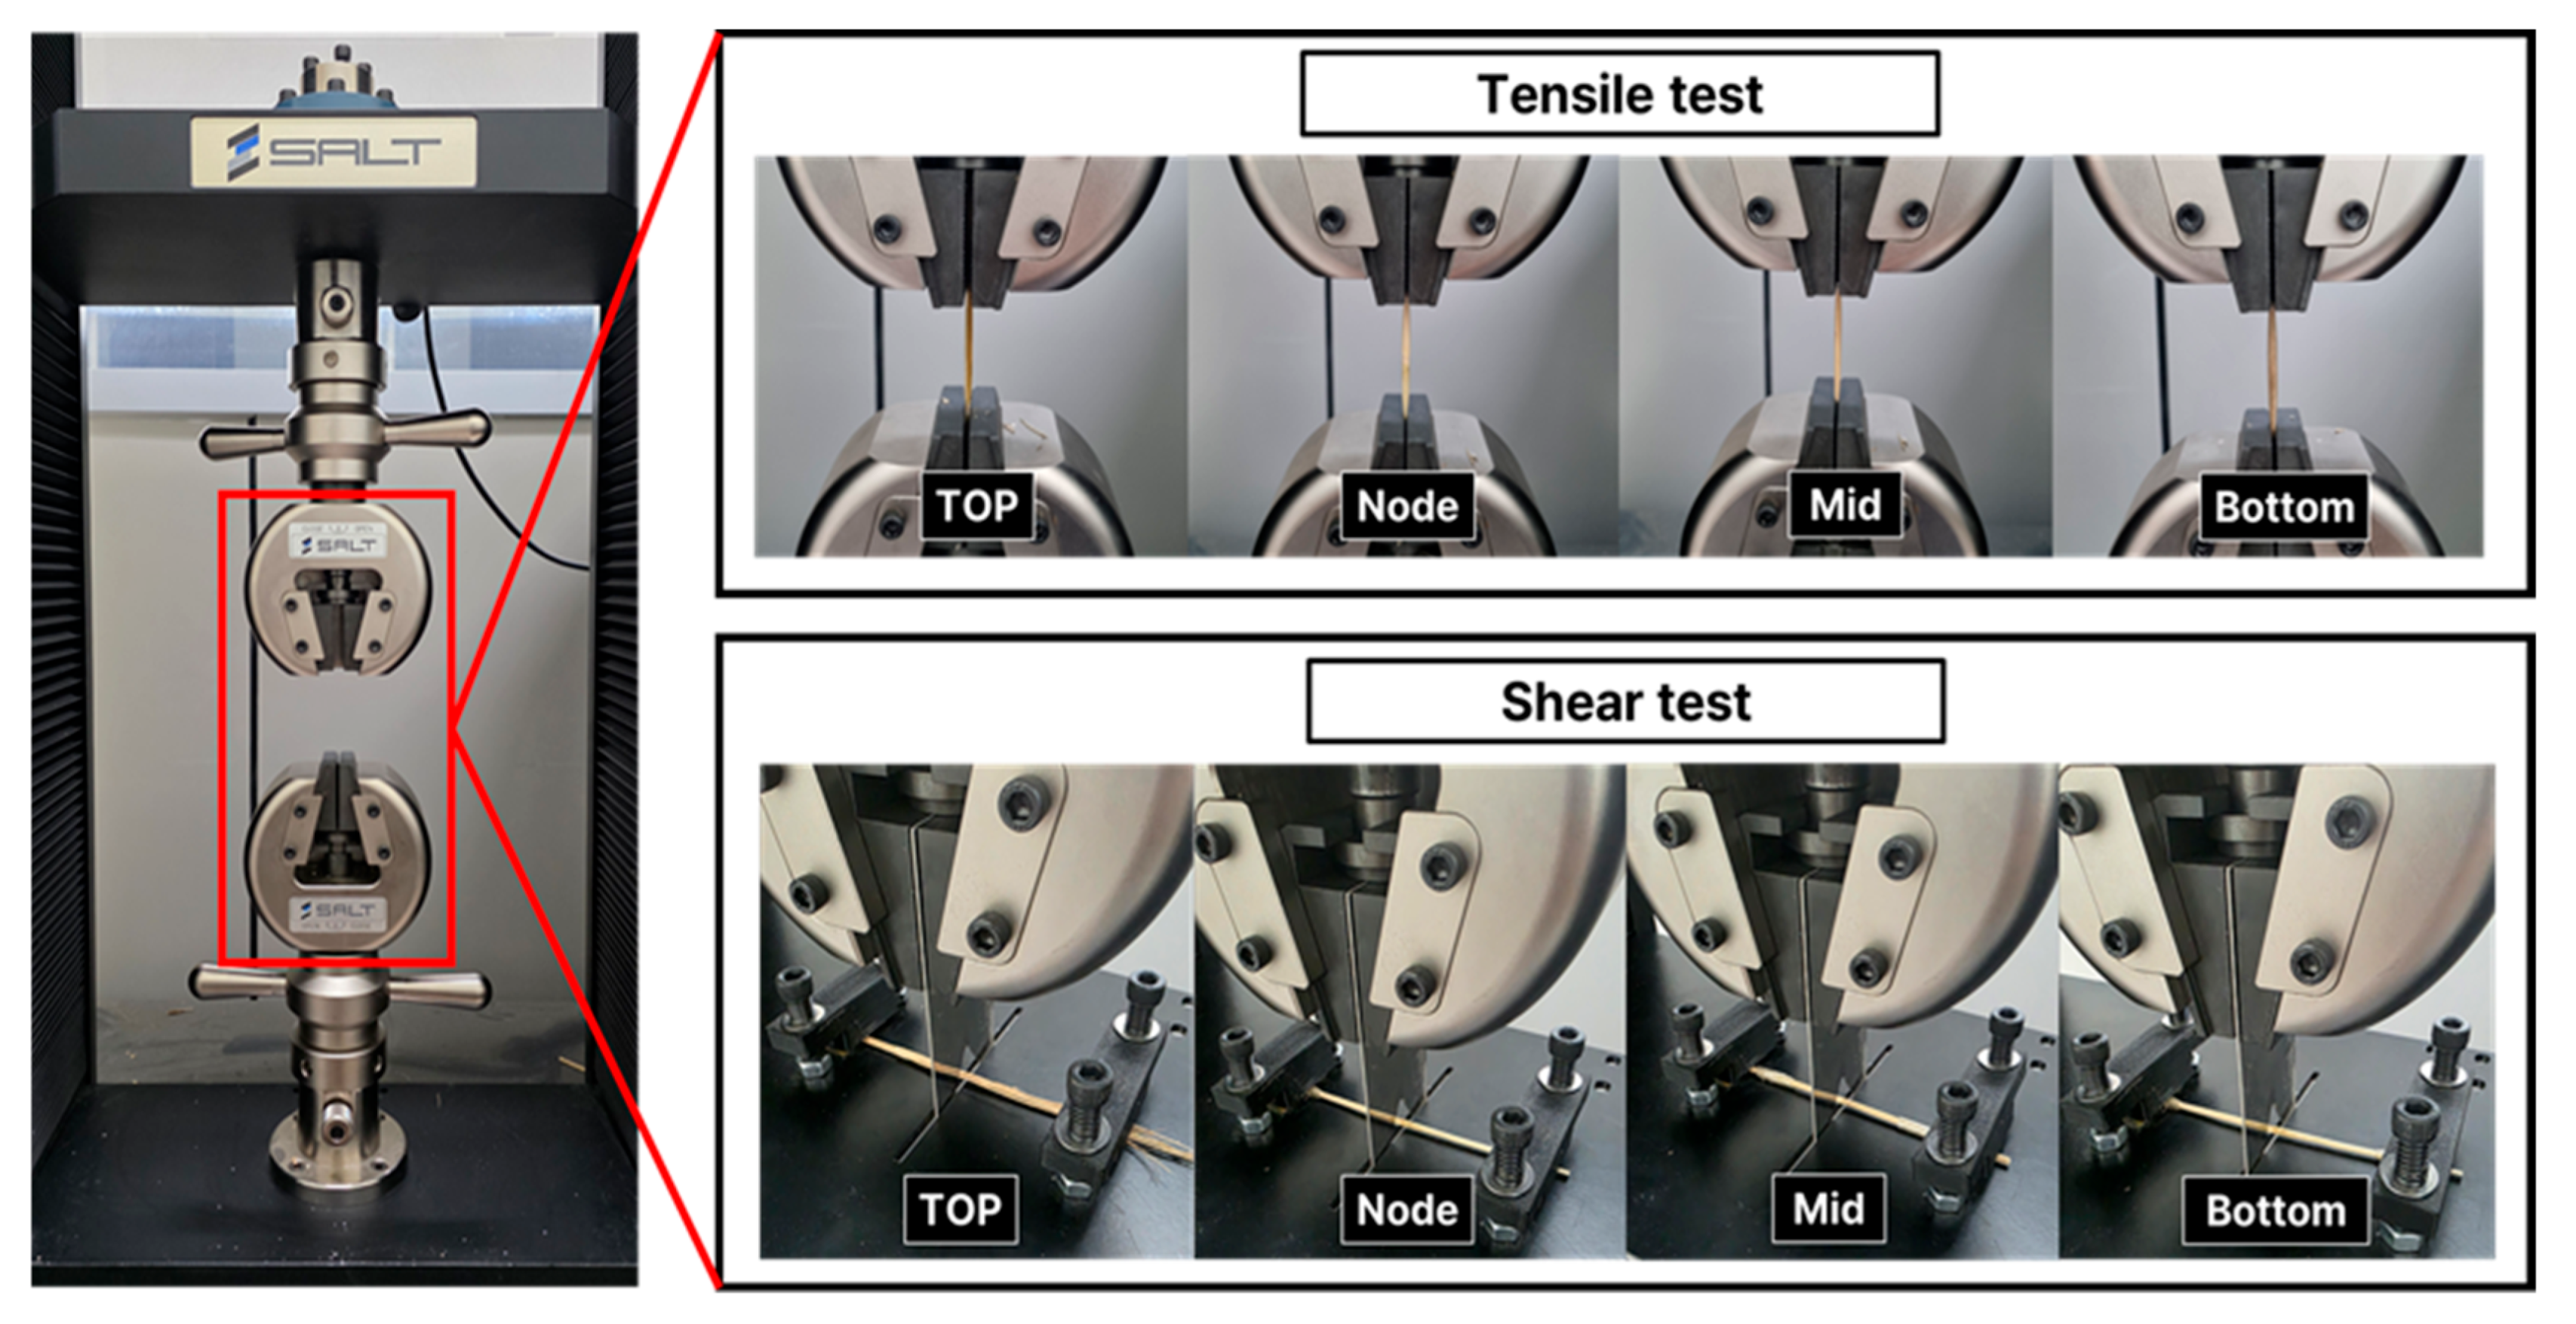
The mechanical and physical properties of rice straw serve as key parameters in discrete element method modeling. These properties represent the interaction between particles and other materials, as well as the behavior of particles in the contact model. The mechanical properties of rice straw were measured through tensile and shear tests. A universal testing machine (ST-1002; SALT, Incheon, Republic of Korea) was used for both tests, as shown in Figure 3. To compare the tensile and shear strength of different parts of the rice straw, samples were divided into four sections, and each section was cut to a length of 14 cm. For the tensile test, samples from each section were pulled at a constant speed of 10 mm/min. The shear test was performed using a Warner–Bratzler shear blade at the same speed of 10 mm/min. To prevent slippage during the shear test, both ends of each rice straw sample were fixed using a jig before testing.
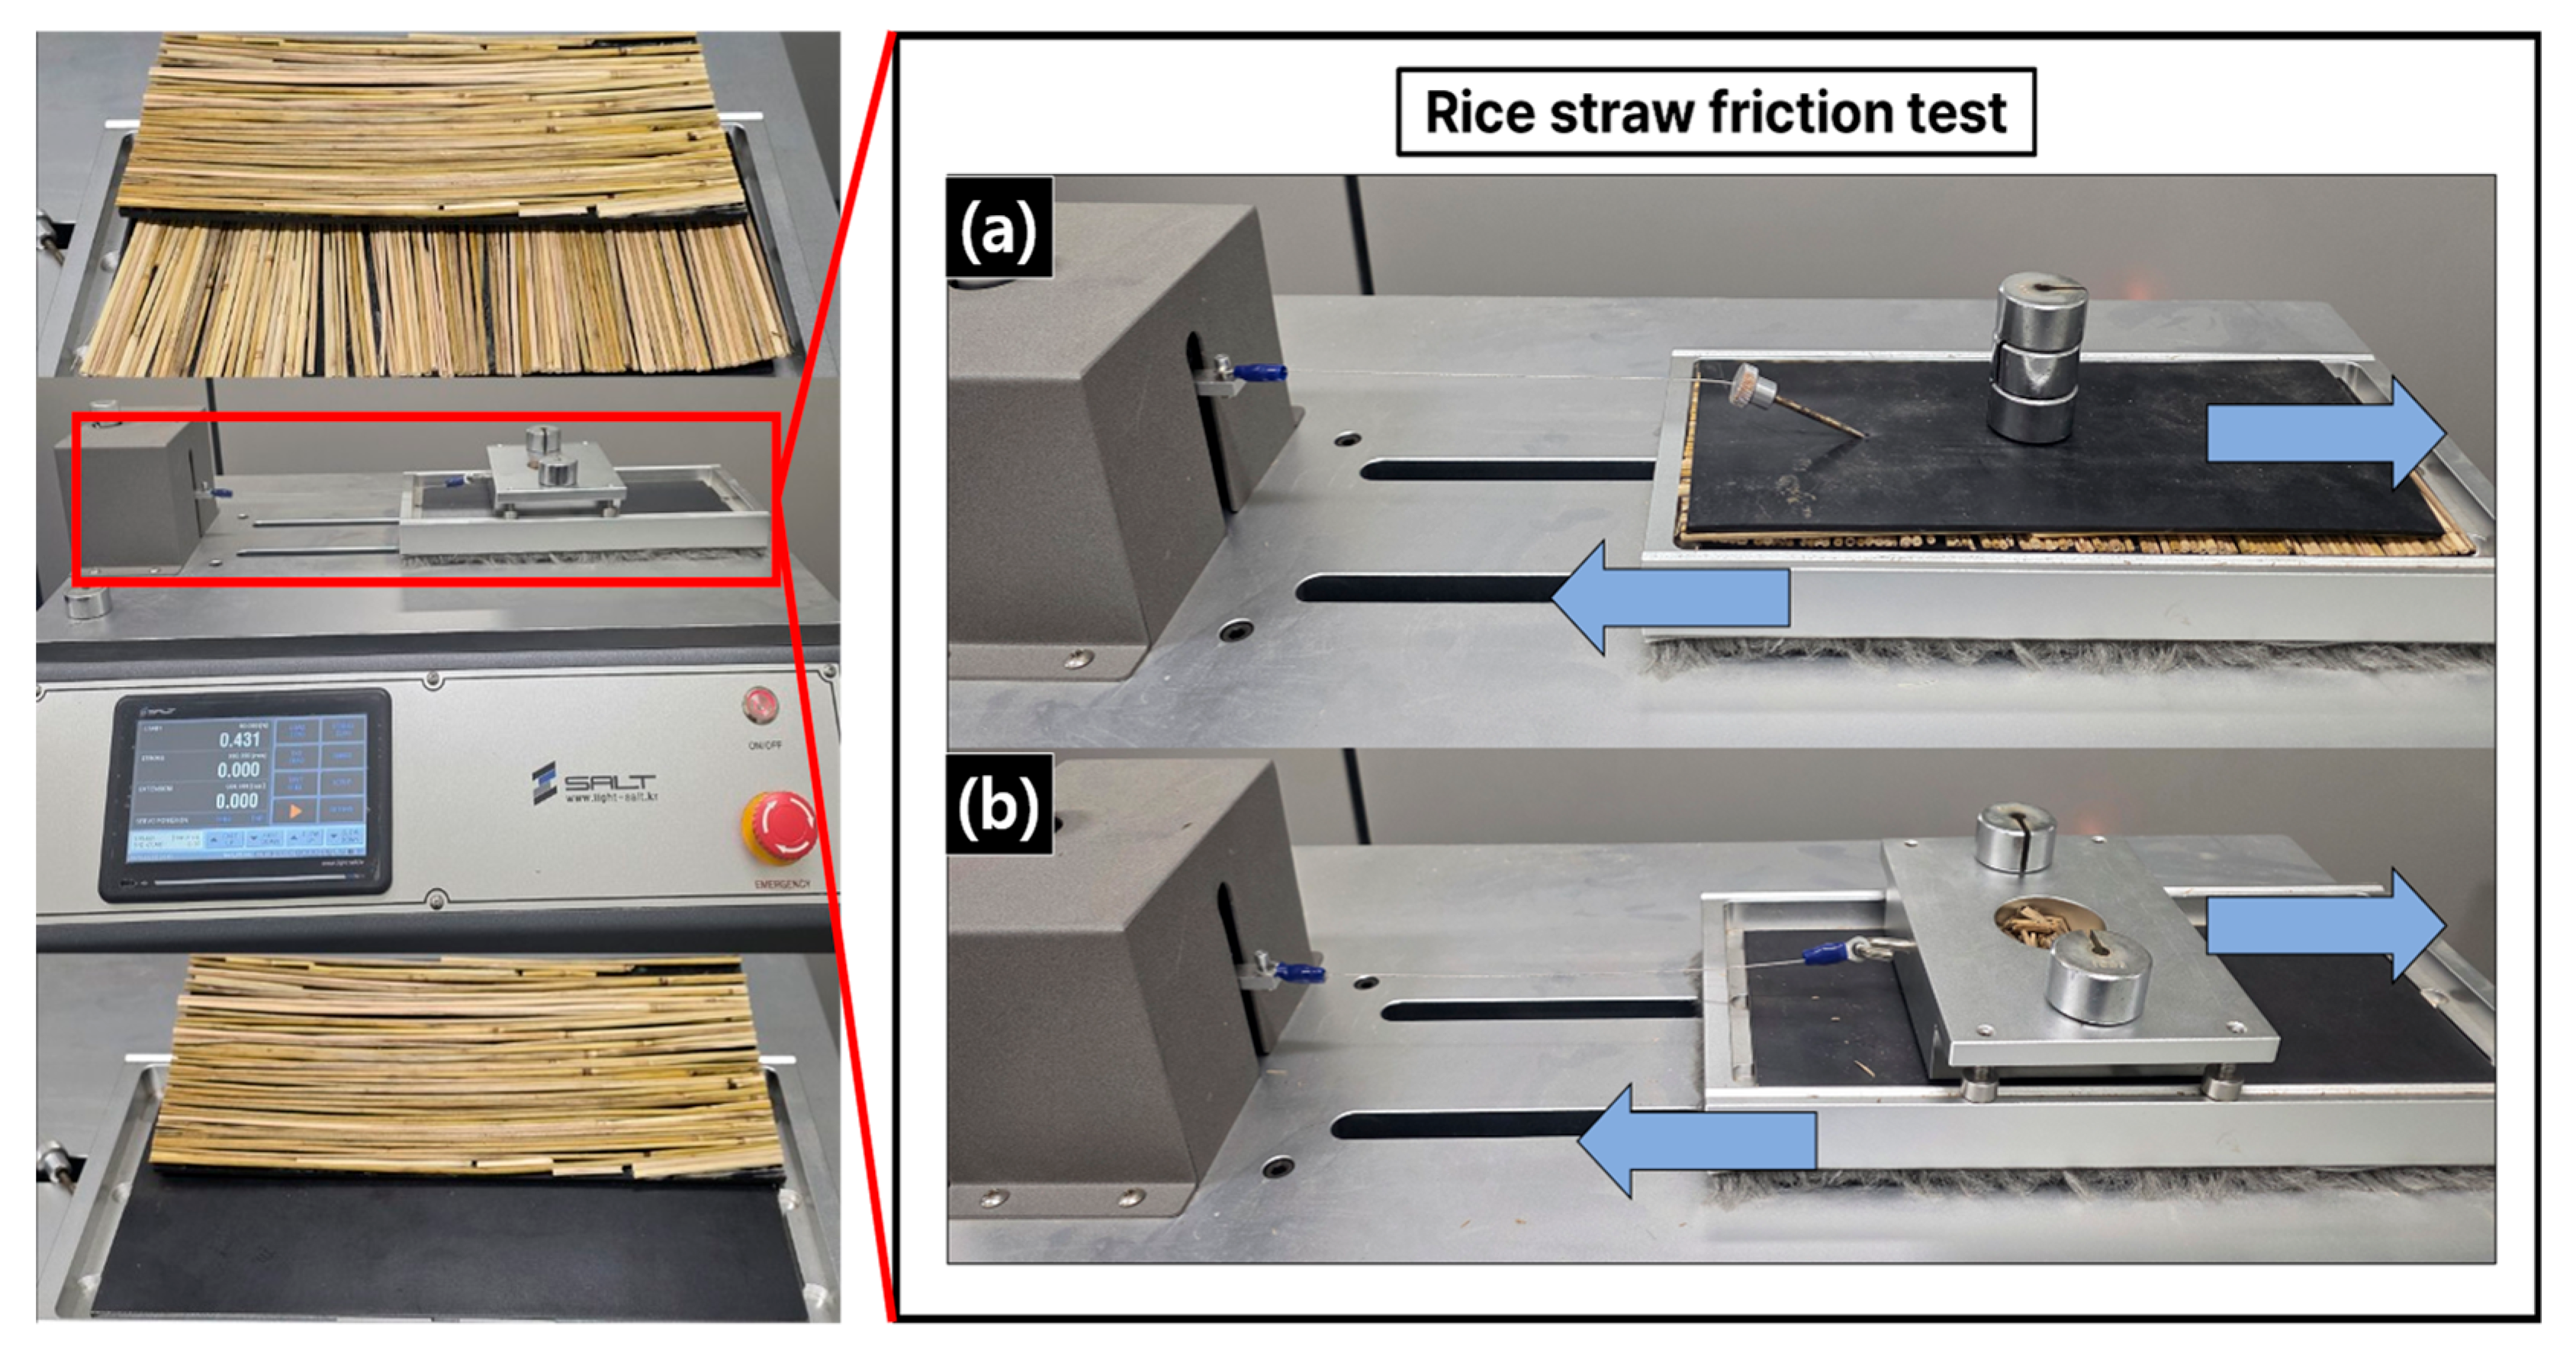
The physical properties of rice straw were evaluated using a friction tester (ST-330; SALT, Incheon, Republic of Korea), as illustrated in Figure 4. The static and kinetic coefficients of friction were measured in accordance with ASTM D1894 [21] (Standard Test Method for Static and Kinetic Coefficients of Friction of Plastic Film and Sheeting) for two contact types: rice straw–rice straw (a) and rice straw–steel (b). The measured static and kinetic friction coefficients were used as interfacial parameters in the DEM-based rice straw modeling to represent contact interactions between materials.

2.2. Rice Straw Modeling Using DEM Software

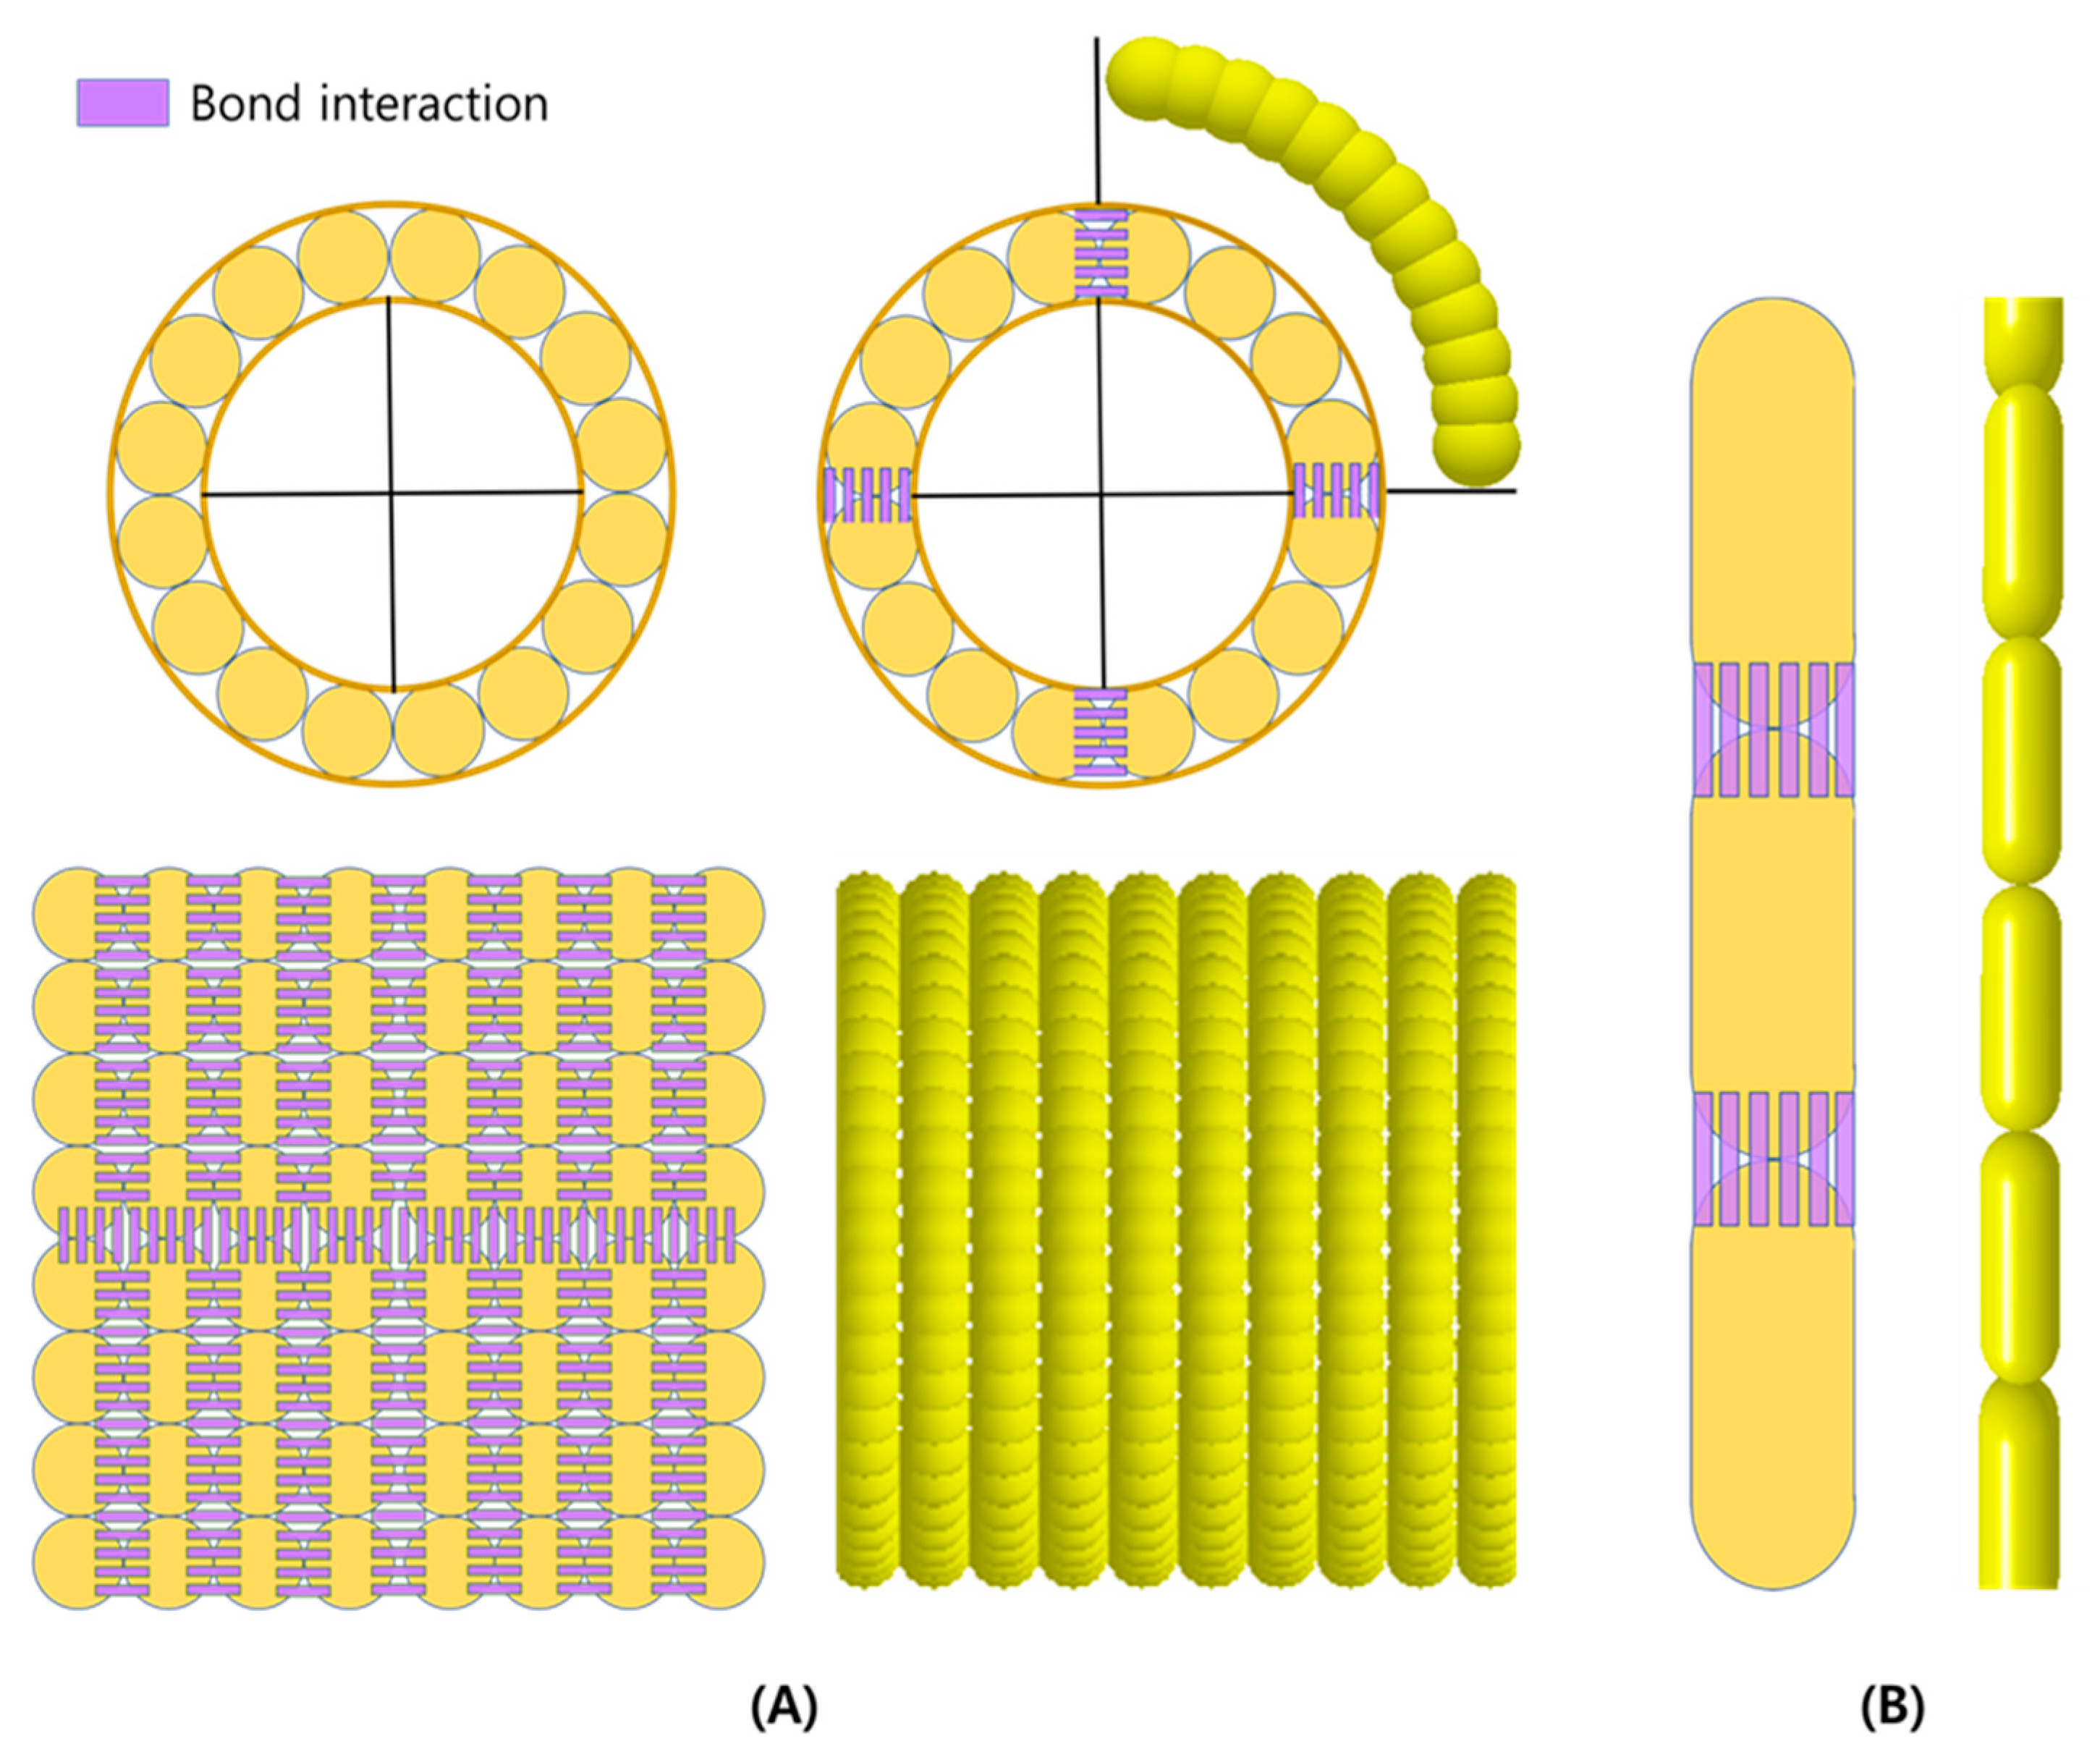
The discrete element method is a numerical technique for analyzing the behavior of particulate materials. Unlike continuum-based models such as the Finite Element Method (FEM) or Computational Fluid Dynamics (CFD), DEM models materials as assemblies of individual particles, allowing for the direct calculation of microscopic interactions. Through this approach, phenomena such as contact, collision, friction, adhesion, and fracture can be represented with high precision. Since discrete element method calculates the movement and forces acting on each particle during simulation, the defined inter-particle interactions and the total number of particles significantly influence the overall simulation time. In this study, two different modeling approaches Model A and Model B were applied to represent rice straw, as illustrated in Figure 5. These models were evaluated to compare modeling accuracy and computational time between the two methods. The modeling parameters for rice straw used in this study are presented in Table 1 and Table 2.
Model A is a multi-particle representation of rice straw, constructed by arranging spherical particles in a circular cross-sectional configuration. The cross-section was divided into four segments, each composed of bonded spherical particles, forming a complete straw structure. This design was informed by the experimental findings of Li et al. (2024) [19], who observed that hollow cereal stems typically exhibit four symmetric cracks under loading, resulting from ring collapse and flattening deformation. Based on this, the four-segment structure was adopted to reflect the characteristic fracture patterns of hollow stems and to effectively capture their representative deformation behavior under external loads.
Model B is a single-particle model that represents the structure of rice straw by connecting elongated cylindrical particles. This model replicates the external shape of the straw, with cylindrical particles bonded together to form the full straw geometry. Compared to Model A, it requires fewer particles, thereby reducing the number of inter-particle interactions and significantly shortening the overall simulation time.

Particle Contact and Interaction Model

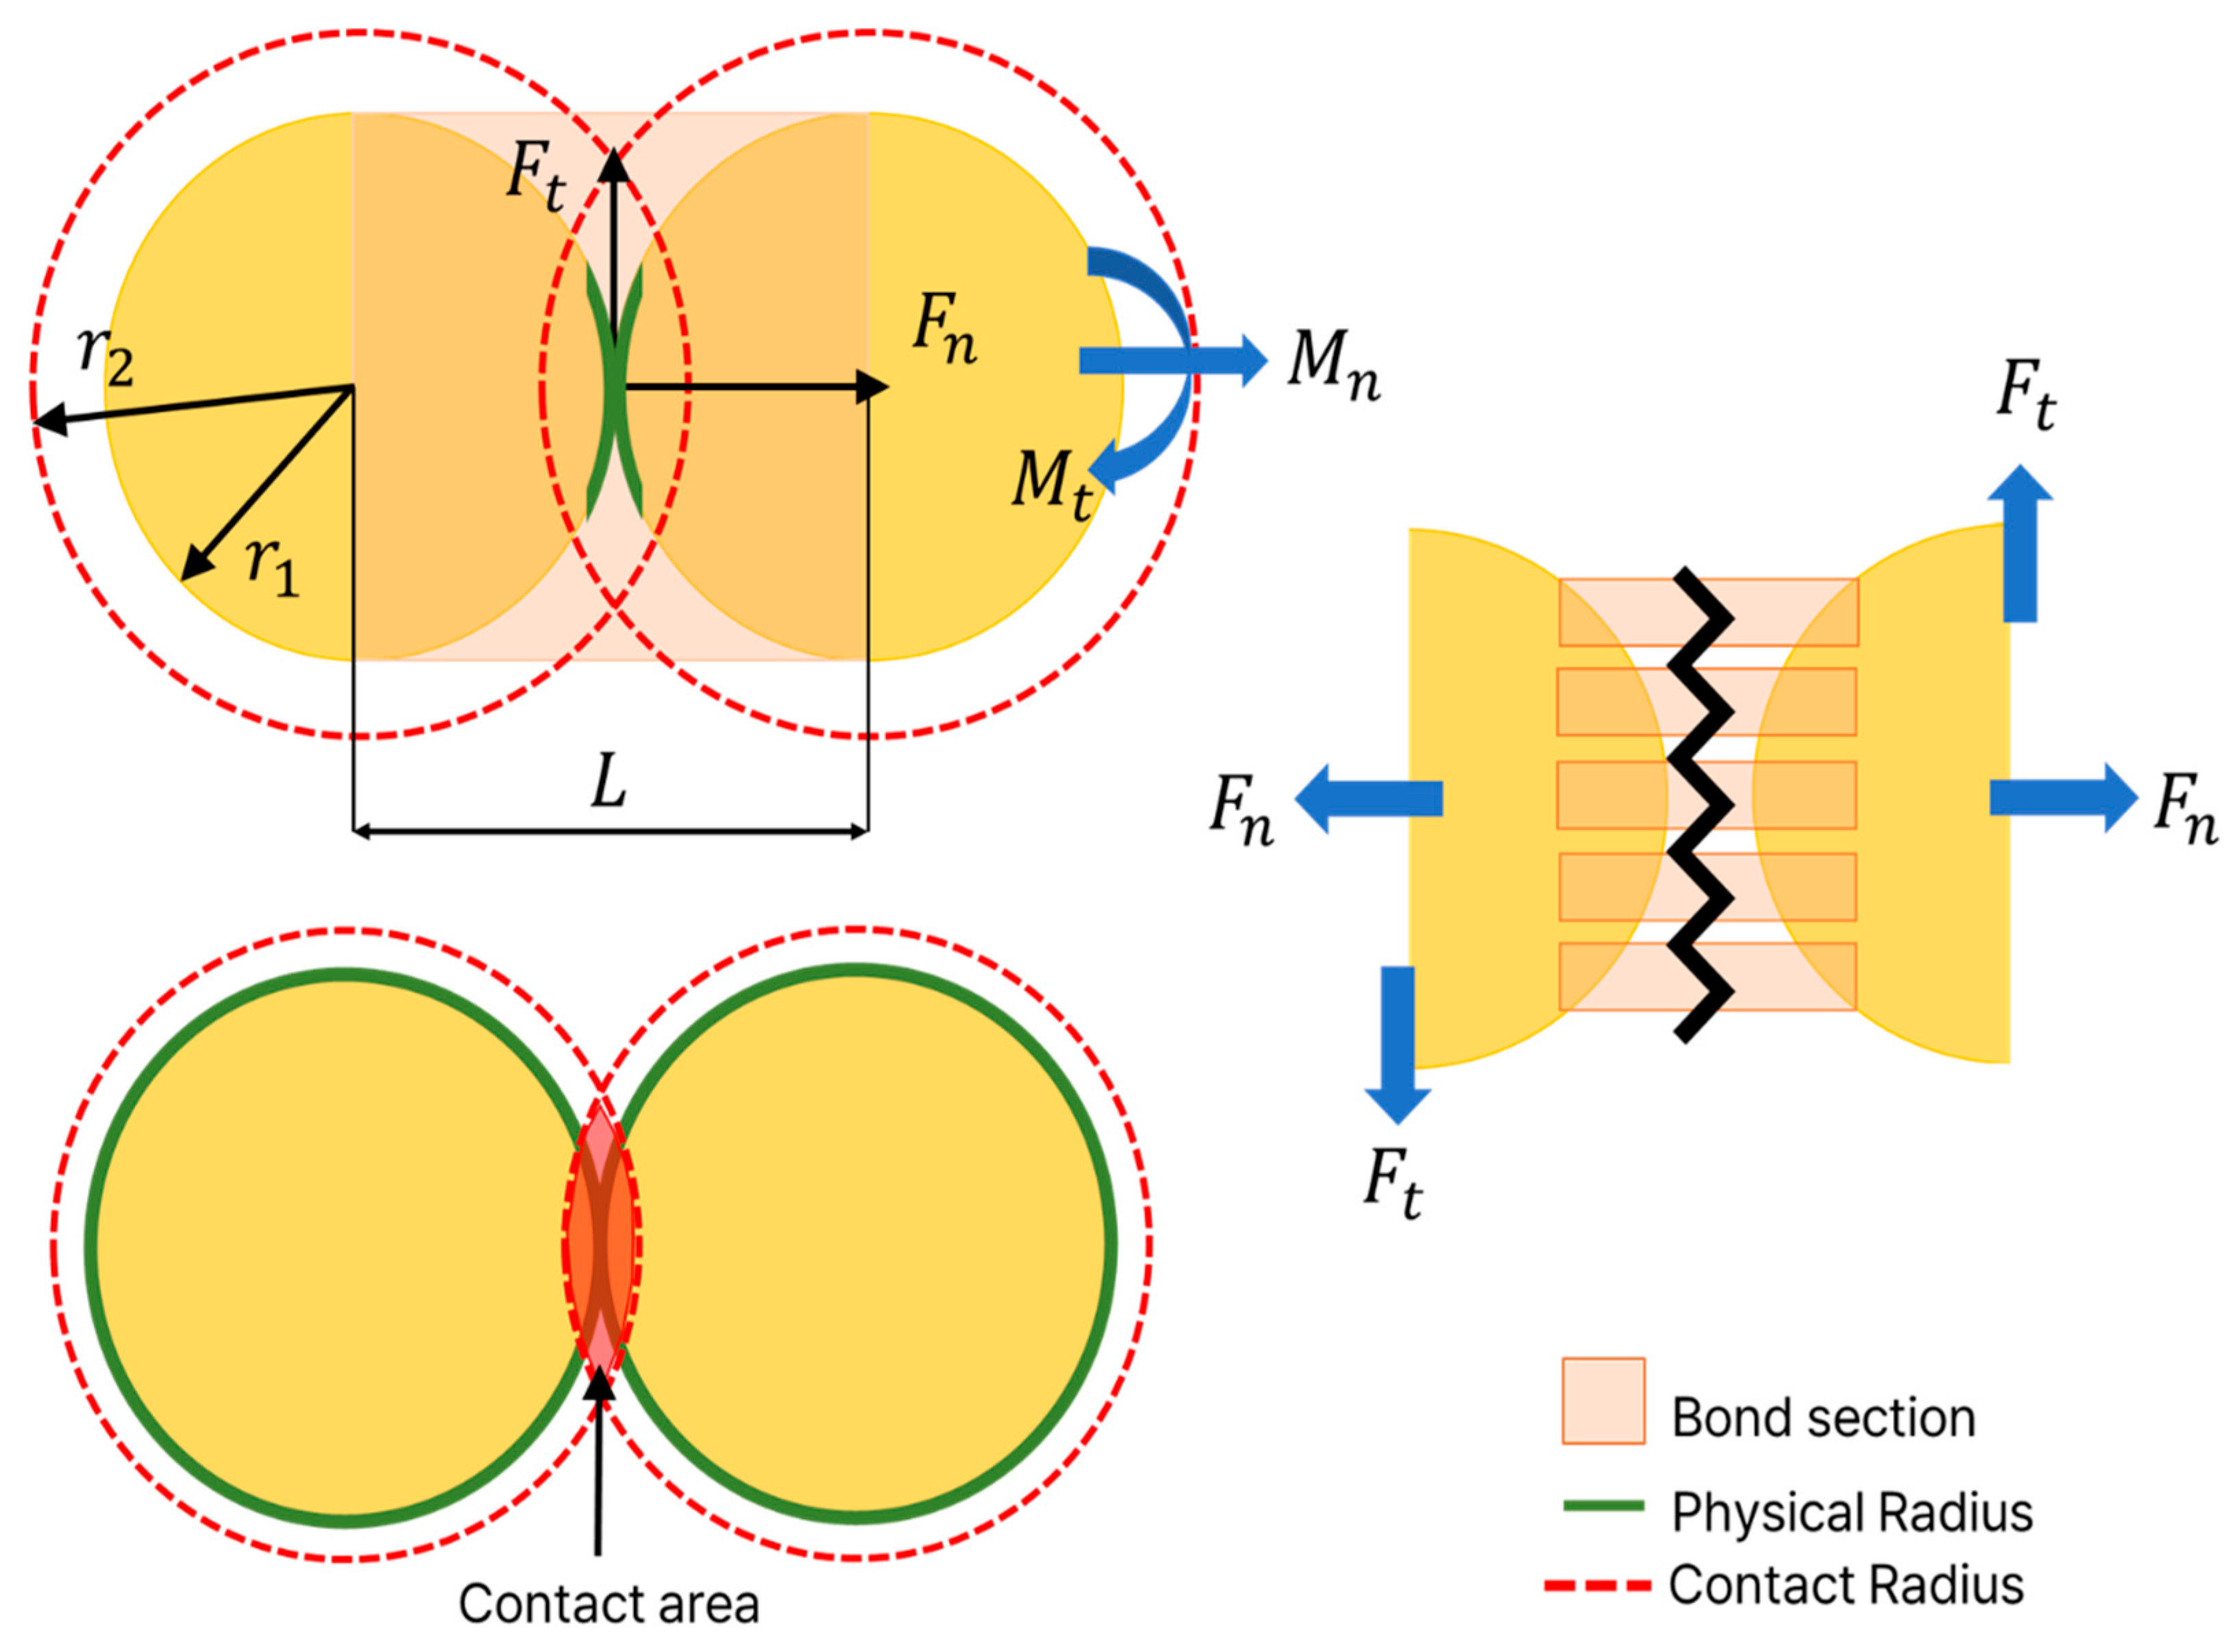
In this study, a Bonded Particle Model (BPM) was used to model rice straw. The BPM is an inter-particle interaction model used in the DEM, which allows particles to remain bonded within a certain distance even without direct physical contact. This model is well-suited for simulating internal bonding forces in materials with continuum-like behavior, such as plant stems, wood, and rocks [24,25]. The BPM consists of three main components: a bond zone, a spring–moment system, and unit stiffness. These components are used to calculate actual forces and stresses within the bonded structure. The particle motion and interactions in the BPM are described through equations for force and moment increments, as well as stress-based failure criteria. These equations are presented in Equations (1)–(4) [26].
  • Force and Moment Accumulation (Incremental Force and Moment)
The bond between particles is modeled as an elastic interaction that accumulates normal and tangential forces, as well as bending and twisting moments, based on their relative motion at each time step t . The incremental force and moment updates are defined in Equations (1) and (2):
δ F n =   v n S n A t , δ F t =   v t S t A t  
δ M n = ω n S n J t , δ M t = ω n S n J 2 t
v n and v t represent the relative velocities in the normal and tangential directions (m/s), respectively. ω n and ω t are the relative angular velocities (rad/s). S n and S t denote the normal and tangential unit stiffness values (N/m3), respectively. A = π R B 2 is the bonded cross-sectional area, and J = 1 2 π R B 4 is the polar moment of inertia, where R B is the bond radius. In this study, the bond radius R B was determined based on the particle size used to represent the straw wall. Since the particles approximate the wall thickness of the hollow straw cross-section, R B was defined as a fixed fraction of the particle radius to ensure that the bonded area reflects the mechanically active region of the straw wall. This method is widely adopted in DEM simulations of hollow plant stems, where fractures typically initiate along the outer wall and propagate symmetrically.
The force increments were computed using a time-discretized form of Hooke’s law, in which force changes are expressed in terms of relative velocity and time step rather than displacement. Meanwhile, the moment increments capture the rotational resistance generated between bonded particles.
2.
Stress-based Bond Breakage Criterion
The stress within the bond is calculated based on the accumulated force and moment, and the bond is broken once the maximum tensile or shear stress exceeds the allowable limit. The combined stresses are expressed as Equations (3) and (4):
σ m a x = F n A + 2 M t J R B  
τ m a x = F t A + M n J R B
The first term in each expression corresponds to the average stress due to direct force, while the second term accounts for additional stress induced by bending (in the case of σ m a x )and twisting (for τ m a x ). If either of these exceeds the material’s tensile or shear strength, the bond is considered to have failed, and the particles are disconnected. The bonding model described by these equations reproduces the elastic and failure behavior of materials through inter-particle bonding. It can effectively represent the elastic and fracture behavior of continuous or fibrous materials using discrete particles. It also includes both translational and rotational resistance, allowing for detailed simulation of structural deformation (Figure 6).

2.3. DEM-Based Prediction of Tensile and Shear Strength

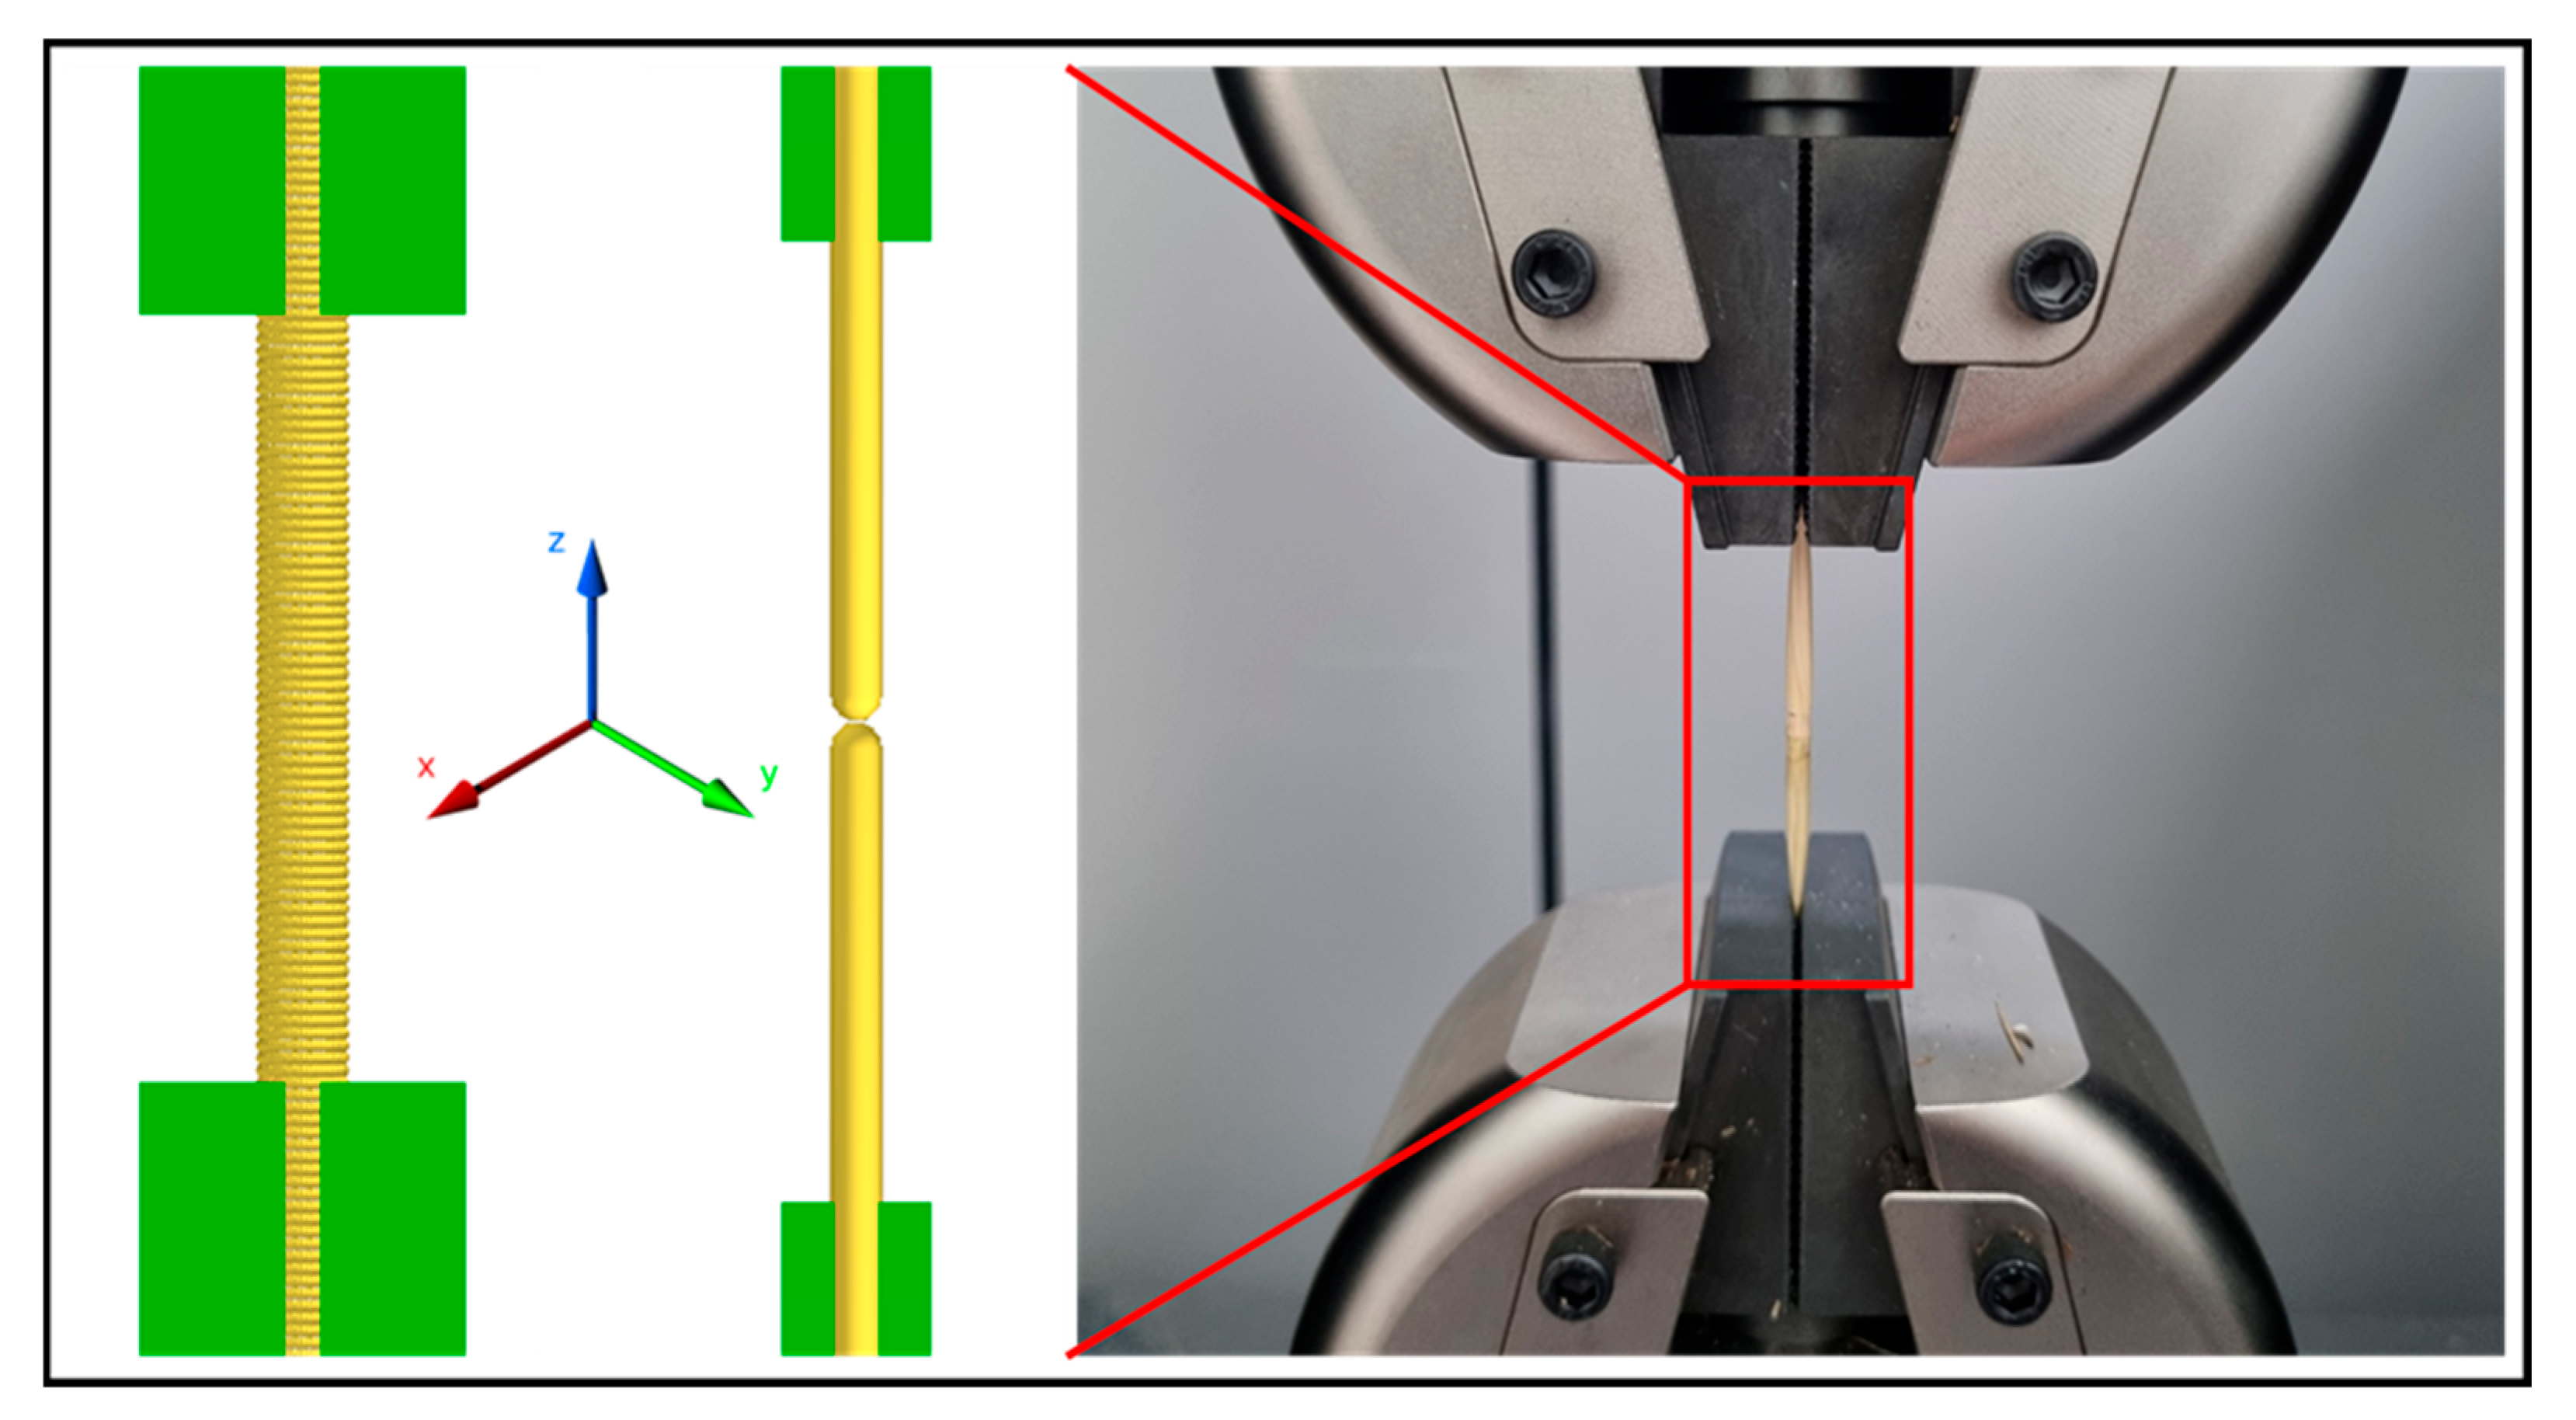
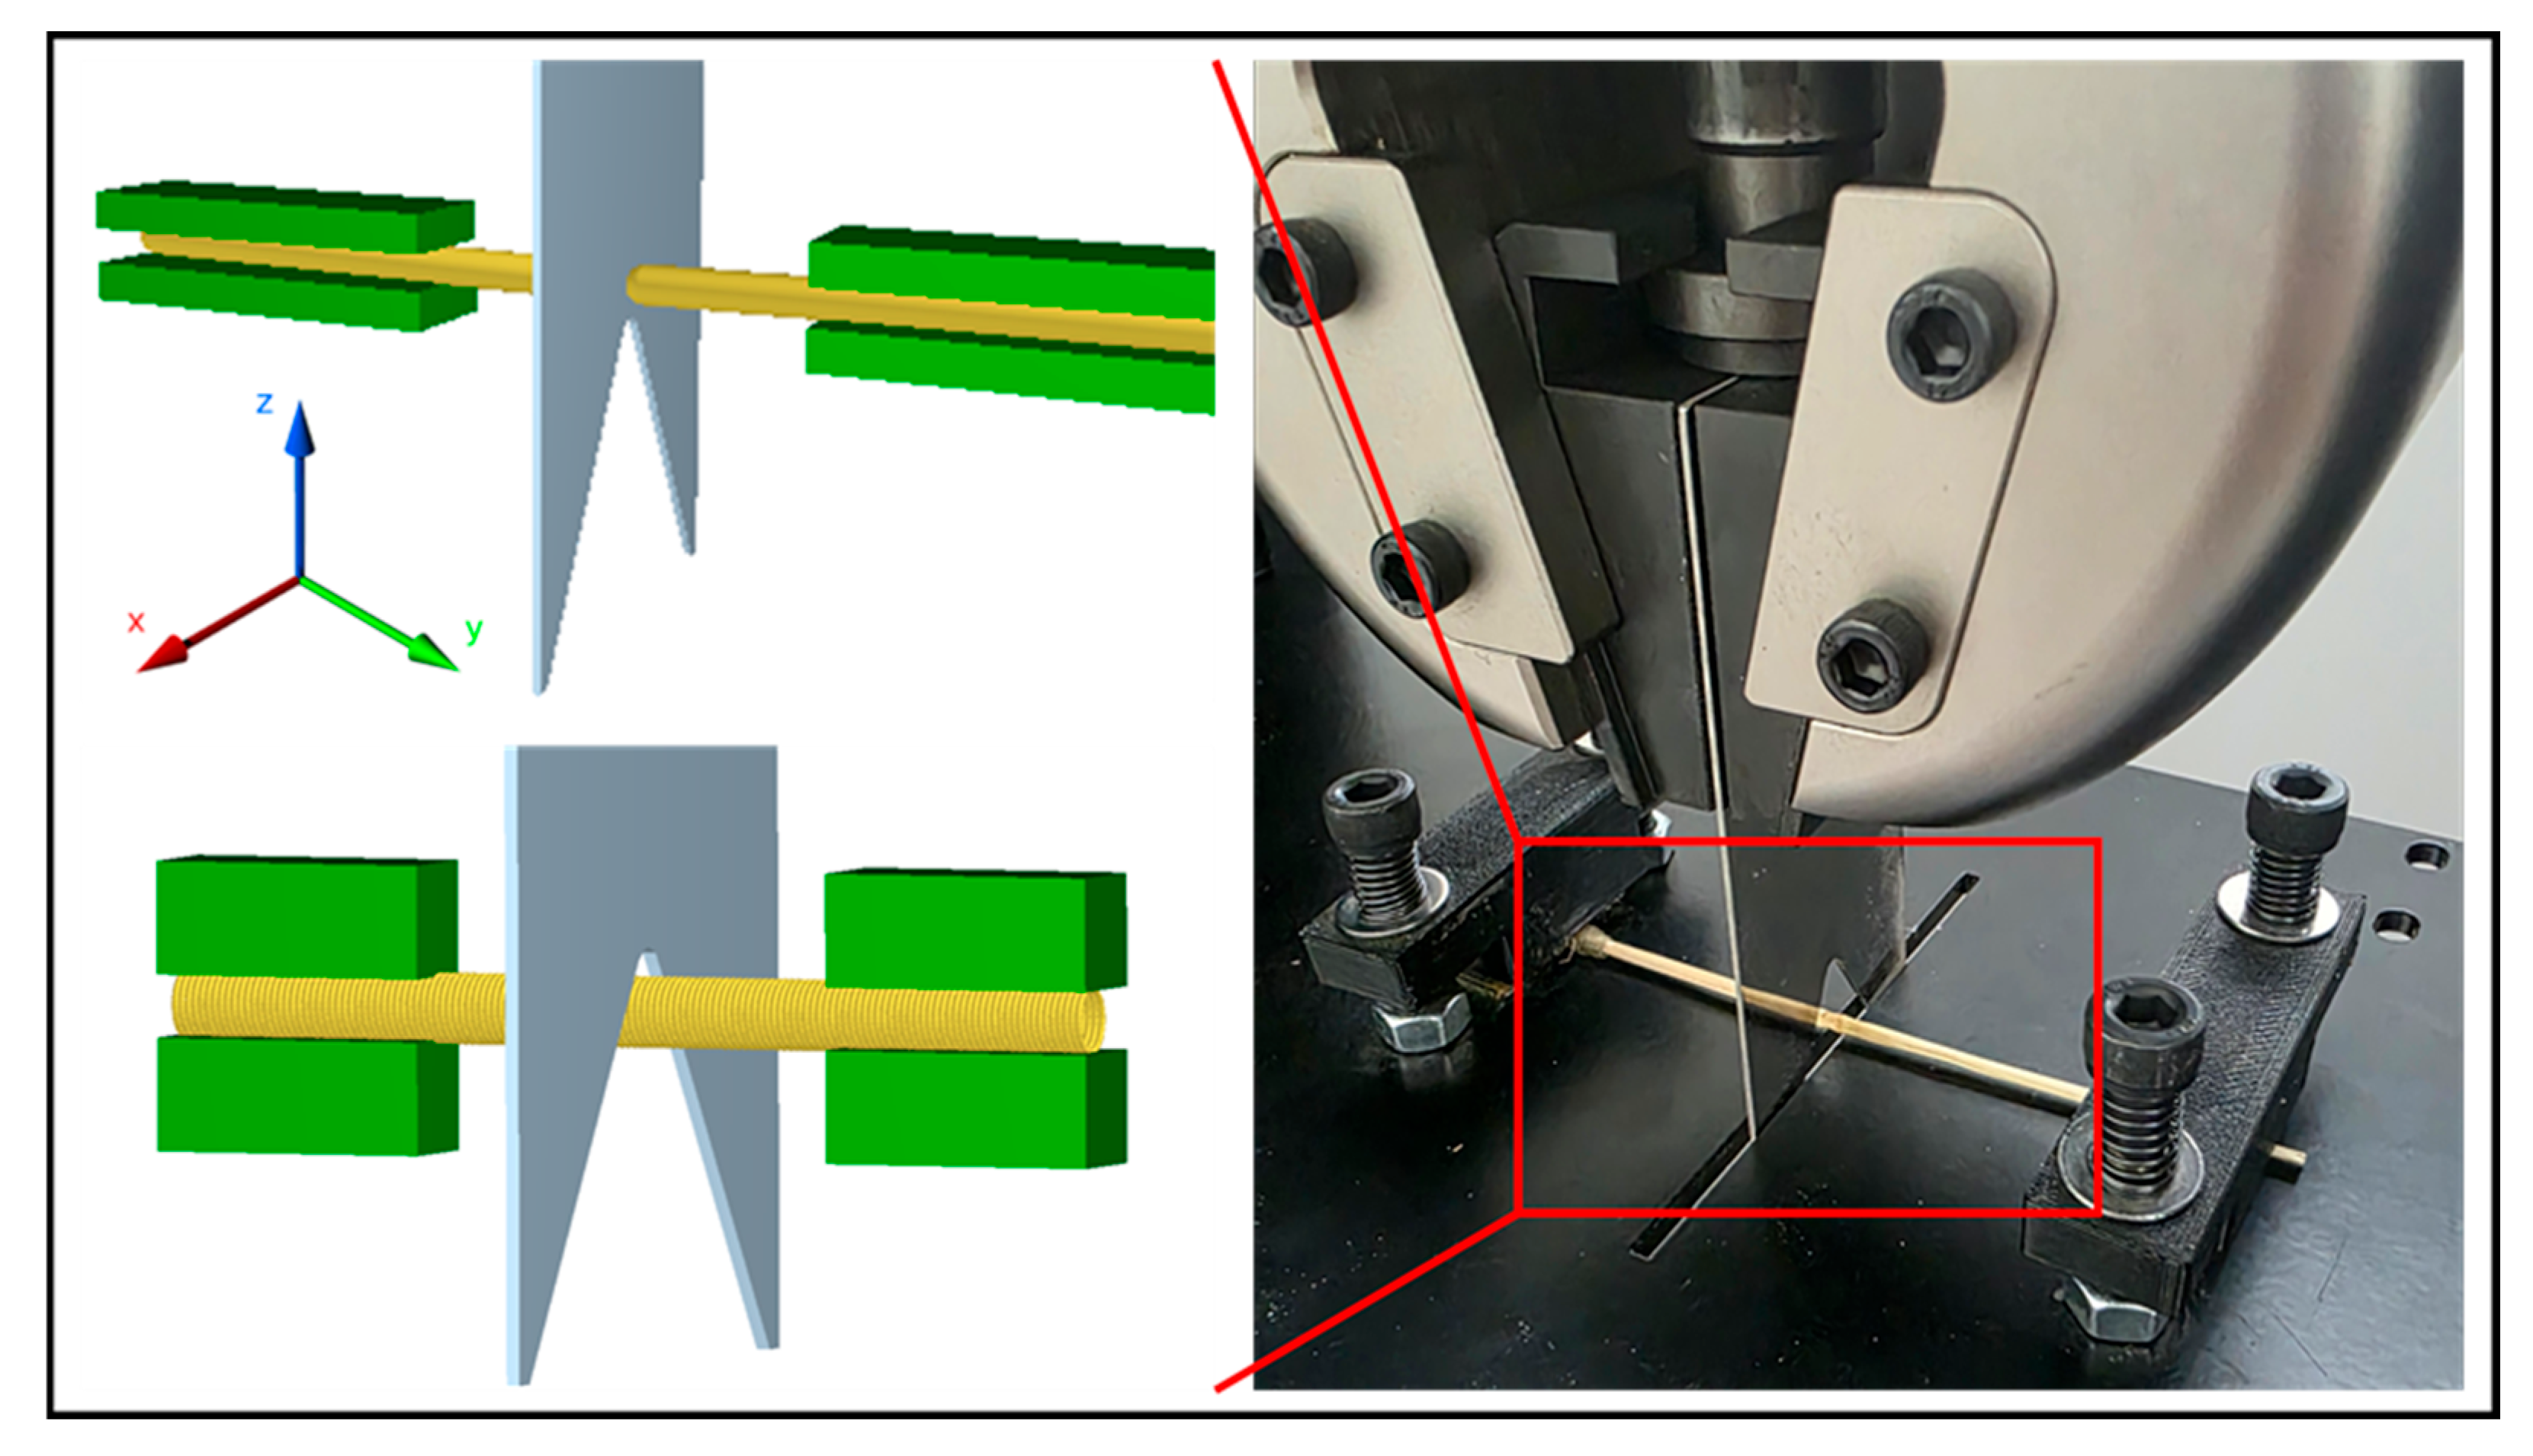
The discrete element method (DEM) simulation environment was configured as illustrated in Figure 7 and Figure 8 to predict tensile and shear loads. The modeling parameters listed in Table 1 and Table 2 were directly applied, and the resulting peak loads were compared with experimental measurements to validate the parameter set.
The tensile test was performed as shown in Figure 7. Four geometry boxes were created, and motion was applied to each box along the Y-axis to secure the rice straw. Following the actual experimental conditions, two of the boxes were fixed to hold the rice straw, while the remaining two were moved along the Z-axis at a speed of 10 mm/min to apply tensile force.
The shear test was performed as shown in Figure 8. The rice straw was first secured using four geometry boxes, following the same setup as the tensile test. The Warner–Bratzler shear blade was modeled as a 1:1 scale CAD file and imported into the virtual simulation environment. Shear force was applied by moving the blade in the negative Z-direction at a speed of 10 mm/min.

3. Results

3.1. Rice Straw Properties Measurement Results

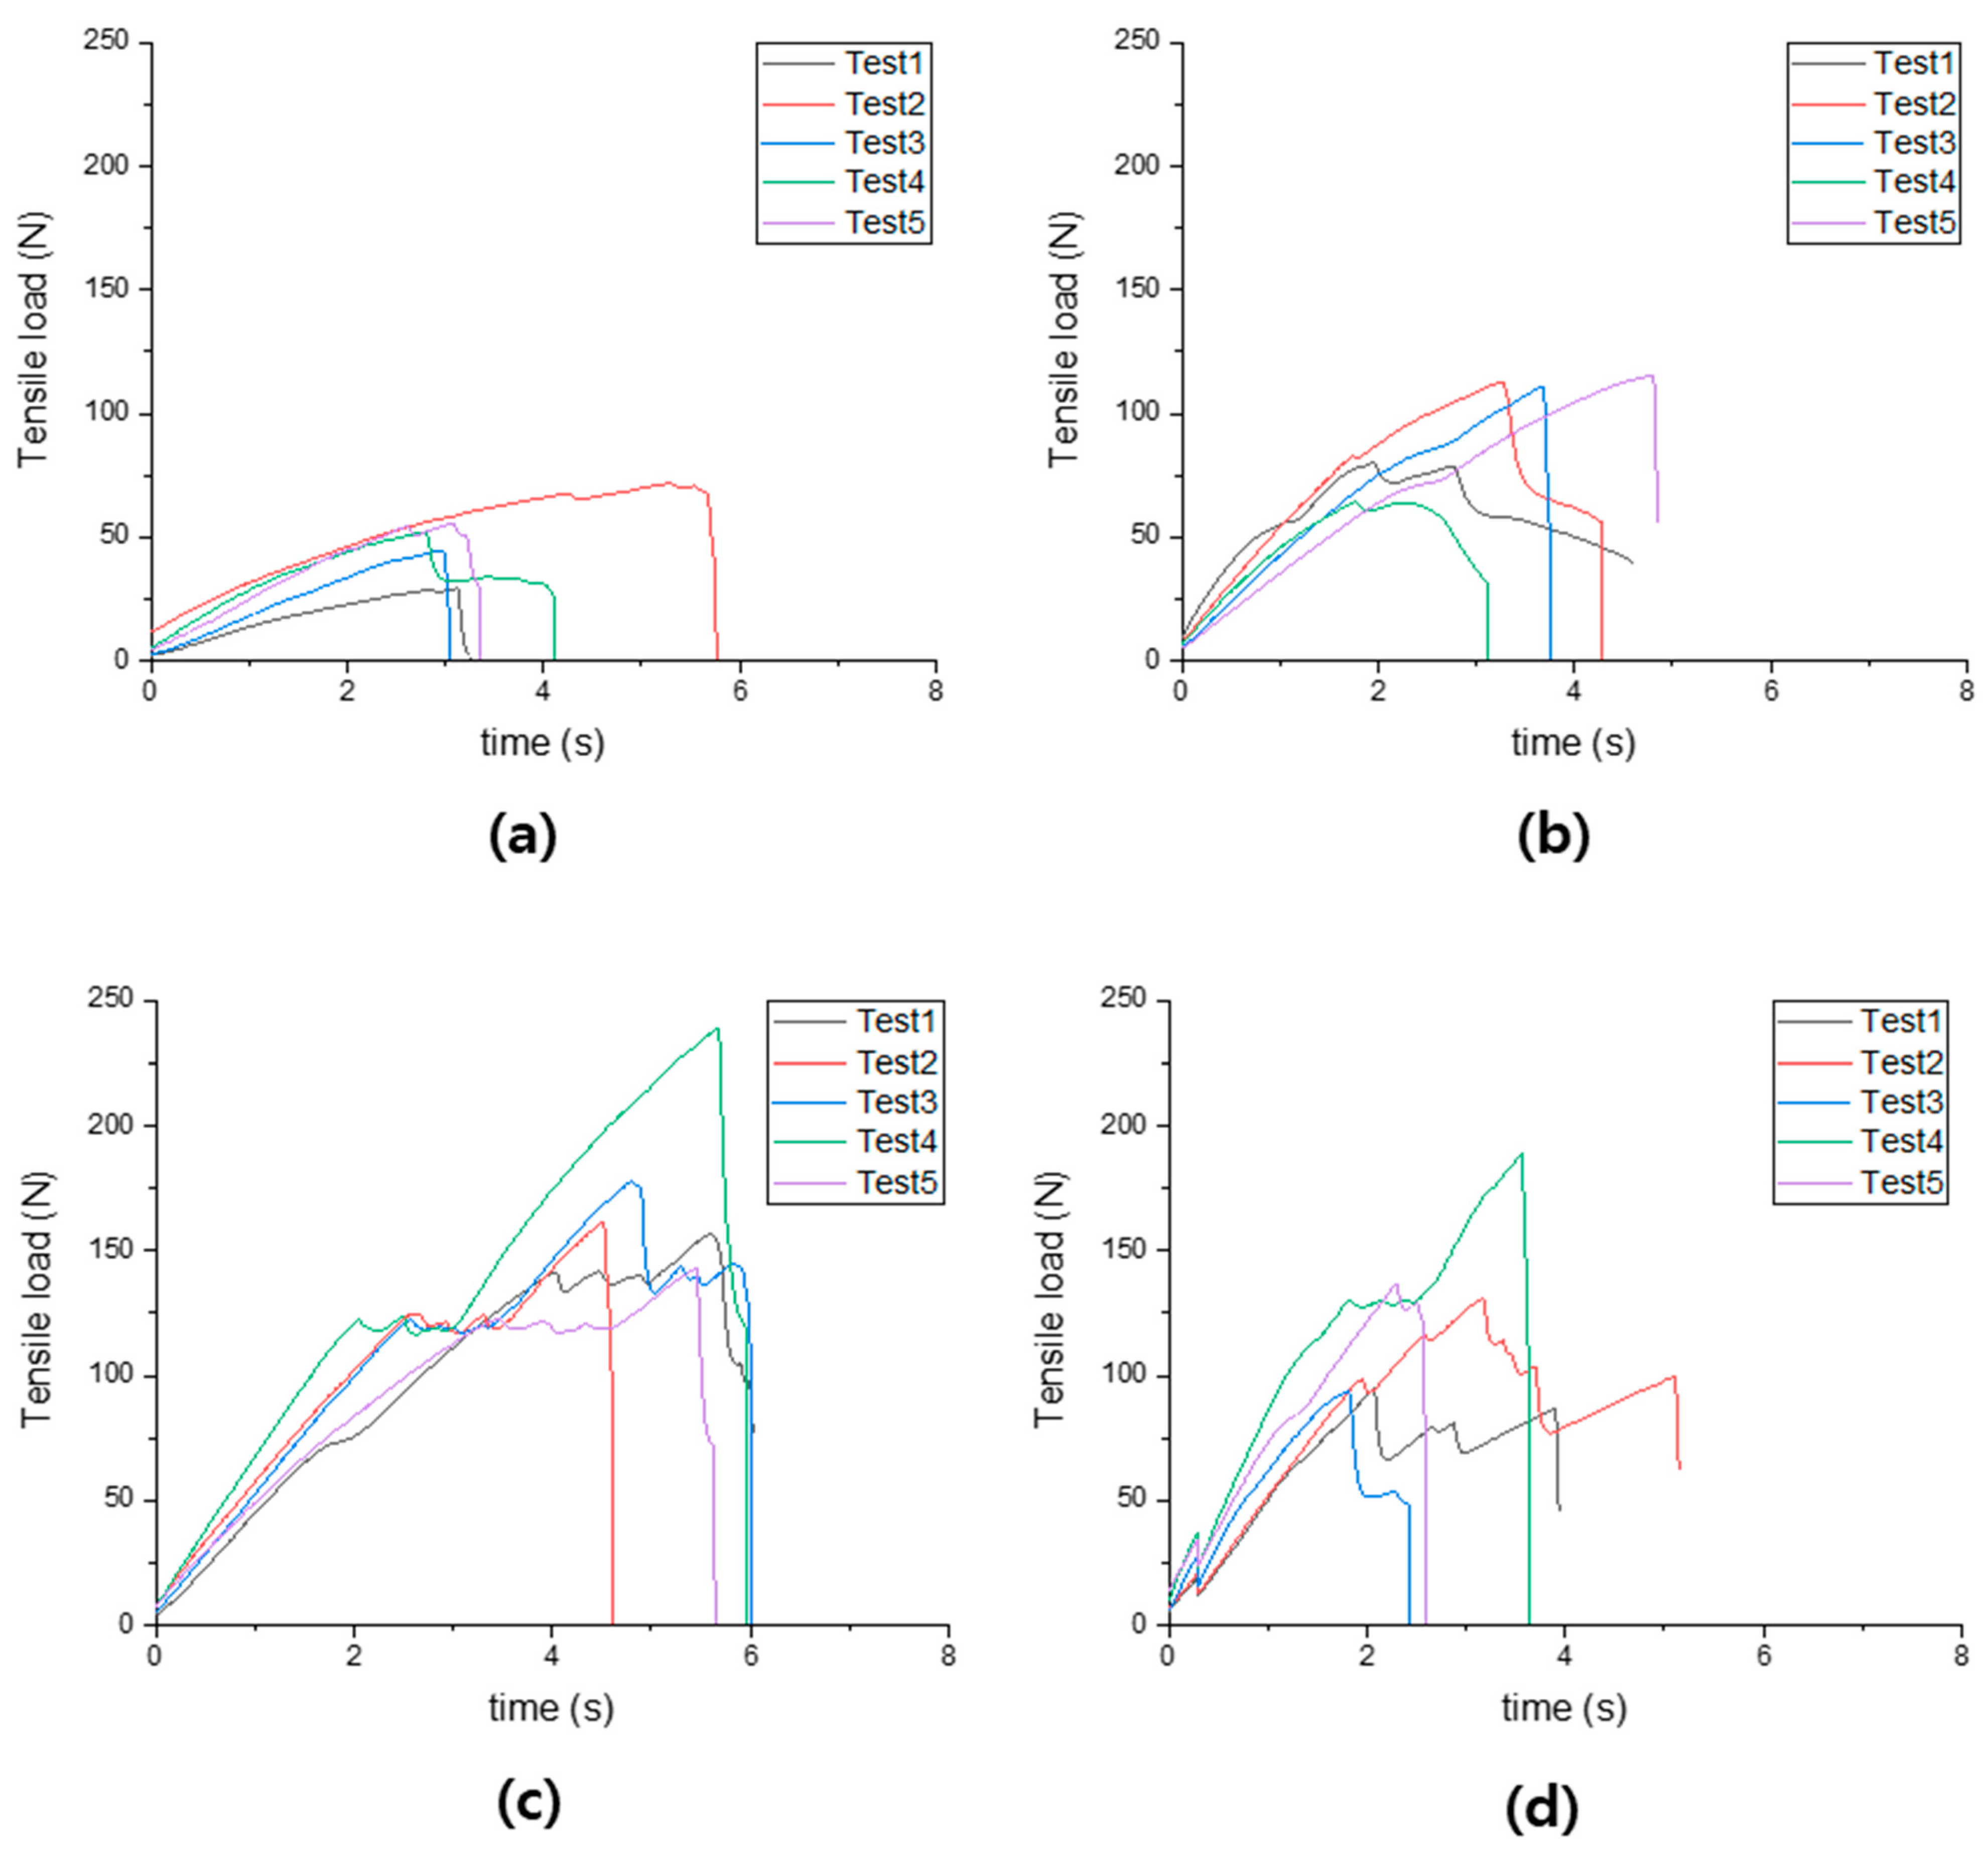
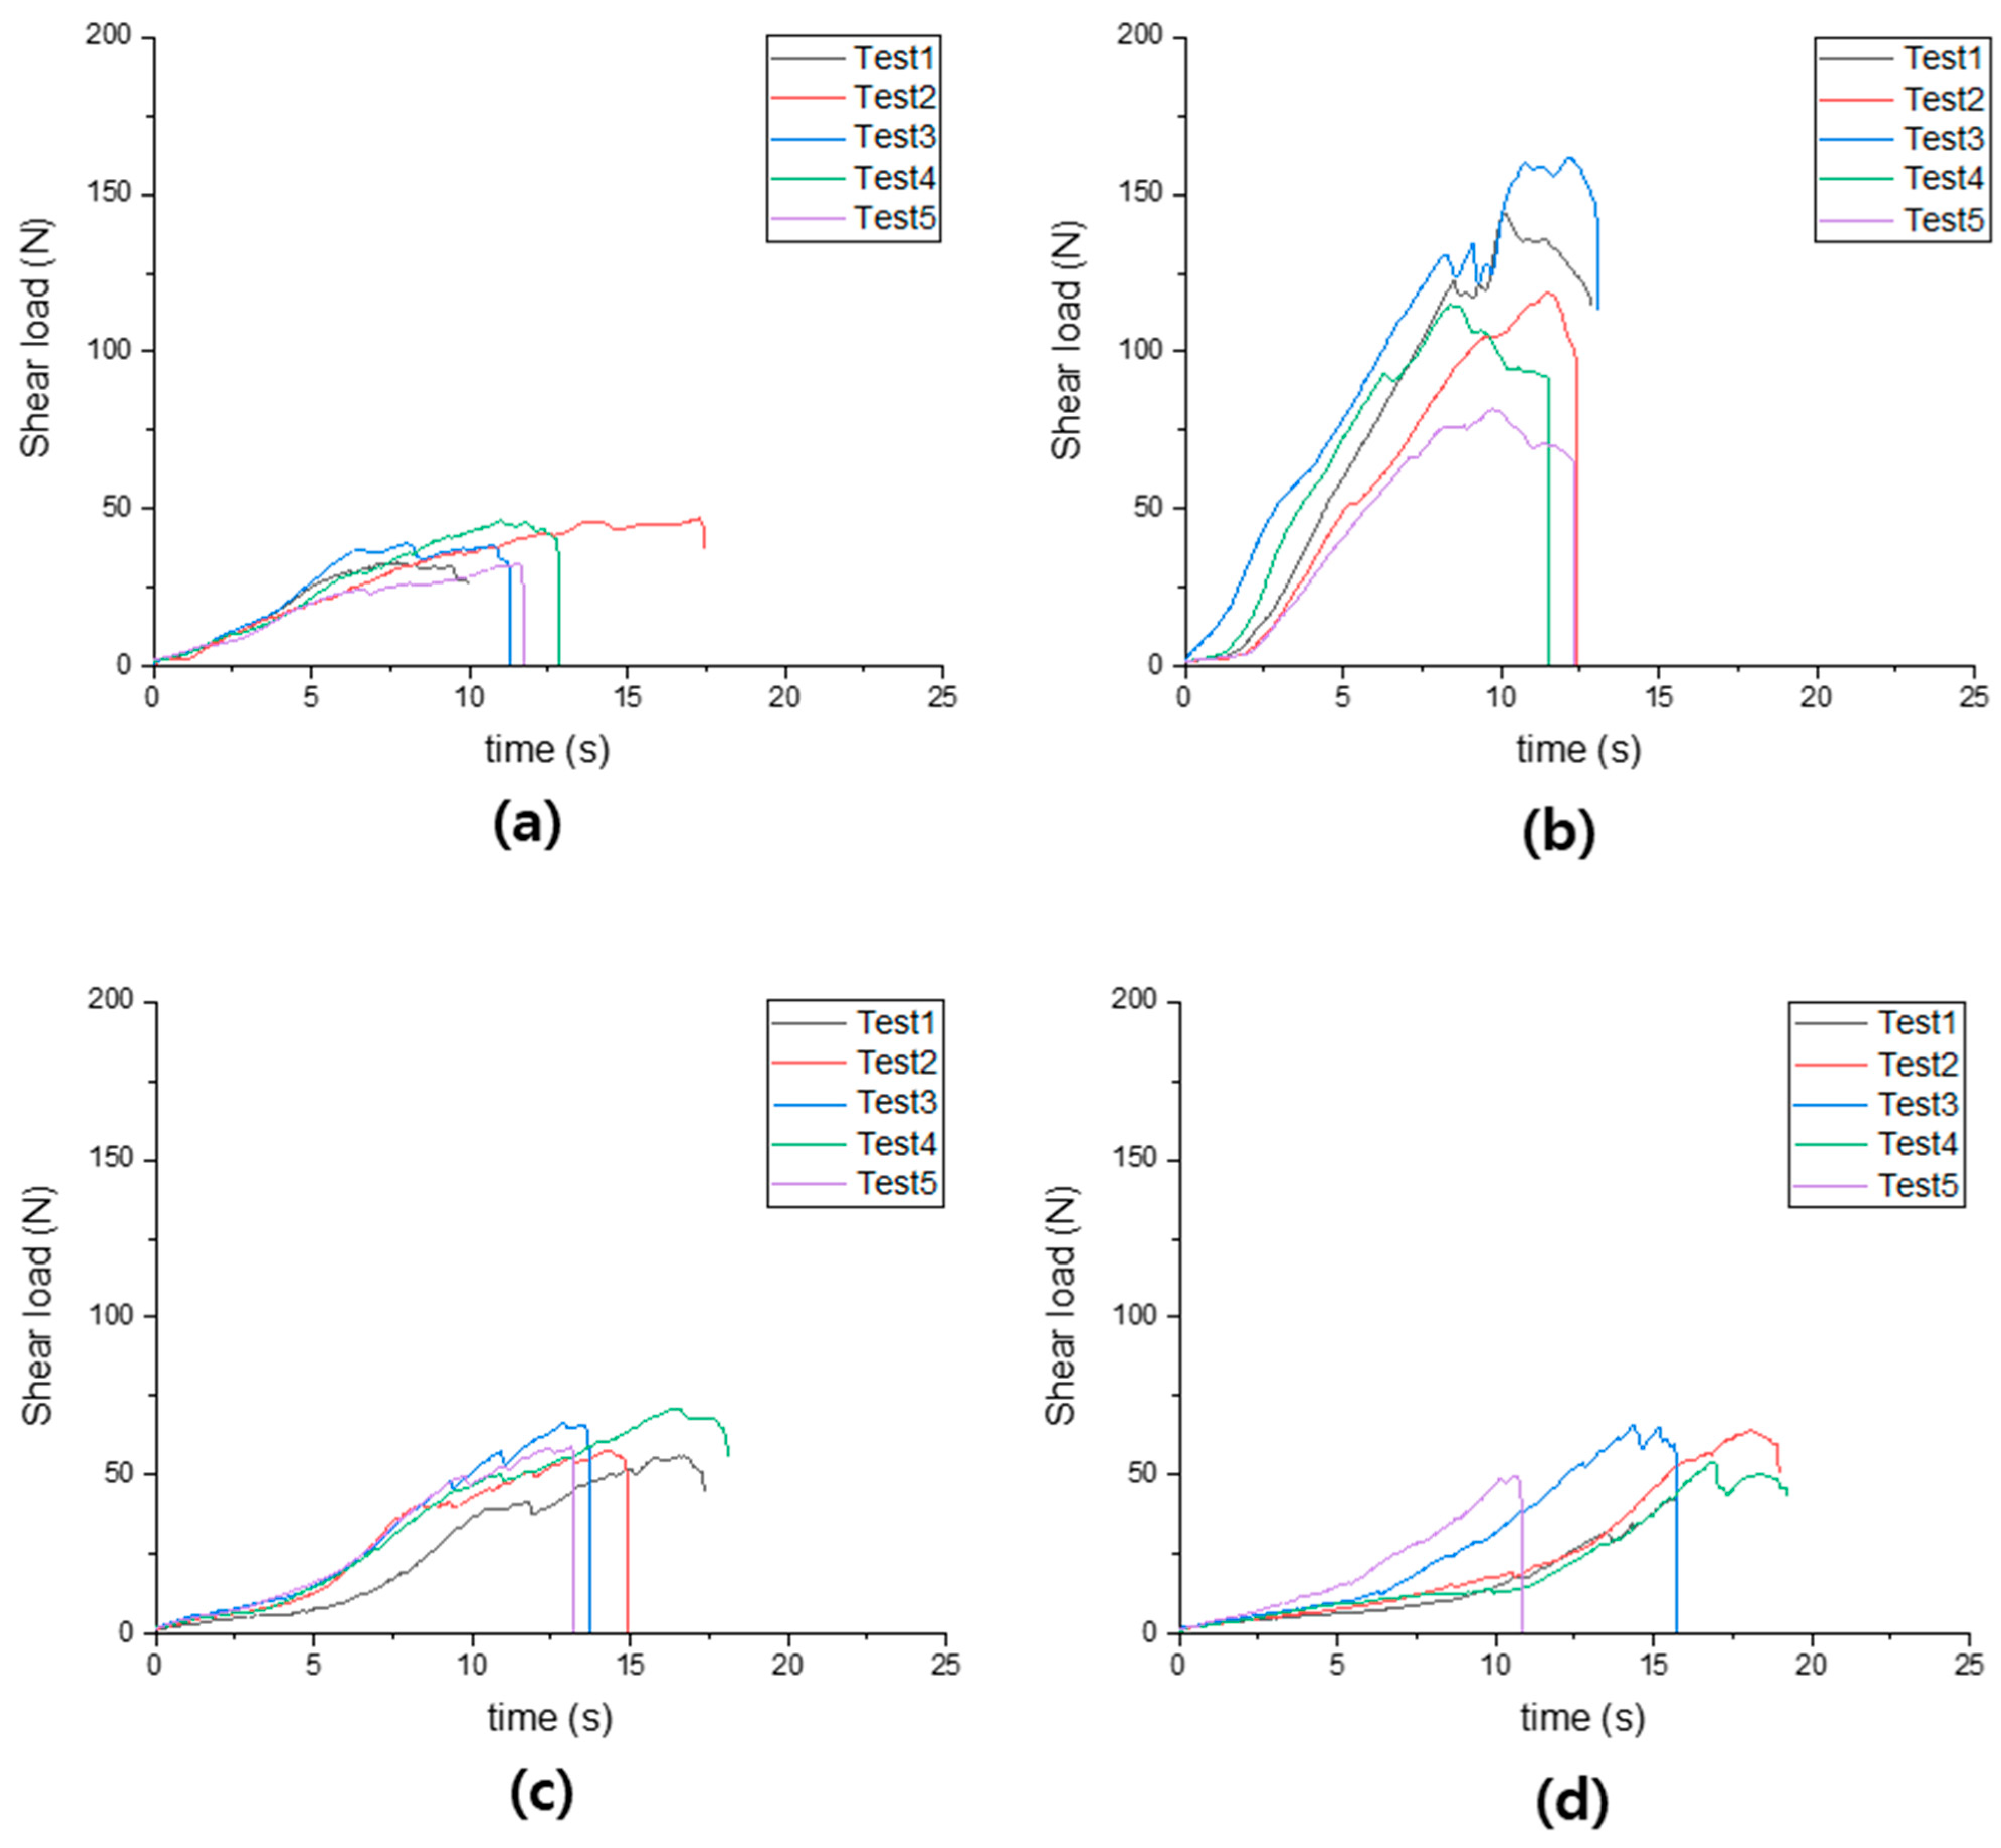
The measured mechanical properties of rice straw—tensile and shear load (N)—are presented in Figure 9 and Figure 10 and Table 3 and Table 4. The tensile test results showed the following order in maximum tensile force: Mid > Bottom > Node > Top, with the Mid section exhibiting the highest load at 239.27 N. In the shear test, the maximum load followed the order Node > Mid > Bottom > Top, with the Node section showing the highest shear resistance at 115.71 N.

Statistical Analysis of Sectional Differences on Rice Straw

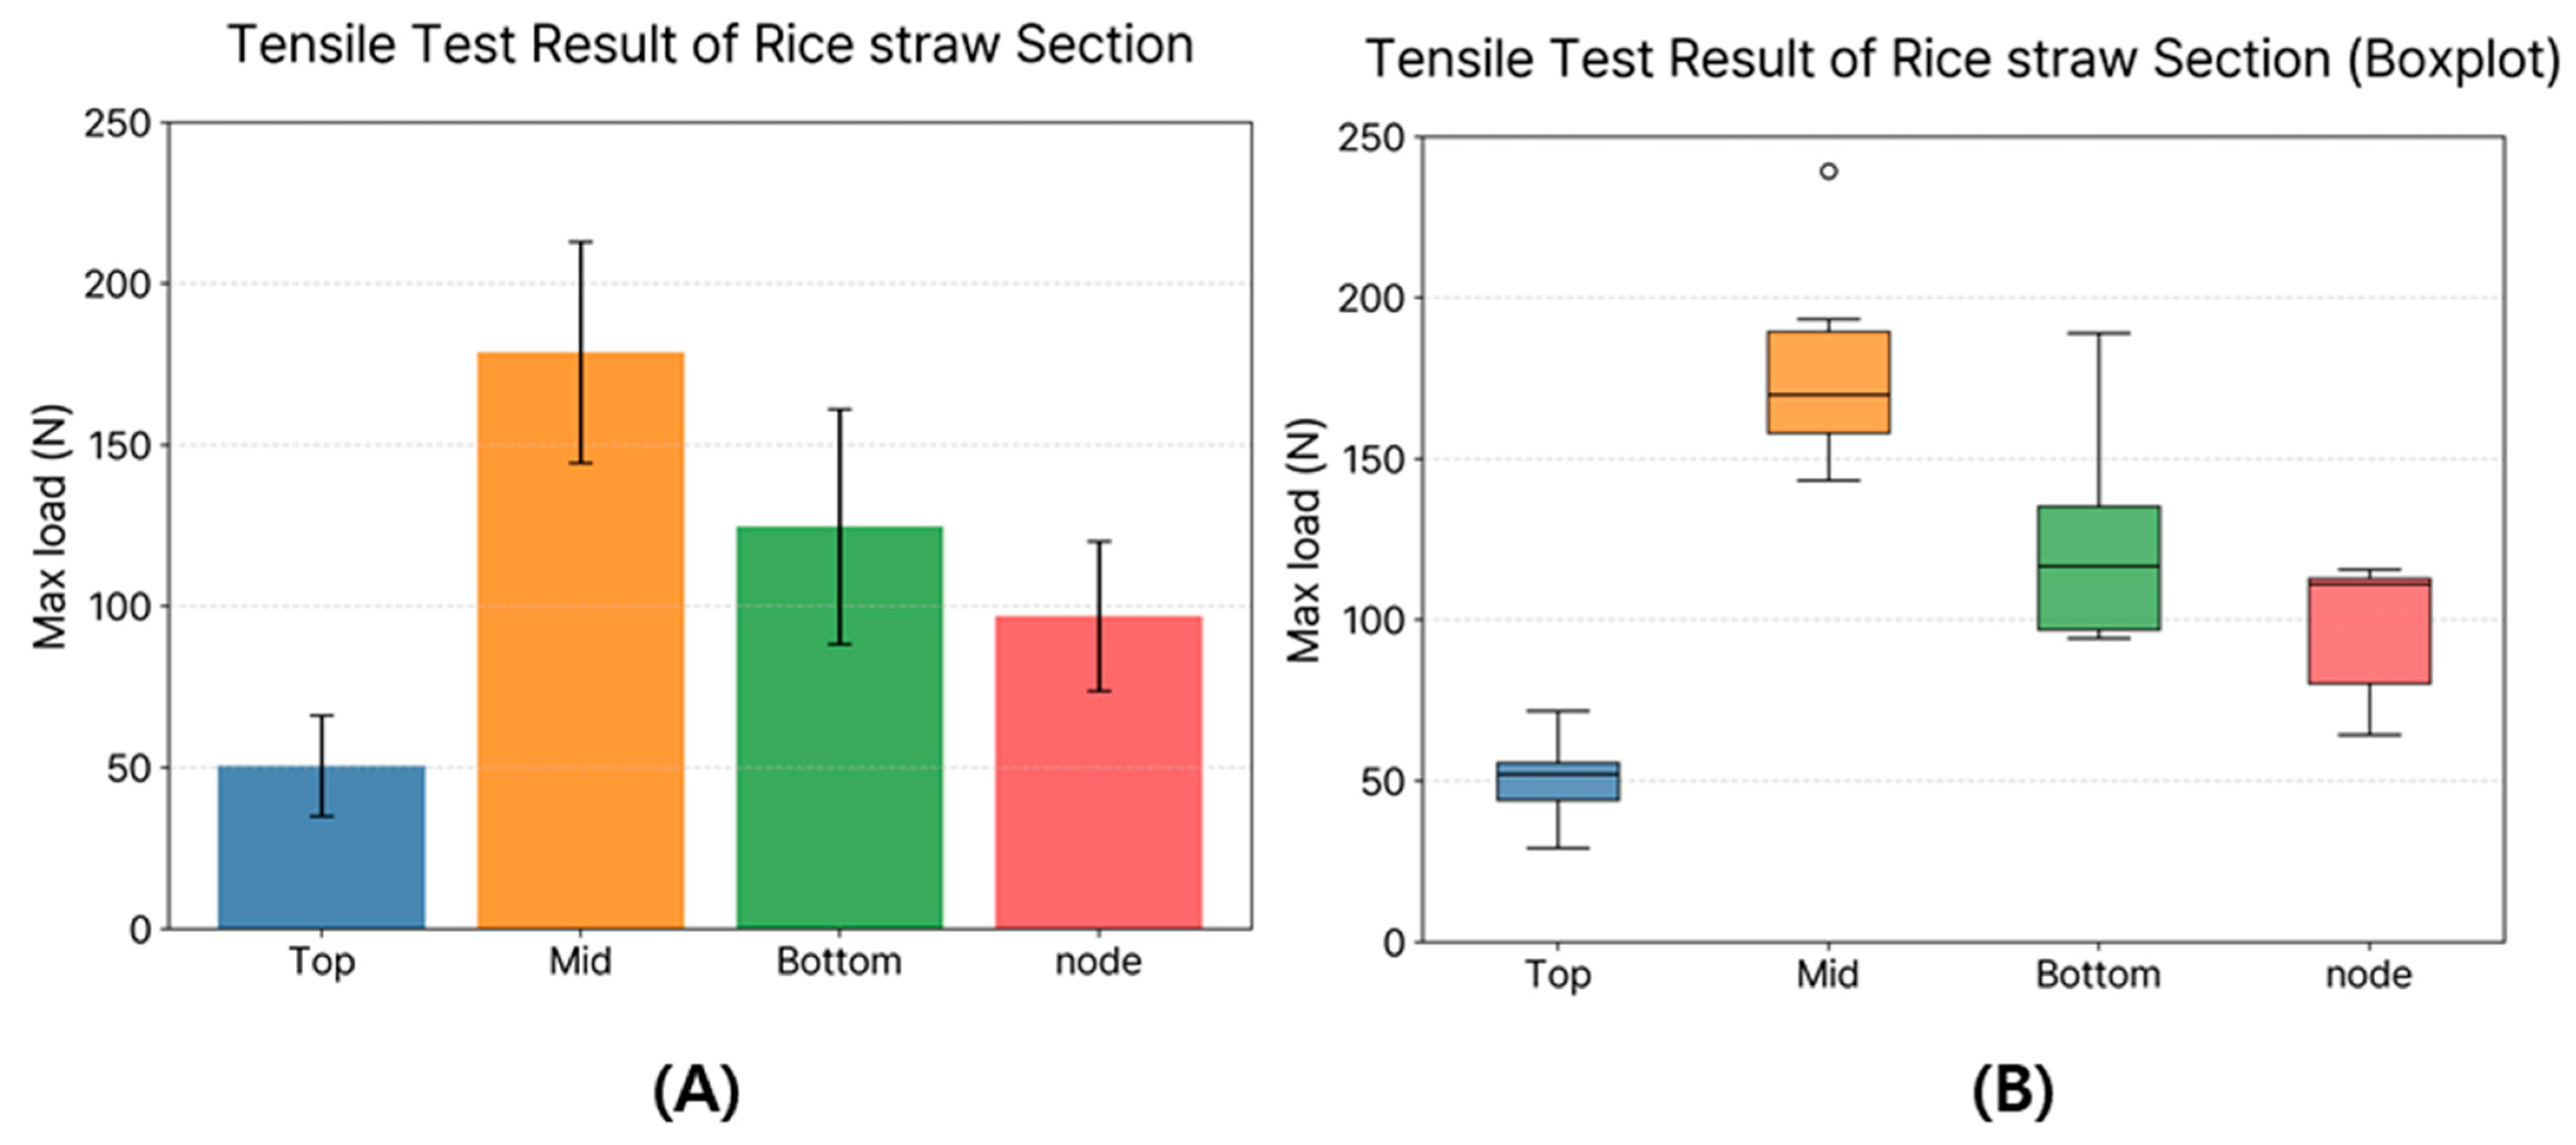
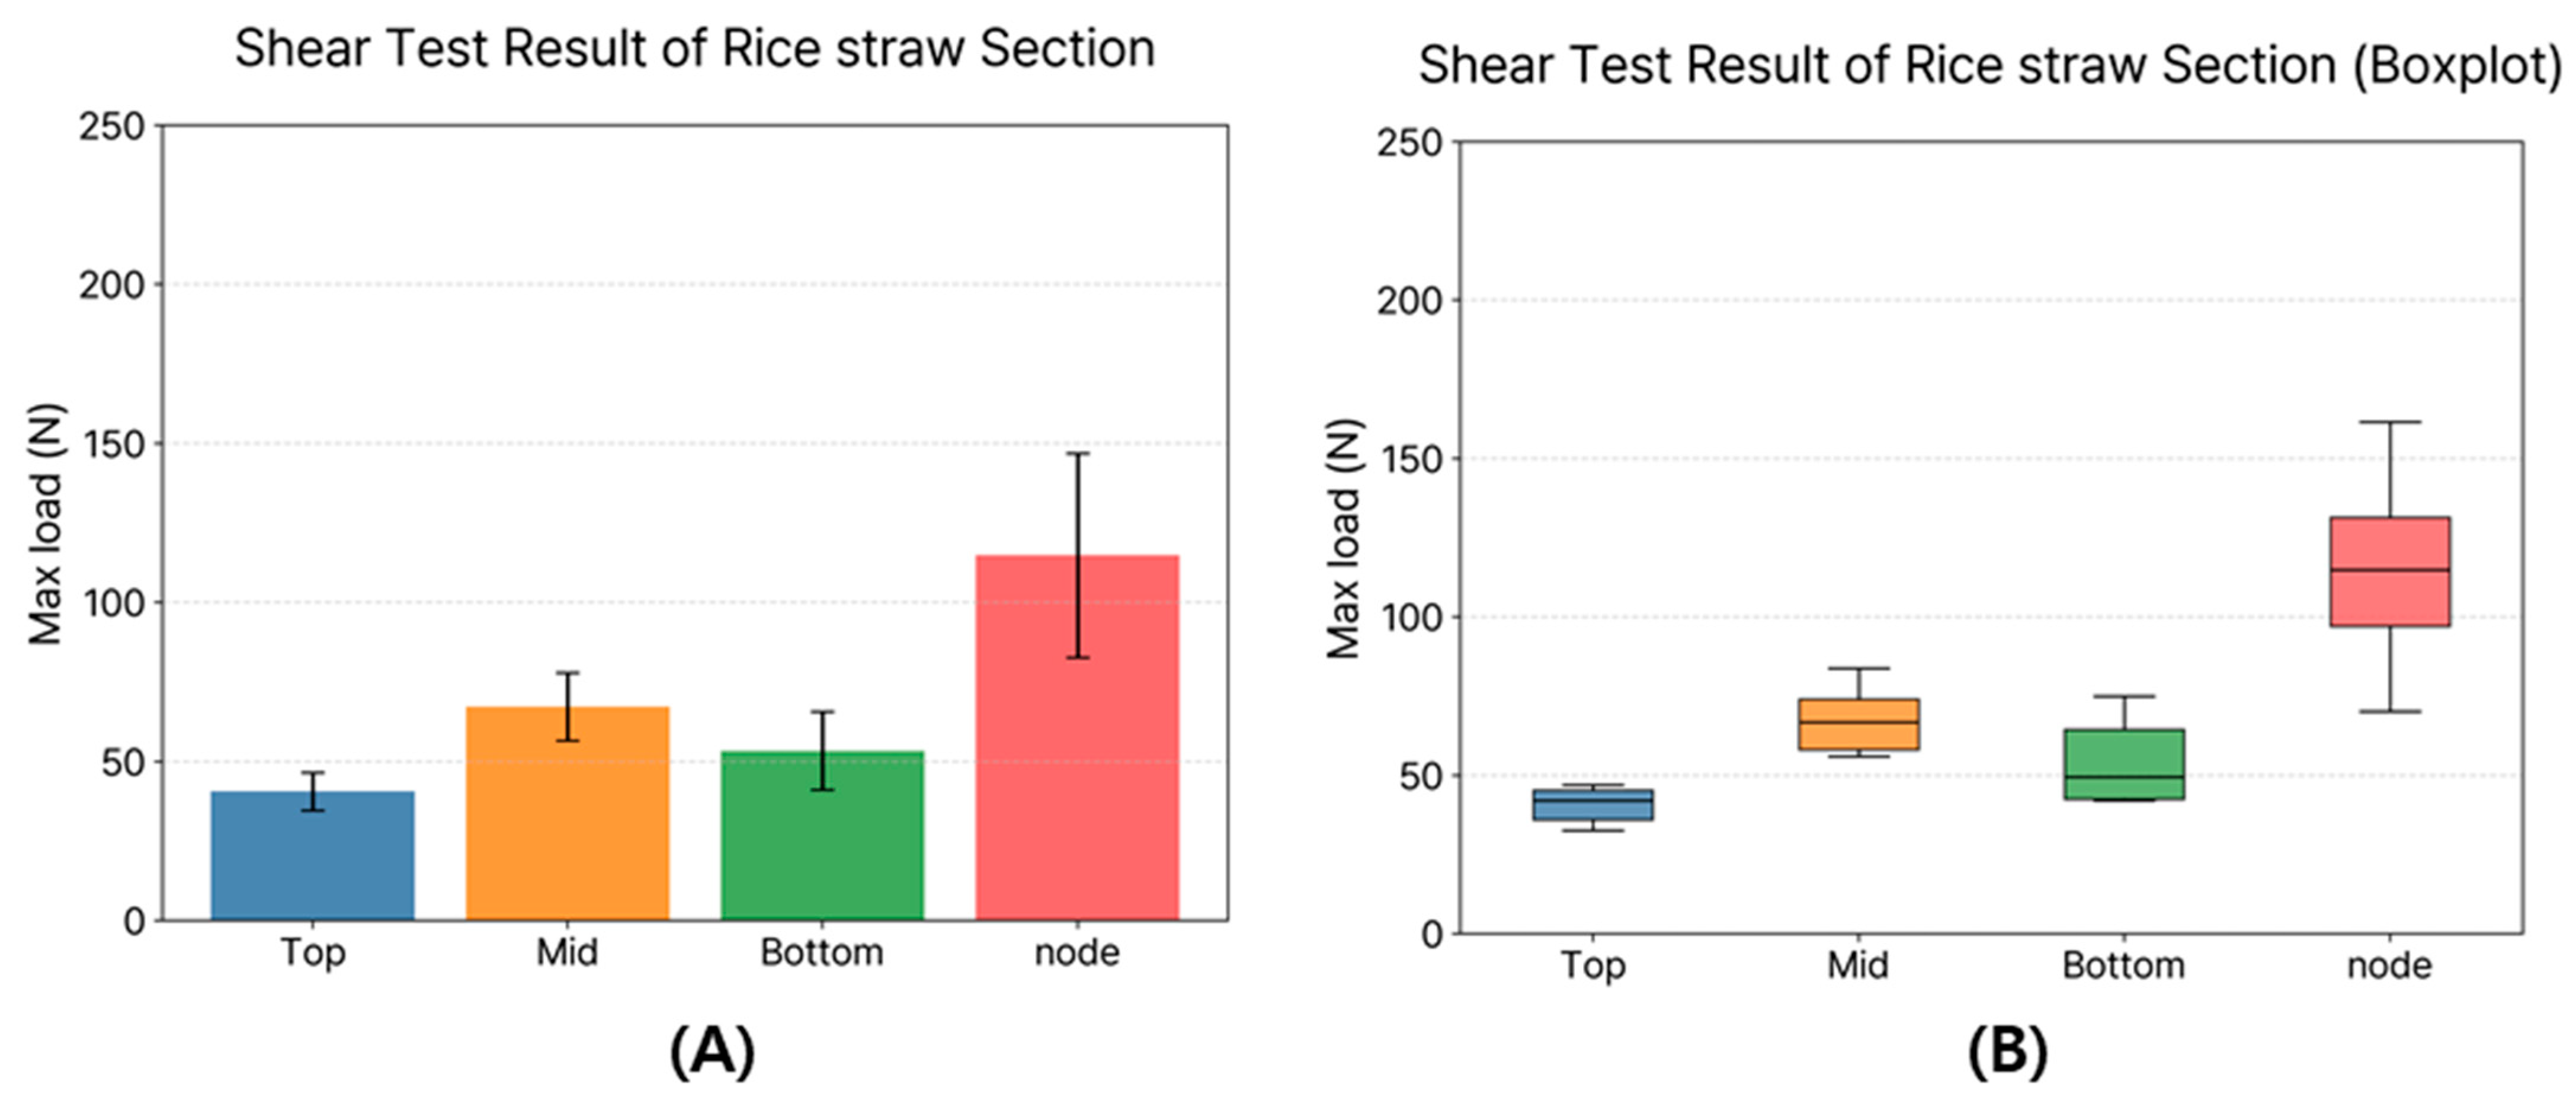
Figure 11 (tensile) and Figure 12 (shear) summarize peak load by section (Top, Mid, Node, Bottom). The left panels show mean ± SD (N), while the right panels show boxplots (median, interquartile range, whiskers at 1.5 × IQR; dots denote outliers).
A one-way ANOVA detected a significant section effect on peak tensile load (F = 18.12, p < 0.001). Tukey’s HSD (multiplicity-adjusted α = 0.05) indicated that Mid was consistently higher than the other sections, whereas Bottom and Node were statistically indistinguishable. Top formed the lowest tier. This pattern, Mid > (Bottom ≈ Node) > Top, is visually consistent across both the mean ± SD bars and the boxplots.
Peak shear load also showed a significant section effect (F = 23.61, p < 0.001). Node was highest in all pairwise comparisons, and Mid exceeded Top at α = 0.05. Bottom was not statistically separated from Mid or Top, yielding the overall ordering Node > Mid ≳ Bottom ≳ Top. The left and right panels convey the same ranking by emphasizing, respectively, means/dispersion and medians/distribution spread.
Tensile and shear peak loads differed significantly across sections (ANOVA, p < 0.001); Tukey’s HSD indicated Mid highest in tension and Node highest in shear, with Bottom statistically indistinguishable from Mid/Top in shear. These results suggest that the mechanical properties of each section should be individually considered when modeling rice straw.

3.2. Simulation Results and Validation of the DEM-Based Rice Straw Model

In this study, the simulation results were compared with experimental measurements using the average maximum tensile and shear loads presented in Table 4. Tensile and shear simulation outcomes for Model A (multi-particle) and Model B (single-particle), calibrated with the particle and contact parameters listed in Table 1 and Table 2, are summarized in Table 5 and Table 6. Model A achieved simulation accuracies ranging from 94.45% to 99.61%, while Model B showed accuracies between 96.14% and 98.76% when compared with experimental data.
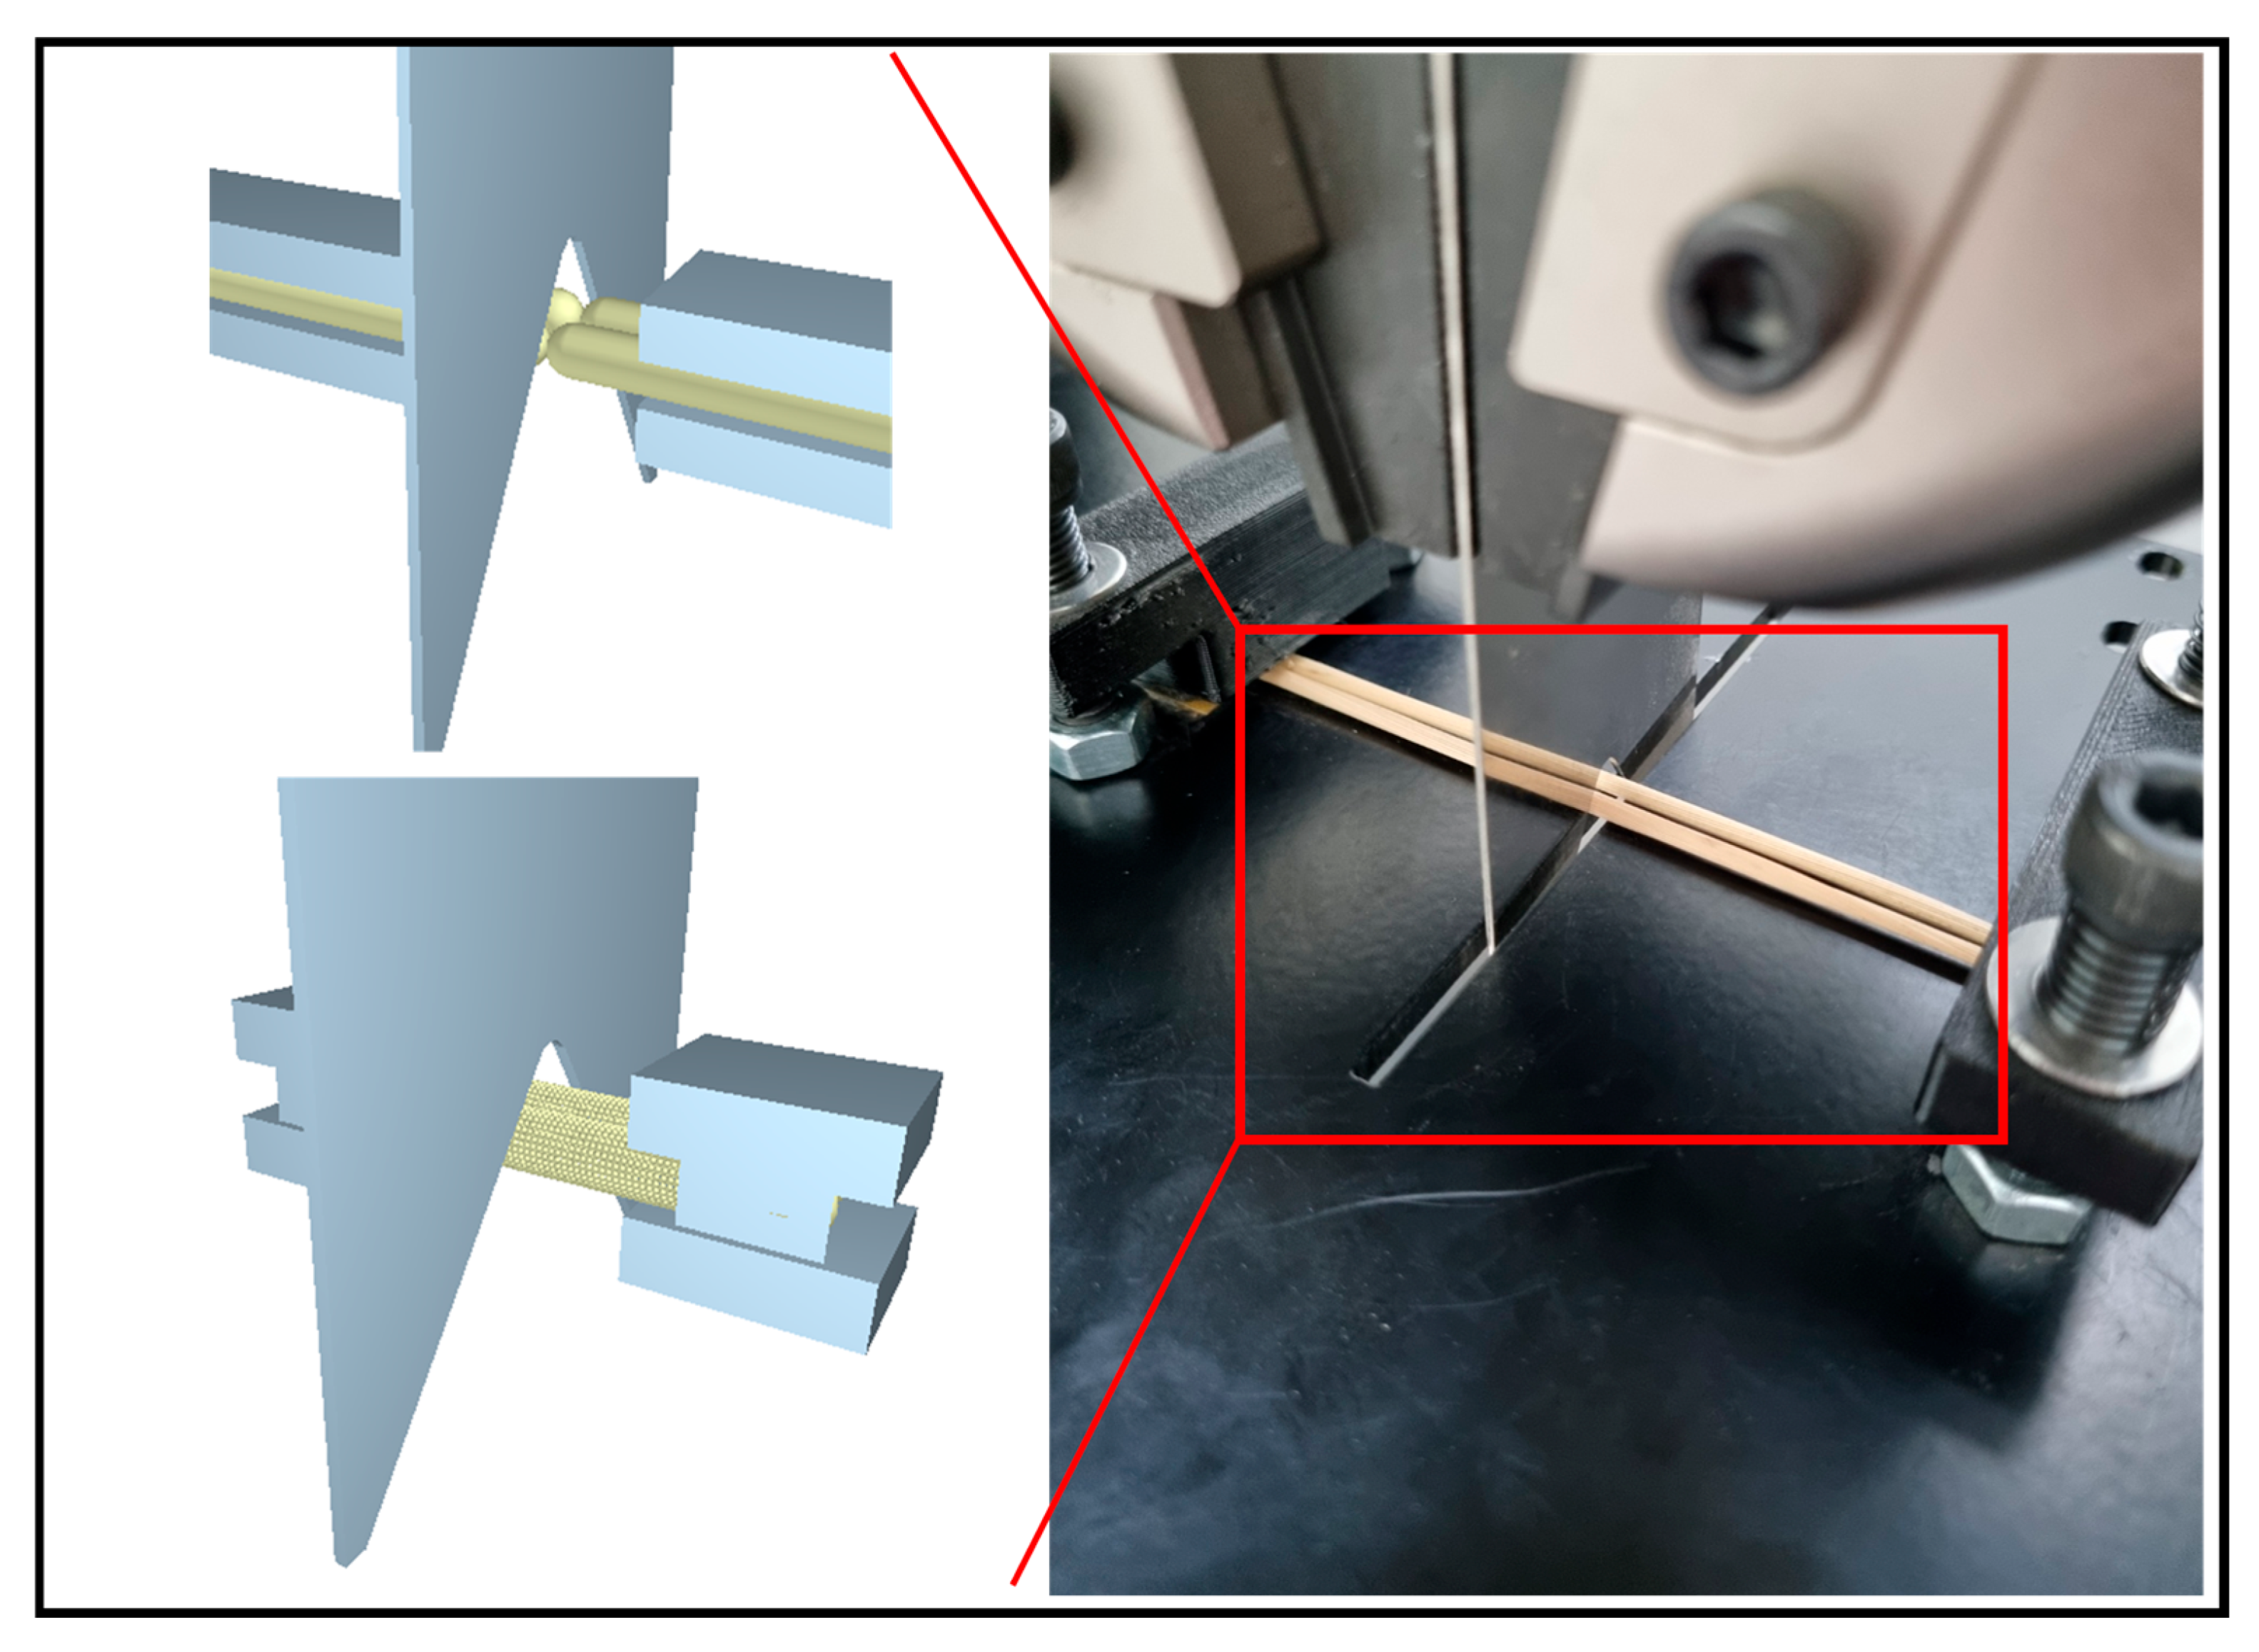
To verify the accuracy of the rice straw model, shear tests and simulations were conducted using two straws placed side by side, as illustrated in Figure 13. The specimens were horizontally aligned and firmly secured to prevent lateral displacement during shearing, and the test was performed at a loading speed of 10 mm/min, consistent with the single-shear tests. The corresponding double-shear simulation replicated the same procedure as in the single-shear simulations. Two rice straw models were generated and positioned in parallel using the static factory function in EDEM, and the shear blade was driven at 10 mm/min to apply deformation. By maintaining identical loading speed, boundary conditions, and shear blade configuration, the simulation environment was matched to the experimental setup.
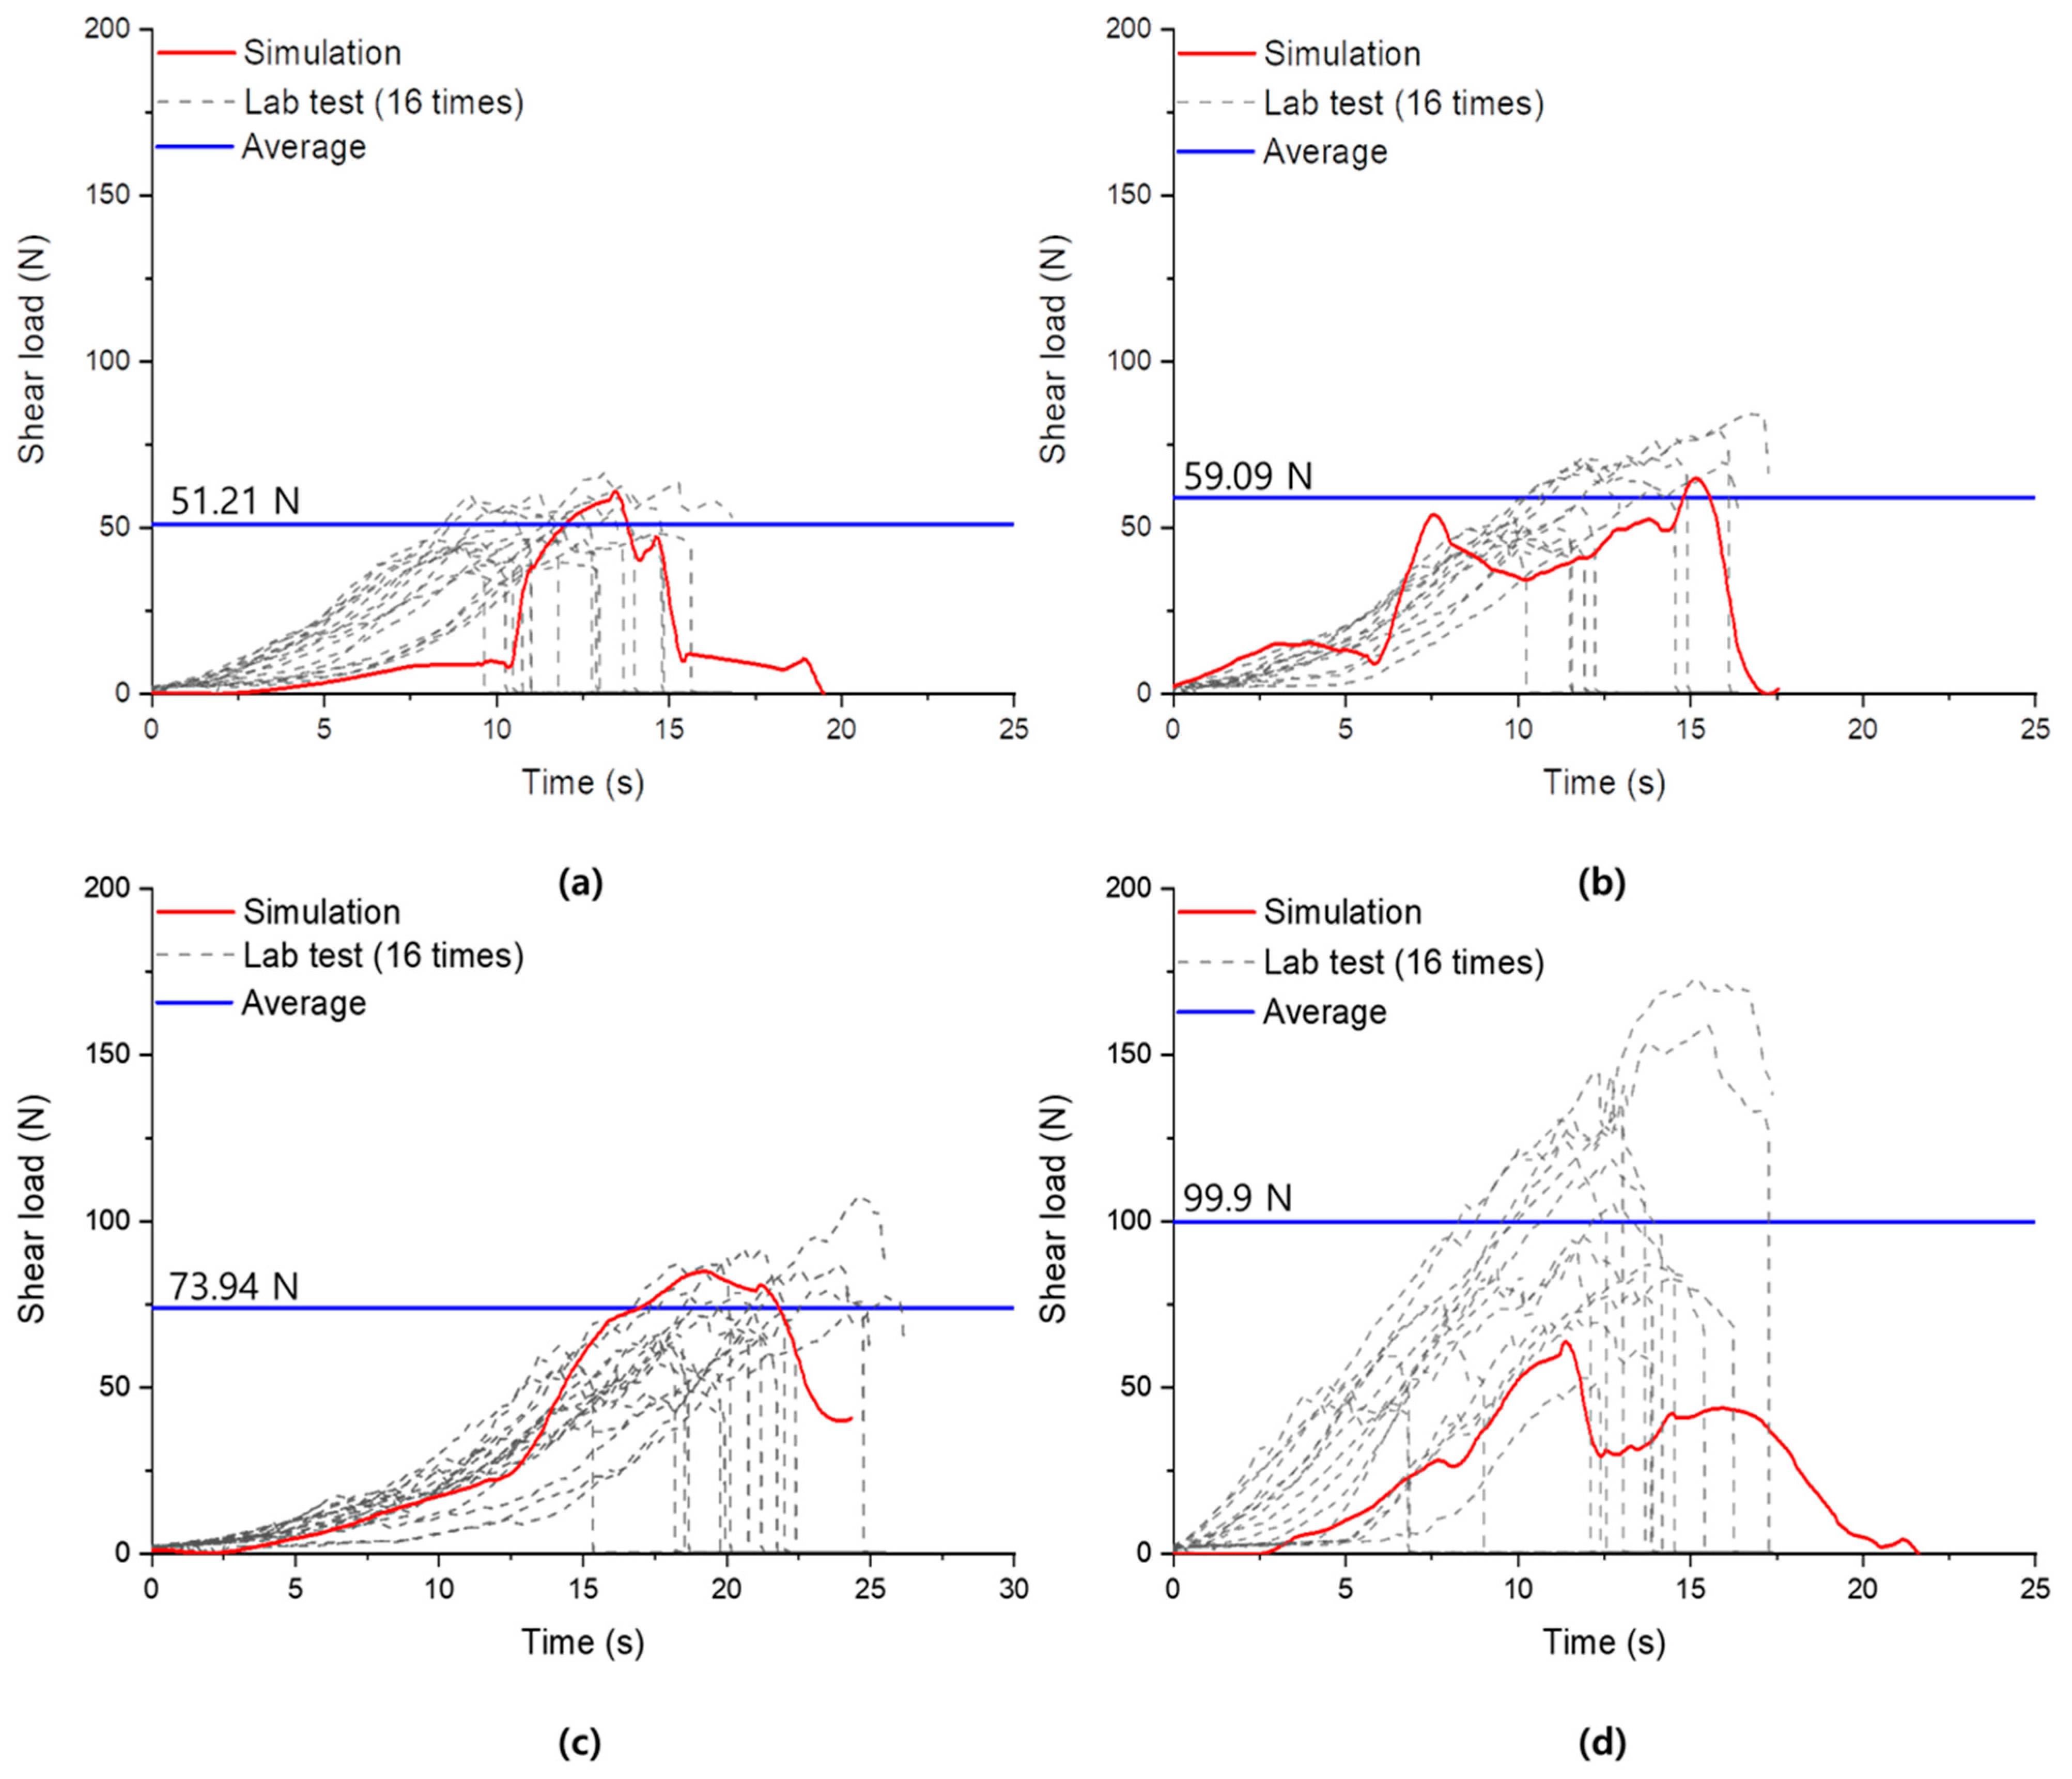
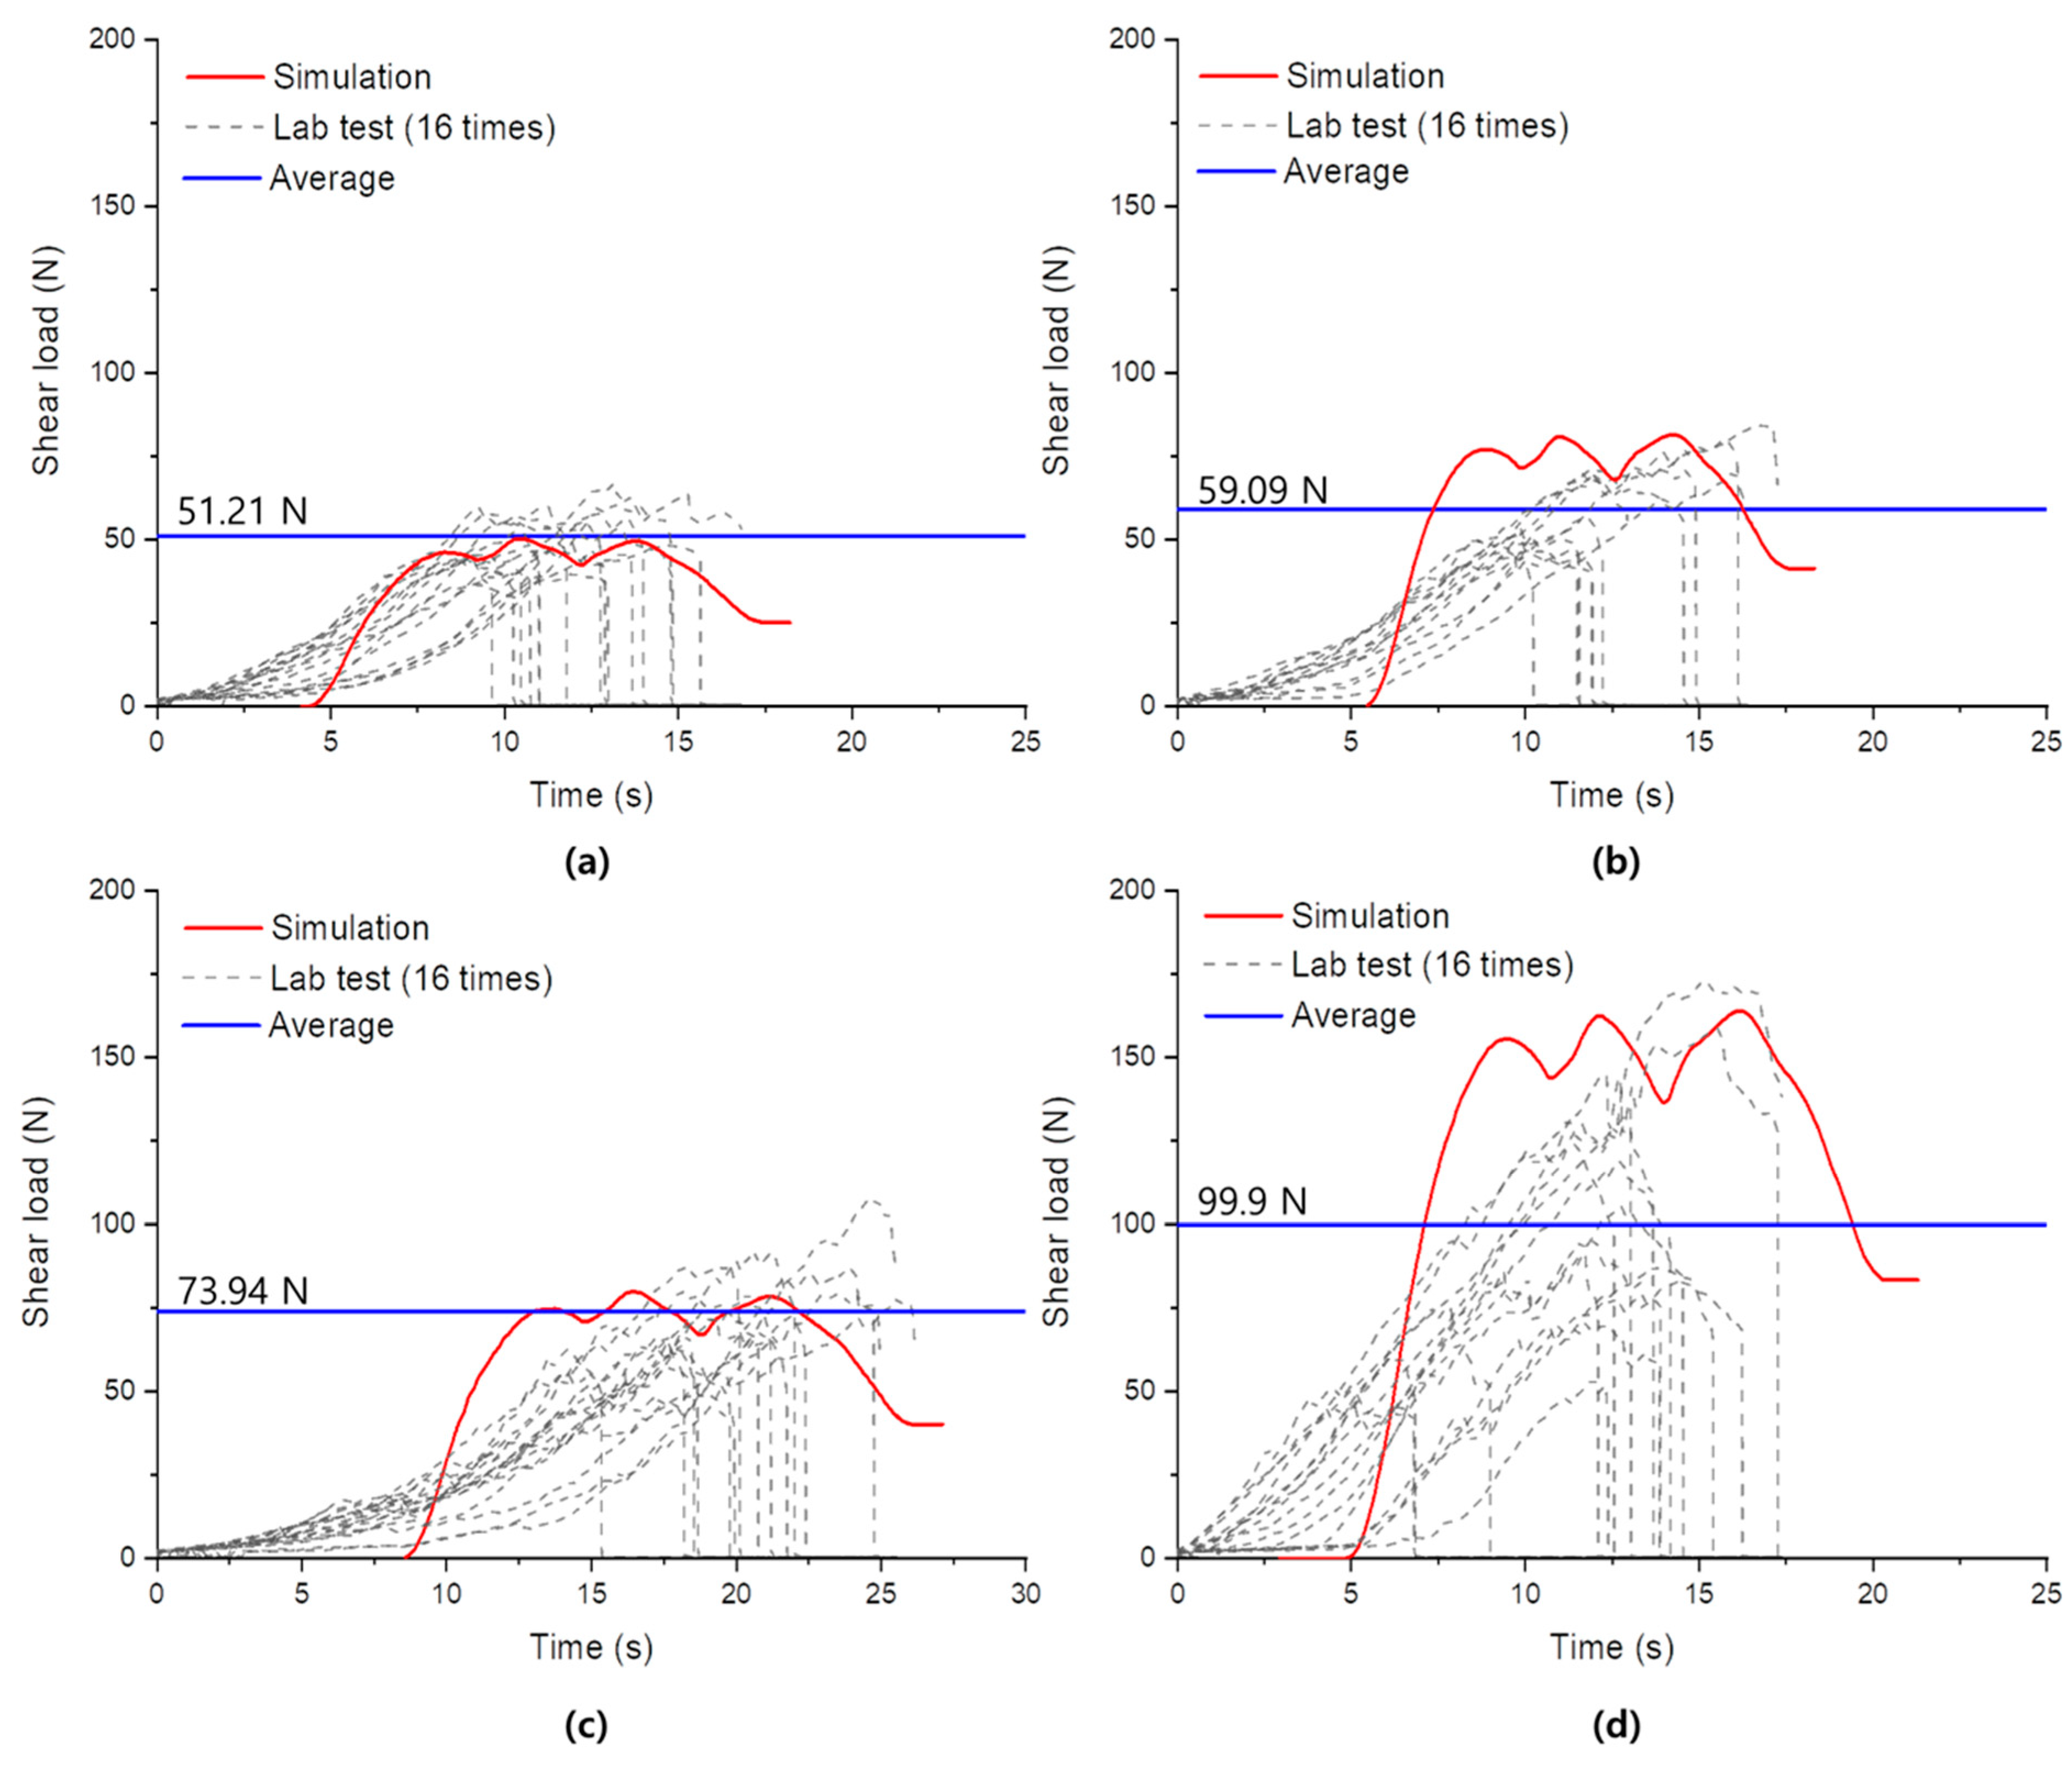
The measured peak loads from the double-shear tests are summarized in Table 7, and the corresponding DEM predictions for Model A and Model B are presented in Table 8. The experimental results exhibited clear sectional differences, with the Top and Mid sections showing lower shear resistance compared to the Bottom and Node sections. For the Top section, the experimental peak load ranged from 41.35 to 59.82 N, with a mean value of 51.21 N. Both Model A and Model B produced peak loads within this experimental range, with relative errors of 22.8% and 2.1%, respectively, when compared to the mean. The Mid section showed a similar trend. The experimental mean was 59.09 N, and both models predicted values within the observed minimum–maximum range, with Model A showing a greater deviation than Model B. In the Bottom section, the experimental peak loads ranged from 61.68 to 85.03 N. Both DEM models yielded predictions close to this range, with relative errors of 16.4% for Model A and 7.9% for Model B, indicating that the simulated shear responses closely approximated the experimental results. The Node section exhibited the broadest experimental range among all sections (51.28–172.49 N). The predicted loads by Model A (63.66 N) and Model B (163.82 N) were within or near this experimental range. However, when compared to the mean value of 99.90 N, the relative errors were higher than those observed in other sections. This section also showed the largest variability in the measured data, with the widest range of experimental peak loads.
Across all sections, the DEM-predicted peak loads corresponded well with the experimentally observed minimum–maximum ranges, demonstrating that the simulation framework effectively captured the magnitude and sectional trends of rice straw shear resistance under double-shear loading (Figure 14 and Figure 15).

3.3. Comparison of DEM Modeling Efficiency

To compare the overall simulation efficiency of the two models (Model A: Multi-particle; Model B: Single-particle), we analyzed total simulation time and accuracy. The simulation computer, common simulation settings, and total runtimes were as follows:
  • Shared simulation settings and computing environment
    Common settings (both models): Rayleigh time step = 6.2429 × 10⁻⁷; Rayleigh percentage = 30%; total simulated duration = 20 s; save interval = 0.01 s.
    Hardware: Windows 11 Pro; Intel Core i9-13900K @ 5.8 GHz; 128 GB RAM; NVIDIA RTX 4090 @ 2580 GHz.
2.
Accuracy summary (from prior sections)
Tensile: Model A = 94.45–99.61%; Model B = 95.87–97.43%.
Shear: Model A = 94.81–99.16%; Model B = 96.14–98.76%.
Both models achieve ≥≈95% agreement across sections.
3.
Total simulation time (this study’s setup)
Model A (Multi-particle): 1 h 20 min (80 min).
Model B (Single-particle): 18 min.
Speed-up: Model B is ≈4.4× faster (80/18 ≈ 4.44).
Under identical settings and hardware, Model B maintains high accuracy (≥≈95%) while reducing runtime to about one quarter of Model A. It further shows uniformly high accuracy in shear and consistently strong agreement in tension. Model A attains the upper-end tensile accuracy (≈99.6%) and better captures near-Node local morphology/failure, but at a substantially higher computational cost.

4. Discussion

The sectional mechanical tests revealed significant variation in the mechanical behavior of rice straw along the stem. The Mid section exhibited the highest tensile strength, while the Node showed the greatest shear resistance, and the Top was the weakest across both loading modes. These observations are in line with previous studies on cereal stems, where structural characteristics such as fiber alignment and tissue composition govern axial and transverse resistance [27,28]. The consistency of these trends, validated through mean-based (mean ± SD) and median-based (IQR) visualizations, further supports the reliability of the experimental data.
In line with our findings, previous research has identified substantial sectional variation in mechanical properties across different regions of cereal stalks. For example, Sorghum stalks exhibit distinct differences in fiber density, wall thickness, and lignification across various stem regions, which directly contribute to region-specific differences in tensile and shear strength [29]. This highlights the importance of treating different sections of the plant as anatomically and mechanically distinct, especially when analyzing agricultural materials using DEM models.
Both DEM models—multi-particle Model A and simplified single-particle Model B—successfully replicated the overall trends observed in the experimental data, achieving accuracies greater than 95% for tensile and shear peak loads. The multi-particle Model A provided slightly better precision around the Node, capturing localized deformation more effectively. This is consistent with previous studies reporting that the Node’s microstructural complexity produces localized stress concentrations and unique deformation patterns [30]. However, the computational time for Model B was drastically reduced, requiring only 18 min per run compared to 80 min for Model A, indicating a significant gain in efficiency for large-scale or parametric studies [31,32]. This performance advantage is attributed to Model B’s simplified representation of the straw’s internal structure, which reduces computational overhead by using fewer particles and bond interactions.
Model B offers efficiency in large-scale simulations; the simplification of local structural features in the Node may lead to inaccuracies in modeling the high variability in this region. As previously highlighted in studies on bamboo [33], the Node exhibits substantial anatomical and mechanical heterogeneity, including irregular vascular bundle arrangements, variations in sclerenchyma thickness, and uneven lignification patterns. These differences can lead to significant variability in shear and tensile strength when sampled from the same anatomical location.
The high dispersion observed in the Node shear tests is not merely an artifact of experimental conditions but is intrinsically tied to the structural irregularities of the Node region. Unlike the relatively uniform internode, the Node features a dense and irregular network of vascular bundles, which change direction and merge transversely. Studies on bamboo nodes have shown that such asymmetric bundle arrangements result in localized variations in load-bearing capacity, making the Node a region of high mechanical variability [33,34].
Additionally, as observed in sorghum stalks, the Node exhibits varying degrees of lignification, which affects both its stiffness and fracture behavior. Sorghum, for instance, shows significant variation in mechanical properties between different regions of the stalk, with the rind providing much higher tensile strength than the pith [34]. Similar anatomical disparities exist in other monocot plants, making the Node an inherently complex structure that is not easily represented by simplified models.
The inherent geometric and morphological variability within the Node poses a challenge for computational models. Small differences in cutting position can lead to large variations in the number and orientation of severed vascular bundles, which in turn causes significant fluctuations in peak shear loads. This phenomenon is consistent with the foam-like behavior of the parenchyma and the reinforcing role of the sclerenchyma in cereal stems. The structural configuration of the Node—combining these materials in an irregular pattern—directly affects how stresses are distributed and dissipated, further contributing to the observed high dispersion in experimental results [33].
To address these uncertainties, we propose conducting a morphological sensitivity analysis using the existing DEM framework. Such an analysis would involve varying key geometric parameters, such as wall thickness, fiber density, and vascular bundle arrangement, within realistic ranges (e.g., ±5–10%) and evaluating the corresponding changes in mechanical response. This type of analysis can be performed without the need for new experimental data, providing valuable insights into the sensitivity of the model to anatomical variability.
Given the anatomical complexity of the Node, we recommend further localized refinement of the DEM model, particularly around the Node region. Previous studies have demonstrated that higher resolution models, such as Model A, provide better results when simulating localized mechanical behavior, such as fracture propagation and stress concentration at the Node [33]. In contrast, Model B is ideal for large-scale simulations where localized accuracy is not the primary concern.
In addition to the morphological considerations, the efficiency of Model B compared to Model A has significant implications for practical applications. The 77.5% reduction in computational time achieved by Model B (18 min per simulation versus 80 min for Model A) enables four times more simulations per unit of computational time. This efficiency gain is particularly advantageous when performing large-scale or parametric simulations, which require numerous iterations under varying conditions (e.g., soil moisture, tillage depth, operational speed). By simplifying the internal structure representation, Model B allows for faster computation without a substantial loss of accuracy for many general-purpose simulations [31,32].
However, localized simulations that focus on detailed failure modes and stress concentrations at the Node require higher-resolution models. In these cases, the trade-off between computational efficiency and localized accuracy must be considered. For more detailed studies focused on localized behavior, Model A or a hybrid model, which incorporates both simplified and detailed regions, would be more appropriate.
Finally, to ensure that the DEM models are applicable to real-world agricultural scenarios, we recommend secondary validation using DEM–MBD co-simulation. By coupling the DEM straw model with multibody simulations of agricultural machinery, such as rake tines or baler compression mechanisms, and comparing the predicted reaction forces or torques with field-measured load data [7,10], it is possible to assess whether the DEM model can accurately replicate operational conditions and real-world interactions. Such co-simulation would be essential for validating the model’s effectiveness in simulating actual machinery performance, particularly under dynamic and complex loading conditions.

5. Conclusions

This study developed an optimized DEM-based modeling framework for dry rice straw by quantifying and integrating the sectional mechanical properties of the Top, Mid, Node, and Bottom regions. Tensile and shear tests confirmed pronounced anatomical heterogeneity along the stem, with the Mid section exhibiting the highest tensile resistance and the Node demonstrating the greatest shear strength. Incorporating these section-specific mechanical characteristics into the DEM significantly improved predictive accuracy compared with conventional models that assume uniform material properties.
Two DEM configurations—a high-resolution multi-particle model (Model A) and a simplified single-particle model (Model B)—were constructed and validated against experimental data. Both models achieved prediction accuracies exceeding 95% for tensile and shear responses, indicating that the calibrated sectional parameters effectively captured the mechanical behavior of rice straw. Model B reduced computation time by 77.5% relative to Model A while maintaining consistent accuracy across all sections, demonstrating its suitability for large-scale or iterative simulations. In contrast, Model A more effectively captured localized deformation around the Node, underscoring its advantage in studies requiring detailed analysis of local failure or stress concentration. These findings highlight a clear trade-off between computational efficiency and deformation fidelity and offer guidance for selecting an appropriate model based on simulation objectives.
Despite these strengths, several limitations should be acknowledged. The validation experiments were conducted under quasi-static, uniaxial loading conditions, which do not fully represent the complex, multiaxial, and dynamic loading states encountered during actual agricultural operations. In addition, the simplified geometry of Model B introduces localized inaccuracies in anatomically complex regions, such as the Node, indicating a need for further refinement of geometric representation and bonding behavior.
Future research should incorporate full load–displacement curve-based calibration, multi-objective parameter optimization, and local geometric refinement in structurally heterogeneous regions. Moreover, DEM–MBD co-simulation with actual agricultural machinery components should be conducted to evaluate model performance under realistic dynamic conditions and to enhance external validity.
The sectionalized rice straw model developed in this study can be extended to simulations of raking, baling, cutting, and other straw-handling operations, and may be adapted for a wide range of stem-type crops to support simulation-based load prediction and machinery design optimization.

Author Contributions

Conceptualization, Y.-S.K. and Y.-J.K.; methodology, Y.-S.K.; software, M.-S.K.; validation, Y.-S.K., D.-W.J. and S.-O.C.; formal analysis, Y.-S.K. and M.-S.K.; investigation, Y.-J.K.; data curation, Y.-S.K. and M.-S.K.; writing—original, M.-S.K.; writing—review and editing, Y.-S.K., D.-W.J., S.-Y.N. and S.-O.C.; supervision, Y.-S.K.; project administration, Y.-S.K.; funding acquisition, Y.-S.K. All authors have read and agreed to the published version of the manuscript.

Funding

This research was conducted under the Ministry of Trade, Industry and Energy (MOTIE)’s Machinery and Equipment Industry Technology Development Project (RS-2024-00442010), Ministry of Agriculture, Food and Rural Affairs (MAFRA) the Field Crop Farming Mechanization Promotion Technology Development Project (RS-2023-00236042), Ministry of Agriculture, Food and Rural Affairs (MAFRA), and the Technology Development Project for Strengthening Export Agriculture Competitiveness Based on International Cooperation (RS-2023-00233191).

Data Availability Statement

The original contributions presented in this study are included in the article. Further inquiries can be directed to the corresponding author.

Conflicts of Interest

The authors declare no conflict of interest.

References

  1. Kim, J.-G.; Park, Y.-J.; Lee, G.-H.; Kim, J.-H. Effects of Bearing Characteristic on the Gear Load Distribution in the Slewing Reducer for Excavator. J. Korean Soc. Manuf. Process Eng. 2014, 13, 8–14. [Google Scholar] [CrossRef]
  2. Park, Y.J.; Kim, J.G.; Lee, G.H.; Kim, Y.J.; Oh, J.Y. Effects of Bearing Characteristics on Load Distribution and Sharing of Pitch Reducer for Wind Turbine. Int. J. Precis. Eng. Manuf. Green Technol. 2016, 3, 55–65. [Google Scholar] [CrossRef]
  3. Park, Y.J.; Lee, G.H.; Nam, Y.Y.; Kim, J.K. Influence of Flexible Pin for Planets on Service Life of Wind Turbine Gearboxes. Trans. Korean Soc. Mech. Eng. A 2012, 36, 953–960. [Google Scholar] [CrossRef]
  4. Bae, B.-M.; Kim, Y.-S.; Kim, W.-S.; Kim, Y.-J.; Lee, S.-D.; Kim, T.-J. The Development of a Draft Force Prediction Model for Agricultural Tractors Based on the Discrete Element Method in Loam and Clay Loam. Agriculture 2023, 13, 2205. [Google Scholar] [CrossRef]
  5. Kim, Y.S.; Lee, S.D.; Baek, S.M.; Baek, S.Y.; Jeon, H.H.; Lee, J.H.; Kim, W.S.; Shim, J.Y.; Kim, Y.J. Analysis of the Effect of Tillage Depth on the Working Performance of Tractor-Moldboard Plow System under Various Field Environments. Sensors 2022, 22, 2750. [Google Scholar] [CrossRef]
  6. Zhao, Y.; Tekeste, M.Z.; Schramm, M.W.; Digman, M.F. Simulation of mechanical fractionation of chopped whole-plant corn (wpc) using discrete element method (dem). J. ASABE 2023, 66, 1281–1291. [Google Scholar] [CrossRef]
  7. Xie, D.; He, J.; Liu, T.; Liu, C.; Zhao, G.; Chen, L. Establishment and Validation the DEM-MBD Coupling Model of Flexible Straw-Shajiang Black Soil-Walking Mechanism Interactions. Comput. Electron. Agric. 2024, 224, 109203. [Google Scholar] [CrossRef]
  8. Cheng, H.; Gong, Y.; Zhao, N.; Zhang, L.; Lv, D.; Ren, D. Simulation and Experimental Validation on the Effect of Twin-Screw Pulping Technology upon Straw Pulping Performance Based on Tavares Mathematical Model. Processes 2022, 10, 2336. [Google Scholar] [CrossRef]
  9. Xu, T.; Gou, Y.; Huang, D.; Yu, J.; Li, C.; Wang, J. Modeling and Parameter Selection of the Corn Straw–Soil Composite Model Based on the DEM. Agriculture 2024, 14, 2075. [Google Scholar] [CrossRef]
  10. Wang, J.; Xu, Y.; Wang, C.; Xiang, Y.; Tang, H. Design and Simulation of a Trenching Device for Rice Straw Burial and Trenching Based on MBD-DEM. Comput. Electron. Agric. 2023, 207, 107722. [Google Scholar] [CrossRef]
  11. Tang, H.; Xu, W.; Zhao, J.; Xu, C.; Wang, J. Comparison of Rice Straw Compression Characteristics in Vibration Mode Based on Discrete Element Method. Biosyst. Eng. 2023, 230, 191–204. [Google Scholar] [CrossRef]
  12. Mei, F.; Li, B.; Xu, Z.; Li, X.; Zhu, X. Discrete Element Modeling of Straw Bale: An Innovative Approach to Simulate the Compression Mechanics of Fiber-Based Materials. Comput. Electron. Agric. 2025, 231, 110002. [Google Scholar] [CrossRef]
  13. Zhang, Z.; Mei, F.; Xiao, P.; Zhao, W.; Zhu, X. Discrete Element Modelling and Simulation Parameters Calibration for the Compacted Straw Cube. Biosyst. Eng. 2023, 230, 301–312. [Google Scholar] [CrossRef]
  14. Nguyen, A.T.Q.; Nguyen, M.N. Straw Phytolith for Less Hazardous Open Burning of Paddy Straw. Sci. Rep. 2019, 9, 20043. [Google Scholar] [CrossRef]
  15. Zareiforoush, H.; Mohtasebi, S.S.; Tavakoli, H.; Alizadeh, M.R. Effect of Loading Rate on Mechanical Properties of Rice (Oryza sativa L.) Straw. Aust. J. Crop Sci. 2010, 4, 190–195. [Google Scholar]
  16. Tang, H.; Xu, W.; Zhu, G.; Xu, C.; Wang, J. Study on Force Chain Evolution of Rice Straw with Different Length during Vibrational Compression. Particuology 2024, 85, 310–322. [Google Scholar] [CrossRef]
  17. Tang, Z.; Liang, Y.; Wang, M.; Zhang, H.; Wang, X. Effect of Mechanical Properties of Rice Stem and Its Fiber on the Strength of Straw Rope. Ind. Crops Prod. 2022, 180, 114729. [Google Scholar] [CrossRef]
  18. Liu, S.; Wang, Y.; Tian, H.; Sun, S.; Zhang, L.; Zhou, R.; Han, C. Mechanical Properties and Toughening Effect of Rice Straw Fiber-Reinforced Soil. Case Stud. Constr. Mater. 2024, 21, e03511. [Google Scholar] [CrossRef]
  19. Li, S.; Diao, P.; Miao, H.; Zhao, Y.; Li, X.; Zhao, H. Modeling the Fracture Process of Wheat Straw Using a Discrete Element Approach. Powder Technol. 2024, 439, 119726. [Google Scholar] [CrossRef]
  20. Liu, W.; Su, Q.; Fang, M.; Zhang, J.; Zhang, W.; Yu, Z. Parameters Calibration of Discrete Element Model for Corn Straw Cutting Based on Hertz-Mindlin with Bonding. Appl. Sci. 2023, 13, 1156. [Google Scholar] [CrossRef]
  21. ASTM D1894-24; Standard Test Method for Static and Kinetic Coefficients of Friction of Plastic Film and Sheeting. ASTM International: West Conshohocken, PA, USA, 2024.
  22. Shi, Y.; Jiang, Y.; Wang, X.; Thuy, N.T.D.; Yu, H. A Mechanical Model of Single Wheat Straw with Failure Characteristics Based on Discrete Element Method. Biosyst. Eng. 2023, 230, 1–15. [Google Scholar] [CrossRef]
  23. Kim, S.-C.; Kim, M.-S.; Bae, B.-M.; Jung, D.-W.; Choi, S.-O.; Kim, Y.-S.; Kim, Y.-J. Optimization of a Rice Straw Modeling for Tensile and Shear Load Based on the Discrete Element Method. J. Drive Control. 2025, 22, 65–73. [Google Scholar] [CrossRef]
  24. Li, X.; Zhang, Z.; Zhao, L.; Zhang, H.; Shi, F. Research on the Calibration Method of the Bonding Parameters of the EDEM Simulation Model for Asphalt Mixtures. Coatings 2024, 14, 1553. [Google Scholar] [CrossRef]
  25. Chen, X.; Peng, D.; Morrissey, J.P.; Ooi, J.Y. A Comparative Assessment and Unification of Bond Models in DEM Simulations. Granul. Matter 2022, 24, 29. [Google Scholar] [CrossRef]
  26. Potyondy, D.O.; Cundall, P.A. A Bonded-Particle Model for Rock. Int. J. Rock Mech. Min. Sci. 2004, 41, 1329–1364. [Google Scholar] [CrossRef]
  27. Shah, D.U.; Reynolds, T.P.S.; Ramage, M.H. The Strength of Plants: Theory and Experimental Methods to Measure the Mechanical Properties of Stems. J. Exp. Bot. 2017, 68, 4497–4516. [Google Scholar] [CrossRef] [PubMed]
  28. Heuschele, D.J.; Garcia, T.A.; Ortiz, J.B.; Smith, K.P.; Marchetto, P. Cereal Stem Stress: In Situ Biomechanical Characterization of Stem Elasticity. Appl. Sci. 2020, 10, 7965. [Google Scholar] [CrossRef]
  29. Bakeer, B.; Taha, I.; El-Mously, H.; Shehata, S.A. On the Characterisation of Structure and Properties of Sorghum Stalks. Ain Shams Eng. J. 2013, 4, 265–271. [Google Scholar] [CrossRef]
  30. Gibson, L.J. The Hierarchical Structure and Mechanics of Plant Materials. J. R. Soc. Interface 2012, 9, 2749–2766. [Google Scholar] [CrossRef]
  31. Di Renzo, A.; Napolitano, E.S.; Di Maio, F.P. Coarse-Grain Dem Modelling in Fluidized Bed Simulation: A Review. Processes 2021, 9, 279. [Google Scholar] [CrossRef]
  32. Jiang, X. Research on Coarse-Grained Discrete Element Model and Optimization for Fine Particles. Coatings 2022, 12, 1483. [Google Scholar] [CrossRef]
  33. Palombini, F.L.; Nogueira, F.M.; Kindlein, W.; Paciornik, S.; Mariath, J.E.D.A.; De Oliveira, B.F. Biomimetic Systems and Design in the 3D Characterization of the Complex Vascular System of Bamboo Node Based on X-Ray Microtomography and Finite Element Analysis. J. Mater. Res. 2020, 35, 842–854. [Google Scholar] [CrossRef]
  34. Fan, H.; Wang, J.; Shen, S.; Yang, M.; Li, S.; Feng, B.; Zhong, R.; Ma, C.; Wang, J.; Xie, R.; et al. High-Throughput Phenotyping of Cross-Sectional Morphology to Assess Stalk Mechanical Properties in Sorghum. Agriculture 2022, 12, 1696. [Google Scholar] [CrossRef]
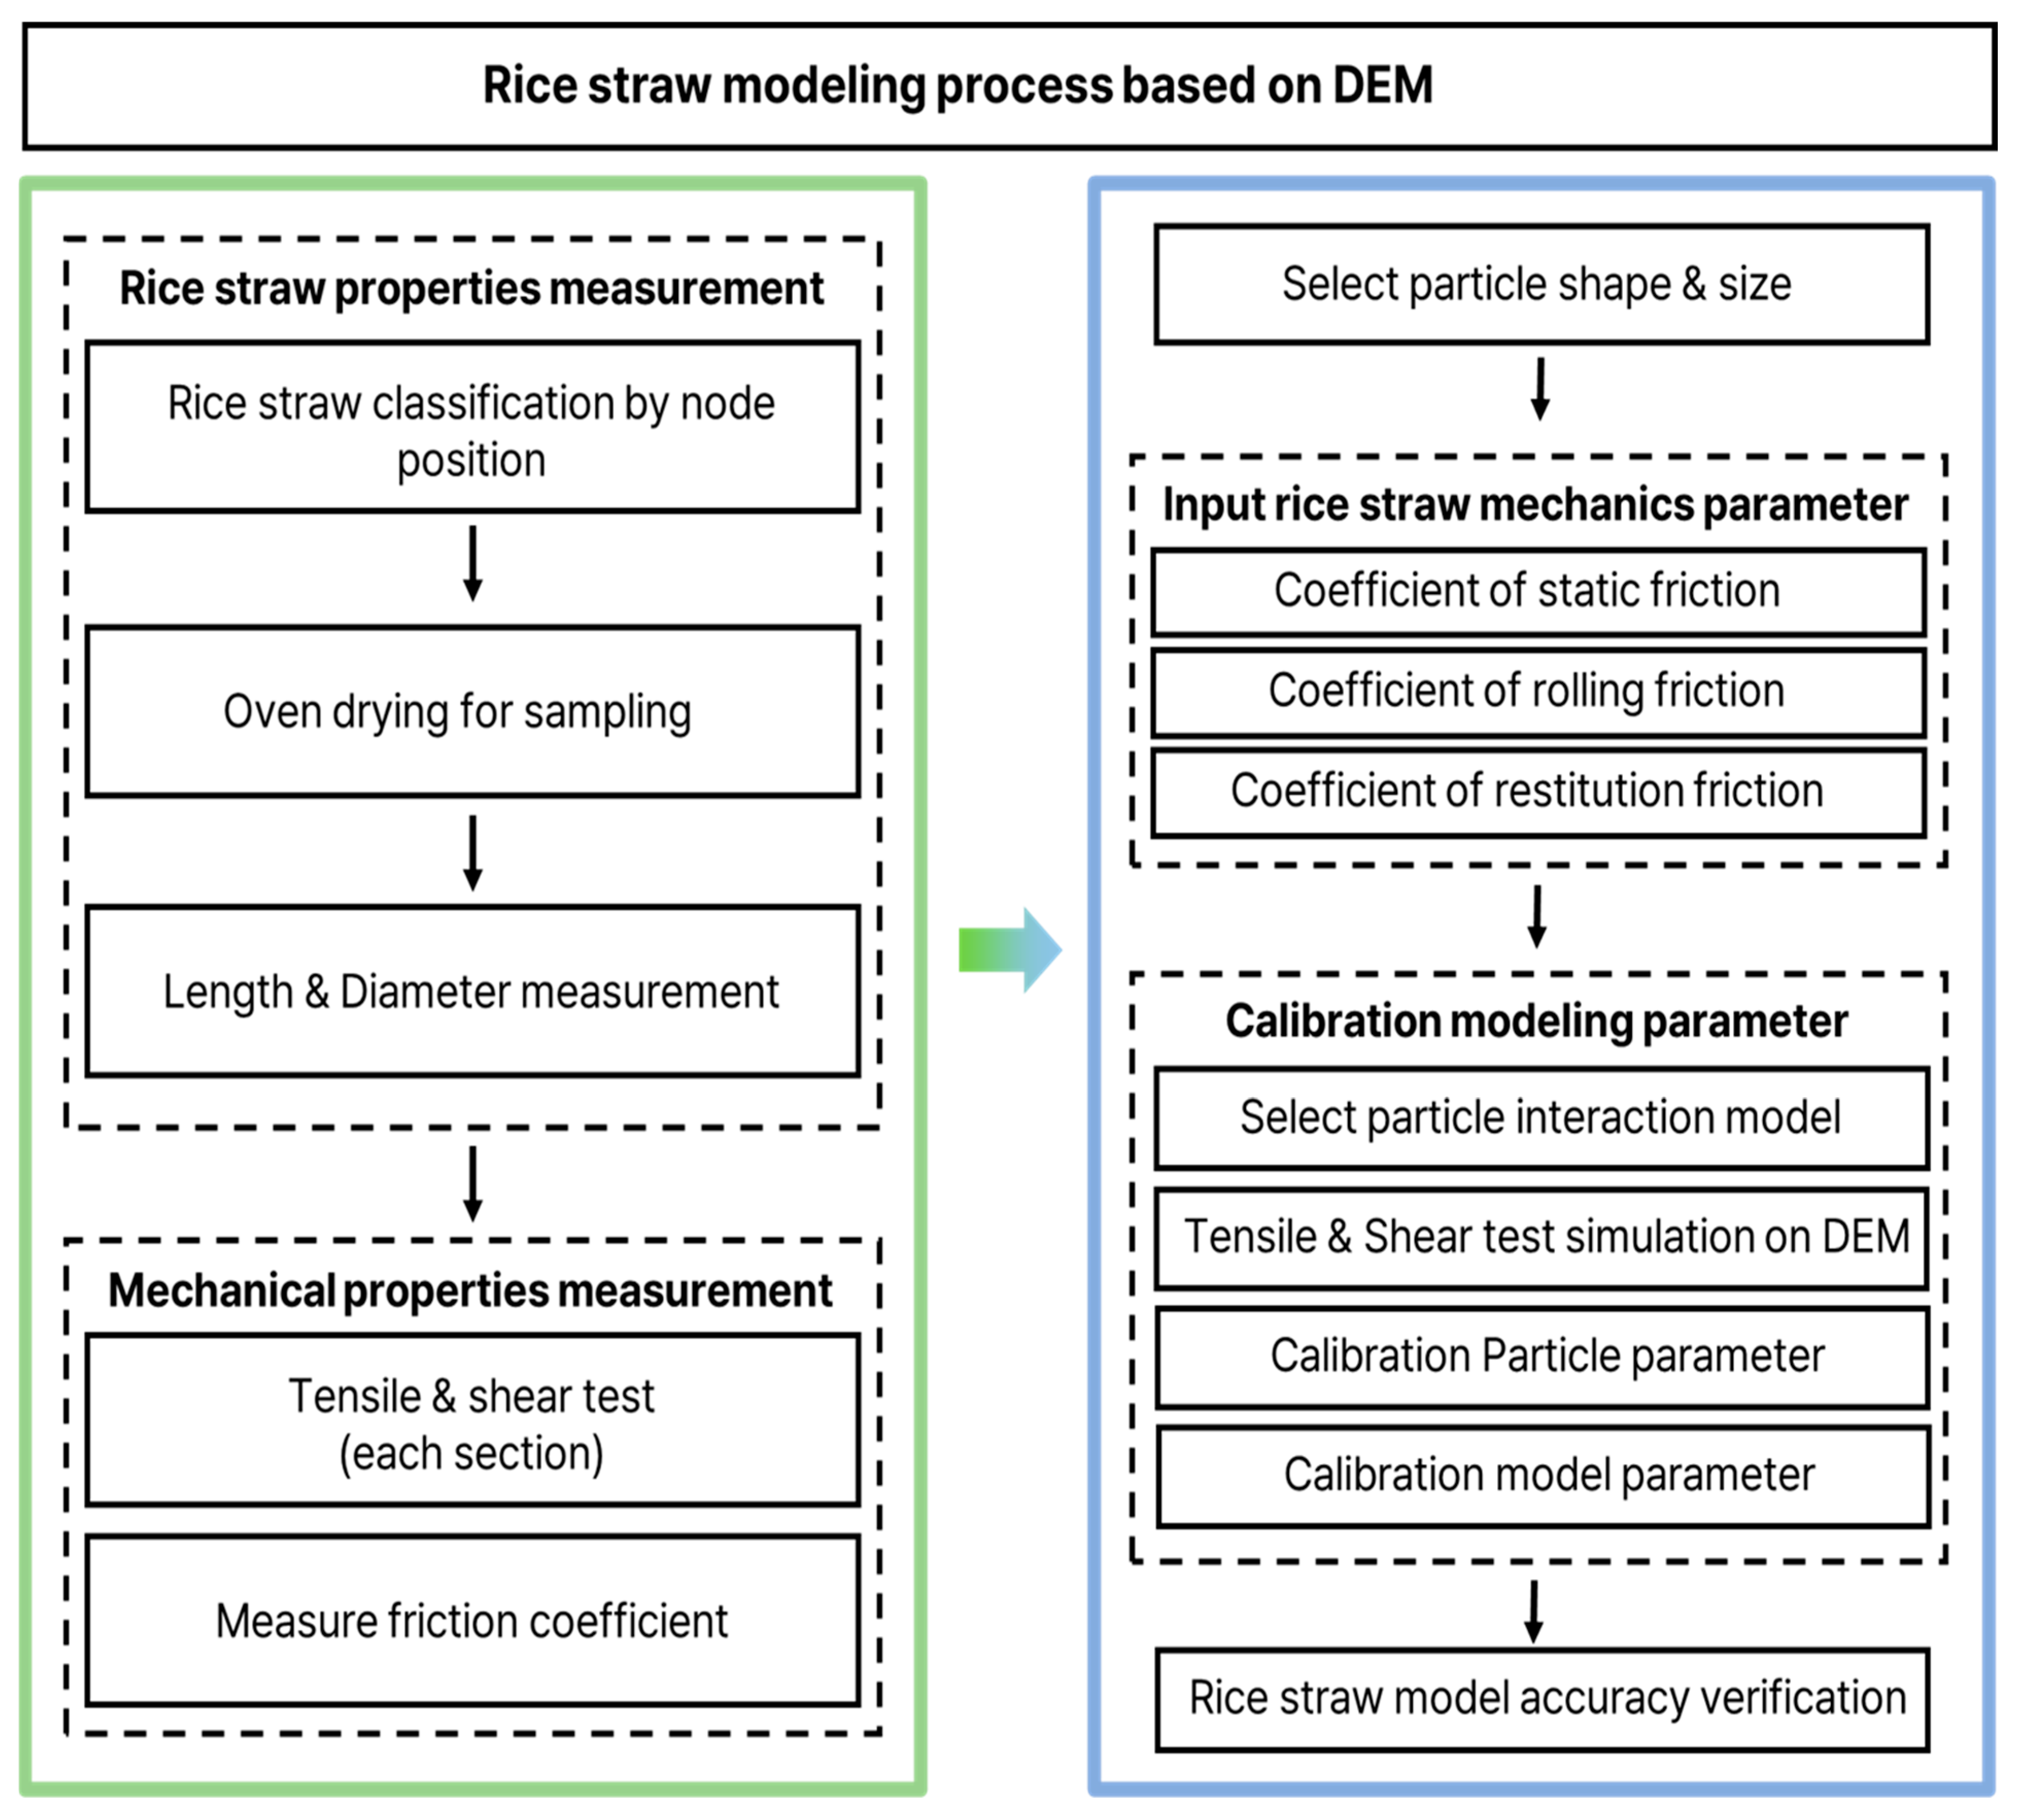
Figure 1. Modeling process of rice straw.
Agronomy 15 02712 g001
Figure 2. Classification and sampling of rice straw.
Agronomy 15 02712 g002
Figure 3. Measurement test of mechanical properties of rice straw.
Agronomy 15 02712 g003
Figure 4. Measurement test of physical properties of rice straw: (a) rice straw—rice straw; (b) rice straw—steel.
Agronomy 15 02712 g004
Figure 5. Rice straw modeling using DEM software(EDEM 2025.1): (A) Multiple particle structure model. (B) Single particle structure model.
Agronomy 15 02712 g005
Figure 6. Particle bonding interaction.
Agronomy 15 02712 g006
Figure 7. Tensile load prediction simulation of rice straw.
Agronomy 15 02712 g007
Figure 8. Shear load prediction simulation of rice straw.
Agronomy 15 02712 g008
Figure 9. Tensile test result of rice straw. (a): Top, (b): Node, (c): Mid, (d): Bottom.
Agronomy 15 02712 g009
Figure 10. Shear test result of rice straw. (a): Top, (b): Node, (c): Mid, (d): Bottom.
Agronomy 15 02712 g010
Figure 11. Tensile test results of rice straw by section: (A) Mean maximum Tensile load with standard deviation. (B) Boxplot of maximum Tensile load distribution for the Top, Mid, Bottom, Node sections. (N = 16 per section).
Agronomy 15 02712 g011
Figure 12. Shear test results of rice straw by section: (A) Mean maximum shear load with standard deviation. (B) Boxplot of maximum shear load distribution for the Top, Mid, Bottom, Node sections. (N = 16 per section).
Agronomy 15 02712 g012
Figure 13. Double shear test and simulation of rice straw.
Agronomy 15 02712 g013
Figure 14. Accuracy Verification Results of the Rice Straw: Model A (Multi-particle). (a): Top, (b): Mid, (c): Bottom, (d): Node.
Agronomy 15 02712 g014
Figure 15. Accuracy Verification Results of the Rice Straw: Model B (single-particle). (a): Top, (b): Mid, (c): Bottom, (d): Node.
Agronomy 15 02712 g015
Table 1. Particle modeling parameters of rice straw.
Particle Modeling ParametersRice Straw Section
TopNodeMidBottom
Particle radius (mm)Model A0.25
Model B2.5
Poisson’s ratioModel A0.4 (reference [22])
Model B0.4 (reference [11])
Shear modulus (Pa)Model A3.5 × 1086.8 × 1084.3 × 1083.45 × 108
Model B8.679 × 1083.3 × 1091.572 × 1091.588 × 109
Solid density (kg/ m 3 ) 241 (reference [19])
Coefficient of static friction (rice-rice)0.995 (measurement)
Coefficient of static friction (rice-steel)0.149 (measurement)
Coefficient of rolling friction (rice-rice)0.012 (reference [23])
Coefficient of rolling friction (rice-steel)0.988 (reference [23])
Coefficient of restitution (rice-rice)0.05 (reference [22])
Coefficient of restitution (rice-steel)0.52 (reference [22])
Table 2. Bonding model parameters for Model A (multi-particle model), Model B (single-particle model).
Bonding Model Parameter
(Model A)
Rice Straw Section
TopNodeMidBottom
Normal stiffness per unit area (N/ m 3 )1.5 × 10102.68 × 10104.3 × 10102.22 × 1010
Shear stiffness per unit area (N/ m 3 )3.5 × 10107.5 × 10102.68 × 10102.68 × 1010
Normal strength (Pa)1.5 × 1072.68 × 1077.92 × 1074.72 × 107
Shear strength (Pa)5.95 × 1074.5 × 1075.3 × 1075.3 × 107
Bonding Model Parameter
(Model B)
Rice Straw Section
TopNodeMidBottom
Normal stiffness per unit area (N/ m 3 )5.5 × 10101.03 × 10101.9 × 10101.31 × 1010
Shear stiffness per unit area (N/ m 3 )1.65 × 1061.7 × 1081.65 × 1065.1 × 108
Normal strength (Pa)1 × 1094.52 × 1095.5 × 1095.2 × 109
Shear strength (Pa)1 × 1099.98 × 1089.98 × 1088.5 × 108
Table 3. Tensile load measurement results of rice straw.
SectionMean (N)SD (N)Min (N)Max (N)
Top50.5615.6329.2271.78
Mid178.7134.37143.27239.27
Bottom124.7536.4194.24189.06
Node96.8823.1864.33115.71
Table 4. Shear load measurement results of rice straw.
SectionMean (N)SD (N)Min (N)Max (N)
Top40.625.9732.6546.97
Mid67.2710.6455.9983.84
Bottom53.3812.2942.0774.92
Node114.0832.0470.11161.60
Table 5. Tensile simulation results of rice straw model.
SectionMeasurement (N)Simulation Result (N)Accuracy (%)
Top50.56Model A53.5394.45
Model B52.4296.32
Mid178.71Model A178.0299.61
Model B186.195.87
Bottom124.75Model A127.8197.55
Model B127.9697.43
Node96.88Model A97.3899.48
Model B100.3896.39
Table 6. Shear simulation results of rice straw model.
SectionMeasurement (N)Simulation Result (N)Accuracy (%)
Top40.62Model A40.9699.16
Model B39.8698.09
Mid67.27Model A70.6395.01
Model B69.9796.14
Bottom53.38Model A55.6395.96
Model B55.4596.63
Node114.08Model A120.3294.81
Model B115.5198.76
Table 7. Double shear test results of rice straw.
SectionLab Test (N)
MinMaxAverage
Top39.4266.1951.21
Mid38.8384.2359.09
Bottom49.13107.1873.94
Node51.28172.4999.9
Table 8. Double shear simulation results of rice straw model.
SectionSimulation Results (N)Experimental
Mean (N)
Relative
Error (%)
TopModel A62.8651.2122.8
Model B50.142.1
MidModel A84.0259.0942.2
Model B81.4437.8
BottomModel A86.1073.9416.4
Model B79.807.9
NodeModel A63.6699.9036.3
Model B163.8263.9
Disclaimer/Publisher’s Note: The statements, opinions and data contained in all publications are solely those of the individual author(s) and contributor(s) and not of MDPI and/or the editor(s). MDPI and/or the editor(s) disclaim responsibility for any injury to people or property resulting from any ideas, methods, instructions or products referred to in the content.