Article

Effects of Water–Fertilizer Management on Soil Aggregate Stability and Organic Carbon Sequestration in Greenhouse Eggplant Fields of the Black Soil Region

1
College of Modern Agriculture and Ecological Environment, Heilongjiang University, Harbin 150080, China
2
State Key Laboratory of Black Soils Conservation and Utilization, Northeast Institute of Geography and Agroecology, Chinese Academy of Sciences, Harbin 150081, China
*
Author to whom correspondence should be addressed.
These authors contributed equally to this work.
Agronomy 2025, 15(12), 2672; https://doi.org/10.3390/agronomy15122672
Submission received: 23 September 2025 / Revised: 23 October 2025 / Accepted: 19 November 2025 / Published: 21 November 2025
(This article belongs to the Special Issue Soil Microbe and Nematode Communities in Agricultural Systems)

Abstract

Excess fertiliser and sub-optimal irrigation threaten soil health in greenhouse vegetable systems on black soils. This study explored how water–fertilizer regimes shape soil aggregate structure, stability, and soil organic carbon (SOC) sequestration in a meadow black soil eggplant system in Heilongjiang, China. Using a randomized block design with drip irrigation, three treatments were tested: conventional water and fertilizer (WF), conventional water with 20% fertilizer reduction (W80%F), and 20% water reduction with conventional fertilizer (80%WF). Results showed that 80%WF significantly increased macro-aggregate proportion, improved stability (mean weight diameter, MWD; geometric mean diameter, GMD), enhanced total organic carbon (TOC) content, and strengthened carbon sequestration, whereas W80%F weakened aggregate stability and reduced SOC in deeper layers. Water availability was the dominant factor for aggregate formation and SOC in surface and middle layers, while nutrients were more influential at depth. These findings demonstrate that moderate water reduction is more effective than fertilizer reduction in improving soil structure and carbon sink capacity, providing a scientific basis for precision water–fertilizer management and sustainable greenhouse agriculture in black soil regions.

1. Introduction

Agriculture, as a cornerstone of human societal development, is essential for ensuring food security, maintaining ecological balance, and advancing sustainable development [1,2]. With population growth and shifts in consumption patterns, protected agriculture has become a key approach to meeting market demand and improving land-use efficiency. Its advantages include high yields, stable supply, and controlled environmental conditions [3]. In northern China, greenhouse vegetable cultivation enables off-season production by regulating facilities. This practice offsets the limitations of cold climates and plays a vital role in balancing the dietary structure of local residents [4]. In black soil regions, protected vegetable fields are mainly located in Heilongjiang, Jilin, Liaoning, and Inner Mongolia, covering 0.51 million hectares, which accounts for 12.8% of the total protected vegetable area nationwide [5,6]. The meadow black soil region of Heilongjiang Province is well known for its fertile soil and high nitrogen retention capacity [7]. This region serves as an important reference for comparable black soil areas worldwide, including those in Russia [8]. Although meadow chernozem in this region has high fertility and strong nitrogen sequestration potential, high-yield-driven and extensive management practices have led to excessive fertilizer use and inefficient irrigation [5]. These practices not only waste resources but also exacerbate nitrogen loss, greenhouse gas emissions, and ecological risks [9]. Therefore, developing precise water and fertilizer management strategies for protected vegetable fields is crucial to improving nitrogen use efficiency and mitigating environmental pressure.
Soil is a fundamental component of the protected vegetable field ecosystem. It provides the physical foundation for crop production and functions as a key medium for ecological processes, including nutrient cycling, water regulation, and carbon sequestration [10,11]. Among these, soil structure largely determines soil functionality. Soil aggregates—the basic units of soil structure—are formed from mineral particles and organic matter through physical, chemical, and biological processes [12]. The stability of soil aggregates is a critical indicator of soil health and strongly influences soil quality [13,14]. Moreover, soil aggregate stability is closely linked to soil organic carbon (SOC), and both serve as key indicators for evaluating soil quality. SOC not only enhances soil aggregate stability but is also stabilized by aggregate formation, which promotes long-term carbon sequestration [15,16]. This positive feedback mechanism is crucial for enhancing soil quality and sustaining ecological functions [17].
In recent years, water and fertilizer management has gained increasing attention as a key regulatory measure in protected vegetable fields, particularly for its effects on soil aggregate structure and SOC sequestration [18]. Previous studies have shown that long-term fertilization markedly enhances the aggregate carbon pool. However, in black soil regions under protected agriculture, most studies have examined only the effects of single water or fertilizer factors on topsoil [19]. Systematic research on the synergistic effects of water–fertilizer coupling, the unique physicochemical properties of meadow chernozem, and the distribution of aggregate stability and SOC in subsoil (>20 cm) remains limited. Moreover, quantitative evidence is lacking on how initial soil nutrient differences, driven by long-term intensive cultivation, influence the regulatory effects of water and fertilizer management. These gaps have partly constrained the optimization of precise water and fertilizer management in black soil regions and hindered the sustainable development of protected agriculture.
Accordingly, this study used greenhouse eggplant (cultivar “Longza 201”) grown under plastic film mulching in the meadow chernozem region of Heilongjiang Province as the research subject, and implemented a water and fertilizer management experiment with drip irrigation. The aim was to systematically elucidate the regulatory effects and underlying mechanisms of different water and fertilizer regimes on soil aggregates and SOC across multiple soil layers. Although “Longza 201” eggplant was used as the test crop in this study, the water and fertilizer management model, soil aggregate structure, and organic carbon distribution patterns provide valuable references for other fruit-bearing vegetables, such as tomatoes, peppers, and cucumbers. These findings can contribute to soil improvement and promote sustainable management in protected vegetable production systems across different regions. The specific objectives were: (i) to analyze aggregate composition across soil profile (0–100 cm) under different water and fertilizer regimes; (ii) to evaluate the responses of soil aggregate stability to water and fertilizer management; and (iii) to determine the distribution of SOC across aggregate sizes and soil layers. The findings can provide a scientific basis for improving soil quality and promoting the sustainable management of protected vegetable fields in meadow chernozem regions.

2. Materials and Methods

2.1. Study Area

This study was carried out at the experimental base of the Horticultural Branch, Heilongjiang Academy of Agricultural Sciences (45°37.836′ N, 126°39.050′ E). The site is located in a moderate temperate zone with a semi-humid continental monsoon climate, characterized by a mean annual temperature of 4.25 °C and average precipitation of 569.1 mm. The soil is classified as meadow chernozem (Mollisols), derived from floodplain sediments. The test crop was eggplant (Solanum melongena L.), cultivar “Longza 201”. After raising seedlings, plants were manually transplanted and cultivated under plastic film mulching. Fertilizers applied included organic fertilizer (organic matter content ≥ 40%) and conventional chemical fertilizers (N, P, and K), all meeting agricultural production standards for purity and source. Irrigation was managed through a greenhouse-installed drip system. The main instruments included an elemental analyzer (Vario EL III, Elementar, Langenselbold, Germany), a pH meter (accuracy ± 0.01, glass membrane electrode), and a standard wet-sieving apparatus. All reagents were of analytical grade and obtained from certified suppliers.

2.2. Experimental Design

This experiment was conducted based on the long-term fixed-position experiment platform for protected vegetable fields in black soil, which was established by the Horticultural Branch of Heilongjiang Academy of Agricultural Sciences in 2016. The study on eggplant continuous cropping was initiated in 2018 and lasted until the end of the seedling-pulling stage on 17 October 2019, covering a total of two complete planting cycles (2018–2019). The aim of this experiment was to systematically evaluate the dynamic changes in soil environment and crop growth under continuous cropping conditions. The experiment was carried out in a solar greenhouse with an area of 324 m2 (12 m × 27 m) over the course of one year. A randomized complete block design was adopted, including 3 treatments with 3 replicates for each treatment, resulting in 9 independent plots. Each plot had an area of 15 m2 (5 m × 3 m) and was divided according to the principle of randomized blocks to reduce the interference of environmental differences. Before the experiment (in 2016), the basic soil nutrients of the experimental field were determined, which served as the baseline data for the subsequent analysis of treatment effects. To assess the impacts of different treatments on the physical and chemical properties of the soil in the protected eggplant field, after the eggplant seedling-pulling stage in 2019 (October 17), 3 random sampling points were selected in each plot for each of the three treatments to ensure the representativeness and repeatability of the data. The treatments were as follows:
1. Conventional water and fertilizer treatment (WF): Basal application of 5 t·ha−1 organic fertilizer; chemical fertilizers applied at 72 kg·ha−1 N, 72 kg·ha−1 P2O5, and 110 kg·ha−1 K2O. Topdressing was applied twice during the full fruiting stage: first with 70 kg·ha−1 N, and second with 23 kg·ha−1 N plus 113 kg·ha−1 K2O. Water management: About 27 m3·ha−1 of irrigation was applied after transplanting. After flowering, drip irrigation was applied every 7–10 days at 45 m3·ha−1 per application, and irrigation ceased before plant removal. This irrigation plan is based on the findings of our previous research conducted under identical greenhouse conditions [20]. These findings have been validated as suitable for meeting the irrigation requirements of greenhouse vegetables in this region [20].
2. Conventional water + 80% fertilizer treatment (W80%F): Basal application of 5 t·ha−1 organic fertilizer; chemical fertilizers applied at 80% of the WF rate (57.6 kg·ha−1 N, 57.6 kg·ha−1 P2O5, and 88 kg·ha−1 K2O). Topdressing was applied twice during the full fruiting stage: first with 56 kg·ha−1 N, and second with 18.4 kg·ha−1 N plus 90.4 kg·ha−1 K2O. Water management was the same as in the WF treatment.
3. 80% water + conventional fertilizer treatment (80%WF): Fertilizer application was identical to that in the WF treatment. Water management: About 21.6 m3·ha−1 of irrigation was applied after transplanting (80% of the WF rate). After flowering, drip irrigation was applied every 7–10 days at 36 m3·ha−1 per application, and irrigation ceased before plant removal.

2.3. Experimental Procedures

After seedling raising, eggplant seedlings were manually transplanted into the greenhouse. After transplanting, plastic film mulching was applied to promote crop growth. Throughout the growth period, all field management practices, except irrigation, were performed manually. Fertilizer type, application rate, application time, and irrigation amount for each treatment are summarized in Table S1. After the final eggplant harvest, a stainless-steel coring device (5 cm in diameter, equipped with a PVC liner) was used to collect intact soil cores while minimizing disturbance to soil structure. (Rhino S1 Soil Sampling Drill, Rhino Tool Company, Kewanee, IL, USA). Divided into five layers: topsoil (0–20 cm), middle soil (20–40 cm and 40–60 cm), and subsoil (60–80 cm and 80–100 cm). Three random sampling points were selected in each plot. To preserve the original soil aggregate structure, no pre-wetting or mechanical disturbance was performed during sampling. After sampling, the soil cores were immediately placed in rigid plastic containers, sealed, and stored to minimize potential disturbance and compaction during transport. In the laboratory, the soil samples were gently separated along natural fracture surfaces. Coarse roots, stones, and visible plant residues were manually removed with forceps to avoid damaging the original aggregate structure. The samples were air-dried at room temperature and stored for subsequent analyses.

2.4. Soil Property Measurement

The methods used to determine soil physical and chemical properties and soil organic carbon (SOC) fractions were as follows. Soil pH was measured with a pHS-3C pH meter at a soil-to-water ratio of 2.5:1 (w/v). To ensure consistency and comparability, soil aggregates were classified according to standardized size ranges following USDA conventions. Aggregates were divided into three main classes: (i) macroaggregates (>2 mm), (ii) mesoaggregates (2–0.25 mm), and (iii) microaggregates (<0.25 mm). Soil aggregate fractionation was performed using the wet-sieving method [21]. Briefly, 100 g of air-dried soil was submerged in deionized water for 10 min, then sieved through 5, 2, 1, 0.5, and 0.25 mm meshes using a mechanical shaker at 60 rpm for 5 min. Aggregates retained on each sieve were oven-dried at 40 °C and weighed to calculate the proportion of each size fraction. Organic carbon (OC) and total nitrogen (TN) were measured with an elemental analyzer (Vario EL III, Elementar, Germany). Dissolved organic carbon (DOC) was extracted using 0.5 M K2SO4 at a soil-to-solution ratio of 1:4 (w/v), shaken for 30 min, filtered through a 0.45 μm membrane, and analyzed using a TOC analyzer (Vario TOC, Elementar, Langenselbold, Germany) [22]. Microbial biomass carbon (MBC) was determined by the chloroform fumigation–extraction method using 0.5 M K2SO4 (1:4 soil-to-solution ratio), and calculated as 2.64 × (EC_fumigated − EC_unfumigated) [23]. Particulate organic carbon (POC) was extracted using a 5 g·L−1 sodium hexametaphosphate solution, after shaking for 18 h and sieving through a 53 μm mesh [24]. Light fraction organic carbon (LFOC) was separated using a 1.70 g cm−3 sodium iodide solution and quantified by the external heating K2Cr2O7–H2SO4 oxidation method [24]. Readily oxidizable carbon (ROC) was measured using the 333 mmol L−1 KMnO4 oxidation–colorimetry method [25].
The mass percentage of aggregates of different particle sizes was calculated using Equation (1):
w i %   =   M i M × 100
where wi is the percentage of aggregates at particle size i relative to the total mass, Mi is the mass of aggregates at size i, and M is the total aggregate mass.
The proportion of large aggregates was calculated using Equation (2):
W S A %   =   M L M × 100
where WSA denotes the proportion of large aggregates relative to the total. Soil aggregate (SAG) stability was evaluated using four indicators: mean weight diameter (MWD), geometric mean diameter (GMD), the proportion of aggregates larger than 0.25 mm (R>0.25), and fractal dimension (D). These indicators were calculated using Equations (3)–(6):
M W D   =   i   =   1 n x i × w i
G M D = e x p i = 1 n w i l n x i
where xi is the mean diameter (mm) of aggregates of size i after wet sieving, and wi is the mass fraction (%) of aggregates of size i.
R > 0.25 = M ( r > 0.25 ) M T
D = 3 l o g M r < x i M T / l o g x i x m a x
where M(r<xi) is the mass of aggregates smaller than xi (g), M(r>0.25) is the mass of aggregates larger than 0.25 mm (g), MT is the total aggregate mass (g), and xmax is the maximum aggregate size.

2.5. Statistical Analysis

Raw data were initially organized and analyzed using Microsoft Excel. A one-way analysis of variance (ANOVA) was conducted with SPSS 22.0 (IBM Corp., Armonk, NY, USA) to evaluate differences (p < 0.05) among aggregates of different particle sizes. Graphs and correlation analyses were generated using OriginPro 2023.

3. Results

3.1. Effects of Different Water and Fertilizer Management Practices on Soil Aggregate Composition

Different water and fertilizer management regimes significantly affected the particle size distribution of soil aggregates (Figure 1). Macroaggregates (>5 mm) responded most strongly to the reduced-water treatment (80%WF) in the topsoil and midsoil (Figure 1a). In the 0–20 cm layer, the macroaggregate content under 80%WF was 88.15% and 94.24% higher than under WF and W80%F, respectively. In the 20–40 cm and 40–60 cm layers, increases reached 55.60% and 95.64%, and 62.86% and 76.98%, respectively. No significant differences were observed among treatments in the 60–80 cm layer. In the 80–100 cm layer, macroaggregate content under W80%F was 61.58% and 69.27% lower than under WF and 80%WF, respectively, with no significant difference between WF and 80%F. These results indicate that subsoil macroaggregates are primarily controlled by soil-forming processes, with nutrient deficiency exerting an inhibitory effect. Mesoaggregate responses (5–2 mm, 2–1 mm) varied across soil layers and particle sizes. In the topsoil (0–20 cm), water regulation dominated, while nutrient effects were negligible (Figure 1b,c). Specifically, 80%WF increased 5–2 mm aggregates by 41.43% and 46.57% compared with WF and W80%F but decreased 2–1 mm aggregates by 20.06% and 31.04%, respectively. This highlights contrasting particle-size responses to water regulation. In the midsoil (20–60 cm), water–fertilizer interactions were significant. In the 20–40 cm layer, 5–2 mm aggregates under 80%WF and W80%F were 57.99% and 64.27% higher than under WF, respectively. Meanwhile, 2–1 mm aggregates under W80%F were 14.32% higher than under 80%WF. In the 40–60 cm layer, 5–2 mm aggregates under WF and 80%WF were 30.11% and 31.09% higher than under W80%F, while 2–1 mm aggregates under WF and W80%F were 22.99% and 25.26% higher than under 80%WF. In the subsoil (60–100 cm), treatment effects on mesoaggregates weakened considerably. No differences were observed among treatments in the 60–80 cm layer. In the 80–100 cm layer, only 5–2 mm aggregates under WF were 53.53% higher than under W80%F, while no differences were found for 2–1 mm aggregates. This suggests that subsoil mesoaggregates respond only weakly to water and fertilizer treatments, particularly in specific particle sizes. The distribution of microaggregates (1–0.5 mm, 0.5–0.25 mm) was regulated by water and fertilizer in a depth-dependent manner. In the topsoil (0–20 cm), water dominated, and 80%WF significantly reduced both microaggregate types. Specifically, 1–0.5 mm aggregates were 25.47% and 30.70% lower under 80%WF than under WF and W80%F, respectively, and 0.5–0.25 mm aggregates were 6.47% and 11.92% lower. No differences were observed between WF and W80%F (Figure 1d,e). In the midsoil (20–60 cm), nutrient regulation was enhanced. In the 20–40 cm layer, 0.5–0.25 mm aggregates under WF were 30.93% higher than under 80%WF. In the 40–60 cm layer, 1–0.5 mm aggregates under W80%F were 15.09% and 28.98% higher than under WF and 80%WF, respectively, while aggregates under WF were also 16.36% higher than under 80%WF. These results indicate that midsoil microaggregates were more sensitive to nutrient regulation. In the subsoil (60–100 cm), microaggregates did not differ among treatments, suggesting that their distribution was mainly governed by soil-forming processes. The response pattern of micro-microaggregates (<0.25 mm) shifted from water-dominated regulation in the topsoil, to water–fertilizer interactions in the midsoil, and nutrient dominance in the subsoil. In the topsoil (0–20 cm), water regulation dominated. Micro-microaggregates under 80%WF were 9.80% and 12.78% higher than under WF and W80%F, respectively (Figure 1f). This suggests that reduced water inhibited colloid aggregation, promoting dispersion and accumulation. In the midsoil (20–60 cm), both synergistic and differential effects of water and fertilizer were observed. In the 20–40 cm layer, aggregate content under WF was 26.98% and 41.45% higher than under W80%F and 80%WF, respectively, while content under W80%F was higher than under 80%WF. In the 40–60 cm layer, contents under WF and W80%F were 8.30% and 21.38% higher than under 80%WF. In the subsoil (60–100 cm), nutrient regulation dominated, with contents under W80%F significantly higher than under other treatments. In the 60–80 cm layer, contents under WF were higher than under 80%WF, whereas in the 80–100 cm layer, no significant difference was observed between WF and 80%WF.

3.2. Effects of Different Water and Fertilizer Management Practices on Soil Aggregate Stability

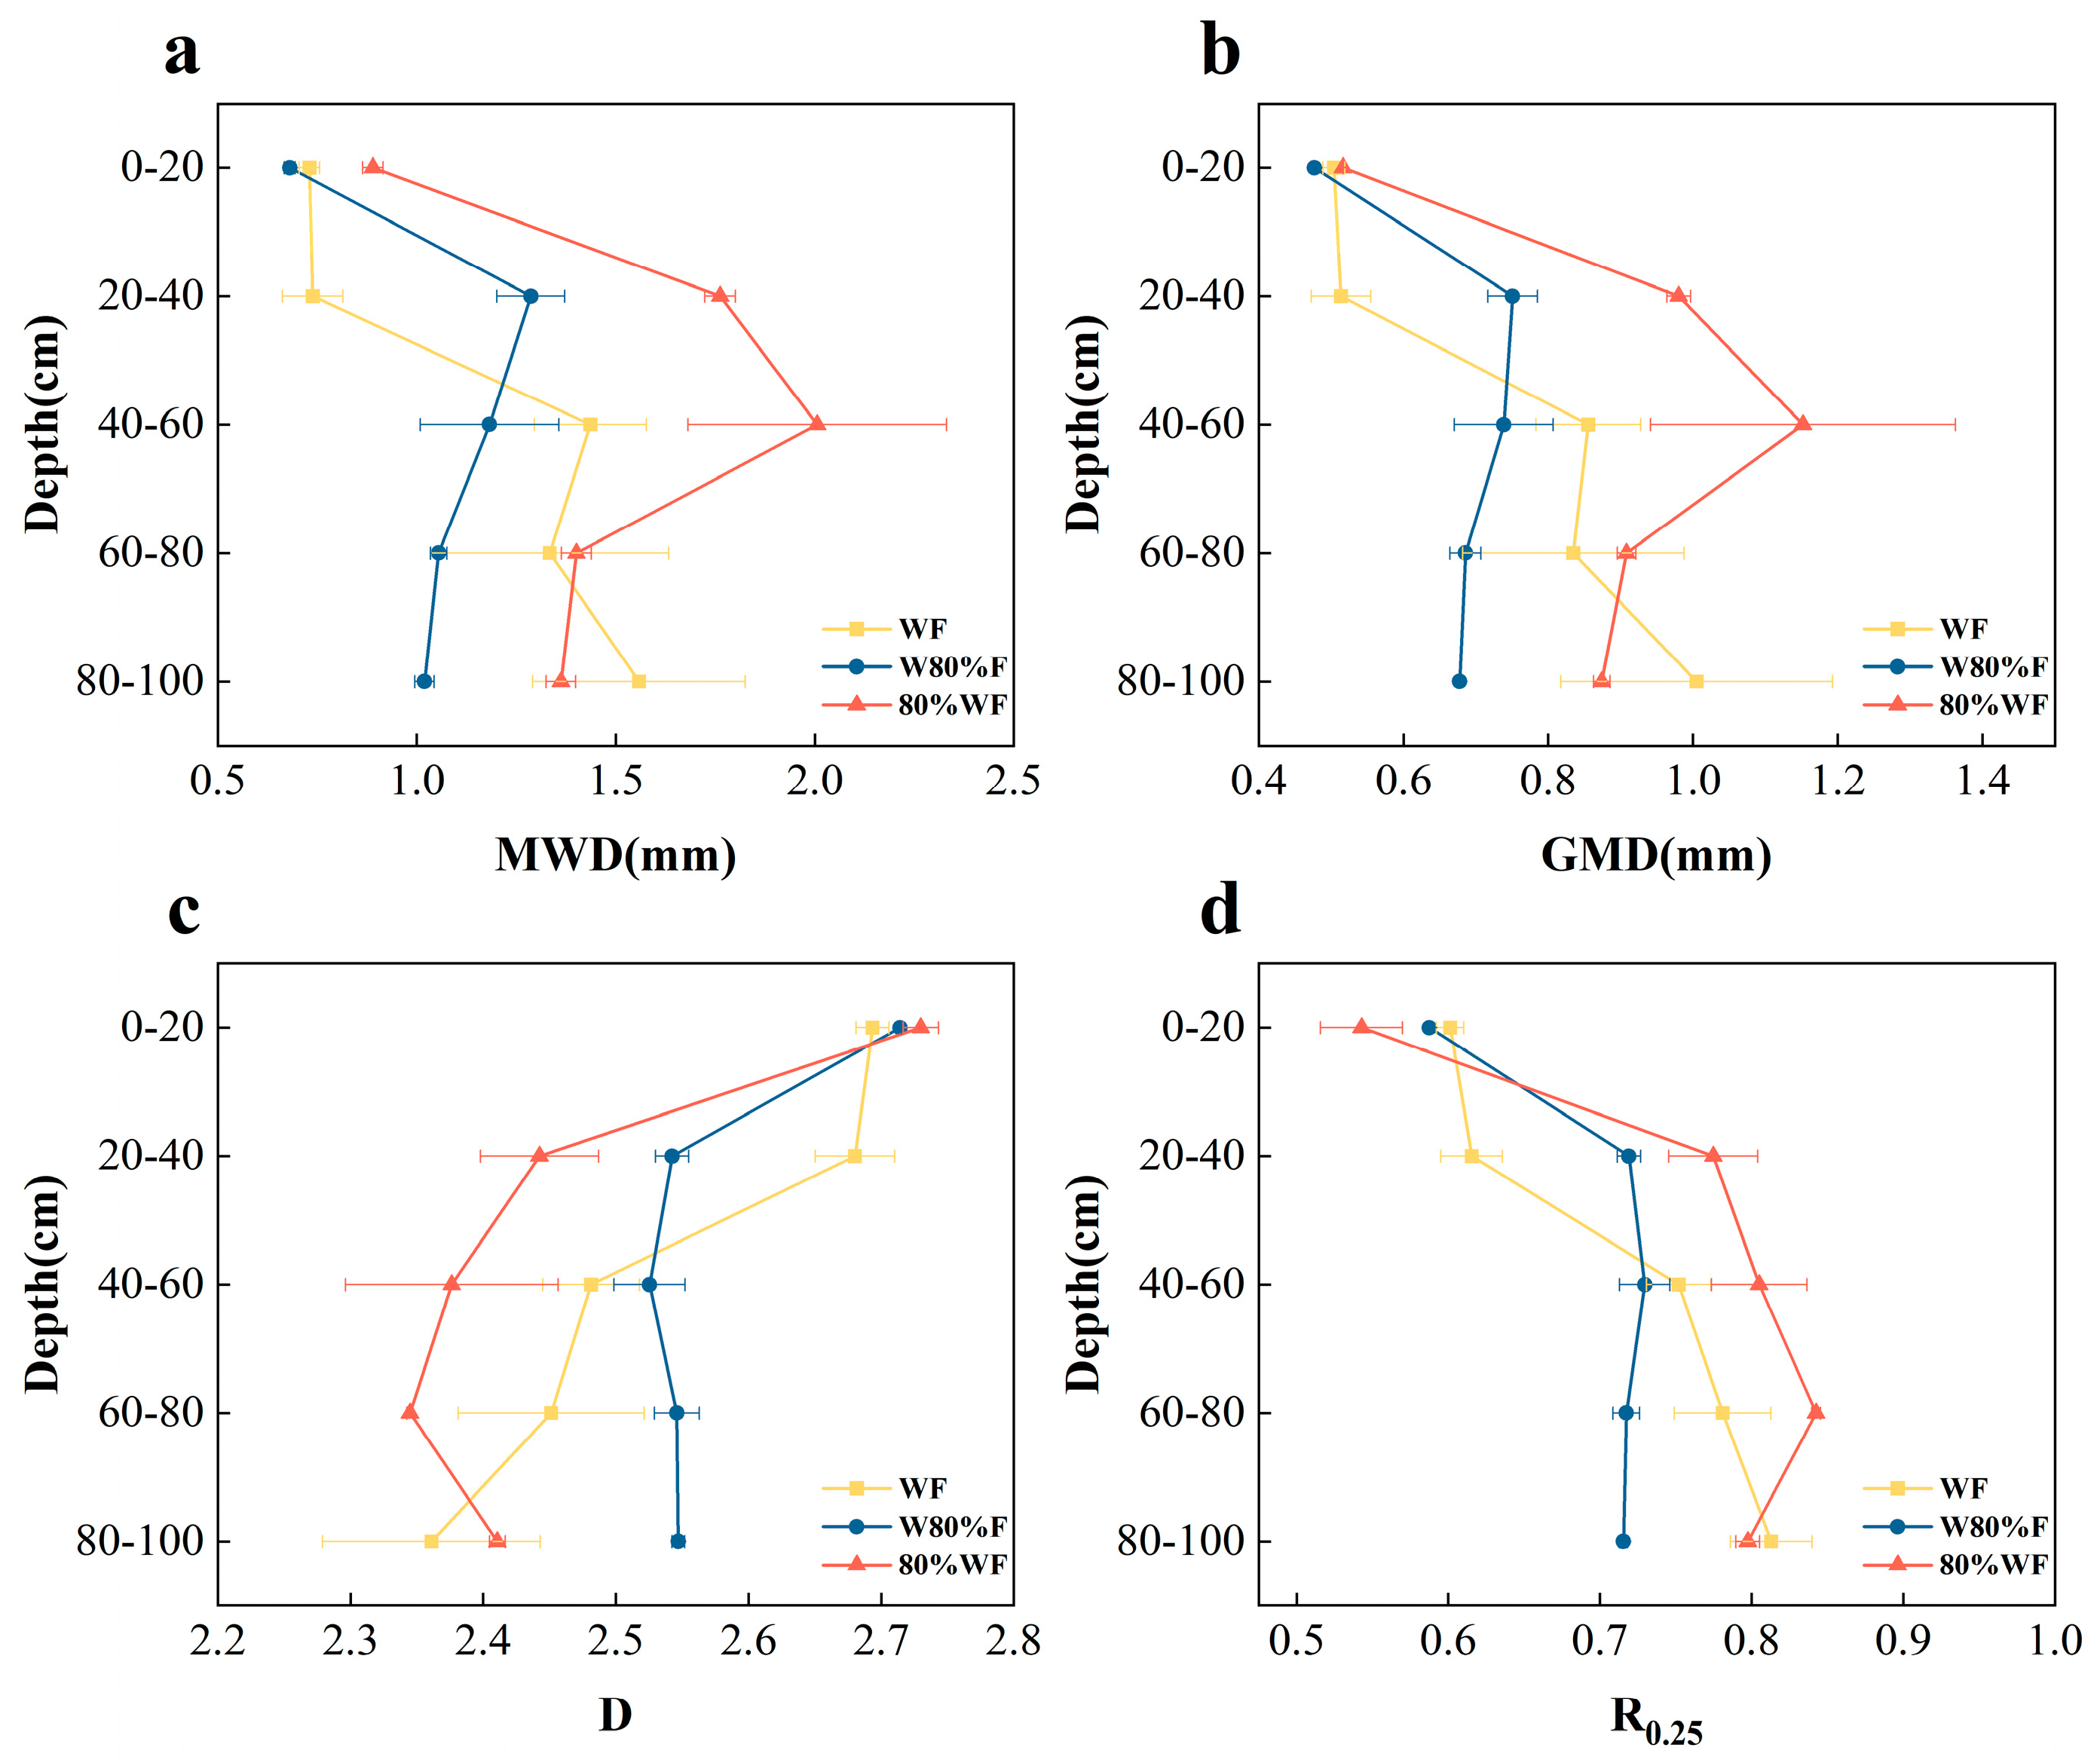
Different water and fertilizer management regimes significantly influenced soil aggregate stability indices across soil layers (Figure 2). For MWD, water regulation was the dominant factor in the topsoil (0–20 cm) and midsoil (20–40 cm, 40–60 cm). MWD under 80%WF was consistently higher than under WF and W80%F across these layers. In the topsoil, WF exceeded W80%F by 7.02%, while in the 20–40 cm layer, W80%F was 40.58% higher than WF. No difference was observed between WF and W80%F in the 40–60 cm layer. In the subsoil (60–100 cm), treatment effects weakened: no differences were detected in the 60–80 cm layer, whereas in the 80–100 cm layer, W80%F was 34.57% and 25.17% lower than WF and 80%WF, respectively (Figure 2a). The dominant factor regulating GMD varied with soil depth. In the topsoil (0–20 cm), WF and 80%WF exceeded W80%F, indicating that fertilizer reduction inhibited GMD. In the midsoil (20–40 cm, 40–60 cm), water reduction dominated, with 80%WF higher than both WF and W80%F. Specifically, in the 20–40 cm layer, W80%F was 31.58% higher than WF, while no difference was found between them in the 40–60 cm layer. In the subsoil (60–100 cm), nutrients became dominant: W80%F was lower than WF and 80%WF, with no difference between the latter two (Figure 2b). The regulatory factor for fractal D also varied with depth. In the topsoil (0–20 cm), 80%WF exceeded WF. In the midsoil (20–60 cm), 80%WF reduced D; WF was 5.14% higher than W80%F in the 20–40 cm layer, while no differences were observed in the 40–60 cm layer. In the subsoil (60–100 cm), nutrients dominated, with W80%F higher than WF and 80%WF. In the 60–80 cm layer, WF exceeded 80%WF by 7.93%, whereas no difference was detected between them in the 80–100 cm layer (Figure 2c). For macroaggregate content (R > 0.25 mm), the dominant factor varied by soil layer. In the topsoil (0–20 cm), water dominated, with 80%WF 7.62% and 9.94% lower than WF and W80%F, respectively. In the midsoil (20–60 cm), water remained dominant, and 80%WF was 6.59–20.57% higher than WF and W80%F, indicating that water reduction increased R > 0.25 mm aggregates. In the upper subsoil (60–80 cm), water continued to dominate, with 80%WF 8.12–14.84% higher than WF and W80%F. However, in the 80–100 cm layer, nutrients became dominant: W80%F was 10.31–11.99% lower than WF and 80%WF, with no difference between the latter two (Figure 2d). To comprehensively assess the stability of soil aggregates under each treatment, we introduced the standardized stability index (SSI). The SSI was calculated by standardizing four indicators (MWD, GMD, R > 0.25, and D) to the range of 0–1, assigning equal weights of 0.25, and then summing the weighted values. The results showed that the SSI varied significantly across soil layers and treatments (Figure S2). Among all treatments, 80% WF exhibited the highest overall stability across most soil layers, suggesting that moderate water reduction enhances soil structural stability. Differences among treatments were minimal in the surface layer (0–20 cm). In the 20–60 cm layer, 80% WF was significantly higher than WF and W80%F, whereas in the deep layer (60–100 cm), differences were less pronounced. Additionally, the mean value and 95% confidence interval of SSI were calculated using the t-distribution method (df = n − 1) to quantify the statistical uncertainty among samples (see Table S4). Incorporating the 95% confidence interval improved the robustness and reliability of the results.

3.3. Effects of Different Water and Fertilizer Management Practices on Soil Organic Carbon

3.3.1. Organic Carbon Content in Aggregates

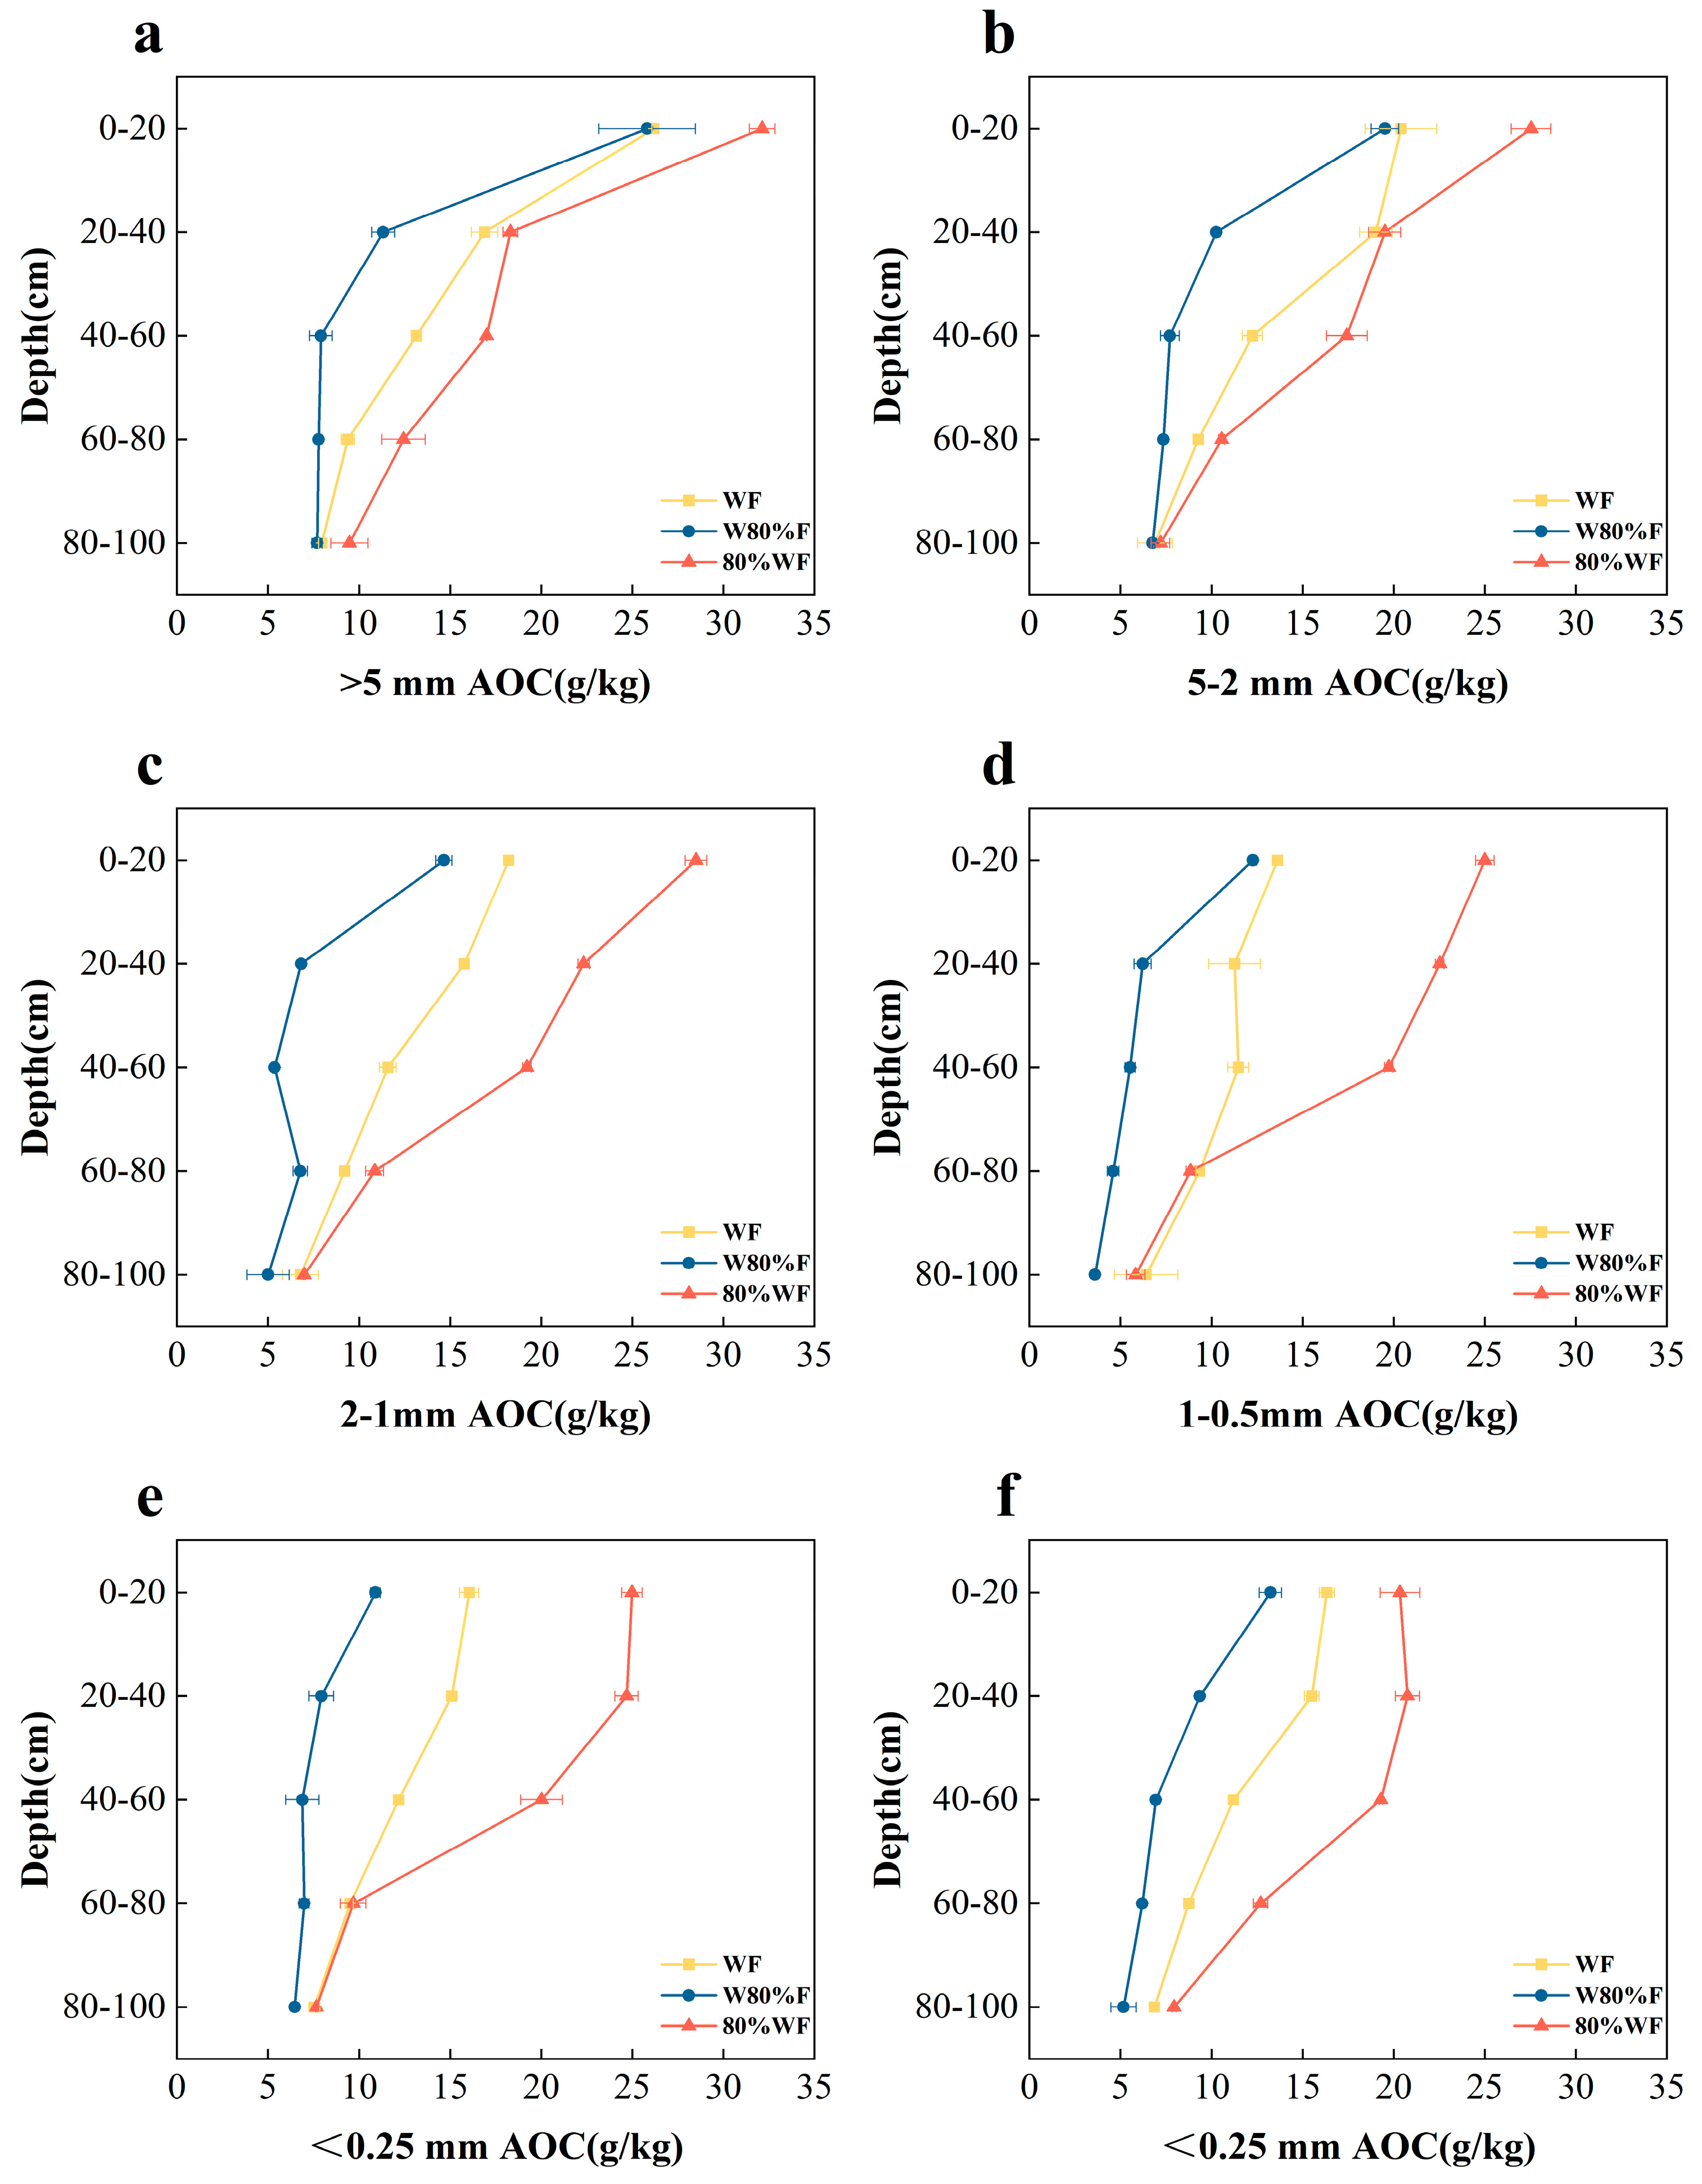
Different water and fertilizer management regimes significantly influenced the organic carbon (OC) content of aggregates across particle sizes (Figure 3). In macroaggregates (>5 mm), OC content under 80%WF was consistently higher than under WF and W80%F across all soil layers, indicating that water reduction is a key driver of OC sequestration in macroaggregates (Figure 3a). In the topsoil (0–20 cm), no difference was observed between WF and W80%F, suggesting that water reduction increased OC content by enhancing macroaggregate retention and reducing OC exposure, whereas fertilizer reduction showed no effect relative to the conventional treatment. In the midsoil (20–40 cm, 40–60 cm), OC content under WF exceeded that under W80%F by 32.93% and 39.84%, indicating that water reduction promoted continuous OC accumulation, while fertilizer reduction inhibited sequestration due to nutrient limitation, with water–nutrient interactions dominating at this depth. In the subsoil (60–100 cm), WF exceeded W80%F by 17.10% in the 60–80 cm layer, but no differences were detected among treatments in the 80–100 cm layer. In mesoaggregates (5–2 mm, 2–1 mm), 80%WF generally enhanced OC accumulation. From 0 to 80 cm, no difference was found between 80%WF and WF only for the 5–2 mm fraction in the 20–40 cm layer; in all other layers, OC content under 80%WF exceeded both WF and W80%F, indicating that water reduction was the dominant factor for mesoaggregate OC content. In the deep subsoil (80–100 cm), treatment differences disappeared, suggesting that aggregates in this layer were insensitive to water and fertilizer management (Figure 3b,c). Microaggregates (1–0.5 mm, 0.5–0.25 mm) exhibited a consistent response pattern. In the topsoil and midsoil (0–60 cm), OC content under 80%WF exceeded both WF and W80%F, and WF was higher than W80%F, indicating that water reduction enhanced sequestration by limiting microaggregate formation, whereas fertilizer reduction inhibited OC storage. In the subsoil (60–100 cm), no difference was observed between WF and 80%WF, but both exceeded W80%F, suggesting that OC sequestration was mainly nutrient-regulated and substantially weakened under fertilizer reduction (Figure 3d,e). Micro-microaggregates (<0.25 mm) exhibited a consistent trend across all soil layers (0–100 cm): OC content under 80%WF exceeded both WF and W80%F, and WF was higher than W80%F (Figure 3f). This indicates that OC sequestration in micro-microaggregates was primarily regulated by water–nutrient interactions. Overall, OC sequestration in aggregates exhibited clear particle size and depth specificity: water regulation dominated in the topsoil, whereas mid- to deep soils gradually shifted to water–nutrient interactions or nutrient control. Overall, the water-reduced treatment (80%WF) substantially enhanced OC accumulation across all aggregate sizes.

3.3.2. Total Organic Carbon Content

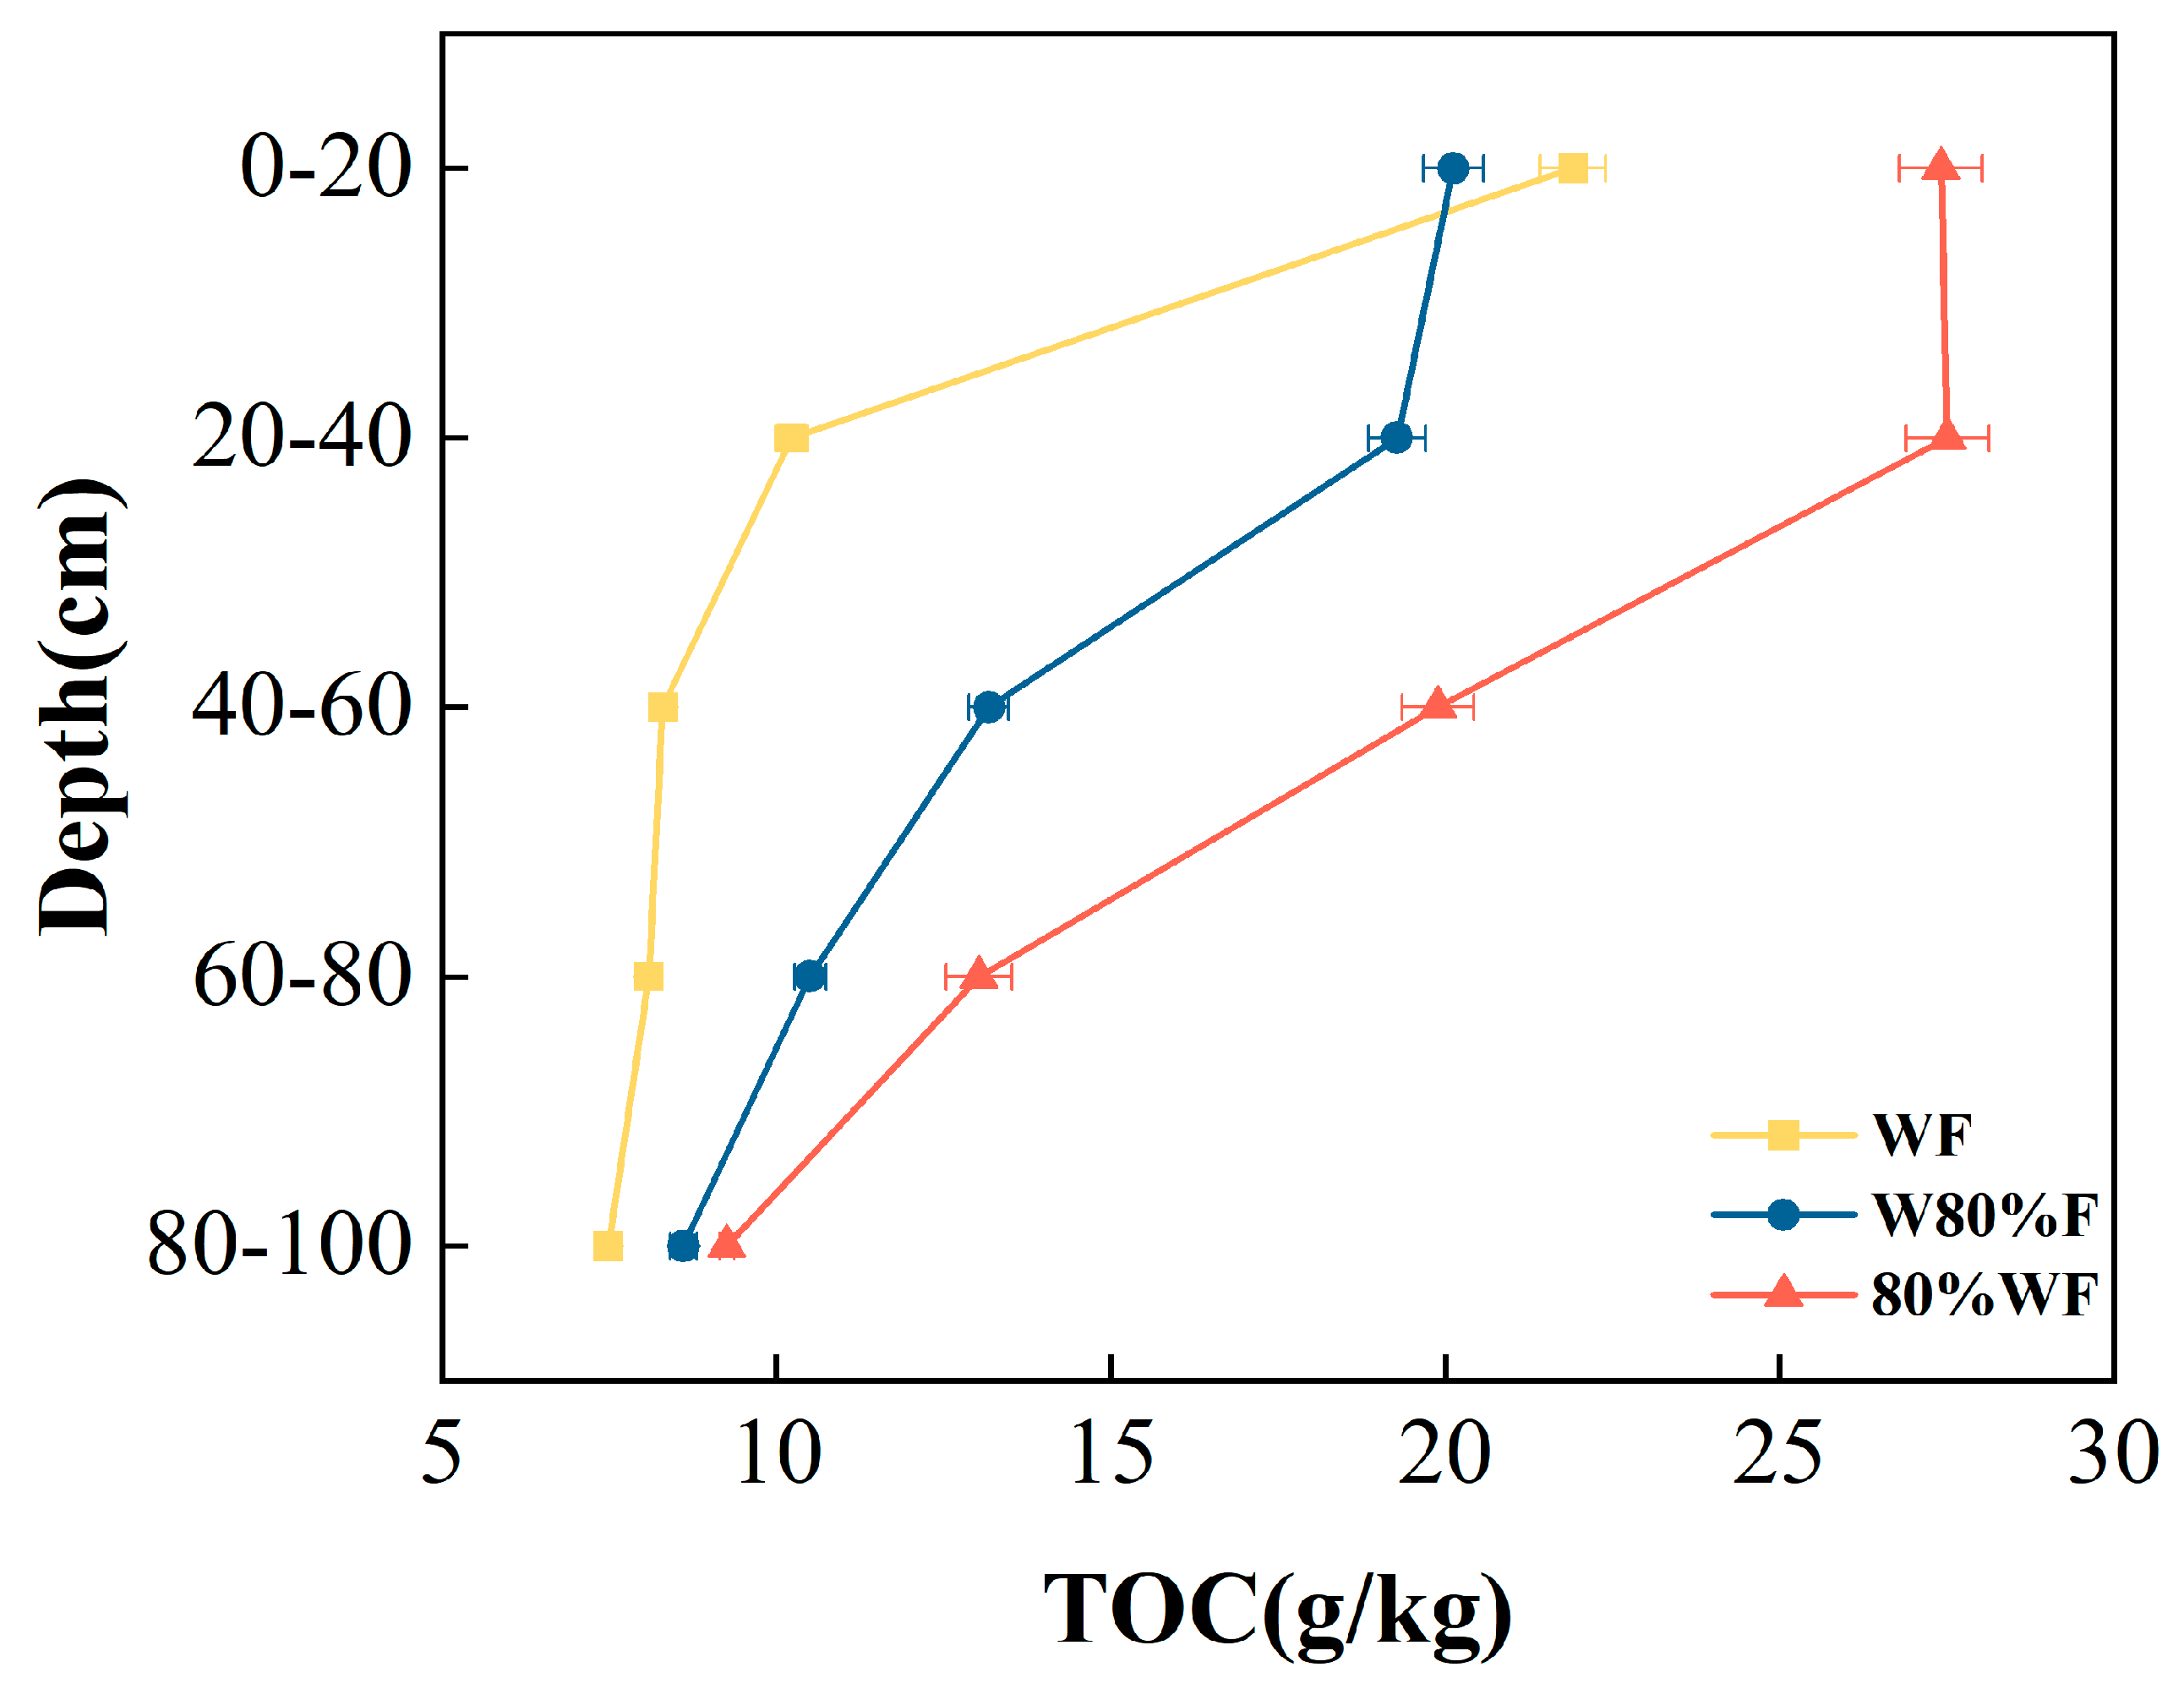
Across water and fertilizer treatments, total organic carbon (TOC) in the 0–100 cm soil profile decreased progressively with depth. Significant differences were observed among treatments in each soil layer, following the overall trend 80%WF > WF > W80%F (Figure 4). In the topsoil (0–20 cm), TOC under all treatments reached the highest level, with ~27 g·kg−1 under 80%WF, significantly higher than 22 g·kg−1 under WF and 20 g·kg−1 under W80%F. In the 20–40 cm layer, TOC declined relative to the topsoil but maintained the same trend, with ~25 g·kg−1 under 80%WF, significantly higher than the other treatments. In the 40–60 cm layer, TOC continued to decline, while 80%WF still maintained the highest level. In the 60–80 cm layer, TOC decreased further to 10–15 g kg−1, with 80%WF remaining significantly higher than WF and W80%F. In the 80–100 cm layer, TOC reached the lowest levels (<10 g·kg−1) across all treatments, yet the trend 80%WF > WF > W80%F persisted. Overall, soil TOC declined progressively with depth, and 80%WF consistently maintained the highest content across all layers, followed by WF, with W80%F lowest.

3.3.3. Contribution of Aggregate Organic Carbon to Total Organic Carbon

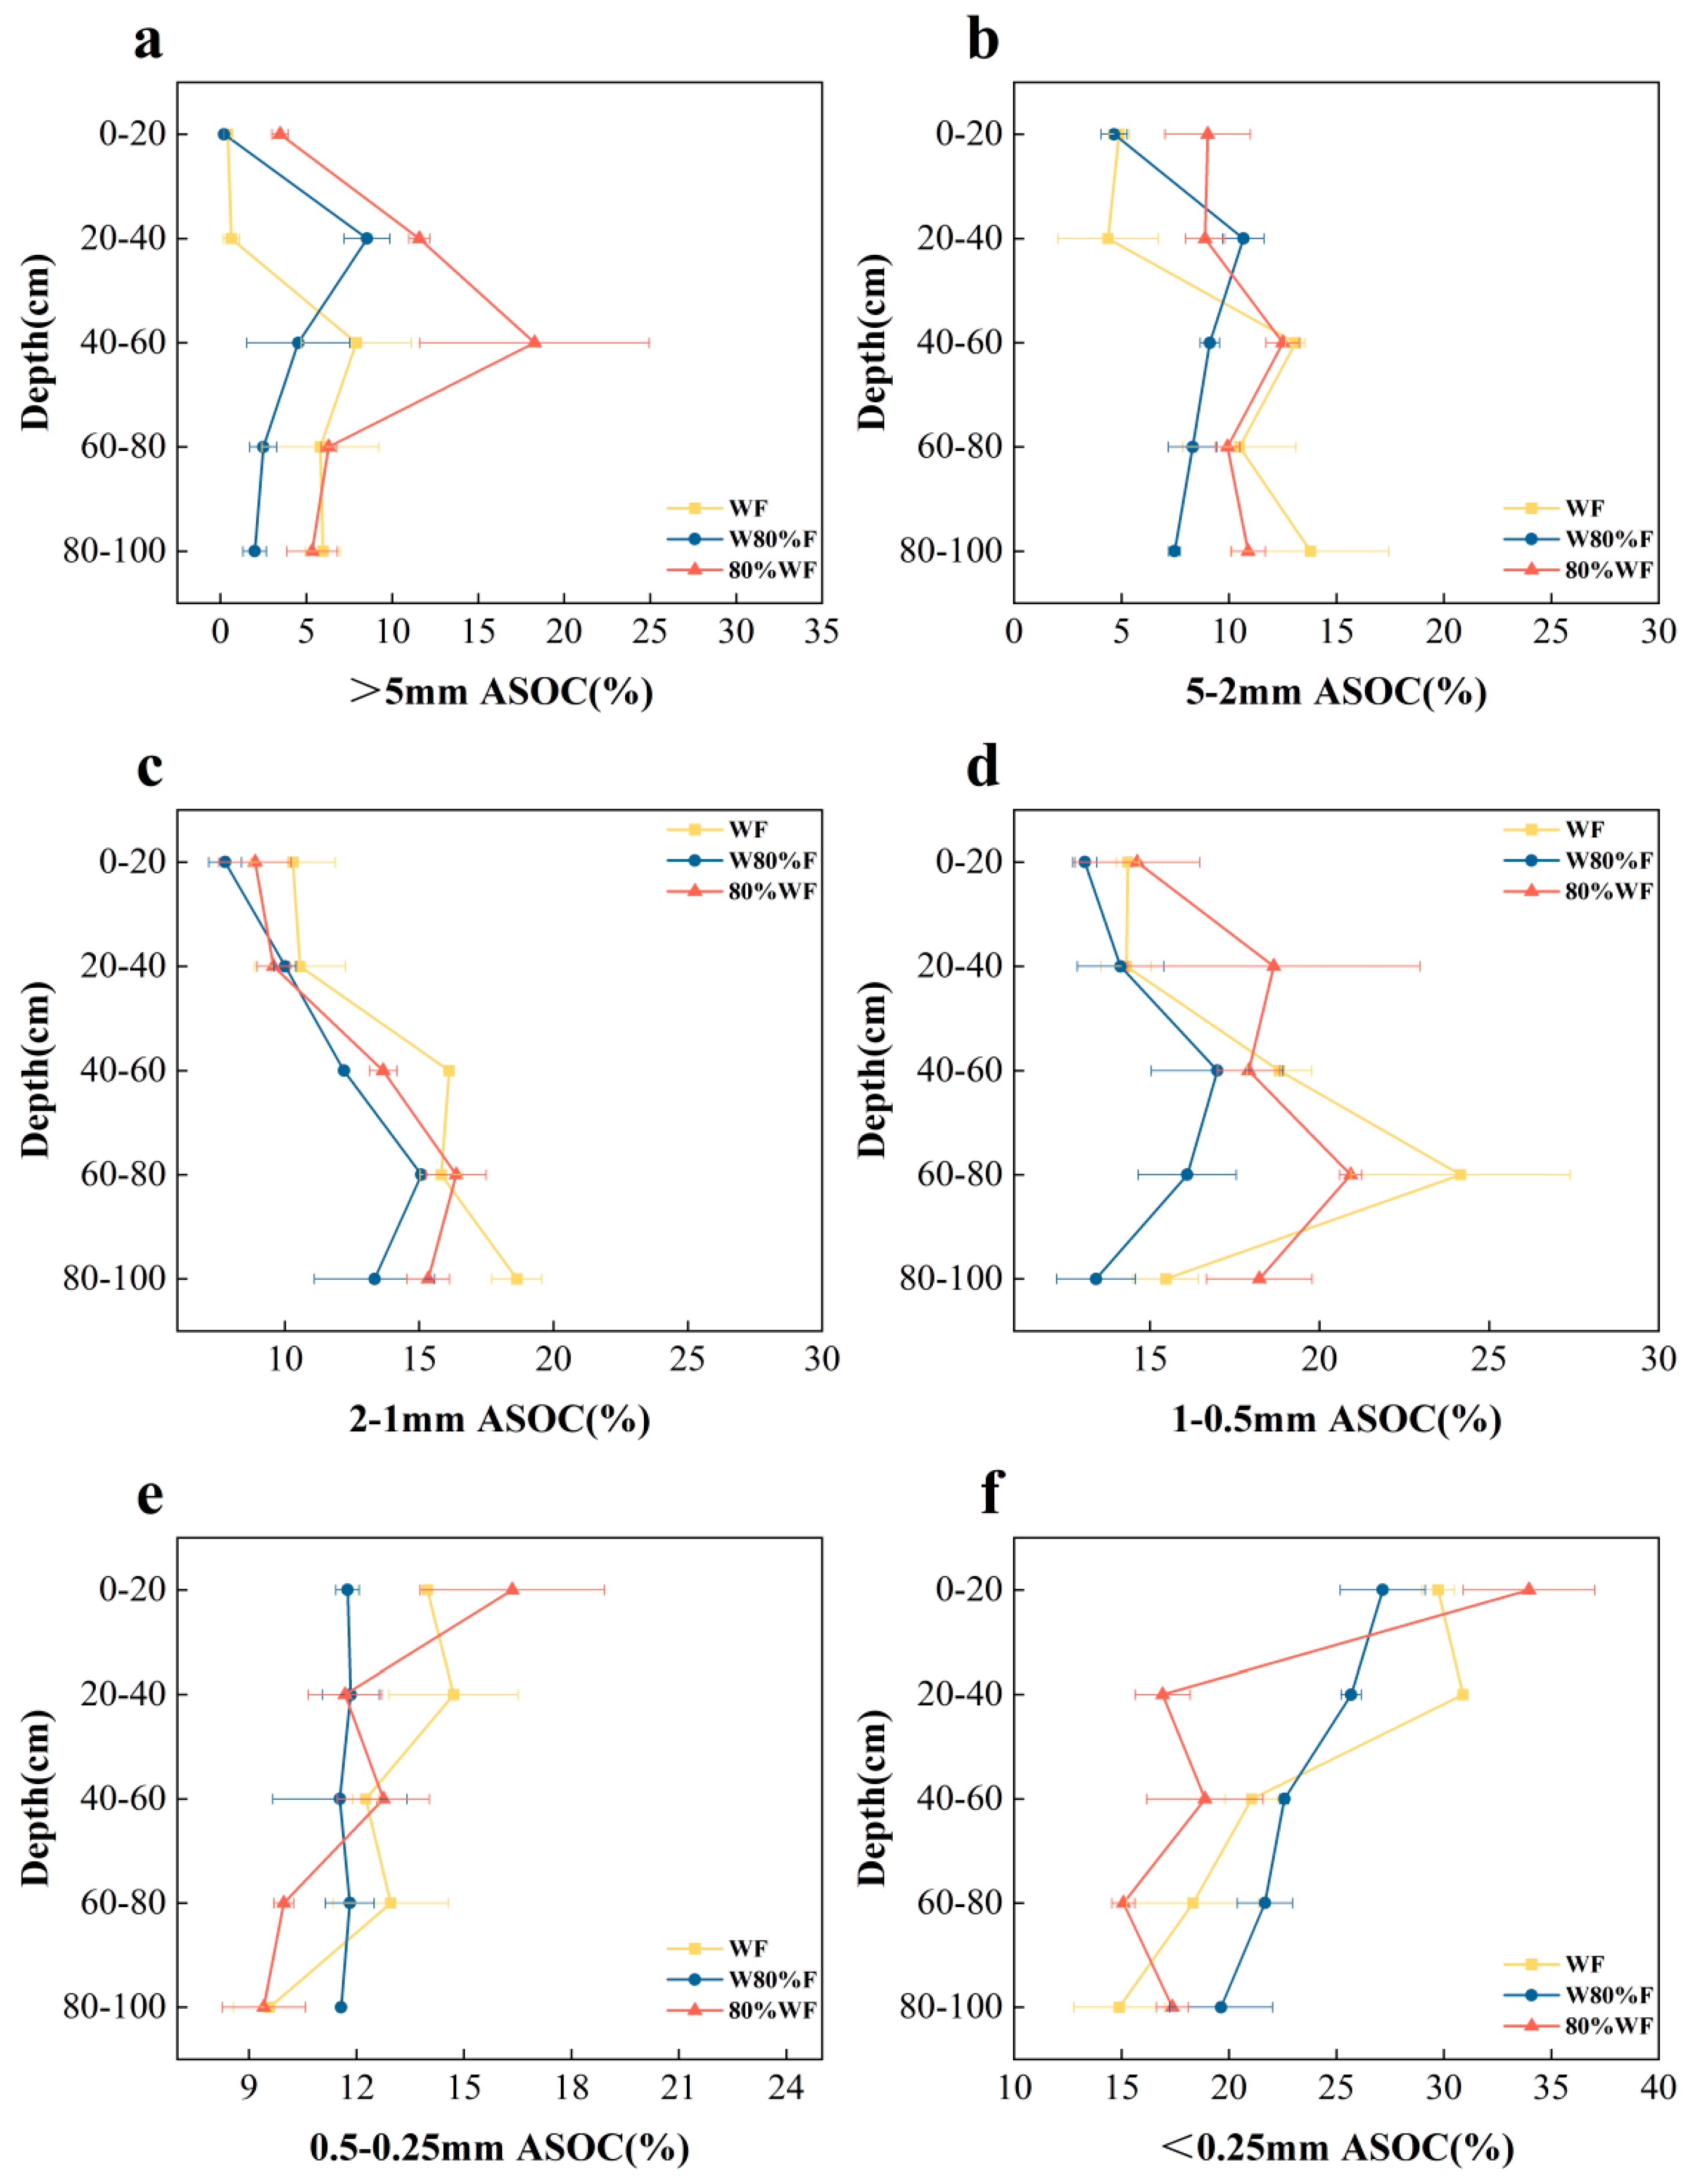
Different water and fertilizer management practices significantly affected the contribution of aggregate-associated organic carbon (ASOC) across particle sizes, and the effects varied with soil depth (Figure 5). Overall, ASOC contribution increased as particle size decreased, being lowest in macroaggregates (>5 mm) and highest in micro-microaggregates (<0.25 mm). In macroaggregates (>5 mm and 5–2 mm; Figure 5a,b), ASOC contribution to total organic carbon (TOC) was relatively high in the 40–60 cm layer, and under 80%WF it was significantly higher than under WF and W80%F (p < 0.05). In contrast, in the topsoil (0–20 cm), macroaggregate ASOC under 80%WF was lower than under WF. For mesoaggregates (2–1 mm and 1–0.5 mm; Figure 5c,d), the response to treatments was more complex. In the 0–40 cm layer, no significant differences were observed, whereas in the 40–60 cm layer, the contribution of 2–1 mm aggregates under WF was significantly lower than under W80%F and 80%WF. For microaggregates (0.5–0.25 mm and <0.25 mm; Figure 5e,f), ASOC contribution to TOC was the highest. In particular, the <0.25 mm fraction contributed more than 30% in the 0–40 cm layer. Compared with WF, W80%F significantly reduced microaggregate contribution in the 20–40 cm and 60–80 cm layers, while 80%WF maintained relatively high levels throughout the profile. ASOC contribution under 80%WF was generally high across particle sizes, especially in macroaggregates and micro-microaggregates, with a pronounced effect on soil organic carbon in deep layers. In contrast, W80%F reduced aggregate-associated carbon contribution in both topsoil and deep soil, with a marked decline particularly in micro-microaggregates.

3.3.4. Organic Carbon Fractions

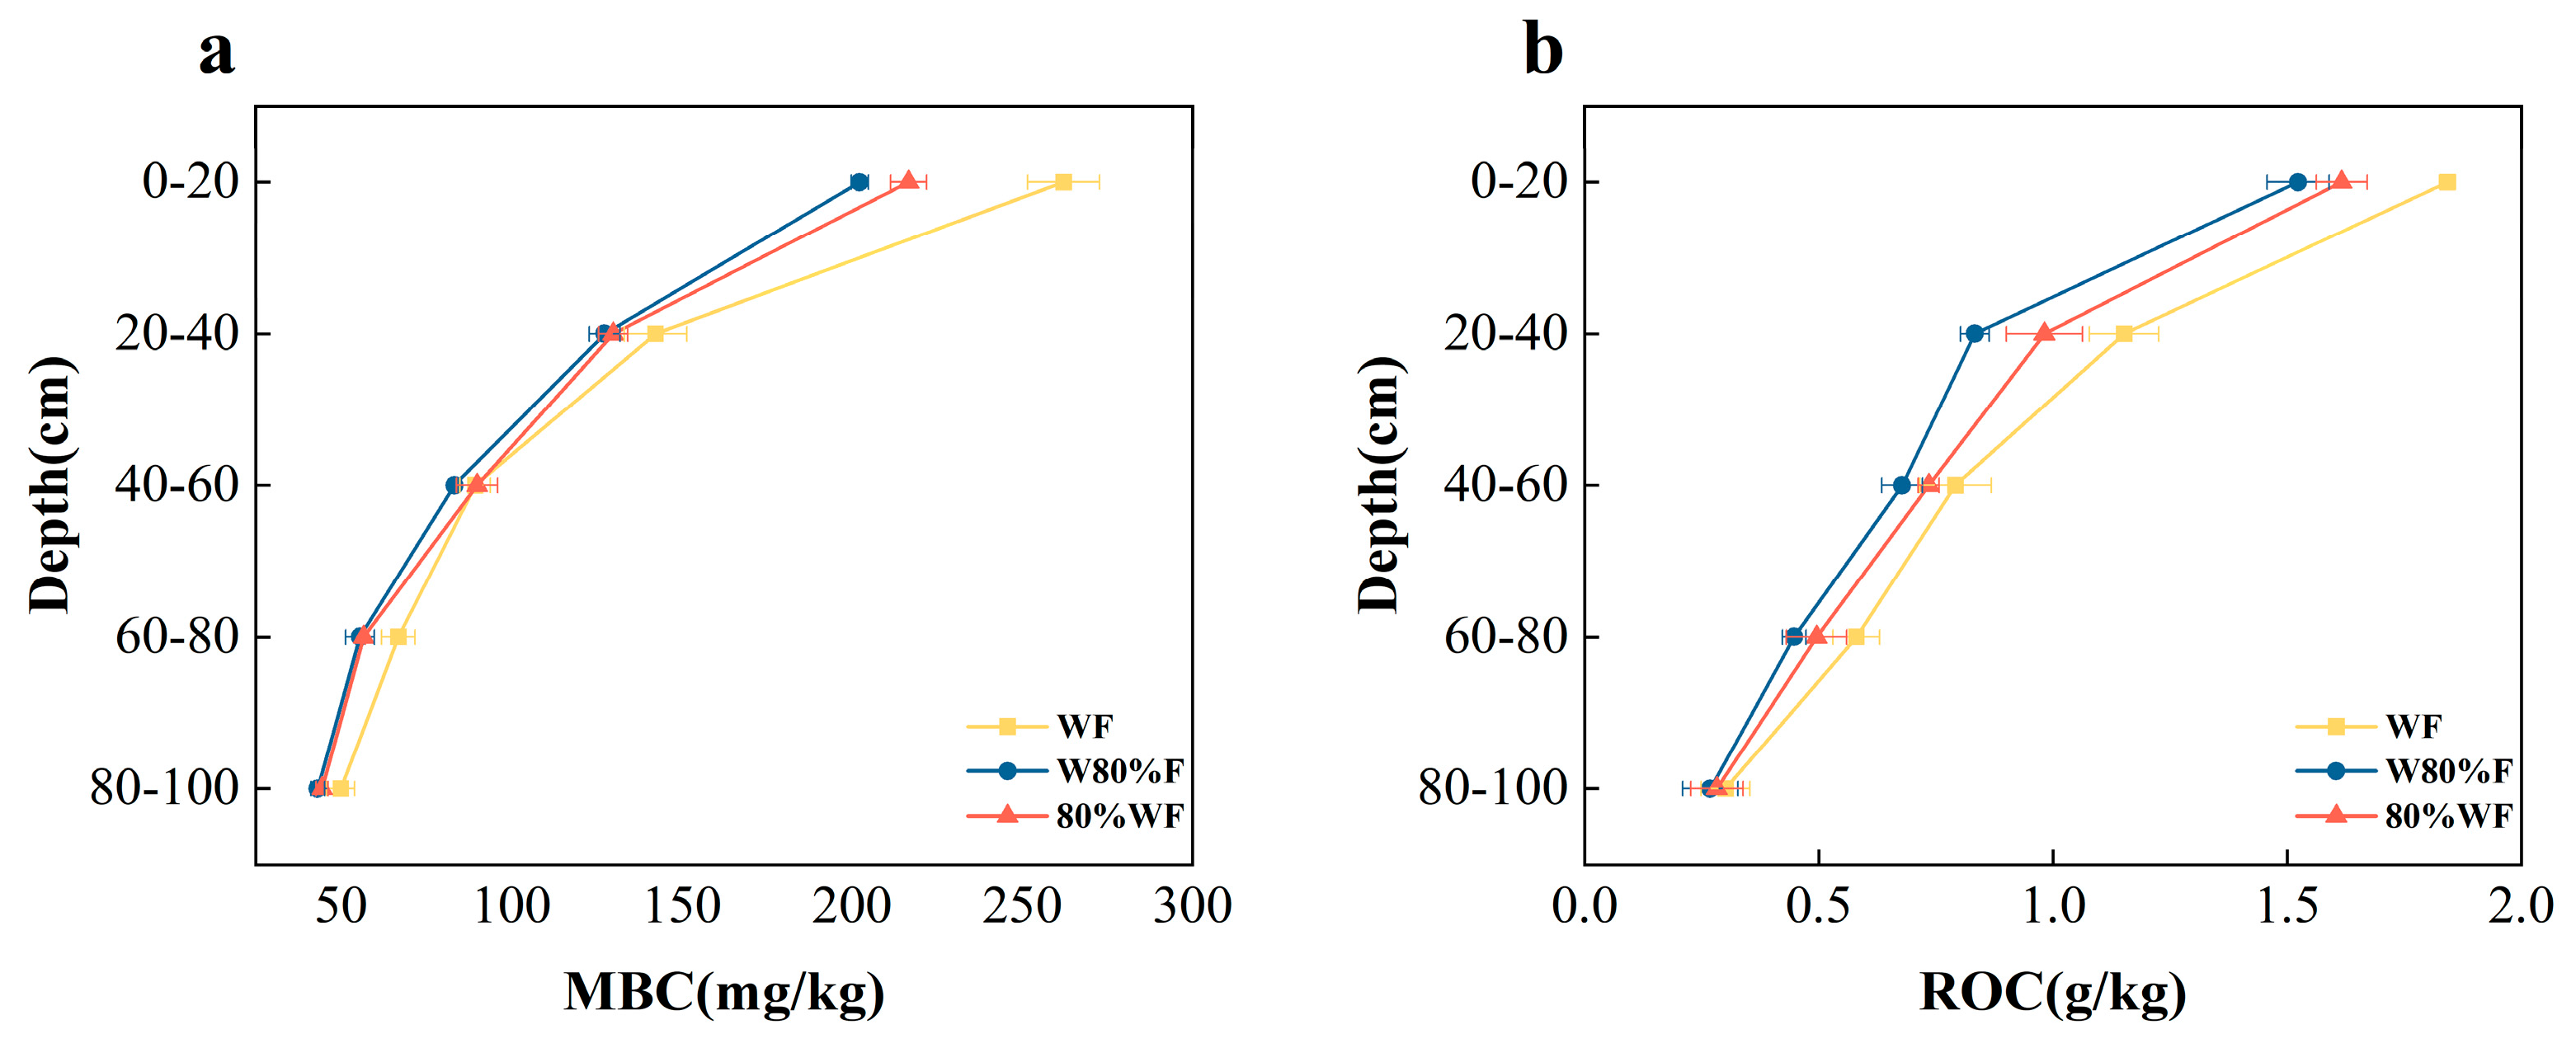
Different water and fertilizer management practices significantly affected soil microbial biomass carbon (MBC) across soil layers (Figure 6a). In the topsoil (0–20 cm), MBC under conventional treatment (WF) was the highest, significantly exceeding 80%WF (p < 0.05), while no difference was observed between W80%F and WF. With increasing depth, treatment differences narrowed, but WF maintained relatively high MBC levels in the 20–40 cm and 40–60 cm layers. In the deep soil (60–100 cm), MBC decreased overall, with no significant differences among treatments. These results indicate that moderate fertilizer reduction (W80%F) had little effect on topsoil microbial activity, whereas reduced irrigation (80%WF) significantly lowered MBC, suggesting that water supply more directly limited microbial activity. Similar to MBC, readily oxidizable carbon (ROC) was high in the topsoil and low in the deep soil (Figure 6b). In the 0–20 cm layer, WF exceeded W80%F and 80%WF (p < 0.05), indicating that conventional treatment favored organic carbon accumulation and retention of active components. In the 20–40 cm layer, WF and W80%F were higher than 80%WF, further indicating that reduced irrigation negatively affected ROC. From 40 to 100 cm, treatment differences narrowed and overall ROC was low, suggesting limited effects of water and fertilizer regulation on deep-soil organic carbon activity. Overall, no significant differences were found between W80%F and WF for MBC and ROC, indicating that moderate fertilizer reduction could sustain soil activity while reducing inputs and improving fertilizer use efficiency. Although 80%WF slightly reduced active carbon and microbial activity in the topsoil, it maintained levels close to WF in deeper soil, suggesting that irrigation reduction does not compromise the overall soil carbon activity reserve.

3.4. Correlations Among Aggregates, Stability, and Organic Carbon

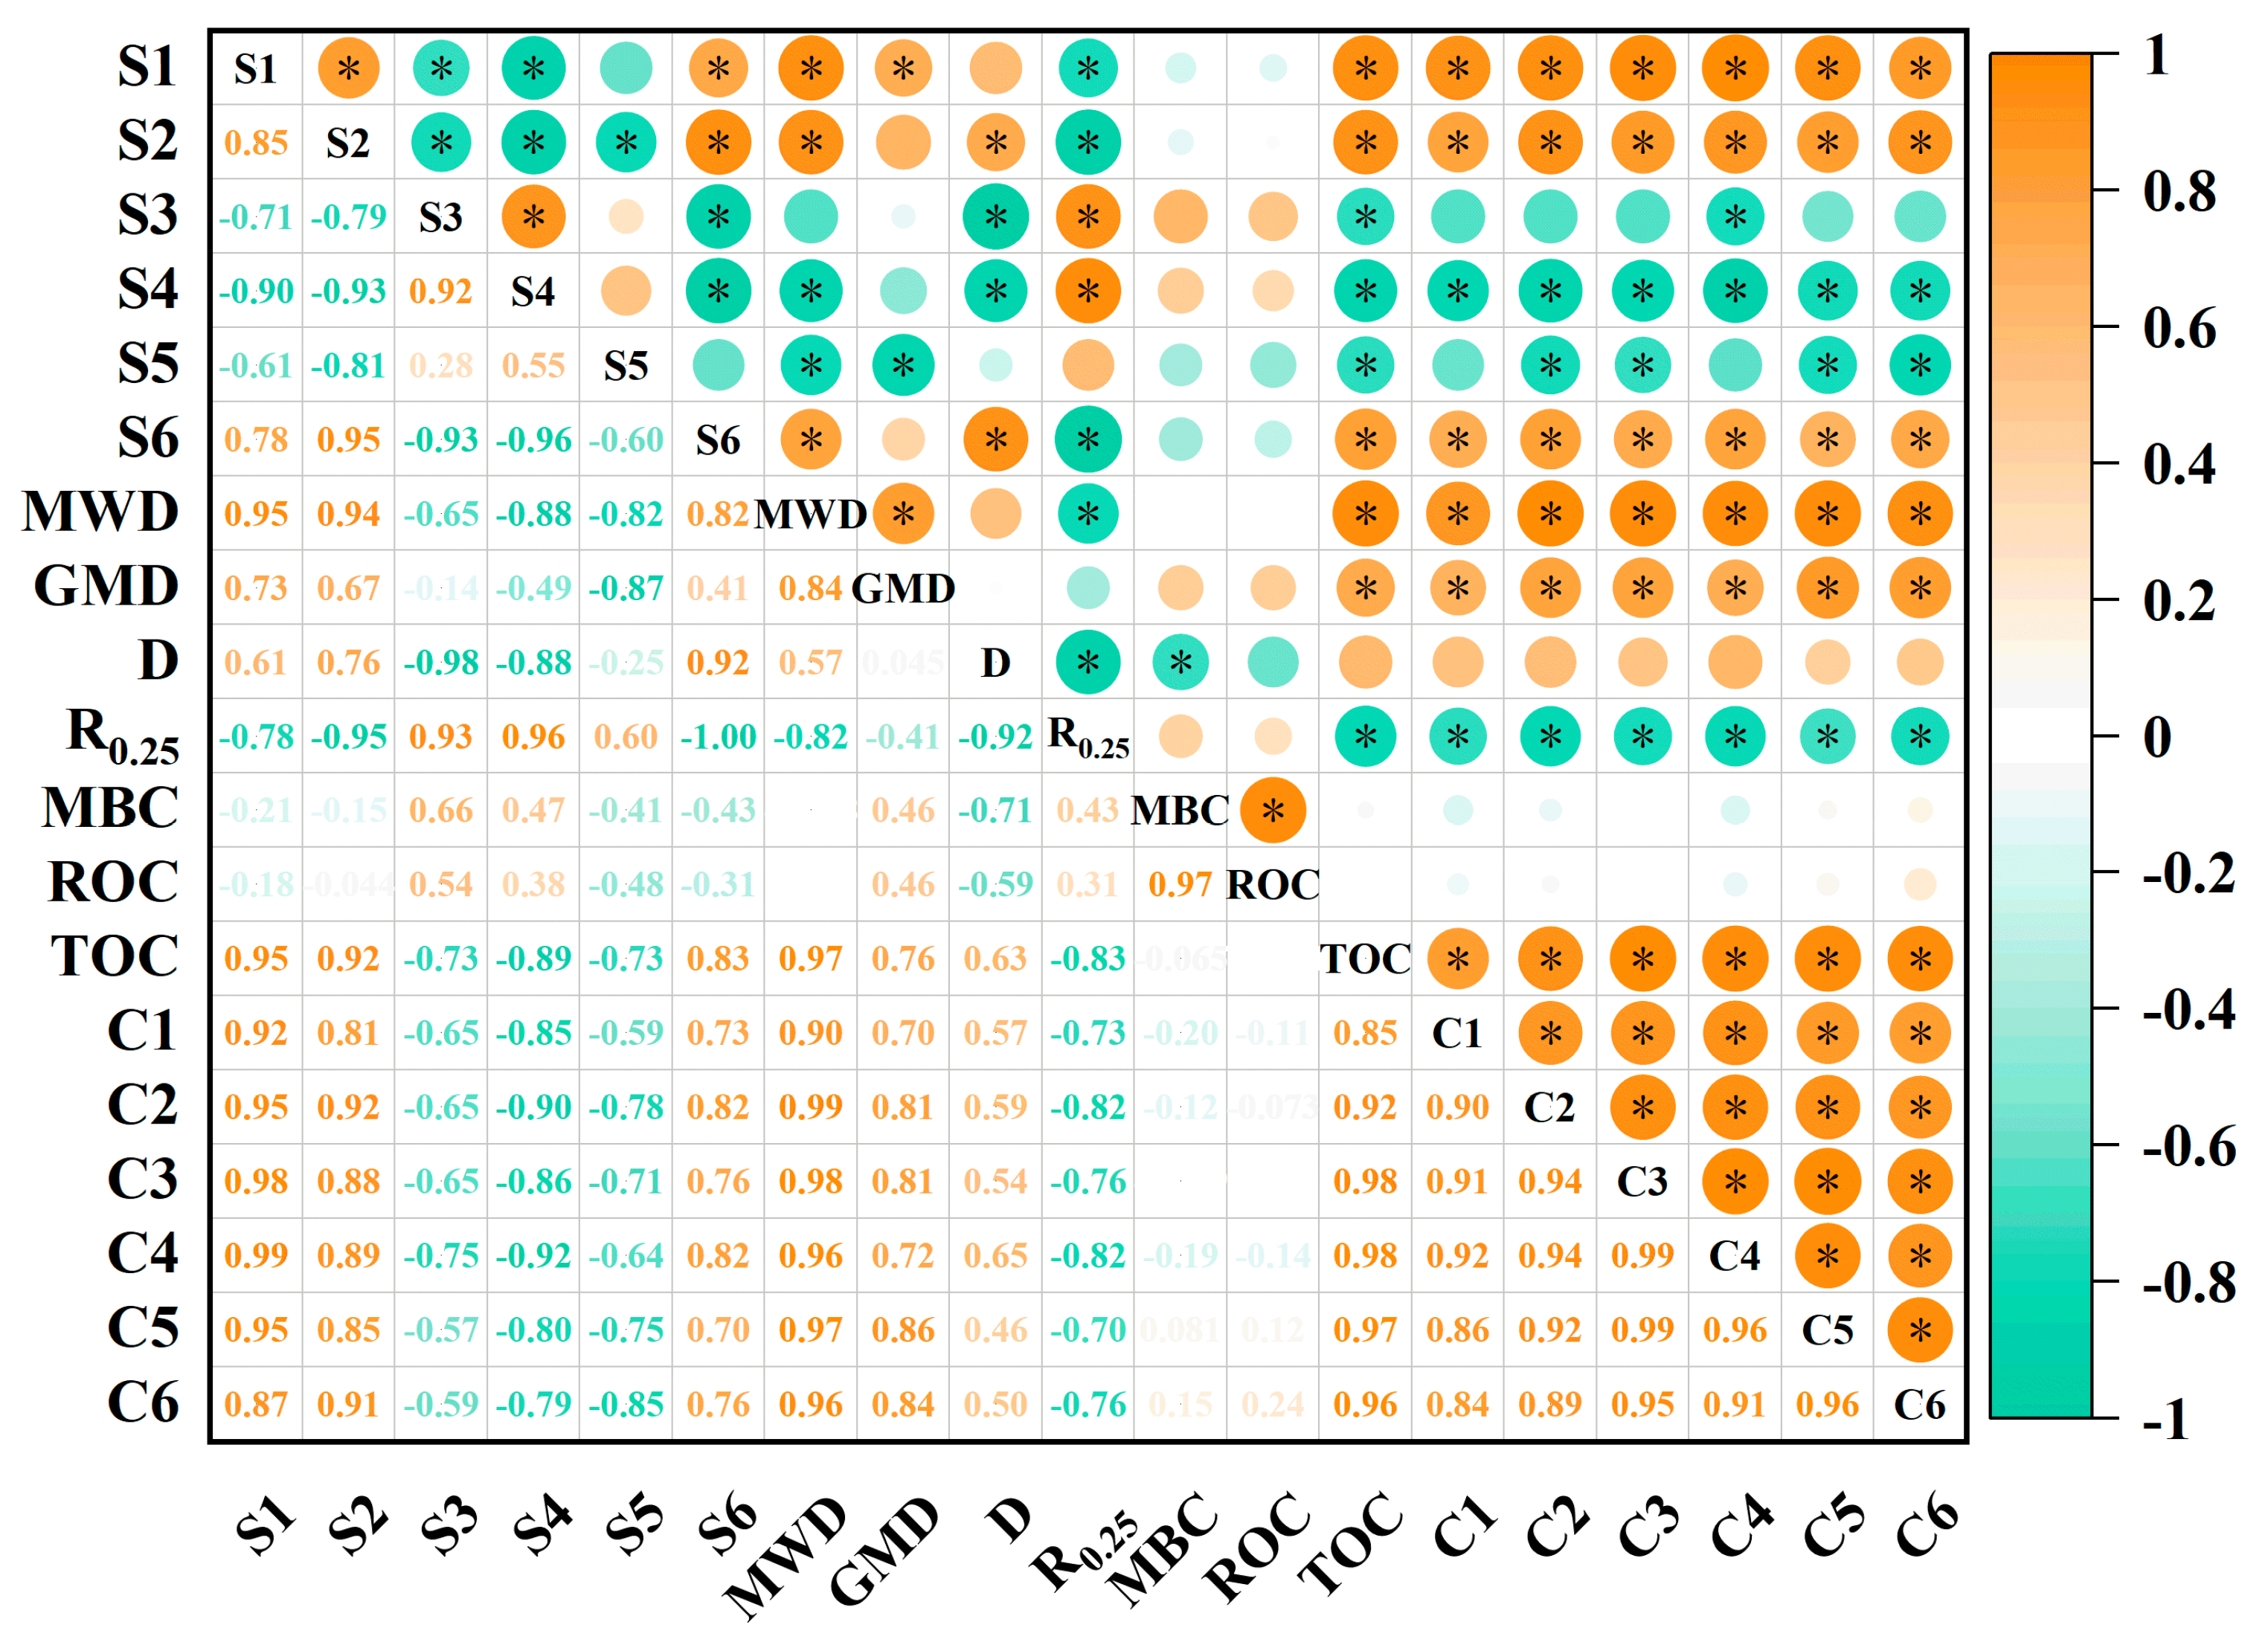
In the 0–20 cm soil layer, significant correlations were observed among aggregates of different particle sizes, organic carbon fractions, active carbon, and structural stability indices (Figure 7). Macroaggregates (S1, S2) and their carbon fractions (C1, C2) exhibited strong positive correlations with stability indices, including TOC, MWD, and GMD. In contrast, microaggregates (S5, S6) and their carbon fractions (C5, C6) correlated positively with MBC and ROC but negatively with structural stability indices. The fractal D was negatively correlated with aggregate stability, indicating that greater soil stability corresponded to lower D values. These results suggest that macroaggregates primarily determine soil carbon sequestration and structural stability, whereas microaggregates are more involved in carbon activation and microbial processes. MBC exhibited a strong non-linear relationship with the content of >5 mm soil aggregates (SAG) (R2 = 0.94, p < 0.05). At ~215 mg·kg−1 MBC, the proportion of macroaggregates peaked (~4%) and then declined with further increases in MBC (Figure S1a). Similarly, MBC and >5 mm aggregate-associated organic carbon (AOC) followed a Gaussian trend (R2 = 0.87, p < 0.05), peaking at ~218 mg·kg−1 MBC with ~34 g·kg−1 AOC (Figure S1b). This result suggests that an optimal level of microbial activity (MBC) promotes the formation of large aggregates and the accumulation of their associated carbon pools. This relationship is likely linked to the role of microbial metabolites in promoting aggregate agglomeration However, when MBC levels are excessively high, the proportion of large aggregates and their carbon content decline. This phenomenon may indicate that excessive microbial activity accelerates organic matter decomposition and weakens aggregate stability. This aligns with the correlation analysis (Figure 7), showing that macroaggregates and their carbon fractions are primarily linked to structural stability, whereas excessive microbial activation accelerates carbon turnover.
Principal Component Analysis (PCA) further supported these findings. PC1 and PC2 together explained 90.1% of data variation, effectively reflecting the main sources of differences (Figure S2). In terms of distribution, 80%WF samples clustered in the first and second quadrants, aligning with vectors for organic carbon accumulation (TOC, AOC) and structural stability (MWD, macroaggregate content). This indicates that water-reduced treatment enhances soil carbon sequestration and structural stability, reflecting stronger long-term ecological benefits. In contrast, WF and W80%F samples clustered in the third and fourth quadrants, aligning with vectors for microbial activity (MBC, ROC) and microaggregate content. This suggests that under conventional or fertilizer-reduced conditions, soils maintain high microbial activity and rapid carbon cycling, supporting short-term nutrient supply. Overall, PCA confirmed the correlation analysis: water-reduced treatment improves soil structure and stable carbon sequestration, whereas conventional management favors microbial activity and carbon turnover. These results indicate that different water and fertilizer regimes involve trade-offs and complementarities in soil ecological functions, and a balanced combination of water- and fertilizer-reduction strategies may optimize both soil activity and structural stability.

3.5. Eggplants Yield

From the perspective of crop yield, the 80%WF treatment significantly improved soil structure and carbon sequestration but resulted in a lower eggplant yield than the WF treatment (Table S9). In protected vegetable production, excessive water savings can partially limit crop biomass accumulation and economic yield [20]. In contrast, reducing fertilizer input alone has a relatively minor effect on yield but fails to achieve both improved soil quality and enhanced carbon sequestration. As demonstrated in our previous studies, future research should further investigate integrated management strategies that combine carbon-based amendments such as biochar with moderate water reduction. Such approaches could maintain crop yield while improving soil aggregate stability and carbon storage capacity, thereby promoting efficient water use and synergistic enhancement of the carbon sink function in protected agriculture.

4. Discussion

4.1. Effects of Different Water and Fertilizer Management Practices on Soil Aggregate Composition and Stability

Previous studies have shown that water and nutrients are key regulators of soil aggregate formation and stability [26,27]. However, most studies have focused on individual factors, with limited understanding of their interactions [28,29]. Our results showed that micro-microaggregates had the highest proportion and macroaggregates the lowest, with the largest differences occurring in the topsoil, consistent with the “microaggregate-dominated” rule [30]. In the topsoil and midsoil, moderate water reduction (80%WF) increased macroaggregates and reduced micro-microaggregates, thereby raising MWD and GMD and lowering D, indicating greater structural stability (see Section 3.1 and Section 3.2). In contrast, fertilizer reduction (W80%F) decreased macroaggregate content and weakened stability. This difference reflects the role of water and nutrients in regulating cementing substance formation and disintegration risk. Under moderate water reduction, the risk of wet disintegration decreases and aggregate structure becomes more stable [31]. Moderate soil moisture reduction also suppresses particle and colloid dispersion, thereby enhancing cementation between organic matter and clay–oxide complexes [32]. Conversely, nutrient deficiency limits the supply of “biological cementing agents,” such as root exudates and microbial polysaccharides, thereby weakening aggregate formation [33]. This supports findings that long-term sole application of inorganic fertilizers may decrease SOC [34]. Overall, this study demonstrates that moderate water regulation is more effective than nutrient regulation alone in promoting macroaggregate formation and soil stability, thereby enhancing SOC protection. These findings provide empirical support for optimizing water and fertilizer management to enhance the carbon sink function of farmland. This study did not directly measure soil stratified parameters, including moisture content (θ/SWC), electrical conductivity (EC), and redox potential. Because the experiment was conducted in a closed greenhouse, temperature, humidity, and water distribution remained controlled and stable. The irrigation and mulching conditions were consistent with those used in our previous study conducted at the same site [20]. The inference that “surface moisture dominates aggregate formation” is a reasonable deduction supported by previous measurements and management experience [20]. However, the absence of direct observations of stratified water and salt content represents a limitation of this study. Future studies will monitor water dynamics and variations in EC across soil layers to better elucidate the mechanisms by which water regulates aggregate evolution.

4.2. Interactive Effects of Different Water and Fertilizer Management Practices on Soil Organic Carbon and Aggregates

Soil aggregates are key physical carriers of organic carbon stabilization, and aggregate-associated organic carbon (AOC) is closely linked to total organic carbon (TOC) sequestration [35]. Results showed that AOC and TOC contents in aggregates of different particle sizes decreased with depth, consistent with the overall TOC distribution (see Section 3.3). In most soil layers and size fractions, 80%WF significantly increased AOC and TOC, whereas W80%F weakened carbon sequestration. In the topsoil, TOC under 80%WF was ~20% higher than WF and ~35% higher than W80%F. In the 20–40 cm and 40–60 cm layers, TOC increases under 80%WF were even greater (~63% and ~58%, respectively). These results suggest that moderate water reduction enhances carbon sequestration by promoting aggregate formation and physical protection of organic carbon. Active carbon fractions further revealed carbon cycling mechanisms under different treatments. MBC and ROC were highest under WF but significantly lower under 80%WF and W80%F (see Section 3.3.4). This indicates that adequate water and fertilizer promoted microbial activity and rapid carbon turnover [36], whereas water reduction or nutrient limitation reduced microbial activity, decreasing decomposition and facilitating sequestration, consistent with the meta-analysis [37]. Notably, MBC showed a non-linear relationship with both macroaggregate content and its AOC, first increasing and then decreasing (see Section 3.4). This suggests that moderate microbial activity promotes macroaggregate formation and carbon accumulation, whereas excessive activity accelerates decomposition and hinders carbon sequestration, aligning with the “microbial efficiency–matrix stabilization” hypothesis [38,39]. PCA results further showed that 80%WF aligned with TOC, macroaggregates, and structural stability indices, whereas WF and W80%F were closer to MBC, ROC, and micro-microaggregates. This indicates that the two management regimes drive soils toward distinct functional pathways: “carbon sequestration” under 80%WF and “rapid turnover” under WF and W80%F. In summary, 80%WF enhances SOC sequestration through a dual mechanism: reducing excessive microbial activity and carbon loss while promoting aggregate formation and physical protection. In contrast, fertilizer reduction weakens carbon accumulation in small and micro-microaggregates, limiting SOC sequestration in deep soil. Therefore, combining water reduction with moderate nutrient management is expected to better balance carbon sequestration and nutrient supply.

5. Conclusions

This study provides a comprehensive yet preliminary assessment of soil aggregate structure, stability, and organic carbon sequestration under different water–fertilizer management regimes in greenhouse vegetable fields of the black soil region. Moderate water reduction (80%WF) markedly increased the proportion and stability of macro- and meso-aggregates, enhanced MWD and GMD, and lowered the D value, thereby improving soil structure and strengthening carbon sequestration. In contrast, fertilizer reduction (W80%F) impaired aggregate stability and SOC accumulation, particularly in deeper layers. Water availability was identified as the primary driver in surface and subsurface layers, whereas nutrient supply exerted greater influence at depth. The nonlinear relationship between MBC and aggregate-associated AOC suggests that moderate microbial activity promotes aggregate formation and carbon accrual, whereas excessive activity accelerates decomposition and undermines sequestration. Overall, moderate water reduction outperformed fertilizer reduction in improving soil physical quality and enhancing carbon sink capacity, offering a practical strategy for sustainable greenhouse agriculture. Overall, moderate water reduction tended to outperform fertilizer reduction in improving soil physical quality and enhancing carbon sink potential. Uncertainties and the absence of soil moisture, electrical conductivity, and crop yield data limit the generalizability of the findings. Future studies should incorporate these parameters and further integrate microbial community dynamics with carbon cycling processes to elucidate the mechanisms governing carbon stabilization under varying water and fertilizer management.

Supplementary Materials

The following supporting information can be downloaded at: https://www.mdpi.com/article/10.3390/agronomy15122672/s1, Figure S1. Gaussian Fitting; Figure S2. Principal component analysis; Figure S3. Principal component analysis; Table S1. Soil Basic Nutrient Status (2016); Table S2. Content of soil aggregates (SAG) with different particle sizes in response to different water and fertilizer management practices; Table S3. Soil aggregate stability indices under different water and fertilizer management regimes.; Table S4. Soil Stability Index (SSI) and 95% confidence intervals under different treatments and soil layers.; Table S5. Response of soil aggregate-associated organic carbon (AOC) to different water and fertilizer management practices; Table S6. Soil total organic carbon (TOC) content under different water and fertilizer management practices.; Table S7. Contribution of soil aggregate-associated organic carbon (ASOC) to soil total organic carbon (TOC) under different water and fertilizer management practices; Table S8. Effects of different water and fertilizer management practices on soil microbial biomass carbon (MBC) and readily oxidizable organic carbon (ROC); Table S9. Eggplant yield.

Author Contributions

Conceptualization: K.W., W.L. and X.J.; Investigation, K.W., W.L., J.H. and S.G.; Data Curation, K.W., W.L., M.Y. and X.J.; Supervision, K.W., W.L., M.Y. and X.J.; Methodology, K.W., W.L., S.G., Y.C., Y.S. and X.J.; Writing—Original Draft, K.W. and W.L.; Writing—Review and Editing, J.H., S.G., M.Y., Y.C., Y.S. and X.J.; Visualization, J.H.; Formal Analysis, J.H., S.G. and M.Y.; Project Administration, Y.C., Y.S. and X.J.; Validation, Y.C. and X.J.; Resources, Y.S.; Funding, Acquisition, X.J. All authors have read and agreed to the published version of the manuscript.

Funding

This research was funded by the National Key Research and Development Program of China (2023YFD1500105) and the National Science and Technology Basic Resources Survey Special Project (2021FY100400). The APC was funded by National Key Research and Development Program of China (2023YFD1500105).

Data Availability Statement

The data presented in this study are available on request from the corresponding author. The data are not publicly available because they are only stored locally and have not been deposited in a public repository.

Conflicts of Interest

The authors declare no conflicts of interest.

References

  1. Li, L.; Fu, M.; Zhu, Y.; Kang, H.; Wen, H. The current situation and trend of land ecological security evaluation from the perspective of global change. Ecol. Indic. 2024, 167, 112608. [Google Scholar] [CrossRef]
  2. Li, X.; Wang, Y.; Wang, Z. Quantifying the industrial development modes and their capability of realizing the ecological value in rural China. Technol. Forecast. Soc. Change 2024, 203, 123386. [Google Scholar] [CrossRef]
  3. Zhang, Z.; Yu, Z.; Zhang, Y.; Shi, Y. Finding the fertilization optimization to balance grain yield and soil greenhouse gas emissions under water-saving irrigation. Soil Tillage Res. 2021, 214, 105167. [Google Scholar] [CrossRef]
  4. Liu, X.; Wu, X.; Xia, T.; Fan, Z.; Shi, W.; Li, Y.; Li, T. New insights of designing thermal insulation and heat storage of Chinese solar greenhouse in high latitudes and cold regions. Energy 2022, 242, 122953. [Google Scholar] [CrossRef]
  5. Fan, B.; Zhang, Y.; Fenton, O.; Daly, K.; Li, J.; Wang, H.; Zhai, L.; Luo, X.; Lei, Q.; Wu, S.; et al. Irrigation and nitrogen fertiliser optimisation in protected vegetable fields of northern China: Achieving environmental and agronomic sustainability. J. Integr. Agric. 2024, 23, 1022–1033. [Google Scholar] [CrossRef]
  6. NCBS (National Bureau of Statistics of China). China Statistical Yearbook; China Statistics Press: Beijing, China, 2019. (In Chinese)
  7. Wang, J.; Li, Y.; Zhu, Z.; Liu, S.; Zhang, L.; Liang, A. Reduced tillage boosts carbon-nitrogen synergy in black soil: Evidence from stable isotope dynamics. Agric. Ecosyst. Environ. 2025, 387, 109621. [Google Scholar] [CrossRef]
  8. Zavalin, A.A.; Dridiger, V.K.; Belobrov, V.P.; Yudin, S.A. Nitrogen in Chernozems under Traditional and Direct Seeding Cropping Systems: A Review. Eurasian Soil Sci. 2018, 51, 1497–1506. [Google Scholar] [CrossRef]
  9. Li, H.; Jia, B.; Wang, H.; Li, D.; Fang, Q.; He, J.; Lv, X.; Li, R. Optimizing irrigation and nitrogen rates for sustainable wheat production: Balancing yield and nitrate leaching in a 7-year field study. Soil Tillage Res. 2025, 255, 106822. [Google Scholar] [CrossRef]
  10. Lal, R. Soil carbon sequestration to mitigate climate change. Geoderma 2004, 123, 1–22. [Google Scholar] [CrossRef]
  11. Amundson, R.; Berhe, A.A.; Hopmans, J.W.; Olson, C.; Sztein, A.E.; Sparks, D.L. Soil and human security in the 21st century. Science 2015, 348, 1261071. [Google Scholar] [CrossRef] [PubMed]
  12. Tisdall, J.M.; Oades, J.M. Organic matter and water-stable aggregates in soils. J. Soil Sci. 1982, 33, 141–163. [Google Scholar] [CrossRef]
  13. Six, J.; Elliott, E.T.; Paustian, K. Soil Structure and Soil Organic Matter II. A Normalized Stability Index and the Effect of Mineralogy. Soil Sci. Soc. Amer. J. 2000, 64, 1042–1049. [Google Scholar] [CrossRef]
  14. Albalasmeh, A.A.; Berli, M.; Shafer, D.S.; Ghezzehei, T.A. Degradation of moist soil aggregates by rapid temperature rise under low intensity fire. Plant Soil 2013, 362, 335–344. [Google Scholar] [CrossRef]
  15. Murugan, R.; Djukic, I.; Keiblinger, K.; Zehetner, F.; Bierbaumer, M.; Zechmeister-Bolternstern, S.; Joergernsen, R.G. Spatial distribution of microbial biomass and residues across soil aggregate fractions at different elevations in the Central Austrian Alps. Geoderma 2019, 339, 1–8. [Google Scholar] [CrossRef]
  16. Zhang, J.; Chi, F.; Wei, D.; Zhou, B.; Cai, S.; Li, Y.; Kuang, E.; Sun, L.; Li, L.-J. Impacts of Long-term Fertilization on the Molecular Structure of Humic Acid and Organic Carbon Content in Soil Aggregates in Black Soil. Sci. Rep. 2019, 9, 11908. [Google Scholar] [CrossRef]
  17. Durigan, M.; Cherubin, M.; De Camargo, P.; Ferreira, J.; Berenguer, E.; Gardner, T.; Barlow, J.; Dias, C.; Signor, D.; Junior, R.; et al. Soil Organic Matter Responses to Anthropogenic Forest Disturbance and Land Use Change in the Eastern Brazilian Amazon. Sustainability 2017, 9, 379. [Google Scholar] [CrossRef]
  18. Yang, X.; Bao, Y.; Li, B.; Wang, R.; Sun, C.; Ma, D.; Chen, L.; Zou, H.; Zhang, J. Effects of fertilization applications on soil aggregate organic carbon content and assessment of their influencing factors: A meta-analysis. CATENA 2024, 242, 108135. [Google Scholar] [CrossRef]
  19. Cheng, M.; Chen, Z.; Shi, T.; Ma, H.; Wen, Y.; Li, P.; Xu, M. Soil aggregate carbon stocks and sequestration efficiency under long-term fertilization across China’s croplands. Soil Tillage Res. 2025, 255, 106828. [Google Scholar] [CrossRef]
  20. Chen, Y.; Zhang, J.; Xu, X.; Qu, H.; Hou, M.; Zhou, K.; Jiao, X.; Sui, Y. Effects of different irrigation and fertilization practices on nitrogen leaching in facility vegetable production in northeastern China. Agric. Water Manag. 2018, 210, 165–170. [Google Scholar] [CrossRef]
  21. Jiang, W.; Li, T.; Ma, J.; Wang, X.; Cheng, Y.; Gong, L.; Zhang, J.; Chen, G. Organic materials input promotes the soil aggregate sequestration through changing soil aggregates structure and stability. J. Environ. Manag. 2025, 393, 127027. [Google Scholar] [CrossRef]
  22. Zheng, X.D.; Chen, X.B.; Liang, C.M.; Hu, Y.J.; Wu, J.S.; Su, Y.R. Influence of extractants and filter materials in the extraction of dissolved organic matter (DOM) from subtropical agricultural soil. Emir. J. Food Agric. 2018, 30, 165–172. [Google Scholar] [CrossRef]
  23. Vance, E.D.; Brookes, P.C.; Jenkinson, D.S. An extraction method for measuring soil microbial biomass C. Soil Biol. Biochem. 1987, 19, 703–707. [Google Scholar] [CrossRef]
  24. Li, Y.; Mou, X.; Zhang, Y.; Chen, Y.; Wang, X. Contrasting contributions of microbial and plant-derived C to soil carbon in desertified grassland restoration. Agric. Ecosyst. Environ. 2025, 385, 109579. [Google Scholar] [CrossRef]
  25. He, Z.; Zhu, X.; Zhou, F.; Zhu, M.; Bao, X.; Deng, F.; He, H.; Zhang, X. How bacterial traits scale to soil organic matter pool buildup revealed by long-term maize straw mulching experiment. Agric. Ecosyst. Environ. 2025, 393, 109816. [Google Scholar] [CrossRef]
  26. Six, J.; Elliott, E.T.; Paustian, K. Soil macroaggregate turnover and microaggregate formation: A mechanism for C sequestration under no-tillage agriculture. Soil Biol. Biochem. 2000, 32, 2099–2103. [Google Scholar] [CrossRef]
  27. Zhao, J.; Chen, S.; Hu, R.; Li, Y. Aggregate stability and size distribution of red soils under different land uses integrally regulated by soil organic matter, and iron and aluminum oxides. Soil Tillage Res. 2017, 167, 73–79. [Google Scholar] [CrossRef]
  28. Li, H.; Liu, G.; Dan, C.; Zhou, Z.; Liu, Y.; Liu, C.; Shen, E.; Zhang, Q.; Xia, X.; Liu, D.; et al. Effects of soil porosity on water stability of aggregates. Soil Tillage Res. 2025, 254, 106741. [Google Scholar] [CrossRef]
  29. Wu, X.; Wang, C.; Cai, C.; Yao, S.; Zhou, J. Divergent responses of aggregate breakdown by slaking to nitrogen forms in solution for contrasting soil types. Geoderma 2024, 449, 117016. [Google Scholar] [CrossRef]
  30. Totsche, K.U.; Amelung, W.; Gerzabek, M.H.; Guggenberger, G.; Klumpp, E.; Knief, C.; Lehndorff, E.; Mikutta, R.; Peth, S.; Prechtel, A.; et al. Microaggregates in soils. J. Plant Nutr. Soil Sci. 2018, 181, 104–136. [Google Scholar] [CrossRef]
  31. Li, X.; Guo, Q.; Jia, R.; Gao, Y. Revegetation drives the accrual and stabilization of organic carbon in biocrusts and subsoils in the Tengger Desert, north China. Geoderma 2025, 460, 117437. [Google Scholar] [CrossRef]
  32. Zhou, M.; Hu, P.; Wang, J.; Wang, X.; Zhou, F.; Zhai, X.; Pan, Z.; Wu, L.; Wang, Z. Aqueous and Colloidal Dynamics in Size-Fractionated Paddy Soil Aggregates with Multiple Metal Contaminants under Redox Alternations. Environ. Sci. Technol. 2024, 58, 18222–18233. [Google Scholar] [CrossRef]
  33. Xiao, T.; Li, P.; Fei, W.; Wang, J. Effects of vegetation roots on the structure and hydraulic properties of soils: A perspective review. Sci. Total Environ. 2024, 906, 167524. [Google Scholar] [CrossRef]
  34. Sun, X.; Zhang, C.; Liu, K.; Xu, M.; Cai, A. Long-term manure application enhances carbon use efficiency in soil aggregates by regulating microbial communities in cropland. Soil Biol. Biochem. 2025, 210, 109945. [Google Scholar] [CrossRef]
  35. Zhang, W.; Munkholm, L.J.; Heck, R.J.; Watts, C.W.; Jensen, J.L. Aggregate pore and shape properties were more strongly correlated to soil organic carbon in large aggregates: Evidence from a long-term management-induced soil carbon gradient. Geoderma 2025, 459, 117357. [Google Scholar] [CrossRef]
  36. Sun, H.; Wang, L.; Kumar, A.; Auwal, M.; Zwieten, L.V.; Ge, T.; Fu, Y.; Kuzyakov, Y. Nutrient availability mediates organic carbon turnover in paddy soils through regulating microbial metabolism. Geoderma 2025, 458, 117313. [Google Scholar] [CrossRef]
  37. Deng, C.; Li, R.; Xie, B.; Wan, Y.; Li, Z.; Liu, C. Impacts of the integrated pattern of water and land resources use on agricultural greenhouse gas emissions in China during 2006–2017: A water-land-energy-emissions nexus analysis. J. Clean. Prod. 2021, 308, 127221. [Google Scholar] [CrossRef]
  38. Cotrufo, M.F.; Wallenstein, M.D.; Boot, C.M.; Denef, K.; Paul, E. The M icrobial Efficiency-Matrix Stabilization (MEMS) framework integrates plant litter decomposition with soil organic matter stabilization: Do labile plant inputs form stable soil organic matter? Glob. Change Biol. 2013, 19, 988–995. [Google Scholar] [CrossRef]
  39. Xie, N.; Sun, L.; Lu, T.; Zhang, X.; Duan, N.; Wang, W.; Liang, X.; Fan, Y.; Liu, H. Effects of Adding Different Corn Residue Components on Soil and Aggregate Organic Carbon. Agriculture 2025, 15, 1050. [Google Scholar] [CrossRef]
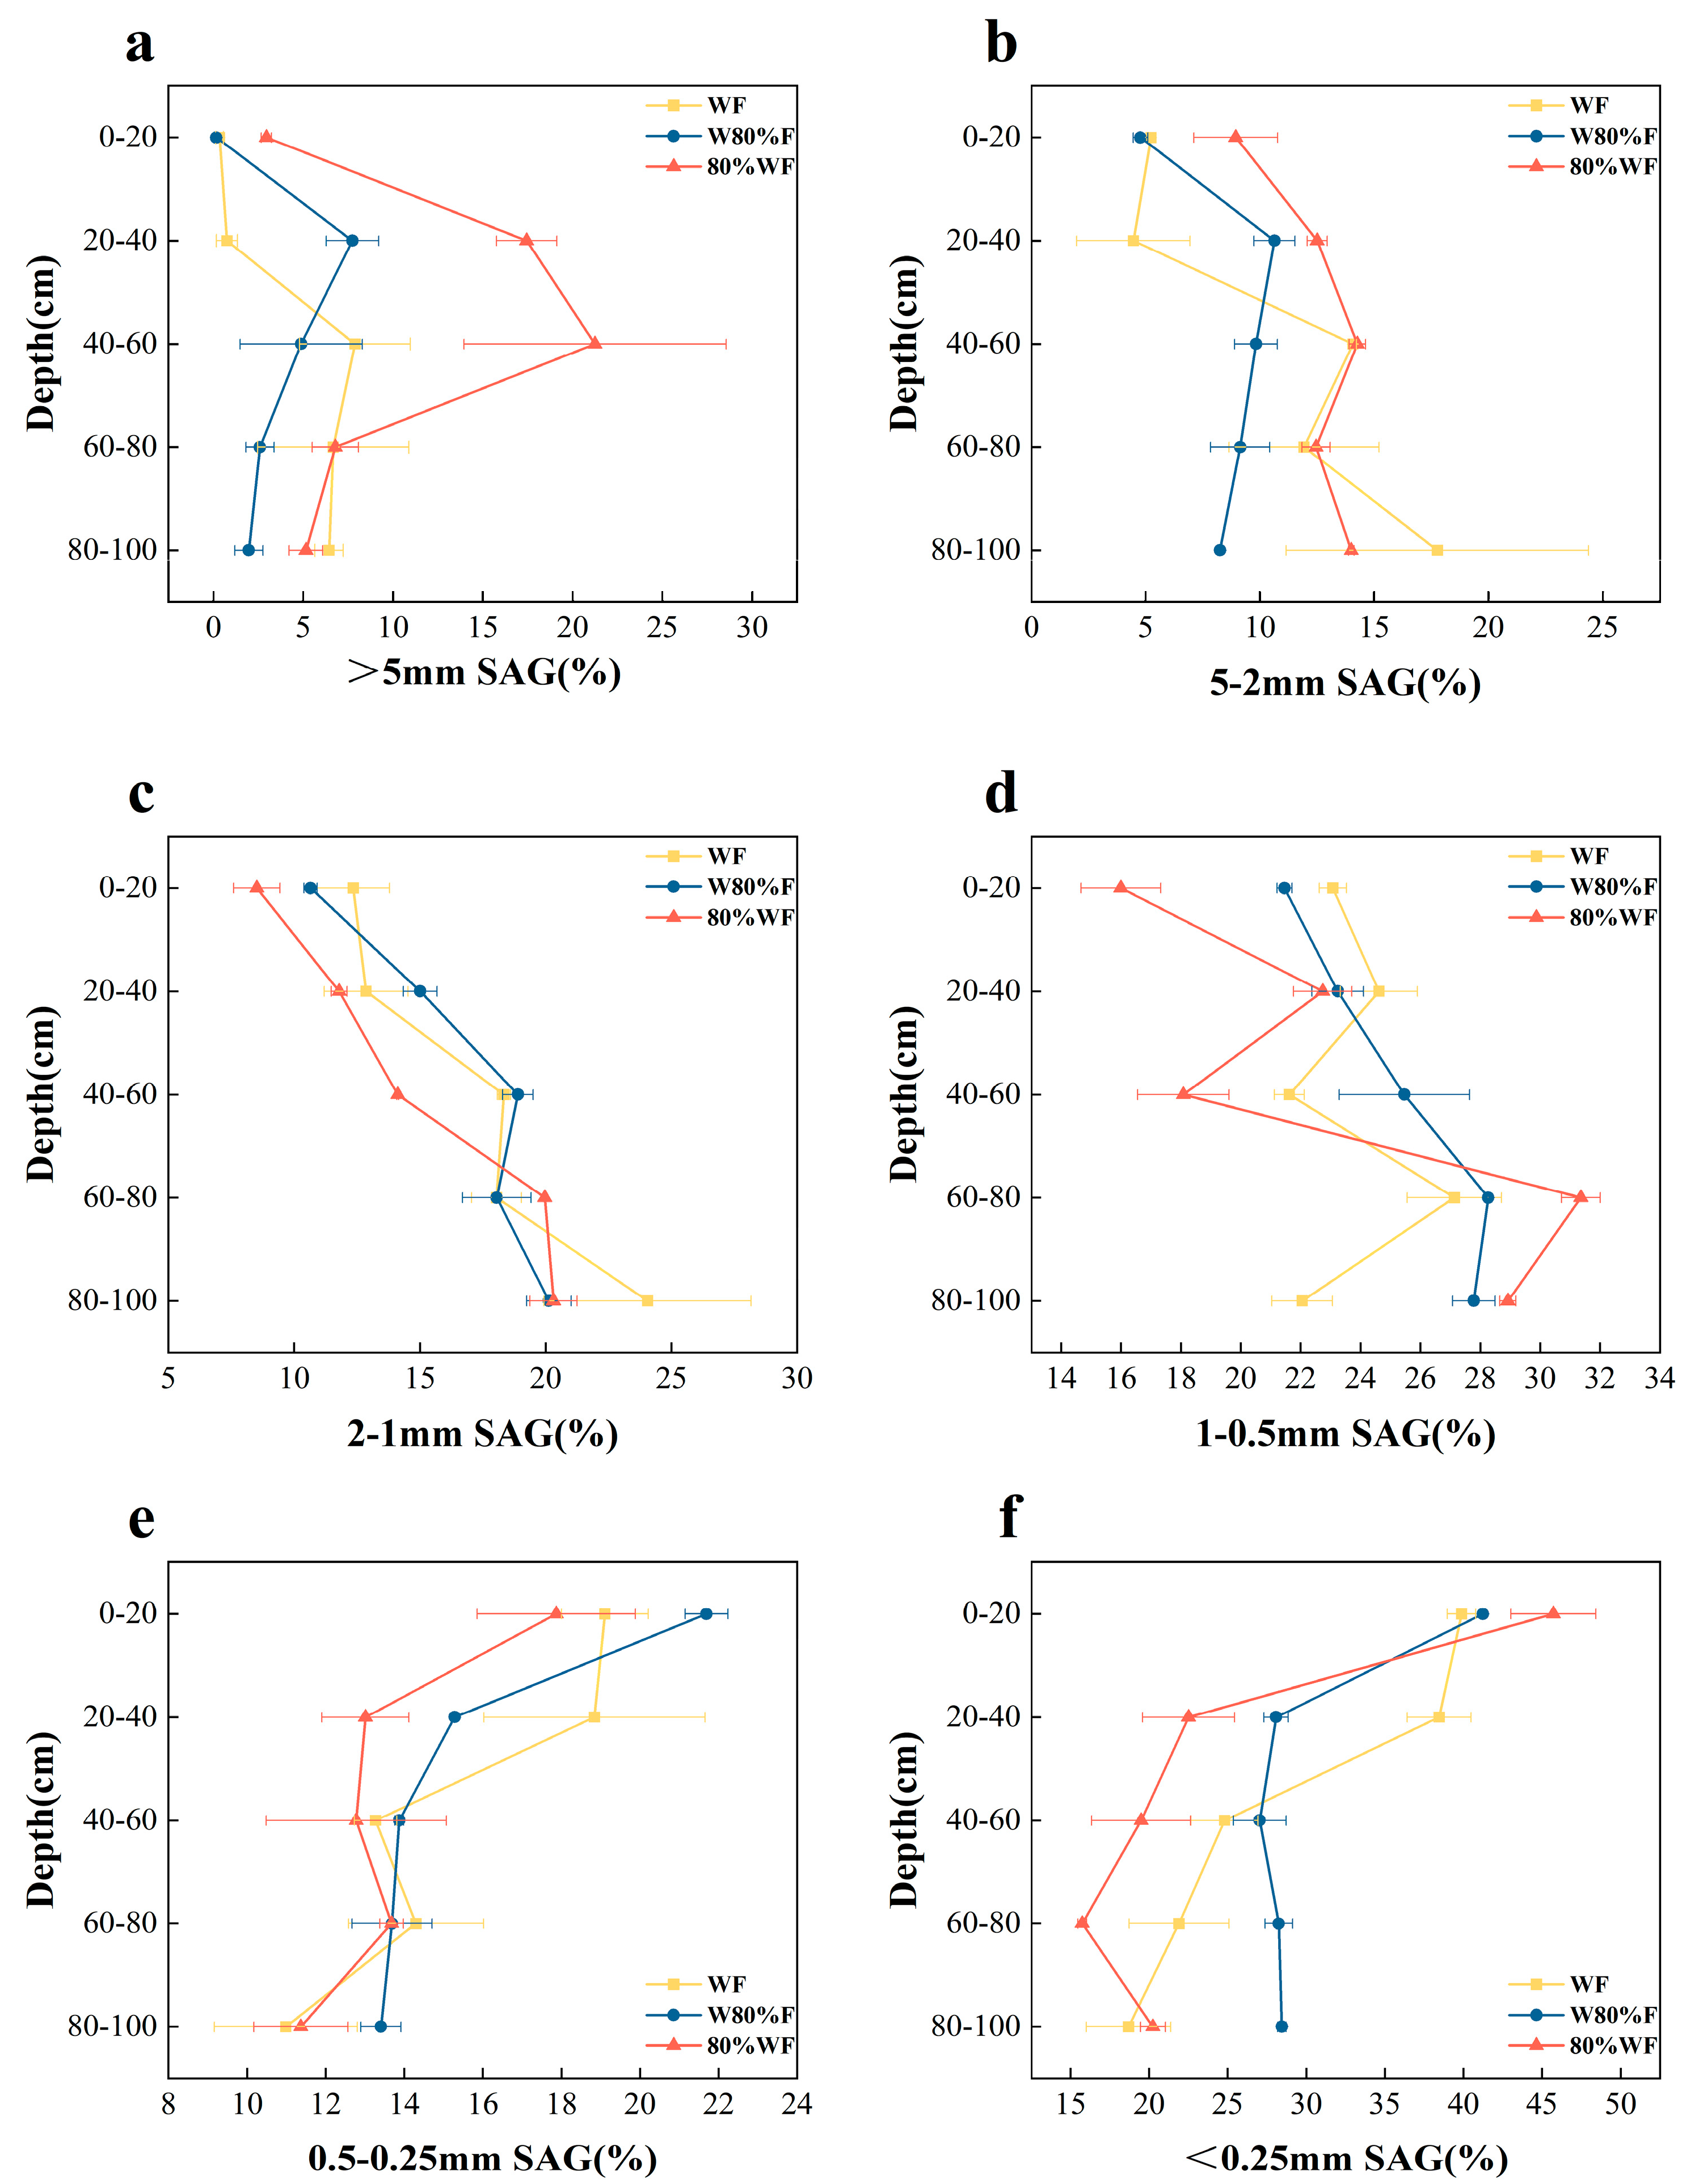
Figure 1. Content of soil aggregates (SAG) with different particle sizes in response to different water and fertilizer management practices ((a): >5 mm; (b): 5–2 mm; (c): 2–1 mm; (d): 1–0.5 mm; (e): 0.5–0.25 mm; (f): <0.25 mm). Statistical differences are shown in Table S2.
Agronomy 15 02672 g001
Figure 2. Soil aggregate stability indices under different water and fertilizer management regimes: (a) MWD, mean weight diameter; (b) GMD, geometric mean diameter; (c) D, fractal dimension; (d) R0.25, proportion of aggregates > 0.25 mm. Statistical differences are shown in Table S3.
Agronomy 15 02672 g002
Figure 3. Response of soil aggregate-associated organic carbon (AOC) to different water and fertilizer management practices: (a) >5 mm; (b) 5–2 mm; (c) 2–1 mm; (d) 1–0.5 mm; (e) 0.5–0.25 mm; (f) <0.25 mm. Values are mean ± SD (n = 3). Statistical differences are shown in Table S5.
Agronomy 15 02672 g003
Figure 4. Soil total organic carbon (TOC) content under different water and fertilizer management practices. Statistical differences are shown in Table S6.
Agronomy 15 02672 g004
Figure 5. Contribution of soil aggregate-associated organic carbon (ASOC) to soil total organic carbon (TOC) under different water and fertilizer management practices: (a) >5 mm; (b) 5–2 mm; (c) 2–1 mm; (d) 1–0.5 mm; (e) 0.5–0.25 mm; (f) <0.25 mm. Statistical differences are shown in Table S7.
Agronomy 15 02672 g005
Figure 6. Effects of different water and fertilizer management practices on soil microbial biomass carbon (MBC) and readily oxidizable organic carbon (ROC): (a) MBC; (b) ROC. Statistical differences are shown in Table S8.
Agronomy 15 02672 g006
Figure 7. Correlation analysis in the 0–20 cm soil layer. * indicates statistical significance at the 0.05 level. Aggregate size classes: S1, >5 mm SAG; S2, 5–2 mm SAG; S3, 2–1 mm SAG; S4, 1–0.5 mm SAG; S5, 0.5–0.25 mm SAG; S6, <0.25 mm SAG. Aggregate-associated organic carbon: C1, >5 mm AOC; C2, 5–2 mm AOC; C3, 2–1 mm AOC; C4, 1–0.5 mm AOC; C5, 0.5–0.25 mm AOC; C6, <0.25 mm AOC.
Agronomy 15 02672 g007
Disclaimer/Publisher’s Note: The statements, opinions and data contained in all publications are solely those of the individual author(s) and contributor(s) and not of MDPI and/or the editor(s). MDPI and/or the editor(s) disclaim responsibility for any injury to people or property resulting from any ideas, methods, instructions or products referred to in the content.