Article

Improved Estimation and Graphical Representation of the Reliability Measures of the SNP Marker Method for Crop Variety Identification

1
Institute of Industrial Crops, Jiangsu Academy of Agricultural Sciences, Nanjing 210014, China
2
Department of Public Courses, Shandong Polytechnic College, Jining 272000, China
3
National Agricultural Technical Extension and Service Center, Beijing 100125, China
4
Institute of Hybrid Wheat, Beijing Academy of Agriculture and Forestry Sciences, Beijing 100097, China
5
Maize Research Institute, Beijing Academy of Agriculture and Forestry Sciences, Beijing 100097, China
6
State Key Laboratory of Rice Biology and Breeding, China National Rice Research Institute, Hangzhou 310006, China
7
Institute of Cotton Research, Chinese Academy of Agricultural Sciences, Anyang 455000, China
*
Authors to whom correspondence should be addressed.
These authors contributed equally to this work.
Agronomy 2025, 15(12), 2670; https://doi.org/10.3390/agronomy15122670
Submission received: 28 September 2025 / Revised: 18 November 2025 / Accepted: 18 November 2025 / Published: 21 November 2025
(This article belongs to the Section Crop Breeding and Genetics)

Abstract

Molecular marker identification is a technique used to ensure fairness when submitting innovative crop varieties. Based on data from a collaborative experiment, our study appraised the reliability of the SNP molecular marker method applied simultaneously to China’s five major crops (wheat, rice, maize, cotton, and soybean) and proposed improved methods to (1) estimate detection uncertainty statistics and (2) graphically represent the detection results. We found that the detection method was quite reliable, as the average trueness rates for wheat, rice, cotton, soybean, and maize were 99.5%, 99.2%, 98.1%, 97.2%, and 96.2%, respectively, in sequence. The laboratory effect, genotype effect, and the effect of the interaction between the laboratory and the genotype all reached highly significant levels in the detection results, but their significance differed between crops. The proposed multi-genotype method confirmed the overestimation of the uncertainty statistics by up to 13% through the single-genotype method currently recommended in ISO 5725. The proposed Lab plus Lab by Genotype interaction (LLG) biplot provides a simple, intuitive, and efficient way to present, in two distinct and complementary biplot views, the trueness–precision of the detection results and the accuracy of the laboratories involved, respectively.

1. Introduction

In the nearly three decades since regulations protecting new plant varieties were established in 1997, China’s seed industry has been highly active across multiple crop types, particularly the five major crops, maize (Zea mays), wheat (Triticum aestivum), rice (Oryza sativa), cotton (Gossypium hirsutum), and soybean (Glycine max). According to the China seed industry big data platform (http://202.127.42.47:6010/SDSite/Home/Index (accessed on 10 January 2025)), 28,781 varieties of the aforementioned five major crops were approved across the country between 2019 and 2023, three and four times the number approved in the two preceding quinquennial periods, respectively. This high number of approved varieties resulted from, on the one hand, a registration process allowing varieties to be registered at two administrative levels (provincial and national), available in view of marketing at the corresponding levels, and, on the other hand, the diversification of the available schemes for variety certification experiments not directly involving the dedicated service of the Ministry of Agriculture and Rural Affairs. Among the approved varieties, only 7733 (26.8%) were allowed to be marketed at the national level.
This rapid, if not explosive, growth in new variety submissions and certifications raises questions about how truly novel these varieties actually are, particularly regarding their distinction from existing varieties. Even without considering possible unethical practices by breeders, Zhang et al. [1] noted that the narrow genetic basis of breeding parents—resulting from limited use of germplasm resources—means that most newly bred varieties show minimal differences from existing ones. Furthermore, unethical behaviors have been observed among some breeders, such as “application of different names for the same variety”, “counterfeiting of brand names”, and “passing for famous seed brands”, seriously threatening the continuation of the seed market development [2] by pushing the honest teams involved in breeding and seed production out of the market.
In China and worldwide, the desire for a sustainable registration process for new varieties before commercial release calls for methods to ensure that newly registered varieties are notably distinct from existing ones; it is a matter of protecting intellectual property rights, maintaining fairness in innovation and competition, maintaining variety diversity, and safeguarding the seed industry [3]. In recent years, this desire has been addressed by extensive research and the application of Single Sequence Repeat (SSR) and, more recently, Single Nucleotide Polymorphism (SNP) molecular marker detection technologies, DNA fingerprinting technologies used to assess the genetic relationship between varieties and to decide on the ownership of variety rights [3].
Several international organizations such as the International Organization for Standardization (ISO) have already issued standards to regulate and guide the application of DNA molecular identification technology in seeds. For example, the International Convention for the Protection of New Varieties of Plants (UPOV) released documents in 2010 related to the construction of plant DNA fingerprint databases using SSR or SNP methods [4]. There has also been guidance released relating to specific crops. For instance, the International Seed Federation (ISF) released documents in 2004 and 2007 to indicate the criteria to be considered when judging Essentially Derived Varieties of four crops (lettuce, cotton, maize, and rapeseed) (https://worldseed.org (accessed on 10 January 2025)), while the International Seed Testing Association (ISTA) published rules for wheat, maize, peas, and oats [5]. However, while the UPOV (2010) [4] and ISTA (2017) [5] have established guidelines for DNA fingerprinting, crop-specific reliability metrics remain underexplored in multi-crop contexts.
At the national levels, SSR fingerprint databases have been set up for 1537 maize varieties in France [6], 502 European wheat varieties in Germany [7], 521 tomato varieties in The Netherlands [8], and 892 potato varieties in the United Kingdom [9]. In China, DNA molecular identification technology is playing an increasingly important role in crop variety management and protection, crop genetic background analysis, and genomic selection [10].
The standardization of molecular markers is the core nexus bridging variety identification practices across distinct crops and diverse molecular technologies, and it is becoming increasingly salient due to the escalating demands for germplasm resource conservation, variety rights enforcement, and related endeavors. Currently, the molecular identification framework is undergoing continuous iteration and refinement. Within its bounds, DNA barcoding technology has exhibited substantial application potential, as validated by Paschalidis et al. [11], whose research demonstrated its successful deployment in precise variety authentication and germplasm resource discrimination, thereby providing an effective paradigm for cross-crop and cross-context molecular identification. SNP fingerprinting, too, is one of the predominant technologies being explored within the molecular identification system, and by establishing conceptual linkages with complementary techniques such as DNA barcoding, its versatility and complementarity in variety identification across different crop species can be further enhanced. Such associations not only augment the practical guiding value of molecular marker standardization, ensuring the comparability and reliability of the results generated by diverse technologies in, e.g., variety authenticity verification and genetic diversity analysis, but also offer theoretical underpinnings for multi-technology integrated identification protocols. This facilitates the standardized application of molecular identification technologies in domains such as crop breeding and market regulation, ultimately contributing to the development of a more efficient, comprehensive, and robust crop variety identification system.
A national unified variety DNA fingerprint data-sharing platform (202.127.42.145/bigdataNew/) has been built—including the SSR fingerprint data of more than 16,000 approved (registered) standard genotypes of maize, rice, wheat, and sunflower and the SNP fingerprint data of more than 14,000 standard cultivar genotypes of maize, rice, and wheat to provide services such as real-time responses to fingerprint comparison queries and assistance to identify counterfeiting through the detection of unknown (non-registered) varieties. Since 2014, China has set up standards to identify the authenticity of varieties of major crops (wheat, maize [12], rice, soybean, and cotton) based on two different molecular marker loci.
In theory, the results of molecular marker methods, and, notably, of the more popular SNP method are perfectly reliable for assessing the distinction between a new variety and an existing one. However, this is not fully true in practice. In theory, the detection efficiency and reliability of the SNP marker method mainly depend on the quantity and representativeness of the selected markers and are not subject to the influence of external environmental factors. In other words, different laboratories should obtain the same detection outcomes when testing the same genotypes [10]. However, this is not the case in practice. Indeed, the number of markers employed in detection constitutes only a small genotype from the whole-genome molecular markers, and sampling errors are inevitable. In addition, variations between different replicates within a laboratory, among laboratories, among genotypes, and the effects of interactions between laboratories and genotypes can occur and lead to some variation in the detection results and increased detection uncertainty. For instance, in an international verification test for the detection of 24 pea (Pisum sativum) varieties using the SSR marker method, involving eight laboratories in several countries, the consistency of the laboratory test results was only about 90% [13], while it was approximately 98% for wheat in China using the SNP marker method [14]. Ro et al. [15] reported that a panel of six SNP markers yielded accuracy, sensitivity, and specificity values ranging from 95.6% to 100% for the identification of 333 Capsicum accessions. However, the reliability of these authentication outcomes remains debatable given the paucity of markers employed. While previous studies have examined SNP marker reliability for individual crops, no research has simultaneously assessed reliability across multiple crop species to identify crop-specific variation patterns.
The variation in detection results has led to the definition of various statistics for appraising their reliability. The accuracy of the detection results is expressed through the statistics of trueness and precision, where trueness refers to the percentage of consistency of the SNP loci between the test results of the genotypes of a variety to be verified and those of the reference variety, and precision refers to the degree of dispersion of the test results, usually reflected in the standard deviation of the differences between the detection results. The standard deviation of the test results under repeatability conditions is referred to as the repeatability standard deviation, and the standard deviation under reproducibility conditions is the reproducibility standard deviation [16]. The dispersion of measurement results is usually expressed by the uncertainty coefficient [17], referring to the degree of uncertainty of the test value due to the existence of measurement errors and inversely indicating the reliability of the detection results [18]. To evaluate the detection precision and uncertainty of various crop varieties in each laboratory, collaborative assessment experiments involving multiple genotypes across laboratories are commonly recommended [16]. In such a collaborative process, the uncertainty coefficient of the SNP detection results is dependent on the size of the detected genotype, the ratio of the reproducibility standard deviation to the repeatability standard deviation, and the number of laboratories involved in the experiment [16]. The expanded uncertainty coefficient is defined as the product of the uncertainty coefficient and the reproducibility standard deviation [19].
Thus, there is a large set of statistics available to help appraise the reliability of molecular marker methods (like the SNP method) in identifying the authenticity of varieties. Nevertheless, works taking into account all of the statistics and/or their graphical representation remain rare. Some teams in China were among the few involved in estimating detection reliability statistics for various crops, and one of them additionally employed the GGE (genotype plus genotype by environment interaction) biplot technique to conduct a visual analysis of the trueness, precision, and accuracy of SNP marker detection in wheat [14]. This method enables the visualization of reliability statistics as vectors in a two-dimensional graphic that do not coincide with the graphic axis (though interpretation of the representation would be more intuitive if they did).
Despite the adoption of the SNP method to detect the authenticity of varieties, particularly in China, more studies are required to sustain its reliability and to provide tools to better present the detection results. So far, the results of the SNP method have been appraised through studies involving only one crop each; to our knowledge, there has been no study that addresses multiple crop varieties. Furthermore, of the statistical methods for analyzing detection accuracy statistics, the one recommended by the ISO standard [20] analyzes N genotypes one by one across laboratories and calculates precision statistics (such as the reproducibility standard deviation), and the overall precision statistic is set as the mean of the N values calculated for each genotype. Such a method neglects the possible genotype effects as well as the genotype by laboratory interaction effect, leading to an overestimation of the detection error. Current variety regulation relies on independent crop assessment, which is established for individual crops. Although this approach is well-developed, it requires specific testing protocols and statistical thresholds for each specific crop, potentially leading to inconsistent standards across different species within the regulatory system. Furthermore, the room for improvement in graphical representation indicated by the abovementioned rare study clearly asks for new contributions.
Therefore, this study innovatively proposes a multi-genotype joint analysis method for validating cross-laboratory and multi-crop SNP detection standard methods, while developing the Lab plus Lab by Genotype interaction (LLG) biplot analysis method. The multi-crop assessment method we propose offers a theoretical pathway to address these limitations. By establishing a universal statistical framework for evaluating different species, it enables the application of standardized criteria for detection, statistical analysis, and threshold determination across various crops, thereby enhancing the consistency and comparability of regulatory decisions. The LLG biplot analysis method exhibits significant advantages, enabling simultaneous, intuitive, and visual analysis of the trueness, stability, and accuracy of SNP detection across laboratories, and effectively addressing the challenge of simultaneously presenting multi-dimensional detection performance encountered in traditional analyses. This innovative achievement successfully fills the research gaps relating to the molecular detection methods specified in the existing ISO and ISTA standards, providing more scientific and efficient technical support in the field of molecular marker-based testing for cultivar authenticity. It makes important contributions to promoting the standardized development of this field and improving the accuracy of cultivar identification. The objectives of this paper are to appraise and confirm the reliability of the SNP method by examining all defined detection statistics through simultaneously addressing five crops in China and to propose a better method for the graphical representation of the detection results that will assist in the adoption and acceptance of the detection method.

2. Materials and Methods

2.1. Dataset Sources

In this study, the data originated from a specific multi-laboratory scheme devoted to assessing the authenticity of varieties of five crops (cotton, maize, rice, soybean, and wheat) through the application of the SNP marker method to multiple genotypes. These experiments were organized and conducted by the National Agricultural Technology Extension Service Center (NATESC) from 2021 to 2023 and involved various marker detection laboratories distributed across the country. Five different research institutions were responsible for formulating the SNP marker method standards for one of the five crops each, and each institution was responsible for randomly selecting varieties that adequately represented their assigned variety repository; the numbers varied from 11 to 21 depending on the crops involved. For each crop, samples were primarily selected through random sampling from representative major promoted varieties and their genetically similar counterparts nationwide, as well as dominant cultivated varieties and their analogous varieties in the major ecological sub-regions for the production of each crop. These varieties solely represent the widely cultivated and extensively applied dominant crop varieties in China. During the variety sampling process, stratified sampling techniques were employed, with comprehensive consideration of factors including variety production regions, genetic backgrounds and origins, variety types, and variations in key agronomic traits, so as to maximize the representativeness of varieties from major production areas.
Based on the detection requirements of the SNP marker method standards for each crop, the SNP loci of each selected variety were identified by the NATESC at its own detection laboratory and the results served as reference values [16] for the collaborative scheme. The detection results were provided by the participating laboratories after three replications of detection for each selected genotype and supplied through the NATESC in the form of seeds (previously made unable to germinate), seed powders, or pre-extracted seed DNA, each representing a homogenized bulk sample from multiple individuals of the same genotype. The seeds were all at the fully mature stage to ensure genetic stability and uniformity. Hence, all detections were performed on the same genotypes, SNP loci, and primer combinations. The results supplied by the participating laboratories were compared against those of the NATESC to verify the trueness, precision, accuracy, and uncertainty of the retained detection method. Details on the number of SNP loci adopted for each crop, the number of participating laboratories, the number of varieties, and the forms and quantities of genotypes provided are presented in Table 1. The participating laboratories (through their name codes), experimental platforms, and the crops on which they implemented detection are presented in Table 2. Details on the specific SNP loci and PCR (competitive allele-specific PCR, KASP) typing primers adopted for each crop are presented in the corresponding crop SNP standards [12,21,22]. Genetic distance information for the samples of each crop can be found in the Supplementary Materials (Tables S1–S5).

2.2. Statistical Analysis Method

2.2.1. Formulas for Calculating SNP Locus Similarity

In China, the similarity of varieties is reflected by their SNP locus similarity [5]; detection trueness is pronounced when the detection values of the genotype being verified are similar to those of the reference. For every individual detection test for a specific locus, the value of “1” is retained in the case of similarity of the result with that of the reference; otherwise, a value of “0” is given. Taking into account all retained loci, the formula for calculating the trueness of genotype j in laboratory i is as follows [14]
y i j k = N S i j k / N T i j k
y ¯ i j = 1 n k = 1 n y i j k
σ i j = 1 n 1 k = 1 n ( y i j k y ¯ i j ) 2
where in the first equation, yijk, NSijk, and NTijk represent the locus similarity (i.e., trueness) between the k-th detection result of genotype j by laboratory i and the reference, the number of loci for which the detection results were similar to the reference ones, and the total number of SNP loci retained, respectively. In the two other equations, n, y ¯ i j , and σrj are the detection replication number of genotype j by laboratory i, the cell mean of locus similarity, and the trueness standard deviation of genotype j detected in laboratory i, respectively.

2.2.2. Formulas for Detection Precision and Uncertainty Statistics

In the collaborative scheme, for every crop species, p participating laboratories were involved and conducted detection on q genotypes n times under repeatability conditions, giving a total of pqn trueness observations for every retained locus to assess trueness, following Equation (1).
Two statistical methods were used to estimate the precision and uncertainty statistics. The first one followed the ISO recommendation (the “single-genotype analysis method”) to analyze every genotype (variety) individually across laboratories and took the average for all genotypes [20]. That is, the test precision statistics of q genotypes were estimated one by one based on the one-way analysis of variance (ANOVA) method, and then the average value of the statistics estimated for all the q genotypes was taken as the overall estimated statistics. The second method jointly analyzed multiple genotypes across multiple laboratories (the “multi-genotype joint analysis method”). In this alternative method, the precision statistics were directly estimated by the two-way ANOVA of laboratories and genotypes simultaneously. Data Processing System (DPS© V21.05) software [23] was employed for the combined multi-genotype ANOVA across laboratories. The homogeneity of variances assumption among different genotypes and laboratories was verified using Levene’s test, normality was tested by the Shapiro–Wilk method, and independence was assessed via the Durbin–Watson method. The calculation formulas for statistics such as the repeatability standard deviation, the inter-laboratory standard deviation, the reproducibility standard deviation, the uncertainty coefficient, the least significant difference, and detection accuracy are listed in Table 3 for the two methods.

2.2.3. Proposed LLG Biplot Method for Graphical Analysis of Detection Trueness, Precision and Accuracy

Before we present the proposed Lab plus Lab by Genotype interaction (LLG) biplot analysis, we will describe how graphical representation via GGE biplot analysis could have been conducted in our study. In our collaborative scheme, for each crop, p laboratories individually detected q genotypes under repeatability conditions. A laboratory × genotype trueness data matrix was formed by comparing the values of the detection results with those of the reference, according to Equation (1), so as to enable GGE biplot analysis. In such an analysis, the traditional “environment factor” is substituted by the genotype factor and the “genotype factor” is replaced by the laboratory factor. After centering the data matrix with respect to the environment, singular value decomposition and partitioning are applied to simplify it into the sum of n products of laboratory principal components (PCi, i = 1, 2, …, n) and genotype principal components (PCj, j = 1, 2, …, n). The first two principal components (PC1 and PC2) of each laboratory and genotype are used as coordinates in a rectangular coordinate system to construct a GGE biplot. In this biplot, each laboratory and genotype is represented by a mark with PC1 and PC2 scores as its coordinates [24,25].
Information drawn from a GGE biplot is shown in Figure 1a, where the coordinates of laboratory i are represented by L (PC1i, PC2i). The average of all environment coordinates constitutes the average environment coordinates mark M (PC1jm, PC2jm). The ray passing through the origin and pointing to the average environment mark is the average tester axis (ATA), and the two-way ray perpendicular to the ATA passing through the origin is the average tester coordinate (ATC) [24]. Point P is the foot of the perpendicular from L to the ATA. Point I is the point on the positive direction of the ATA whose distance from the origin is equal to the longest laboratory vector, that is, the ideal laboratory mark [24]. The length of the line segment OP in the positive direction of the ATA represents the testing trueness, while LP and LI show the testing precision and accuracy, respectively. The shorter their values, the better they are. Figure 1a, therefore, gives a visual analysis of statistics such as the testing precision of a given laboratory. Nevertheless, due to the complexity of calculating the mathematical relations between the lengths of the aforementioned line segments (LP and LI), quantitative analysis of indicators like testing precision is not convenient.
The proposed LLG biplot is a variation in the GGE biplot analysis that more intuitively shows the quantitative relationship between laboratory coordinates and indicators such as trueness, precision, and accuracy. It was executed by using the GGE biplot software (Version 7.10, http://www.ggebiplot.com (accessed on 5 February 2024)) and included the missing data function to deal with the fact that not all laboratories implemented detection for the five crops. In the proposed method, the coordinate axes of the GGE biplot (as shown in Figure 1a) are rotated counterclockwise by angle θ so that the horizontal axis (PC1 axis) coincides with the ATA and the vertical axis PC2 coincides with the ATC, thereby forming a new coordinate system. Each mark in Figure 1a is assigned new coordinates in the rotated coordinate system. There is a functional relationship linking the new coordinates to the original. For example, if the coordinates of laboratory i in the new coordinate system are represented by (xi, yi), then xi = PC1i × cos (θ) + PC2i × sin (θ), yi = PC1i × sin (θ) + PC2i × cos (θ). The rotation angle θ = arctan(PC2m/PC1m), where M = (PC1m, PC2m) represents the coordinates of the average environment mark. As shown in Figure 1b, the horizontal axis of the LLG biplot is the ATA, representing the direction of higher testing trueness; the vertical coordinate (the ATC), also known as the stability coordinate (S), represents testing precision. The arrow of the S coordinate points to the direction of poor testing precision. The absolute value of the ordinate is negatively correlated with testing precision, and the smaller the value, the more precise the testing result [24]. The abscissa of the laboratory represents trueness. The absolute value of the ordinate represents precision. The difference between the abscissa of the ideal laboratory mark and that of a given laboratory (i.e., the length of the line segment PI) represents trueness, and the smaller its value the better. Detection accuracy results from a high trueness value combined with high precision. The detection results of a laboratory are accurate when the projection of this laboratory on the LLG biplot almost lies on the horizontal axis and is far over on its right. The “trueness vs. precision” view of the LLG biplot is similar to the “mean vs. stability” view of the GGE biplot [14,24], hence providing a simple visual analysis of the SNP detection trueness and precision of each laboratory. The “ideal laboratory” view is similar to the “ideal genotype” view of the GGE biplot [14,24], thus providing a tool to appraise the whole laboratory network of the collaborative scheme.

3. Results

3.1. Variance Analysis of the Trueness of SNP Molecular Marker Detection for Five Major Crop Varieties

Based on generalizedlinear models (GLMs) with a normal distribution, the combined analysis of variance (ANOVA) results for the trueness data from the collaborative scheme (Table 4) indicate the following: (1) Verification of the statistical assumptions underpinning the ANOVA—encompassing normality obtained via the Shapiro–Wilk test, homogeneity of variance obtained via Levene’s test, independence obtained via the Durbin–Watson test, and additivity of effects—confirmed that all test results satisfied the requisite criteria for valid ANOVA implementation. Specifically, all p-values substantially exceeded the 0.05 significance threshold, thereby showing the applicability of parametric statistical analyses. Moreover, the normality test outcomes provided empirical evidence that the observed variations conformed to a normal distribution, further validating the appropriateness of the analytical framework employed. (2) For the five major crops considered, the effects of laboratories, genotypes, and the interaction between laboratories and genotypes (L × G) were extremely significant (p < 0.01) in the phenotypic variation in the trueness data detected by the SNP marker method. (3) The sources of variation for the trueness of the five crops differed to some extent when considering the distribution of the sum of squares of treatment (SStrmt) between laboratory, genotype, and L × G. The sources of variation for the trueness of cotton, maize, and rice were relatively similar, mainly dominated by the effects of laboratories and L × G, with relatively small differences among genotypes. For soybean, the differences among genotypes were large and constituted the main source of variation. For wheat, the variation mainly arose from L × G, with relatively small variations among laboratories and genotypes.

3.2. LLG Biplot Analysis of Trueness, Precision, and Accuracy in Detection by the SNP Method

The results of the LLG biplots are successively presented for the five crops considered to assess the trueness, precision, and accuracy of detection achieved using the SNP method. For each crop, two views of the biplot are presented: one to show the trueness and precision of each laboratory, the degree of dispersion of the genotypes, and their interaction relationship with the laboratories, and the other to show the detection accuracy of the laboratories with reference to an ideal laboratory, i.e., their distances to the point representing the latter. In both views, the outcomes of laboratories are in blue letters while those of the genotypes are in red; a small red circle corresponds either to the average genotype (trueness–precision view) or the ideal laboratory (ideal–laboratory view). In the trueness–precision view, the detection trueness and precision are indicated by the positions on the horizontal and vertical axis, respectively. In the ideal–laboratory view, the accuracy of a laboratory is measured by its distance to the ideal laboratory; the shorter this distance, the more accurate the laboratory.
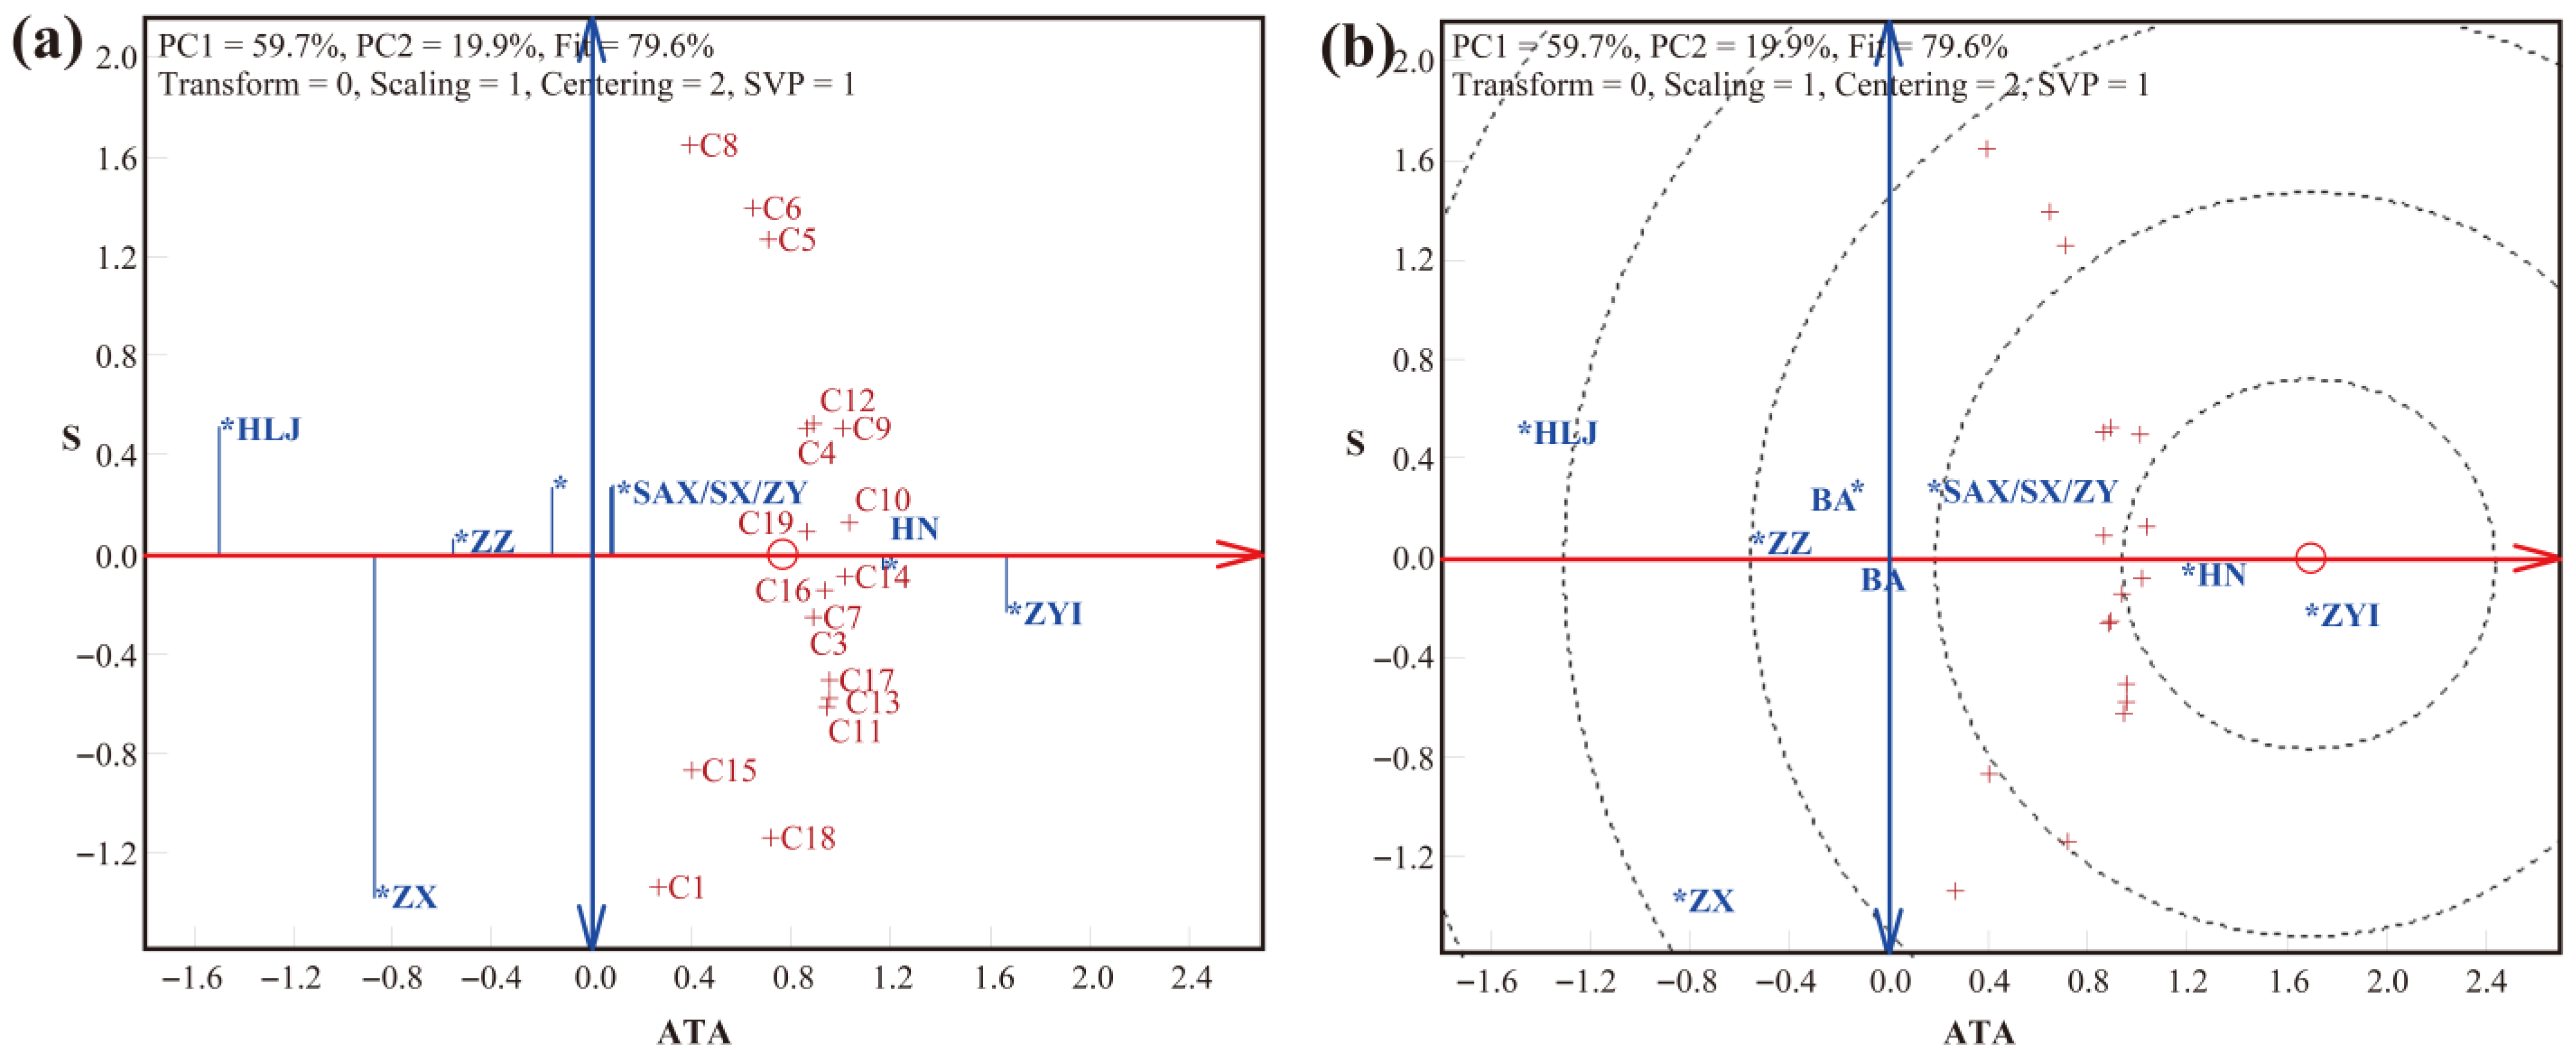
For cotton genotypes (Figure 2a), there were some substantial variations between laboratories in terms of detection trueness; laboratories ZYI and HN demonstrated the highest levels, and laboratories HLJ and ZX demonstrated the lowest, while the remaining laboratories had an average level of trueness. Variation also appeared in the precision of detection between laboratories; laboratories HN and ZZ achieved the optimal level, and laboratories HLJ and ZX performed the worst, while the rest of the laboratories had a relatively good level. The interaction between laboratories and genotypes was significant; for instance, genotypes C1, C18, and C15 had significant positive interactions in laboratories ZX, ZYI, and HN, and significant negative interactions in laboratories HLJ and BA. Consequently, laboratories ZYI and HN achieved the best detection accuracy level (Figure 2b), and laboratories HLJ and ZX performed the worst, while the remaining laboratories reached a moderate level of accuracy.
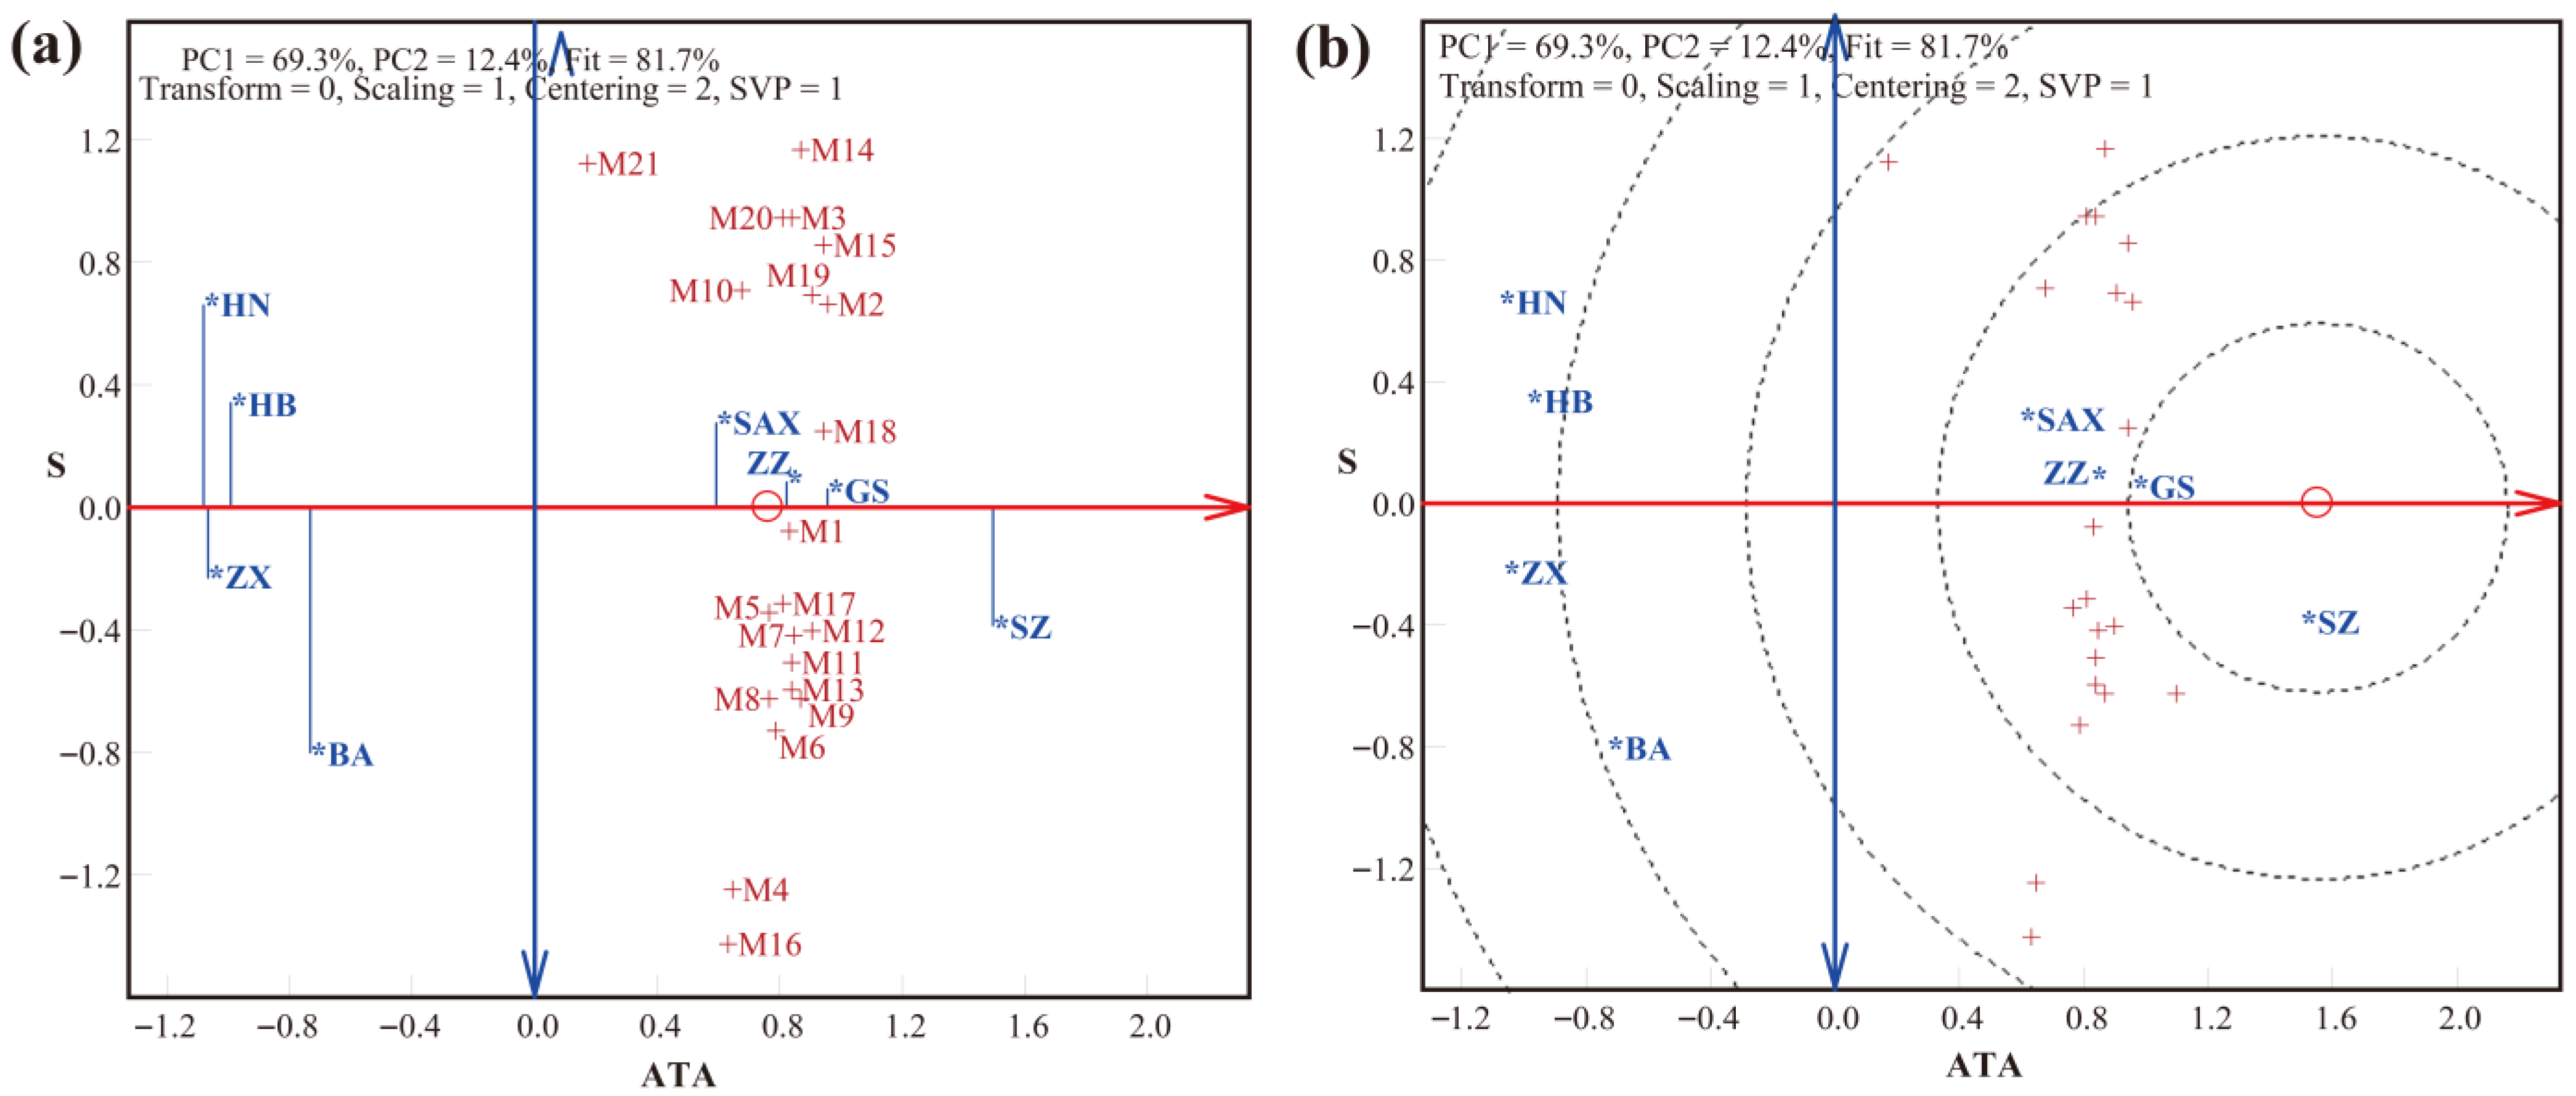
For maize genotypes (Figure 3a), there was also some substantial variation in detection trueness between different laboratories; that of laboratory SZ was the highest, those of laboratories GS, ZZ, and SAX were relatively satisfactory, and laboratories BA, HB, ZX, and HN were the worst. In terms of detection precision, laboratories GS and ZZ reached the best level and laboratories HN and BA the worst, while the level of the remaining laboratories was relatively good. The interaction between laboratories and genotypes was significant; for instance, genotypes M4 and M16 had significant positive interactions in laboratories BA, GS, and SZ, and significant negative interactions in laboratories HN and HB. Laboratory SZ showed the best detection accuracy level (Figure 3b), and laboratories GS, ZZ, and SAX reached a relatively good level compared to the remaining laboratories.
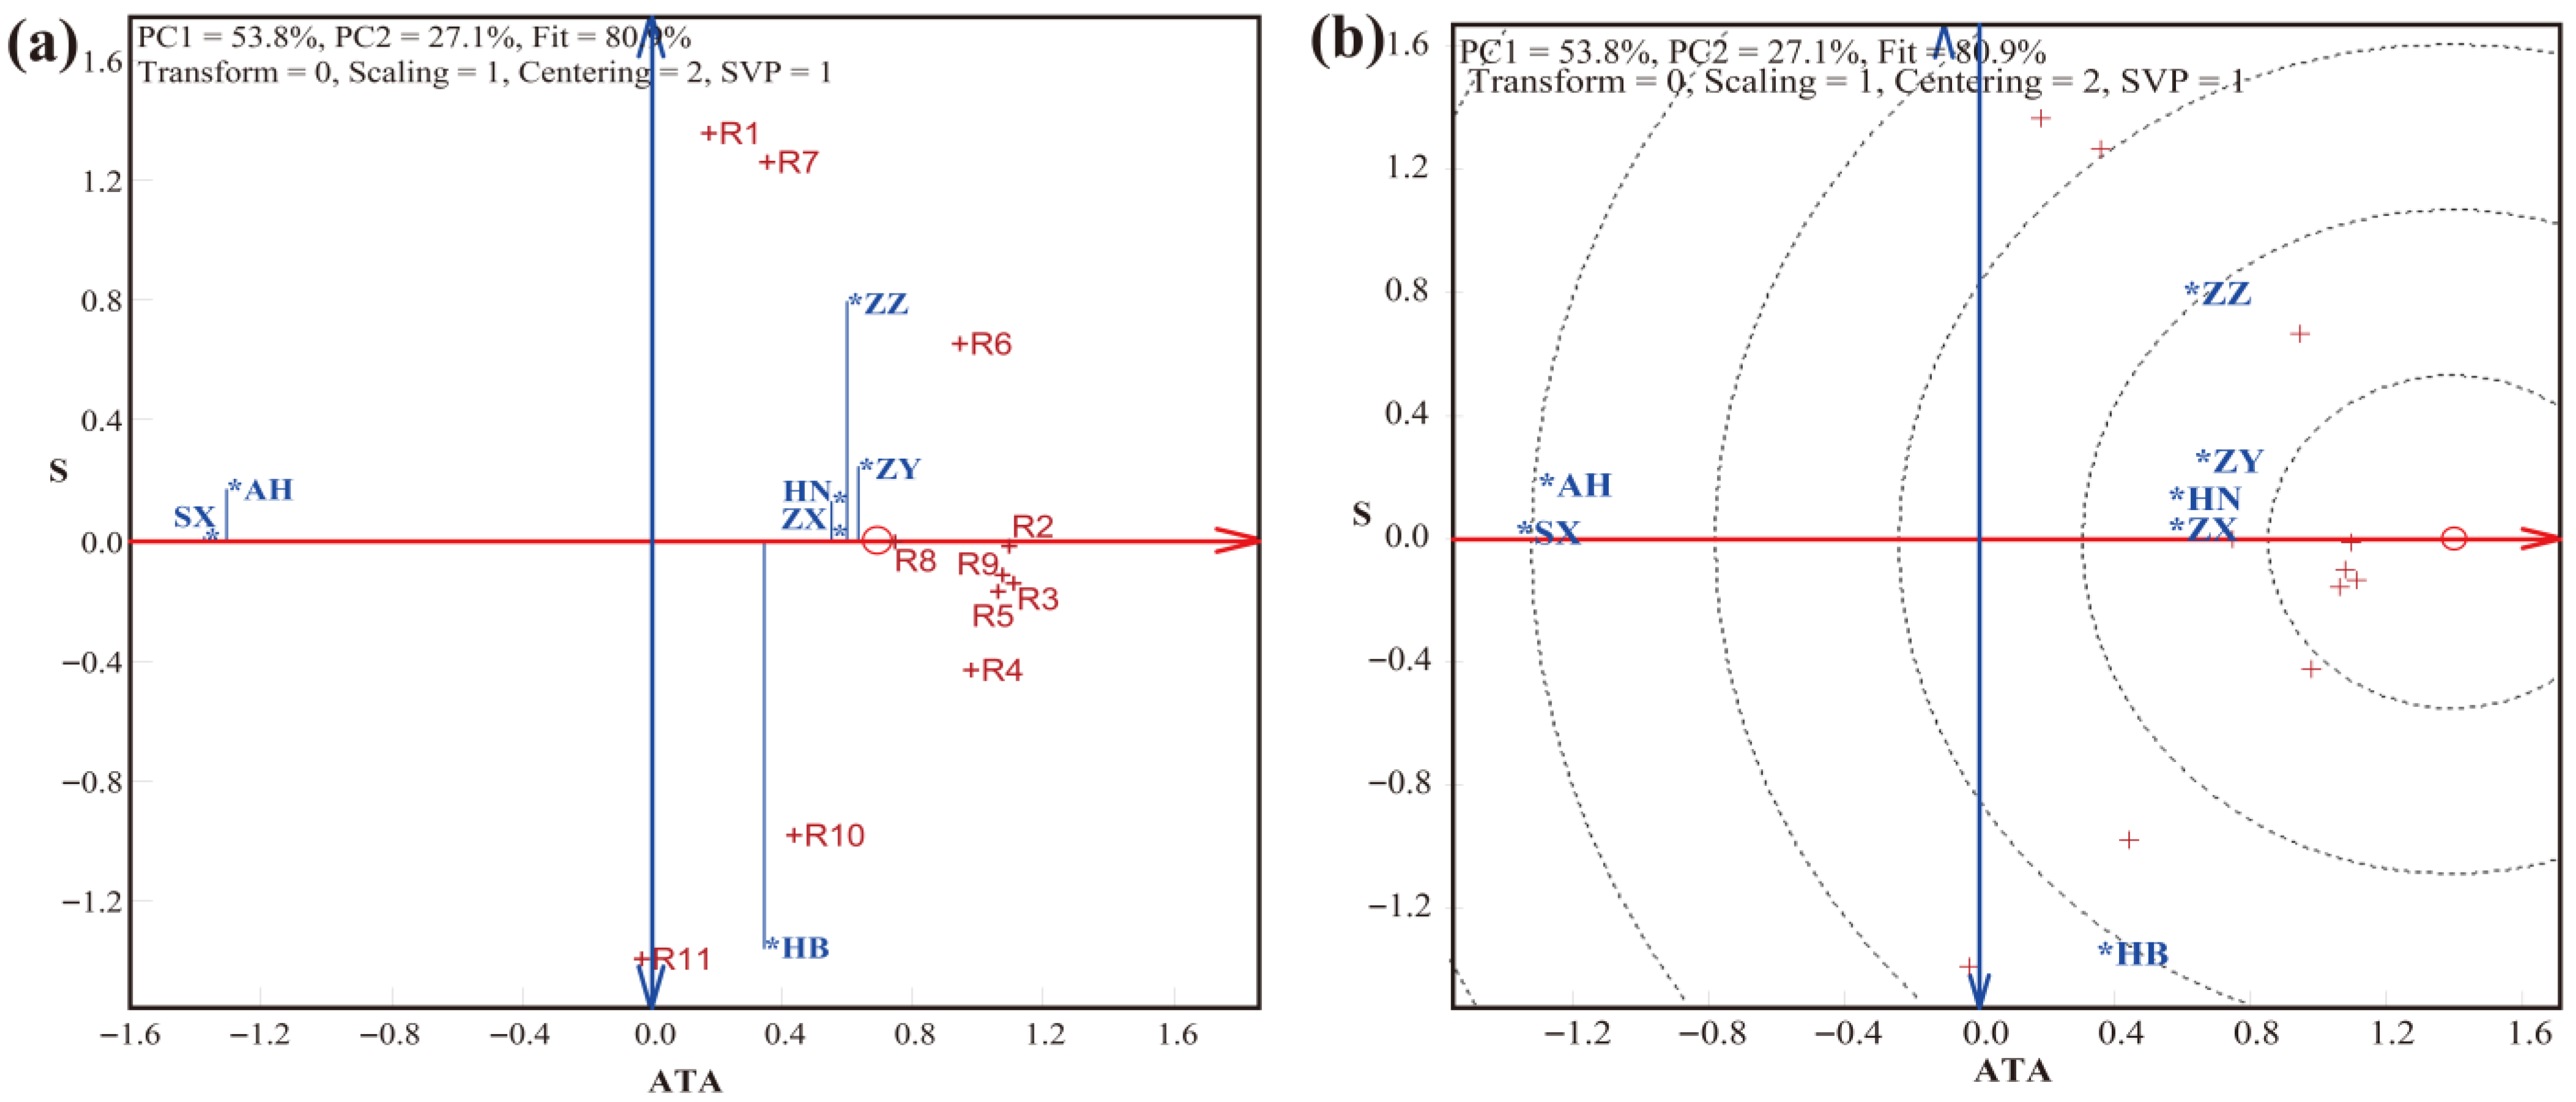
For rice genotypes (Figure 4a), the detection trueness of laboratories ZY, ZZ, ZX, and HN was higher compared to that of laboratories HB, AH, and SX. With regard to detection precision, laboratories SX and ZX exhibited the best level, those of laboratories HN, AH, and ZY were relatively good, and laboratories ZZ and HB were the worst. The interaction between laboratories and genotypes was significant; for instance, genotypes R10 and R11 had a significant positive interaction in laboratory HB, and negative interactions in laboratories ZZ and AH. Consequently, laboratories ZY, ZX, and HN achieved the best level of detection accuracy (Figure 4b), that of laboratories HB and ZZ was relatively good, and laboratories AH and SX were the worst.
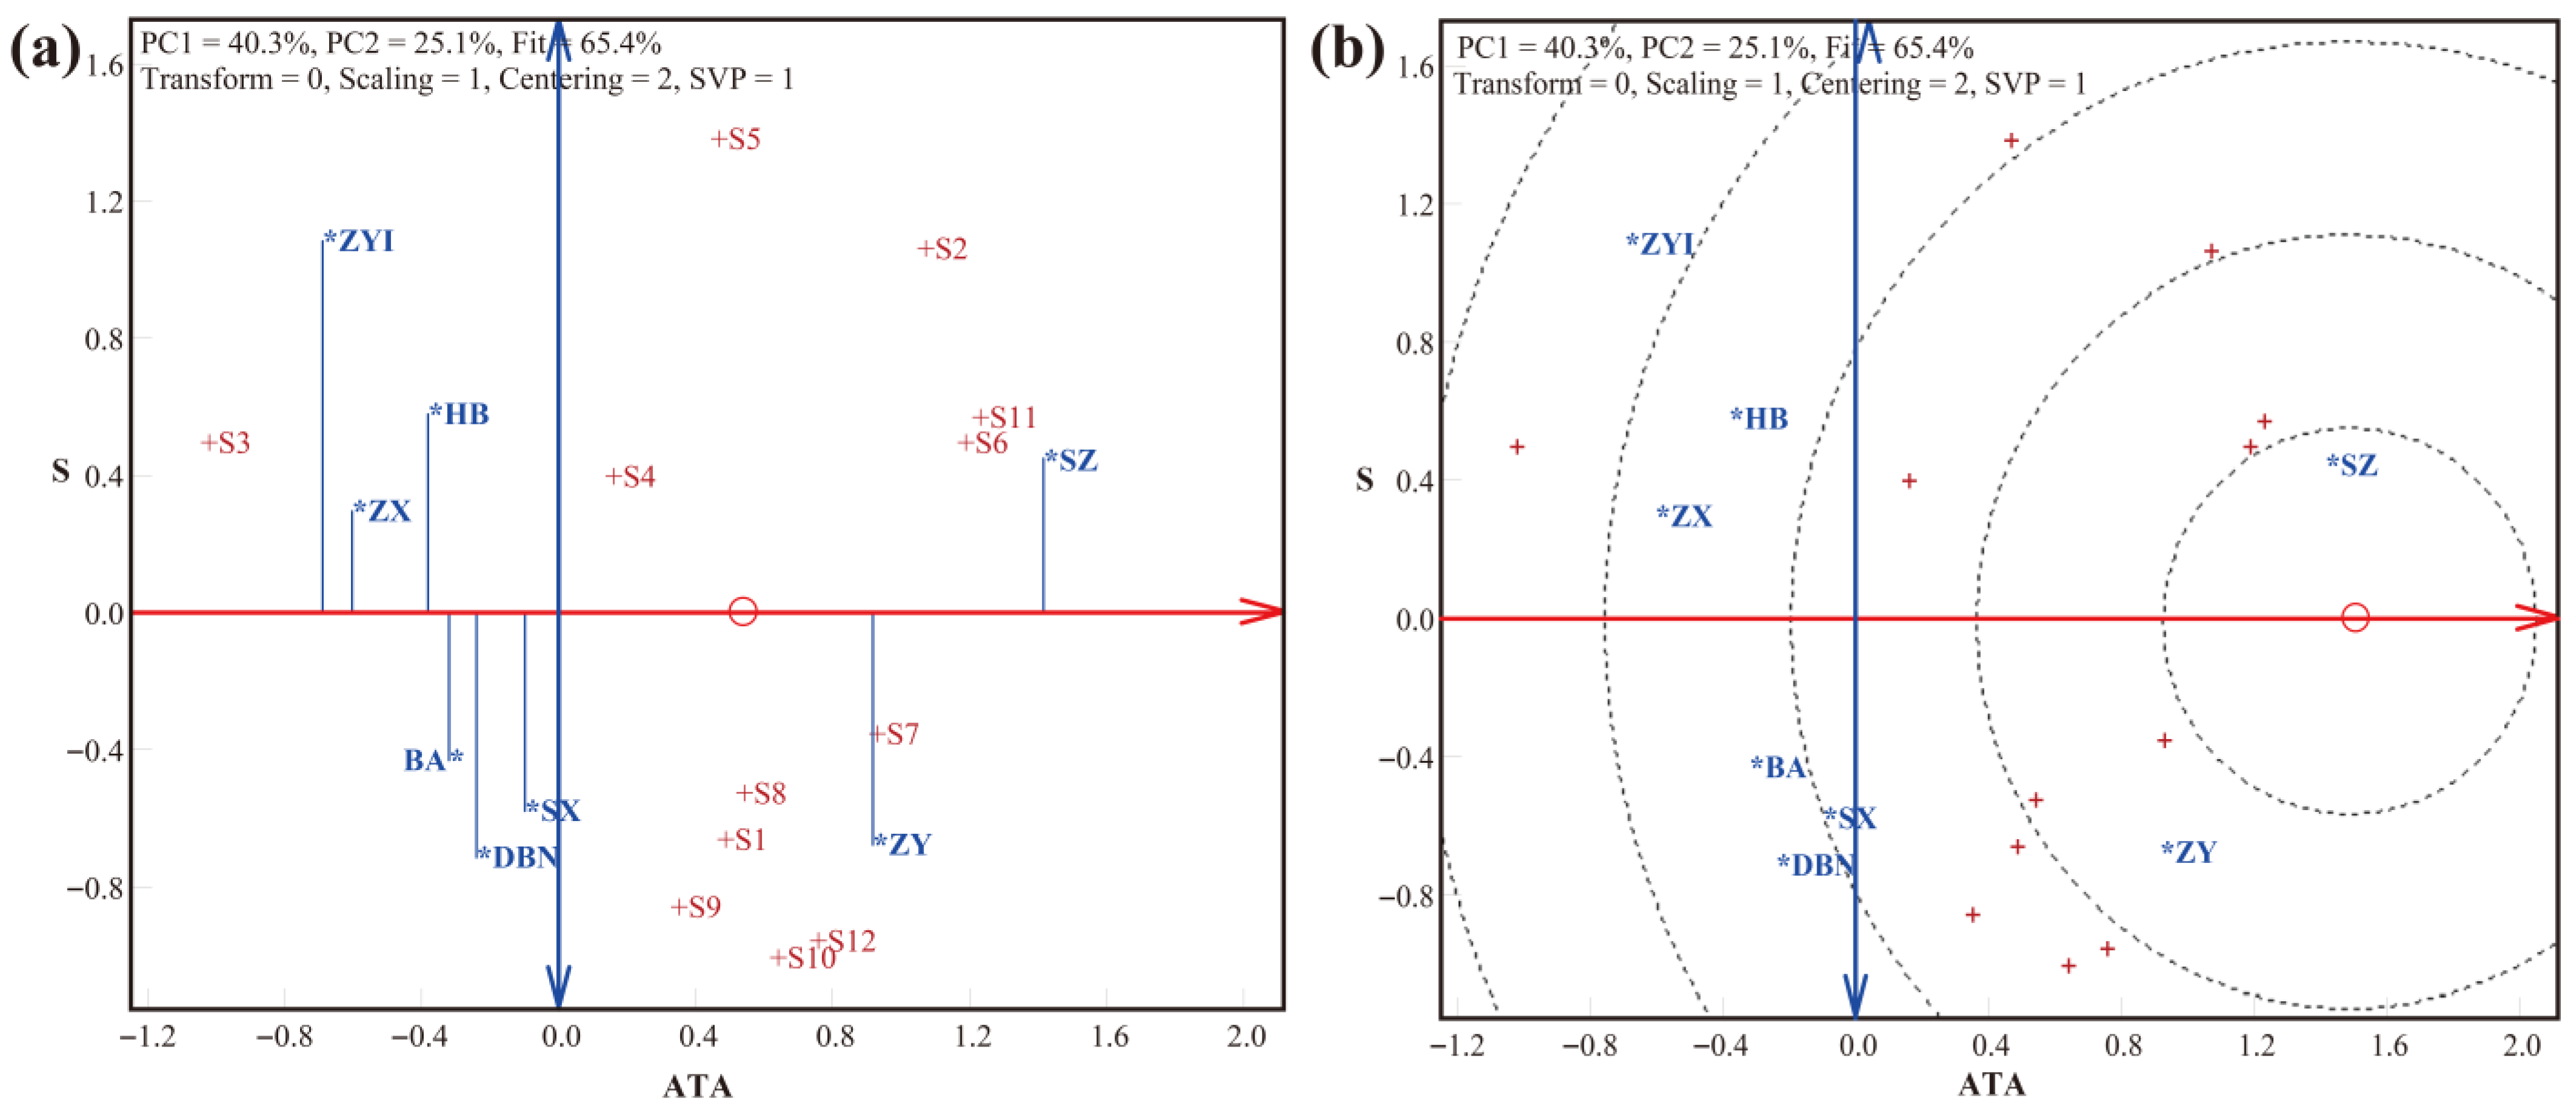
For soybean genotypes (Figure 5a), laboratories SZ and ZY had a relatively high level of detection trueness, and the remaining laboratories an average level. Laboratories ZX, BA, and SZ showed relatively good detection precision compared to laboratory ZYI, while the remaining laboratories achieved a medium level. The interaction between laboratories and genotypes was notable; for instance, genotypes S5, S2, and S11 had significant positive interactions in laboratory SZ and significant negative interactions in laboratories DBN, SX, and BA. Consequently, laboratory SZ achieved the best level of detection accuracy (Figure 5b), and laboratory ZY was relatively good compared to the medium level of the remaining laboratories.
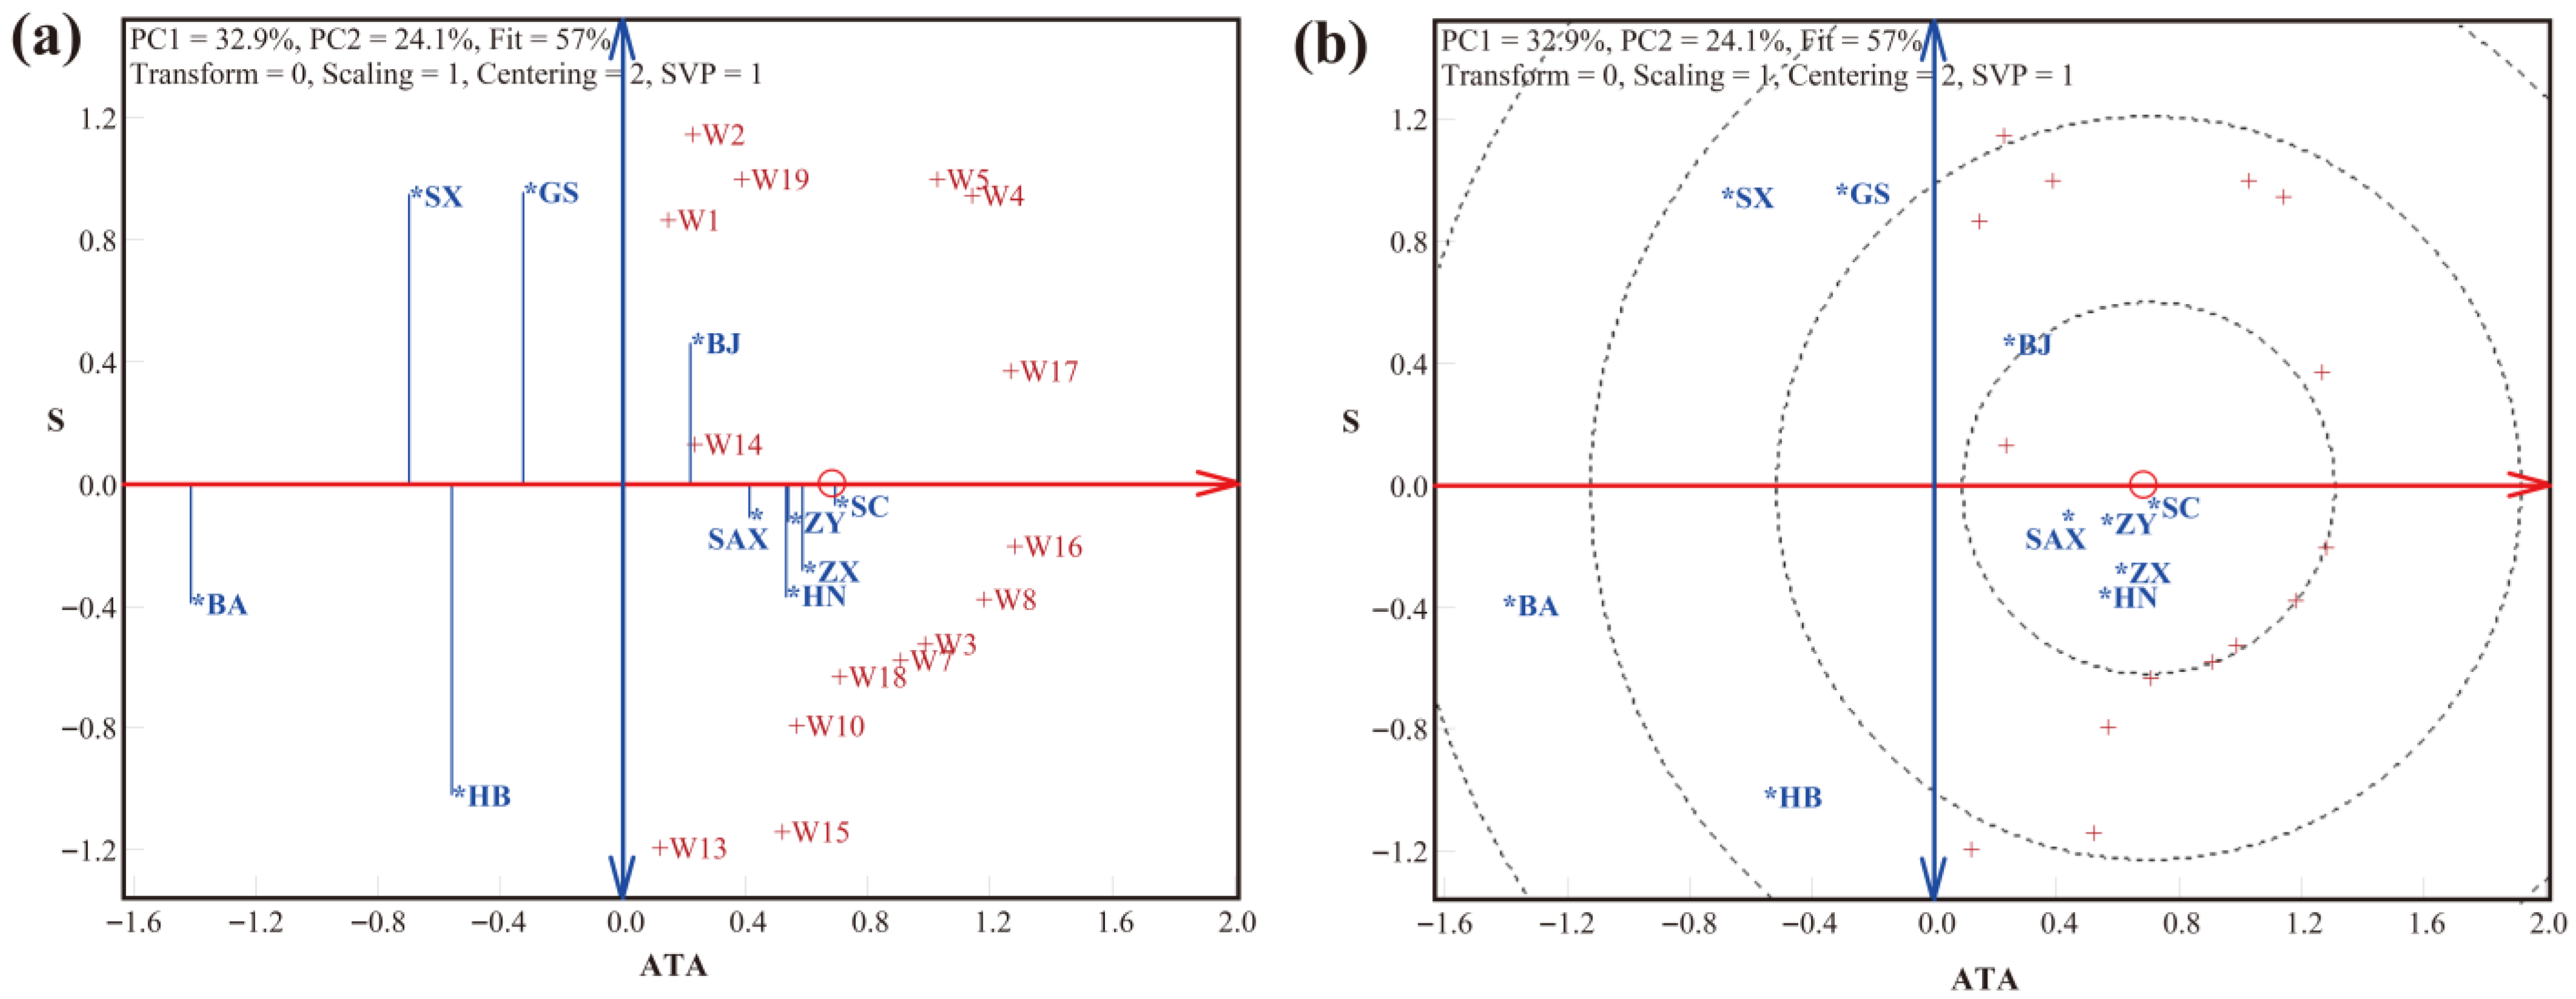
For wheat genotypes (Figure 6a), the detection trueness of laboratories SC, ZX, ZY, HN, and SAX was high, compared to that of laboratories BJ, GS, HB, SX, and BA. With regard to detection precision, laboratories SC, SAX, and ZY reached the highest level, and those of laboratories ZX, HN, BA, and BJ were relatively good compared to laboratories SX, GS, and HB, which were the worst. The interaction between laboratories and genotypes was significant; for instance, genotypes W13, W15, and W10 had significant positive interactions with laboratory HB, but significant negative interactions with laboratories SX, GS, and BJ. Consequently, laboratories SC, ZX, ZY, HN, and SAX all achieved the best level of detection accuracy (Figure 6b), while that of laboratory BJ was relatively good compared to laboratories GS, HB, SX, and BA, which were the worst.

3.3. Analysis of Detection Accuracy and Uncertainty of the SNP Detection Method Based on Single-Genotype Analysis

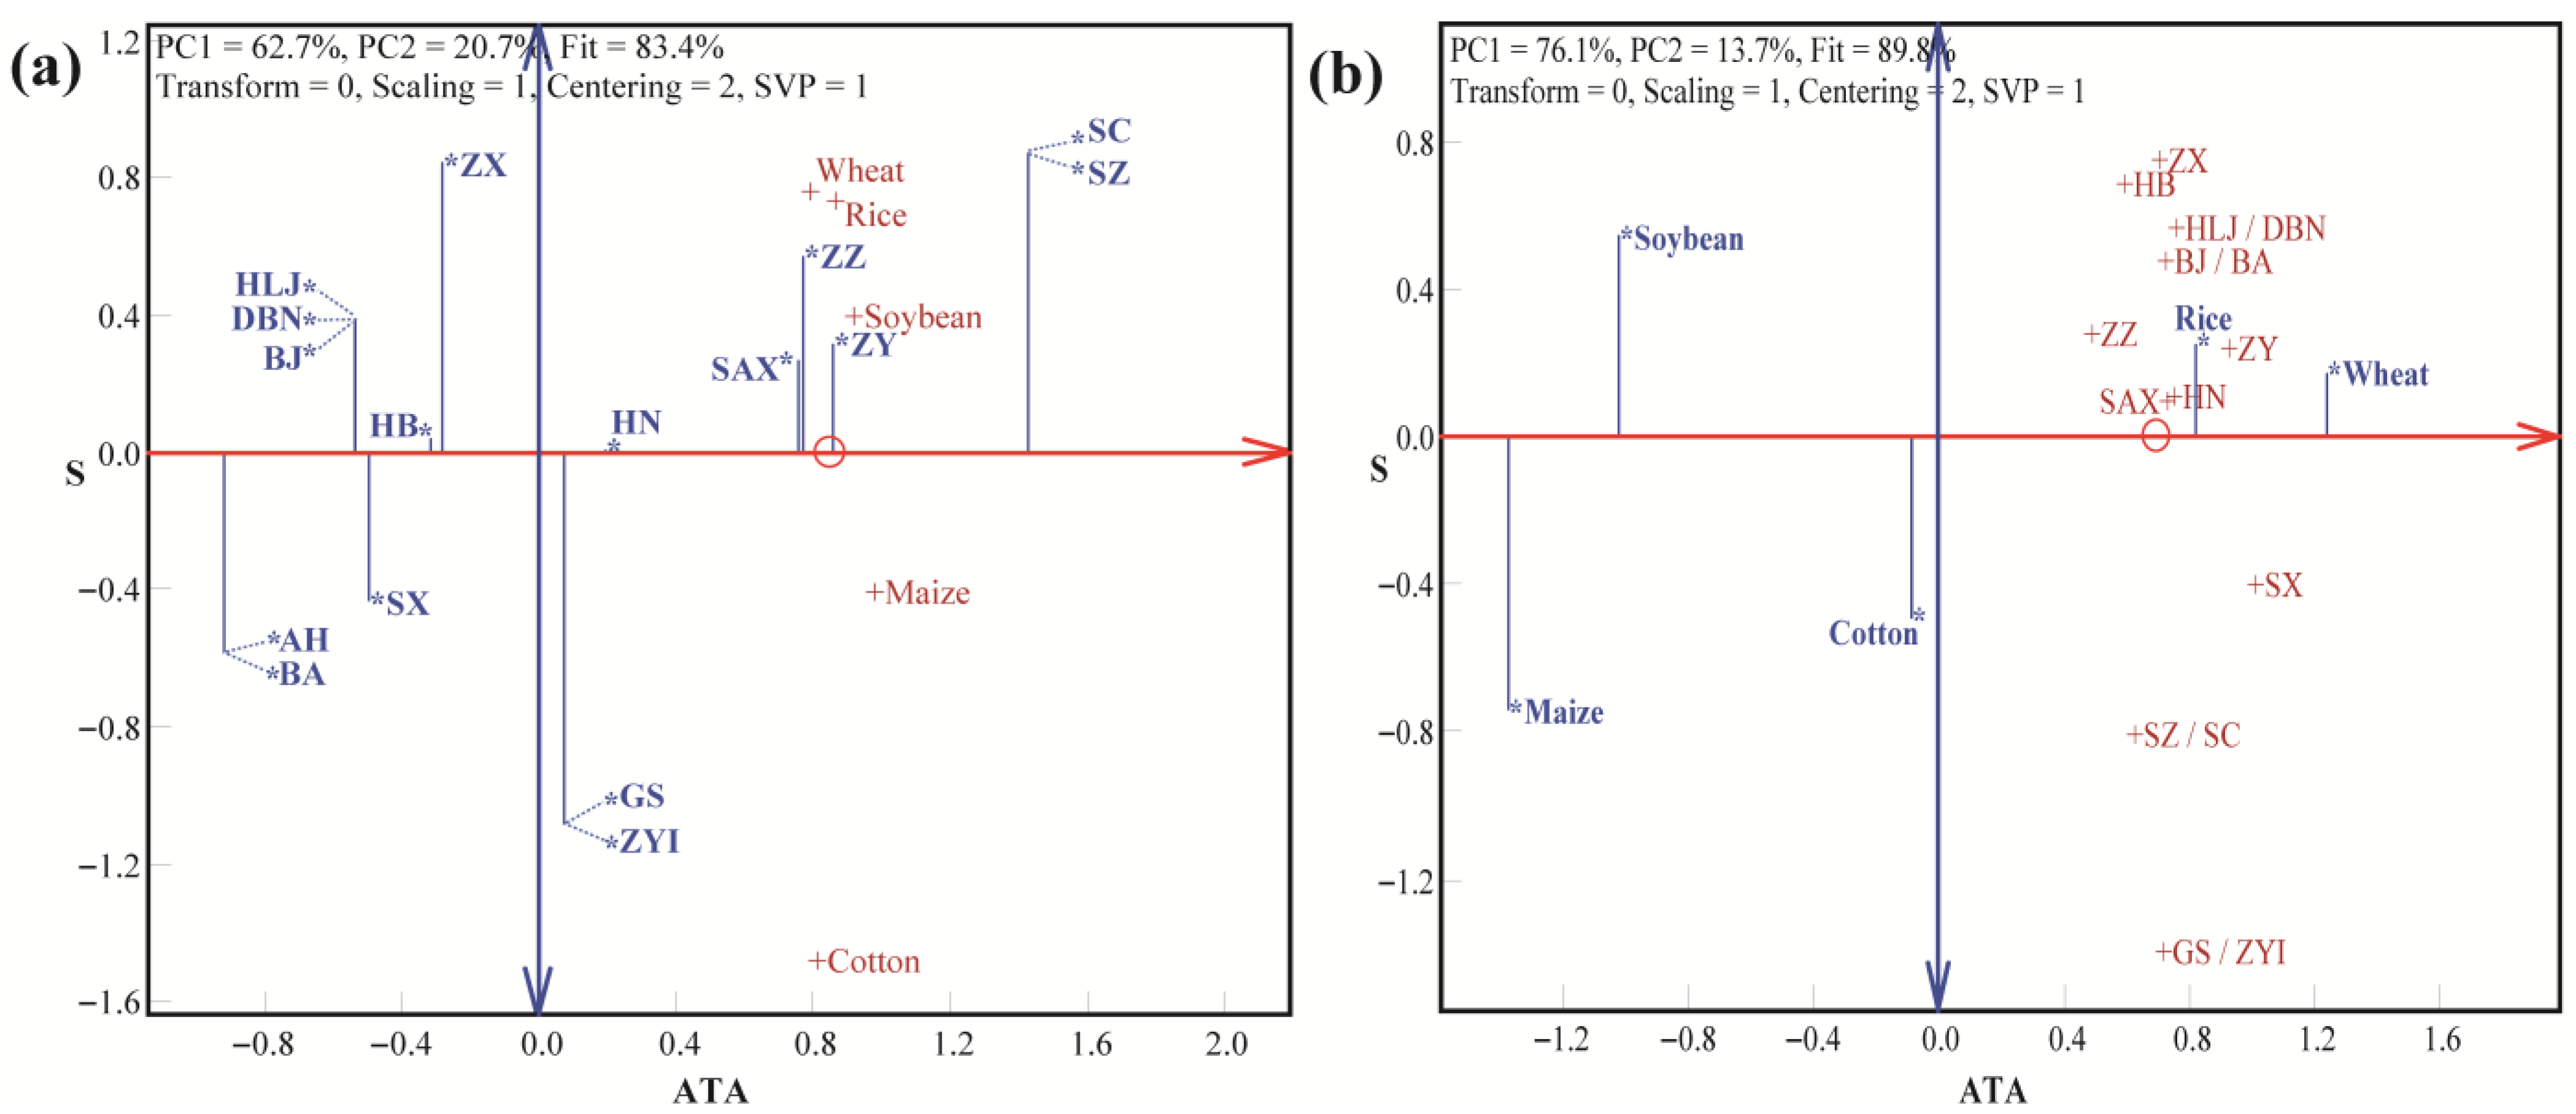
The overall performance of the laboratories involved in the collaborative scheme, in terms of overall trueness and precision among crops, is presented in Figure 7a. There were large ranges of values for both trueness and precision. In terms of detection trueness, laboratories SC and SZ exhibited the highest values, followed by laboratories ZY, SAX, and ZZ, which were much better than the remaining ones. In terms of detection precision, the level reached in laboratories HN and HB was optimal, particularly compared to ZX, SC, SZ, GS, and ZYI. There were no laboratories that clearly showed outstanding performance in trueness and precision, but laboratories ZY and SAX came close. There were, however, laboratories with lower levels of both trueness and precision, like laboratories BA and AH.
The detection trueness and precision for the five crops are presented in Figure 7b. The level of detection trueness varied between crops; it was best for wheat and rice, relatively good for cotton, and only average for soybean and maize. The interaction between laboratories and different crops was significant; for instance, laboratories SX, SZ, SC, GS, and ZYI had positive interactions with wheat and rice and negative interactions with soybean. The ranking of crops with regard to detection precision was similar to that for detection trueness, as was the ranking of detection accuracy as a consequence of trueness.

3.4. Analysis of Detection Accuracy and Uncertainty of the SNP Detection Method Based on Single-Sample Analysis

When the “single-genotype analysis method” was employed for the laboratory data collected in the collaborative scheme, statistics such as the determination precision and uncertainty of each crop were initially estimated on a genotype-by-genotype basis. As per the method indicated by the ISO, the average value of the estimated statistics of each genotype was regarded as the comprehensive estimated statistic for each crop. The results of the estimations (Table 5) show the following: (1) The repeatability standard deviation (σr) of cotton was the highest, significantly higher than that of maize, soybean, rice, and wheat. Quantitatively, the σr of cotton was three times that of rice and wheat. (2) The inter-laboratory standard deviation (σL) of maize was very significantly higher than that of other crops: more than twice that of cotton and soybean, four times that of rice, and five times that of wheat. Among these, the σL of soybean and cotton was significantly higher than that of wheat. (3) The reproducibility standard deviation (σR) of maize was the highest, significantly exceeding that of cotton, soybean, rice, and wheat. Specifically, the σR of maize was approximately 3.5 times that of rice and wheat. (4) The expanded uncertainty factor (R) of maize was the highest (approximately 2%), significantly higher than that of cotton and soybean (approximately 1%) and that of rice and wheat (approximately 0.5%). (5) The trueness of the SNP marker detection method for wheat, rice, cotton, soybean, and maize was 99.5%, 99.2%, 98.1%, 97.2%, and 96.2%, respectively. Among these, the trueness of wheat and rice was significantly higher than that of cotton, and the trueness of cotton was significantly higher than that of soybean and maize. The detection accuracy (approximately 99%) of wheat and rice was significantly higher than that of cotton and soybean (approximately 97%), and that of maize (approximately 95%). (6) The least significant difference (LSD0.05,L) for the comparison of inter-laboratory detection trueness indicated the discriminative ability of the SNP detection method for differences in inter-laboratory detection. The discriminative ability for cotton was moderate, and a difference of up to 2.5% could be distinguished between laboratories; the discriminative abilities for maize and soybean were better, and a difference of up to 2% could be distinguished; and the discriminative abilities for rice and wheat were the best, and a difference of up to 1% could be distinguished.

3.5. Analysis of Detection Precision and Uncertainty of the SNP Detection Method Based on Multi-Genotype Combined Analysis of Variance

The detection precision and uncertainty statistics calculated by the method we proposed, as an alternative to the ISO one, are given in Table 6. They show the following: (1) The results of the repeatability standard deviation and trueness for each crop were in line with those based on single-genotype analysis. (2) Compared with the single-genotype analysis method, the average laboratory standard deviation and the reproducibility standard deviation decreased by 23% and 13% on average, respectively, for all crops, with variation among crops. The laboratory standard deviation of soybean, wheat, rice, and maize decreased by approximately 50%, 40%, 30%, and 15%, respectively, while that of cotton did not show a significant reduction. The decrease in the reproducibility standard deviation of wheat and soybean was more than 20%, while that of rice, maize, and cotton was more than 15%, 12%, and 4%, respectively. (3) The expanded uncertainty coefficient dropped to 0.3%, 0.4%, 0.7%, 0.9%, and 1.8% for wheat, rice, soybean, cotton, and maize, respectively, leading to the average coefficient for all crops decreasing from 0.98% to 0.80%, i.e., a reduction of 18%. (4) The average detection accuracy for each crop rose by approximately 0.2%. (5) The least significant difference among laboratories decreased significantly to, on average, about one-third of the result obtained from single-genotype analysis for the five crops. The LSD0.05,L of cotton and maize decreased from approximately 2.5% and 2.1% to about 0.8% and 0.7%, respectively; that of soybean dropped from about 1.8% to 0.7%; and that of rice and wheat decreased from approximately 0.9% to about 0.3%. (6) At a significance level of 0.05, the average least significant difference among genotypes of each crop was approximately 0.4%. That is, the SNP marker method could distinguish a difference of 0.4% among genotypes. Among them, the discriminative ability of cotton and soybean was slightly higher than 0.5%, that of maize was slightly higher than 0.4%, and that of rice and wheat was slightly higher than 0.2%. (7) The multi-genotype combined analysis method could estimate the standard deviation among genotypes and the laboratory × genotype interaction standard deviation, which could not be estimated by the single-genotype analysis method. The standard deviation among soybean genotypes was approximately 2.3%, which was significantly higher than that of other crops, consistent with the combined variance analysis outputs in Table 3. The standard deviation among maize genotypes was approximately 1%, that of cotton and rice was around 0.4%, and that of wheat was the lowest at 0.2%. The standard deviations of the laboratory × genotype interaction effects of maize, soybean, and cotton were approximately 1.8%, 1.3%, and 0.8%, respectively, and those of wheat and rice were slightly higher than 0.5%. Compared with the data analysis method for single-sample point across multiple laboratories, the combined analysis of variance (ANOVA) method using multi-sample and cross-laboratory test data significantly reduced the reproducibility standard deviation (by 13.3%) and the expanded uncertainty (by 18.4%), thereby demonstrating that it can effectively lower the risk of misclassification in the actual process of seed certification or variety registration. Obviously, multi-genotype analysis can estimate statistics such as detection precision and uncertainty more precisely and can significantly enhance the reproducibility standard deviation, expanded uncertainty coefficient, least significant difference, and the discriminative ability of the SNP marker method for each crop.

4. Discussion

Our study appraised the reliability of the SNP method by examining all defined detection statistics across five crops in China and proposed improvements to the statistical analysis and graphical representation of detection results that will assist in the adoption and acceptance of the detection method.
Owing to the values of detection trueness and related uncertainty statistics, the SNP method was found to be quite reliable. The ranking of crops in terms of trueness was, from highest to lowest, wheat (99.5%) > rice (99.2%) > cotton (98.1%) > soybean (97.2%) > maize (96.2%). The reproducibility standard deviation ranking of the five crops estimated by the multi-genotype combined analysis method, in ascending order, was wheat (0.64%) > rice (0.71%) > soybean (1.32%) > cotton (1.81%) > maize (2.71%). The ranking of the expanded uncertainties of different crops was likely in the same order. As for the repeatability standard deviation, wheat and rice ranked first, then soybean, maize and cotton. There are no existing studies allowing all the values of detection trueness to be appraised, but it is worth noting that the figure obtained for wheat is fully consistent with that obtained in a case study of 502 European winter wheat varieties, for which the overall accuracy level achieved was 99.5% [7]. In a soybean research case [26], the concordance among five laboratories was reported to be above 0.9888. However, considering that this result was based on genetic similarity calculations (heterozygous-homozygous comparisons are assigned half weight), the accuracy level of SNP detection results should be less than 98.9%. According to Chinese SNP detection standards, the threshold for declaring two samples as the same variety is set at 97% marker similarity for rice, 98% for wheat, and 97% for maize [12,21,22].
Our results show that the reliability of the SNP method is not perfect due to variation in the detection results. In the related combined analysis of the variance of the detection trueness data (Table 4), the effects of laboratories, genotypes, and the interaction between laboratories and genotypes were all extremely significant, while the sources of variation differed to some extent among crops. Although, theoretically, the reliability of detection by the SNP marker method mainly relies on the quantity and quality of molecular markers, as well as their minimum allele frequency variation, we saw that, in practice, detection results are inevitably impacted by intra- and inter-laboratory factors. This is consistent with the findings of former works on peas [13] and wheat [13], as mentioned in the introduction. Our results are also consistent with those of Székács et al. [27], who pointed out that significant differences still occur among toxin concentrations detected in different laboratories when determining the Cry1 Ab toxin in maize leaf material despite the use of a standardized enzyme-linked immunoassay protocol. Despite the high resolution of the SNP marker method, its reliability is susceptible to variations in technical execution [28,29]. A case in point is the reported 96.9% to 98.4% concordance between base extension techniques and direct sequencing [30]. The intra- and inter-laboratory factors observed in our study likely encompass such technical discrepancies.
Being the first, to our knowledge, to simultaneously address several (five) crops, our study shows that the sources of variation in the detection results can differ between crops. For cotton, maize, and rice the variations mainly resulted from inter-laboratory factors and the interaction between laboratories and genotypes, while the differences between genotypes impacted relatively very little. For soybean, variations mainly stemmed from differences between genotypes, while differences between laboratories impacted relatively little. For wheat, variations were mainly derived from the interaction effect between laboratories and genotypes, while differences between laboratories or between genotypes had little impact. By explicitly including the genotype-by-laboratory interaction, the combined ANOVA model separates this specific source of variation from the residual error. This yields a purer, reduced estimate of experimental error, which in turn increases the power of statistical tests for detecting true differences.
We believe that two factors at least are behind the observed variation: one is the genetic purity (homozygosis rate) of the varieties used in the crops, and the other is the quantity and representativeness of SNP molecular markers. Indeed, in China, all wheat genotypes are conventional varieties, most soybean and rice varieties are conventional, all maize varieties are hybrid, and more hybridization is observed in cotton varieties. The extent of heterozygosis in the varieties used is hence inversely related to the observed overall performance ranking of the detection accuracy (wheat > rice > cotton > soybean > maize). The lower performance for cotton and soybean was also related to the smaller number of SNP markers (58 and 65 for cotton and soybean, respectively, versus 96 for the three other crops), but our study did not allow for quantification of the relative impacts of these two factors. Our explanation is in line with the conclusion that it was easier and more certain to detect similar tomato varieties in a study based on 20 markers when they were homogeneous [8]. Similarly, the lower detection reliability for maize with total recourse to hybrid varieties has already been pointed out [8]. The implication of the differences observed in the sources of variation in detection results is that the tolerable error or confidence interval when using the SNP method varies depending on the crop; the higher the degree of heterozygosis in the varieties and the lower the number of available markers, the higher the tolerable error.
The observed, seemingly inevitable, intra- and inter-laboratory effects continue to raise questions about the single-genotype method so far recommended (ISO 5725) for estimating the uncertainty of detection by markers [31]. As observed and quantified by our study comparing the proposed multi-genotype method to the single-genotype method, the single-genotype method overlooks the existence of the interaction effect between genotypes and laboratories and, as a result, can overestimate the uncertainty (Table 3). Based on the multi-genotype analysis method, the inter-laboratory standard deviation, the reproducibility standard deviation, the ratio of the reproducibility standard deviation to the repeatability standard deviation, the uncertainty coefficient, and the expanded uncertainty all decreased significantly compared with those obtained using the single-genotype method. Among them, the inter-laboratory standard deviation had the largest decline, which led to a significant decrease in the ratio of the reproducibility standard deviation to the repeatability standard deviation. Our results are partially consistent partially with those of an inter-laboratory collaborative verification experiment of bee viral loads performed across 16 European National Reference Laboratories, where the standard deviations of measurement reproducibility showed a linear relationship that increased as bee viral loads increased, leading to difficulty in estimating the reproducibility standard deviation. In another area, Jbeily et al. [32] concluded that, due to the linear relationship between standard deviations and mean values, no fixed values of repeatability and reproducibility could be derived when following the requirements of ISO 5725 in a multi-national collaborative test for the determination of the rheological properties of wheat flour dough using the Haubelt Flourgraph. In addition, Zhu [33] stressed that the formula for calculating the reproducible variance between two laboratories given by the ISO 5725 method contradicts the classic theory of errors and could result in overestimation of the inter-laboratory variance. Therefore, as proposed in our study, we believe that the multi-genotype and multi-laboratory combined analysis of variance method is more suitable for estimating the repeatability standard deviation, inter-laboratory standard deviation, and reproducibility standard deviation to appraise the reliability of the SNP detection method. This is particularly true for crops for which the interaction of genotype × laboratory is a significant source of detection variation, namely, four out of the five crops studied here (with soybean being the exception).
The multi-genotype combined analysis method employed in this study demonstrated that the SNP marker-based approach could discriminate a genotypic difference of 0.4% at a significance level of 0.05. This indicates that the overall threshold for distinguishing variety samples of the five crops may be set at 0.4%. Specifically, the threshold for wheat and rice can be approximately 0.25%, for maize around 0.40%, and for soybean and cotton, roughly 0.5%. The SNP-based multi-genotype combined analysis method and the detected thresholds for the five major crops should be incorporated into the national industry standard for the SNP-based variety authenticity identification of major crops. Serving as the basis for determining the threshold values of statistical parameters in the SNP detection standards for crop varieties, this methodology and these thresholds ought to be popularized and implemented across various testing institutions and laboratories. The cross-laboratory multi-sample combined analysis of variance (ANOVA) method substantially reduces the reproducibility standard deviation and expanded uncertainty, thereby effectively enhancing the traceability and commercial reliability of molecular identification. This method can directly facilitate the development of national SNP identification protocols for seeds and prevent the mislabeling of varieties in the market. For instance, while Achard et al. established a SNP similarity of 96% as threshold for soybean cultivar difference in morphology [26], systematically incorporating technical detection errors would help make it more precise and robust.
Finally, our study proposes an improvement in the graphical representation of detection reliability statistics, an area previously explored by very few works. In the proposed LLG biplot, a variation in the GGE biplot [25,34], detection trueness and precision are clearly displayed, as the horizontal coordinate axis is merely the ATA, representing the direction of high detection trueness, while the arrow of the vertical coordinate S axis points towards the direction of poor detection precision (Figure 1). The two views of the LLG biplot illustrate the detection reliability statistics in a complementary way: in the trueness–precision view, the abscissa of the laboratory directly indicates the detection trueness, while the absolute value of the ordinate represents precision; in the ideal–laboratory view, the difference between the abscissa of the ideal laboratory mark and that of a given laboratory represents accuracy. This study revealed that, among the laboratories participating in the detection experiment, SZ and SC achieved the best detection accuracy, ZY, AX, HN, GS, BJ, ZYI, and ZZ achieved relatively good detection accuracy, DBN, ZX, SX, and HB achieved average detection accuracy, and BA, AH, and HLJ achieved poor detection accuracy. It also revealed the overall performance ranking of the detection accuracy of the crops to be, in descending order, wheat > rice > cotton > soybean > maize. We therefore believe that the application of the LLG biplot can present the trueness, precision, and accuracy of SNP marker detection more intuitively, efficiently, and simply.
In the cross-laboratory multi-sample combined analysis of variance (ANOVA) model used in this study, the genotype–laboratory interaction effect is incorporated, enabling more accurate decomposition of error variation sources, reducing reproducibility variance, and improving detection precision. The LLG biplot, a visual statistical method, facilitates intuitive understanding of detection accuracy, precision, and their interrelationships across laboratories. It is noteworthy that, with the rapid advancement of DNA molecular technologies, DNA barcoding has assumed an increasingly pivotal role in variety identification [11]. However, compared to multi-SNP analysis, DNA barcoding interrogates far fewer genomic loci, which increases the critical need for the assessment of detection errors. Our methods are also applicable to other detection techniques (such as SSR, InDel, DNA barcoding, etc.), allowing for the establishment of appropriate genotyping thresholds and graphical representations through statistical analysis of the detection results. This approach holds significant potential for applications in breeding, seed certification, germplasm resource management, and related research fields. Crucially, the “ideal–laboratory” view of the LLG biplot provides a direct visual metric for laboratory proficiency, enabling regulatory bodies to define performance thresholds and identify laboratories requiring technical support or method re-validation. For instance, a maximum permissible distance from the ideal point could be defined as a quality control threshold for laboratory accreditation, thus framing it as a tool for continuous quality improvement.
The application scope of these cross-laboratory validation and visual statistical methods is not limited to the five crops in this study—they are fully applicable to other crops or species at the molecular level (e.g., horticultural crops, medicinal plants, ornamental plants). Notably, they hold broader value in plant breeding, seed authenticity identification, and germplasm resource conservation. Previous studies on DNA barcoding in plant germplasm identification or variety mislabeling detection have shown that DNA barcoding prioritizes direct analysis of genetic variations among varieties at the molecular level [11,35]. In contrast, the LLG biplot emphasizes intuitive visualization of detection accuracy and precision across laboratories. Therefore, DNA barcoding and the LLG biplot provide complementary insights from distinct dimensions for variety identification. Their integration will further advance the application of DNA fingerprinting technology in the seed identification industry.

5. Conclusions

Our study appraised the reliability of the SNP method for crop variety identification by examining all the defined detection statistics for five major crops in China and proposed improvements in the statistical analysis and graphical representation of detection results. We found that the SNP method was quite reliable, with estimated trueness values between 99.5% (wheat) and 96.2% (maize). Better trueness was encountered for crops with more frequent homogeneous varieties like conventional ones. Nevertheless, the SNP method nevertheless is not perfect, as the detection results varied due to intra- and inter-laboratory factors, genotypes, and the genotype × laboratory interaction. By simultaneously addressing several (five) crops, our study, for the first time, revealed that the sources of variations depended on the crops, thus leading to distinct levels of tolerable error in the SNP detection varieties depending on the crops considered. Furthermore, the extreme significance of inter-laboratory effects and the genotype × laboratory interaction invalidates the single-genotype method of ISO 5725 for estimating the uncertainty statistics of the SNP detection method. Our proposed multi-genotype method confirmed and quantified the extent of the overestimation by the ISO method to be as high as 13%; therefore, since these laboratory and interaction effects are frequent, we believe that ISO 5725 should be revised. The LLG biplot method proposed in this study provides two views to clearly visualize the trueness and precision of the SNP detection results (the trueness–precision view) and the accuracy of the results of a given laboratory with regard to an ideal laboratory (the ideal–laboratory view). We thus believe that the application of the LLG biplot can help the adoption and acceptance of the SNP method for crop variety identification. With the gradual application of DNA barcoding or genomic selection technologies in plant breeding and germplasm resource conservation, integrating the LLG biplot technique with these approaches is expected to further enhance its application value in breeding programs, seed quality assurance, and molecular database management. Our findings suggest that future revisions of ISO 5725 should incorporate multi-genotype analysis requirements, particularly for crops with significant Laboratory × Genotype interaction effects, to ensure more accurate and fair assessment of variety distinctness.

Supplementary Materials

The following supporting information can be downloaded at: https://www.mdpi.com/article/10.3390/agronomy15122670/s1, Table S1: Genetic distance matrix of Cotton varieties; Table S2: Genetic distance matrix of Maize varieties; Table S3: Genetic distance matrix of Rice varieties; Table S4: Genetic distance matrix of Soybean varieties; Table S5: Genetic distance matrix of Wheat varieties.

Author Contributions

Conceptualization, N.X., B.P. and J.X.; methodology, N.X., B.P., J.X. and G.W.; validation, N.X., B.P., S.J., J.X. and G.W.; formal analysis, N.X., B.P., J.X. and G.W.; investigation, N.X., B.P., S.J., J.X., L.L., H.Y., F.J., Q.X., M.K., X.R., Q.S. and G.W.; resources, L.L., H.Y., F.J., Q.X., M.K., X.R., Q.S. and B.P.; data curation, N.X., S.J., J.L. and X.X.; writing—original draft preparation, N.X., B.P., J.X. and G.W.; writing—review and editing, N.X., B.P., J.X. and G.W.; supervision, S.J., N.X. and B.P.; project administration, N.X., S.J. and B.P.; funding acquisition, S.J., N.X., B.P. and J.X. All authors have read and agreed to the published version of the manuscript.

Funding

This research was funded by the Biological Breeding-National Science and Technology Major Project (grant number 2022ZD04019), the Science and Technology Innovation Project of BAAFS, China (grant number KJCX20251004, KJCX20230307), the National Natural Science Foundation of China (grant number 32572366) and Jiangsu Agricultural Science and Technology Innovation Fund (grant number CX(24)3120).

Data Availability Statement

The original contributions presented in this study are included in the article/Supplementary Materials. Further inquiries can be directed to the corresponding authors.

Acknowledgments

We would like to express our gratitude to Michel Fok (a former senior researcher of CIRAD in France) for his valuable contribution to the language editing and refinement of this manuscript.

Conflicts of Interest

The authors declare no conflicts of interest.

References

  1. Zhang, S.; Yuan, D.; Lu, H.; Jian, Y.; Li, X.; Huang, A.; Luo, Z.; Lu, Q.; Tan, Y.; Zhang, Y.; et al. The results of rice germplasm EDV test by genomic analysis and related discussions. Sci. Sin. Vitae 2020, 50, 633–649. [Google Scholar] [CrossRef]
  2. Wei, Z.; Li, H.; Li, J.; Yasir, A.G.; Ma, Y.; Qiu, L. Accurate identification of varieties by nucleotide polymorphisms and establishment of scannable variety IDs for soybean germplasm. Acta Agron. Sin. 2018, 44, 315–323. [Google Scholar] [CrossRef]
  3. Jamali, S.H.; Cockram, J.; Hickey, L.T. Insights into deployment of DNA markers in plant variety protection and registration. Theor. Appl. Genet. 2019, 132, 1911–1929. [Google Scholar] [CrossRef]
  4. UPOV (International Union for the Protection of New Varieties of Plants). Guidelines for DNA-Profiling: Molecular Marker Selection and Database Construction; UPOV/INF/17/2; UPOV (International Union for the Protection of New Varieties of Plants): Geneva, Switzerland, 2010. [Google Scholar]
  5. ISTA (International Seed Testing Association). Method Validation Reports on Rules Proposals for the International Rules for Seed Testing 2017 Edition; ISTA OM16-06; ISTA (International Seed Testing Association): Geneva, Switzerland, 2017. [Google Scholar]
  6. Van Inghelandt, D.; Melchinger, A.E.; Lebreton, C.; Stich, B. Population structure and genetic diversity in a commercial maize breeding program assessed with SSR and SNP markers. Theor. Appl. Genet. 2010, 120, 1289–1299. [Google Scholar] [CrossRef]
  7. Röder, M.S.; Wendehake, K.; Korzun, V.; Bredemeijer, G.; Laborie, D.; Bertrand, L.; Isaac, P.; Rendell, S.; Jackson, J.; Cooke, R.J.; et al. Construction and analysis of a microsatellite-based database of european wheat varieties. Theor. Appl. Genet. 2002, 106, 67–73. [Google Scholar] [CrossRef] [PubMed]
  8. Bredemeijer, G.; Cooke, R.J.; Ganal, M.W.; Peeters, R.; Isaac, P.; Noordijk, Y.; Rendell, S.; Jackson, J.; Röder, M.S.; Wendehake, K.; et al. Construction and testing of a microsatellite database containing more than 500 tomato varieties. Theor. Appl. Genet. 2002, 105, 1019–1026. [Google Scholar] [CrossRef]
  9. Reid, A.; Hof, L.; Felix, G.; Rucker, B.; Tams, S.; Milczynska, E.; Esselink, D.; Uenk, G.; Vosman, B.; Weitz, A. Construction of an integrated microsatellite and key morphological characteristic database of potato varieties on the EU common catalogue. Euphytica 2011, 182, 239–249. [Google Scholar] [CrossRef]
  10. Xu, Y.; Wang, B.; Zhang, J.; Zhang, J.; Li, J. Enhancement of plant variety protection and regulation using molecular marker technology. Acta Agron. Sin. 2022, 48, 1853–1870. [Google Scholar] [CrossRef]
  11. Paschalidis, K.; Fanourakis, D.; Tsaniklidis, G.; Tsichlas, I.; Tzanakakis, V.A.; Bilias, F.; Samara, E.; Ipsilantis, I.; Grigoriadou, K.; Samartza, I.; et al. DNA barcoding and fertilization strategies in Sideritis syriaca subsp. syriaca, a local endemic plant of Crete with high medicinal value. Int. J. Mol. Sci. 2024, 25, 1891. [Google Scholar] [PubMed]
  12. NY/T 4022-2021; Maize (Zea mays L.) Variety Genuineness Identification: SNP Based Method. Standardization Administration of the People’s Republic of China: Beijing, China, 2021. Available online: https://hbba.sacinfo.org.cn/attachment/onlineRead/0c9ed07cbe3b38f0129c0e420923580f5b49002d92aa1699d6164f667de39f73 (accessed on 10 January 2025).
  13. ISTA (International Seed Testing Association). Method Validation Reports on Rules Proposals for the International Rules for Seed Testing 2023 Edition. Part 3: Validation of a New DNA-Based Method for Testing Pisum Varieties; ISTA OGM22-06-Part 3; ISTA (International Seed Testing Association): Geneva, Switzerland, 2023. [Google Scholar]
  14. Xu, N.; Jin, S.; Jin, F.; Liu, L.; Xu, J.; Liu, F.; Ren, X.; Sun, Q.; Xu, X.; Pang, B. Genetic similarity and its detection accuracy analysis of wheat varieties based on SNP markers. Acta Agron. Sin. 2024, 50, 887–896. [Google Scholar] [CrossRef]
  15. Ro, N.; Haile, M.; Yoon, H.; Yu, D.; Ko, H.; Cho, G.; Woo, H.; Sung, P. Development of informative SNP markers for Capsicumspecies identification using phenotypic and genomic data. Sci. Hortic. 2025, 351, 114417. [Google Scholar] [CrossRef]
  16. ISO 5725-1; Accuracy (Trueness and Precision) of Measurement Methods and Results. Part 1: General principles and Definitions; ISO (International Standards Organization): Geneva, Switzerland, 1994.
  17. Ellison, S.L.R.; Williams, A. Eurachem/CITAC Guide: Quantifying Uncertainty in Analytical Measurement, 3rd ed.; Laboratory of the Government Chemist: London, UK, 2012; pp. 7–9. [Google Scholar]
  18. IOC (International Standards Organization); IEC (International Electrotechnical Commission). Guide to the Expression of Uncertainty in Measurement. Part 1: Introduction; ISO/IEC Guide 98-Part 1; ISO (International Standards Organization): Geneva, Switzerland; IEC (International Electrotechnical Commission): Geneva, Switzerland, 2024. [Google Scholar]
  19. ISO 13528; Statistical Methods for Use in Proficiency Testing by Interlaboratory Comparison. ISO (International Standards Organization): Geneva, Switzerland, 2022.
  20. ISO 5725-4; Accuracy (Trueness and Precision) of Measurement Methods and Results. Part 4: Basic Methods for the Determination of the Trueness of a Standard Measurement Method. ISO (International Standards Organization): Geneva, Switzerland, 1994.
  21. NY/T 2745-2021; Rice (Oryza sativa L.) Variety Genuineness Identification: SNP Based Method. Standardization Administration of the People’s Republic of China: Beijing, China, 2021. Available online: https://hbba.sacinfo.org.cn/portal/online/f34b856d930383c47fe37d85228854a1b82be2b2bb8a3926ffeb9da773aa83db (accessed on 10 January 2025).
  22. NY/T 4021-2021; Wheat (Triticum aestivum L.) Variety Genuineness Identification: SNP Based Method. Standardization Administration of the People’s Republic of China: Beijing, China, 2021. Available online: https://hbba.sacinfo.org.cn/portal/online/cb9572bf672f36f7f6f1dd479e46398a36702b3d7d29599ae9247a07ff46cb86 (accessed on 10 January 2025).
  23. Tang, Q.; Zhang, C. Data Processing System (DPS) software with experimental design, statistical analysis and data mining developed for use in entomological research. Insect Sci. 2013, 20, 254–260. [Google Scholar] [CrossRef]
  24. Yan, W. A systematic narration of some key concepts and procedures in plant breeding. Front. Plant Sci. 2021, 12, 724517. [Google Scholar] [CrossRef]
  25. Yan, W. Singular-value partitioning in biplot analysis of multienvironment trial data. Agron. J. 2002, 94, 990–996. [Google Scholar] [CrossRef]
  26. Achard, F.; Butruille, M.; Madjarac, S.; Nelson, P.T.; Duesing, J.; Laffont, J.; Nelson, B.; Xiong, J.; Mikel, M.A.; Smith, J.S.C. Single nucleotide polymorphisms facilitate distinctness-uniformity-stability testing of soybean cultivars for plant variety protection. Crop Sci. 2020, 60, 2280–2303. [Google Scholar] [CrossRef]
  27. Székács, A.; Weiss, G.; Quist, D.; Hilbeck, A. Inter-laboratory comparison of cry1ab toxin quantification in MON 810 maize by enzyme-immunoassay. Food Agric. Immunol. 2012, 23, 99–121. [Google Scholar] [CrossRef]
  28. Singh, N.; Choudhury, D.R.; Singh, A.K.; Kumar, S.; Srinivasan, K.; Tyagi, R.K.; Singh, N.K.; Singh, R. Comparison of SSR and SNP markers in estimation of genetic diversity and population structure of Indian rice varieties. PLoS ONE 2013, 8, e84136. [Google Scholar] [CrossRef]
  29. Xu, K.; Wu, J.; Li, F.; Wu, X. Comparison between SSR and SNP systems of genetic diversity analysis in Brassica napus L. Oil Crop Sci. 2018, 3, 86–91. [Google Scholar]
  30. Esteves, F.; Gaspar, J.; De Sousa, B.; Antunes, F.; Mansinho, K.; Matos, O. Clinical relevance of multiple single-nucleotide polymorphisms in Pneumocystis jiroveciiPneumonia: Development of a multiplex PCR-single-base-extension methodology. J. Clin. Microbiol. 2011, 49, 1810–1815. [Google Scholar] [CrossRef]
  31. ISO 5725-2; Accuracy (Trueness and Precision) of Measurement Methods and Results. Part 2: Basic Method for the Determination of Repeatability and Reproducibility of a Standard measurement Method. ISO (International Standards Organization): Geneva, Switzerland, 1994.
  32. Jbeily, A.C.; Haubelt, G.; Myburgh, J.; Svacinka, R. Results of an international ring test for the determination of the rheological properties of wheat flour dough using the haubelt flourgraph e 7 (ICC standard no. 180). Qual. Assur. Saf. Crops Foods 2014, 6, 469–477. [Google Scholar] [CrossRef]
  33. Zhu, J. Discussion on repeatability and reproducibility of measuring method in ISO 5725. China Stand. 2013, 58, 80–87. [Google Scholar]
  34. Yan, W.; Frégeau-Reid, J. Genotype by yield*trait (GYT) biplot: A novel approach for genotype selection based on multiple traits. Sci. Rep. 2018, 8, 8242. [Google Scholar] [CrossRef]
  35. Bourgou, S.; Ben Haj Jilani, I.; Karous, O.; Megdiche-Ksouri, W.; Ghrabi-Gammar, Z.; Libiad, M.; Khabbach, A.; El Haissoufi, M.; Lamchouri, F.; Greveniotis, V.; et al. Medicinal-cosmetic potential of the local endemic plants of Crete (Greece), Northern Morocco and Tunisia: Priorities for conservation and sustainable exploitation of neglected and underutilized phytogenetic resources. Biology 2021, 10, 1344. [Google Scholar] [CrossRef]
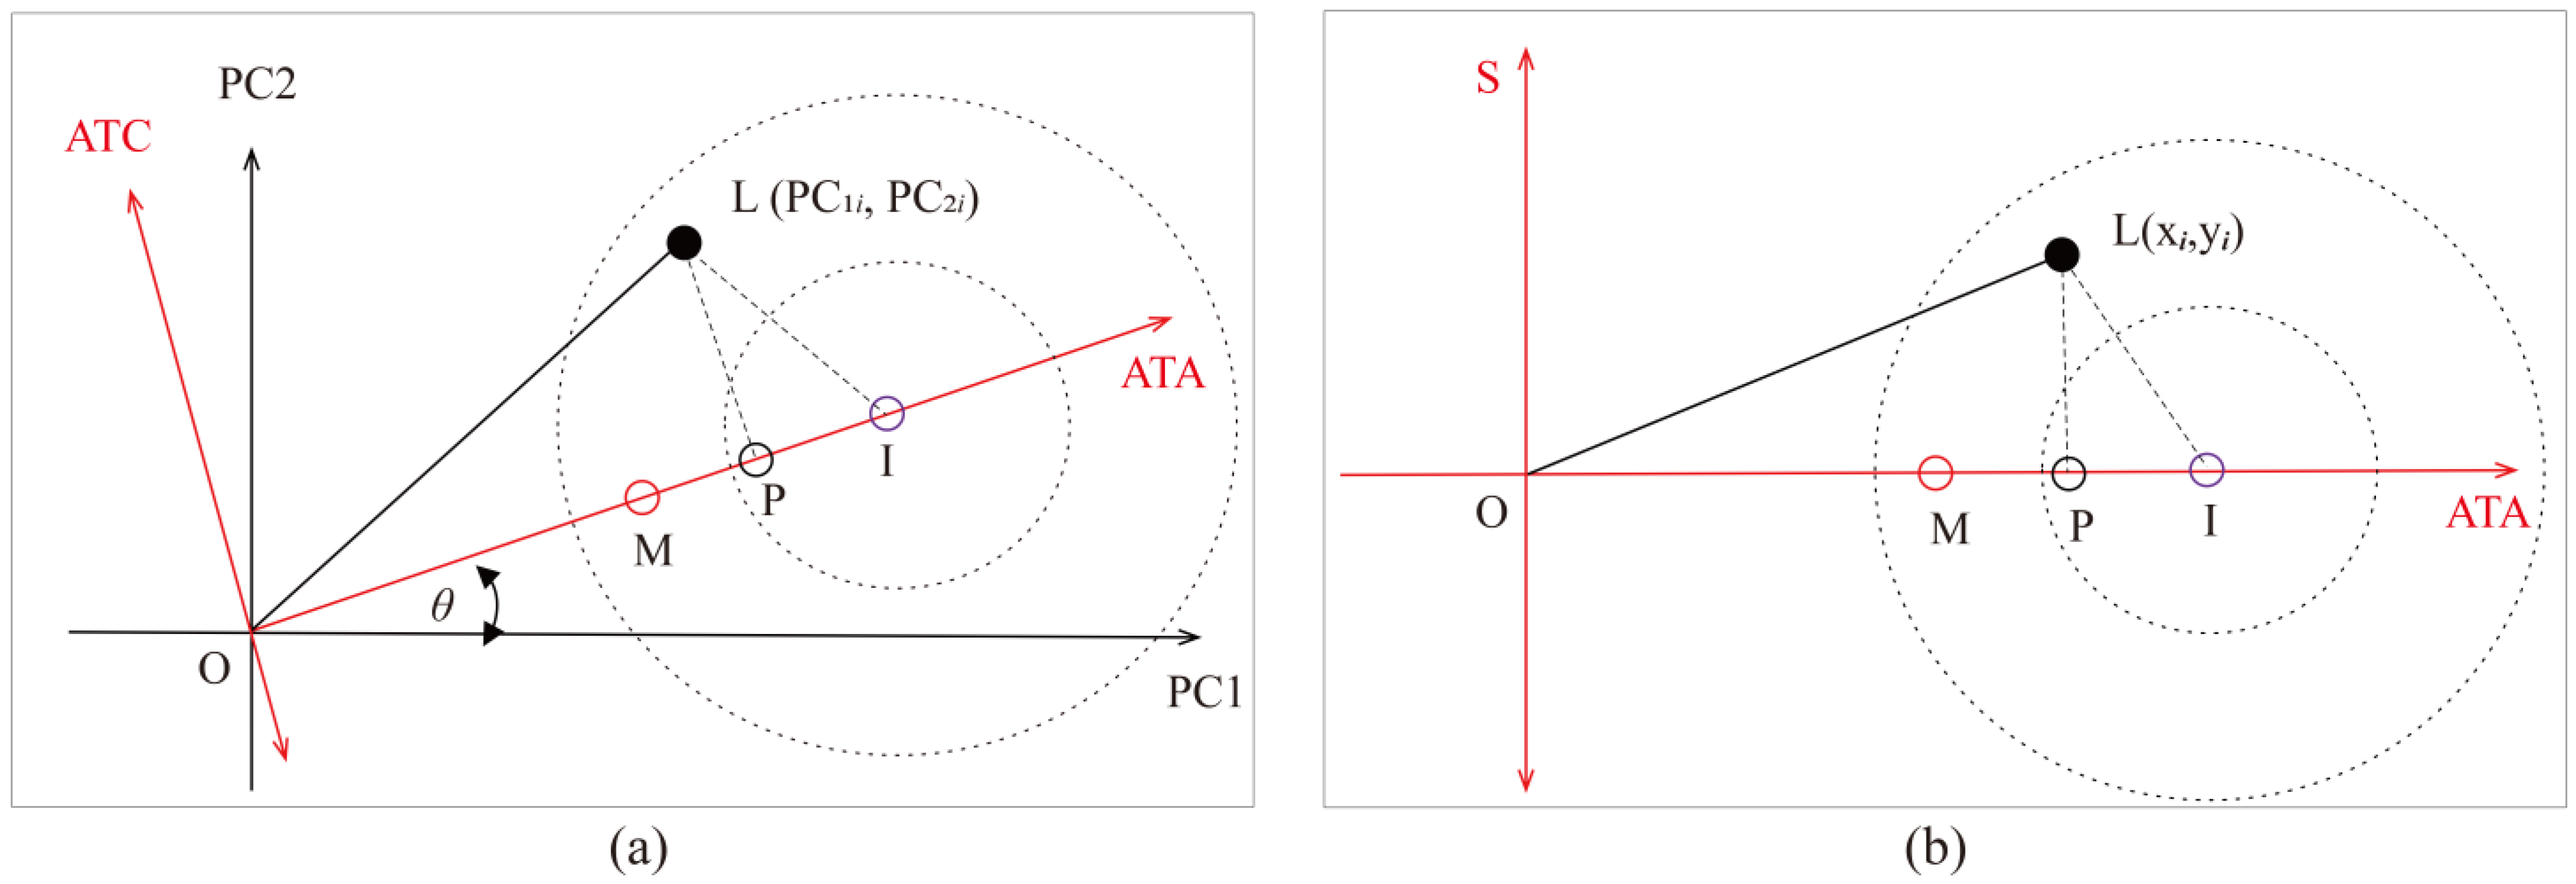
Figure 1. GGE biplot (a) and LLG biplot (b) for visual analysis of trueness, precision, and accuracy of laboratory detection. O: biplot origin; PC1: horizontal axis; PC2: vertical coordinate; L: mark of Labi; ATA: average environment axis; ATC: average environment coordinate; M: average environment mark; I: ideal laboratory mark; P: foot of perpendicular line from point L to ATA; θ: angle between ATA and horizontal PC1 axis; S: stability axis.
Agronomy 15 02670 g001
Figure 2. “Trueness–precision” and “Accuracy” views of LLG biplots for cotton. (a) The detection “trueness–precision” biplots; (b) The detection accuracy biplots. The horizontal axis (average tester axis, ATA) represents the direction of increasing mean detection performance across genotypes. The absolute value on the vertical coordinate (stability, S) represents a laboratory’s consistency across different genotypes; values closer to zero indicate higher stability. The marks prefixed with an asterisk (*) and plus sign (+) indicate laboratory and test genotypes, respectively, while genotype marks in (b) are replaced with “+” for clarity. Red circles in (a,b) indicate the average environmental mark and the ideal laboratory mark, respectively. “Scaling = 1”: the laboratory-by-genotype table was scaled by the standard deviation of each genotype; “Centering = 2”: the laboratory-by-genotype table was centered by the mean of each genotype; “SVP = 1”: the singular values were fully partitioned to the laboratory, rendering the biplot most suitable for laboratory evaluation. PC1 and PC2 explain 59.7% and 19.9% of the total variance, respectively.
Agronomy 15 02670 g002
Figure 3. “Trueness–precision” and “Accuracy” views of LLG biplots for maize. (a) The detection “trueness–precision” biplots; (b) The detection accuracy biplots. The horizontal axis (average tester axis, ATA) represents the direction of increasing mean detection performance across genotypes. The absolute value on the vertical coordinate (stability, S) represents a laboratory’s consistency across different genotypes; values closer to zero indicate higher stability. The marks prefixed with an asterisk (*) and plus sign (+) indicate laboratory and test genotype, respectively, while genotype marks in (b) are replaced with “+” for clarity. Red circles in (a,b) indicate the average environmental mark and the ideal laboratory mark, respectively. “Scaling = 1”: the laboratory-by-genotype table was scaled by the standard deviation of each genotype; “Centering = 2”: the laboratory-by-genotype table was centered by the mean of each genotype; “SVP = 1”: the singular values were fully partitioned to the laboratory, rendering the biplot most suitable for laboratory evaluation. PC1 and PC2 explain 69.3% and 12.4% of the total variance, respectively.
Agronomy 15 02670 g003
Figure 4. “Trueness–precision” and “Accuracy” views of LLG biplots for rice. (a) The detection “trueness–precision” biplots; (b) The detection accuracy biplots. The horizontal axis (average tester axis, ATA) represents the direction of increasing mean detection performance across genotypes. The absolute value on the vertical coordinate (stability, S) represents a laboratory’s consistency across different genotypes; values closer to zero indicate higher stability. The marks prefixed with an asterisk (*) and plus sign (+) indicate laboratory and test genotype, respectively, while genotype marks in (b) are replaced with “+” for clarity. Red circles in (a,b) indicate the average environmental mark and the ideal laboratory mark, respectively. “Scaling = 1”: the laboratory-by-genotype table was scaled by the standard deviation of each genotype; “Centering = 2”: the laboratory-by-genotype table was centered by the mean of each genotype; “SVP = 1”: the singular values were fully partitioned to the laboratory, rendering the biplot most suitable for laboratory evaluation. PC1 and PC2 explain 53.8% and 27.1% of the total variance, respectively.
Agronomy 15 02670 g004
Figure 5. “Trueness–precision” and “Accuracy” views of LLG biplots for soybean. (a) The detection “trueness–precision” biplots; (b) The detection accuracy biplots. The horizontal axis (average tester axis, ATA) represents the direction of increasing mean detection performance across genotypes. The absolute value on the vertical coordinate (stability, S) represents a laboratory’s consistency across different genotypes; values closer to zero indicate higher stability. The marks prefixed with an asterisk (*) and plus sign (+) indicate laboratory and test genotype, respectively, while genotype marks in (b) are replaced with “+” for clarity. Red circles in (a,b) indicate the average environmental mark and the ideal laboratory mark, respectively. “Scaling = 1”: the laboratory-by-genotype table was scaled by the standard deviation of each genotype; “Centering = 2”: the laboratory-by-genotype table was centered by the mean of each genotype; “SVP = 1”: the singular values were fully partitioned to the laboratory, rendering the biplot most suitable for laboratory evaluation. PC1 and PC2 explain 40.3% and 25.1% of the total variance, respectively. The wide spread of genotype markers (+) visually reflects the variance analysis result that soybean genotype was the main source of variation (70.0% SStrmt).
Agronomy 15 02670 g005
Figure 6. “Trueness–precision” and “Accuracy” views of LLG biplots for wheat. (a) The detection “trueness–precision” biplots; (b) The detection accuracy biplots. The horizontal axis (average tester axis, ATA) represents the direction of increasing mean detection performance across genotypes. The absolute value on the vertical coordinate (stability, S) represents a laboratory’s consistency across different genotypes; values closer to zero indicate higher stability. The marks prefixed with an asterisk (*) and plus sign (+) indicate laboratory and test genotype, respectively, while genotype marks in (b) are replaced with “+” for clarity. Red circles in (a,b) indicate the average environmental mark and the ideal laboratory mark, respectively. “Scaling = 1”: the laboratory-by-genotype table was scaled by the standard deviation of each genotype; “Centering = 2”: the laboratory-by-genotype table was centered by the mean of each genotype; “SVP = 1”: the singular values were fully partitioned to the laboratory, rendering the biplot most suitable for laboratory evaluation. PC1 and PC2 explain 32.9% and 24.1% of the total variance, respectively.
Agronomy 15 02670 g006
Figure 7. “Trueness–precision” and “Accuracy” views of LLG biplots for overall crops. (a) The “trueness–precision” biplot based on crop-centered datasets; “Scaling = 1”: the laboratory-by-crop table was scaled by the standard deviation of each crop; “Centering = 2”: the laboratory-by-crop table was centered by the mean of each crop; “SVP = 1”: the singular values were fully partitioned to the laboratory, making the biplot most suitable for laboratory evaluation; PC1 and PC2 explain 62.7% and 20.7% of the total variance, respectively; the dashed lines are guide lines connecting the laboratory name labels to their respective coordinates in the figure. (b) The “trueness-precision” biplot based on laboratory-centered datasets; “Scaling = 1”: the crop-by-laboratory table was scaled by the standard deviation of each laboratory; “Centering = 2”: the crop-by-laboratory table was centered by the mean of each laboratory; “SVP = 1”: the singular values were fully partitioned to the crop, ensuring the biplot is most suitable for crop evaluation; PC1 and PC2 explain 76.1% and 13.7% of the total variance, respectively. The horizontal axis (average tester axis, ATA) represents the direction of increasing mean detection performance across genotypes. The absolute value on the vertical coordinate (stability, S) represents a laboratory’s consistency across different genotypes; values closer to zero indicate higher stability. The marks prefixed with an asterisk (*) and plus sign (+) indicate laboratory and test genotype, respectively, while genotype marks in (b) are replaced with “+” for clarity. Red circles in (a,b) indicate the average environmental mark.
Agronomy 15 02670 g007
Table 1. Characteristics of the collaborative scheme of variety identification by SNP molecular markers.
CropSNP NumberLaboratory Number (p)Variety Number
(q)
TypeWeight
(g)
Cotton58919DNA1.0 × 10−5
Maize96821Seed18.0
Rice96711Seed2.0
Soybean65812Seed15.0
Wheat961015Seed powder0.5
Table 2. Characteristics of the laboratories participating in the collaborative scheme.
Laboratory Name InitialsProvinceDetection PlatformCrop Detected
CottonMaizeRiceSoybeanWheat
ZXBeijingLGC SNP Line
BABeijingIMAP
HBHebeiLGC SNP Line
ZYBeijingArray tape
HNHenanLGC SNP Line
SXShanxiLGC SNP Line
SAXShaanxiLGC SNP Line
BJBeijingQuantitative PCR
SZGuangdongLGC SNP Line
ZZBeijingQuantitative PCR
GSGansuQuantitative PCR
HLJHeilongjiangLGC SNP Line
SCSichuanArray tape
ZYIGansuLGC SNP Line
AHAnhuiLGC SNP Line
DBNBeijingArray tape
Tick mark “√” indicates the laboratories that undertook the collaborative assessment experiment on the SNP molecular marker method for each crop.
Table 3. Formulas for the precision and uncertainty statistics according to two methods.
StatisticSingle-Genotype Analysis Method for Genotype j IndividuallyMulti-Genotype Joint Analysis Method for All Genotypes Simultaneously
Repeatability standard deviation (σr) 1 p ( n 1 ) i = 1 p k = 1 n ( y i j k y ¯ i j ) 2 1 p q ( n 1 ) i = 1 p j = 1 q k = 1 n ( y i j k y ¯ i j ) 2
Inter-laboratory standard deviation (σL) 1 p 1 i = 1 p ( y ¯ i j y ¯ ¯ j ) 2 1 n σ r j 2 1 p 1 i = 1 p ( y ¯ ¯ i y ¯ ¯ ) 2 1 q n σ r 2
Reproducibility standard deviation (σR) σ r j 2 + σ L j 2 σ r 2 + σ L 2
Ratio of the reproducibility to the repeatability standard deviation (γ) σ R j / σ r j σ R / σ r
Coefficient of uncertainty (A) 1.96 [ n ( γ j 2 1 ) + 1 ] / ( γ j 2 p n ) 1.96 [ n ( γ 2 1 ) + 1 ] / ( γ 2 p n )
Coefficient of extended uncertainty (EA) A j σ R j A σ R
Least significant difference among labs at the 0.05 probability level (LSD0.05,L) 2 σ r j 2 / n t ( 0.05 , p ( n 1 ) ) 2 σ r 2 / q n t ( 0.05 , p ( n 1 ) ( q 1 ) )
Least significant difference among genotypes at the 0.05 probability level (LSD0.05,G)/ 2 σ r 2 / p n t ( 0.05 , p ( n 1 ) ( q 1 ) )
Test accuracy (TA) 100 ( 100 y ¯ ¯ j ) 2 + σ R j 2 100 ( 100 y ¯ ¯ ) 2 + σ R 2
p: the number of laboratories involved in the assessment experiment; q: the number of genotypes tested; y ¯ ¯ j : the average accuracy of genotype j tested in p laboratories; y ¯ ¯ i : the average trueness of q genotypes tested in the laboratory i; y ¯ ¯ : the grand mean of trueness of q genotypes across p laboratories. The statistic with the subscript “j” represents the one-genotype statistic of genotype j. For example, σrj is the repeatability standard deviation of genotype j.
Table 4. Analysis of variance for the detection of trueness by the SNP molecular marker method for five major crops in China.
CropSourcedfSSSStrmt (%)MSF-Valuep-Value
CottonLaboratory8538.4043.967.3031.420.000
Genotype18129.3710.57.193.360.000
Laboratory × Genotype144559.2045.63.881.810.000
Error342732.66 2.14
MaizeLaboratory72587.1354.4369.59244.890.000
Genotype20544.6011.427.2318.040.000
Laboratory × Genotype1401626.8234.211.627.700.000
Error336507.09 1.51
RiceLaboratory647.9932.08.0029.630.000
Genotype1034.7423.13.4712.870.000
Laboratory × Genotype6067.4344.91.124.160.000
Error15441.57 0.27
SoybeanLaboratory7117.515.916.7912.680.000
Genotype111390.3770.0126.4095.460.000
Laboratory × Genotype77477.9824.16.214.690.000
Error192254.23 1.32
WheatLaboratory944.3521.54.9315.920.000
Genotype1420.6310.01.474.760.000
Laboratory × Genotype126141.6768.61.123.630.000
Error30092.88 0.31
SStrmt (%) indicates the percent of the sum of squares of treatment.
Table 5. Estimation of the precision and uncertainty statistics by the single-genotype analysis method for five crops.
StatisticCottonMaizeRiceSoybeanWheatMean
σr1.44 ± 0.06 a1.19 ± 0.07 b0.49 ± 0.06 c1.03 ± 0.16 b0.54 ± 0.04 c0.94
[1.32, 1.56][1.05, 1.33][0.37, 0.61][0.71, 1.35][0.46, 0.62][0.78, 1.09]
σL1.07 ± 0.17 bc2.83 ± 0.23 a0.68 ± 0.06 cd1.27 ± 0.17 b0.56 ± 0.05 d1.28
[0.73, 1.41][2.37, 3.29][0.56, 0.80][0.93, 1.61][0.46, 0.66][1.01, 1.55]
σR1.89 ± 0.12 b3.09 ± 0.22 a0.85 ± 0.06 c1.68 ± 0.20 b0.80 ± 0.04 c1.66
[1.65, 2.13][2.65, 3.53][0.73, 0.97][1.28, 2.08][0.72, 0.88][1.41, 1.92]
γ1.33 ± 0.09 c2.70 ± 0.19 a1.91 ± 0.20 b1.78 ± 0.18 bc1.56 ± 0.12 bc1.86
[1.15, 1.51][2.32, 3.08][1.51, 2.31][1.42, 2.14][1.32, 1.80][1.54, 2.17]
A0.48 ± 0.02 c0.65 ± 0.01 a0.65 ± 0.02 a0.59 ± 0.02 b0.50 ± 0.01 c0.57
[0.44, 0.52][0.63, 0.67][0.61, 0.69][0.55, 0.63][0.48, 0.52][0.54, 0.61]
R0.94 ± 0.09 b2.02 ± 0.16 a0.55 ± 0.04 c0.99 ± 0.12 b0.41 ± 0.03 c0.98
[0.76, 1.12][1.70, 2.34][0.47, 0.63][0.75, 1.23][0.35, 0.47][0.81, 1.16]
y ¯ ¯ 98.08 ± 0.12 b96.19 ± 0.23 d99.21 ± 0.12 a97.18 ± 0.66 c99.48 ± 0.06 a98.03
[97.84, 98.32][95.73, 96.65][98.97, 99.45][95.86, 98.50][99.36, 99.60][97.55, 98.50]
TA97.31 ± 0.17 b95.08 ± 0.31 c98.80 ± 0.10 a96.65 ± 0.66 b99.04 ± 0.06 a97.38
[97.00, 97.62][94.46, 95.70][98.60, 99.00][95.33, 97.97][98.92, 99.16][96.86, 97.89]
LSD0.05,L2.47 ± 0.10 a2.05 ± 0.12 b0.85 ± 0.10 c1.78 ± 0.27 b0.92 ± 0.07 c1.61
[2.27, 2.67][1.81, 2.29][0.65, 1.05][1.24, 2.32][0.78, 1.06][1.35, 1.88]
Data in the table are means ± SEs. Different lowercase letters in the same row indicate significant differences among crops at the 0.05 probability level. σr = repeatability standard deviation; σL inter-laboratory standard deviation; σR = reproducibility standard deviation; γ = ratio of the reproducibility standard deviation to the repeatability standard deviation; A= coefficient of uncertainty; R = coefficient of extended uncertainty; y ¯ ¯ = grand mean of trueness of q genotypes across p laboratories; TA = average test accuracy; LSD0.05,L = significant difference among labs at the 0.05 probability level. The values in square brackets are the 95% confidence intervals.
Table 6. The precision and uncertainty statistic estimation of SNP marker detection for the staple crop varieties based on multi-genotype combined analysis method.
StatisticCottonMaizeRiceSoybeanWheatMean
σr1.46
[1.383, 1.551]
1.23
[1.146, 1.319]
0.52
[0.475, 0.572]
1.15
[1.065, 1.246]
0.56
[0.515, 0.603]
0.98
[0.917, 1.058]
σL1.07 (0%)2.42 (−14.5%)0.48 (−29.4%)0.66 (−48%)0.32 (−42.9%)0.99 (−22.7%)
σR1.81 (−4.2%)2.71 (−12.3%)0.71 (−16.5%)1.32 (−21.4%)0.64 (−20%)1.44 (−13.3%)
σG0.431.040.392.280.20.87
σLG0.761.840.531.280.520.99
γ1.24 (−6.8%)2.21 (−18.1%)1.37 (−28.3%)1.15 (−35.4%)1.15 (−26.3%)1.42 (−23.7%)
A0.49 (2.1%)0.64 (−1.5%)0.59 (−9.2%)0.49 (−16.9%)0.44 (−12%)0.53 (−7%)
R0.89 (−5.3%)
[0.836, 0.949]
1.75 (−13.4%)
[1.637, 1.868]
0.42 (−23.6%)
[0.384, 0.465]
0.65 (−34.3%)
[0.592, 0.711]
0.28 (−31.7%)
[0.259, 0.306]
0.8 (−18.4%)
[0.742, 0.860]
y ¯ ¯ 98.0896.1999.2197.1899.4898.03
TA97.36 (0.1%)95.33 (0.3%)98.94 (0.1%)96.88 (0.2%)99.18 (0.1%)97.54 (0.2%)
LSD0.05,L0.78 (−68.4%)0.70 (−65.9%)0.32 (−62.4%)0.66 (−62.9%)0.28 (−69.6%)0.55 (−65.8%)
LSD0.05,G0.540.430.250.530.230.4
σG: the between-genotype standard deviation; σLG: the laboratory × genotype interaction standard deviation; LSD0.05,G: the least significant difference among genotypes. The data in parentheses are the percentage increase or decrease when the statistics estimated by the multi-genotype analysis method are compared with those estimated by the single-genotype analysis method. The values in square brackets are the 95% confidence intervals for σr and R.
Disclaimer/Publisher’s Note: The statements, opinions and data contained in all publications are solely those of the individual author(s) and contributor(s) and not of MDPI and/or the editor(s). MDPI and/or the editor(s) disclaim responsibility for any injury to people or property resulting from any ideas, methods, instructions or products referred to in the content.