Article

Enhancing the Valorization of Spent Pleurotus Substrate Through Anaerobic Digestion by Extracted Enzymes

by
Diana Constantinescu-Aruxandei
1,†,
Alexandru Vlaicu
1,†,
Daria Gabriela Popa
1,2,
Ștefan-Ovidiu Dima
1,
Mălina Deșliu-Avram
1,
Alin Cristian Nicolae Vintilă
1,
Marius Ghiurea
1,
Mihaela Cilțea-Udrescu
1,
Ioana Popa-Tudor
1,
Naomi Tritean
1,
Georgeta Ramona Ivan
1,
Cristian-Andi Nicolae
1,
Mihaela Ganciarov
1,
Gabriel Vasilievici
1,* and
Florin Oancea
1,2,*
1
Bioresource and Polymer Departments, National Institute for Research and Development in Chemistry and Petrochemistry—ICECHIM, Splaiul Independentei nr. 202, Sector 6, 060021 Bucharest, Romania
2
Faculty of Biotechnologies, University of Agronomic Sciences and Veterinary Medicine of Bucharest, Blvd. Marasti Nr. 59, Sector 1, 011464 Bucharest, Romania
*
Authors to whom correspondence should be addressed.
These authors contributed equally to this work.
Agronomy 2025, 15(11), 2663; https://doi.org/10.3390/agronomy15112663
Submission received: 13 September 2025 / Revised: 14 November 2025 / Accepted: 17 November 2025 / Published: 20 November 2025

Abstract

Spent mushroom substrate (SMS) could be used as a substrate in anaerobic digestion (AD), but some studies have reported modest production and yield of methane. Several solutions have been proposed to mitigate this issue, such as co-digestion with other substrates, various pretreatments, and the use of additives. In this study we report for the first time the possibility of enhancing the process of methane production from spent Pleurotus substrate (SPS) using a pretreatment with enzymes recovered by a simple aqueous extraction from SPS. This represents an alternative to harsher chemical and physical pretreatment methods. The pretreatment increased the methane production from SPS by 16% at saturation, and a 25% faster anaerobic digestion process was obtained. After 2 days of AD, the methane volume for SPS + enzyme was 287 ± 9 NmL, approaching the maximum of 295 ± 14 NmL obtained for this variant, and was 39% more than SPS without pretreatment (207 ± 16 NmL). Pleurotus cultivation, AD, and the enzymes increased the crystallinity of the substrate. The enzymes increased the chemical oxygen demand, total carbon, and the concentration of pentanoic acid and 2-methyl-butanoic acid and decreased the concentration of hexanoic acid in the liquid digestate. The pretreatment increased, in general, the P and K content in the liquid and solid digestates. All data were compared with the hay used for Pleurotus cultivation.

1. Introduction

Large amounts of spent mushroom substrate (SMS) are produced from the mushroom cultivation industry, with an average of five kilograms of SMS generated for every kilogram of harvested edible mushrooms [1]. This side stream is unstable and has become an environmental problem in the absence of a rapid conversion to various bioproducts/biomaterials/biochemicals [2].
Multiple ways of SMS valorization have been proposed until now, such as using it as feed for ruminants [3] or broilers [4], in a new mushroom cultivation cycle [5], as a fertilizer [6,7], soil amendment [8], and bioremediation agent [9], or as a plant biostimulant after pelletizing it together with microbial biostimulants [10]. However, there is a continuous increase in the demand for edible mushrooms due to their nutritional characteristics, which generates an increase of 6–7% per year in the quantities of spent substrate produced globally. This increase requires less energy intensive and/or more mature valorization technologies [11].
Anaerobic digestion (AD) is such a mature technology that produces energy carriers, i.e., biogas, biomethane, biohydrogen/biohythane [12], or biochemicals, such as volatile fatty acids, e.g., propionic, butyric acid, and hexanoic acids [13], and anaerobic digestate used as fertilizer or as a soil amendment or bioremediation agent [14]. AD technology has the advantage of producing biofuels/bioenergy and/or biochemicals, while closing the loop of plant nutrients from anaerobic digestate with mature/commercial technologies. Closing the loop with anerobic digestate utilization for plant cultivation supports circular economy principles and promotes both resource efficiency and environmental sustainability [15]. SMS from cultivation of lignocellulolytic mushrooms is theoretically well-suited for AD, as the fungal development on the lignocellulose substrate leads to breakdown of lignocellulose, which improves efficiency in AD systems. SMS was shown to benefit biogas production from co-digestion with cattle manure more than the untreated lignocellulose substrate did due to the prior cultivation of fungi, which partially degraded the lignocellulosic matrix [16]. Despite this advantage, available reports indicate high heterogeneity in methane production among various substrates due to the differences in composition and degree of fungal activity [17].
SMS from lignocellulolytic mushroom cultivation is better utilized in thermophilic anaerobic digestion processes. In a study conducted by Xiao and colleagues [18], the performance of batch thermophilic anaerobic digestion (at 55 °C) of spent substrate from Pleurotus eryngii was assessed. This study revealed enhanced methane production, reaching a yield of 177.69 mL/g of volatile solids (VS) over 12 days. This method proved efficient in shortening the fermentation duration and increasing the breakdown of cellulose and hemicellulose as well, with degradation rates of 47.53% and 55.08%, respectively [19,20]. In the case of mesophilic AD, various strategies were applied to SMS anaerobic digestion to improve the yield in biogas/biomethane. Some strategies were aimed towards providing the optimal carbon–nitrogen ratio, which is usually considered to be between 20 and 30, although some studies report lower ratios. For example, biomethane production was enhanced by co-digestion of SMS with livestock manure as a co-substrate to control the C/N ratio [19,20,21]. Other strategies involved SMS pretreatment for increased substrate anaerobic digestibility or both pretreatment and co-digestion [20]. Application of chemical (acidic or alkaline) and hydrothermal pretreatments significantly improves the substrate’s digestibility, supporting its use as an alternative feedstock in anaerobic digestion systems [20,22]. Nevertheless, these methods have some drawbacks, such as extreme pH, which requires intensive washing of the substrate, formation of inhibitory compounds, and high energy input [22]. Biological pretreatments are more environmentally friendly, produce fewer inhibitory compounds, and require less energy input, but have the drawbacks of the process being generally slow and, in the case of commercial enzymes, of the cost being high. In the case of SMS, the cultivation of the mushrooms can be considered as a pretreatment, and the drawback of a slow process is overcome by the valorization of the fruiting bodies in the food sector and beyond. There is scarce information with respect to the effects of additional biological pretreatments of SMS on AD. Zhu et al. recently tested a biological pretreatment with Trichoderma chlamydospores, which resulted in an increase of 16.8% in methane yield at the optimal (24 h) pretreatment period [23]. López-Balladares et al. obtained promising results with an enzymatic pretreatment by Trichoderma spp. [24]. These solutions, although promising, add to the overall cost of the AD process if commercial media are used for microorganism growth. Ravlikovsky et al. proposed that SMS could be used without pretreatment [25], but this would depend on the SMS composition and characteristics, and more comparative studies should be performed in order to conclude which SMS can be used without pretreatment.
Our study aimed to evaluate another strategy for enhancement of SMS anaerobic digestion, i.e., we analyzed the impact of SMS pre-incubation with an aqueous extract from SMS, in our case, spent Pleurotus substrate (SPS), on AD. We show that the aqueous extract of SPS contains volatile solids and active lignocellulolytic enzymes, both of which contribute to the enhancement of AD. SPS was compared with the hay used for Pleurotus cultivation. This approach represents a more cost-effective solution compared with commercial enzymes or growth media used for enzyme production.

2. Materials and Methods

2.1. Materials

The main materials and chemicals used for the cultivation of Pleurotus ostreatus P 70 were 2 buckets, 4 blankets to maintain the temperature, and one large basin, which were bought from a local store; mycelium of P. ostreatus from Labreccia SRL (Timișoara, Romania, Romanian subsidiary of the Italian company), calcium carbonate—CaCO3 (Scharlau, Barcelona, Spain)—and hay from Vita Herbal (Vitapol, Brzoza, Poland) acquired online. Other chemicals used in this study were potassium dihydrogen phosphate, di-potassium hydrogen phosphate, sodium acetate, glacial acetic acid, potassium metabisulfite, phenol, sodium hydroxide, potassium sodium tartrate for analysis (Scharlau, Barcelona, Spain), 2,2′-Azino-bis (3-ethylbenzothiazo-line-6-sulfonic acid) diammonium salt, 98%—ABTS (Alfa Aesar, Kandel, Germany), cystine, 2,5-Bis(5-tert-butyl-2-benzo-oxazol-2-yl (Thermo Fisher Scientific, Bremen, Germany), standard solutions for Inductively Coupled Plasma Optical Emission Spectroscopy (ICP-OES) Certipur, nitric acid 65%, hydrochloric acid 37% (Merck, Darmstadt, Germany), 3,5-dinitrosalicylic acid, and carboxymethyl cellulose (Sigma-Aldrich, St. Louis, MO, USA).

2.2. Cultivation of P. ostreatus

The hay was cut into small pieces and placed in 2 buckets, and 2 L of boiled hot water was poured over the hay in each bucket. Each bucket was covered with 2 blankets and left for 24 h to permit the hay substrate to soak.
The CaCO3 was added stepwise and mixed manually and aseptically with the hay in a large basin. The mycelia were chopped and added stepwise and mixed well gently. The hay with mycelium was incubated in a polyethylene bag. Three holes on one side and four on the other side, aligned on the diagonal of the bag, were made to allow the fruiting bodies to develop.
Following inoculation, the bags were incubated in a plant growth tent (Mammoth Tent Pro150, Oldebroek, The Netherlands) equipped with vent holes for air exchange. Until fully colonized, indicated by a white mycelial covering (approximately 2–3 weeks), the bags were kept at 22–25 °C in the dark. Upon complete colonization, the temperature was decreased and maintained below 20 °C by air conditioning, with an 8 h light/16 h dark cycle using a LED system (Phytolite Resina NX2 200, Salita Santa Caterina, Genoa, Italy) controlled by a programmable socket (Grasslin Topica 200S, Georgen, Germany). When the fruiting bodies started to appear, the holes were sprinkled with a water sprayer 2–3 times per day.
The harvest was performed when the mushroom cap had fully expanded and flattened. After the first harvest, the holes were carefully cleaned and prepared for the next development of mushroom fruiting bodies. After full harvest, the spent Pleurotus substrate was collected and freeze-dried (CoolSafe 55-4, Labogene, Lillerød, Denmark).

2.3. Hay and SPS Characterization

The hay used for Pleurotus cultivation and the SPS were characterized for total carbon and nitrogen content by elemental analysis, phosphorous and potassium by ICP-OES, VS, and ash content by gravimetry. For VS and ash, the substrates were dried in a Memmert UNE 400 oven (Memmert, Schwabach, Germany) at 105 °C until constant weight and calcinated in a Nabertherm S27 furnace (Nabertherm, Lilienthal, Germany), with the temperature raised to 550 °C for an hour and then maintained at constant temperature of 550 °C for 2 h. The dry mass after 105 °C treatment represented the total solids (TS) which were expressed as percent (w/w) of the initial freeze-dried mass. The residual mass after calcination represented the ash content and was expressed as percent (w/w) of TS. The VS content (total organic matter content) was calculated as the difference between TS and ash and expressed as percent (w/w) of TS.

2.4. Enzyme Extraction

The extraction of enzymes from SPS was performed in double distilled water (ddH2O) at a ratio of 1:2 (w/w). In each of six Erlenmeyer flasks, 30 g of freeze-dried SPS and 60 mL of ddH2O were mixed and incubated in a water bath OLS 26 Aqua Pro (Grant Instruments, Cambridge, UK) at 25 °C and 100 rpm for 1 h. The extract was filtered through a multilayered gauze and next centrifuged at 7350× g 4 °C for 15 min. To quantify the cellulase and laccase activity, the extract was sterile filtered through a polyethersulfone (PES) syringe filter with 0.2 µm porosity. The VS and ash of the enzyme extract were determined as described in Section 2.3.

2.5. Cellulase Activity

Cellulase activity was measured by the 3,5-dinitrosalicylic acid (DNS) method, with carboxymethylcellulose (CMC) as the substrate [26,27], with some modifications regarding the type of buffer, the reaction temperature and time, the ratio between the reaction mixture and DNS reagent, and the ratio between the components of the DNS reagent. CMC was solubilized in sodium acetate with pH 4.5. Briefly, the calibration curve was constructed in the range 0.1–1 mg/mL, starting from a stock solution of 1 mg/mL glucose in distilled water. The enzymatic reaction was performed in a water bath at 50 °C for 30 min. The reaction mixture consisted of 50 µL CMC 1% (w/v) and 300 µL enzyme extract. The reaction was stopped by the addition of 650 µL DNS reagent [26] and incubation at 95 °C for 15 min on a thermoblock. Each sample had a control, in which the binding of the enzyme to the substrate was inhibited by adding DNS before addition of the sample followed by incubation at 95 °C for 15 min on a thermoblock. The absorbance was read at 540 nm with a plate reader (CLARIOstar BMG Labtech, Ortenberg, Germany). One cellulase unit (U) was defined as µmol glucose/min.

2.6. Laccase Activity

Laccase activity was determined based on the enzyme capacity to oxidize ABTS in the presence of oxygen according to [28], with some modifications regarding the type, volume, pH, and concentration of the buffer, the volume and concentration of the ABTS, and reaction time. Briefly, the reaction mixture was composed of 50 µL of enzyme extract, 20 µL of 20 mM ABTS, and 130 µL of 0.2 M acetate buffer with pH 5. The kinetics of the reaction were recorded by measuring the absorbance at 420 nm over 30 min with a plate reader. The absorbance coefficient of ABTS was considered to be 36,000 M−1 cm−1. One laccase unit (U) was defined as µmoles oxidized ABTS/min.

2.7. Mechanical and Enzymatic Pretreatment of SPS

For pretreatment, hay and SPS were dried at 60 °C in a Memmert UNE 200 oven (Memmert, Schwabach, Germany) and ground in a planetary ground mill (PM 100, Retsch GmbH, Haan, Germany). The enzymatic treatment of SPS was first tested at 5 enzyme extract concentrations, i.e., 25%, 33%, 50%, 66%, and 100% (v/v) in water (total volume 25 mL, solid/liquid ratio 5). The samples were incubated in a water bath at 37 °C, 100 rpm shaking, for 24 h. The samples were next centrifuged at 7350× g, 4 °C, for 15 min and filtered through a PES syringe filter with 0.2 µm porosity. The reducing groups of each filtrate was determined by the DNS method, with some modifications. Briefly, the reaction mixture consisting of 300 µL filtrate and 650 µL DNS was incubated at 95 °C for 15 min followed by cooling to room temperature. The absorbance was read at 540 nm in 96-well plates and the concentration was determined based on a calibration curve of glucose (0.1–1 mg/mL). The best extract concentration was used for the enzymatic pretreatment of SPS in the glass reactors of the anaerobic digestor, under similar conditions as above, before anaerobic digestion. Non-inoculated initial hay was also subjected to mechanical and enzymatic pretreatment. Hay and SPS controls consisted of substrates incubated in water, without enzyme extract, under the same conditions as the enzymatically treated samples. The reducing groups were determined for the samples and controls, following the protocol described above.

2.8. Anaerobic Digestion

The anaerobic digestion was performed at laboratory-scale with a Gas Endeavor anaerobic digestor (BPC Instruments, Lund, Sweden) equipped with 15 glass reactors (flasks) in an incubation unit, each with a 500 mL total volume. The following experimental variants were each tested in triplicate: hay, hay + enzyme, SPS, SPS + enzyme, and control. The composition of the variants is shown in Table 1. For inoculation, liquid digestate from a local commercial biogas production facility was used (ECOTERRA BIOGAS, Suceava, Romania). Before the addition of the inoculum, the substrates (21 g) from the variants with enzymes were incubated with 100 mL of 66% enzyme extract (in water) in the flasks (solid/liquid ratio 1/5) at 37 °C and 80 rpm shaking for 24 h. The variants without enzymes were incubated with 100 mL water under the same conditions. Next, 80 mL extra water and 20 mL inoculum were added in each glass reactor. The experimental conditions of the anaerobic digestion were 37 °C and 80 rpm mixing in discontinuous mode, at 5 s on/5 s off intervals, and the total duration of the experiment was 24 days. Each reactor was connected to a glass vessel containing 80 mL of 3M sodium hydroxide (Merck, 99% purity) in distilled water to neutralize the resulting biogas by retaining carbon dioxide and hydrogen sulfide. The concentrated methane flow resulting from the absorption unit was directed to the dosing unit, the software recorded the flow rate obtained in the dosing unit throughout the experiment, and the graphical data were generated for each reactor individually.
The following parameters were determined: cumulative methane yield (NmL/g VS) as the cumulative amount of methane produced per gram of initial volatile solids in the flasks; methane productivity (NmL/day) as the methane amount produced each day; and methane yield productivity (NmL/g VS/day) as the methane yield generated each day.
The cumulative methane yield of SPS was modeled with the modified Gompertz model (Equation (1)) [29]. In the case of hay, two steps for methane production were obtained; therefore, the equation was modified accordingly, with one set of determined parameters for each step (Equation (2)). The first-order kinetic model did not provide proper fittings to the experimental data.
B t = B 1 × e x p e x p R m 1 × e x p ( 1 ) B 1 λ 1 t + 1
B t = B 1 × e x p e x p R m 1 × e x p ( 1 ) B 1 λ 1 t + 1 + B 2 × e x p e x p R m 2 × e x p ( 1 ) B 2 λ 2 t + 1
where B(t) is the total (bio)methane yield; B1 and B2 are the methane generation potential (ultimate/maximum experimental methane yield) for the first and second steps, respectively; Rm1 and Rm2 are the maximal methane generation rate for the first and second steps, respectively; λ1 and λ2 are the lag time for the first and second steps, respectively; and t is the time of the experiment (in hours).
At the end of the anaerobic digestion, the samples were centrifuged at 10,776× g, 4 °C, for 20 min with a Hettich Rotina 420 R centrifuge (Hettich, Tuttlingen, Germany). The solid digestate was freeze-dried for 48 h (CHRIST ALFA 1-4 LDplus, Osterode am Harz, Germany); the dry weight, moisture, and the chemical oxygen demand (COD) were determined. The C and N composition was determined by elemental analysis and the morphological aspects by scanning electron microscopy (SEM). The liquid digestate was characterized for dry weight, COD, elemental analysis, and volatile compounds.

2.9. Dry Weight and Moisture

The dry weight and moisture of the solid digestate were determined gravimetrically by heating at 105 °C in a Memmert UNE 400 oven until constant weight. The solid substance of the liquid digestate was determined by refractometry with Hanna HI-96800 equipment (Hanna Instruments, Woonsocket, RI, USA).

2.10. Chemical Oxygen Demand

The COD of the liquid and solid digestate was performed with chemical test kits (Hanna Instruments, RI, USA) used in water and wastewater analysis, which are based on a method adapted from the methodology employed by the Environment Protection Agency of the States (EPA 410.4/1993) for surface and wastewater. Samples of liquid digestate or samples of dry solid digestate were added to the test flasks containing pre-dosed reagents, after which the flasks were heated at 150 °C for 2 h to facilitate oxidation of organic materials. In the case of the solid digestate samples, the lyophilized digestate was resuspended in distilled water and left overnight. Before sampling, the suspension was homogenized. The samples that surpassed the superior limit of detection (1500 mg/L O2) were diluted.

2.11. Elemental Analysis

The total content of nitrogen and carbon in the solid and liquid digestates was determined with a FlashSmart equipment (Thermo Fisher Scientific, Waltham, MA, USA), which was provided with a thermal conductivity detector (TCD). The sample combustion was performed at 950 °C under oxygen atmosphere (99.999% purity). The calibration of the equipment was performed with 2,5-Bis(5-tert-butyl-2-benzo-oxazol-2-yl (N = 6.51 ± 0.09%; C = 72.52 ± 0.22%; H = 6.09 ± 0.08%), work range: nitrogen, 0.003–0.172 mg, R2 = 0.9995; carbon, 0.074–1.914 mg, and R2 = 0.9997. The confirmation of the calibration curves was performed with a cystine standard (N = 11.66 ± 0.16%, C = 29.98 ± 0.28%).

2.12. GC-MS Analysis of Volatile Compounds from Liquid Digestate

For the GC-MS analysis, 200 µL of liquid digestate was esterified with 200 µL saturated NaHSO4 solution and approximately 1600 µL of diethyl ether was used for liquid–liquid extraction. The mixture was vortexed for 1 min, left to settle for 5 min, and centrifuged at 940× g with a Grant-bio Microspin 12 centrifuge (Grant Instruments, Cambridge, UK) for 5 min. The superior organic fraction was analyzed by GC-MS with a GC-MS/MS Triple Quad Agilent 7890 A (Agilent, Santa Clara, CA, USA) equipped with a capillary DB-WAX column. Helium at 1 mL/min debit was used as the carrying gas. The NIST database was used for compound identification. The temperature regime consisted of keeping an initial constant temperature at 40 °C for 2 min., followed by an increase up to 170 °C with a 7 °C/min rate. The second heating step was from 170 °C to 220 °C with a 15 °C/min rate, and the temperature was maintained at 220 °C for 5 min.

2.13. Inductively Coupled Plasma Optical Emission Spectroscopy

The ICP-OES analysis was performed with Optima 2100 DV equipment (Perkin Elmer, Waltham, MA, USA), with a dual view optical system [30]. The operating parameters were argon debit in the nebulizer 0.75 mL/min, argon debit in the plasma 15 mL/min, auxilliary argon debit 1.5 mL/min, peristaltic pump debit 1.5 mL/min, and total analysis time approximately 110 s/sequence. The purging gas was Argon 5.0, 99.999% purity. For solid sample mineralization, a Multiwave 3000 microwave digestion system (Anton Parr GmbH, Graz, Austria) with a pressure sensor was used. The ash was obtained at 550 °C and mineralized with HNO3 65% and HCl 37% (6:2). The liquid samples were mineralized with HNO3 65% and HCl 37% (21:7) in a heating reflux system for 2 h. The blank samples were prepared under the same conditions.

2.14. Fourier Transform-Infrared Spectroscopy

Fourier Transform-Infrared (FT-IR) Spectroscopy was performed on dried powder samples with an IR-Tracer 100 spectrophotometer (Shimadzu, Kyoto, Japan) in the attenuated total reflectance (ATR) mode. The final spectrum was obtained as the mean of 45 scans at a resolution of 4 cm−1 in the wavenumbers range from 4000 to 400 cm−1. The exported spectra files were imported and graphically overlaid in the OriginPro2022b software, version 9.9.5 from OriginLab Corporation (Northampton, MA, USA).

2.15. Scanning Electron Microscopy

Structural and morphological characterization of the substrates before and after anaerobic digestion by SEM was carried out using a Hitachi TM4000plus II scanning electron microscope (Hitachi, Ibaraki, Japan). The following parameters were used: 15 kV electron acceleration voltage, secondary electrons (SE)/backscattered electrons (BSE) detector, low-charge (L) vacuum mode, and 1000× magnification. For the substrates before anaerobic digestion, a magnification of 100× was used as well.

2.16. X-Ray Diffraction Analysis

X-ray diffraction (XRD) spectra were performed on dried powder samples using a Rigaku SmartLab diffractometer (Rigaku Corporation, Tokyo, Japan) in wide angle (WAXS) based on CuKα1 (λ = 1.54059 Å) radiation. The tube voltage was set at 40 kV and the emission current at 200 mA. The diffraction spectra were acquired in the 2θ interval 4–61° with 0.02° resolution and a scan speed of 4°/min. PDXL 2.7.2.0 software was used for smoothing the raw diffractograms using the B-Spline model with Chi = 1 and for background subtraction, peak deconvolution, and identification. The crystallinity degree (Xc, %) was determined with PDXL software as the ratio between the area of crystalline peaks over the total peak area. The final figures were made withOriginPro2022b software, version 9.9.5, from OriginLab Corporation (Northampton, MA, USA).

2.17. Thermogravimetric Analysis

Thermogravimetric analysis (TGA) was performed on dried samples with Q5000IR equipment (TA Instruments, New Castle, DE, USA) by adding 5–10 mg to each 100 µL platinum pan. The TGA method was performed under nitrogen (99.99%) by heating the samples from 20 °C to 750 °C, with a temperature ramp of 10 °C/min. At 750 °C, the purge gas was switched to synthetic air (99.99%) in Hi-Res mode and kept isothermal for 10 min to determine the residual content.

2.18. Statistical Analysis

All experiments were performed in triplicate (n = 3). Values are presented in mean ± standard deviation. Statistical analysis was carried out with IBM SPSS 26 software version 26.0.0.0 (one-way ANOVA and Tukey’s HSD tests based on means for multiple comparisons when all the samples were included in the statistical analysis, independent-samples t-test when only 2 pairs of samples were included in the statistical analysis; in the case of Tukey’s HSD, different letters indicate statistical significant differences between samples at α ≤ 0.05; the p-value for each comparison is presented in Tables S3–S11; in the case of independent-samples t-test, * when 0.05 ≥ p > 0.01, ** when 0.01 ≥ p > 0.001, *** when p ≤ 0.001, and ms—marginally significant when 0.05 < p ≤ 0.1).

3. Results and Discussion

3.1. Effect of Pleurotus Enzymes on Lignocellulosic Substrate

The inoculated bags were incubated in a growth tent, as shown in Figure 1. The fruiting bodies appeared after a couple of weeks following the light/dark cycle and decrease in the incubation temperature. The proximate analysis (Table 2) showed that SPS had a higher content of nitrogen, potassium, and ash and a lower content of carbon and volatile solids than hay. The higher content of nitrogen comes mainly from the chitin of the mycelium. SMS is known to have a high ash content [31] due to the consumption of organic matter by mushrooms, and this could negatively impact AD.
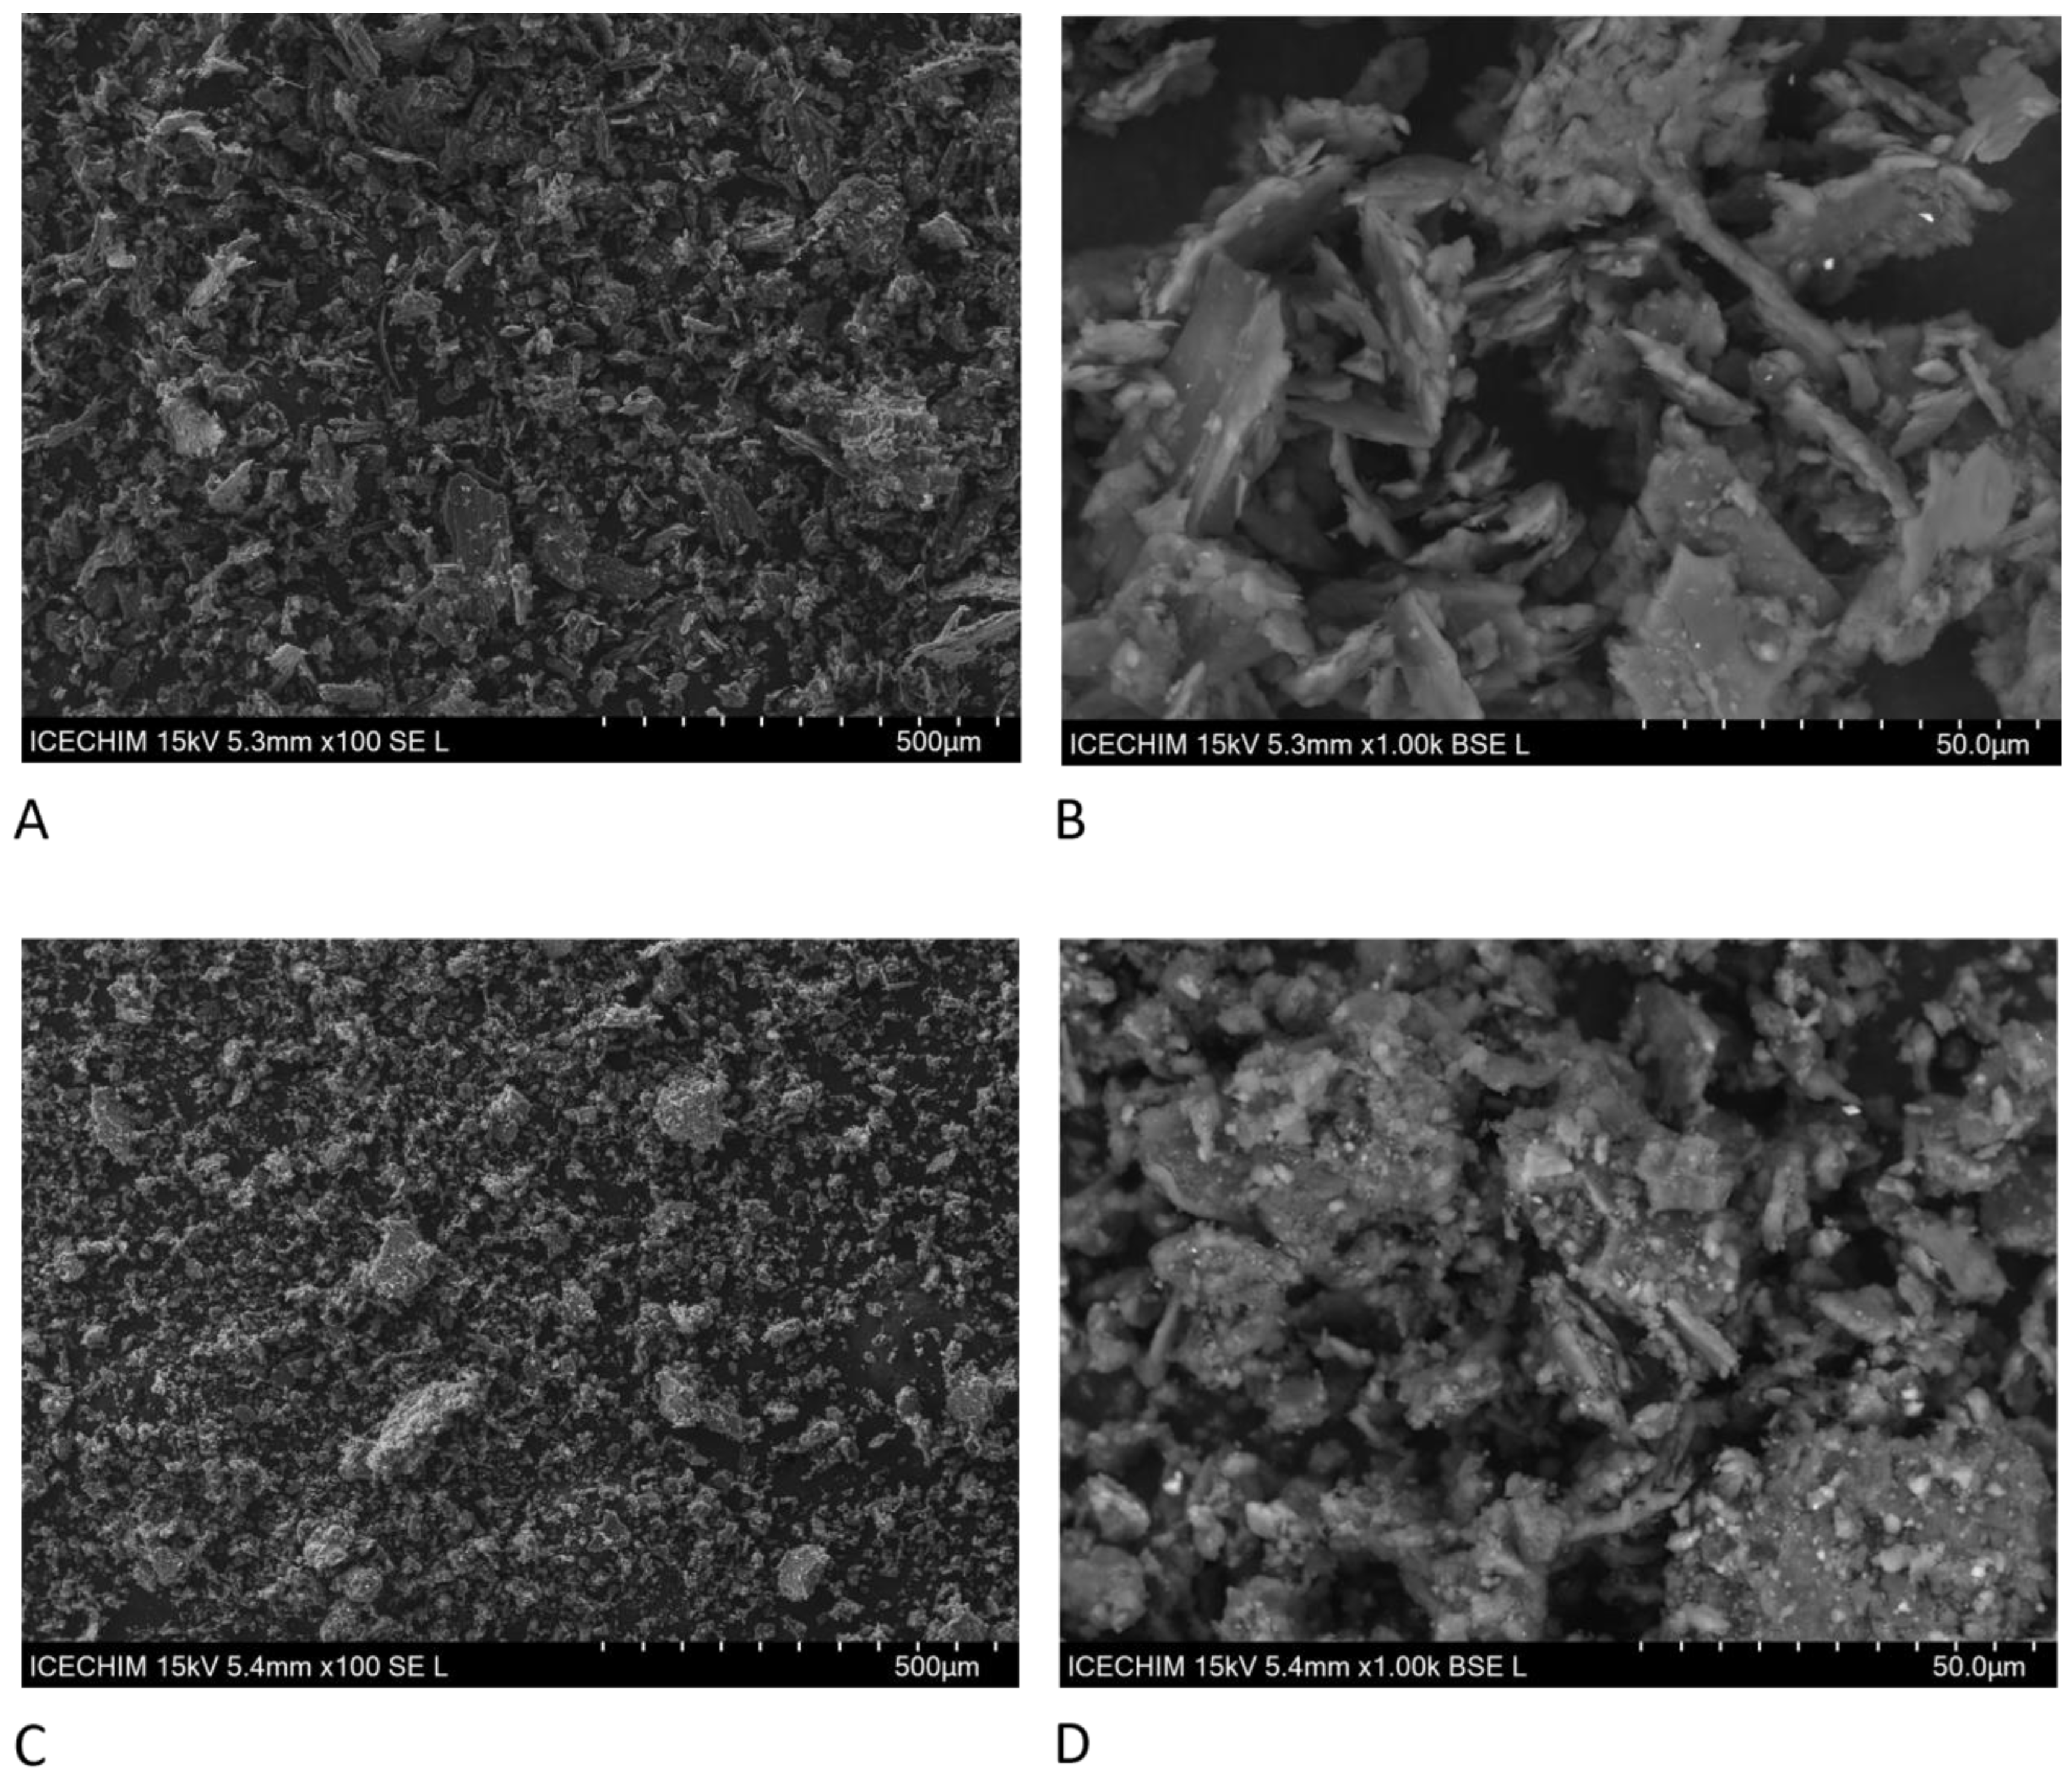
The morphological features of the milled hay substrate and SPS as analyzed by SEM are shown in Figure 2. Hay was coarser than SPS, as expected considering the degradation induced by the mycelium. Moreover, the surface of hay in SPS was more rugged and uneven than initial hay and showed signs of degradation compared to non-inoculated hay (Figure 2D compared to Figure 2B). These characteristics are in line with other previous reports and indicate the structural destruction of hay by P. ostreatus [32]. The mycelium in SPS was generally completely milled and rather hard to distinguish, but fluffy patches could be observed entangled with the hay.
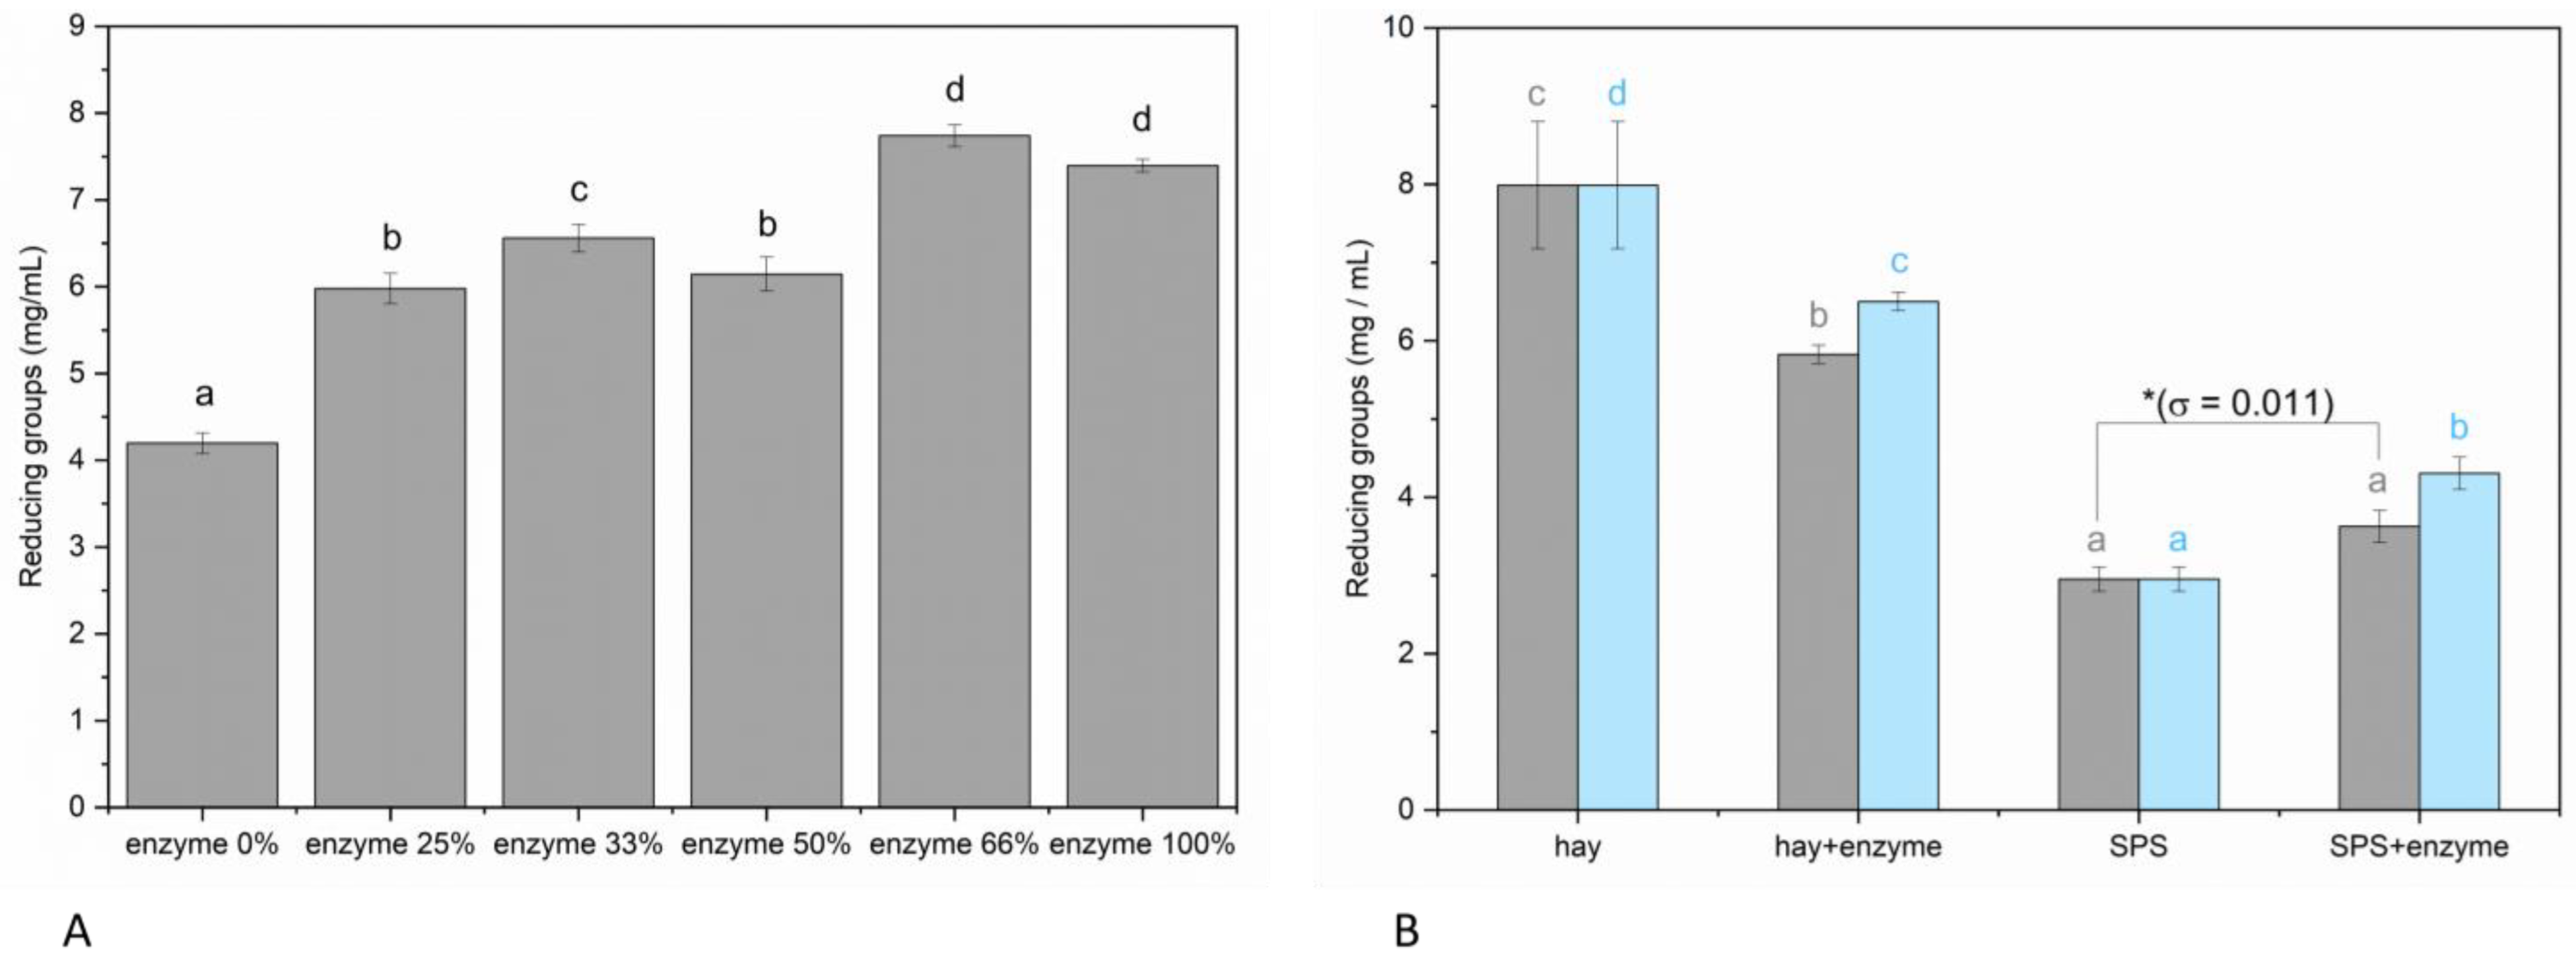
The enzyme extract had a cellulase activity of 7.8 ± 0.2 U/L and a laccase activity of 0.77 ± 0.05 U/L. The volatile solids of the enzyme extract were 1.22 ± 0.08%. The extract was tested on SPS at various proportions in ddH2O at 37 °C and the 66% extract gave the highest reducing groups in the supernatant. This was approximately 25% higher than the lower-proportion extracts and 80% higher than the untreated SPS (Figure 3A) and closely followed by the 100% enzyme extract. The 66% enzyme extract was chosen for the following experiments, as it presented the highest enzymatic activity among all the tested extract percentages. The treatment with the 66% enzyme extract decreased the reducing groups in the case of hay and increased them in the case of SPS (Figure 3B). The increase was 23% compared with untreated SPS, which was much less than the 80% increase in the initial screening, probably due to various factors such as the effect of the scale up, different vessels, different mixing techniques (vertical mechanical mixing compared with orbital shaking), etc. This indicates that the pretreatment can be further optimized in the future. Because the values for hay were much higher when comparing all values, the increase was statistically significant only when comparing SPS with SPS + enzyme, without including hay. There was an additional contribution from the reducing groups of the extract, which gave a total increase of 46% (cyan bar of SPS + enzyme) compared with SPS. In the case of hay, this additional contribution from the reducing groups of the extract was not high enough for hay + enzyme (cyan bar of hay + enzyme) to reach the non-treated hay (cyan bar of hay), therefore the difference between hay and hay + enzyme remained statistically significant (Figure 3B). The decrease in the reducing groups induced by the enzyme extract in the case of hay suggests an unavailability caused by specific enzymes/molecules. For example, it is known that feruloyl esterases (FAE) have dual, opposite actions and can (re)esterify hydroxycinnamic acids onto oligosaccharides as a natural process occurring in plants [33]. Mushrooms produce FAE mainly for their role in hydrolyzing ester bonds and degrading lignocellulose. Due to poor access to the hay substrate, some enzymes might have acted on the already solubilized molecules by reactions of esterification, ligation, etc., but the confirmation of this hypothesis needs more in-depth investigation.

3.2. Effect of Enzyme Extract from SPS on Methane Production

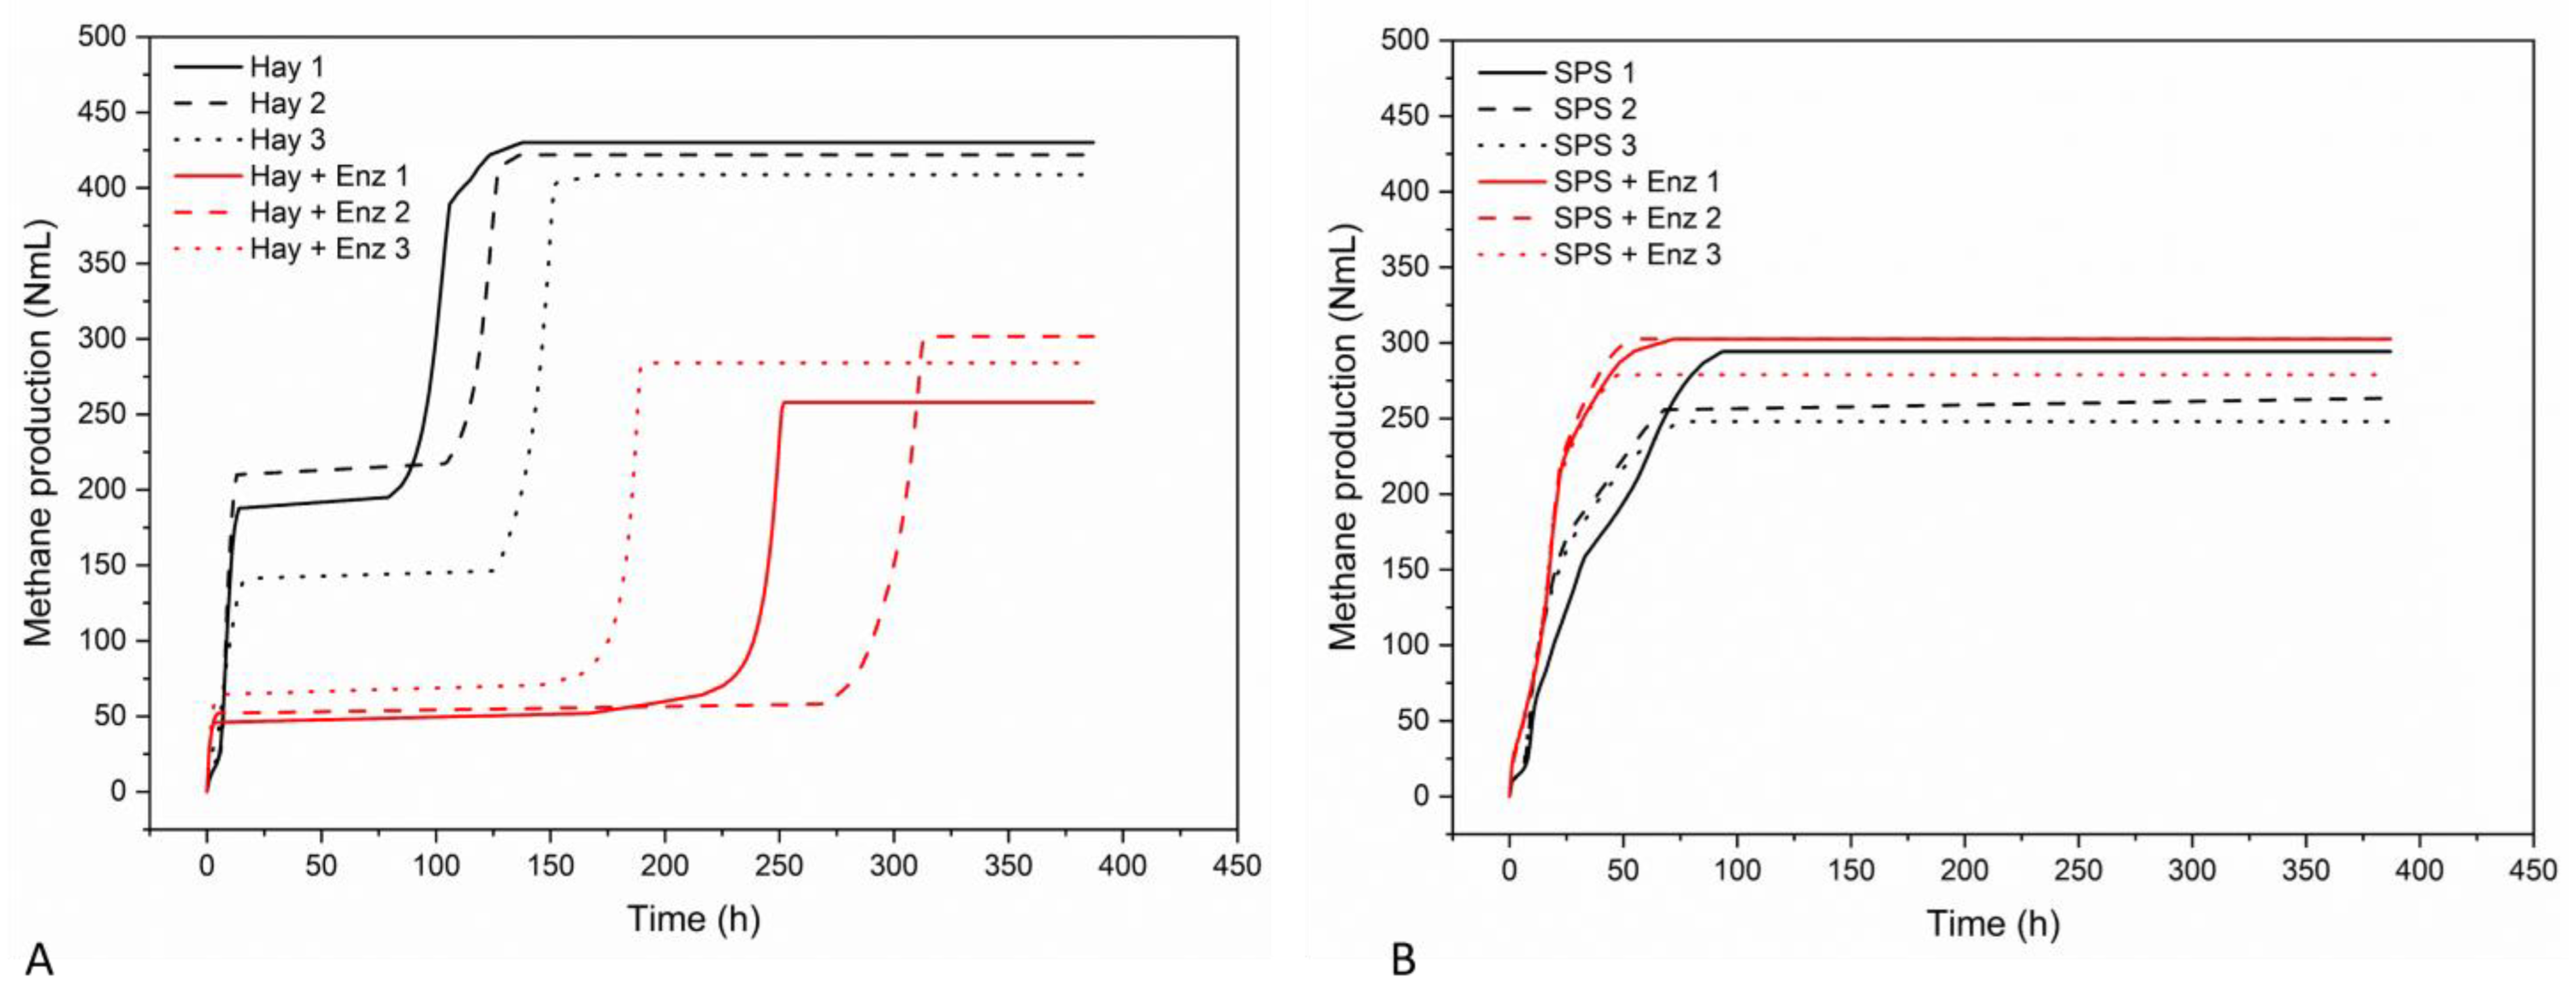
The evolution of methane production in each replicate from each variant is shown in Figure 4. The main observation is that hay and SPS determined the methane production in two steps and one step, respectively, within the timeframe used. Another observation is that there are significant differences between the three replicates in the case of hay, especially with respect to the timeframe of the second step. Although hay has a higher proportion of organic matter than SPS, it has the disadvantage that the lignocellulosic matrix is highly recalcitrant. Therefore, the microbial activity in anaerobic digestion depends on the capacity and level of biomass degradation more than in the case of other substrates. The first step probably involved the soluble and easily degradable fractions of hay, followed by a lag phase until there was a new adaptation of the inoculum to the substrate and degradation of the more recalcitrant biomass. In SPS, the mushroom mycelium partially degrades the recalcitrant matrix and removes part of the lignin, which is known to inhibit anaerobic digestion. The fermentable biomass should therefore be more available and easier to ferment in SPS than in hay. Because of a lower fermentable biomass content in SPS due to previous consumption by Pleurotus and the presence of mycelium (non-fermentable), there is no second step. Another difference between hay and SPS is the effect of the enzyme extract. For SPS, the effect of enzymes with respect to methane production was positive, although less significant than for hay. The effect was negative and significant in the case of hay, i.e., it decreased the total methane production and delayed the second step of methane production. This correlates with the decreased reducing groups from hay induced by the enzymes (Figure 2B). Enzymatic pretreatments have been previously tested before on some substrates, but the field has been less studied compared to other types of pretreatments, partially because of the high price of commercial enzymes [34]. The formation of recalcitrant or inhibiting compounds could be the main cause for the effect of the enzymes observed on hay, which will be discussed later.
The mean cumulative methane production and the methane daily productivity over the three replicates are represented in Figure 5A and Figure 5B, respectively. Due to the shift in the lag phases between the replicates, the standard deviation of methane production/productivity was large during the second step in the case of hay. Instead, the standard deviation was moderate in the case of SPS. During anaerobic digestion, the highest value of the total methane volume was achieved in the samples with hay as a substrate; 420 ± 11 NmL was reached after 8 days and 2 steps, as seen in Figure 4A. As mentioned before, this volume was obtained in two steps, a step within the first 24 h, followed by a plateau of 2–3 days at 180 ± 36 NmL, and a second step after 4 days from inoculation. The volume of methane produced in the first step when hay was treated with the enzyme extract was decreased to 55 ± 10 NmL from 180 ± 36 NmL in the absence of the enzyme extract. The second step was delayed by approximately 4 days and the total methane volume of the second step was decreased to 281 ± 22 NmL by the enzyme extract. For SPS, the enzyme extract led to a reduction in the time required to reach the plateau to approx. 72 h compared to 96 h for samples without the enzyme extract. There was an increase to 295 ± 14 NmL in the average volume of methane for SPS + enzyme compared with 254 ± 8 NmL for SPS without enzyme after 3 days of anaerobic digestion. Overall, an increase of about 16% in methane production and a 25% faster anaerobic digestion process were obtained when SPS was treated with the enzyme extract. After 2 days of anaerobic digestion, the methane volume for SPS + enzyme was 287 ± 9 NmL, which was close to the maximum of 295 ± 14 NmL obtained for this variant, and 39% larger than SPS without the enzyme (207 ± 16 NmL). In the case of the control samples consisting of inoculum and distilled water, no signal was recorded in terms of the volume of gas generated, suggesting that the methane production could be entirely attributed to the digestion of the substrate used.
The daily methane productivity (Figure 5B) was the highest for SPS + enzyme on the first day of anaerobic digestion (224 ± 4 NmL/day), which was followed by hay (180 ± 35 NmL/day) and SPS (149 ± 25 NmL/day). The methane productivity was much lower for hay + enzyme in the first day (55 ± 10 NmL/day). The methane productivity of SPS decreased significantly during the following days and reached 0 NmL/day after 4–5 days of anaerobic digestion. The methane productivity of hay had another peak between the fifth and sixth day of anaerobic digestion (82 ± 70 NmL/day), with a significant standard deviation due to the different second step timelines of the replicates. The hay + enzyme variant had several small peaks of 50–60 NmL/day with very large standard deviations, after 6 days from the first peak. The cumulative methane yield and methane yield productivity over the three replicates are represented in Figure 5C and Figure 5D, respectively. The trend was similar to the total methane production/productivity, but because of lower VS in SPS compared with hay, the difference between SPS and hay changed. The difference between SPS and hay during the time interval 1–4 days and, respectively, hay + enzyme over the entire time interval increased, with higher yield for SPS. The difference between SPS and hay over the time interval 7–16 days decreased, with higher yield for hay.
Gompertz fitting graphs for all replicates are represented in Figure S1 and the fitting parameters and statistics for each replicate in Table S1. The mean parameter values together with standard deviations and statistics are shown in Table 3. SPS had a higher methane generation potential (B1) during the first step, but the rate (Rm1) was lower. The enzyme extract decreased B1 significantly, and showed a marginally significantly Rm1 for hay, which explains the inhibition observed. Nevertheless, the lag time (λ1) was reduced, probably because of the available VS in the enzyme extract. In the case of SPS, the extract increased Rm1, which explains the higher yield between the first and third days, and slightly increased λ1 (by 2 h), the latter with no apparent explanation. The B1 was not changed significantly, which is in agreement with similar yields between SPS and SPS + enzyme observed after the fifth day (Figure 5C). In the case of the second step, the enzyme extract significantly increased the lag time (λ2), which was in agreement with the long delay between the first and second steps observed for hay + enzyme. Rm2 and B2 were not significantly changed by the enzyme extract. The analysis indicates that the enzyme extract acted mainly on the kinetics of the first step for both hay and SPS.
We statistically compared the total methane production between the variants, at three time points, i.e., 2, 3, and 14 days of anaerobic digestion (Figure 6A). After 2 days, when the methane level was close to its maximum in the case of SPS + enzyme and the highest among the variants, the difference between SPS + enzyme and SPS was statistically significant. After 3 days, the difference became marginally significant, but SPS + enzyme was still the highest among the variants. On the other hand, the enzymatic pretreatment proved to be unsuitable for hay samples. Hay + enzyme gave a much lower methane volume compared with the other variants. The significantly lower methane production for pretreated hay samples could have been caused by some byproducts of the enzymatic pretreatment of hay. In this respect, some studies reported certain compounds such as phenolics [35] and humic acids [36,37,38,39] to inhibit AD. These compounds can result from the biomass used in AD, under the actions of various pretreatments, including enzymatic pretreatments; the latter are less investigated in the process of AD. When the concentrations of these compounds exceed a certain threshold, inhibitory effects might occur, whereas at low concentrations, stimulatory effects were observed in some cases [36]. In the case of humic acids (HAs), it was shown that the effects depend not only on concentration but also on structural characteristics, with higher aromatic degree, more carboxylic or phenolic hydroxyl groups, and higher molecular weights being correlated with higher inhibitory effects [36,38,39]. The HA redox potential was shown to influence the effect of HA on AD as well [40]. In our case, the system is even more complex, as we have a cocktail of various enzymes in the extract acting on hay. Moreover, some enzymes could have a double-edged effect, e.g., laccase could on the one hand produce inhibitory humic acids and phenolics from biomass and, on the other hand, detoxify the medium from inhibitory phenolic compounds released from biomass [35,41,42]. In comparison to SPS, hay contains intact lignocellulose and therefore a higher content of phenolics and lignin, which could be prone to humification. The overall effect might depend on the activity level of each particular enzyme as well. Information with respect to the effects of humic acids produced by enzymes/biological pretreatment on AD and methane production is scarce in the literature. Therefore, understanding the cause and mechanism of the observed inhibitory effect of the enzyme extract on the AD of hay will require a separate, multi-parameter, in-depth study, which was not the purpose of this work.
The trends mentioned above were maintained when comparing the yield as reported to the initial volatile solids (Figure 6B). The higher yield of SPS + Enz than SPS after 2–3 days indicates that the enzyme extract released additional volatile solids from SPS that were used to produce more methane. The yield of SPS was higher than the yield of hay on the second and third days. After two weeks, as hay was hydrolyzed by the AD microorganisms and the consortium adapted to the substrate, hay produced a significantly higher total methane volume and yield than the other variants. The yields of SPS and SPS + enzyme remained higher than the yield of hay + enzyme (Figure 6B), but there were no differences between the total methane volumes of these three variants (Figure 6A). Moreover, there was no difference between the methane produced by SPS and SPS + enzyme at 14 days, a trend that started after the 4th day of AD (Figure 5A).
The level of methane produced with the tested substrates within 14 days was higher than in some studies and lower than in other studies reporting on similar substrates in the absence of other additions [17,20,21,22,23,43,44]. The daily methane yield produced from SPS in the first two days was similar to other values previously reported for spent mushroom substrates, SMSs, but the process was inhibited faster than in other cases. If one considers the average daily methane yield, i.e., the ratio between the cumulative methane yield and the time period of AD needed to reach the maximum value, the values found in the literature range between below 2 NmL/(g VS)/day [22,44] to higher than 10 NmL/(g VS)/day [22]. In our case, SPS and SPS + Enz reached saturation after 4 and 3 days, respectively, with an average daily methane yield of 4.25 and 5.83 NmL/(g VS), respectively. These values are within the range reported in the literature. From the available literature, it can be observed that the anaerobic digestion of SMS is rather heterogeneous, with various lag phases, cumulative methane production, yield, and productivity. Comparative studies performed within the same lab in controlled environments are needed to explain these differences. Several parameters could influence AD of SMS, such as the mushroom species, substrate, inoculum, etc. The advantage of our results is that the SPS + Enz sample has fast methane production, which could allow the process to be operated in semi-continuous mode. Within the 8 days needed for the AD of hay to reach saturation, the AD of SPS + Enz, operated semi-continuously, could produce at least 600 NmL of total methane and 35 NmL/(g VS) compared with 430 NmL total methane and 22 NmL/(g VS) in the case of hay.

3.3. Characterization of Solid and Liquid Digestate

Upon anaerobic digestion, the dry weight of the liquid and solid digestate was determined (Table 4). The dry weight of the liquid digestate from SPS was significantly higher than from hay, both in the absence and in the presence of enzyme extract. The enzyme extract significantly increased the dry weight of the liquid digestate. This increase was probably due in part to the solid matter of the enzyme extract, and for SPS, it correlates with higher methane yield. In conjunction with the higher reducing groups upon enzyme treatment, it can be hypothesized that the enzyme extract released additional matter from SPS. The dry weight of the solid digestate from SPS was lower than from hay, both in the absence and in the presence of enzyme extract. The enzyme extract did not have a significant effect on the dry weight of the solid digestate. The moisture of the solid digestate was lower for SPS than for hay both in the absence and in the presence of enzyme extract. The enzyme extract did not significantly affect the moisture of the solid digestate but had a tendency to induce lower values. These results indicate that the inoculum was able to process SPS easier than hay and that the solid digestate of SPS was more hydrophobic than that of hay.
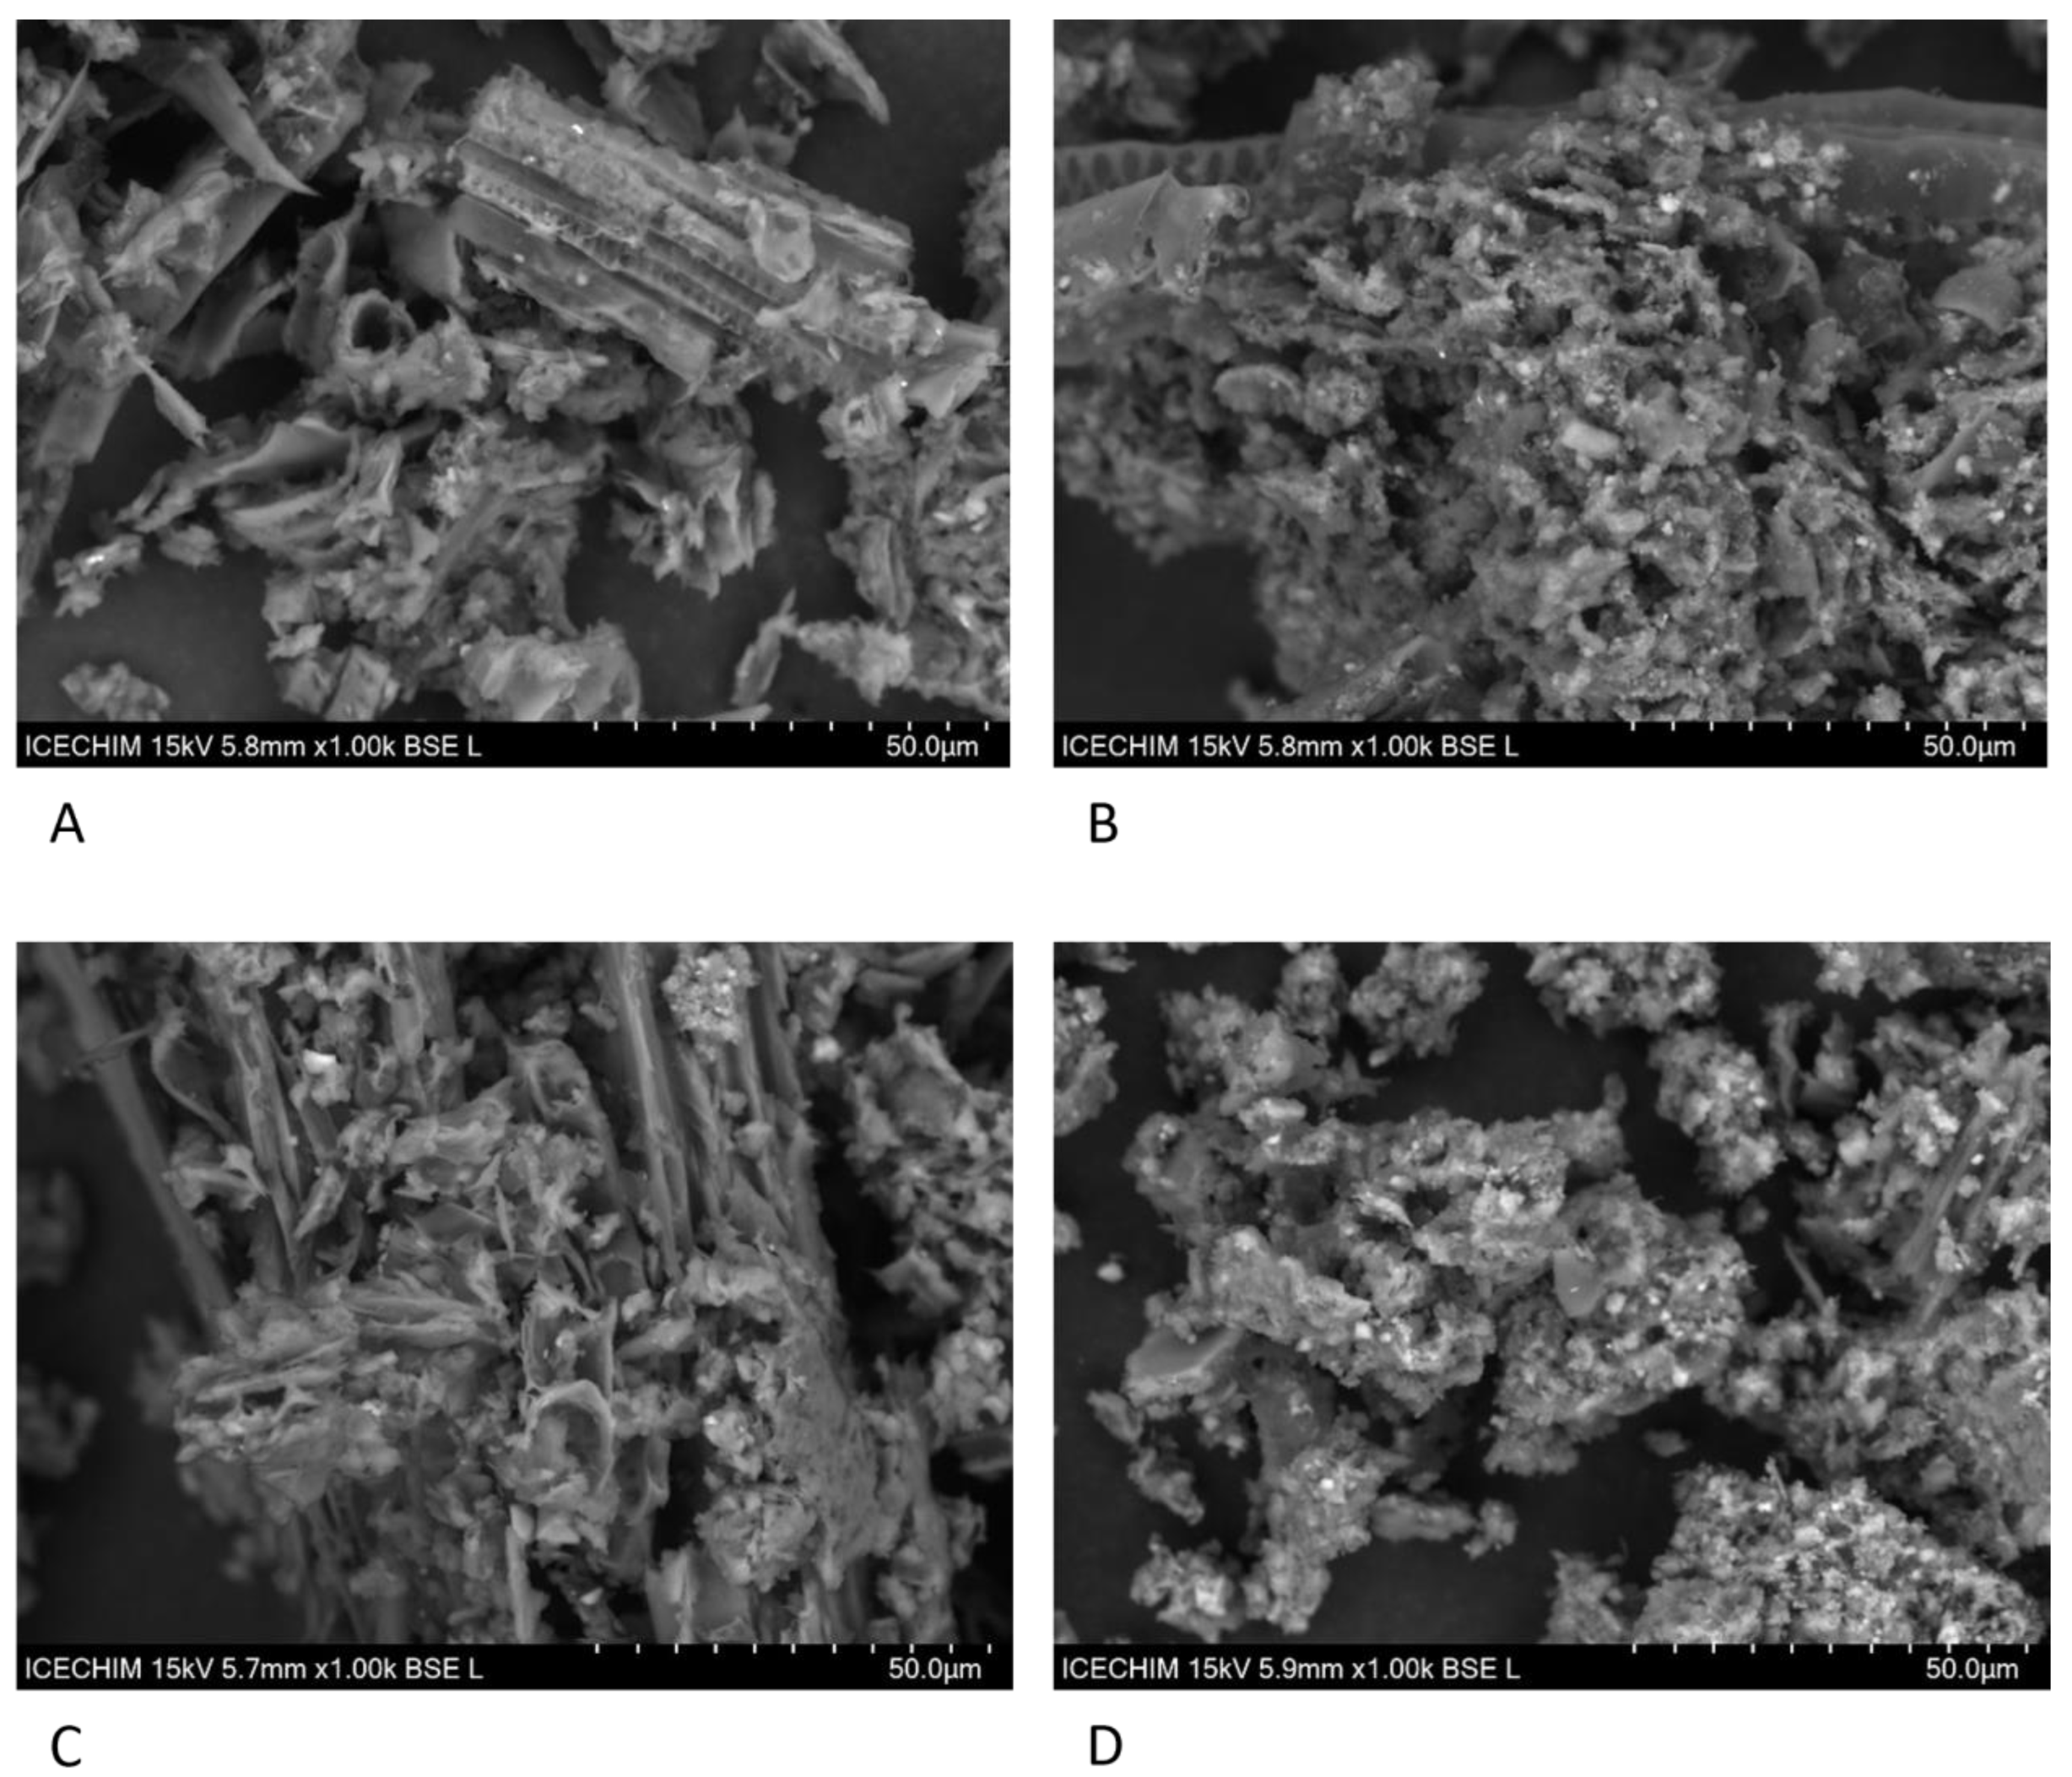
The morphological aspects of hay and SPS as investigated by SEM significantly changed upon anaerobic digestion (Figure 7), with signs of advanced degradation, including a fluffier and rougher texture compared with the substrates before anaerobic digestion (Figure 3). Especially in the case of SPS, the texture was of a “chewed” biomass. The samples with enzymatic pretreatment did not show any apparent major differences compared with the samples without pretreatment.
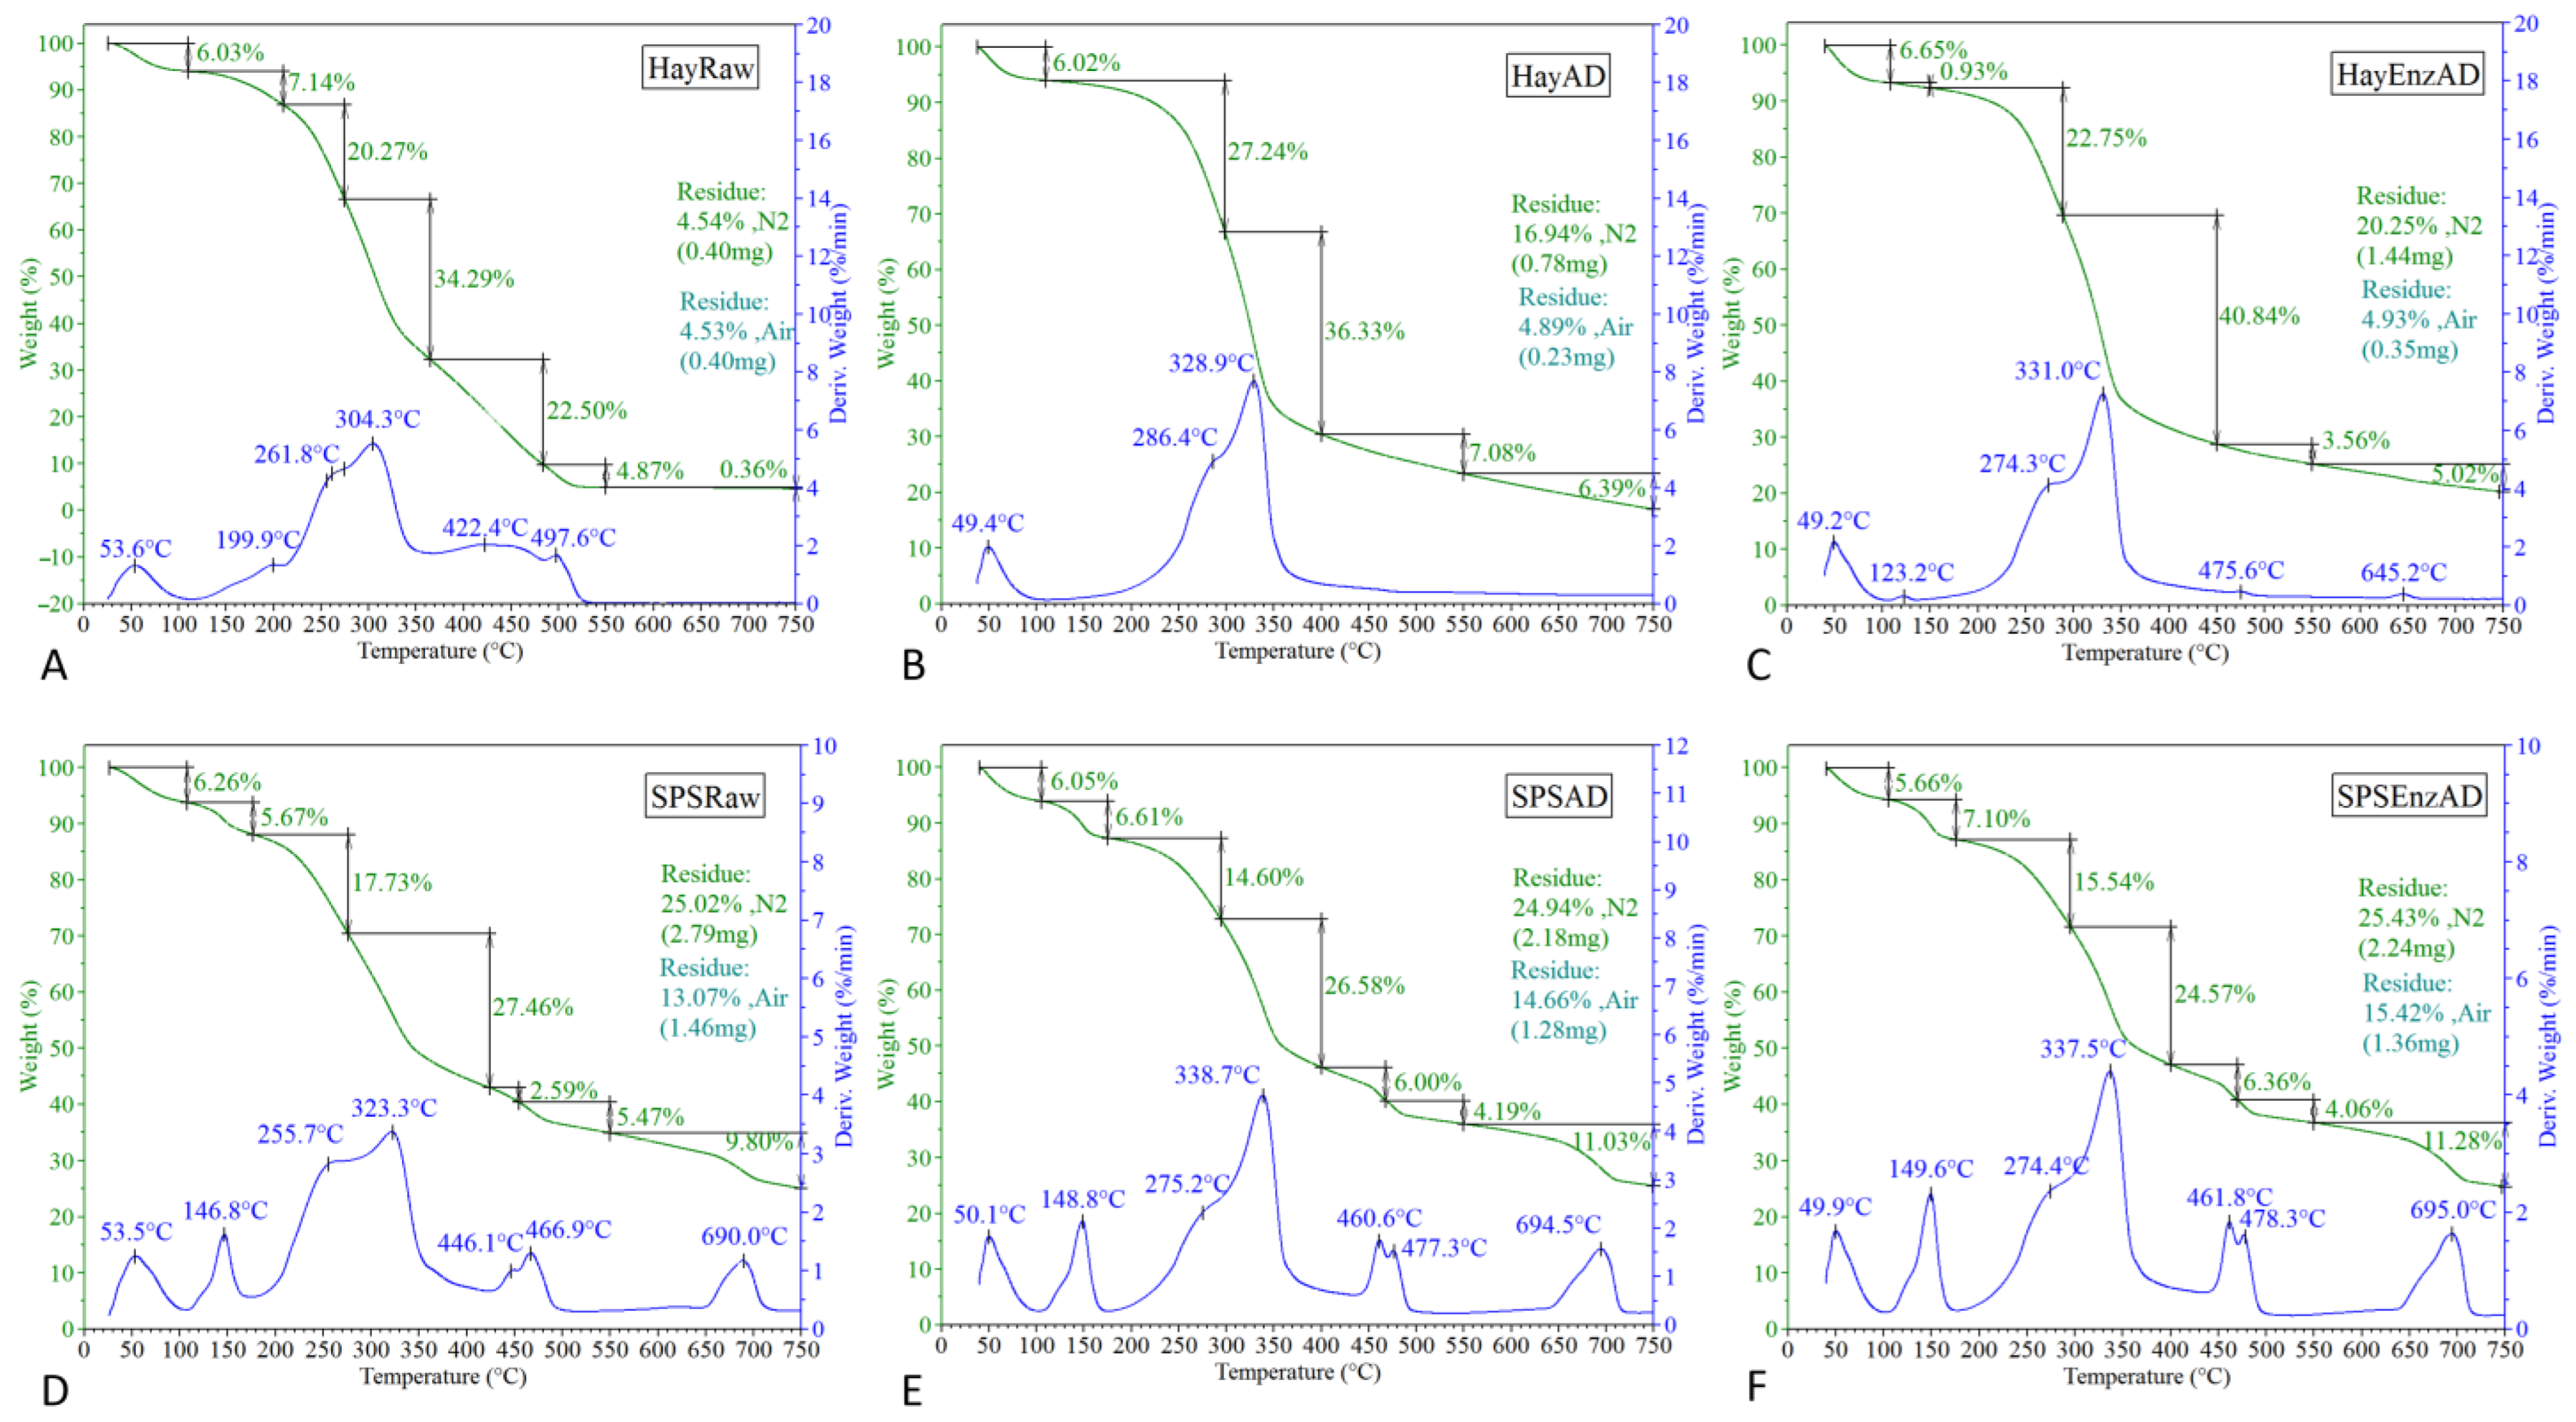
TGA provided evidence of specific weight losses in particular thermal regions and allowed for the estimation of water content and residual content (Figure 8, Table 5). The derivative thermogram (DTG) gave evidence of specific thermal decomposition peaks which further suggested the following characteristic main thermal regions detailed in Table 5: at 25–105 °C, interstitial water and volatile organic biocompounds; at 105–200 °C, small organics, carbohydrates, polyphenols, and proteins; at 200–290 °C, hemicelluloses; at 290–350 °C, cellulose; at 350–460 °C, chitin and lignin; at 460–550 °C, lignin and fixed carbon; at 550–750 °C, CaCO3, together with a residue in nitrogen at 750 °C and residue in air (ash) at 750 °C.
All the samples had a similar water content and volatiles of approximately 6% and slightly lower for the solid digestate of the pretreated SPS, which is in the same range as was reported by other studies [45,46]. The second thermal region, from 105 to 200 °C, assigned to polyphenols, proteins, and fulvic acid-like compounds, demonstrated a 7.14% content in HayRaw (raw hay) and a 5.67% content in SPSRaw (raw SPS). The reduction in the percent was accompanied by a reduction in the main temperature of this region, which decreased from 199.9 °C in hay to 146.8 °C in SPS. These changes were related to the biological degradation of the biomass by Pleurotus. The third thermal region, from 200 to 290 °C, was assigned to the general term of hemicelluloses and could include NaOH-extractable organic carbon and humic-like compounds [47]. The temperature and content were lower in SPS than in hay in this region. The cellulose-specific thermal region was at approximately 320 ± 30 °C [48] and was at a higher percent in hay than in SPS, but the maximum temperature was lower (304.3 °C and 323.3 °C, respectively). This suggests a lower content of cellulose in SPS than in hay, and mainly crystalline cellulose, which needs a higher temperature to degrade than amorphous cellulose. Amorphous cellulose is prone to degradation by Pleurotus and it was therefore reduced in SPS. Due to its heterogeneous structure, lignin degradation spans a broad temperature interval, which overlapped the hemicellulose and cellulose regions and had a maximum at approx. 400 °C. Hay had a maximum at 422.4 °C, which was absent in SPS, indicating that the structural components decomposing at this temperature had been degraded by Pleurotus. A second maximum was recorded at 497.6 °C in the case of hay. SPS presented a main peak at 467 °C and a smaller one at 446 °C. For the SPS samples, this region might have also included chitin. After 600 °C, there was a last transition in the case of SPS which was absent in hay. This transition could have reflected the decomposition of CaCO3, which had been added to the substrate before mushroom cultivation, into CaO and CO2 [49].
Anaerobic digestion removed most of the compounds from the 199.9 °C and the 350–500 °C transitions and increased the (crystalline) cellulose content in hay, the latter reflected by the increased maximum temperature as well. In the case of SPS, it is intriguing that the transitions from 146.8 °C and 446–467 °C were not removed by AD. In fact, the transition at 146.8 °C for AD samples had a higher mass loss and shifted to slightly higher temperatures, especially in the case of the pretreated samples, indicating a higher proportion of these compounds. These data are in agreement with the observations that SPS was easier to ferment and that the enzyme extract contributed positively as well. The remaining transition at 446–467 °C could represent hard-to-ferment chitin and lignin fractions. The ash content was about three times higher in the SPS samples (13.07–15.42%) than in the hay samples (4.53–4.93%), which correlates with a higher mineral content present in SPS.
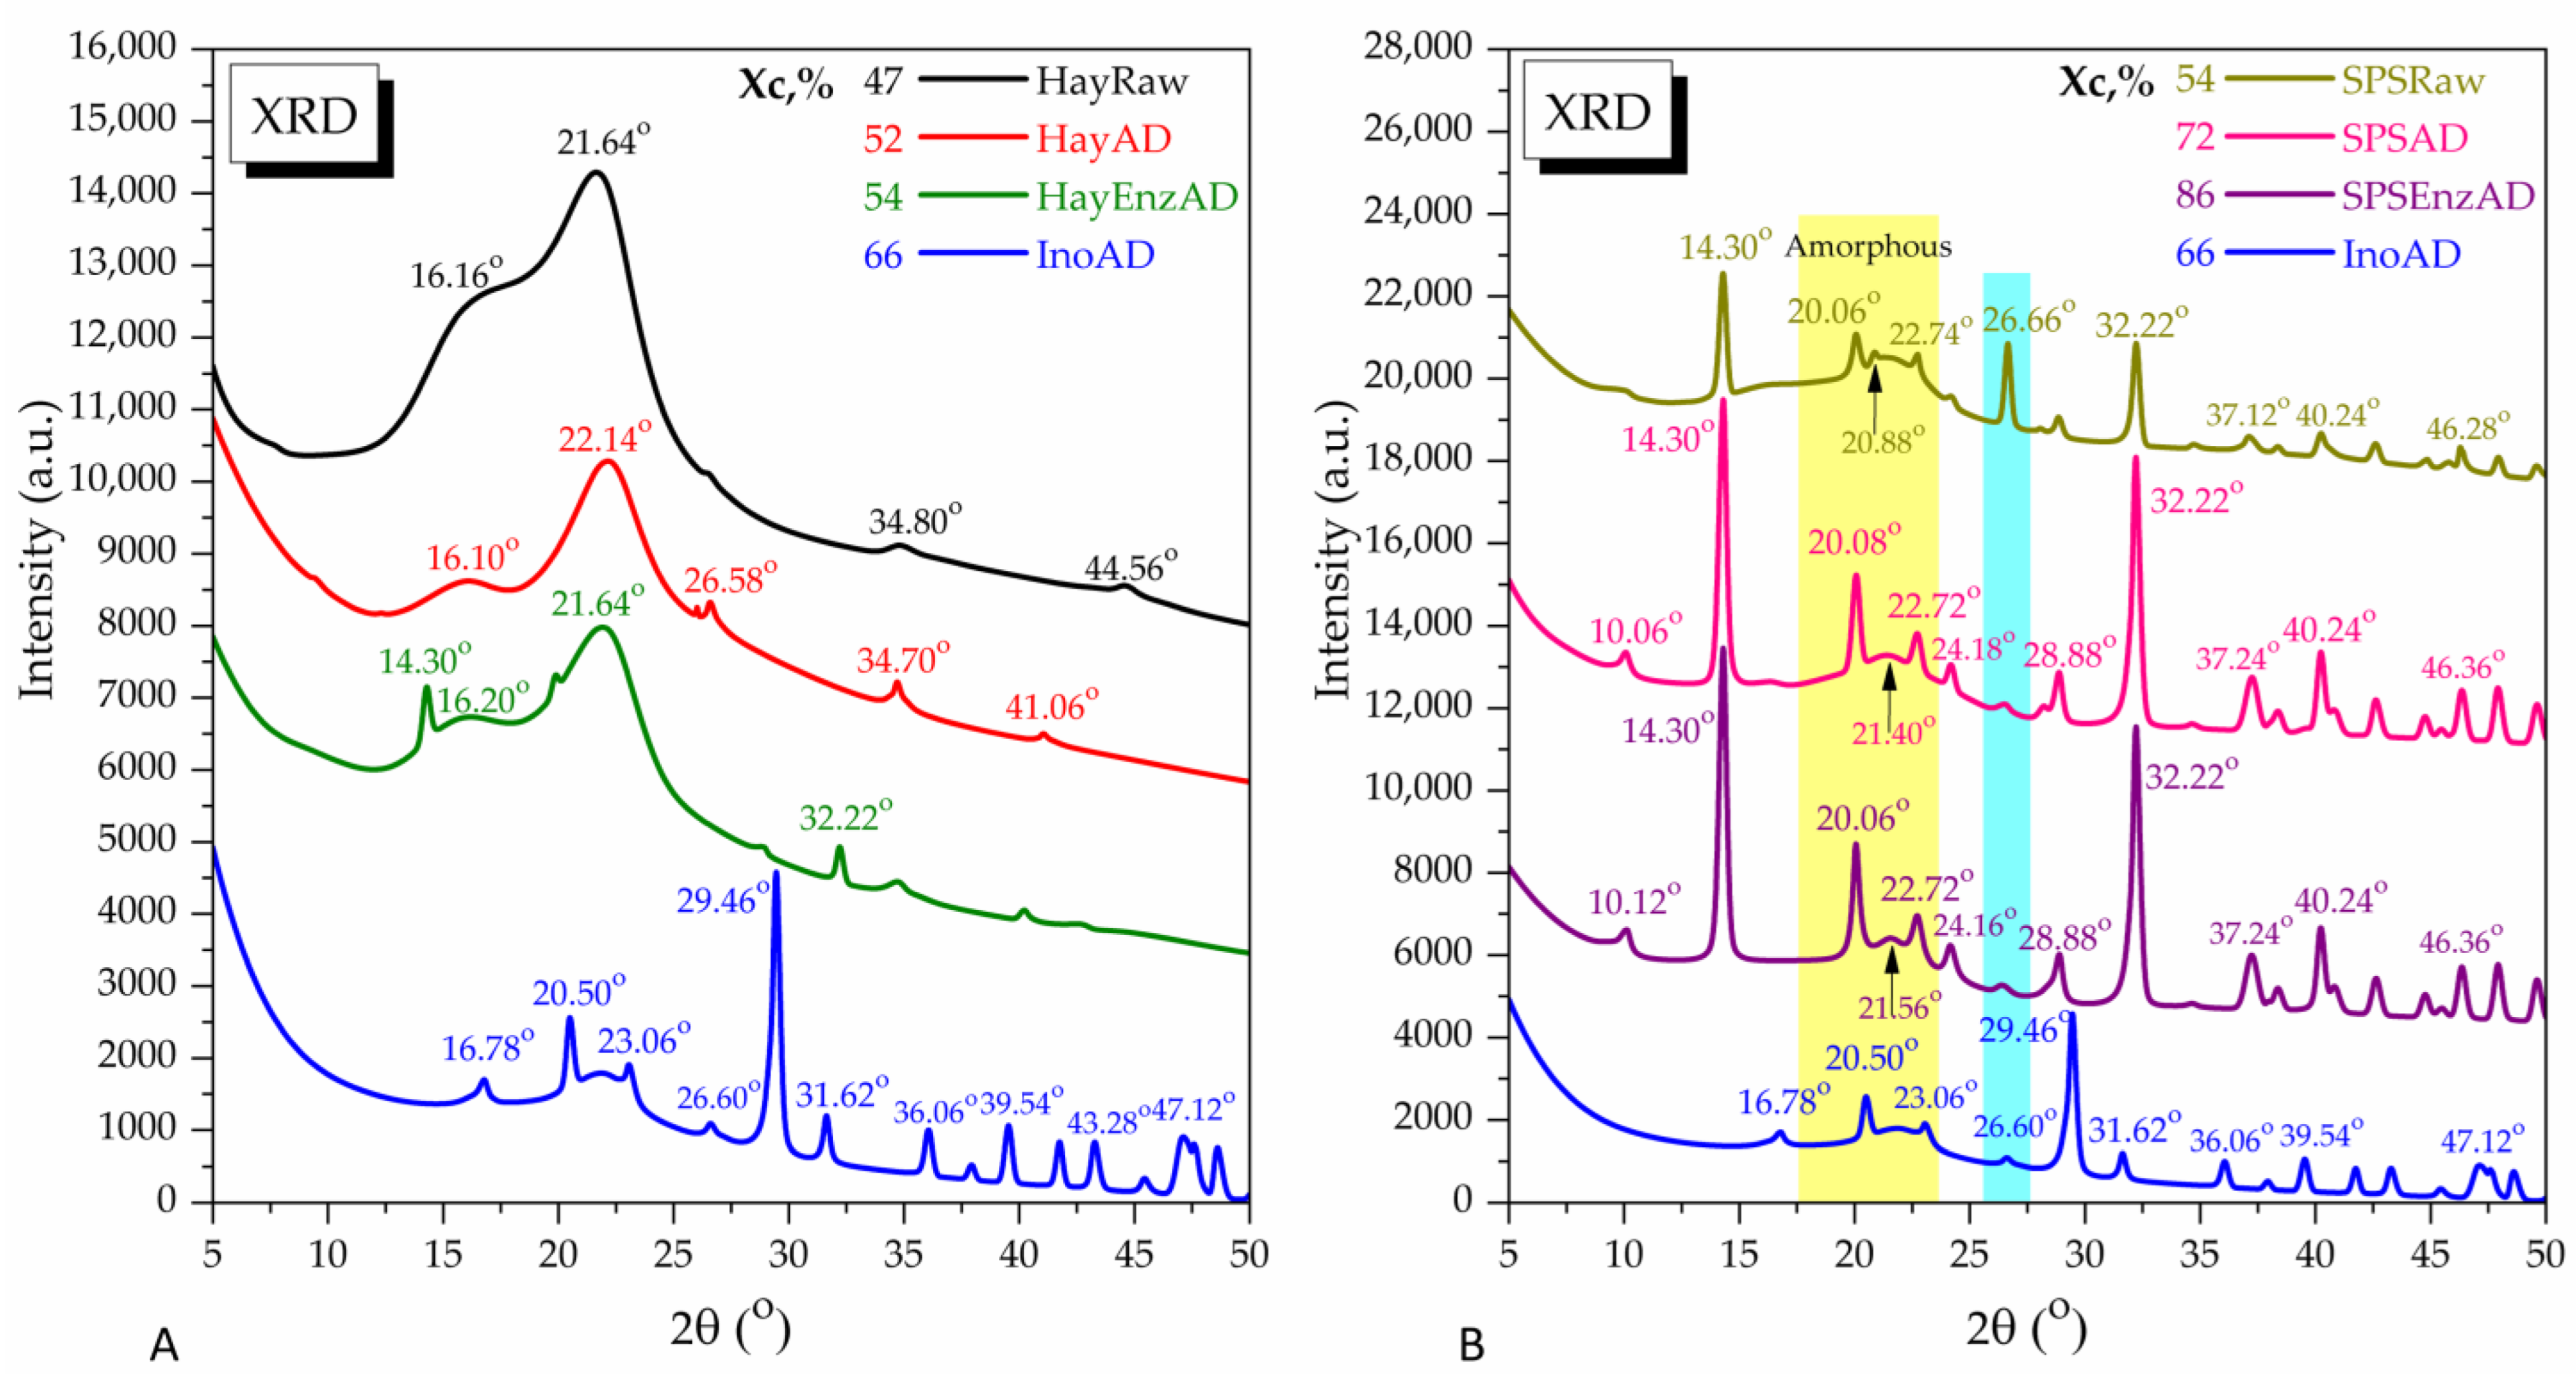
XRD analyses presented in Figure 9 indicate a semi-crystalline pattern for hay, with a 47% crystallinity index and with two main peaks at 16.16° and 21.64°. These peaks result from cellulose Iα (PDF card No. 00-056-1719), with specific peaks at 16.77° (0,1,0) and 21.80° (−1,1,0), in conjunction with cellulose Iβ (PDF card No. 00-060-1502) having specific peaks at 16.42° (1,0,1) and 22.71° (0,0,2) and with amorphous cellulose (PDF card No. 00-060-1501) having specific peaks at 15.28° and 19.78° [48,50]. Lignin overlaps this region with a broad peak characteristic to amorphous structures, with the maximum at approximately 22°. The crystallinity of SPS (54%) was higher than that of hay (47%). This indicates that the mycelium degraded mainly the amorphous regions of the biomass on which it grew and it correlated with the TGA results. This is in agreement with previous studies which show increased crystallinity of lignocellulosic substrate such as wheat and paddy straws induced by mushroom, as reported for Pleurotus florida and Agaricus bisporus [51]. Other studies reported a smaller effect on crystallinity [52]. The different behaviors could be caused by the different substrates used (white birch, alder, and aspen) and mushroom strains, e.g., Lentinula edodes. Two main sharp peaks, i.e., at 14.30° and 32.22°, characteristic, respectively, of the (110) and (040) planes of crystalline cellulose I [53], appeared in SPS as the amorphous peaks were reduced. These peaks significantly increased upon anaerobic digestion, indicating a further reduction in the amorphous regions by the microbial consortium from the inoculum. This is an important observation, as it suggests that we could facilitate the production of crystalline (nano)cellulose from SPS by applying anaerobic digestion. The other two peaks, at 20.88° and 26.66°, which became visible in SPS, were the only crystalline peaks significantly reduced by anaerobic digestion. These peaks have been previously assigned to silica, more specifically quartz, and in some cases to chitin [54,55,56]. The AD reduction effect on these peaks is interesting and raises the question of the true source of these peaks, which could have been degraded by the inoculum. Peaks at approximately 9–10°, 19–20°, and 23° are usually assigned to chitin [57,58]. SPS had peaks at 10.1°, 20.06°, and 22.74°, similar to those reported for alpha chitin. These peaks were increased by anaerobic digestion in contrast to the peaks at 20.88° and 26.66°. This indicates that the latter mainly came from silica in the form of quartz. In support of this hypothesis is the fact that the peak at 26.66° has a higher intensity than the peak at 20.88°, which is characteristic of quartz, whereas the two peaks in chitin are approximately of equal intensity. It has been shown that fungi, such as Fusarium oxysporum, can leach out amorphous silica from lignocellulosic biomass, such as rice husks, through crystalline nanoparticles with XRD characteristics of quartz polymorphs of crystalline silica [59]. The crystalline forms of silica observed in SPS should therefore be the result of Pleurotus activity. Similar crystalline peaks have been previously reported for spent mushroom substrates of P. florida, but they were not identified separately [60]. Anaerobic digestion mainly influenced the amorphous compounds from the raw materials and led to increased crystallinity in the treated substrates, respectively, 52% for HayAD and 72% for SPSAD. By enzymatic pretreatment, the extraction of amorphous compounds was intensified and the post-AD substrates had a higher crystallinity, respectively, 54% for HayAD and 86% for SPSAD. It is worth mentioning that the two peaks of crystalline cellulose, at 14.30° and 32.22°, appeared for hay only in the combination AD + enzyme. This indicates that the enzyme extract had within 24 h an effect similar to that of Pleurotus.
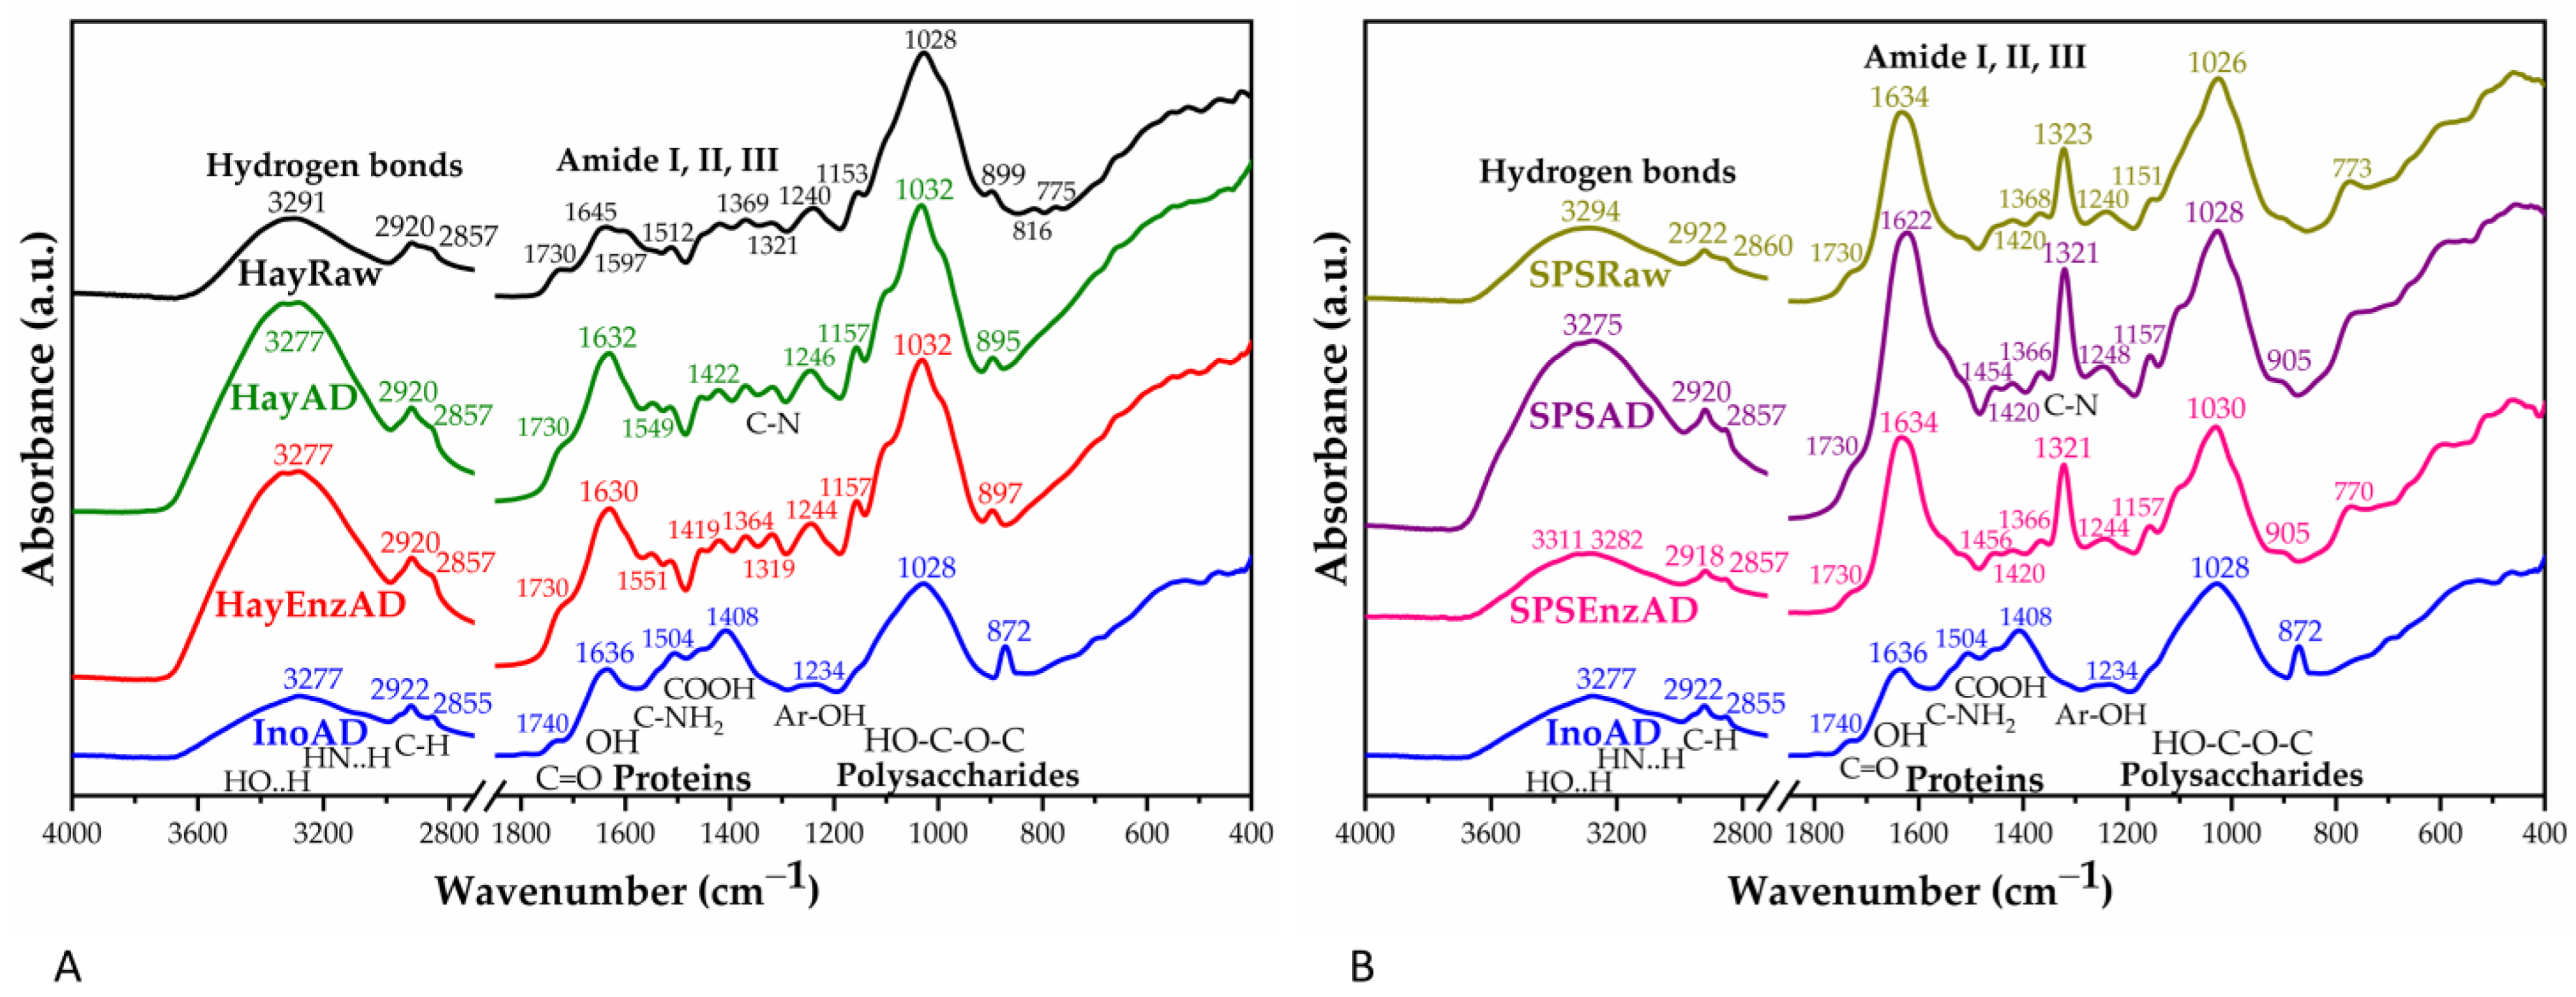
The structural changes in the substrates induced by the various processes were investigated by FT-IR (Figure 10). In hay, the large band at 3291 cm−1 represented the stretching vibrations of O-H bonds from cellulose and hemicellulose involved in inter-molecular hydrogen bonds. The two bands at 2920 and 2857 cm−1 were due to asymmetric and symmetric stretching vibrations of methylene groups from long-chain aliphatic molecules. The band at 1730 cm−1 came from the unconjugated C=O vibrations of carboxylic acids and acetyl in hemicellulose [61]. The bands at 1645, 1597, and 1512 cm−1 were from the stretching vibrations of the lignin aromatic rings [61] overlapping with carbohydrates, the amide I and amide II regions, and the O-H deformation of the absorbed water. The region 1500–1300 cm−1 involved vibrations of C-H bonds from lignin, cellulose, and hemicellulose [62]. The band at 1240 cm−1 could be attributed to the stretching vibrations of C-O bonds between lignin and hemicellulose. The region 1153–899 cm−1 represented the stretching and deformation vibrations of glycosidic compounds (cellulose and hemicellulose). The band at 1028 cm−1 represented the deformation vibrations of the ether bond C-O-C in the glycosidic link, with a shoulder at 1153 cm−1, which could be a convolution of skeletal vibrations involving the C–O–C glycosidic bonds from hemicellulose and amorphous cellulose. The band overlapped with the peak characteristic for Si-O stretching, which has a maximum between 1100 and 1000 cm−1. The 899 cm−1 band has been previously assigned to C-O-C vibrations from β-(1,4)-glycosidic linkage bond of cellulose. AD induced a significant increase in intensity of the large band at 3290 cm−1, and a shift to lower wavenumber, i.e., 3277 cm−1. The bands at 1645 and 1597 cm−1 became convoluted within a larger band with a maximum at 1632–1630 cm−1, which indicates changes in the lignin and protein structure, but also a contribution from the inoculum. The band at 1549–1551 cm−1 (amide II) increased in intensity upon AD, which suggests a higher content of protein in the solid digestate, probably from the inoculum. The bands at lower wavenumbers suffered shifts to lower or higher wavenumbers. The pretreatment with the enzyme extract induced some small shifts in the band maxima, but no significant changes.
The FT-IR spectrum of SPS had some differences compared with the hay (Figure 10B). One of the main differences was the convolution and increase in the bands in the region 1700–1550 cm−1, resulting in a band with the maximum at 1634 cm−1, similar to the changes induced by AD on hay. The difference was previously attributed to lignin degradation by Pleurotus sp., but the formation of mycelium, i.e., protein and chitin components [63], could contribute as well. Another main difference was a significant increase and sharpening of the band at 1321 cm−1, as well as a shift to 1323 cm−1 in SPS compared with hay. This band reflects the amide III bending in chitin and proteins [64,65], and the changes are probably due to the presence of mycelium. This band was assigned to vibrations of CH2 groups in cellulose as well and could reflect changes in cellulose ordering and crystallinity [66], as shown by XRD (Figure 9). The substrate after AD had similar changes as those seen in the hay after AD. The broad band with the maximum at 3294 cm−1 increased significantly and shifted to 3275 cm−1. The band at 1634 cm−1 increased and shifted to 1622 cm−1. These changes induced by AD were partially inhibited by the pretreatment with the enzyme extract in the case of SPS.
The COD was lower for SPS compared with hay, in both the liquid and solid digestate, in the absence of enzyme extract (Table 6). The enzyme extract significantly increased the COD in the liquid digestate of SPS, which correlated with the observed higher reducing group content when SPS was incubated with the enzymes (Figure 3). Additionally, we propose that the enzymatic pretreatment applied to the SPS samples increased the accessibility of methanogenic bacteria to organic matter and facilitated a mass transfer from the solid to the liquid fraction, the organic loading in the liquid phase being on average 26% higher in the pretreated SPS samples compared to the untreated SPS samples. These results suggest that the driving force for the improved anaerobic digestion process in the case of enzymatically pretreated SPS samples was the increased availability of organic matter. In the case of hay, the significantly lower biogas production for pretreated hay compared with untreated hay was accompanied by a small, but insignificant, decrease in the organic loading in the liquid digestate. For the solid digestate, the results were linked to the easily soluble organic compounds present within it. For both hay and SPS, the pretreated samples had on average 21% and 22% fewer soluble organic compounds, respectively, than the untreated samples. This reinforces the positive effect of an enzymatic pretreatment on increasing the availability of organic matter, but in the case of hay, the pretreatment might release certain compounds that inhibit or do not benefit the AD process.
The main compounds in the liquid digestate were identified by GC-MS/MS (Table 7, Figure S2). Short chain and medium chain fatty acids (SCFA and MCFA), as well as other volatile carboxylic acids were the main compounds found. One intriguing aspect was the much higher proportions of butyric and especially hexanoic acid compared with SCFA in all the samples and replicates. Previous studies of anaerobic digestion reported acetic acid as the major fatty acid, whereas in our study the content of hexanoic acid was more than 50% that of all compounds identified by GC-MS in each sample. Hexanoic acid has the highest economic value among MCFA, i.e., up to an estimated 4.4 $/kg according to some recent reports [67]. Hexanoic acid (or caproic acid) has various applications and new ones are being discovered, from being a possible replacement for pesticides, an elicitor of plant defense pathways [68], or a modulator of fermentation processes [69], to its use in production of biofuels [70,71] and bio-based polymers [72,73]. Lately, the interest has started to shift from methane production towards enhancing the production of MCFA over SCFA, as MCFA have a higher energy content than SCFA. Biologically, MCFA are produced by a process called chain elongation (CE), by which some volatile fatty acids (VFAs) react with electron donors such as ethanol or lactic acid and add additional carbons within anaerobic pathways. MCFA have been previously obtained by AD/fermentation of various substrates such as whey, winery wastewater, brewery waste, and some lignocellulose substrates such as cassava, sugar cane, Opuntia ficus-indica, Chinese cabbage waste, and celery [67,74,75]. In the case of lignocellulose, the few studies available either used ensiling or acidification to produce lactic acid or did not obtain MCFA and methane simultaneously, the two having different optimal hydraulic retention times, or hexanoic acid was not the most abundant among the VFAs. We found limited studies that reported hexanoic acid as the major VFA by using rather complex media with vitamins, yeast extract, and minerals added, several cycles, and over 30 days of AD [76]. A common approach is to add an exogeneous electron donor source, but this is not desirable as it increases the production cost. In our study, we obtained both methane and hexanoic acid as the major VFAs by simple AD of hay/SPS at 37 °C, even though the methane production was not as high as in other studies. Hay is a substrate that can generate lactic acid by the action of lactic acid bacteria. Moreover, we identified lactic acid in the control (inoculum without water) as well (Table S2), which indicates that the inoculum contained strains that were able to produce lactic acid. The low levels of both lactic acid and acetic acid upon AD correlate with the high levels of butyric acid and hexanoic acid and indicate that the two compounds might have been used in the CE reaction. The results point towards the need to more deeply investigate the source of this behavior.
Other compounds were ethyl acetate, 2-propanol, 2-butanol, butylated hydroxytoluene, and cyclohexanecarboxylic acid, but not all were present in all samples. Carboxylic acids with up to 4 C atoms (butanoic acid), ethyl acetate, and BHT were present at a higher proportion in the liquid digestate of SPS than that of hay, except for 2-methyl propanoic acid, which was lower. The carboxylic acids with more than 4 C atoms (from pentanoic acid), 2-butanol, and cyclohexanecarboxylic acid were present at a lower proportion in the liquid digestate of SPS than that of hay, except 4-methyl pentanoic acid, which was higher. The enzyme extract had a mixed effect on the composition of the liquid digestate. Some compounds increased in the case of hay when the enzymatic treatment was applied. The compounds 2-propanol, acetic acid, 2-methyl propanoic acid, butanoic acid, and heptanoic acid did not increase significantly, whereas hexanoic acid and cyclohexanecarboxylic acid decreased. In the case of SPS, most compounds did not change significantly in the presence of enzymes, except lactic acid and hexanoic acid, which decreased, and 2-methyl-butanoic acid, pentanoic, and heptanoic acid, which increased. All in all, there were no drastic changes in the profiles of the main compounds detected in the liquid digestate between the samples.
The elemental analysis showed no significant differences in nitrogen content of the solid and liquid digestate between hay, SPS, and enzymatically treated substrates (Table 8). The enzymatic treatment did not affect the total carbon content of the solid digestate, but it increased the total carbon content of the liquid digestate in both hay (1.19 ± 0.10% versus 0.87 ± 0.08%) and SPS (1.39 ± 0.02% versus 1.17 ± 0.09%), which correlates with the increase in the dry weight of the liquid digestate. As mentioned before, part of this increase is due to the solid matter present in the enzyme extract and part of it is due to the action of the enzymes on the substrate, as shown by the reducing groups in the case of SPS (Figure 3) and by the XRD analysis, respectively (Figure 9). In the case of hay, this increase in the total carbon and dry weight, along with the lower reducing groups and lower COD, indicates that the enzyme extract enriched the liquid digestate in carbonaceous matter, but this was not fermentable. For both enzymatically treated and non-treated substrates, the total carbon content was lower and higher, respectively, in solid and liquid digestate of SPS compared to hay. This indicates that the liquid digestate of SPS contained more organic non-fermentable matter than hay at the end of the process.
The phosphorous content of the solid and liquid digestate was lower for SPS than for hay, with or without enzymes (Table 9). This is because the mushrooms consumed the P from the substrate, especially when forming fructification bodies. The enzyme extract slightly increased the P percent in all the solid and liquid digestates. The potassium content was slightly higher in the digestates from SPS than from hay, except in solid digestate with enzyme treatment, where the values were the same. The enzyme treatment significantly increased the K content in all the samples.
The P and K content is important for future processing and applications of the liquid and solid digestates, such as struvite recovery and agricultural inputs, which would close the loop of SPS valorization. These data indicate that enzyme treatment could help improve the P and K recovery in the form of struvite and the characteristics of the products.

4. Conclusions

We demonstrated for the first time, to the best of our knowledge, that the aqueous extract of SPS contains elements such as volatile solids and lignocellulolytic enzymes that can improve the anaerobic digestion (AD) of SPS. From a partially optimized process, we obtained an increase of 39% in methane production and a 25% acceleration in the process after 2 days of AD. The extract increased the reducing groups released from SPS in water and the COD and total C of the liquid digestate, and the modification of the substrate was confirmed by XRD. The extract was not suitable to be used for the initial substrate on which Pleurotus was cultivated (hay) in combination with AD, as it resulted in the inhibition of the process. All variants produced hexanoic acid as a major compound after approximately 3 weeks of AD in batch, followed by butanoic acid, without any exogeneous addition. This is one of the very few studies that report hexanoic acid as a major volatile fatty acid. The parameters responsible for this result need further investigation. One important parameter is the consortium tested, not only for the production of hexanoic acid but also for methane and other compound production as well. One limitation of our study is the investigation of one inoculum only. Inocula from other sources will need to be tested, as well as the consortia and responsible strains identified in future works. The extract increased P and K content in both solid and liquid digestate, which has important applications in agriculture.

Supplementary Materials

The following supporting information can be downloaded at https://www.mdpi.com/article/10.3390/agronomy15112663/s1: Figure S1: Gompertz fit; Table S1: Fitting parameters using Gompertz equation for cumulative methane yield; Figure S2: GC chromatograms of liquid digestate; Table S2: Chemical composition of the liquid digestate from the AD control (water + inoculum); Tables S3–S11: p resulted from Tukey’s HSD test for multiple comparison analysis based on means at α ≤ 0.05.

Author Contributions

Conceptualization, D.C.-A. and F.O.; methodology, D.C.-A. and F.O.; validation, D.C.-A., G.V. and F.O.; formal analysis, D.C.-A., G.V. and F.O.; investigation, D.C.-A., A.V., D.G.P., Ș.-O.D., M.D.-A., A.C.N.V., M.G. (Marius Ghiurea), M.C.-U., I.P.-T., N.T., G.R.I., C.-A.N., M.G. (Mihaela Ganciarov) and G.V.; resources, D.C.-A. and F.O.; data curation, D.C.-A., A.V. and G.V.; writing—original draft preparation, D.C.-A., A.V. and Ș.-O.D.; writing—review and editing, F.O. and G.V.; visualization, F.O.; supervision, F.O. and G.V.; project administration, D.C.-A. and G.V.; funding acquisition, D.C.-A. and F.O. All authors have read and agreed to the published version of the manuscript.

Funding

This research was funded by the Romanian Ministry of Education and Research, National Agency for Research, project PN.23.06.02.01 InteGral, Nucleu Program.

Data Availability Statement

The original contributions presented in this study are included in the article/Supplementary Material. Further inquiries can be directed to the corresponding authors.

Acknowledgments

The XRD diffractometer was purchased with the support of the POS-CCE “Agri-Flux” project, nr. 645/18.03.2014, SMIS-CSNR 48695. The scanning electron microscope was acquired within the 15PFE Next-Bexcel project. We thank Bogdan Trica for valuable discussions and suggestions with respect to the statistical analysis, to Luiza Capra for assistance with the ICP-OES analysis, and to Victor Faraon for the help with the mechanical processing of SPS.

Conflicts of Interest

The authors declare no conflicts of interest.

Abbreviations

The following abbreviations are used in this manuscript:
ABTS2,2′-azino-bis-(3-ethylbenzothiazoline-6-sulfonic acid)
ADAnaerobic Digestion
BHTButylated Hydroxytoluene
CMCCarboxymethylcellulose
CODChemical Oxygen Demand
DNS3,5-Dinitrosalicylic acid
DTGDerivative Thermogram
FAEFeruloyl Esterase
FT-IRFourier Transform-Infrared
GC-MSGas Chromatography–Mass Spectrometry
HayADHay After Anaerobic Digestion
HayEnzADEnzymatically Treated Hay After Anaerobic Digestion
ICP-OESInductively Coupled Plasma Optical Emission Spectroscopy
PESPolyethersulfone
SEMScanning Electron Microscopy
SPSSpent Pleurotus Substrate
SPSADSPS After Anaerobic Digestion
SPSEnzADEnzymatically Treated SPS After Anaerobic Digestion
TGAThermogravimetric Analysis
VFAVolatile Fatty Acids
XRDX-Ray Diffraction

References

  1. Leong, Y.K.; Varjani, S.; Lee, D.-J.; Chang, J.-S. Valorization of spent mushroom substrate for low-carbon biofuel production: Recent advances and developments. Bioresour. Technol. 2022, 363, 128012. [Google Scholar] [CrossRef]
  2. Leong, Y.K.; Ma, T.-W.; Chang, J.-S.; Yang, F.-C. Recent advances and future directions on the valorization of spent mushroom substrate (SMS): A review. Bioresour. Technol. 2022, 344, 126157. [Google Scholar] [CrossRef] [PubMed]
  3. Yuan, C.; Wu, M.; Chen, X.; Li, C.; Zhang, A.; Lu, W. Growth performance and hematological changes in growing sika deers fed with spent mushroom substrate of Pleurotus ostreatus. Animals 2022, 12, 765. [Google Scholar] [CrossRef] [PubMed]
  4. Chuang, W.Y.; Liu, C.L.; Tsai, C.F.; Lin, W.C.; Chang, S.C.; Shih, H.D.; Shy, Y.M.; Lee, T.-T. Evaluation of Waste Mushroom Compost as a Feed Supplement and Its Effects on the Fat Metabolism and Antioxidant Capacity of Broilers. Animals 2020, 10, 445. [Google Scholar] [CrossRef]
  5. Wang, S.; Xu, F.; Li, Z.; Zhao, S.; Song, S.; Rong, C.; Geng, X.; Liu, Y. The spent mushroom substrates of Hypsizigus marmoreus can be an effective component for growing the oyster mushroom Pleurotus ostreatus. Sci. Hortic. 2015, 186, 217–222. [Google Scholar] [CrossRef]
  6. De Bonis, M.; Sambo, P.; Zanin, G.; Cardarelli, M.; Nicoletto, C. Spent Pleurotus substrate as organic fertilizer to improve yield and soil fertility: The case of baby leaf lettuce production. J. Sci. Food Agric. 2025, 105, 5874–5886. [Google Scholar] [CrossRef]
  7. Tuhy, Ł.; Samoraj, M.; Witkowska, Z.; Wilk, R.; Chojnacka, K. Using spent mushroom substrate as the base for organic-mineral micronutrient fertilizer–field tests on maize. BioResources 2015, 10, 5709–5719. [Google Scholar] [CrossRef]
  8. Ma, X.; Han, F.; Yang, G.; Wu, J.; Ma, Y. Enhanced soil ecosystem multifunctionality and microbial community shifts following spent mushroom substrate application in vineyards. Appl. Soil Ecol. 2025, 213, 106230. [Google Scholar] [CrossRef]
  9. Li, R.; Zhang, X.; Wang, G.; Kong, L.; Guan, Q.; Yang, R.; Jin, Y.; Liu, X.; Qu, J. Remediation of cadmium contaminated soil by composite spent mushroom substrate organic amendment under high nitrogen level. J. Hazard. Mater. 2022, 430, 128345. [Google Scholar] [CrossRef]
  10. Oancea, F.; Raut, I.; Sesan, T.E.; Doni, M.; Popescu, M.; Jecu, M.L. Enhancement of biostimulant activity of spent Pleurotus substrate for seedling production. Acta Hortic. 2017, 1164, 55–62. [Google Scholar] [CrossRef]
  11. Kousar, A.; Khan, H.A.; Farid, S.; Zhao, Q.; Zeb, I. Recent advances on environmentally sustainable valorization of spent mushroom substrate: A review. Biofuels Bioprod. Biorefining 2024, 18, 639–651. [Google Scholar] [CrossRef]
  12. Subbarao, P.M.V.; D’ Silva, T.C.; Adlak, K.; Kumar, S.; Chandra, R.; Vijay, V.K. Anaerobic digestion as a sustainable technology for efficiently utilizing biomass in the context of carbon neutrality and circular economy. Environ. Res. 2023, 234, 116286. [Google Scholar] [CrossRef]
  13. Harirchi, S.; Wainaina, S.; Sar, T.; Nojoumi, S.A.; Parchami, M.; Parchami, M.; Varjani, S.; Khanal, S.K.; Wong, J.; Awasthi, M.K.; et al. Microbiological insights into anaerobic digestion for biogas, hydrogen or volatile fatty acids (VFAs): A review. Bioengineered 2022, 13, 6521–6557. [Google Scholar] [CrossRef]
  14. Dincă, M.-N.; Ferdeș, M.; Zăbavă, B.-Ș.; Ionescu, M.; Moiceanu, G.; Paraschiv, G. Effective Valorization of Anaerobic Digestate—A Sustainable Approach to Circular Economy. Appl. Sci. 2025, 15, 8939. [Google Scholar] [CrossRef]
  15. Pérez-Chávez, A.M.; Mayer, L.; Albertó, E. Mushroom cultivation and biogas production: A sustainable reuse of organic resources. Energy Sustain. Dev. 2019, 50, 50–60. [Google Scholar] [CrossRef]
  16. Bisaria, R.; Vasudevan, P.; Bisaria, V.S. Utilization of spent agro-residues from mushroom cultivation for biogas production. Appl. Microbiol. Biotechnol. 1990, 33, 607–609. [Google Scholar] [CrossRef]
  17. Bernat, K.; Le, T.C.T.; Kulikowska, D.; Thapa, R. Anaerobic Digestion as a Possible Method of Managing Waste from Mushroom Production with Sewage Sludge as Co-Substrate. Energies 2024, 17, 1938. [Google Scholar] [CrossRef]
  18. Xiao, Z.; Lin, M.; Fan, J.; Chen, Y.; Zhao, C.; Liu, B. Anaerobic digestion of spent mushroom substrate under thermophilic conditions: Performance and microbial community analysis. Appl. Microbiol. Biotechnol. 2018, 102, 499–507. [Google Scholar] [CrossRef] [PubMed]
  19. Luo, X.; Yuan, X.; Wang, S.; Sun, F.; Hou, Z.; Hu, Q.; Zhai, L.; Cui, Z.; Zou, Y. Methane production and characteristics of the microbial community in the co-digestion of spent mushroom substrate with dairy manure. Bioresour. Technol. 2018, 250, 611–620. [Google Scholar] [CrossRef]
  20. Vasilakis, G.; Rigos, E.-M.; Giannakis, N.; Diamantopoulou, P.; Papanikolaou, S. Spent Mushroom Substrate Hydrolysis and Utilization as Potential Alternative Feedstock for Anaerobic Co-Digestion. Microorganisms 2023, 11, 532. [Google Scholar] [CrossRef] [PubMed]
  21. Gao, X.; Tang, X.; Zhao, K.; Balan, V.; Zhu, Q. Biogas Production from Anaerobic Co-Digestion of Spent Mushroom Substrate with Different Livestock Manure. Energies 2021, 14, 570. [Google Scholar] [CrossRef]
  22. Lee, J.; Ryu, D.-y.; Jang, K.H.; Lee, J.W.; Kim, D. Influence of Different Pretreatment Methods and Conditions on the Anaerobic Digestion Efficiency of Spent Mushroom Substrate. Sustainability 2022, 14, 15854. [Google Scholar] [CrossRef]
  23. Zhu, W.; Lai, X.; Liu, C.; Wu, X.; Bai, X.; Cai, Y.; Zhao, X.; Li, Z.; Hao, Y.; Huang, Y.; et al. Enhancement of Biomethane Yield from Spent Mushroom Substrate: Biological Pretreatment with the Chlamydospores of Trichoderma viride. Fermentation 2025, 11, 152. [Google Scholar] [CrossRef]
  24. López-Balladares, O.H.; De la Lama-Calvente, D.; Flores-Flor, F.J.; Borja, R. Valorization of Lignocellulosic Biomass Through Anaerobic Digestion after the Cultivation of the Edible Mushroom Lentinula Edodes and Enzymatic Pretreatment. Waste Biomass Valorization 2025, 1–13. [Google Scholar] [CrossRef]
  25. Ravlikovsky, A.; Pinheiro, M.N.C.; Kucheruk, P.; Symochko, L. Spent Mushroom Substrate as a Renewable Energy Resource: Evaluating Its Biogas Production Potential. Sustainability 2025, 17, 1800. [Google Scholar] [CrossRef]
  26. Bala, I.-A.; Tritean, N.; Enache, A.A.; Trică, B.; Constantinescu-Aruxandei, D.; Oancea, F. Effects of Blue-Light Laser Irradiation on the Enzymatic Activities and Sporulation of Trichoderma atroviride Grown on Rice Husks. Appl. Sci. 2023, 13, 9191. [Google Scholar] [CrossRef]
  27. Shyaula, M.; Regmi, S.; Khadka, D.; Poudel, R.C.; Dhakal, A.; Koirala, D.; Sijapati, J.; Singh, A.; Maharjan, J. Characterization of Thermostable Cellulase from Bacillus licheniformis PANG L Isolated from the Himalayan Soil. Int. J. Microbiol. 2023, 2023, 3615757. [Google Scholar] [CrossRef]
  28. Yuliana, T.; Maharddhika, A.; Rialita, T.; Lembong, E.; Anastassya, F.; Krama, A.; Ratu, S. Optimization of Laccase Production from Marasmius sp. in a Submerged Fermentation System. Pak. J. Biol. Sci. 2024, 27, 283–288. [Google Scholar] [CrossRef]
  29. Ben Khedher, N.; Lattieff, F.A.; Mahdi, J.M.; Ghanim, M.S.; Majdi, H.S.; Jweeg, M.J.; Baazaoui, N. Modeling of biogas production and biodegradability of date palm fruit wastes with different moisture contents. J. Clean. Prod. 2022, 375, 134103. [Google Scholar] [CrossRef]
  30. Ivan, G.R.; Ion, I.; Capra, L.; Oprea, O.; Ion, A.C. The Influence of the Chemical Composition of Natural Waters about the Triclocarban Sorption on Pristine and Irradiated MWCNTs. Separations 2023, 10, 46. [Google Scholar] [CrossRef]
  31. Restrepo Londoño, C.; Alvarado Torres, P.; Moreno, A.; Giraldo Gil, A. Characterization of Spent Mushroom Compost and Evaluation of Its Potential for Thermochemical Valorization through Ash Reduction Treatments. Biomass 2024, 4, 978–989. [Google Scholar] [CrossRef]
  32. Sheng, T.; Zhao, L.; Gao, L.; Liu, W.; Wu, G.; Wu, J.; Wang, A. Enhanced biohydrogen production from nutrient-free anaerobic fermentation medium with edible fungal pretreated rice straw. RSC Adv. 2018, 8, 22924–22930. [Google Scholar] [CrossRef] [PubMed]
  33. Oliveira, D.M.; Mota, T.R.; Salatta, F.V.; de Almeida, G.H.G.; Olher, V.G.A.; Oliveira, M.A.S.; Marchiosi, R.; Ferrarese-Filho, O.; dos Santos, W.D. Feruloyl esterase activity and its role in regulating the feruloylation of maize cell walls. Plant Physiol. Biochem. 2020, 156, 49–54. [Google Scholar] [CrossRef]
  34. Kamusoko, R.; Mukumba, P. Potential of Wheat Straw for Biogas Production by Anaerobic Digestion in South Africa: A Review. Energies 2024, 17, 4662. [Google Scholar] [CrossRef]
  35. Schroyen, M.; Vervaeren, H.; Vandepitte, H.; Van Hulle, S.W.H.; Raes, K. Effect of enzymatic pretreatment of various lignocellulosic substrates on production of phenolic compounds and biomethane potential. Bioresour. Technol. 2015, 192, 696–702. [Google Scholar] [CrossRef]
  36. Huang, F.; Liu, H.; Wen, J.; Zhao, C.; Dong, L.; Liu, H. Underestimated humic acids release and influence on anaerobic digestion during sludge thermal hydrolysis. Water Res. 2021, 201, 117310. [Google Scholar] [CrossRef]
  37. Li, J.; Hao, X.; van Loosdrecht, M.C.M.; Luo, Y.; Cao, D. Effect of humic acids on batch anaerobic digestion of excess sludge. Water Res. 2019, 155, 431–443. [Google Scholar] [CrossRef]
  38. Li, Y.; Yu, S.; Yang, X.; Feng, Y.; Dong, L.; Zhang, Y.; Feng, L.; Mazarji, M.; Pan, J. From feedstock to digestion: Unraveling the impact of humic acid composition on anaerobic digestion. Sci. Total Environ. 2023, 902, 166495. [Google Scholar] [CrossRef] [PubMed]
  39. Huang, F.; Liu, H.; Wen, J.; Huang, S.; Zheng, Z.; Zhang, X.; Fu, B.; Li, Y.; Wang, A.; Liu, H. Influences of humic acids released during sludge thermal hydrolysis on anaerobic digestion: New insights from enzymatic perspectives. Chem. Eng. J. 2023, 474, 145849. [Google Scholar] [CrossRef]
  40. Zhao, C.; Liu, H.; Zhang, X.; Li, Y.; Shi, M.; Huang, F.; Dong, L.; Wen, J.; Liu, H. Humic acids promotion or inhibition of sludge anaerobic digestion depends on their redox potentials. Chem. Eng. J. 2023, 464, 142653. [Google Scholar] [CrossRef]
  41. Li, S.; Sun, K.; Latif, A.; Si, Y.; Gao, Y.; Huang, Q. Insights into the Applications of Extracellular Laccase-Aided Humification in Livestock Manure Composting. Environ. Sci. Technol. 2022, 56, 7412–7425. [Google Scholar] [CrossRef] [PubMed]
  42. Schroyen, M.; Van Hulle, S.W.H.; Holemans, S.; Vervaeren, H.; Raes, K. Laccase enzyme detoxifies hydrolysates and improves biogas production from hemp straw and miscanthus. Bioresour. Technol. 2017, 244, 597–604. [Google Scholar] [CrossRef]
  43. Lin, Y.; Ge, X.; Li, Y. Solid-state anaerobic co-digestion of spent mushroom substrate with yard trimmings and wheat straw for biogas production. Bioresour. Technol. 2014, 169, 468–474. [Google Scholar] [CrossRef]
  44. Córdoba, V.; Colavolpe, M.B.; Fernández, M.; Santalla, E.; Albertó, E. Potential methane production of spent sawdust used in the cultivation of Gymnopilus pampeanus. J. Environ. Chem. Eng. 2016, 4, 4418–4425. [Google Scholar] [CrossRef]
  45. Huang, J.; Liu, J.; Chen, J.; Xie, W.; Kuo, J.; Lu, X.; Chang, K.; Wen, S.; Sun, G.; Cai, H.; et al. Combustion behaviors of spent mushroom substrate using TG-MS and TG-FTIR: Thermal conversion, kinetic, thermodynamic and emission analyses. Bioresour. Technol. 2018, 266, 389–397. [Google Scholar] [CrossRef] [PubMed]
  46. Czerwinska, J.; Szufa, S.; Unyay, H.; Wielgosinski, G. Emission of Total Volatile Organic Compounds from the Torrefaction Process: Meadow Hay, Rye, and Oat Straw as Renewable Fuels. Energies 2025, 18, 4154. [Google Scholar] [CrossRef]
  47. Paredes, C.; Medina, E.; Moral, R.; Pérez-Murcia, M.; Moreno-Caselles, J.; Bustamante, M.; Cecilia, J. Characterization of the Different Organic Matter Fractions of Spent Mushroom Substrate. Commun. Soil Sci. Plant Anal. 2009, 40, 150–161. [Google Scholar] [CrossRef]
  48. Dima, S.O.; Constantinescu-Aruxandei, D.; Tritean, N.; Ghiurea, M.; Capra, L.; Nicolae, C.A.; Faraon, V.; Neamtu, C.; Oancea, F. Spectroscopic Analyses Highlight Plant Biostimulant Effects of Baker’s Yeast Vinasse and Selenium on Cabbage through Foliar Fertilization. Plants 2023, 12, 3016. [Google Scholar] [CrossRef]
  49. Ma, Y.H.; Wang, Q.; Sun, X.; Wang, X.; Su, W.; Song, N. A Study on Recycling of Spent Mushroom Substrate to Prepare Chars and Activated Carbon. BioResources 2014, 9, 3939–3954. [Google Scholar] [CrossRef]
  50. Popa-Tudor, I.; Tritean, N.; Dima, S.; Trica, B.; Ghiurea, M.; Cimpean, A.; Oancea, F.; Constantinescu-Aruxandei, D. Kombucha Versus Vegetal Cellulose for Affordable Mucoadhesive (nano)Formulations. Gels 2025, 11, 37. [Google Scholar] [CrossRef] [PubMed]
  51. Devi, R.; Kapoor, S.; Thakur, R.; Sharma, E.; Tiwari, R.K.; Joshi, S.J. Lignocellulolytic enzymes and bioethanol production from spent biomass of edible mushrooms using Saccharomyces cerevisiae and Pachysolen tannophilus. Biomass Convers. Biorefinery 2025, 15, 28445–28459. [Google Scholar] [CrossRef]
  52. Chen, F.; Martín, C.; Lestander, T.A.; Grimm, A.; Xiong, S. Shiitake cultivation as biological preprocessing of lignocellulosic feedstocks—Substrate changes in crystallinity, syringyl/guaiacyl lignin and degradation-derived by-products. Bioresour. Technol. 2022, 344, 126256. [Google Scholar] [CrossRef]
  53. Long, J.; Wang, X.; Qiu, S.; Zhou, W.; Zhou, S.; Shen, K.; Xie, L.; Ma, X.; Zhang, X. Construction of cellulose-degrading microbial consortium and evaluation of their ability to degrade spent mushroom substrate. Front. Microbiol. 2024, 15, 1356903. [Google Scholar] [CrossRef] [PubMed]
  54. Facchinatto, W.M.; Santos, D.M.d.; Fiamingo, A.; Bernardes-Filho, R.; Campana-Filho, S.P.; Azevedo, E.R.d.; Colnago, L.A. Evaluation of chitosan crystallinity: A high-resolution solid-state NMR spectroscopy approach. Carbohydr. Polym. 2020, 250, 116891. [Google Scholar] [CrossRef] [PubMed]
  55. Zhong, T.; Wolcott, M.P.; Liu, H.; Glandon, N.; Wang, J. The influence of pre-fibrillation via planetary ball milling on the extraction and properties of chitin nanofibers. Cellulose 2020, 27, 6205–6216. [Google Scholar] [CrossRef]
  56. Guo, H.; Bian, K.; Ding, S.; Cai, H.; Zhang, H.; Chen, X.; Wang, C.; Yao, S.; Chen, X. Efficient Utilization of Biomass Hydrolysis Residues in Preparing a Metal/Acid Bifunctional Catalyst for Butyl Levulinate Hydrogenation to γ-Valerolactone. Ind. Eng. Chem. Res. 2023, 62, 5502–5514. [Google Scholar] [CrossRef]
  57. Poerio, A.; Girardet, T.; Petit, C.; Fleutot, S.; Jehl, J.; Arab-Tehrany, E.; Mano, J.; Cleymand, F. Comparison of the Physicochemical Properties of Chitin Extracted from Cicada orni Sloughs Harvested in Three Different Years and Characterization of the Resulting Chitosan. Appl. Sci. 2021, 11, 1278. [Google Scholar] [CrossRef]
  58. Cárdenas, G.; Cabrera, G.; Taboada, E.; Miranda, S. Chitin characterization by SEM, FTIR, XRD, and 13C cross polarization/mass angle spinning NMR. J. Appl. Polym. Sci. 2004, 93, 1876–1885. [Google Scholar] [CrossRef]
  59. Bansal, V.; Ahmad, A.; Sastry, M. Fungus-Mediated Biotransformation of Amorphous Silica in Rice Husk to Nanocrystalline Silica. J. Am. Chem. Soc. 2006, 128, 14059–14066. [Google Scholar] [CrossRef]
  60. Rajavat, A.S.; Rai, S.; Pandiyan, K.; Kushwaha, P.; Choudhary, P.; Kumar, M.; Chakdar, H.; Singh, A.; Karthikeyan, N.; Bagul, S.Y.; et al. Sustainable use of the spent mushroom substrate of Pleurotus florida for production of lignocellulolytic enzymes. J. Basic Microbiol. 2020, 60, 173–184. [Google Scholar] [CrossRef]
  61. Lin, S.Y.; Dence, C.W. Methods in Lignin Chemistry; Springer Science & Business Media: Berlin/Heidelberg, Germany, 2012. [Google Scholar]
  62. Hong, S.; Shen, X.-J.; Xue, Z.; Sun, Z.; Yuan, T.-Q. Structure–function relationships of deep eutectic solvents for lignin extraction and chemical transformation. Green Chem. 2020, 22, 7219–7232. [Google Scholar] [CrossRef]
  63. Zuffi, V.; Puliga, F.; Zambonelli, A.; Trincone, L.; Sanchez-Cortes, S.; Francioso, O. Sustainable Management of Anaerobic Digestate: From Biogas Plant to Full-Scale Cultivation of Pleurotus ostreatus. Agronomy 2023, 13, 950. [Google Scholar] [CrossRef]
  64. Banerjee, A.; Sahu, S.; Bhaskar, T.; Ghosh, D. Enhanced Glucan–Chitin Complex Extraction from Deoiled Yeast Biomass for Sustainable Biorefinery Applications. ACS Sustain. Chem. Eng. 2024, 12, 17450–17459. [Google Scholar] [CrossRef]
  65. Bekiaris, G.; Koutrotsios, G.; Tarantilis, P.A.; Pappas, C.S.; Zervakis, G.I. FTIR assessment of compositional changes in lignocellulosic wastes during cultivation of Cyclocybe cylindracea mushrooms and use of chemometric models to predict production performance. J. Mater. Cycles Waste Manag. 2020, 22, 1027–1035. [Google Scholar] [CrossRef]
  66. Gaur, R.; Agrawal, R.; Kumar, R.; Ramu, E.; Bansal, V.R.; Gupta, R.P.; Kumar, R.; Tuli, D.K.; Das, B. Evaluation of recalcitrant features impacting enzymatic saccharification of diverse agricultural residues treated by steam explosion and dilute acid. RSC Adv. 2015, 5, 60754–60762. [Google Scholar] [CrossRef]
  67. Battista, F.; Bolzonella, D. Beyond Anaerobic Digestion: New Perspectives for the Development of a Biorefinery Platform for the Simultaneous Production of Medium-Chain Fatty Acids by Chain Elongation and Biogas from Food Wastes. ACS Sustain. Chem. Eng. 2024, 12, 15294–15306. [Google Scholar] [CrossRef]
  68. Anderson, A.J.; Kim, Y.C. The Plant-Stress Metabolites, Hexanoic Aacid and Melatonin, Are Potential “Vaccines” for Plant Health Promotion. Plant Pathol. J. 2021, 37, 415–427. [Google Scholar] [CrossRef]
  69. Wang, W.; Yang, X.; Li, J.; Dong, Z.; Zhao, J.; Shao, T.; Yuan, X. Effects of hexanoic acid on microbial communities, fermentation, and hygienic quality of corn silages infested with toxigenic fungi. J. Sci. Food Agric. 2022, 102, 3522–3534. [Google Scholar] [CrossRef]
  70. D’Ambrosio, V.; Angelini, A.; Pastore, C. Hexanoic acid upgrading into hexyl hexanoate: An efficient way to obtain a new sustainable biofuel. Fuel 2024, 368, 131631. [Google Scholar] [CrossRef]
  71. Hong, D.H.; Gebresillase, M.N.; Seo, J.G. Upscaled Catalytic Production of Renewable Biofuels from Hexanoic Acid. Korean J. Chem. Eng. 2025, 42, 1033–1043. [Google Scholar] [CrossRef]
  72. Shi, J.; Zhang, X.; Weng, L.; Zhu, X.; Liu, L. Study on low dielectric laminate modified by hyperbranched polyester of caprylic acid and hexanoic acid co-blocking. J. Mater. Sci. Mater. Electron. 2020, 31, 5068–5076. [Google Scholar] [CrossRef]
  73. Shi, J.; Weng, L.; Wang, X.; Sun, X.; Du, S.; Gao, F.; Zhang, X. Synthesis and evaluation of epoxy resin modified by hyperbranched polyester of caprylic acid and hexanoic acid. Pigment Resin Technol. 2021, 51, 33–41. [Google Scholar] [CrossRef]
  74. Chen, Z.; Huang, L.; Ji, X.; Chen, R.; Zhu, J. Hexanoic Acid Production from Chinese Cabbage Waste Driven by In Situ Lactic Acid Pre-Fermentation: Effect of pH. Appl. Biochem. Biotechnol. 2025, 197, 6154–6168. [Google Scholar] [CrossRef] [PubMed]
  75. Zhang, Q.; Lu, Y.; Zhou, X.; Wang, X.; Zhu, J. Effect of different vegetable wastes on the performance of volatile fatty acids production by anaerobic fermentation. Sci. Total Environ. 2020, 748, 142390. [Google Scholar] [CrossRef] [PubMed]
  76. Contreras-Dávila, C.A.; Carrión, V.J.; Vonk, V.R.; Buisman, C.N.J.; Strik, D.P.B.T.B. Consecutive lactate formation and chain elongation to reduce exogenous chemicals input in repeated-batch food waste fermentation. Water Res. 2020, 169, 115215. [Google Scholar] [CrossRef] [PubMed]
Figure 1. (A) The hay substrate used for culturing Pleurotus ostreatus P 70; (B) mycelium of P. ostreatus used for inoculation; (CE) incubation and production of P. ostreatus P 70: (C) initial incubation before mycelium growth, in the absence of light; (D) incubation after mycelium growth, with day/light cycle; (E) production of fruiting bodies.
Agronomy 15 02663 g001
Figure 2. Scanning electron micrographs of (A,B) hay and (C,D) SPS; (A): 100× magnification, secondary electrons; (B): 1000×, backscattered electrons; (C): 100×, secondary electrons; (D): 1000×, backscattered electrons.
Agronomy 15 02663 g002
Figure 3. (A) Reducing groups after 24 h pretreatment of SPS at 37 °C with various percentages of enzyme extract from SPS; (B) reducing groups after 24 h enzymatic pretreatment of hay and SPS at 37 °C with 66% enzyme extract from SPS in comparison with untreated substrate. The gray bars in B compare the values after extracting the reducing groups of each extract. The bars represent standard deviation. Different letters indicate statistically different values at α ≤ 0.05, n = 3; *—p = 0.011 (when only SPS and SPS + enzyme were included in the statistical analysis).
Agronomy 15 02663 g003
Figure 4. (A) Evolution of methane production from anaerobic digestion of hay without (black) and with (red) enzymatic pretreatment; (B) evolution in methane production from anaerobic digestion of SPS without (black) and with (red) enzymatic pretreatment; Enz: enzyme extract, SPS: spent Pleurotus substrate. Each variant is shown in triplicate.
Agronomy 15 02663 g004
Figure 5. (A) Graphical representation of the cumulative methane production as a mean of the three replicates on each day; (B) graphical representation of the methane productivity; Enz: enzyme extract, SPS: spent Pleurotus substrate; (C) graphical representation of the cumulative methane yield; (D) graphical representation of the methane yield productivity; the bars represent the standard deviations (n = 3).
Agronomy 15 02663 g005
Figure 6. Graphical representation of (A) the cumulative methane production and (B) methane yield (normalized per gram of volatile solids) on the 2nd, 3rd, and 14th days of anaerobic digestion; the values are mean ± standard deviation (n = 3); different letters indicate statistically different values at α ≤ 0.05 and each timeline was statistically analyzed separately; for * (p = 0.012) and ms (p = 0.07) only SPS and SPS + enzyme were included in the statistical analysis.
Agronomy 15 02663 g006
Figure 7. Scanning electron microscopy of the solid digestate of (A) hay; (B) spent Pleurotus substrate (SPS); (C) hay + enzyme; (D) SPS + enzyme.
Agronomy 15 02663 g007
Figure 8. Thermogravimetric analysis (TGA) of (A) raw hay (HayRaw); (B) hay after anaerobic digestion (HayAD); (C) enzymatically treated hay after anaerobic digestion (HayEnzAD); (D) raw SPS (SPSRaw); (E) SPS after anaerobic digestion (SPSAD); (F) enzymatically treated SPS after anaerobic digestion (SPSEnzAD).
Agronomy 15 02663 g008
Figure 9. X-ray diffraction analysis of (A) raw hay (HayRaw), hay after anaerobic digestion (HayAD), enzymatically treated hay after anaerobic digestion (HayEnzAD), inoculum after anaerobic digestion (InoAD); (B) raw SPS (SPSRaw), SPS after anaerobic digestion (SPSAD), enzymatically treated SPS after anaerobic digestion (SPSEnzAD), inoculum after anaerobic digestion (InoAD). The numbers in the legend represent the degree of crystallinity (Xc, %).
Agronomy 15 02663 g009
Figure 10. FT-IR spectra for (A) raw hay (HayRaw), hay after anaerobic digestion (HayAD), enzymatically treated hay after anaerobic digestion (HayEnzAD), inoculum after anaerobic digestion (InoAD); (B) raw SPS (SPSRaw), SPS after anaerobic digestion (SPSAD), enzymatically treated SPS after anaerobic digestion (SPSEnzAD), inoculum after anaerobic digestion (InoAD).
Agronomy 15 02663 g010
Table 1. Composition of the anaerobic digestion variants.
VariantComposition
hay21 g hay, 180 mL water, 20 mL inoculum
hay + enzyme21 g hay, 100 mL 66% enzyme, 80 mL water, 20 mL inoculum
SPS 121 g SPS, 180 mL water, 20 mL inoculum
SPS + enzyme21 g SPS, 100 mL 66% enzyme, 80 mL water, 20 mL inoculum
Control200 mL water, 20 mL inoculum
1 Spent Pleurotus substrate.
Table 2. Characteristics of hay and SPS.
Sample
Name
Elemental Analysis % (w/w)ICP-OES
ISO 11885:2009, % (w/w)
Gravimetric Analysis
% (w/w)
Total
Nitrogen
Total
Carbon
P
(λ = 213.617 nm)
K
(λ = 766.490 nm)
VS
(550 °C)
Ash
(550 °C)
Hay1.5243.000.200.3194.89 ± 0.295.11 ± 0.29
SPS2.4840.000.210.6980.28 ± 0.3019.72 ± 0.30
SPS: spent Pleurotus substrate; VS: volatile solids; ICP-OES: Inductively Coupled Plasma Optical Emission Spectroscopy; VS and ash were expressed as percent of total solids (TS). The TS content was 93.56 ± 0.48% (w/w) and 93.52 ± 0.55% (w/w) of the total mass for hay and SPS, respectively.
Table 3. Gompertz model parameters of cumulative methane yield.
SampleB1 (NmL/g VS)Rm1 (NmL/g VS/hλ1 (h)
Hay9.917 ± 1.899 b#1.503 ± 0.789 b3.989 ± 2.472 b
Hay + Enzyme3.008 ± 0.456 a1.077 ± 0.042 ab−0.160 ± 0.012 a
SPS16.975 ± 1.581 c0.356 ± 0.058 a−0.769 ± 0.735 a
SPS + Enzyme17.504 ± 0.800 c0.638 ± 0.037 ab2.503 ± 0.487 ab
SampleB2 (NmL/g VS)Rm2 (NmL/g VS)λ2 (NmL/g VS)
Hay12.642 ± 1.5150.798 ± 0.124113.092 ± 22.690
Hay + Enzyme11.271 ± 1.153
(p = 0.280)
0.710 ± 0.183
(p = 0.530)
234.181 ± 56.129 *
(p = 0.026)
B1 and B2: methane generation potential (ultimate/maximum experimental methane yield) for the first and second steps, respectively; Rm1 and Rm2: the maximal methane generation rate for the first and second steps, respectively; λ1 and λ2: lag time for the first and second steps, respectively; # different letters indicate statistically significant differences between samples at α ≤ 0.05, when comparing all the four variants simultaneously, i.e., hay, hay + enzyme, SPS, SPS + enzyme; *—0.05 ≥ p > 0.01, when comparing B2, Rm2, and λ2 between hay and hay + enzyme.
Table 4. Dry weight and moisture of the liquid digestate and solid digestate.
Sample
Name
Liquid DigestateSolid Digestate (Freeze-Dried)
Dry Weight (%)Dry Weight (g)Moisture (%)
Hay2.40 ± 0.10 b,#16.75 ± 1.94 bc79.40 ± 1.76 b
Hay + Enzyme 3.42 ± 0.01 d18.72 ± 2.20 c77.50 ± 0.62 b
SPS3.18 ± 0.06 c14.53 ± 0.20 b71.60 ± 0.54 a
SPS + Enzyme4.28 ± 0.02 e14.02 ± 0.56 b69.90 ± 1.00 a
Control0.81 ± 0.02 a0.55 ± 0.03 a92.00 ± 2.25 c
Values ± standard deviation; # different letters indicate statistically significant differences between samples at α ≤ 0.05, n = 3.
Table 5. Thermogravimetric analyses of hay and SPS samples *,**.
SampleT (°C); WL (%)ResN2ResAir
H2O & VOBs Small Organics Hemicellulose Cellulose Lignin
Chitin
Lignin
FC
CaCO3 w% w%
25–105 °C 105–200 °C 200–290 °C 290–350 °C 350–460 °C 460–550 °C 550–750 °C 750 °C 750 °C
HayRaw53; 6.03199.9; 7.14261.8; 20.27304.3; 34.29422.4; 22.50497.6; 4.87650.0; 0.364.544.53
SPSRaw53.5; 6.26146.8; 5.67255.7; 17.73323.3; 27.46446.1; 2.59466.9; 5.47690.0; 9.8025.0213.07
HayAD49.4; 6.02-286.4; 27.24328.9; 36.33-470.0; 7.08650.0; 6.3916.944.89
SPSAD50.1; 6.05148.8; 6.61275.2; 14.60338.7; 26.58460.6; 6.00477.3; 4.19694.5; 11.0324.9414.66
HayEnzAD49.2; 6.65123.2; 0.93274.3; 22.75331.0; 40.84-475.6; 3.56645.2; 5.0220.254.93
SPSEnzAD49.9; 5.66149.6; 7.10274.; 15.54337.5; 24.57461.8; 6.36478.3; 4.06695.0; 11.2825.4315.42
* Notations: VOBs—volatile organic biocompounds; PF—polyphenols; Prot.—proteins; FC—fixed carbon; ResN2—residue under nitrogen; ResAir—residue under air. ** 100% total mass balance in N2.
Table 6. Chemical oxygen demand (COD) of liquid and solid digestate.
SampleLiquid DigestateSolid Digestate (Freeze-Dried)
COD (mg/L)COD (mg/g)
Hay23,508.3 ± 471.6 b#1535.6 ± 263.2 b
Hay + Enzyme 23,133.3 ± 358.5 b1211.4 ± 298.0 ab
SPS21,731.33 ± 3727.3 b1308.8 ± 65.9 ab
SPS + Enzyme29,391.7 ± 312.6 c1019.1 ± 216.0 ab
Control613.3 ± 270.2 a898.7 ± 237.7 a
Values ± standard deviation; # different letters indicate statistically significant differences between samples at α ≤ 0.05, n = 3.
Table 7. Proportion of the main compounds from liquid digestate determined by GS-MS/MS.
CompoundABCD
HayHay + EnzymeSPSSPS + Enzyme
Area, %Area, %Area, %Area, %
Ethyl acetate0.39 ± 0.05 a,#0.73 ± 0.09 b
A ** (p = 0.005)
0.98 ± 0.14 c0.81 ± 0.08 bc
2-Propanol0.00 ± 0.00 a0.74 ± 0.78 a0.00 ± 0.00 a0.00 ± 0.00 a
Lactic acid0.00 ± 0.00 a0.62 ± 0.15 b
A ** (p = 0.002)
0.63 ± 0.04 b0.43 ± 0.06 b
C ** (p = 0.007)
2-Butanol0.52 ± 0.13 b1.91 ± 0.19 c
A *** (p < 0.001)
0.00 ± 0.00 a0.07 ± 0.08 a
Acetic acid0.00 ± 0.00 a0.29 ± 0.26 a0.73 ± 0.73 a0.95 ± 0.13 a
A *** (p < 0.001); B * (p = 0.016)
Propanoic acid0.13 ± 0.13 a1.05 ± 0.08 c
A ** (p = 0.001)
0.45 ± 0.08 b0.48 ± 0.13 b
2-methyl propanoic acid1.76 ± 0.05 a1.94 ± 1.58 a0.88 ± 0.13 a
A *** (p < 0.001)
1.01 ± 0.08 a
A *** (p < 0.001)
Butanoic acid15.35 ± 2.28 a20.24 ± 9.73 a24.32 ± 1.73 a
A ** (p = 0.006)
23.09 ± 0.96 a
A ** (p = 0.006)
2-methyl butanoic acid1.32 ± 0.05 a2.72 ± 0.18 b
A *** (p < 0.001)
1.03 ± 0.11 a
A *
3.96 ± 0.24 c
C *** (p < 0.001)
Pentanoic acid4.75 ± 0.11 ab6.74 ± 2.12 b2.31 ± 0.10 a4.51 ± 0.68 ab
C ** (p = 0.005)
4-methyl pentanoic acid0.00 ± 0.00 a0.00 ± 0.00 a0.70 ± 0.23 b0.64 ± 0.23 b
Hexanoic acid64.51 ± 1.50 c53.11 ± 5.07 a
A * (p = 0.02)
58.75 ± 2.67 ab53.45 ± 0.64 a
C * (p = 0.029)
Butylated hydroxytoluene1.42 ± 0.08 a2.81 ± 0.40 b
A ** (p = 0.004)
3.89 ± 0.32 c3.01 ± 0.49 bc
C (ms) (p = 0.06)
Heptanoic acid2.38 ± 0.51 a3.15 ± 2.29 a1.04 ± 0.20 a2.75 ± 0.71 a
C * (p = 0.016)
Octanoic acid3.61 ± 0.40 a2.62 ± 1.96 a2.33 ± 0.68 a3.39 ± 0.38 a
C (ms) (p = 0.077)
Cyclohexanecarboxylic acid3.88 ± 0.14 b0.00 ± 0.00 a
A *** (p < 0.001)
0.00 ± 0.00 a0.00 ± 0.00 a
# different letters indicate statistically significant differences between samples at α ≤ 0.05, when comparing all the four variants simultaneously, i.e., hay, hay + enzyme, SPS, SPS + enzyme; n = 3. *—0.05 ≥ p > 0.01, **—0.01 ≥ p > 0.001, ***—p ≤ 0.001, and ms—marginally significant (0.05 < p ≤ 0.1), when comparing by column pairs, the column to which the comparison is being made is indicated in front as A, B, C, and D.
Table 8. Elemental analysis of solid and liquid digestate.
Sample NameTotal NitrogenTotal Carbon
Mean * (%)Mean * (%)
Solid digestate
Hay2.23 ± 0.34 a,#47.45 ± 0.07 c
Hay + Enzyme2.11 ± 0.21 a47.60 ± 0.57 c
SPS2.12 ± 0.26 a37.10 ± 0.14 b
SPS + Enzyme1.97 ± 0.30 a37.00 ± 0.14 b
Control3.40 ± 0.46 b31.30 ± 0.28 a
Liquid digestate
Hay<0.19 **0.87 ± 0.08 a
Hay + Enzyme<0.19 **1.19 ± 0.10 bc
SPS<0.19 **1.17 ± 0.09 b
SPS + Enzyme<0.19 **1.39 ± 0.02 c
Control<0.19 **<0.52 **
* n = 3; ** limit of quantification; # different letters indicate statistically significant differences between samples at α ≤ 0.05.
Table 9. ICP-OES analysis of phosphorous and potassium content of the solid and liquid digestate.
Sample NameElement
P % (w/w)K % (w/w)
Solid digestate
Hay0.200 ± 0.000 bc,#0.250 ± 0.010 a
Hay + Enzyme0.233 ± 0.015 c0.333 ± 0.012 b
SPS0.157 ± 0.015 a0.280 ± 0.017 ab
SPS + Enzyme0.187 ± 0.015 ab0.333 ± 0.012 b
Control2.127 ± 0.1500.577 ± 0.051 c
Liquid digestate
Hay0.026 ± 0.006 a0.055 ± 0.008 b
Hay + Enzyme0.052 ± 0.027 a0.084 ± 0.002 c
SPS0.020 ± 0.003 a0.086 ± 0.011 c
SPS + Enzyme0.028 ± 0.003 a0.113 ± 0.006 d
Control0.017 ± 0.011 a0.027 ± 0.002 a
ICP-OES: Inductively Coupled Plasma Optical Emission Spectroscopy; # different letters indicate statistically significant differences between samples at α ≤ 0.05, n = 3.
Disclaimer/Publisher’s Note: The statements, opinions and data contained in all publications are solely those of the individual author(s) and contributor(s) and not of MDPI and/or the editor(s). MDPI and/or the editor(s) disclaim responsibility for any injury to people or property resulting from any ideas, methods, instructions or products referred to in the content.