1. Introduction
Wheat is one of the most important staple crops globally, extensively cultivated across diverse regions and playing an irreplaceable role in agricultural production. Fusarium head blight (FHB), a climate-associated fungal disease caused by Fusarium graminearum, is prevalent in wheat-growing areas worldwide [
1]. In severe outbreaks, it can result in complete grain loss, drawing considerable attention across breeding, grain production, and food processing sectors [
2]. Accordingly, timely detection and accurate assessment of FHB severity are critical for safeguarding wheat yield. Traditional field-based diagnosis is time-consuming and labor-intensive, often relying heavily on the surveyor’s experience, which introduces a high degree of subjectivity [
3]. Therefore, developing a rapid, non-destructive, and high-throughput method for FHB detection is of particular importance.
With the ongoing development of digital agriculture, applying computational techniques to detect FHB in wheat has become a prominent area of research [
4,
5,
6]. In particular, deep learning—a key driver of predictive automation—has accelerated the integration of computer vision into FHB detection workflows. Gao et al. [
7] implemented an enhanced lightweight YOLOv5s model for identifying FHB-infected wheat spikes under natural field conditions. By combining MobileNetV3 with the C3Ghost module, the model achieved reduced complexity and parameter count while improving detection accuracy and real-time performance. Ma et al. [
8] employed hyperspectral imaging alongside an optimized combination of SBs, VIs, and WFs, and applied the MMN algorithm for normalization, significantly enhancing FHB detection outcomes. Zhou et al. [
9] introduced DeepFHB, a high-throughput deep learning framework incorporating a modified transformer module, DConv network, and group normalization. This architecture enabled efficient detection, localization, and segmentation of wheat spikes and symptomatic regions in complex field settings. Evaluated on the FHB-SA dataset, DeepFHB achieved a box AP of 64.408 and a mask AP of 64.966. Xiao et al. [
10] proposed a hyperspectral imaging approach for detecting FHB in wheat by integrating spectral and texture features and optimizing the window size of the gray-level co-occurrence matrix (GLCM), which led to a notable improvement in detection accuracy. The study demonstrated that a 5 × 5 pixel window provided the highest accuracy (90%) during the early stage of infection, whereas a 17 × 17 pixel window was most effective in the late stage, also yielding an accuracy of 90%.
However, existing approaches for detecting FHB in wheat using RGB or hyperspectral imaging primarily depend on two-dimensional data captured by monocular cameras. These methods often underperform in the presence of complex field backgrounds and require extensive training datasets to reach acceptable accuracy levels [
11]. Segmentation networks based on deep convolutional neural networks (DCNNs) also exhibit limitations, particularly in their inability to capture spatial relationships between pixels at different depths within an image [
12]. In response, several studies have investigated crop detection methods that incorporate depth information. Wen et al. [
13] employed a binocular camera system with parallel optical axes to generate disparity maps and compute 3D point clouds of wheat surfaces, thereby enabling the detection of lodging. By analyzing the angle between wheat stems and the vertical axis, lodging was categorized into upright, inclined, and fully lodged conditions and quantified using point cloud height. Liu et al. [
14] proposed a method for pineapple fruit detection and localization that integrates an enhanced YOLOv3 model with binocular stereo vision, where YOLOv3 performs rapid 2D object detection and the stereo system supplies depth data to form a complete end-to-end detection and localization pipeline. Ye et al. [
15] proposed a soybean plant recognition model utilizing a laser range sensor. By analyzing structural differences between soybean plants and weeds—specifically in diameter, height, and planting spacing—the model demonstrated the applicability of laser range sensing in complex field environments, providing a reliable solution for real-time soybean identification and automated weeding. Jin et al. [
16] introduced a method for maize stem–leaf segmentation and phenotypic trait extraction based on ground LiDAR data. A median-normalized vector growth (MNVG) algorithm was developed to achieve high-precision segmentation of individual maize stems and leaves. This approach enabled the extraction of multiscale phenotypic traits, including leaf inclination, length, width, and area, as well as stem height and diameter, and overall plant characteristics such as height, canopy width, and volume. Experimental results indicated that the MNVG algorithm achieved an average segmentation accuracy of 93% across 30 maize samples with varying growth stages, heights, and planting densities, with phenotypic trait extraction reaching an R
2 of up to 0.97.
Therefore, crop and plant segmentation methods based on depth information have become an important direction for improving segmentation accuracy. However, traditional stereo cameras and laser sensors face challenges such as high costs, complex calibration, and maintenance requirements, which limit their widespread adoption in large-scale applications [
17]. To overcome these limitations, this study proposes an innovative method for wheat ear segmentation and scab detection based on a depth estimation model, aiming to advance depth-guided crop and plant segmentation technology through algorithmic innovation. (1) By reconstructing 3D depth information from single-view RGB images using a depth estimation model (Depth Anything V2 [
18]), we address the limitation of traditional 2D images in providing spatial information, thereby enhancing the accuracy of wheat ear segmentation. This approach not only improves segmentation precision but also innovatively utilizes depth information to guide the segmentation process. (2) We propose a geometry-based localization method using sudden changes in stalk width to accurately eliminate redundant stalks. This innovative algorithm significantly optimizes crop segmentation accuracy through morphological feature analysis, overcoming the limitations of traditional methods in handling redundant structures within complex backgrounds. (3) By combining optimized color indices, we developed an efficient scab detection method. This approach enhances the identification accuracy of scab-infected regions through the fusion of color indices and depth information, demonstrating how depth-guided feature fusion can improve the performance of agricultural disease monitoring technologies. Experimental results show that the proposed method achieves an IoU of 0.878 for wheat ear segmentation and an R
2 of 0.815 for scab detection, outperforming traditional depth-guided methods that rely on stereo cameras or LiDAR. In comparison, our method only requires images captured by conventional RGB cameras, significantly reducing hardware costs while avoiding the complex processes of multi-sensor calibration and point cloud computation, thereby improving detection efficiency. Through these algorithmic innovations, this research not only proposes a low-cost, highly feasible precision agriculture solution but also makes significant algorithmic contributions to the field of depth-guided crop and plant segmentation.
2. Materials and Methods
2.1. Field Experiment
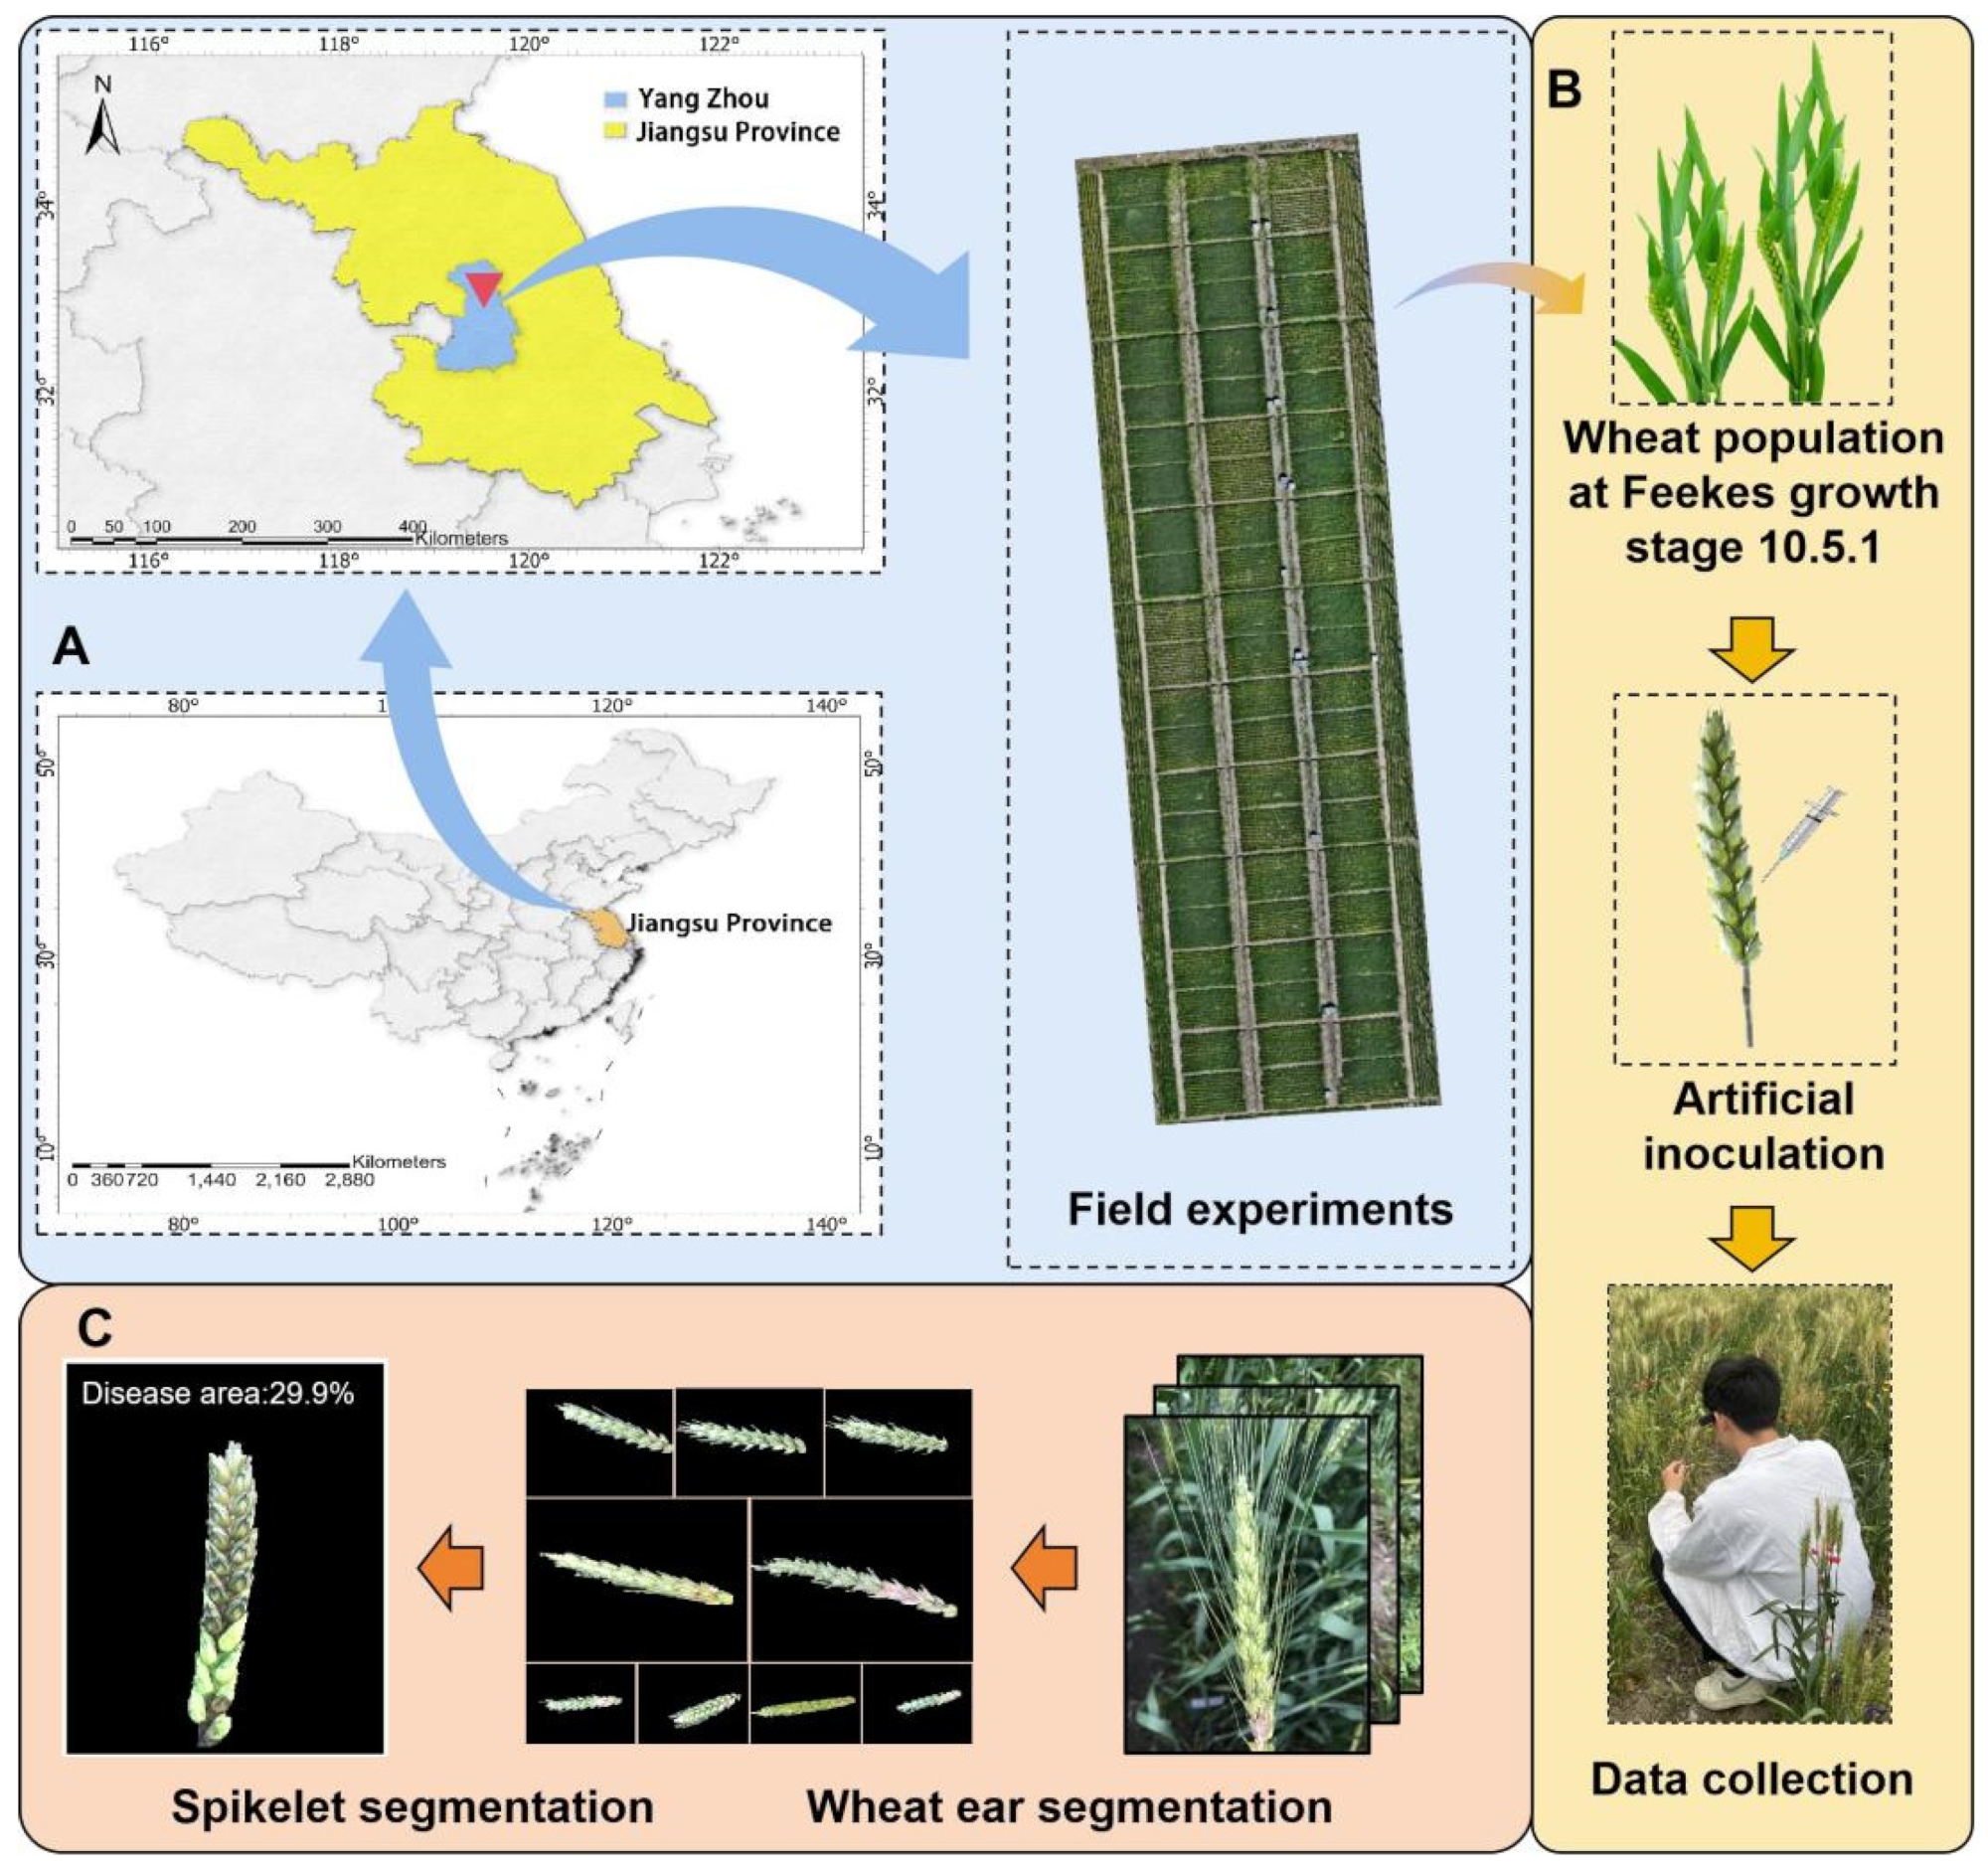
The experiment was conducted from October 2023 to June 2024 at the experimental fields of the Jiangsu Provincial Key Laboratory of Crop Genetics and Physiology, Yangzhou University, located in Yangzhou, Jiangsu Province, China (119°42′ E, 32°38′ N). The site is characterized by a northern subtropical monsoon climate, with an annual average temperature of 13.2 °C to 16.0 °C, annual precipitation of 1518.7 mm, and an annual sunshine duration of 2084.3 h. The soil is classified as light loam, with the 0–20 cm layer containing 65.81 mg kg−1 of hydrolyzable nitrogen, 45.88 mg kg−1 of available phosphorus, 101.98 mg kg−1 of available potassium, and 15.5 g kg−1 of organic matter.
Over twenty winter wheat varieties (lines) commonly grown in the middle and lower Yangtze River region were selected as experimental materials. A randomized block design was adopted, with each line sown in five rows measuring 2 m in length and spaced 0.2 m apart. Each row was uniformly sown with 30 seeds, and each variety was replicated three times (
Figure 1A).
FHB was induced using the single-floret injection method to artificially inoculate the wheat lines. A mixture of highly virulent Fusarium strains (F0301, F0609, F0980) was used as the inoculum. These strains were first cultured on PDA plates at 25 °C for 5–7 days to ensure hyphal purity and viability. They were subsequently transferred to liquid medium and incubated under constant shaking at 25–28 °C for 3 days to prepare the spore suspension. Spore concentration was determined using a hemocytometer and adjusted to 1 × 10
5/mL, followed by mixing the three strains in equal volumes (1:1:1). At Feekes growth stage 10.5.1, twenty wheat spikes at a uniform developmental stage were selected, and 10 μL of the spore suspension was injected into a single floret at the center of each spike using a syringe. Artificial misting was applied immediately after inoculation to maintain humidity (
Figure 1B).
2.2. Image Acquisition of Single-Spike Scab
Image acquisition was carried out from the time of FHB inoculation until Feekes growth stage 11.1 (early grain-filling stage). The imaging device selected for this study was a pair of AR smart glasses, a choice justified by the requirement for a mobile, hands-free data acquisition system that mimics a natural plant inspection scenario while ensuring high image quality. The specific model used was a pair of AR smart glasses equipped with a high-resolution camera (Changzhou Jinhe New Energy Technology Co., Ltd., Changzhou, China), with a maximum resolution of 2448 × 3264 pixels (Telephoto Camera, 8 MP, 5× optical zoom, 120 mm focal length). The device features voice control and autofocus capabilities, and image data were transmitted to a server via a mobile phone with cellular connectivity using the Wi-Fi protocol.
Data collection was conducted between 10:00 and 14:00 under natural light conditions to ensure high image quality and accurate color fidelity. The specific procedures for image acquisition were as follows:
- (1)
The operator gently holds the wheat stem with one hand to stabilize the target plant.
- (2)
The target spike is positioned 30–50 cm from the camera lens to ensure an appropriate field of view.
- (3)
The spike is centered within the frame and oriented perpendicular to the camera.
- (4)
Autofocus and image capture are triggered via voice command or by lightly tapping the touch-sensitive module on the side of the glasses frame. This hands-free operation minimized camera shake and ensured consistent framing across different samples.
Approximately over 30 images of FHB-infected wheat ears were collected for each test variety. After image acquisition, all images are manually reviewed. Those that are blurry, overexposed, severely occluded or have frame differences are excluded as they are not suitable for analysis. In addition, overly repetitive images are also removed. A total of 300 most representative images of different varieties, different times and different degrees of disease were retained, forming the basic dataset for subsequent digital image analysis and model training. In addition, 200 images were collected in the same way in another experimental field about 10 km away to construct the final validation dataset for FHB detection, to ensure that there are environmental and variety differences from the base dataset.
2.3. Wheat Ear Segmentation
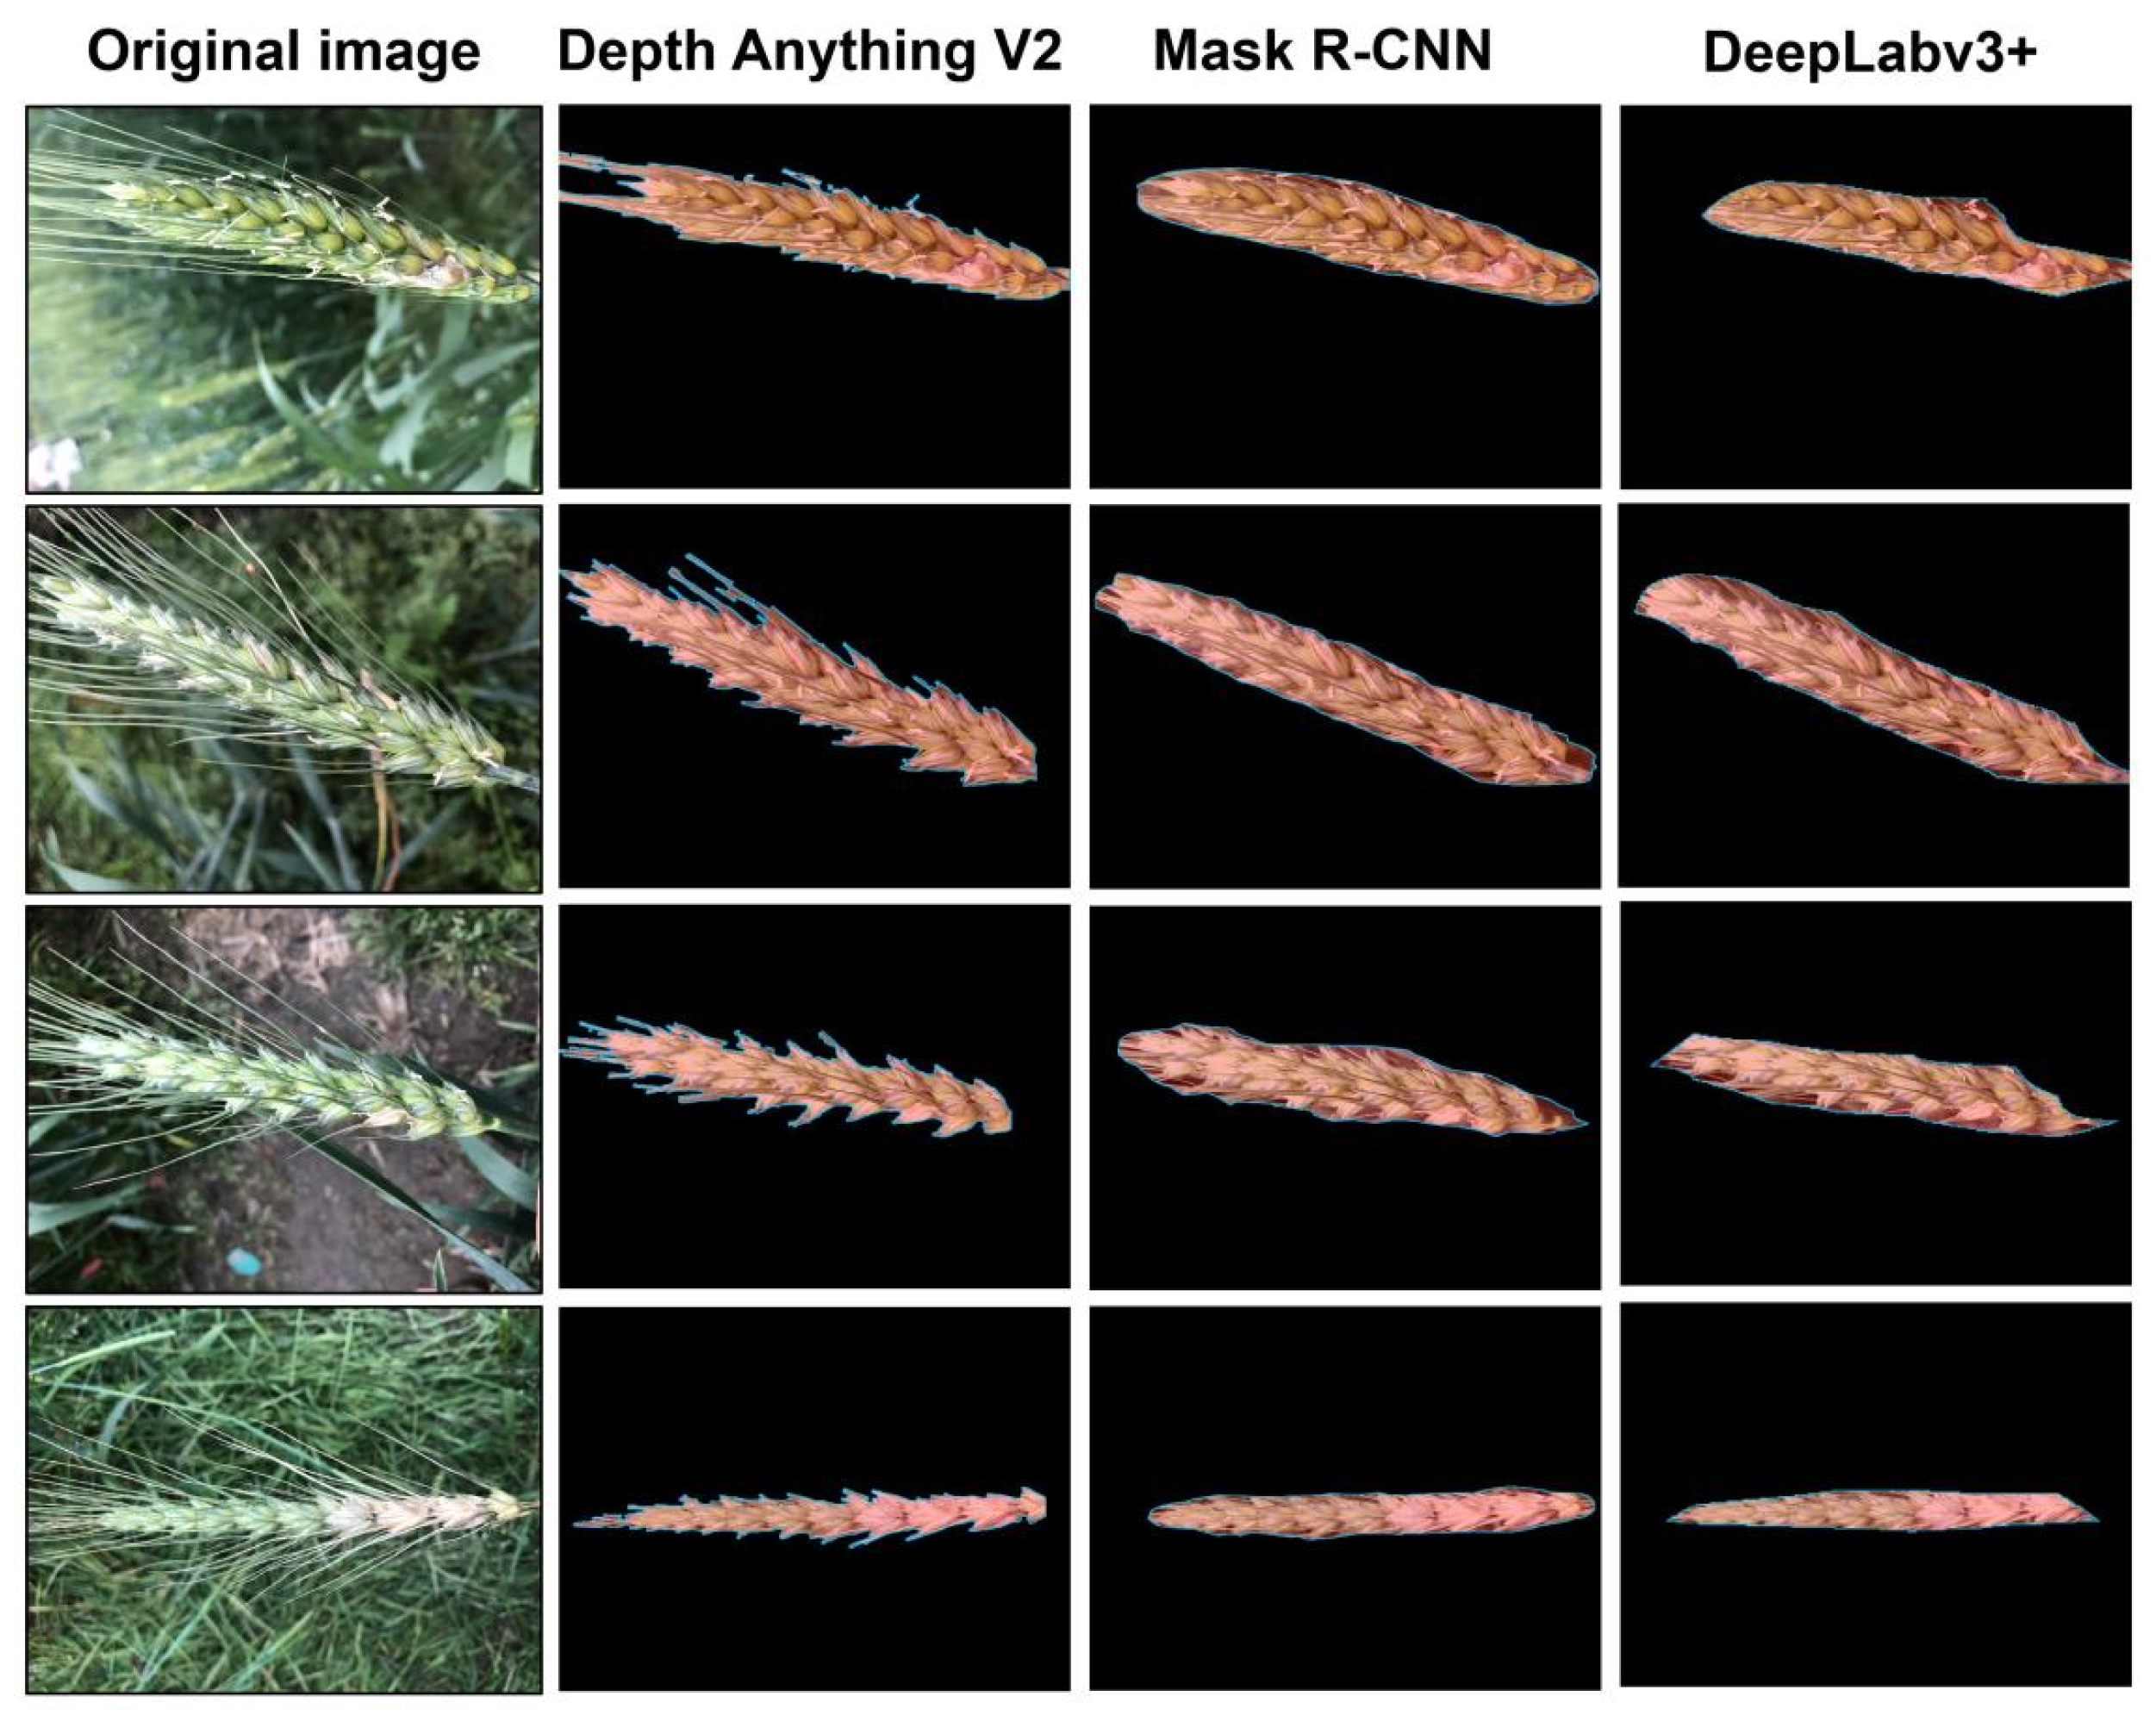
This study employed three distinct deep learning models—Depth Anything V2, DeepLabv3+, and Mask R-CNN—to segment FHB-infected wheat spikes and eliminate background interference. Depth Anything V2 is a depth estimation model that performs segmentation based on reconstructed depth information, whereas DeepLabv3+ and Mask R-CNN are computer vision models that segment wheat spikes by directly identifying them within RGB images.
2.3.1. Depth Estimation Model
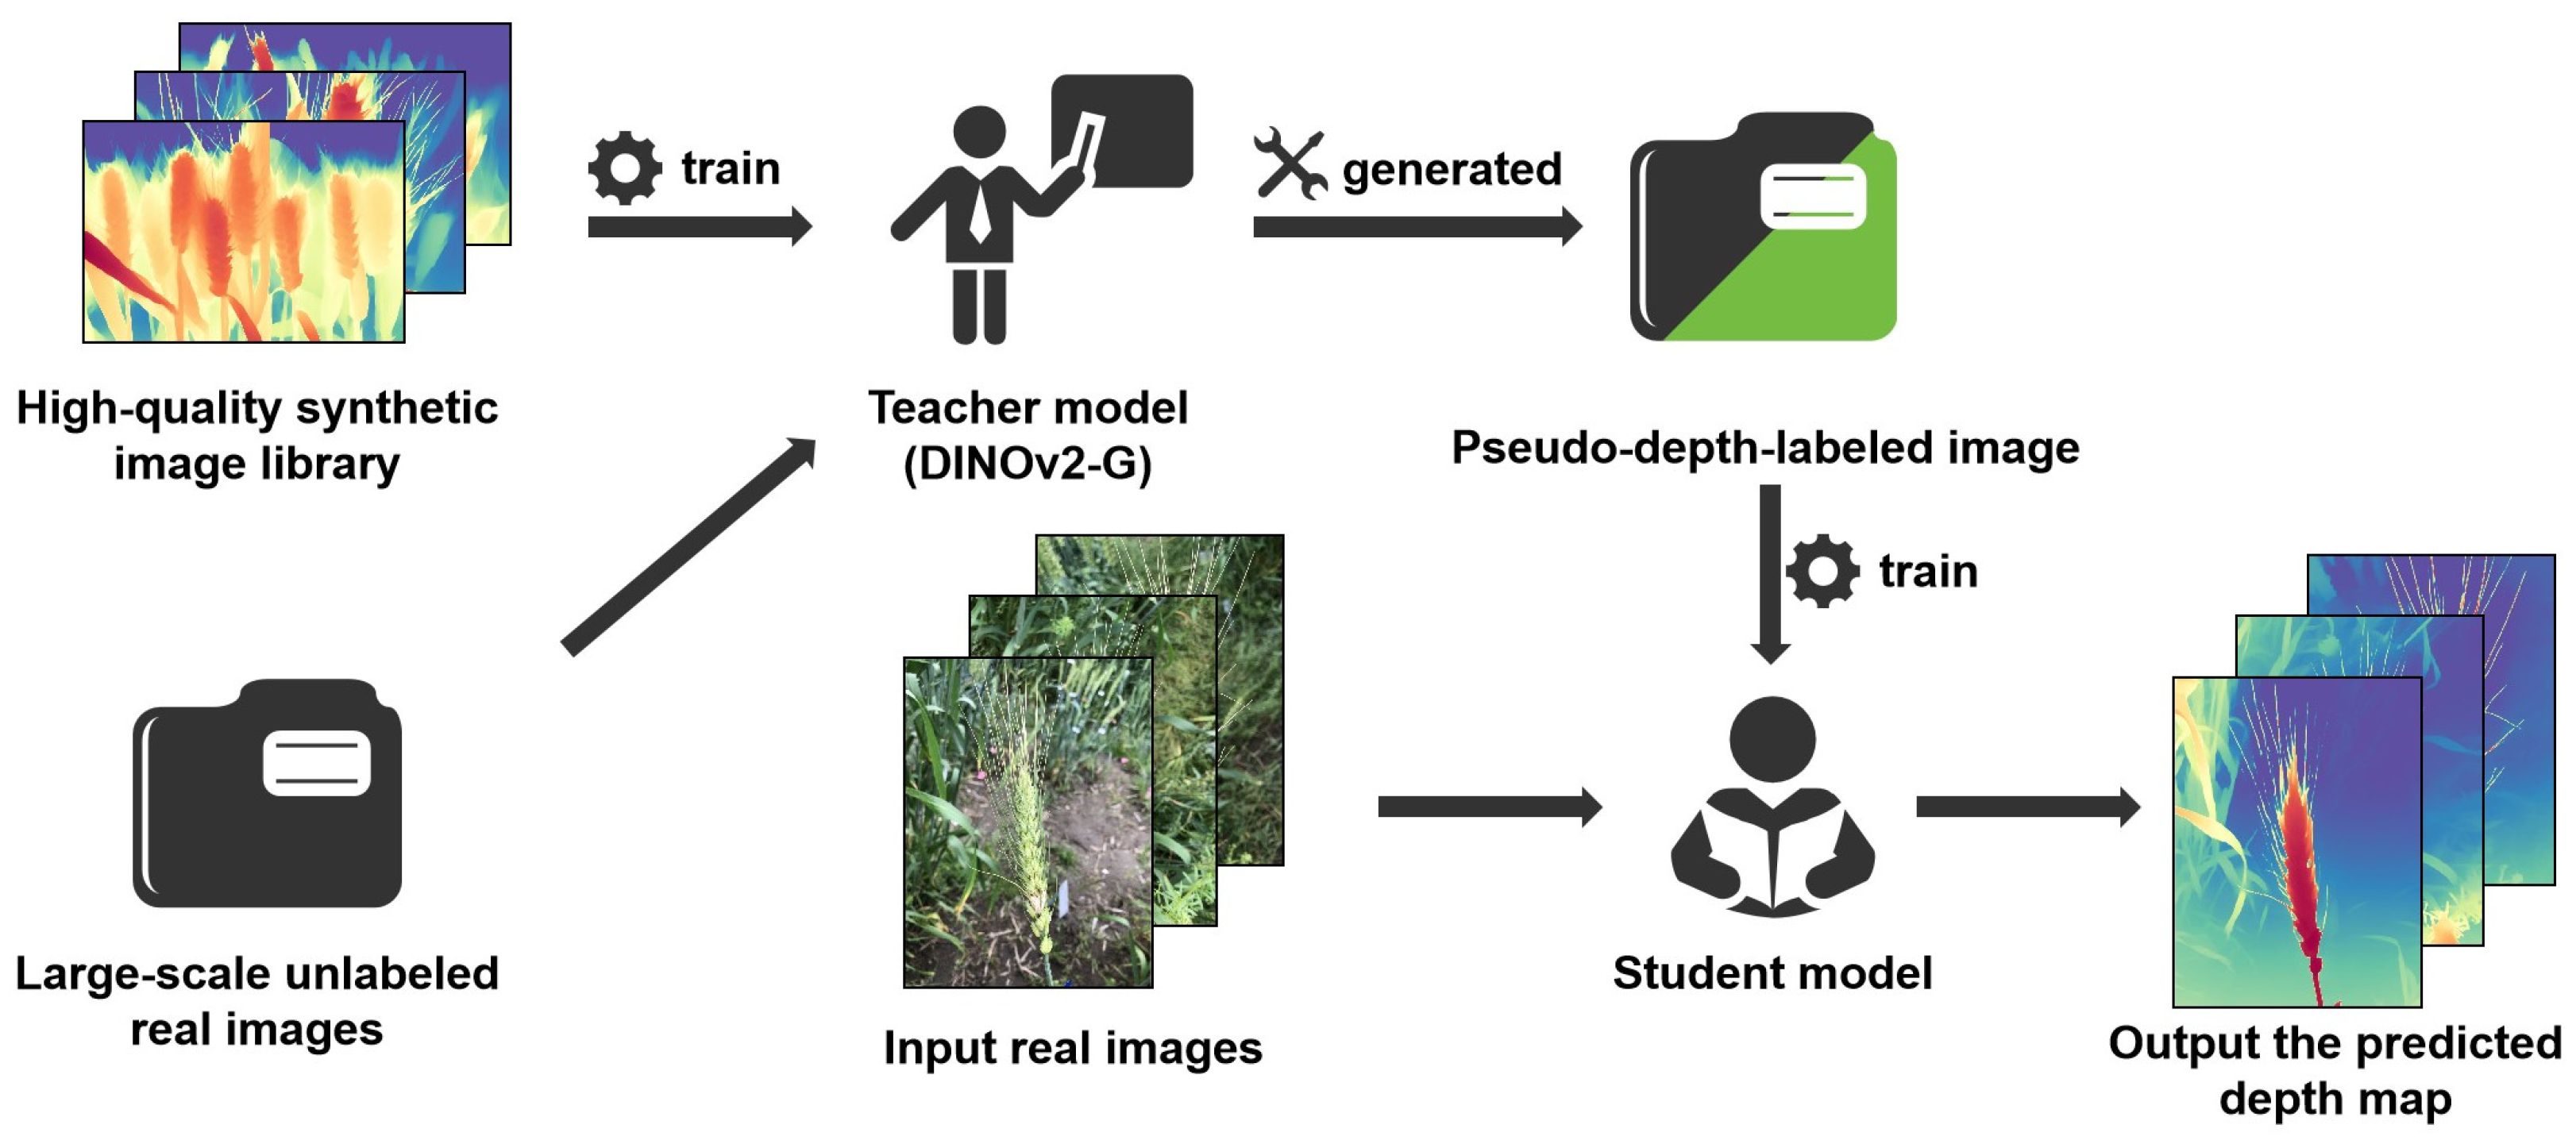
Depth Anything V2 is a high-performance monocular depth estimation model designed to infer the 3D structure of a scene from a single image. The model is trained using a large corpus of synthetic images to develop a DINOv2-G-based teacher model, which in turn supervises the student model through large-scale pseudo-labeled real-world images as a bridging dataset (
Figure 2). This training strategy enables strong generalization, allowing the model to perform robustly even when applied to plants with complex and variable morphological structures [
19].
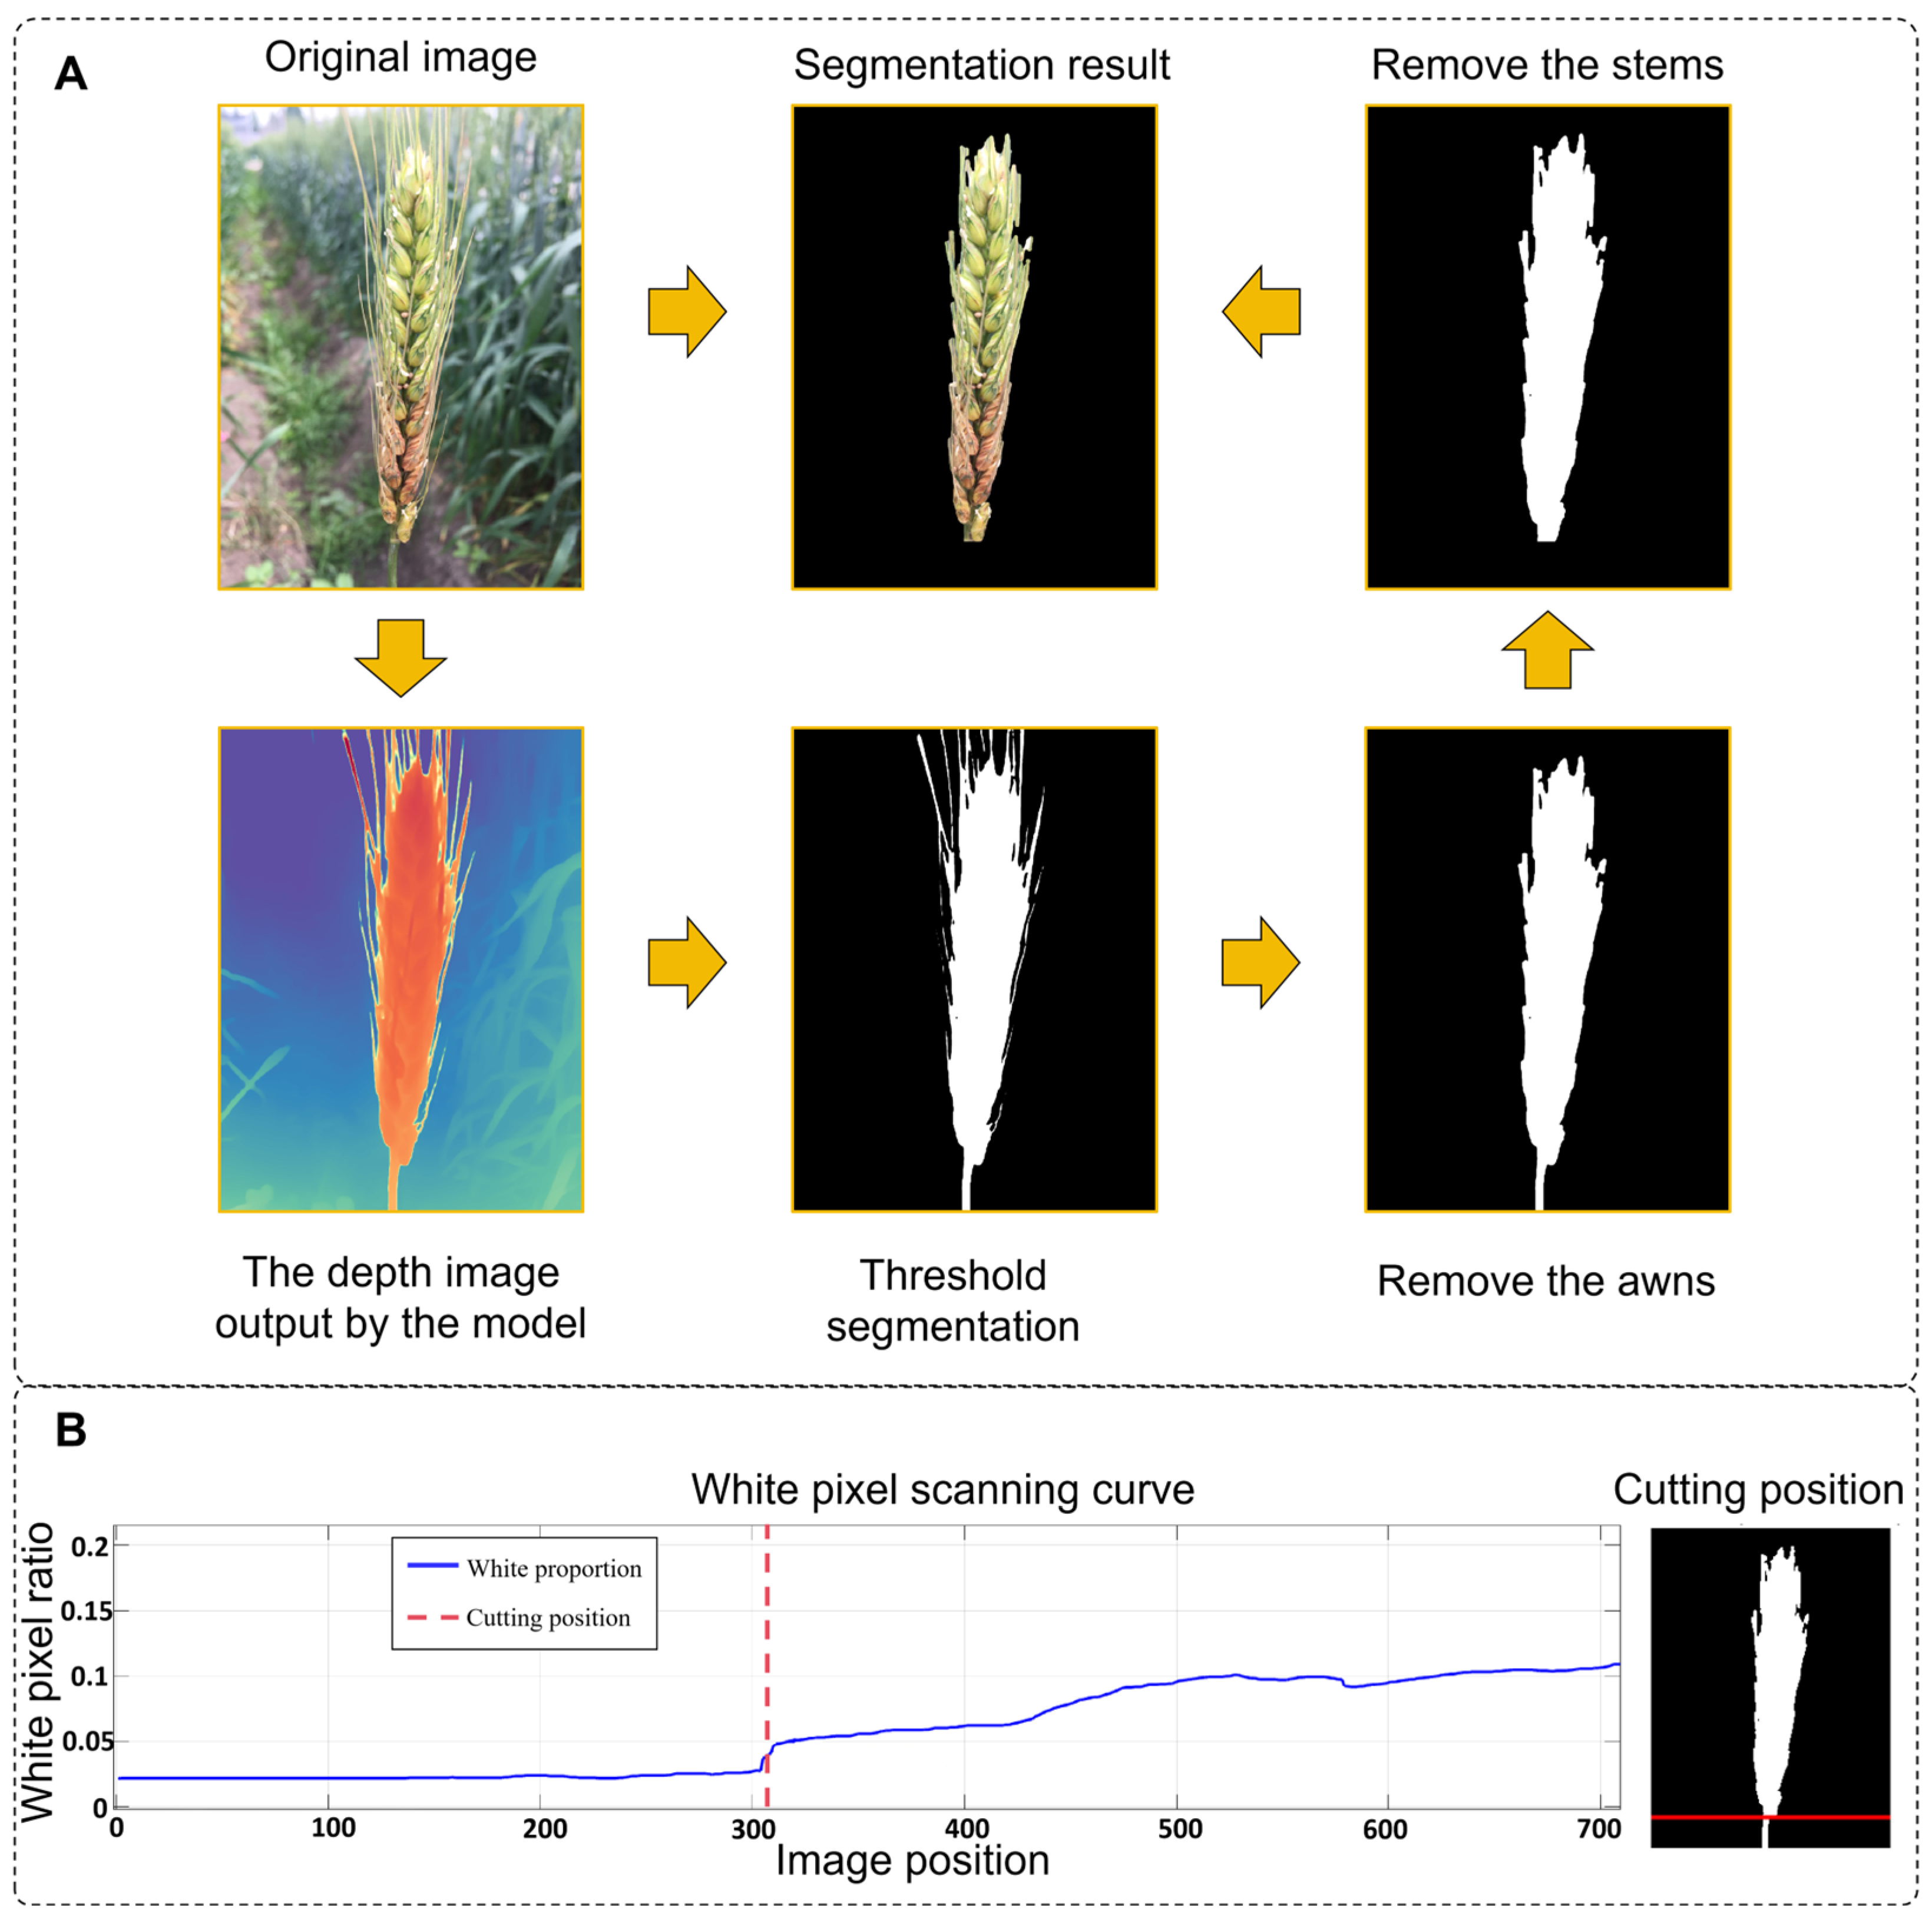
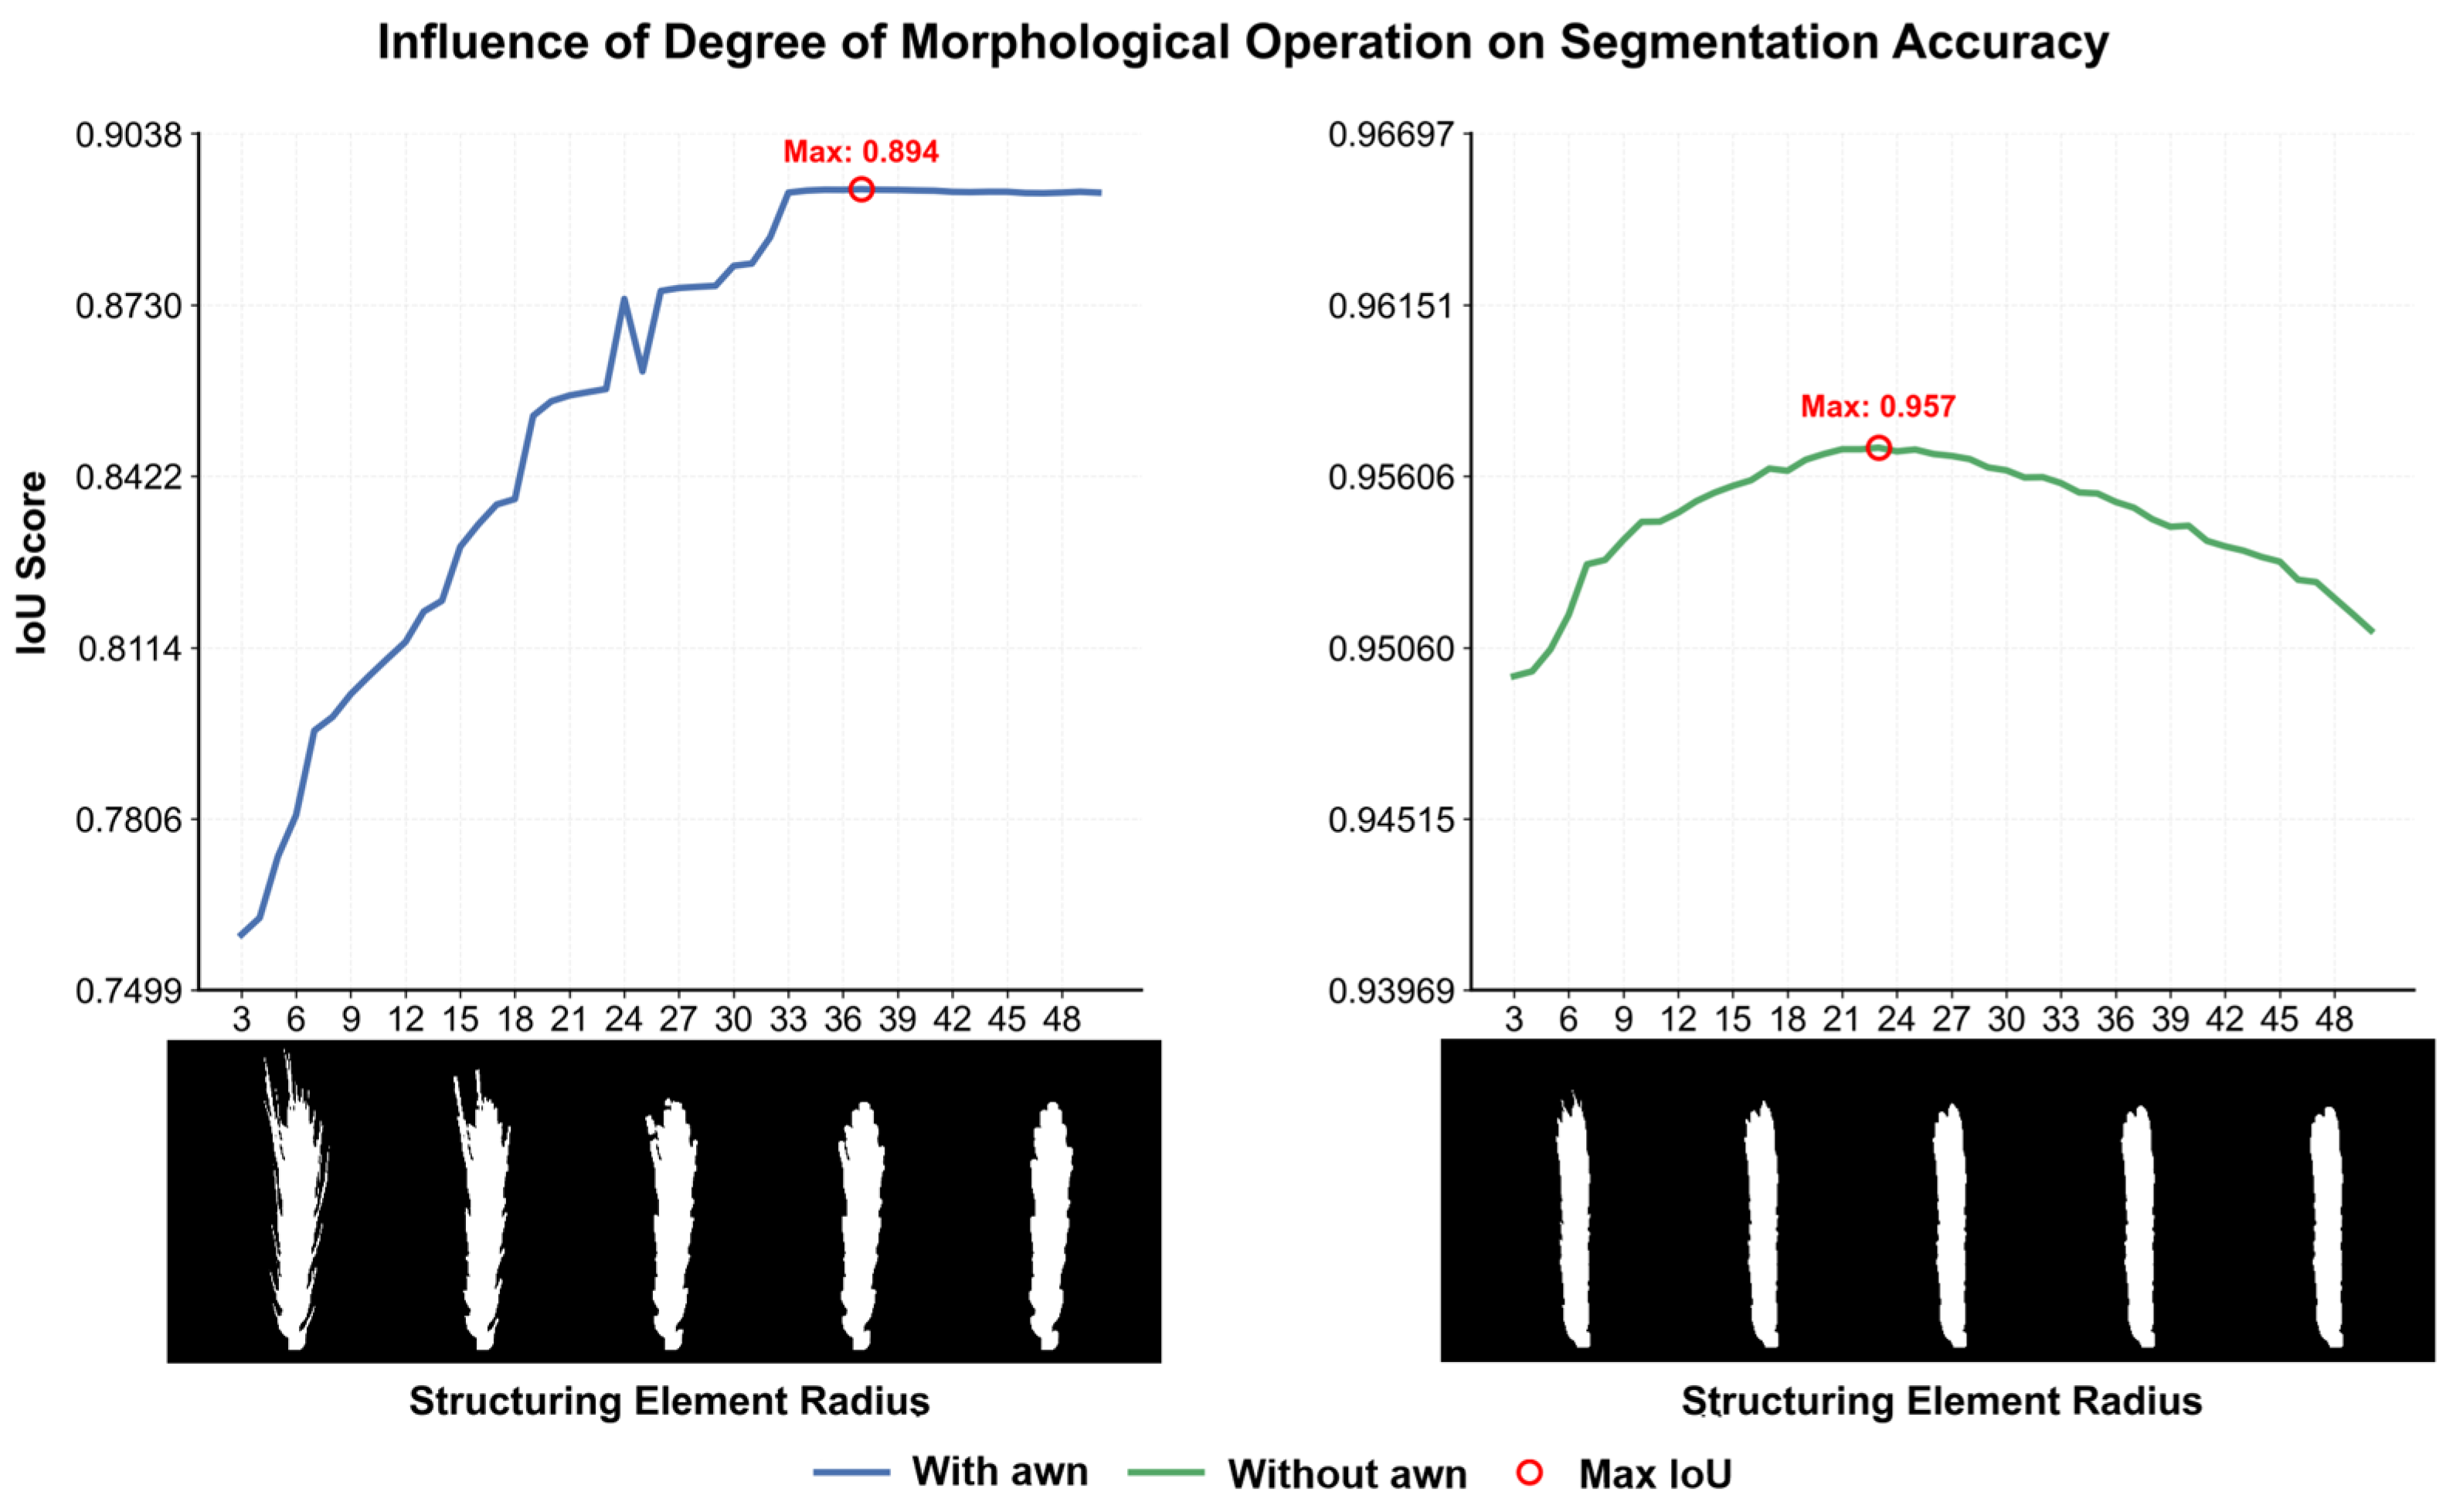
For robust wheat ear segmentation under challenging field conditions (e.g., occlusion, varying illumination), we used the pre-trained Depth-Anything-V2 model without fine-tuning. The model produces a depth map in which pixel intensity reflects the estimated distance from the camera. The optimal binarization threshold was empirically set to 50% of the maximum depth value, determined through a grid search over a validation set with thresholds ranging from 30% to 70%. Performance was evaluated using the Dice coefficient and false positive rate. The 50% threshold provided the best balance, minimizing both background inclusion (common at lower thresholds) and mask erosion (prevalent at higher thresholds), thereby maximizing overall segmentation accuracy. The resulting binary mask often contained non-target structures such as awns and stems. To address this, a morphological opening operation was applied using a circular structuring element with a radius of 15 pixels, selected as the optimal value from a tested range of 5 to 25 pixels based on a parameter sensitivity analysis. This radius was found to be the smallest size capable of effectively removing most awns while causing negligible erosion to the central region of the wheat ear. Smaller radii were ineffective in awn removal, whereas larger radii led to noticeable distortion of the ear morphology. Finally, connected component analysis was employed to filter out any residual noise.
However, for wider stems, excessive morphological erosion and dilation can lead to the loss of critical edge information from the wheat spike. To address this, a stem localization method based on abrupt changes in width is proposed. The procedure is as follows (implemented in MATLAB R2024a/Python 3.8):
- (1)
Edge scanning: The spike mask is scanned row by row from the edge near the base of the spike toward the opposite side, recording the mask width as the number of white pixels in each row.
- (2)
Abrupt change detection: A threshold for the rate of width change is defined, and a sudden increase in row width is used to identify the junction between the spike and the stem.
- (3)
Precise cropping: The mask on the spike side is retained, while the stem side is masked with black pixels to remove the stem region.
2.3.2. Semantic Segmentation Model
We employ two benchmark models: DeepLabv3+ for semantic segmentation and Mask R-CNN for instance segmentation. The core of DeepLabv3+ lies in its atrous convolution and ASPP module, which capture multi-scale contextual information for accurate pixel-level classification [
20]. Mask R-CNN, whereas, introduces RoIAlign to preserve spatial precision, allowing it to not only classify pixels but also separate individual objects, such as distinct wheat spikes in a cluster, proving superior in handling occlusion [
21].
To train these two models, we divided the base dataset into a training set (50%), a validation set (25%), and a test set (25%), ensuring that the same variety only appeared in the same type of dataset. We also performed data augmentation on each part, including operations such as rotation (±90°), horizontal and vertical flipping, and Gaussian blur, to expand the dataset. Throughout the entire annotation process, the consistent definition of wheat ears was strictly followed: only the ear body was marked, and the awns and stem segments were clearly excluded. According to this criterion, the wheat ear area was manually labeled using LabelMe software to generate polygonal masks, which were then used to train the DeepLabV3+ and Mask R-CNN networks. During the training process, adjust hyperparameters such as the learning rate, batch size, and the number of iteration rounds. In the prediction stage, the raw segmentation probability maps generated by the trained model often exhibit coarse boundaries. To address this, we introduced a post-processing step incorporating Conditional Random Field (CRF) and Graph Cut (GC). This step does not alter the model’s internal parameters but operates on its output. The CRF model leverages color and spatial consistency to refine pixel-level labels, while the GC algorithm globally optimizes the boundary placement. This combination effectively enhances the continuity of segmentation masks and the accuracy of detail representation, transforming the model’s probabilistic outputs into sharp, high-quality final results.
Table 1 provides detailed parameters and Settings for model training and inference.
2.4. Color Feature Extraction
FHB-infected spikelets are characterized by water-soaked lesions that appear yellow in the early stages and later turn brown, exhibiting a distinct color contrast compared to healthy spikelets [
22]. Drawing on prior research [
23,
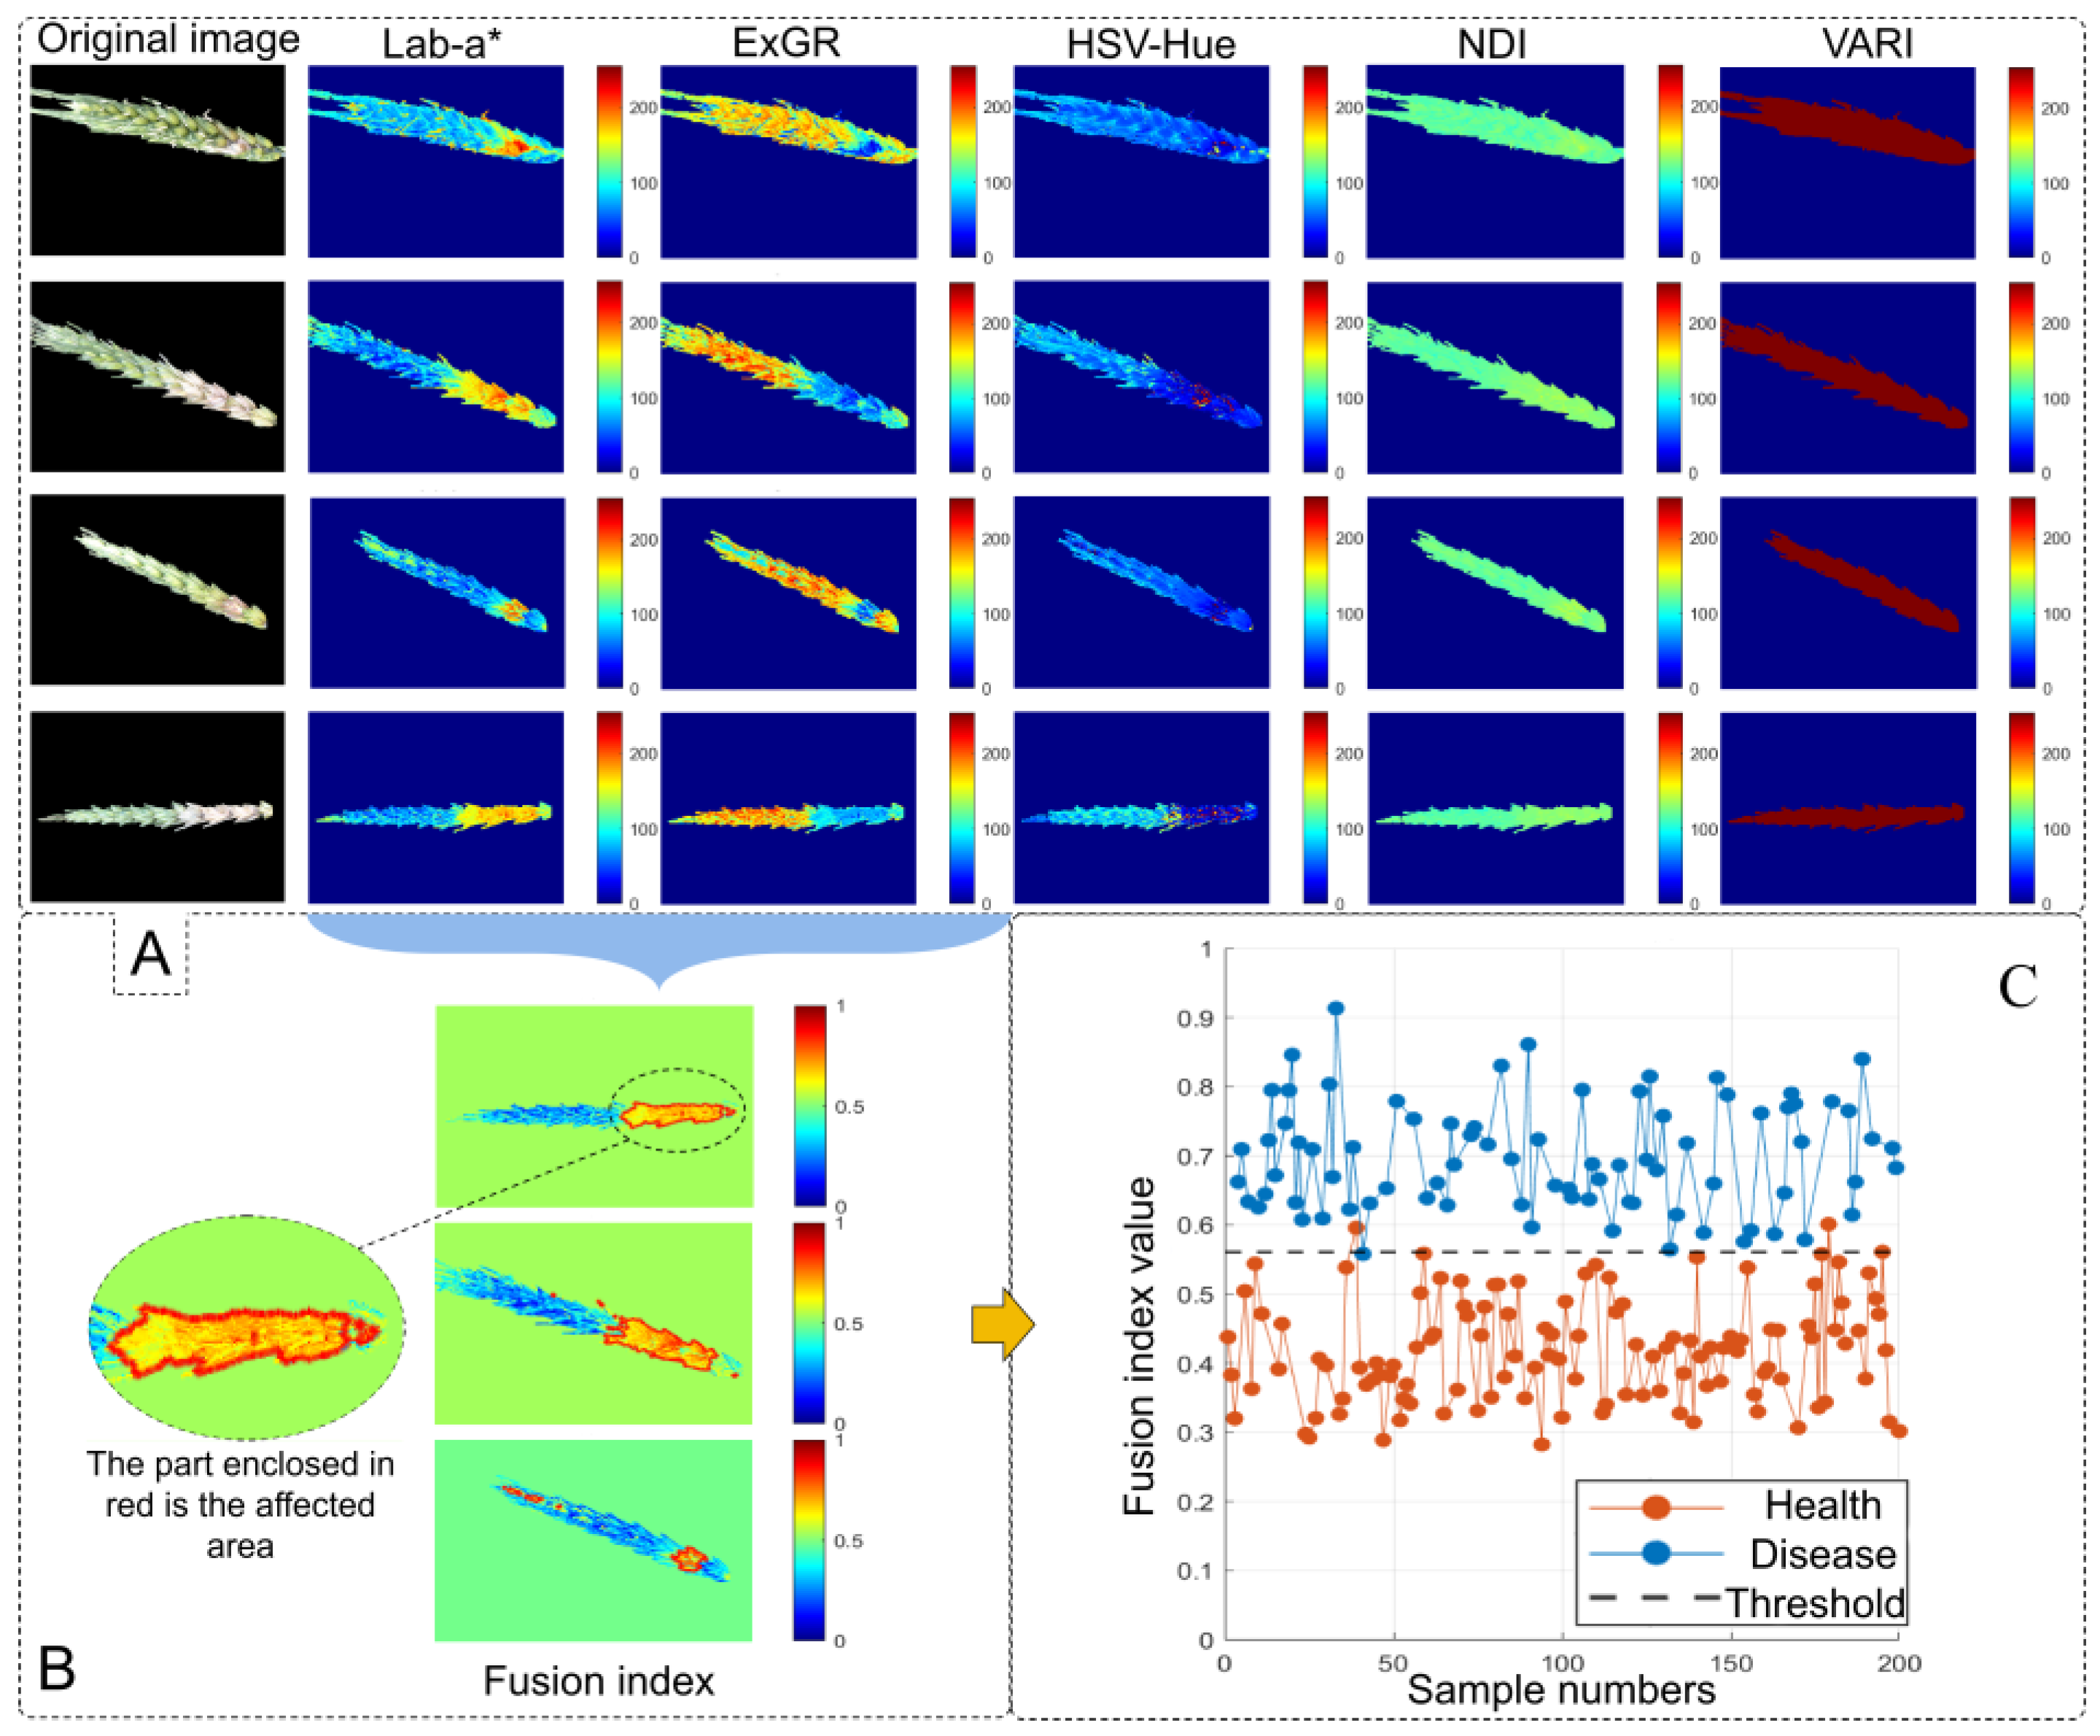
24], we compared infected and healthy spikelets across the RGB color space, the Saturation and Value components of the HSV color space, the CIELAB (LAB) color space, and three color indices: Excess Green–Excess Red difference (ExGR) [
25], Normalized Difference Index (NDI) [
26], and Visible Atmospherically Resistant Index (VARI) [
27]. To enhance discriminatory power, a fused index was developed by integrating ExGR with the Lab-a* component. The formulas used to calculate each color index are as follows:
where
,
, and
denote the digital number (DN) values of the red, green, and blue channels in the image.
2.4.1. HSV Color Space Conversion
In color-based visual perception tasks, the HSV color space is widely adopted for its capacity to decouple color attributes, making it more consistent with the cognitive mechanisms of the human visual system and markedly distinct from the conventional RGB model [
28]. The conversion formulas from RGB to HSV are as follows:
where
,
, and
represent the normalized red, green, and blue components, each ranging from 0 to 1;
and
correspond to saturation and value (brightness), also within the range [0, 1];
denotes hue, with values ranging from 0 to 360°.
2.4.2. LAB Color Space Conversion
LAB is a color model grounded in human visual perception and provides distinct advantages for tasks such as precise color quantification, cross-device color consistency, and visual quality assessment. Direct conversion from the RGB color space to LAB is not possible; instead, the transformation must proceed through the intermediate XYZ color space—first from RGB to XYZ, followed by conversion from XYZ to LAB [
29]. The corresponding conversion formulas are as follows:
where
denotes lightness, with values ranging from 0 to 100;
represents the green–red axis, ranging from –128 to 127; and
represents the blue–yellow axis, also ranging from –128 to 127.
,
, and
represent the reference white values for the respective parameters.
2.4.3. Dynamic Index Fusion
To balance visual distinguishability and segmentation accuracy, this study employs a dynamic index fusion strategy. Based on the severity of infection—manifested as variations in red and yellow pixel intensities within the wheat spike region—the weights of different indices are dynamically adjusted to minimize segmentation error. The specific weighting formula is as follows:
where
denotes the proportion of red–yellow pixels;
is the total number of pixels within the wheat spike region;
represents the set of pixel coordinates in the spike region;
is the HSV hue value of pixel (x, y), normalized to the range [0, 1];
is the indicator function (equal to 1 if the condition is met, and 0 otherwise);
is the fusion weight assigned to the Lab-a* value;
is the fusion weight for the inversely normalized ExGR index; and
is the parameter controlling the range of weight variation.
2.5. Evaluation Metrics
2.5.1. Wheat Spike Segmentation
To assess the performance of wheat spike extraction, six evaluation metrics were employed: Accuracy, Precision, Recall, Specificity, Intersection over Union (IoU), and F1 Score. All metrics were calculated at the pixel level. The corresponding formulas are as follows:
where True Positive (TP) denotes the number of wheat spike pixels correctly classified as spike; False Negative (FN) refers to the number of spike pixels incorrectly classified as background; False Positive (FP) represents the number of background pixels incorrectly classified as spike; and True Negative (TN) indicates the number of background pixels correctly classified as background.
2.5.2. Wheat FHB Detection
In addition, R
2, RMSE, and Cohen’s Kappa (k) coefficient were used to evaluate the accuracy of infected area extraction. The corresponding formulas for each metric are as follows:
where
represents the number of samples;
is the true value of the i-th sample;
is the predicted value of the i-th sample; and
is the mean of all true values. Observed Agreement (
) denotes the proportion of samples for which the predicted severity level exactly matches the true severity level. Expected Agreement by Chance (
) refers to the proportion of agreement expected by random chance, calculated based on the marginal distributions of severity levels in both the ground truth and the predicted labels.
2.6. Severity Calculation
Severity is a commonly used metric for quantifying the extent of disease occurrence. In this study, it is defined as the ratio of the infected spikelet area to the total spikelet area. The corresponding calculation formula is as follows:
where
denotes the severity index for an individual wheat spike;
represents the number of pixels corresponding to infected spikelets; and
represents the number of pixels corresponding to healthy spikelets.
Severity grading is commonly used to assess the extent of disease development. In this study, grading criteria were quantitatively established by examining the size of infected spikelets and entire spikes across different wheat varieties under varying levels of infection. All samples were classified into five severity levels (0–4) according to the Chinese national standard GB/T 15796-2011 Technical Specification “
https://www.sdtdata.com/fx/fmoa/tsLibCard/125622.html (accessed on 15 May 2024)” for the Monitoring and Forecasting of FHB in Wheat. The severity levels and corresponding symptom descriptions are presented in
Table 2.
4. Discussion
4.1. Method Efficacy and Comparative Analysis
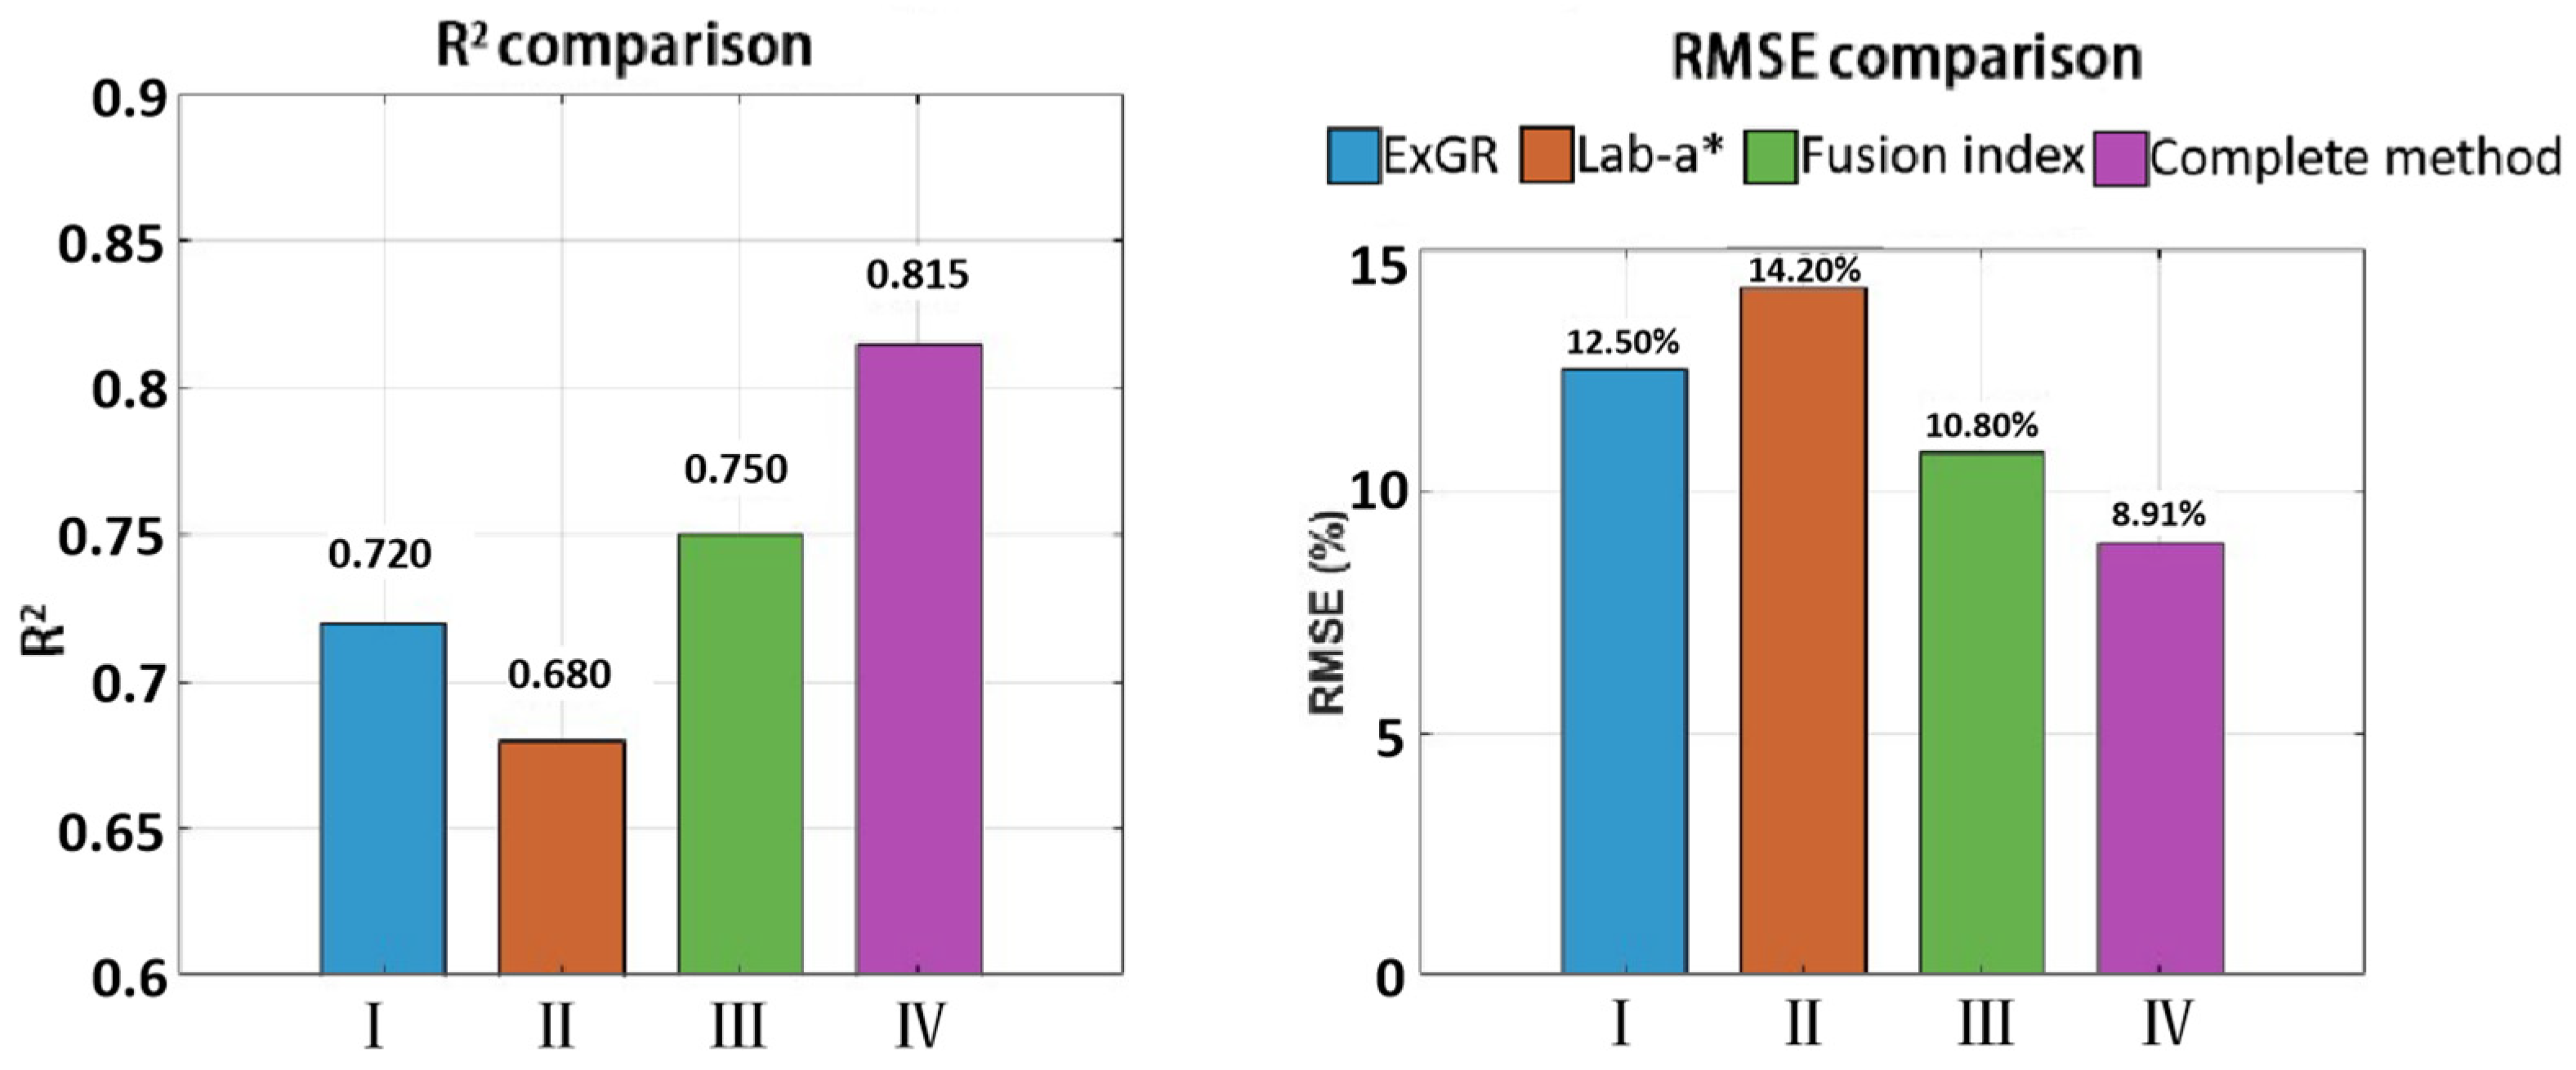
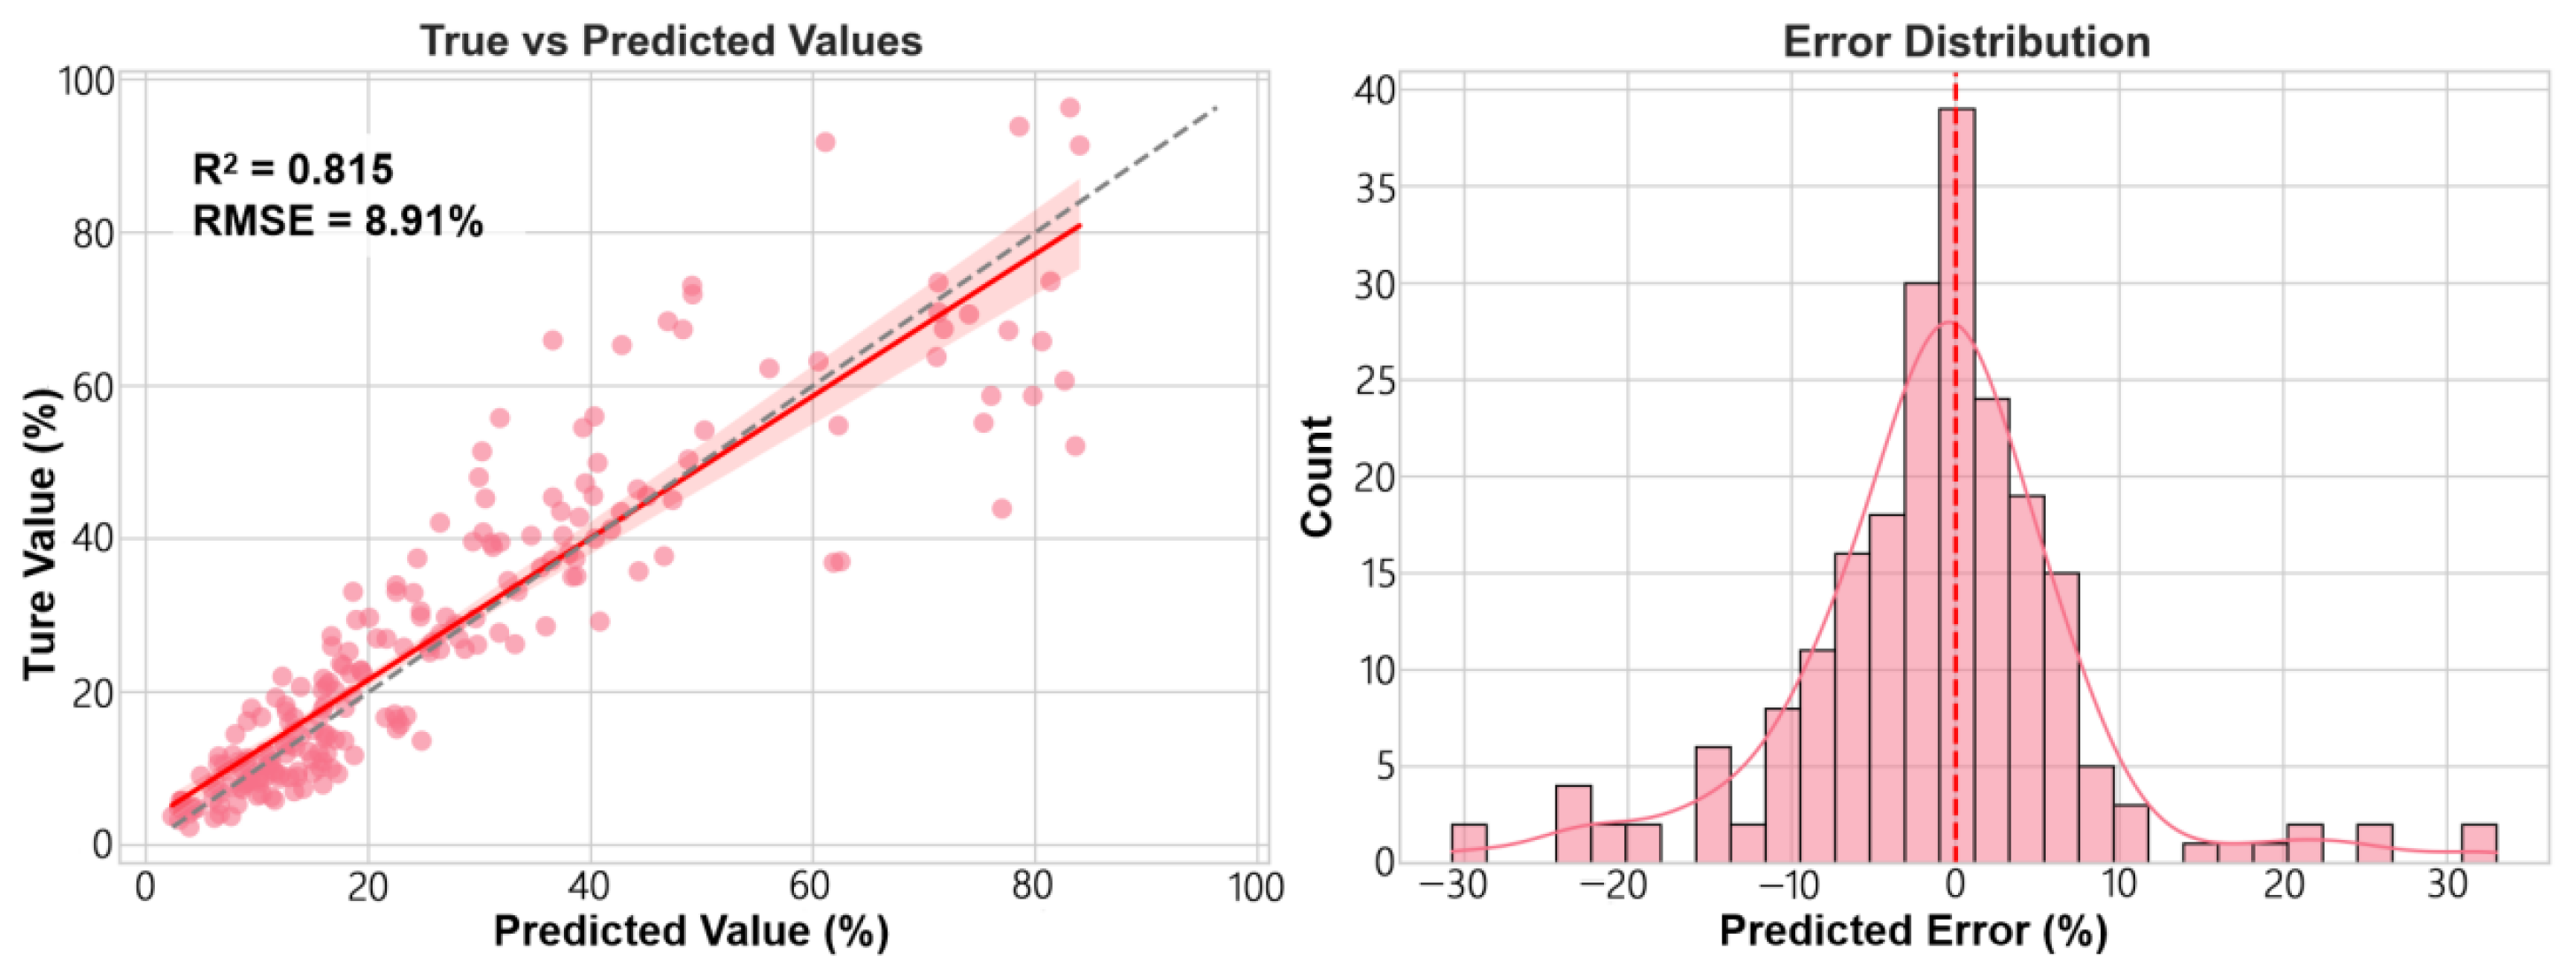
This study successfully established a framework integrating monocular depth estimation with dynamic color index fusion, achieving high-precision segmentation of wheat spikes in field conditions (IoU = 0.878) and accurate quantitative assessment of FHB severity (R
2 = 0.815), all without the need for annotated data training. Similarly to this study, many existing methods also focus on wheat spike segmentation and model development [
30,
31]. Zhang et al. [
32], based on hyperspectral data from wheat canopies, selected the optimal model from nine candidates and developed two new types of indices combined with model fusion, achieving a wheat FHB detection accuracy of 91.4%. Francesconi et al. [
33] utilized UAV-based TIR and RGB image fusion alongside spike physiological data, such as molecular identification of the FHB pathogen, to achieve precise FHB detection in field environments. However, the aforementioned methods, operating under natural field backgrounds, cannot extract information from individual spikes and can only obtain the disease incidence rate at the population level. Wang et al. [
34] used structured light scanners mounted on field mobile platforms to acquire point cloud data of wheat spikes and employed an adaptive k-means algorithm with dynamic perspective and Random Sample Consensus (RANSAC) algorithms to calculate 3D data of the spikes. This approach is similar to ours in utilizing three-dimensional data for analyzing spike morphology. Nonetheless, the complexity of acquiring point cloud data may significantly limit its application. Qiu et al. [
35] used a Mask R-CNN model to segment collected wheat spike images and employed a new color index to identify diseased spikelets. Similarly, Liu et al. [
4] utilized an improved DeepLabv3+ model to segment RGB images and applied dynamic thresholds based on color indices for segmenting diseased spikelets. The rationale behind these methods aligns with that of our study, which involves first segmenting the wheat spikes and then detecting diseases based on the color differences between diseased and healthy spikelets. However, semantic segmentation models typically require large amounts of data for training to achieve satisfactory performance. The method proposed in this study addresses or circumvents the inherent bottlenecks of traditional approaches. Its convenient and efficient application strikes an excellent balance between accuracy and cost-effectiveness.
4.2. Practical Considerations and Robustness
Although the image processing and deep learning framework proposed in this study offers clear advantages in the high-throughput detection of FHB in wheat, its effectiveness is challenged under real-world field conditions. Factors such as canopy occlusion within wheat populations, weed interference, and variable illumination significantly affect detection performance [
36,
37,
38]. Additionally, variability in disease severity, cultivar-specific traits, and morphological differences among wheat varieties constitute critical sources of uncertainty [
39].
Robustness analysis indicates that our method’s uniform morphological post-processing for both awned and awnless wheat spikes imposes a non-negligible constraint on segmentation accuracy. The fundamental morphological differences between these two types mean that a single parameter set is suboptimal for both, which is a primary factor contributing to the performance gap. Consequently, implementing an adaptive post-processing mechanism that automatically tailors parameters based on spike morphological features (e.g., awn presence and density) presents a promising avenue for significantly enhancing accuracy. Although the difference in image accuracy does not affect the effectiveness of this scheme, it is still a factor restricting the final accuracy. To achieve the leap from “effective” to “precise”, subsequent research will focus on developing corresponding online calibration algorithms [
40,
41]. This algorithm can perform real-time error correction on the segmentation results based on the imaging characteristics of the equipment and the degree of scene degradation, thereby significantly enhancing the accuracy and consistency of this method in different practical scenarios.
In addition, illumination is a critical factor influencing the visual recognition accuracy of FHB in wheat. This study specifically examined the effects of strong direct sunlight and found that under such conditions, wheat spikes often exhibit significant overexposure, leading to whitening and color distortion of surface features [
42]. This effect is particularly pronounced in diseased areas. The adverse impact of intense lighting is primarily observed in two aspects: (1) Strong illumination obscures the characteristic pink mold layer associated with FHB, thereby diminishing the color contrast between healthy and infected tissues; and (2) excessive brightness blurs lesion boundaries, reducing overall recognizability. These effects contribute to the decreased accuracy of color index fusion methods under higher infection severity levels. The promising results of GAN-based approaches in mitigating similar issues in agricultural imagery, such as preserving detail under varying light and spectrum [
43] strongly support our proposal for future work. Specifically, integrating a learned illumination compensation module, inspired by these advances, represents a highly promising direction to enhance the resilience of our FHB detection framework against harsh sunlight conditions.
4.3. Innovative Contributions and Future Prospects
The fundamental innovation of this study lies in the establishment of a new crop phenotypic model, which is characterized by low implementation cost, minimal hardware dependence and high operational efficiency. This breakthrough was systematically demonstrated through three key contributions: methodologically, it was the first to comprehensively apply advanced monocular depth estimation to wheat ear segmentation, effectively replacing expensive stereo vision systems while maintaining high precision; Technically, a dynamic weighting mechanism for perceiving the degree of infection has been incorporated to achieve intelligent fusion of image color features, significantly enhancing environmental adaptability. Practically, it offers a quasi-plug-and-play solution, significantly reducing the technical barriers to on-site deployment. It is particularly worth noting that the proposed technical framework integrates “depth-guided segmentation, geometrically optimized morphology and dynamic fusion enhanced recognition”, demonstrating significant portability in various agricultural scenarios.
Looking ahead, we plan to further integrate the method proposed in this paper into the local system of AR glasses to achieve real-time, end-to-end crop monitoring and recognition capabilities, and further enhance the response speed and practicality of the system in field applications. In addition, our research agenda will focus on four strategic directions to advance this technology: first, developing deep learning-powered adaptive morphological processing algorithms to improve generalization capability across diverse spike architectures; second, constructing illumination-invariant feature representation modules to ensure robust performance under varying field conditions; Third, developing a more refined dedicated model for the segmentation of wheat scab to enhance the environmental adaptability of this scheme. Finally, through the technical path of multi-platform integration, explore an automated acquisition scheme suitable for the detection of grain size in ears. Through these coordinated innovations, we anticipate providing an integrated technical solution for achieving unmanned, intelligent, and precision-oriented crop disease monitoring in modern agriculture, thereby contributing substantial technical support for global food security initiatives.
