Article

Dynamics of Soil Organic Carbon Mineralization Under Straw Addition: Evidence from a Controlled Incubation Experiment

1
College of Forestry, Gansu Agricultural University, Lanzhou 730070, China
2
Gansu Provincial Key Laboratory of Arid Land Crop Science, Gansu Agricultural University, Lanzhou 730070, China
3
College of Resources and Environmental Sciences, Gansu Agricultural University, Lanzhou 730070, China
4
Government Seed Farm Dhakkar, Agronomic Research Institute, Ayub Agricultural Research Institute, Faisalabad 38000, Pakistan
*
Author to whom correspondence should be addressed.
Agronomy 2025, 15(11), 2642; https://doi.org/10.3390/agronomy15112642
Submission received: 13 October 2025 / Revised: 14 November 2025 / Accepted: 15 November 2025 / Published: 18 November 2025
(This article belongs to the Section Soil and Plant Nutrition)

Abstract

Returning straw to the soil is increasingly recognized as a sustainable practice that enhances soil fertility and promotes carbon sequestration. However, it can also accelerate the decomposition of soil organic carbon (SOC) and CO2 emissions, raising concerns about carbon loss. This study aimed to clarify the biological and environmental drivers of SOC mineralization across soil depths in a semi-arid system. A 79-day incubation experiment was conducted using wheat straw applied at four rates (0, 3500, 7000, and 14,000 kg ha−1) to soils from 0–10, 10–20, and 20–30 cm. Cumulative CO2 release, SOC, dissolved organic carbon (DOC), and extracellular enzyme activities were quantified, and relationships were analyzed using correlation and structural equation modeling. Compared with the control, straw return increased cumulative CO2 emissions by 48–126%, SOC by 9–21%, and DOC by 17–32%. Enzyme activities of β-glucosidase and N-acetylglucosaminidase were 25–64% higher under straw treatments. Structural modeling revealed that enzyme activity had a stronger direct effect on SOC mineralization than chemical properties. These results support the co-metabolism theory, stimulating microbial metabolism to enhance both straw- and native-SOC decomposition. Overall, straw return improves nutrient cycling but increases CO2 emissions, underscoring the need for optimized management to balance soil fertility with carbon mitigation.

1. Introduction

China ranks among the world’s leading grain producers, generating a substantial volume of crop straw, which constitutes roughly one-third of the country’s total biomass resources [1]. Recent reports indicate that crop straw production reached 870 million tons in 2023, emphasizing the critical need for the sustainable utilization of this abundant resource [2]. Liang et al. [3] identified crop straw as a rich source of carbon (C), nitrogen (N), phosphorus (P), and various trace elements, highlighting its value as a renewable resource [4,5]. Effective management of straw through field return not only contributes significantly to mitigating global climate change but also helps reduce environmental pollution caused by straw burning. The practice of straw return has been shown to enhance soil organic carbon (SOC) levels and promote organic carbon sequestration [6,7]. SOC represents the largest terrestrial carbon reservoir, with its quantity and stability governed by the equilibrium between carbon inputs from external organic sources, such as crop straw, and carbon losses through SOC mineralization [8,9,10]. SOC mineralization refers to the microbially mediated decomposition of soil organic matter into CO2 and other products, representing a key process in sustaining the soil carbon balance [11]. Therefore, investigating SOC mineralization following straw incorporation is essential for advancing carbon peak and carbon neutrality objectives in this new era. SOC mineralization is evaluated by indicators of cumulative carbon dioxide (CO2) emissions. Most studies indicate that cumulative CO2 emissions increase after straw addition [12], a finding that can be verified through both field experiments and incubation experiments. Kan et al. [13] demonstrated through investigations of wheat–maize systems managed by no-till and straw incorporation that laboratory incubation techniques reliably mimic the effects of straw return on soil carbon mineralization processes. Additionally, studies by Li et al. [14] and Lang et al. [15] reported that increasing straw input during incubation led to elevated cumulative CO2 emissions, highlighting the direct relationship between straw addition rates and carbon mineralization. Fontaine et al. [16] reached the same conclusion, finding that straw addition can trigger higher CO2 emissions than the straw itself. The theory of co-metabolism can explain this [17]. Gan et al. [18] found that the same results were obtained across different types of straw. However, O et al. [19] found that the amount of straw addition has little to no effect on SOC mineralization under specific soil management conditions and high baseline carbon levels, where microbial activity was already limited by nutrient availability rather than carbon. This finding contrasts with the consensus that increasing straw inputs typically enhances soil carbon mineralization but highlights that the magnitude of this response can vary depending on soil type, existing organic matter content, and microbial nutrient limitations [20,21]. Therefore, discrepancies among studies likely arise from differences in experimental design and soil background characteristics. Furthermore, previous work has primarily focused on how SOC mineralization responds to varying straw quantities and types, often emphasizing observations from individual soil layers. As a result, these studies may not fully reflect the dynamics of SOC mineralization when accounting for the complexity of natural, multilayered soil environments.
In different soil layers, there are differences in organic carbon content, physicochemical properties, enzyme activities, and microbial activity. Existing research has demonstrated that these soil characteristics are important factors influencing SOC mineralization [20,21,22]. In addition, following the incorporation of straw into the soil, subsequent shifts in pH, total nitrogen, total phosphorus, and nutrient availability can further influence the rates of SOC mineralization [19,23,24,25,26,27]. Thus, it can be seen that the overall response of SOC mineralization to straw addition is a complex and multifaceted process. However, throughout the entire process of SOC mineralization, soil microorganisms play a key role, not only directly influencing the soil carbon mineralization process but also regulating the mineralization of SOC through the secretion of relevant enzymes [28]. Extracellular enzyme activities (EEAs) are reliable indicators of microbially driven SOC decomposition and exhibit high sensitivity to shifts in environmental conditions [29,30]. Cellulose—the dominant carbohydrate biopolymer globally—is broken down by enzymes such as β-glucosidase (BG) and β-cellobiosidase (CBH) [31]. In addition, the degradation of soil-derived organic nitrogen compounds, including proteins and chitin, principally depends on the catalytic actions of L-leucine aminopeptidase (LAP) and β-1,4-N-acetylglucosaminidase (NAG), respectively [32]. Consequently, even slight variations in key enzyme activities can exert a substantial influence on SOC mineralization at both global and long-term temporal scales [33].
Despite extensive research into the influence of straw return on SOC mineralization [34,35], most studies have focused on assessments within single soil horizons or used bulk soil analyses, neglecting the vertical heterogeneity in soil chemistry, active carbon fractions, and associated microbial processes. Consequently, there is limited understanding of the mechanisms regulating SOC mineralization at different depths—especially regarding how abiotic factors (such as pH, nutrient concentrations, organic carbon content, and dissolved organic carbon) and biotic processes (such as extracellular enzyme activities) interact within this framework. Gaining a mechanistic perspective on these drivers is crucial for predicting SOC turnover and managing the balance between carbon sequestration and loss in systems employing straw recycling.
Therefore, in this study, a 79-day incubation experiment was conducted using wheat straw as an exogenous carbon source, as this duration captures both the rapid initial phase of organic matter decomposition and the subsequent stabilization stage of soil carbon mineralization. The selected period aligns with previous incubation studies, which show that CO2 release and microbial activity tend to stabilize after approximately 70–80 days, allowing for a comprehensive assessment of short- and medium-term carbon transformation dynamics. The aims were: (1) to determine the impact of straw application on soil chemical properties, SOC, DOC, and enzyme activities across multiple soil layers; (2) to quantify corresponding changes in cumulative CO2 emissions with increasing straw additions; and (3) to disentangle the relative contributions of biological and environmental factors in driving SOC mineralization. We hypothesized that increasing straw addition rates (0, 3500, 7000, and 14,000 kg ha−1) would proportionally accelerate SOC mineralization by enhancing microbial activity and cumulative CO2 emissions, and that extracellular enzyme activities (EEAs) would account for a greater proportion of the variance in SOC mineralization (>50%) compared with soil chemical properties alone. Importantly, they suggest that while straw return enhances soil fertility, it may also intensify carbon losses, posing challenges for long-term carbon sequestration strategies in semi-arid agroecosystems.

2. Materials and Methods

2.1. Sampling and Preparation

Soil was sampled after the spring wheat harvest in July 2023 from three depth intervals: 0–10 cm, 10–20 cm, and 20–30 cm at the Dryland Farming Experimental Station in Dingxi, Gansu Province (35°28′ N, 104°44′ E). The site is situated in a mid-temperate, semi-arid zone at approximately 2000 m elevation, experiencing an average annual solar radiation of 591.9 kJ cm−2, a mean temperature of 6.4 °C, an annual evaporation of 1531 mm, and a rainfall of 390.9 mm. This region typifies rain-fed agriculture. The soil, classified as typical loess, exhibits a fine texture, uniformity, depth, and favorable water retention properties. Initial soil properties were determined for the 0–20 cm soil layer, which represents the primary plough layer of the site. The soil exhibited a pH of 8.13, soil organic carbon of 8.06 g kg−1, total nitrogen of 0.88 g kg−1, and available nitrogen of 0.77 g kg−1. Before use, soil was air-dried and passed through a 2 mm sieve to remove roots, stones, and macrofauna fragments. Wheat straw used in this study was collected after harvest, oven-dried at 60 °C to a constant weight, and ground to a fine powder. Its basic chemical composition was characterized by determining total carbon (C) and nitrogen (N) contents, from which a C/N ratio of 36.01 was obtained. Although the lignin, cellulose, and hemicellulose contents were not analyzed, the C/N ratio served as the primary indicator of straw quality, as it strongly affects microbial decomposition and has been widely used as a reliable proxy for estimating soil carbon mineralization and CO2 emission rates in incubation studies [36].

2.2. Experimental Design

The experiment included twelve treatments (six replicates): The three soil layer (0–10 cm, 10–20 cm, and 20–30 cm) were combined with four levels of straw input; soil without straw (control, W0); soil combined with three levels of straw addition, namely W1 (0.15 g), W2 (0.3 g), and W4 (0.6 g). Tillage mode and treatment are shown in Table 1. Furthermore, three incubation jars filled solely with NaOH were utilized as blank samples. There were 75 incubation jars.

2.3. Incubation Experiment

For the incubation experiment, 100 g of air-dried soil was placed into 500 mL airtight plastic jars. Sterile water was added to adjust the soil moisture content to 60% of field capacity (FC), a level commonly used in incubation experiments to maintain optimal microbial activity and minimize oxygen limitation, as supported by previous studies by Haider et al. [37]. After a one-week pre-incubation period at 25 °C, wheat straw was thoroughly mixed with the soil according to the experimental treatments. A glass vial containing 30 mL of 0.01 M NaOH solution was positioned inside each jar to trap evolving CO2. Gas emissions were quantified at intervals of 1, 3, 7, 13, 21, 32, 48, and 79 days using alkali-trapping methods. CO2 levels were determined by titrating the NaOH solution with 0.8 M HCl, following the addition of 2 mL of 1 M BaCl2 and the use of phenolphthalein as an indicator. Soil moisture was maintained consistently throughout the incubation by regularly weighing jars and adding sterile water as necessary. Additionally, triplicate jars per treatment were destructively sampled on the 7th and 79th day to measure soil pH, total nitrogen (TN), nitrate nitrogen (NO3-N), ammonium nitrogen (NH4+-N), total phosphorus (TP), available phosphorus (AP), soil organic carbon (SOC), dissolved organic carbon (DOC), and extracellular enzyme activities. The 79-day incubation period was selected based on previous studies and preliminary observations, which showed that CO2 emissions tend to stabilize after approximately 70–80 days, indicating a transition from an active to a slower phase of organic matter decomposition under controlled incubation conditions.

2.4. Soil Analysis

Soil pH was measured with a glass electrode using a soil-to-water ratio of 1:2.5 [38]. Soil organic carbon (SOC) was quantified employing the oxidation technique with potassium dichromate and sulfuric acid [39]. Dissolved organic carbon (DOC) extraction involved a 1:5 soil-to-water mixture, which was then vacuum-filtered through a 0.45-µm membrane and analyzed following the SOC protocol [39]. Total nitrogen (TN) was determined by the Kjeldahl digestion method, while nitrate nitrogen (NO3-N) and ammonium nitrogen (NH4+-N) contents were measured after a one-hour end-over-end shaking with 2 M potassium chloride at a 1:5 soil-to-water ratio [40,41]. Total phosphorus (TP) and available phosphorus (AP) concentrations were evaluated using sulfuric acid-perchloric acid digestion and sodium bicarbonate extraction, respectively [38,42].

2.5. Soil Extracellular Enzyme Activity

Enzyme activities were assessed using synthetic substrates tagged with fluorescent labels [43]. Details of the substrates and corresponding compounds are listed in Table 2. The 4-methylumbelliferyl (MUF) substrates were initially dissolved in 2 mL methoxyethanol and then diluted with sterile distilled water to achieve target concentrations. Soil samples (1 g) were suspended in 10 mL of water and agitated on an overhead shaker at room temperature and 500 rpm for 30 min to ensure homogeneity. Subsequently, 0.5 mL aliquots of these soil suspensions were combined with 1.5 mL of substrate solutions (containing 200 µM MUF or 200 µM 7-amino-4-methylcoumarin [AMC]) that had been pre-dispensed into 24-well deep-well plates (10 mL capacity, HJ-Bioanalytik GmbH, Erkelenz, Germany). Saturation concentrations of substrates were determined through prior experiments. The plates were incubated at 22 °C for 1 h to enable monomer release from enzymes such as β-glucosidase, β-1,4-N-acetylglucosaminidase, and leucine aminopeptidase, followed by a 3 h incubation at 37 °C for β-cellobiosidase and alkaline phosphatase activity. Calibration solutions were prepared by mixing soil suspensions with varying MUF or AMC concentrations (0–100 µmol L−1). After centrifugation at 3000 rpm for 10 min, 1 mL of supernatant was transferred to microplates (Becton Dickinson, Franklin Lakes, NJ, USA) for fluorescence measurement within 2–3 min. Fluorescence detection employed excitation and emission wavelengths of 355 nm and 460 nm, respectively, with a 25 nm slit width using a Victor3 1420-050 Multilabel Counter (PerkinElmer, Waltham, MA, USA). Controls for substrate autofluorescence and quenching effects were included throughout the enzyme assays [43]. Enzyme activities were expressed as micromoles of MUF or AMC released per gram of soil per hour (µmol g−1 h−1). Different incubation times were selected based on the catalytic rates of individual enzymes determined during preliminary kinetic tests and supported by established protocols [43]. Rapidly acting hydrolases such as β-glucosidase, N-acetylglucosaminidase, and leucine aminopeptidase typically reach substrate saturation within 1 h, ensuring accurate quantification without secondary substrate depletion. In contrast, β-cellobiosidase and alkaline phosphatase exhibit slower catalytic turnover and require longer incubation (3 h) to achieve detectable product formation within the linear phase of the reaction. These conditions ensure that enzyme activity measurements remain within the optimal kinetic range for each enzyme type.

2.6. Statistical Analysis

Data processing and analysis were performed using SPSS version 26 and Microsoft Excel 2007, while graphical visualizations were created with Origin 2021. One-way analysis of variance (ANOVA) was applied to evaluate differences among treatments for variables such as cumulative CO2 emissions, soil physicochemical characteristics, enzyme activities, and activated carbon fractions. Subsequent pairwise comparisons were conducted using the Least Significant Difference (LSD) test at a significance threshold of p < 0.05. A three-way ANOVA was applied to evaluate the effects of fixed factors (soil layer, treatment, and incubation time) on variables (cumulative CO2 emissions, soil physicochemical characteristics, enzyme activities, and activated carbon fractions). The Pearson correlation coefficient was calculated to examine relationships between cumulative CO2 emissions and soil properties, enzyme activity, and carbon components. Furthermore, structural equation modeling (SEM) implemented in R (version 4.1.1; RStudio) was used to explore both the direct and indirect influences of various factors on cumulative CO2 emissions.

3. Results

3.1. CO2 Emission

3.1.1. Cumulative CO2 Emission

The cumulative CO2 emission was strongly influenced by the amount of straw added, soil depth, and incubation time (p < 0.001; Figure 1). Similarly, the interactions between soil layers and incubation time, soil layers and straw addition levels, as well as incubation time and straw addition levels, had a significant effect on cumulative CO2 release (p < 0.01). The highest cumulative CO2 emission was observed in the W4 treatment within the 0–10 cm soil layer, which was 14.09 times that of the control, 9.1 times that of W1, and 5.11 times that of W2. Notably, the cumulative CO2 emission increased with the extension of incubation time (p < 0.001), showing a rapid intensification during the first 3rd to 7th days of incubation.

3.1.2. CO2 Emission Rate

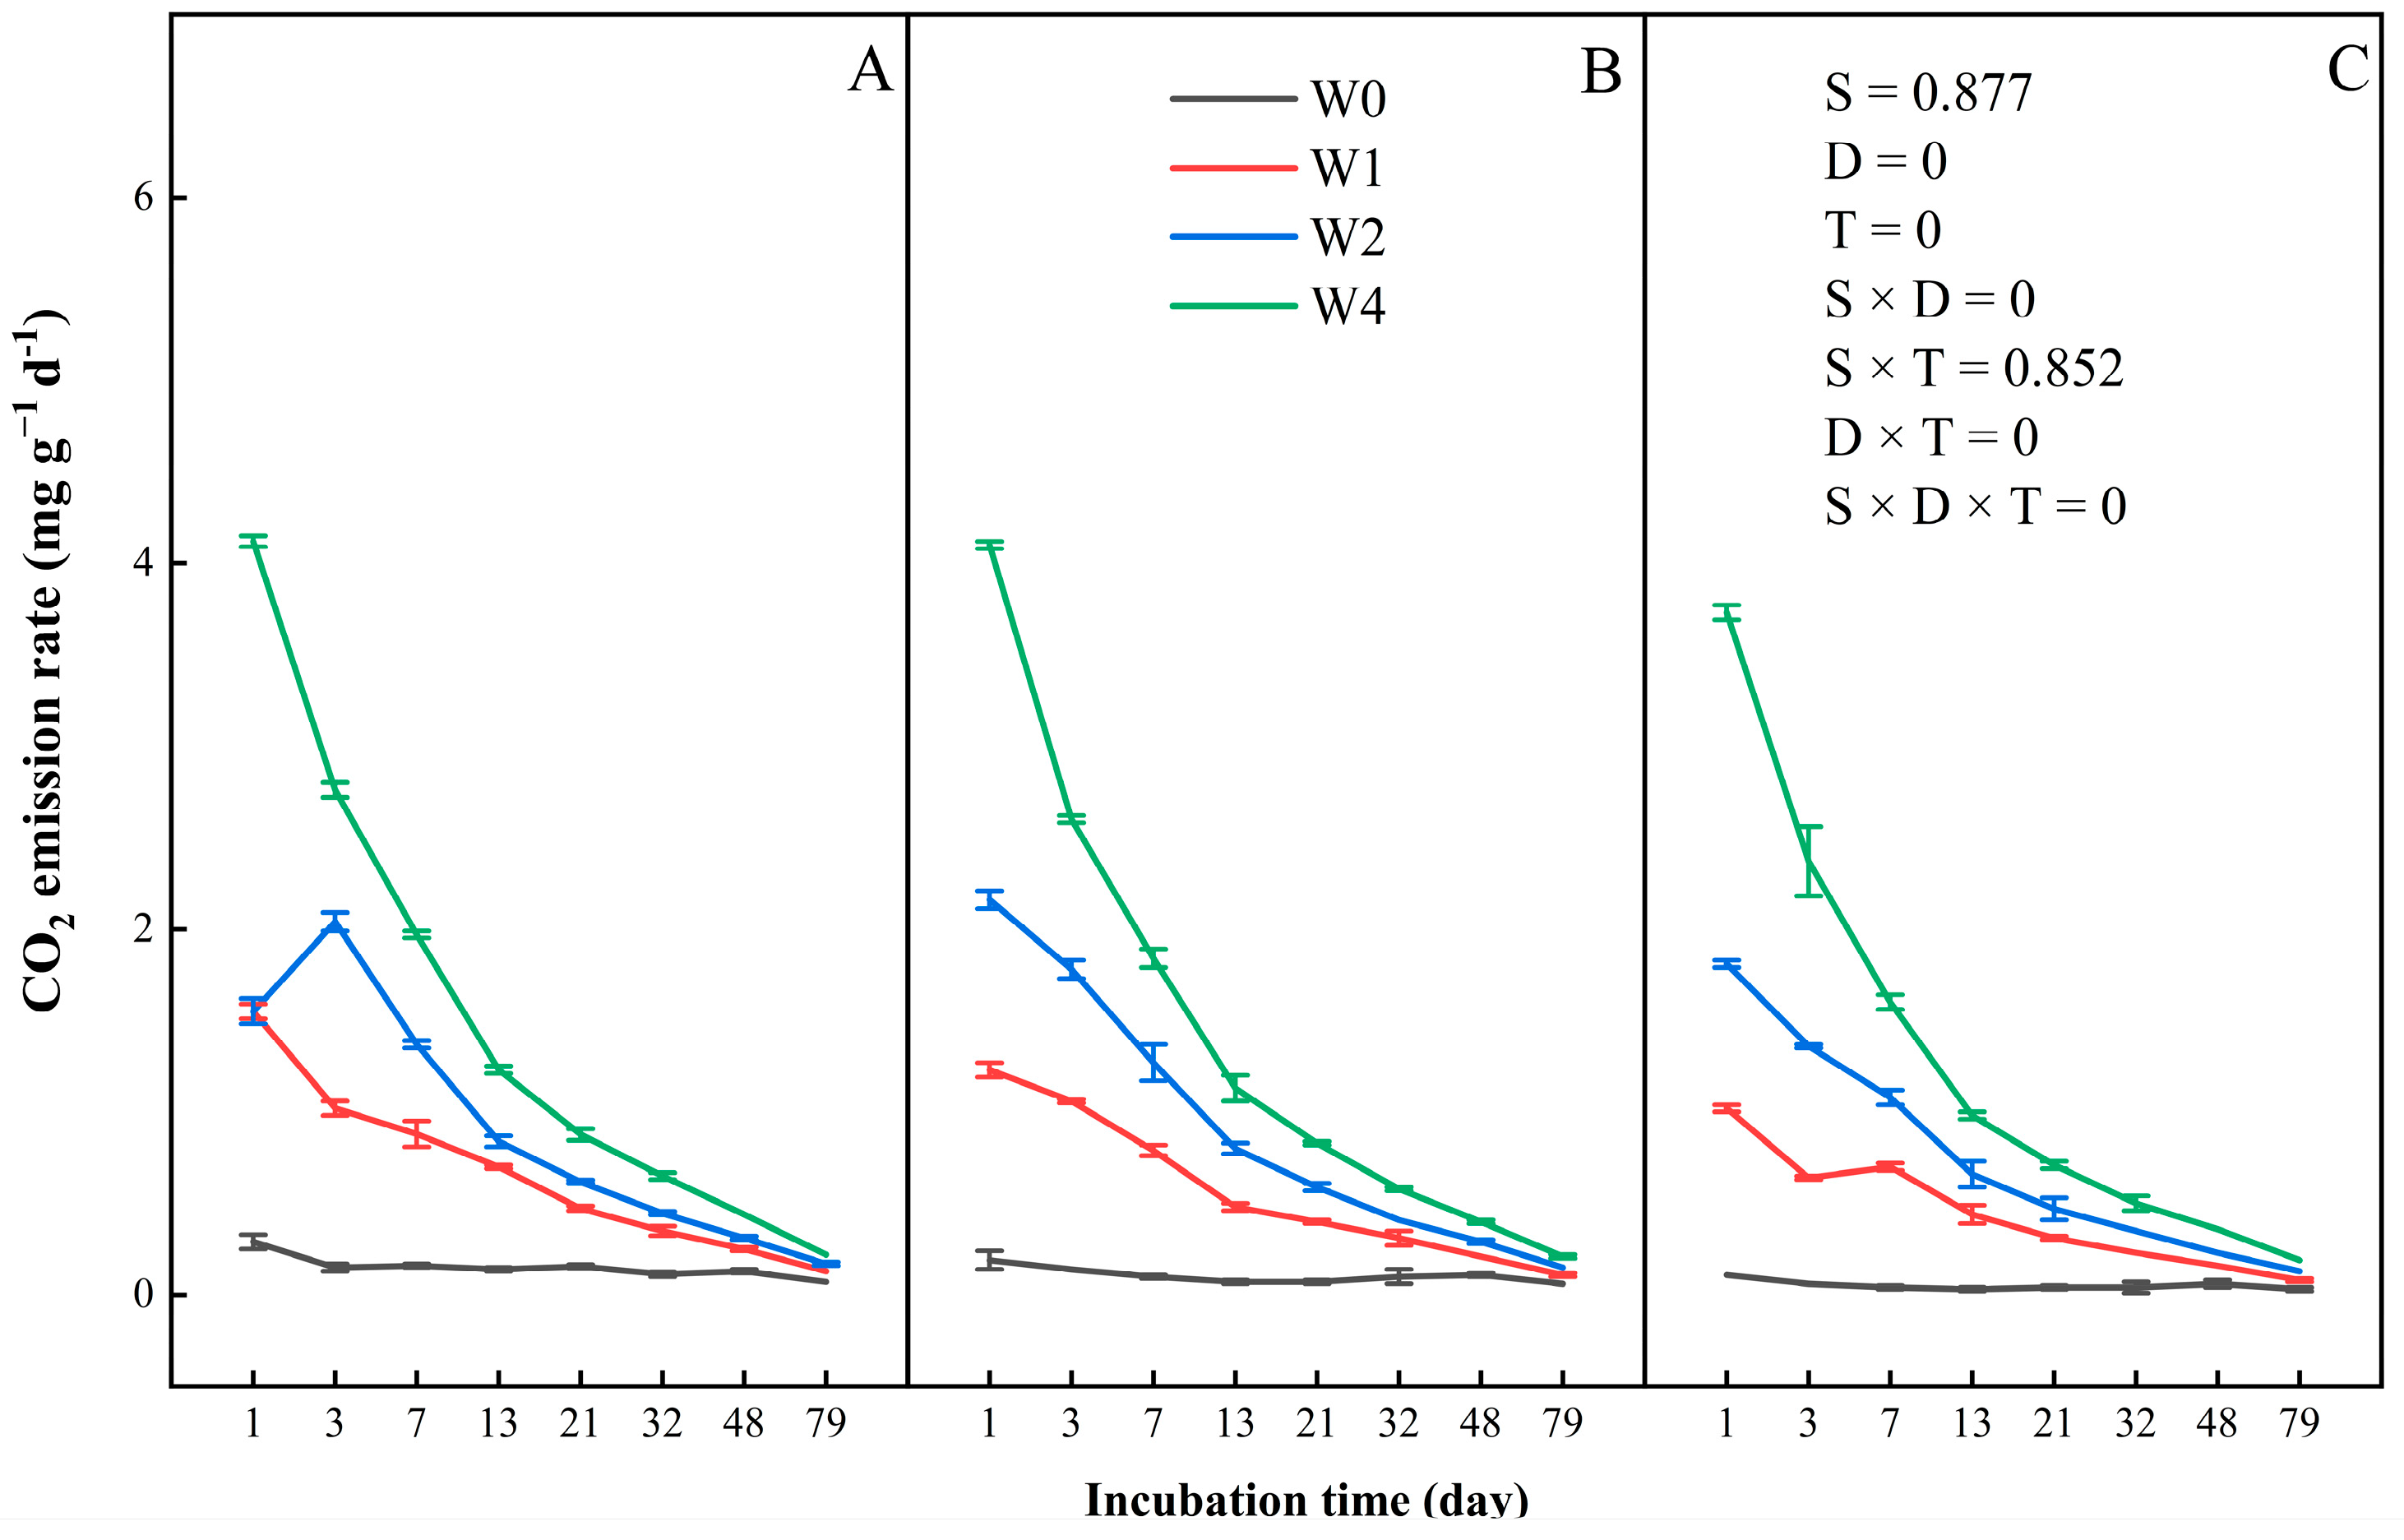
The CO2 emission rate was not influenced by soil depth, nor by the interaction between soil depth and incubation time (p > 0.05; Figure 2). Similarly, to the cumulative CO2 emission, the highest CO2 emission rate was also observed in the W4 treatment within the 0–10 cm soil layer, which was 10.1 times that of the control, 2.29 times that of W1, and 1.67 times that of W2. However, in the 10–20 cm soil layer, W4 treatment was 13.97 times that of the control, 2.55 times that of W1, and 1.57 times that of W2. In the 20–30 cm soil layer, W4 treatment was 26.63 times that of the control, 2.91 times that of W1, and 1.71 times that of W2.

3.2. Soil Physicochemical Properties

3.2.1. pH

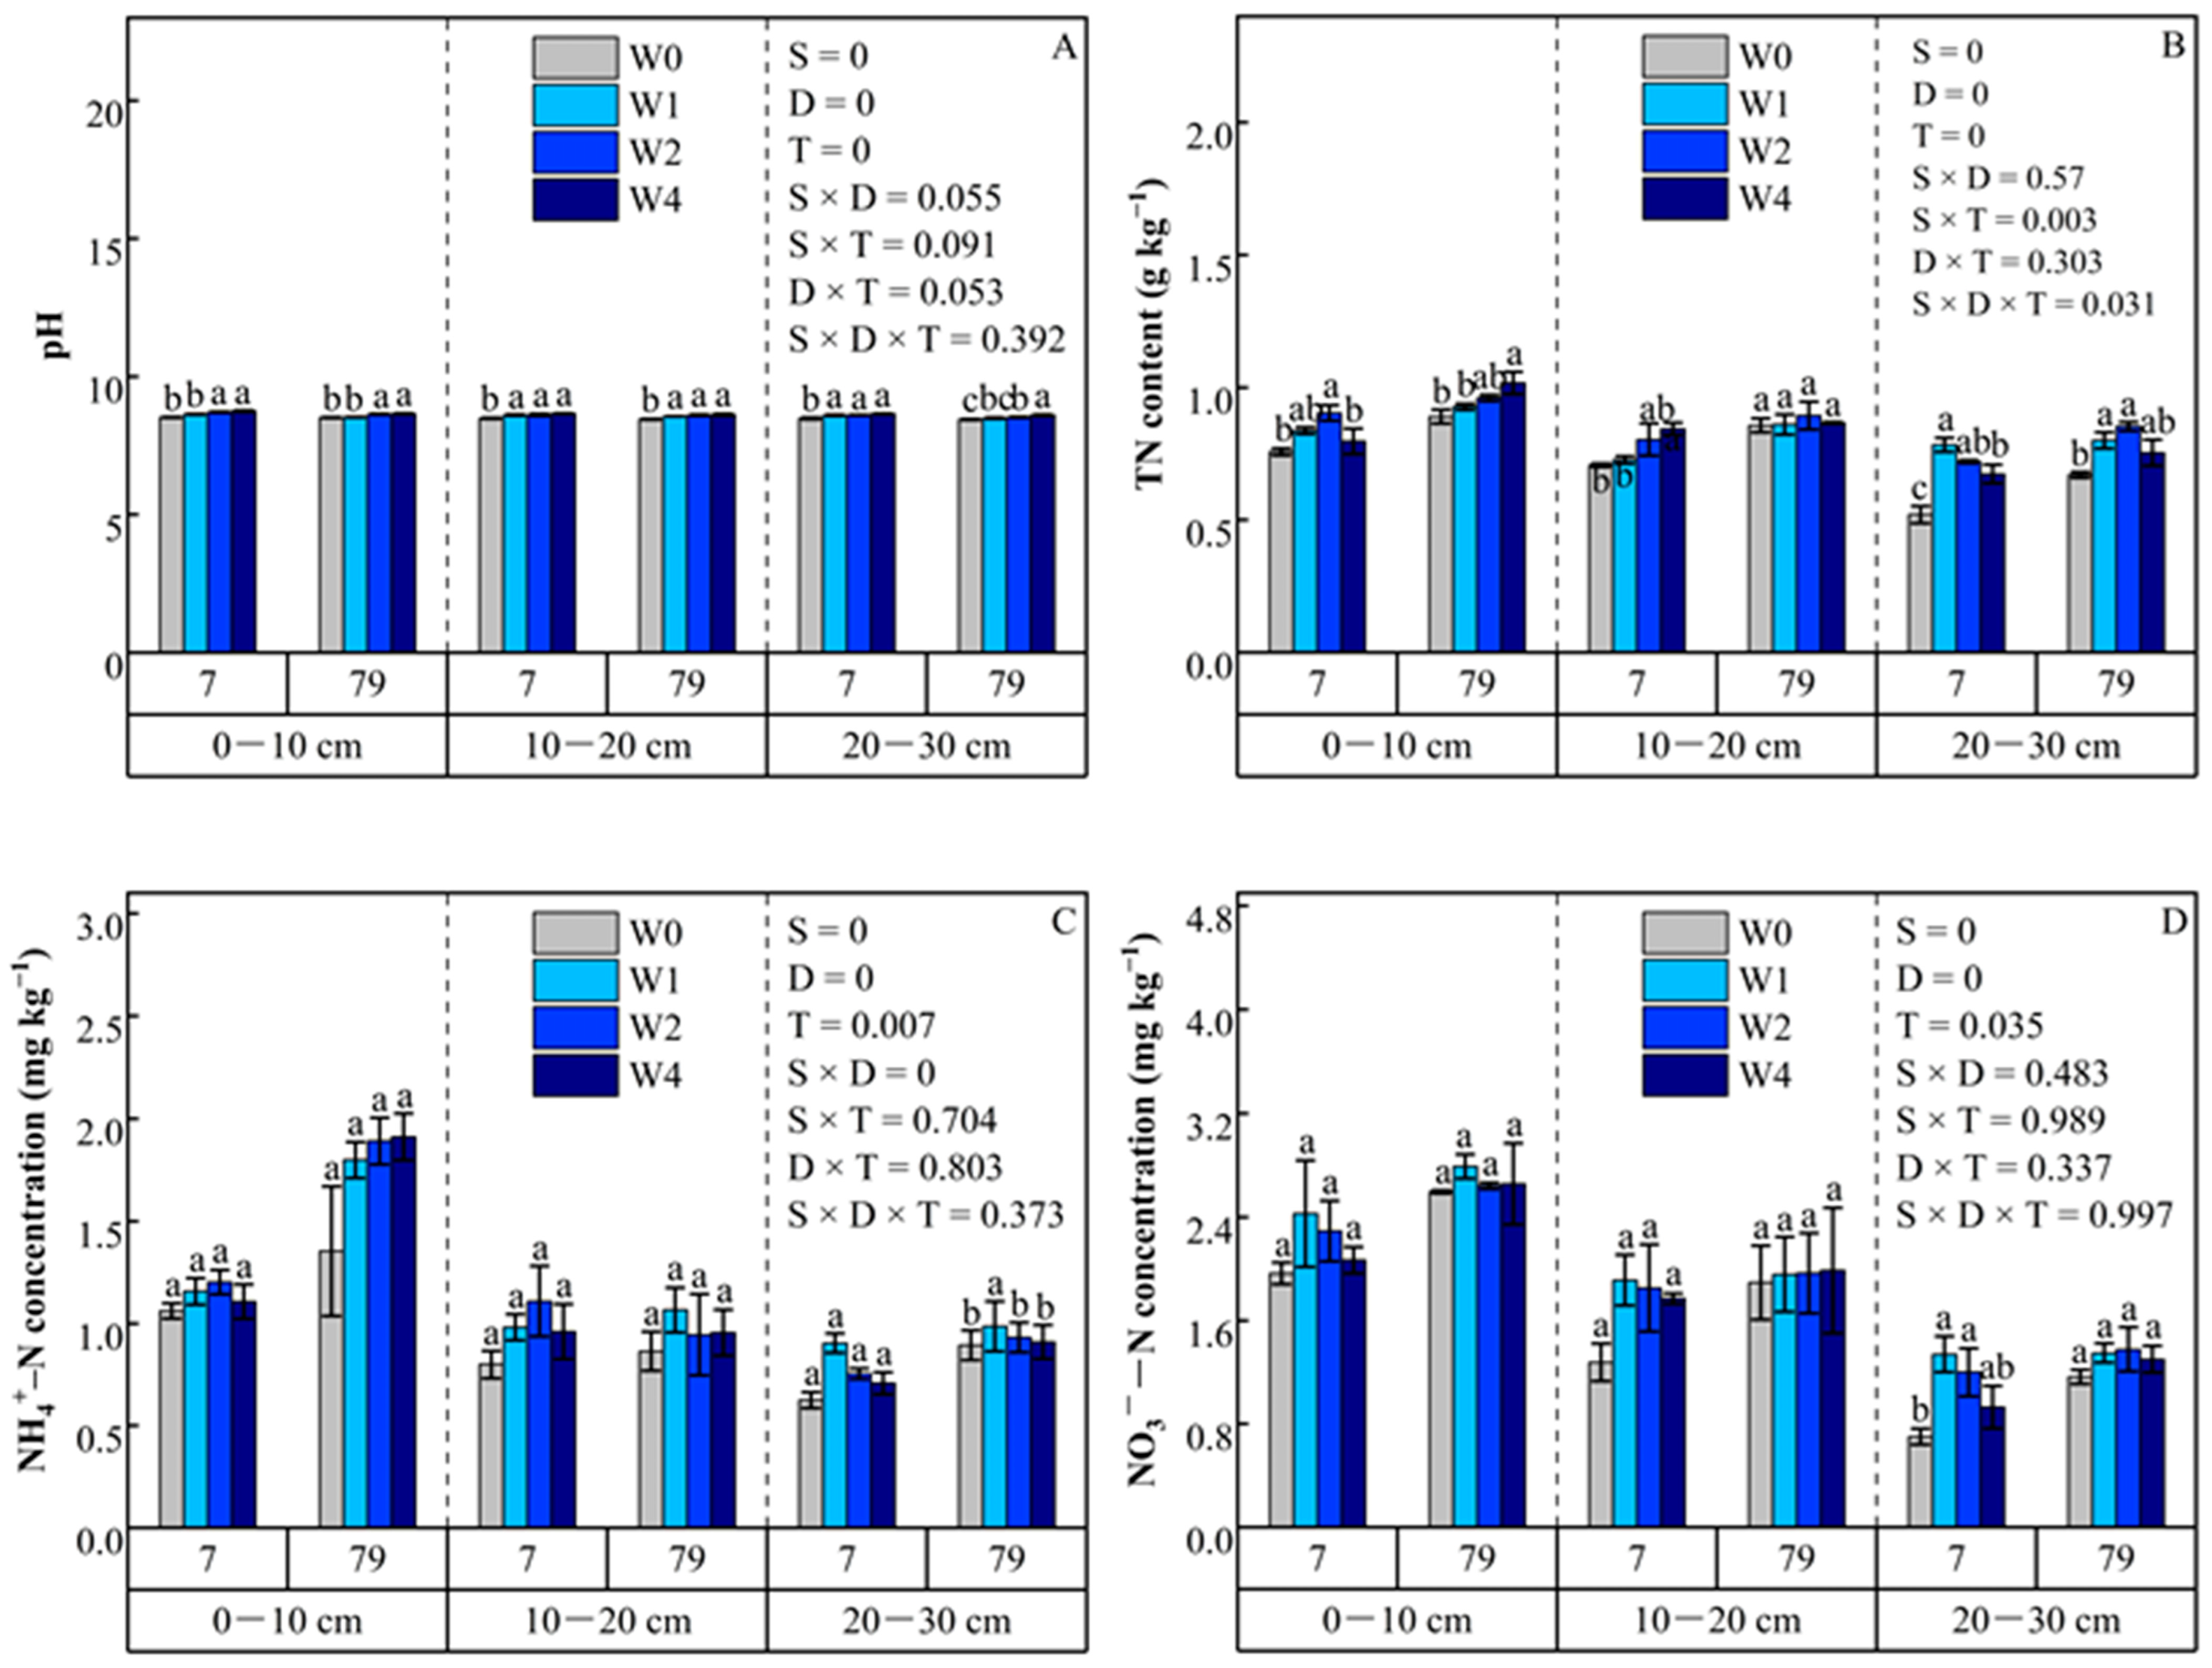
Overall, the addition of straw significantly increased the pH at three soil depths (p < 0.001), particularly in the 0–10 cm soil layer (Figure 3A). On the 7th day, compared with control and W1, W4 rose from 8.53 and 8.64 to 8.75, respectively; W2 rose from 8.53 and 8.64 to 8.72, respectively. On the 79th day, compared with the control and W1, W4 rose from 8.52 and 8.53 to 8.66, while W2 rose from 8.52 and 8.53 to 8.64, respectively. Furthermore, the effect of straw addition on pH was higher at 7th days than at 79th days (p < 0.001).

3.2.2. Total Nitrogen

The total nitrogen (TN) content significantly depended on the interactions among soil depths, incubation time, and straw addition levels, as well as the interactions between soil layers and straw addition levels (p < 0.05; Figure 3B). At the 79th day, W4 exhibited increases of 14.24%, 9.71%, and 5.91% in the 0–10 cm soil layer, respectively, compared to the control, W1, and W2. However, on the 7th day, W4 was 19.37%, 7.96%, and 13.38% higher than the control, W1, and W2, respectively.

3.2.3. Ammonium Nitrogen

Although the ammonium nitrogen (NH4+-N) concentration was not influenced by the interactions among soil layer, straw addition levels, and incubation time, it significantly decreased with increasing soil depth (p < 0.001) and increased with the extension of incubation time (p < 0.001; Figure 3C). The increase was more pronounced in the W4 treatment compared to other treatments, particularly on day 79th. In the 0–10 cm soil layer, the NH4+-N concentration in W4 was 1.41 times that of the control, 1.06 times that of W1, and 1.01 times that of W2.

3.2.4. Nitrate Nitrogen

The nitrate nitrogen (NO3-N) concentrations significantly decreased with increasing soil depth (p < 0.001) and significantly increased with prolonged incubation time (p < 0.001; Figure 3D). W1 not only increased NO3-N concentrations in all soil layers on the 7th day but also elevated NO3-N concentrations in the 0–10 cm soil layer on the 79th day. However, this increase was statistically significant only in the 20–30 cm soil layer on the 7th day, where W1 showed a 0.91-fold increase compared to the control, a 0.12-fold increase over W2, and a 0.44-fold increase over W4.

3.2.5. Total Phosphorus

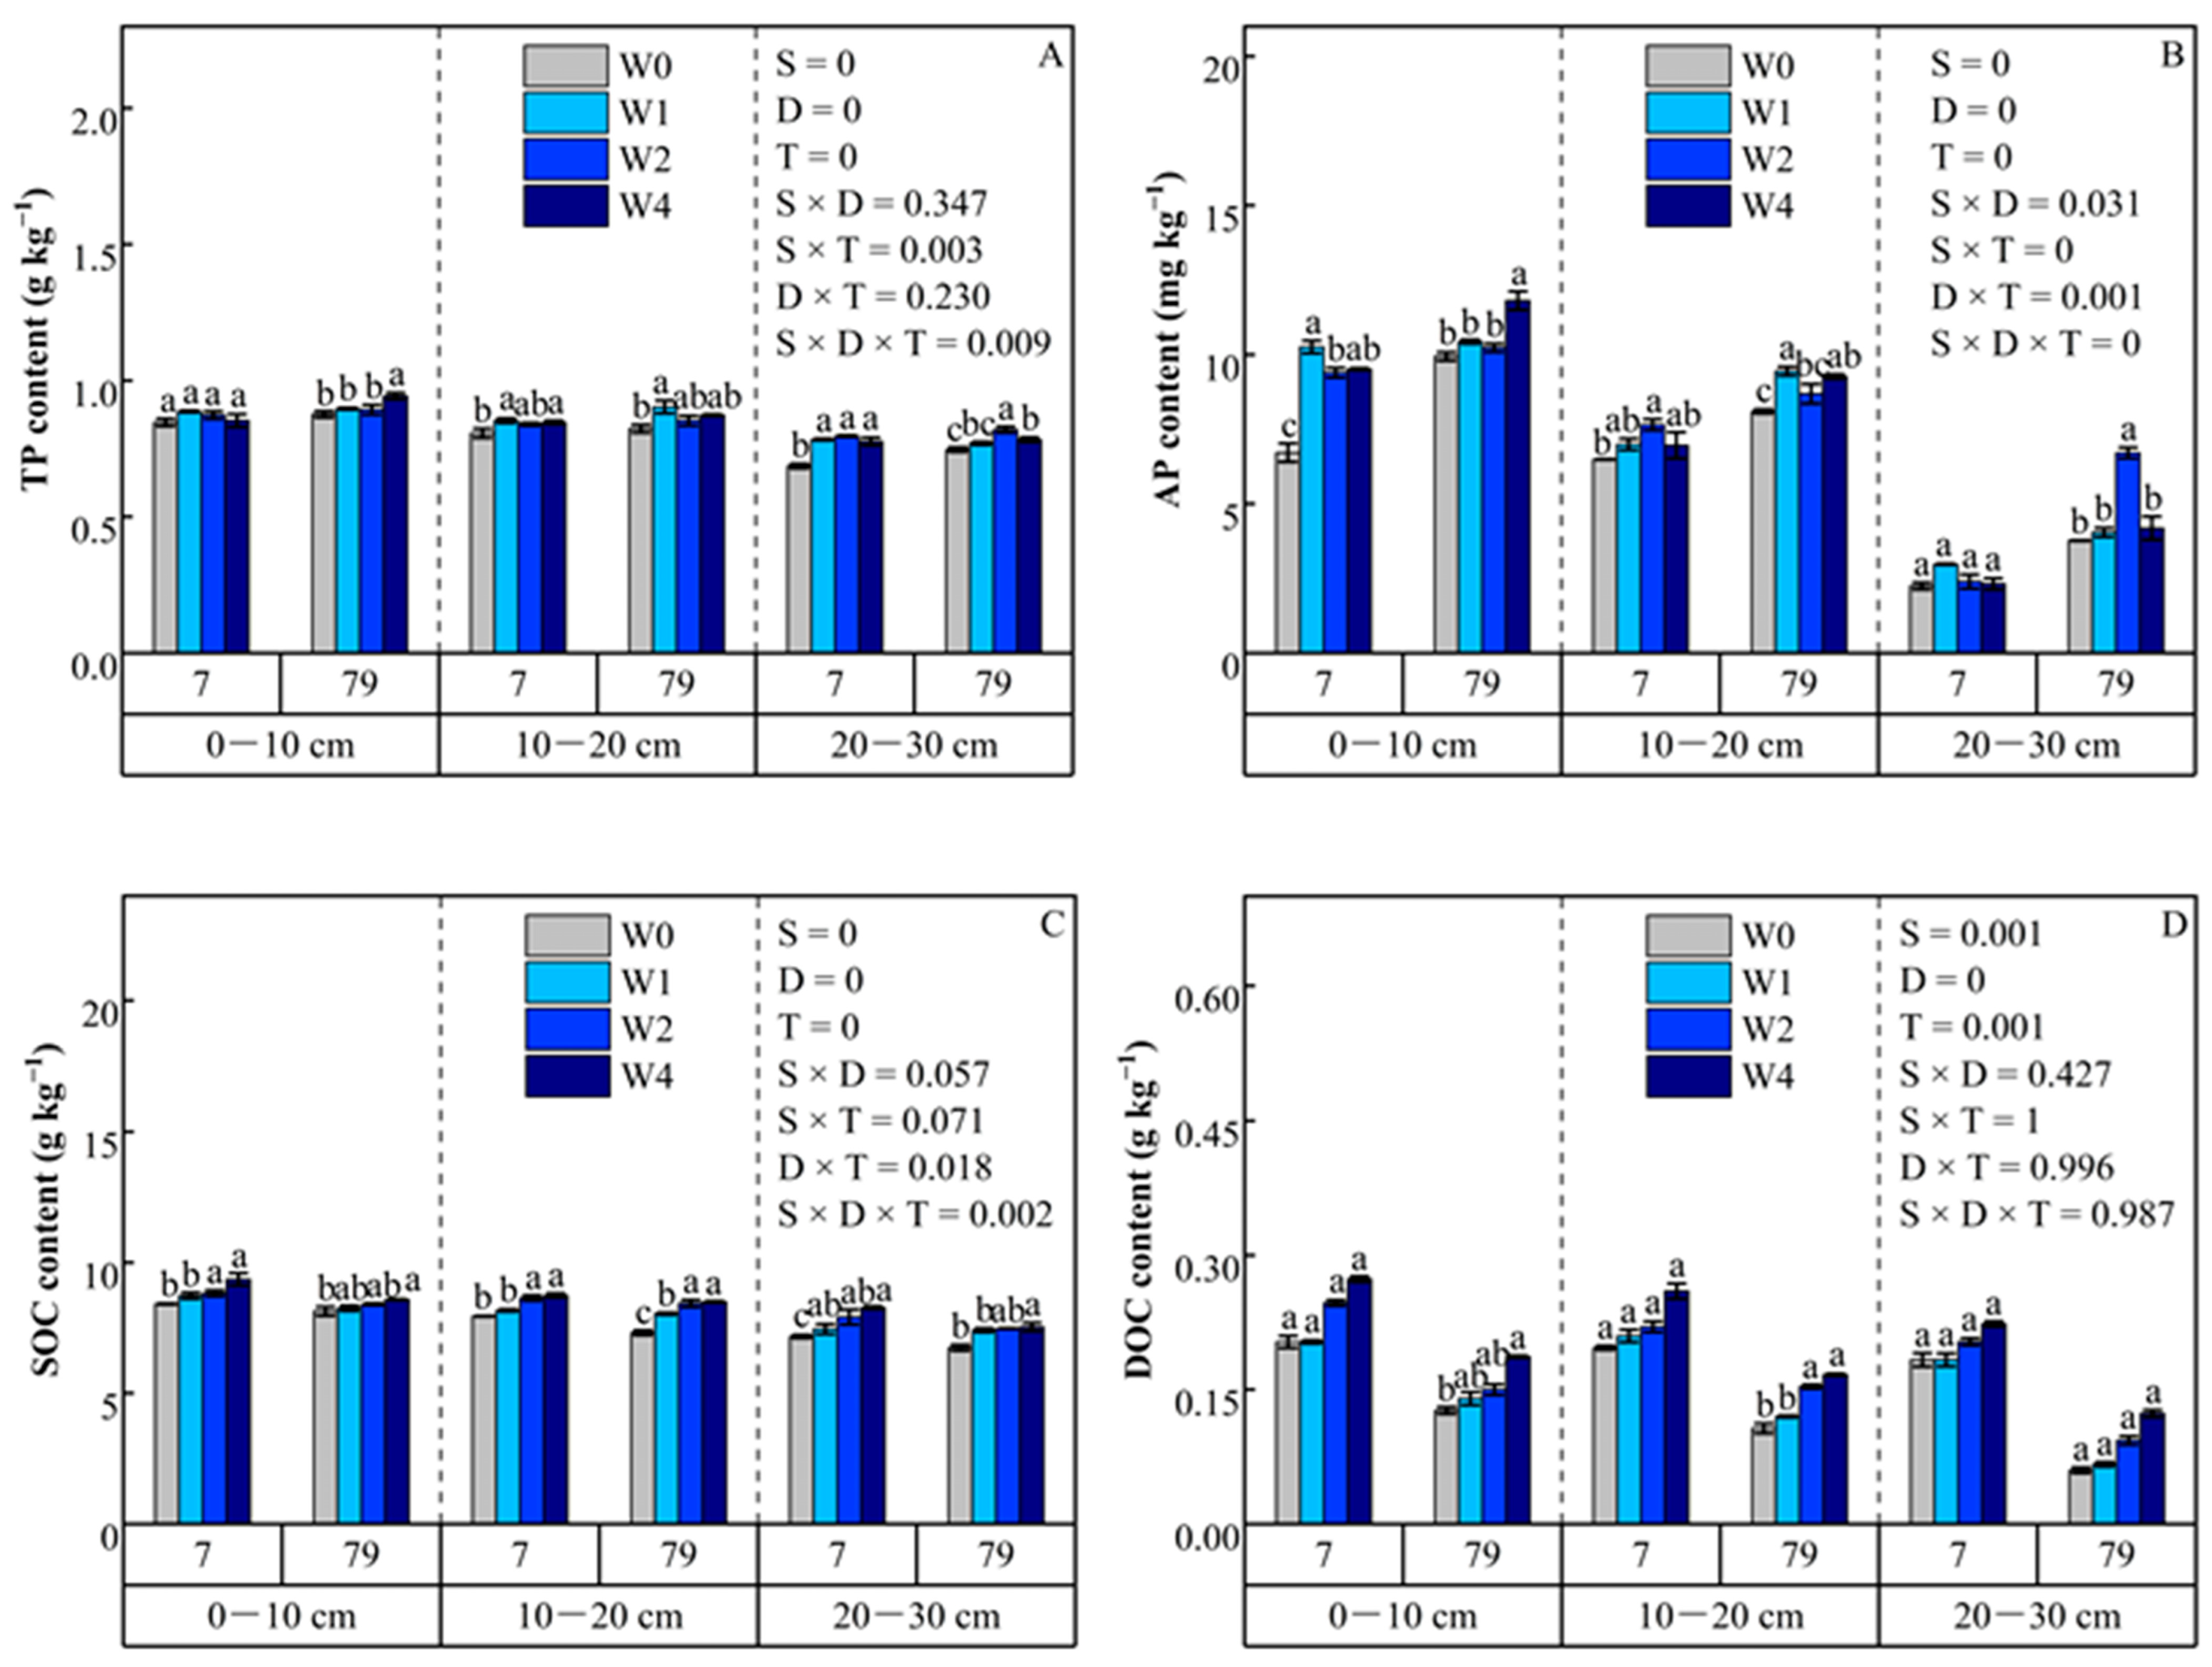
The effect of straw additions on total phosphorus (TP) content varied across different soil depth classes. TP content decreased with increasing soil depth (p < 0.001) and increased with incubation time (p < 0.001; Figure 4A). On the 79th day, values in the 0–10 cm soil layer were higher in the W4 treatment compared to the other treatments, indicating increases of 7.6%, 5.6%, and 5.3% over the control, W1, and W2, respectively. Additionally, TP content was influenced by the interaction of soil layer, straw addition levels, and incubation time.

3.2.6. Available Phosphorus

The effect of straw addition and soil layer on available phosphorus (AP) content was similar to that on TP, particularly in the three soil layers at 79th days (Figure 4B). However, this value peaks in the 0–10 cm soil layer, particularly in the W4 treatment. Compared with the control, W1, and W2, the AP increased by 18.81%, 13.12%, and 15.44%, respectively, in the W4 treatment. Additionally, the AP content on the 79th day was superior to that on the 7th day. The AP content was significantly affected by soil layer, incubation time, straw addition levels, and their interactions.

3.3. Soil Organic Carbon and Dissolved Organic Carbon

3.3.1. Soil Organic Carbon

Soil organic carbon (SOC) content decreased with increasing soil depth (p < 0.001) and increased with the amount of straw addition (p < 0.001; Figure 4C). Additionally, SOC content decreased with the extension of incubation time (p < 0.001). The highest SOC content was observed in the W4 treatment within the 0–10 cm soil layer at the 7th day, which was 1.11 times that of the control, 1.07 times that of W1, and 1.06 times that of W2. Furthermore, the interaction effects among soil depth, incubation time, and straw addition levels were also significant for SOC content (p < 0.01).

3.3.2. Dissolved Organic Carbon

Similarly to SOC, dissolved organic carbon (DOC) content also decreased with increasing soil depth and the extension of incubation time (p < 0.05; Figure 4D), while it increased with the amount of straw addition (p < 0.05). The highest DOC content was observed in the W4 treatment within the 0–10 cm soil layer at the 7th day, which was 1.34 times that of the control and W1, and 1.06 times that of W2. However, there was no significant interaction effect among soil depth, incubation time, and straw addition levels on DOC content.

3.4. Extracellular Enzyme Activities (EEAs)

3.4.1. β-Glucosidase

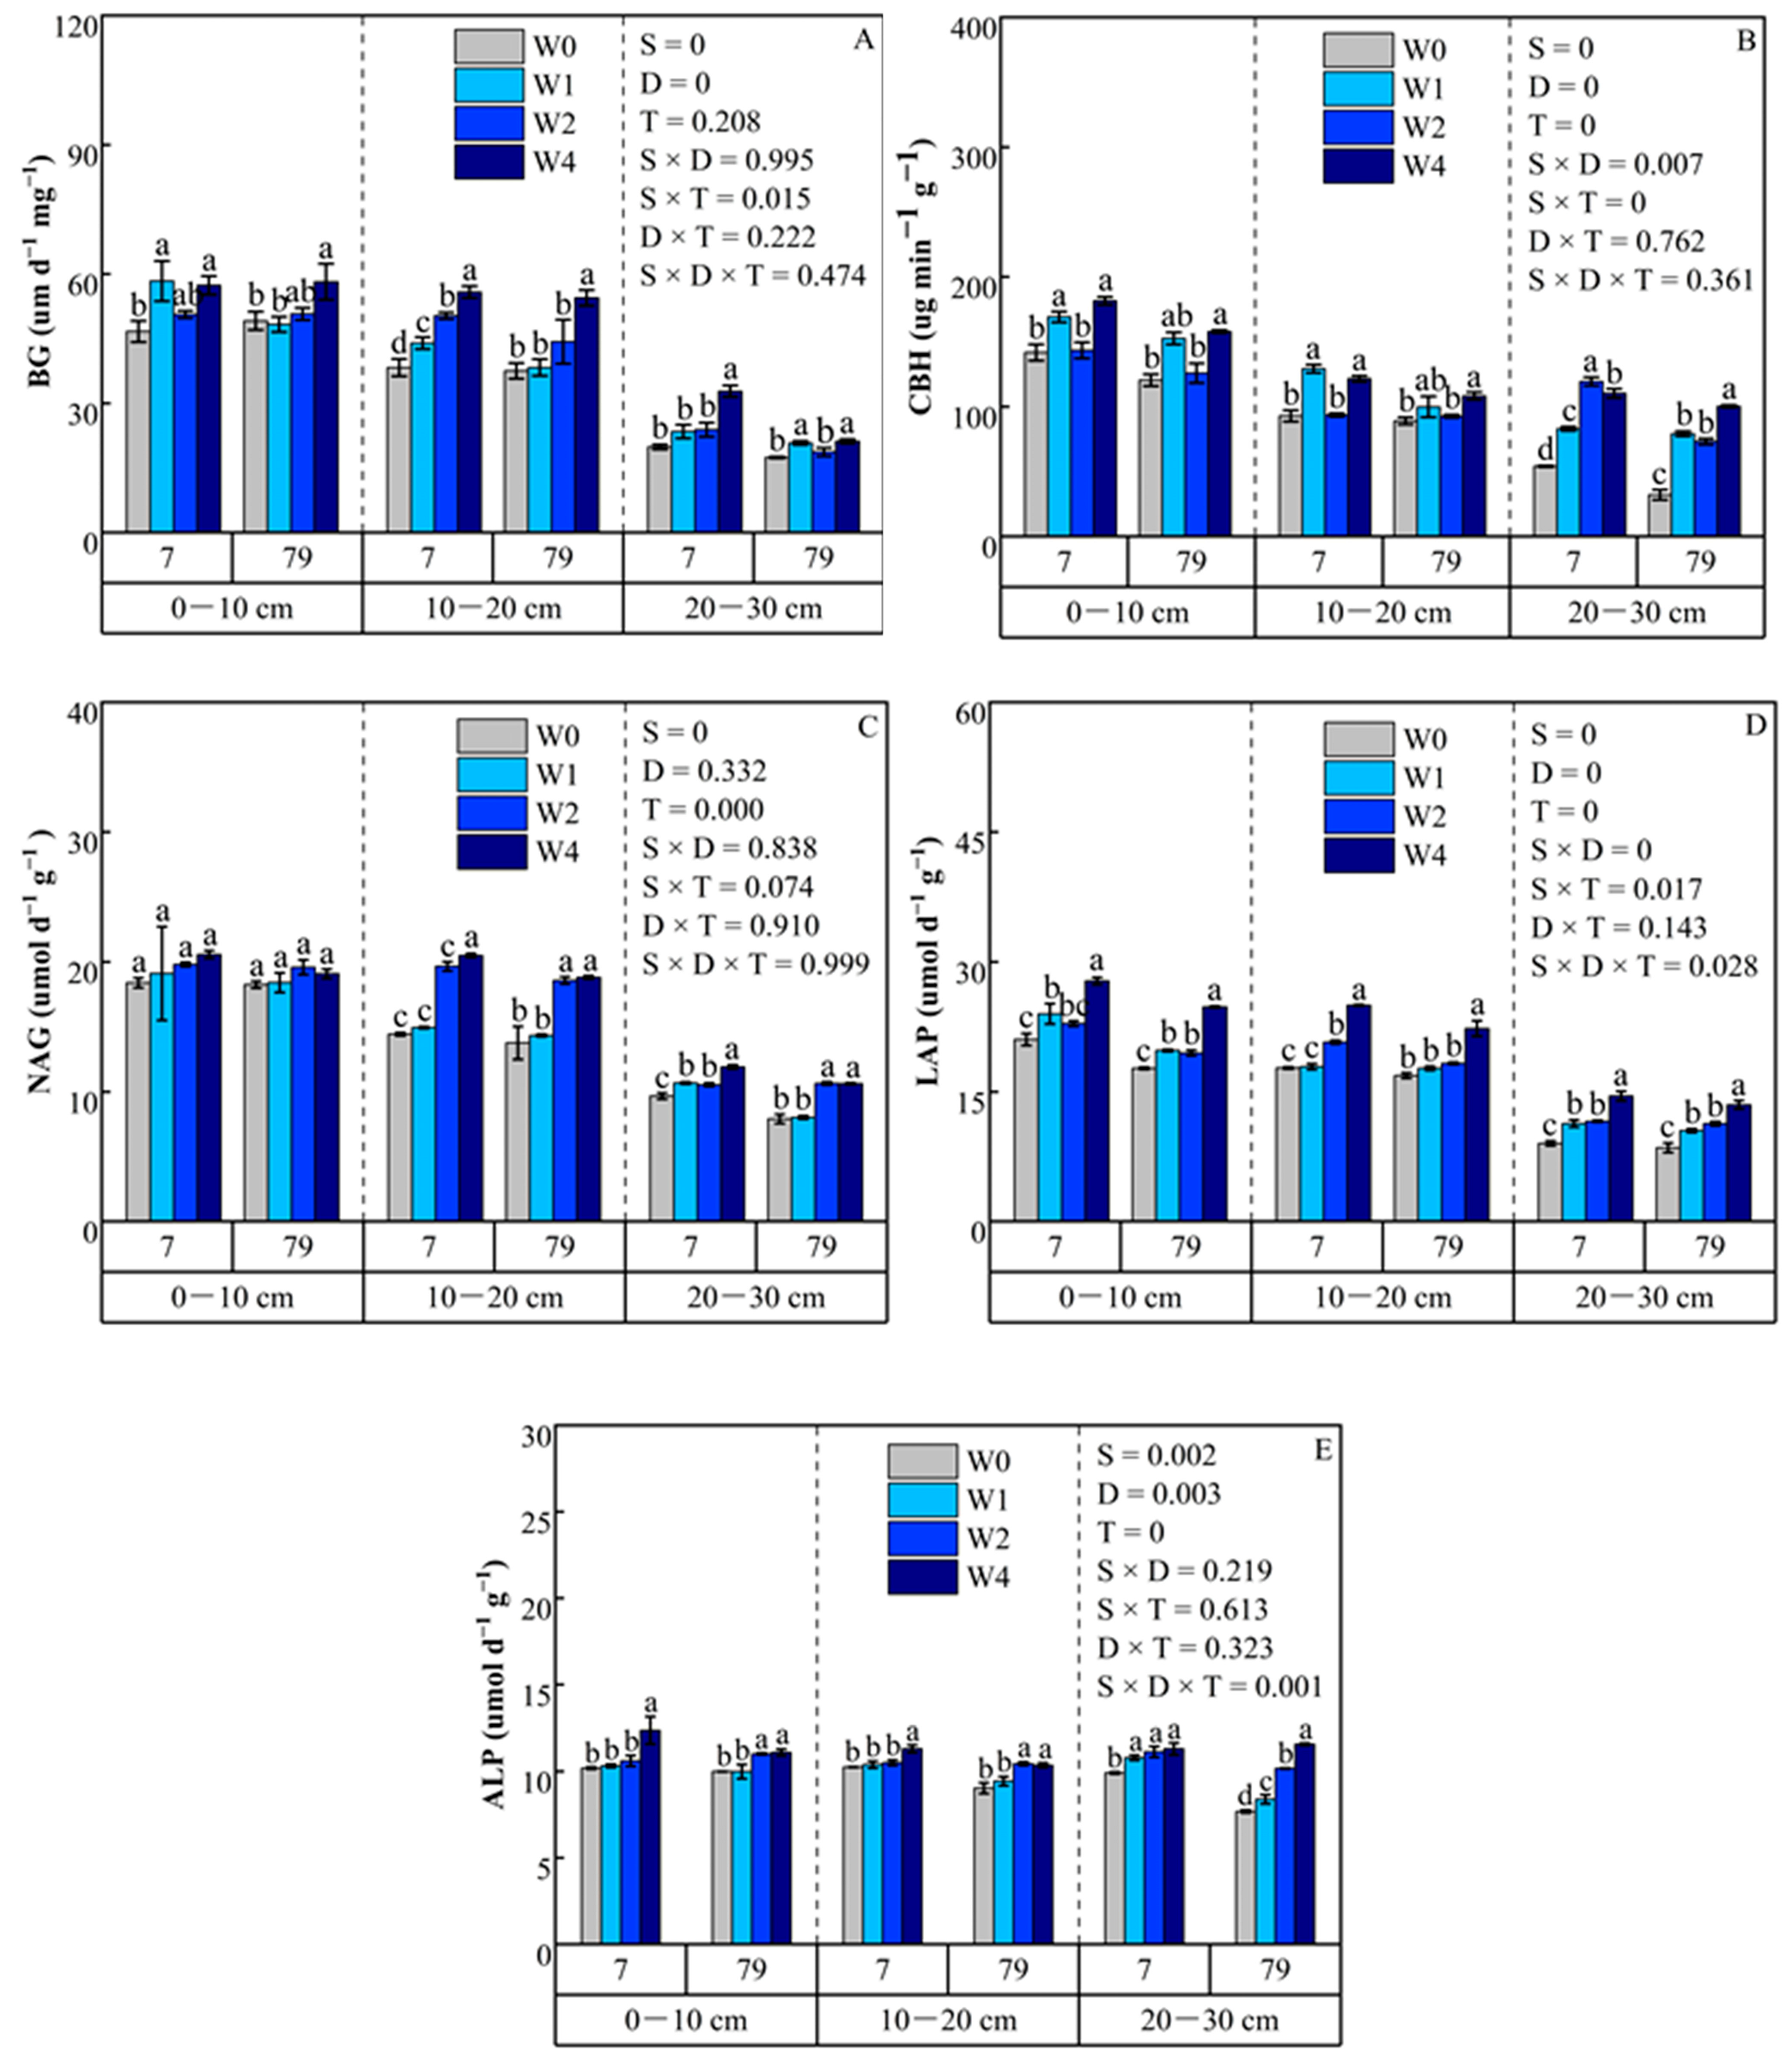
The β-glucosidase (BG) activity was highly dependent on both incubation time and soil layer (p < 0.001; Figure 5A). The 0–20 cm soil layer exhibits significant differences from the 20–30 cm soil layer, particularly in the 0–10 cm layer. In the 0–10 cm soil layer, W1 increased by 15.35%, 25.02%, and 4.55% compared to the control, W2, and W4, respectively, upon the 7th day. However, on the 79th day, W4 increased by 18.43%, 20.49%, and 14.74% compared with the control, W1, and W2, respectively.

3.4.2. β-Cellobiosidase

β-cellobiosidase (CBH) activities significantly decreased with increasing soil depth (p < 0.001) and with the prolongation of incubation time (p < 0.001; Figure 5B). W4 was the highest in the 0–10 cm soil layer. Compared with the control, W1, and W2, W4 increased by 28.08%, 7.34%, and 26.62% on the 7th day, respectively. However, on the 79th day, W4 increased by 31.14%, 3.46%, and 25.49% compared to the control, W1, and W2, respectively. Moreover, the three-way ANOVA revealed that the interaction between soil depth, incubation time, and straw addition levels had a highly significant effect on CBH (p < 0.001).

3.4.3. β-1, 4-N-Acetylglucosaminidase

Although β-1, 4-N-acetylglucosaminidase (NAG) activities increased following the addition of straw (Figure 5C), there was no statistical significance among all treatments in the 0–10 cm soil layer. On the 7th day of this soil layer, W4 treatment was 11.87%, 7.64%, and 3.87% higher than the control, W1, and W2, respectively. Interestingly, W2 treatment peaked in the 0–10 cm soil layer at the 79th day, showing increases of 7.36%, 6.45%, and 2.65% over the control, W1, and W2, respectively.

3.4.4. L-Leucine Aminopeptidase

The activities of L-leucine aminopeptidase (LAP) were not only significantly influenced by soil depth, incubation time, and straw addition levels (p < 0.001), but also dependent on the interaction among these factors (Figure 5D). Among all soil layers, W4 has the greatest impact on LAP activity, particularly in the 0–10 cm soil layer. On the 7th day, W4 treatment was 1.32 times that of the control, 1.16 times that of W1, and 1.22 times that of W2. However, by the 79th day, W4 treatment was 1.40 times that of the control, 1.26 times that of W1, and 1.27 times that of W2.

3.4.5. Alkaline Phosphatase

The effect of straw addition levels, soil depth, and incubation time on alkaline phosphatase (ALP) activity was similar to that of LAP (Figure 5E). Except for W2 treatment in the 10–20 cm soil layer on the 79th day, the W4 treatment had a significant effect on ALP activity in all soil layers. At the 7th day, W4 treatment resulted in a 21.39%, 19.83%, and 16.59% increase in ALP activity compared to the control, W1, and W2, respectively, in the 0–10 cm soil layer. The increase in ALP activity was more pronounced in the 0–10 cm soil layer at the 7th day compared to the 0–10 cm soil layer at the 79th day. On the 79th day, W4 treatment led to an 11.04%, 11.09%, and 11.04% increase in ALP activity compared to the control, W1, and W2, respectively. Additionally, soil depth, straw addition levels, incubation time, and their interactions had significant effects on ALP activity (p < 0.01).

3.5. Contribution of Abiotic and Biotic Factors to SOC Mineralization

3.5.1. Correlation Analysis

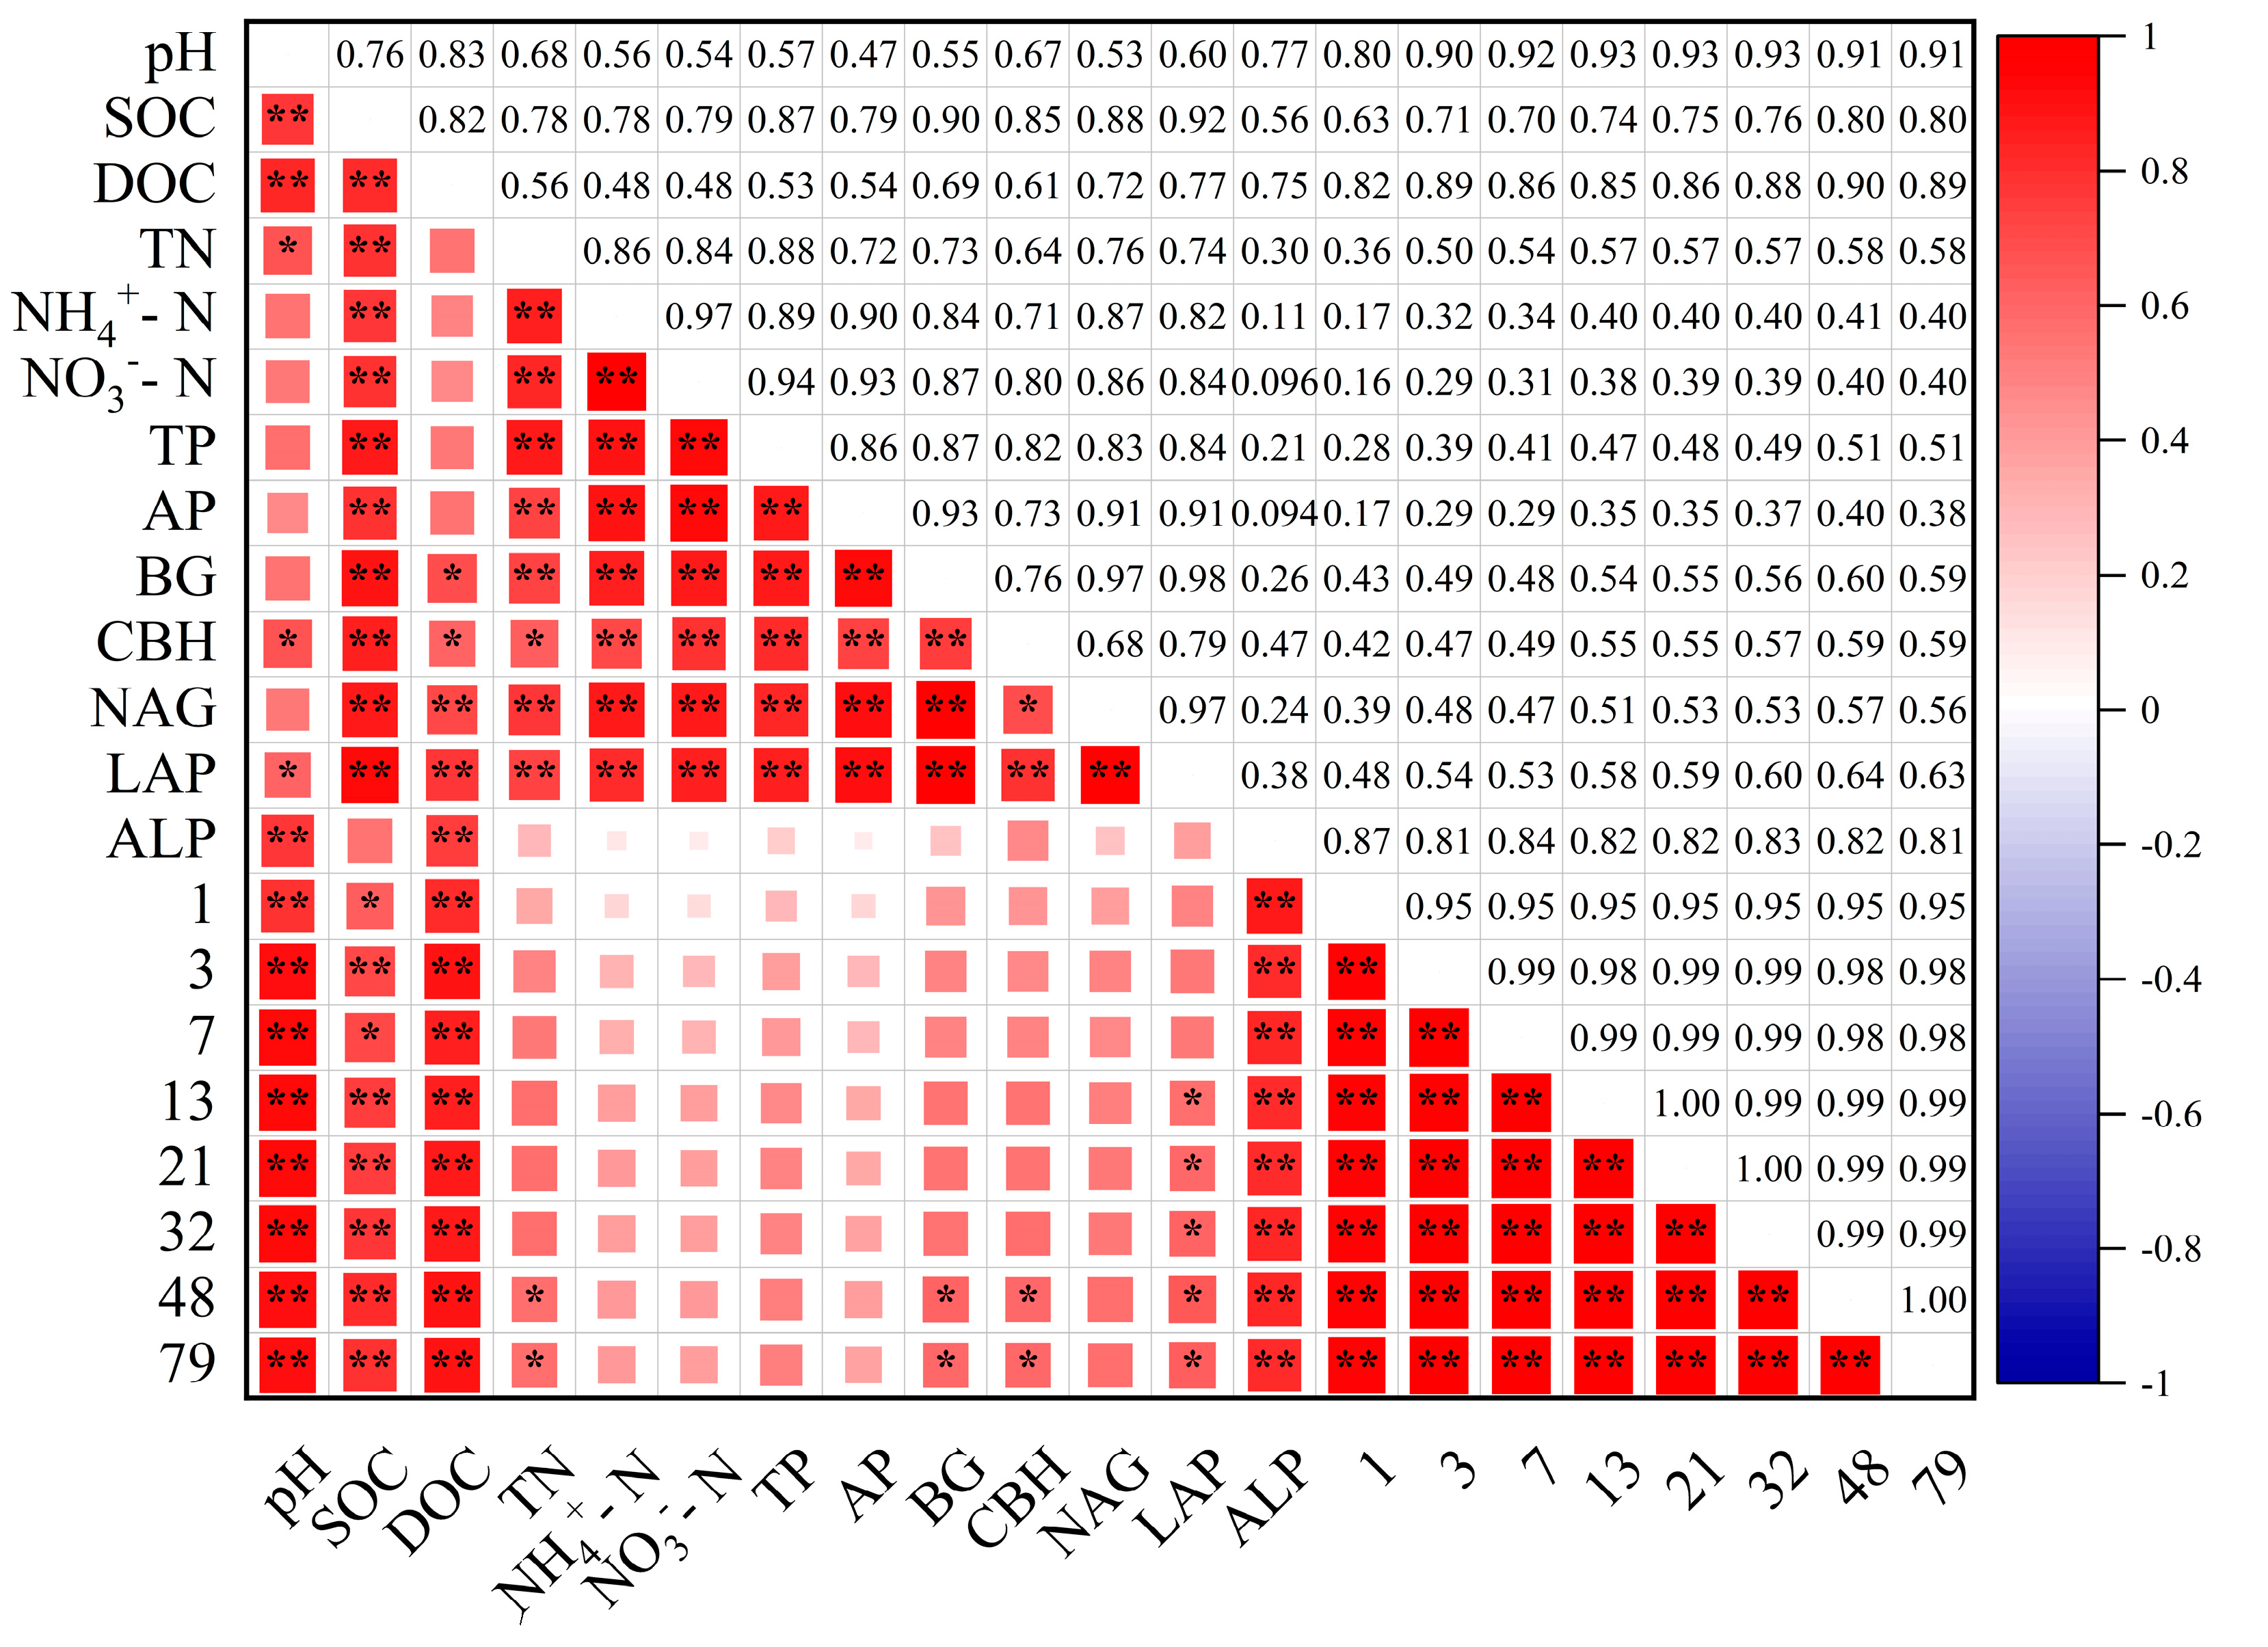
A positive correlation was observed between cumulative CO2 emissions and the corresponding values (p < 0.01; Figure 6). Cumulative CO2 emissions exhibited a significant positive correlation with pH, DOC, ALP activities, and SOC (p < 0.01). Cumulative CO2 emissions were also positively correlated with LAP (p < 0.05). Additionally, soil nutrients showed a significant positive correlation with SOC, as well as with enzyme activities associated with the cycling of carbon (C) and nitrogen (N) (p < 0.05). SOC showed a significant positive correlation with DOC and enzyme activities associated with the cycling of carbon (C) and nitrogen (N) (p < 0.01). At the same time, DOC showed a significant positive correlation with all enzyme activities (p < 0.05).

3.5.2. Structural Equation Modeling

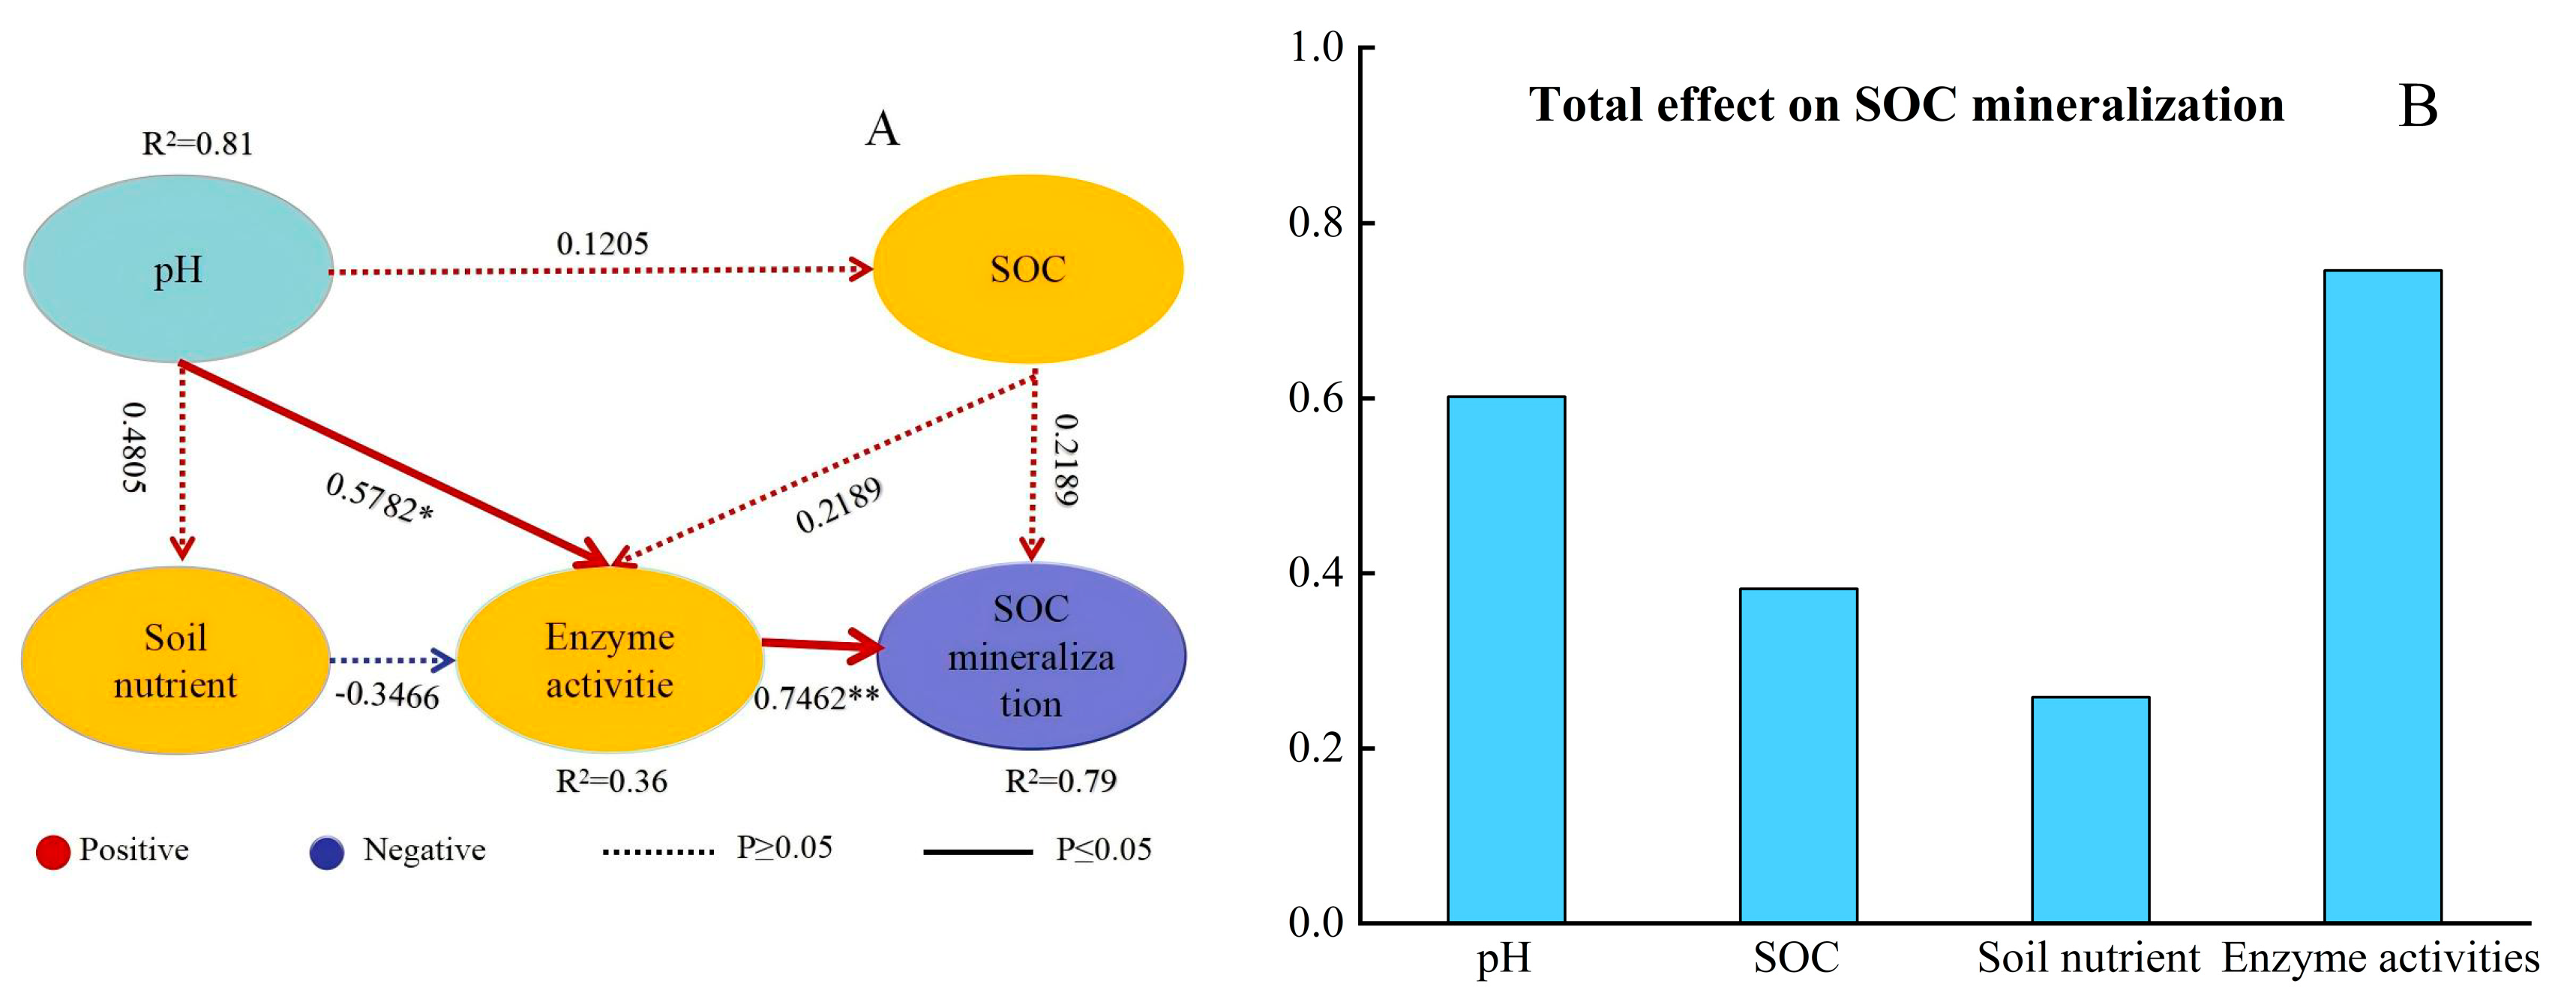
We employed structural equation modelling (SEM) to provide an integrated understanding of the major predictors of SOC mineralization, including pH, soil nutrients, SOC, and enzyme activities (Figure 7). Both SOC and enzyme activities positively influenced SOC mineralization, with the effect of enzyme activities being more pronounced than that of SOC. pH had a positive effect on enzyme activities and SOC, but its impact on enzyme activities was stronger than on SOC. Additionally, while SOC had a positive influence on enzyme activity, the effect was not statistically significant.

4. Discussion

4.1. Effects of Straw Addition on Carbon Dioxide Emission

Under four straw addition levels, SOC exhibited different mineralization characteristics. The addition of straw significantly increased cumulative CO2 emissions (Figure 1) and emissions rate (Figure 2). The emissions and rate increased with higher levels of straw addition [16,44], which was consistent with the findings of Lang et al. [15], who used wheat straw at varying levels (0, 1, 4, 6, 8, and 10 t ha−1) in orchard soil, and Shar et al. [45] who investigated the effect of maize straw and coal gas residue in combination with biochar under different treatment conditions. Although the straw types and application methods in these studies differ from those in our experiment, both studies, like ours, observed that increasing straw application levels significantly enhanced CO2 emissions, indicating the strong influence of straw addition on SOC mineralization. Thus, straw additions resulted in higher SOC losses through mineralization during the 79-day incubation period. The increase in unstable carbon during straw decomposition and the decrease in stability of soil organic matter could lead to an elevation in CO2 release [16]. On the one hand, the addition of straw enhanced the availability of carbon substrates, soil metabolic activity, respiration, and microbial activity [46,47,48]. Additionally, higher carbon substrate availability provides a more potent stimulus for microorganisms, resulting in greater CO2 emissions [49]. Especially under the W4 treatment, the CO2 release further demonstrates the contribution of straw addition to SOC mineralization. Notably, although cumulative CO2 emissions increased with increasing the amount of straw addition, the amount of CO2 emissions observed was greater than the carbon input from the straw itself (Figure 1). This phenomenon can be explained by the co-metabolism theory, which posits that when exogenous organic matter is added to soil, it provides an organic carbon source for microorganisms, activating microbial activity and increasing microbial populations in the short term. As microorganisms degrade the exogenous organic carbon, they also co-metabolize native organic carbon sources in the soil, resulting in additional CO2 emissions beyond the carbon added with the straw [16,17].
We observed that cumulative CO2 emissions exhibited a rapid increase during the 3rd to 7th day of incubation in different soil layers and treatments (Figure 1). In the initial phase of straw decomposition, there were more readily degradable substances that could be absorbed and utilized by microorganisms, thereby facilitating the rapid decomposition of the straw [50]. However, as the labile carbon substrates were exhausted, microbial activity decreased [35]. Additionally, in the later stages of cultivation, lignin and xylan, which were more resistant to decomposition in straw, required a relatively long time to be consumed by soil microorganisms, resulting in a slower rise in cumulative CO2 emissions [51]. This pattern of slow CO2 emission rise as decomposition progresses aligns with previous studies [15], who observed similar trends in the decomposition of straw over time. Our results support these findings, confirming that as more recalcitrant carbon components, such as lignin and xylan, are decomposed, the rate of CO2 emissions slows down in the later stages of incubation [51]. In addition to CO2 emission dynamics, the decomposition rate of straw followed a clear temporal pattern consistent with the availability of labile and recalcitrant organic fractions. During the initial stage of incubation, the rapid mineralization of easily degradable compounds, such as cellulose, hemicellulose, and soluble sugars, resulted in high CO2 fluxes and elevated enzyme activities. As incubation progressed, the decomposition rate declined markedly due to the depletion of labile carbon pools and the predominance of structurally complex compounds, such as lignin and cutin, which decompose more slowly [51]. This gradual shift from fast to slow decomposition phases reflects the transition from microbial utilization of fresh straw-derived substrates to the breakdown of more resistant organic matter. Similar biphasic decomposition patterns have been widely reported in incubation studies involving cereal straw, reinforcing that the decomposition rate is closely coupled with microbial activity, enzyme production, and substrate availability. Furthermore, the SOC pool, labile C content, enzyme activities, pH, and the diversity and activity of soil microorganisms decreased with increasing soil depth, leading to corresponding changes in cumulative CO2 emissions [52,53].

4.2. Effects of Straw Addition on Soil Physicochemical Properties

Our results indicated that soil nutrients increased following the addition of straw. This suggests that straw returning has a specific effect on improving soil nutrients; similar results were also found by Poeplau and Don [46]. After straw is returned to the soil, organic matter in the straw is decomposed and released, which not only enhances the content of SOC but also increases pH, total nitrogen (TN), total phosphorus (TP), available nitrogen, and available phosphorus (AP) [23,24,25,26,27]. Under natural conditions, microorganisms remain largely dormant; however, their activity is stimulated when straw is introduced into the soil, thereby accelerating the decomposition of straw. During this process, microorganisms can not only release CO2 into the atmosphere through catabolism but also convert straw carbon into soil nutrients through anabolism, storing it in the soil [23,54,55,56]. The increase in available nitrogen (NH4+-N, NO3-N) and AP was also related to the rise in SOC content following straw return [57], because SOC mineralization was the main source of soil-available nutrients. This process is achieved through the decomposition of organic matter, which produces acids that weaken the fixation of nitrogen and phosphorus in the soil [58]. It is worth noting that the soil used in this study had not previously received straw return or similar organic amendments. Therefore, the initial SOC content and microbial conditions reflect a baseline state unaffected by prior straw incorporation, allowing the observed responses to be attributed solely to the experimental treatments. We also discovered that the addition of straw significantly increased the soil pH. The decarboxylation of organic anions from straw, along with ammonification during the later stages of decomposition [59], can lead to changes in soil pH following the addition of straw. However, the gradual decline in pH observed from day 7 to day 79 likely resulted from the microbial decomposition of straw and the subsequent production of acidic intermediates. As microorganisms efficiently metabolize degradable carbon fractions, they release low-molecular-weight organic acids (such as acetic, lactic, and oxalic acids) and CO2, which dissolve in soil water to form carbonic acid. These processes collectively lower the soil pH over time. Moreover, increased nitrification activity during later incubation stages can further contribute to acidification by converting ammonium to nitrate, releasing H+ ions in the process. This microbial-driven acidification pattern is consistent with previous findings in straw-amended soils. However, the extent of these changes depends on the concentrations of alkalinity (excess cations) and nitrogen in plant residues, the level of straw addition and decomposition, as well as the initial soil pH and its buffer capacity [59].

4.3. Effects of Straw Addition on Soil Organic Carbon and Dissolved Organic Carbon

4.3.1. Soil Organic Carbon

This study found that the content of SOC increased with higher levels of straw addition, indicating that the addition of straw mitigated the loss of SOC (Figure 4). This finding is consistent with those of Akhtar et al. [60]. First, the newly added carbon may be protected through direct physical and chemical bonding with the soil mineral complex [61]. Second, this increase is also related to the conversion of straw into fungal biomass, especially under conditions of sufficient carbon sources [62,63], as fungal biomass accumulates in the soil as fungal necromass [64]. Although straw input levels influence the effects of straw return on SOC dynamics, the magnitude of this effect varies among studies [65]. For example, Stewart et al. [66] and Cotrufo et al. [67] found that the capacity for SOC storage is finite, particularly in surface soils, indicating an upper limit or saturation level for SOC stocks. In our study, although SOC increased with higher levels of straw addition, the rate of increase between the W2 and W4 treatments was smaller than that observed between the W1 and W2 treatments. This diminishing response suggests that SOC accumulation may be approaching a temporary saturation point, where further increases in carbon input yield progressively smaller gains. Such a pattern is consistent with the SOC saturation concept described by Stewart et al. [66] and Cotrufo et al. [66], implying that physical and biochemical protection mechanisms within soil aggregates limit additional carbon stabilization at high input levels. The apparent contradiction between the mitigation of SOC losses through straw addition and the decline of SOC over time can be explained by the temporal dynamics of carbon transformation (Figure 4). Although straw addition initially increased SOC content due to the incorporation of fresh organic matter, the observed decline over time reflects the progressive mineralization of labile carbon fractions. During the early incubation phase, microbial decomposition of easily degradable substrates led to temporary SOC accumulation. Still, as incubation continued, these labile pools were exhausted, and microbial respiration consumed both straw-derived and native organic carbon [67]. This transition from an accumulation phase to a mineralization-dominated phase explains why SOC decreased over time despite the overall enhancing effect of straw addition. In the short term, straw inputs provide fresh organic matter that enhances microbial biomass and enzyme activity, promoting the stabilization of new carbon through aggregation and mineral association. However, as incubation progresses, the labile fraction of the added carbon is rapidly decomposed, resulting in a gradual decline in SOC content. This reflects a shift from the initial accumulation phase to a mineralization-dominated phase, during which microbial respiration consumes both straw-derived and native carbon pools [67,68]. Similar temporal patterns have been reported by Yang et al. [69], who observed that straw addition initially increases SOC but is followed by a net decrease due to enhanced microbial decomposition. Thus, the short-term mitigation of SOC loss represents a transient stabilization process rather than a permanent accumulation. The increase in microbial activity during the initial phase of incubation likely enhances microbial assimilation of substrate C, thereby boosting the contribution of microbial metabolites to SOC stabilization. However, microbial activity decreases with the extension of incubation time, leading to a reduction in SOC content during the later stages of incubation [67]. Nevertheless, according to a meta-analysis on the effects of straw carbon input on carbon dynamics in agricultural soils by Liu et al. [70], long-term experiments (lasting more than 15 years) showed no significant changes in soil carbon over time.
Our correlation analysis and SEM results further confirmed that SOC dynamics were strongly linked to soil physicochemical and biological parameters. SOC exhibited significant positive correlations with DOC, pH, and extracellular enzyme activities, indicating that both abiotic and biotic factors jointly regulated carbon turnover. In particular, the SEM model revealed that enzyme activity exerted the strongest direct influence on SOC mineralization, while SOC and pH contributed indirectly by stimulating microbial metabolism. These findings validate our initial hypothesis that the addition of straw enhances microbial activity, which in turn accelerates the decomposition and transformation of organic carbon pools. The causal pathways identified through SEM, linking straw inputs, microbial activity, soil nutrients, and SOC turnover, highlight that microbial enzyme activity acts as the central mediator connecting carbon input with SOC decomposition and stabilization. This mechanistic insight supports the co-metabolism theory, demonstrating that external carbon sources simultaneously promote microbial growth and the mineralization of native SOC.

4.3.2. Dissolved Organic Carbon

In the study, the DOC content increased with increasing straw addition levels, and significant differences were observed among treatments. This supports previous findings [71], indicating that straw returning can promote the accumulation and transformation of SOC. Our analysis revealed that DOC was significantly associated with SOC (Figure 4), with the increase in DOC being more pronounced than that of SOC, suggesting that the active components of SOC responded more sensitively to straw return. Previous studies have demonstrated that the active SOC fractions, such as microbial biomass carbon (MBC), particulate organic C (POC), DOC, and light fraction organic C (LFOC), could serve as appropriate indicators of the direction and magnitude of soil C cycling after straw return [70]. These fractions are easily decomposed and mineralized by soil microorganisms [72]. The enhanced decomposition of these labile carbon fractions increases DOC availability, which serves as a readily accessible substrate for microbial metabolism. Elevated DOC levels promote microbial growth and enzyme production (such as β-glucosidase and cellulase), accelerating SOC mineralization through intensified oxidative and hydrolytic processes. In this study, the relative increase in DOC content was higher that of SOC across straw addition treatments, indicating that DOC was more sensitive to straw inputs than SOC. This shows that greater DOC accumulation coincided with higher cumulative CO2 emissions, suggesting that elevated DOC availability directly fueled microbial respiration and SOC decomposition. Thus, the increase in DOC not only reflects enhanced carbon solubility but also serves as a key driver of microbial-mediated soil carbon turnover. The strong positive association between DOC and enzyme activities observed in the correlation analysis also suggests that higher DOC availability stimulates microbial metabolism, reinforcing the feedback between labile carbon pools and SOC mineralization. It is important to note that the observed increase in DOC refers to treatment-level differences among straw addition rates, whereas the subsequent decline describes the temporal trend over the course of incubation. In other words, DOC concentrations were higher in straw-amended soils compared to the control but decreased over time as labile carbon sources were progressively mineralized [30]. We also observed that the content of DOC decreased with prolonged incubation time. Solubilized OM is readily biodegradable and is rapidly consumed by soil microorganisms over time [30,48,73], resulting in corresponding changes in DOC content during the latter stage of incubation. At the early stage of incubation (day 7), DOC concentrations reached their peak across all treatments. This transient increase can be attributed to the rapid decomposition of easily degradable straw components [50], which released soluble organic compounds into the soil solution. In addition, enhanced microbial activity during this phase promoted the secretion of extracellular enzymes and the turnover of microbial biomass, leading to the release of microbial metabolites that further elevated DOC levels. Such an early DOC surge has been widely reported in incubation studies and reflects the initial pulse of labile carbon availability following straw incorporation.

4.4. Effects of Straw Addition on Enzyme Activities and Microbial Processes

Enzyme activity plays a crucial role in regulating the decomposition and transformation of organic matter following the addition of straw. In this study, the activities of extracellular enzymes associated with the cycling of carbon, nitrogen, and phosphorus, such as β-glucosidase (BG), β-cellobiosidase (CBH), leucine aminopeptidase (LAP), N-acetylglucosaminidase (NAG), and alkaline phosphatase (ALP), increased significantly with higher levels of straw input [68]. This enhancement reflects the stimulatory effect of fresh carbon inputs on microbial metabolism, as microorganisms secrete enzymes to degrade complex straw components (e.g., cellulose and hemicellulose) into simpler, bioavailable compounds [74]. Elevated enzyme activities in the W2 and W4 treatments indicate that straw return provided sufficient energy and nutrient sources to support microbial growth and enzymatic synthesis. The increase in enzyme activities also suggests that microorganisms were responding to nutrient limitations by producing more enzymes to acquire carbon and nitrogen from organic substrates [75]. As the incubation progressed, enzyme activities gradually declined, reflecting the depletion of labile carbon pools and a reduction in microbial turnover. These temporal patterns align with earlier reports, which show that enzyme activity dynamics depend on substrate quality, carbon availability, and microbial energy demands [30,47,48,76,77]. Interestingly, the W1 treatment exhibited the highest enzyme activity on day 7, whereas the W4 treatment surpassed all other treatments by day 79. This shift likely reflects the changing availability of carbon substrates and the adaptation of microbes over time. During the early incubation stage, the moderate straw input in W1 provided an optimal balance between available carbon and microbial demand, leading to rapid microbial activation and peak enzyme secretion. In contrast, the highest straw input in W4 initially contained a larger proportion of complex, slowly decomposing compounds (e.g., lignin and cellulose), which required longer microbial adaptation and enzyme induction. As incubation progressed, microbial communities under W4 progressively decomposed these recalcitrant substrates, resulting in sustained or delayed enzyme production during the later stage. This temporal differentiation in enzyme activity among treatments illustrates how substrate quality and microbial succession jointly govern enzymatic responses under varying straw addition levels.
Furthermore, enzyme activities decreased with increasing soil depth, particularly in the 20–30 cm layer, likely due to lower nutrient availability and reduced microbial biomass in deeper horizons [78]. Because enzyme production primarily depends on microbial secretion, and microbial survival relies on SOC and mineral nutrients as energy sources, a decline in soil fertility and aeration with depth can constrain enzymatic activity [29,79]. The lower enzyme activities observed under deeper layers may also reflect the adverse effects of tillage on microbial habitats [80]. The correlation analysis revealed strong positive associations between enzyme activity, SOC, and DOC, suggesting that enzymatic processes mediate the coupling between labile carbon availability and SOC mineralization [72]. This strong correlation can be attributed to the mutual feedback between microbial activity and the supply of carbon substrates. Increased SOC and DOC provide essential carbon and energy sources that stimulate microbial growth and enzyme synthesis. In turn, elevated enzyme activities enhance the decomposition of organic substrates, generating additional DOC and releasing nutrients that further sustain microbial metabolism [80]. This cyclical interaction illustrates that enzyme production is both a response to and a driver of SOC and DOC dynamics, with microbes adjusting enzyme expression according to substrate quality and nutrient demand. Such mechanisms have been widely documented in carbon turnover studies, where enzyme-mediated hydrolysis of polysaccharides and proteins regulates the balance between carbon stabilization and mineralization. Higher enzyme activity accelerated the breakdown of straw-derived polymers, resulting in increased DOC concentration and, consequently, increased CO2 emissions during incubation. The SEM analysis further confirmed that enzyme activity exerted the strongest direct influence on SOC mineralization among all examined factors. These findings demonstrate that microbial enzymatic regulation is central to carbon turnover under straw return conditions [81]. Overall, enhanced enzyme-mediated transformation of organic matter promotes nutrient cycling while balancing carbon stabilization and mineralization, supporting the hypothesis that microbial processes are key drivers of SOC dynamics in straw-amended soils.

4.5. Effects of Straw Addition on SOC Mineralization

The straw return has a significant impact on SOC mineralization (Figure 1) [82,83]. SOC mineralization, which refers to the change in microbial decomposition of SOC in response to carbon inputs, is a crucial aspect of global carbon cycling [5,84]. It is a globally ubiquitous phenomenon following straw addition, which depends on several factors, including the quality and quantity of exogenous organic carbon, soil properties, and microbial characteristics [15,46,68,85,86]. In our studies, a positive correlation was found between SOC mineralization and pH, SOC, DOC, and enzyme activities (Figure 6), suggesting that straw addition stimulated the growth and activity of microorganisms [46,47,48]. Specifically, higher soil pH may have enhanced SOC mineralization by creating a more favorable environment for microbial respiration and enzymatic reactions, as neutral to slightly alkaline conditions improve enzyme stability and substrate accessibility. Increased SOC provides more organic substrates for microbial decomposition, while higher DOC offers readily available carbon sources that can be rapidly metabolized, thereby stimulating microbial activity and enzyme synthesis. Together, these factors increase microbial energy availability and enzymatic efficiency, leading to greater SOC mineralization following straw return. This also implies that pH, SOC, DOC, and enzyme activities were the essential factors leading to an increase in SOC mineralization. Previous studies have demonstrated that SOC mineralization is driven by plants and rhizo-deposits, microbial biomass, microbial diversity, warming, and SOC content [5,87,88,89]. In addition to pH and AP, these factors can also drive SOC mineralization by altering microbial communities and enzyme activity [24,90]. Our study also found that the changes in pH, SOC, and enzyme activities were the most fundamental causes of SOC mineralization changes in straw return (Figure 7). This relationship reflects the synergistic regulation of SOC mineralization by abiotic and biotic factors. A higher soil pH creates a more favorable biochemical environment for microbial respiration and enzyme catalysis, enhancing the breakdown of organic matter. Increased SOC provides a larger substrate pool for microbial utilization, while elevated enzyme activities directly accelerate the conversion of complex carbon compounds into simpler, metabolizable forms. These interactions suggest that SOC mineralization in straw-amended soils is primarily governed by microbial-driven enzymatic processes, which are modulated by soil chemical conditions. The SEM results further confirmed that enzyme activity had the most substantial direct effect on SOC mineralization, indicating that microorganisms and their enzymes act as the key mediators linking carbon input, decomposition, and CO2 release. pH and SOC had a positive effect on SOC mineralization, whereas enzyme activities had a greater influence than SOC (Figure 7). This indicated the crucial role of enzyme activities in regulating SOC mineralization, also demonstrating that microorganisms can adapt to resource scarcity caused by straw input [76]. However, some studies suggest that TN and TP, as well as C: N and N:P ratios in soil, play a significant role in determining the direction of SOC mineralization [88]. Overall, while soil physicochemical properties, SOC, and enzyme activities directly or indirectly drive SOC mineralization, all these effects are achieved through the mediation of microorganisms.
Microorganisms play a crucial role in the decomposition of straw, with a significant portion remaining in a dormant state under natural conditions. The microbial activity, abundance, or composition can change when straw is introduced into the soil. Despite the presence of a wide variety of microbial types in the soil, only a select few are adapted to the dominant conditions, with the majority remaining dormant [91]. Bacteria played an important role in trapping and metabolizing the majority of readily available organic matter following the addition of straw. Although this study did not directly sequence or identify specific bacterial taxa, previous studies in similar incubation systems have consistently shown that fast-growing r-strategist bacterial groups—such as Proteobacteria (e.g., Pseudomonas, Burkholderia) and Bacteroidetes—are primarily responsible for the rapid mineralization of labile carbon fractions during the early incubation stage. Their high growth rates and metabolic versatility enable efficient utilization of soluble carbon compounds released from straw decomposition, leading to increased CO2 emissions within the first few days to weeks [92]. In particular, r-strategist bacteria, characterized by their small size and rapid growth, triggered a greater CO2 emission for several days to a week or two [92]. Future work incorporating microbial community profiling (e.g., 16S rRNA sequencing) would help confirm the specific bacterial groups contributing to SOC mineralization under straw return conditions. However, as the culture period lengthened, substrate exhaustion occurred, and r-strategists died or entered a dormant state, as they were unable to utilize the SOM. In contrast, slow-growing K-strategists dominate the fungal community [37,69,93]. This is also one of the reasons for the slow increase in cumulative CO2 release during the later cultivation stage. Meanwhile, microorganisms would also be a part of C fixed up in soil as SOC or soil nutrients by anabolic metabolism. However, enzyme activities play an essential role during microbial growth and metabolic processes [56,72]. Soil microbes require a wide range of nutrient elements during their development and metabolic processes. They secrete enzymes to decompose both exogenous and native organic matter, thereby alleviating nutrient demands when available nutrients are limited due to external environmental stimuli [69]. Straw addition would have supplied a greater amount of C substrate to microorganisms throughout the entire incubation process, facilitating the synthesis of SOC-degrading enzymes capable of decomposing both straw and native SOC, thereby enhancing SOC mineralization in accordance with the co-metabolism theory [38,92]. Moreover, Zhou et al. [94] and Jastrow et al. [81] found that cumulative CO2 emissions were positively correlated with enzyme activity, further confirming the role of enzyme activity in SOC mineralization.

4.6. Limitations, Future Strategies, and Prospects

(1)
Experimental Design Considerations
While this incubation study elucidated key mechanisms of straw-induced SOC mineralization under controlled conditions, several limitations exist. The short-term duration (79th days) may not fully capture long-term SOC stabilization and priming dynamics observed in field settings. Although this study demonstrated a clear positive priming effect—evidenced by CO2 emissions exceeding the carbon input from straw—we did not directly quantify priming using isotopic labeling or differential carbon partitioning techniques. Therefore, future work should employ 13C- or 14C-labeled straw to quantify priming intensity and distinguish native SOC decomposition from straw-derived carbon emissions.
(2)
Environmental and Soil Context
The soil microbial community structure and function may differ under natural environmental variability, particularly with respect to temperature, soil moisture, and seasonal fluctuations in precipitation. These factors are most influential in regulating microbial activity and SOC mineralization rates. Furthermore, the loess soil used in this experiment—characterized by a fine texture, alkaline pH (8.13), and moderate SOC levels (8.06 g kg−1)—is representative of semi-arid dryland agroecosystems in northwestern China. However, the findings may not be fully generalizable to other soil types, such as clay-rich or highly organic soils, which exhibit different microbial and physicochemical dynamics.
(3)
Methodological Approaches for Future Research
Future studies should integrate advanced molecular and isotopic tools to refine our understanding of microbial-mediated carbon transformations. Recommended techniques include stable isotope probing (SIP) with 13C-labeled substrates, compound-specific isotope analysis (CSIA) to trace microbial carbon assimilation, metagenomic and meta-transcriptomic sequencing to identify functional microbial genes associated with SOC turnover, and phospholipid fatty acid (PLFA)–13C analysis to link microbial community structure with C utilization pathways. These methods will allow for clearer attribution of CO2 fluxes to microbial sources and improved quantification of priming mechanisms.
(4)
Management Practices and Applications
Strategies to optimize straw return should balance enhancing soil fertility and carbon sequestration against potential increases in CO2 emissions due to priming effects. Integrating straw return with complementary conservation practices—such as reduced tillage, crop residue mulching, cover cropping, and biochar amendment—can enhance carbon stabilization and reduce mineralization losses. Additionally, manipulating microbial communities through selective residue management or enzyme regulation (e.g., through targeted nutrient inputs or organic amendments) holds promise for sustainable soil carbon management.
In prospect, improving the mechanistic understanding of straw return effects on soil carbon mineralization will advance climate-smart agriculture and contribute to carbon neutrality goals. Integrating microbial ecology, soil chemistry, and agronomic practices will enable the development of tailored soil management strategies that optimize carbon retention while maintaining crop productivity.

5. Conclusions

This study demonstrates that straw return has a significant influence on soil carbon dynamics, with cumulative CO2 emissions increasing by approximately 310–1580% compared to the control, depending on soil depth and straw input. Enhanced straw application intensified SOC mineralization (p < 0.001) by stimulating microbial activity and enzyme functions. Higher straw input improved soil nutrient availability, labile carbon pools, and enzyme activities, which collectively accelerated CO2 emissions. The maximum straw input (14,000 kg ha−1) yielded the highest SOC content, indicating short-term enrichment rather than long-term SOC stabilization. Enzyme activities (particularly β-glucosidase, cellobiohydrolase, and alkaline phosphatase) were the strongest predictors of SOC mineralization, as confirmed by correlation and SEM analyses, supporting the co-metabolism theory whereby microorganisms simultaneously decompose both straw-derived and native SOC. While straw return improved soil fertility and nutrient cycling, it also increased CO2 emissions, revealing a trade-off between productivity and carbon loss. Optimizing straw management through balanced input levels, conservation practices, and carbon-stabilizing amendments (e.g., biochar or mineral additives) is essential to maximize carbon retention and reduce emissions. Deeper soil layers (10–30 cm) exhibited weaker microbial and enzymatic activity than surface soils, confirming vertical stratification in soil carbon turnover. Overall, this study provides mechanistic insights into the interactions among straw input, microbial processes, and soil depth, contributing to sustainable carbon management in semi-arid agroecosystems.

Author Contributions

Conceptualization, X.R. and L.C.; methodology, X.R.; software, X.R. and M.K.A.; validation, X.R. and L.C.; formal analysis, X.R. and M.K.A.; investigation, X.R.; resources, L.C.; data curation, X.R.; writing—original draft preparation, X.R. and L.C.; writing—review and editing, L.C., F.U.H. and J.W.; visualization, X.R.; supervision, L.C.; project administration, L.C.; funding acquisition, L.C. and J.W. All authors have read and agreed to the published version of the manuscript.

Funding

This work was supported by the Science and Technology Project of Gansu Province (25JRRA807), the National Key R&D Program of China (2022YFD1900300), the National Natural Science Foundation of China (32260549), and the State Key Laboratory of Aridland Crop Science, Gansu Agricultural University (GSCS-2022-Z02).

Data Availability Statement

Data available on request from the authors.

Conflicts of Interest

The authors affirm that they possess no identifiable conflicting financial interests or personal affiliations that might seem to have influenced the findings presented in this paper.

References

  1. Li, H. Evaluation on the Production of Food Crop Straw in China from 2006 to 2014. BioEnergy Res. 2017, 10, 949–957. [Google Scholar] [CrossRef]
  2. Zhao, X.; Li, R.C.; Liu, W.X.; Liu, W.S.; Xue, Y.H.; Sun, R.H.; Wei, Y.X.; Chen, Z.; Lal, R.; Dang, Y.P. Estimation of crop residue production and its contribution to carbon neutrality in China. Resour. Conserv. Recycl. 2024, 203, 107450. [Google Scholar] [CrossRef]
  3. Liang, Z.; Cao, B.; Jiao, Y.; Liu, C.; Li, X.; Meng, X.; Shi, J.; Tian, X. Effect of the combined addition of mineral nitrogen and crop residue on soil respiration, organic carbon sequestration, and exogenous nitrogen in stable organic matter. Appl. Soil Ecol. 2022, 171, 104324. [Google Scholar] [CrossRef]
  4. Blagodatsky, S.; Blagodatskaya, E.; Yuyukina, T.; Kuzyakov, Y. Model of apparent and real priming effects: Linking microbial activity with soil organic matter decomposition. Soil Biol. Biochem. 2010, 42, 1275–1283. [Google Scholar] [CrossRef]
  5. Kuzyakov, Y. Priming effects: Interactions between living and dead organic matter. Soil Biol. Biochem. 2010, 42, 1363–1371. [Google Scholar] [CrossRef]
  6. Zhao, Y.; Li, Y.; Wang, S.; Wang, J.; Xu, L. Combined application of a straw layer and flue gas desulphurization gypsum to reduce soil salinity and alkalinity. Pedosphere 2020, 30, 226–235. [Google Scholar] [CrossRef]
  7. Wu, L.; Zhang, S.; Ma, R.; Chen, M.; Wei, W.; Ding, X. Carbon sequestration under different organic amendments in saline-alkaline soils. Catena 2021, 196, 104882. [Google Scholar] [CrossRef]
  8. Angst, G.; Mueller, K.E.; Nierop, K.G.J.; Simpson, M.J. Plant- or microbial-derived? A review on the molecular composition of stabilized soil organic matter. Soil Biol. Biochem. 2021, 156, 108189. [Google Scholar] [CrossRef]
  9. Wu, H.; Sun, W.; Zhu, F.; Jiang, Y.; Huang, S.; Goloran, J.; Xue, S. Straw addition increases enzyme activities and microbial carbon metabolism activities in bauxite residue. J. Environ. Sci. 2024, 1, 332–344. [Google Scholar] [CrossRef]
  10. Sun, N.; Gao, C.; Ding, Y.; Bi, Y.; Seglah, P.A.; Wang, Y. Five-Dimensional Straw Utilization Model and Its Impact on Carbon Emission Reduction in China. Sustainability 2022, 14, 16722. [Google Scholar] [CrossRef]
  11. Zhang, H.; Cao, Y.; Lyu, J. Decomposition of different crop straws and variation in straw-associated microbial communities in a peach orchard, China. J. Arid Land 2021, 13, 152–164. [Google Scholar] [CrossRef]
  12. Li, N.; Teng, P.J.; Lei, W.Y.; Long, J.H.; Li, L.J. Effects and mechanisms of addition of different types of exogenous organic materials on priming effect of organic carbon in arable black soils. Chin. J. Eco-Agric. 2023, 31, 1588–1601. [Google Scholar] [CrossRef]
  13. Kan, Z.; Virk, A.L.; Wu, G.; Qi, J.; Ma, S.T.; Wang, X.; Zhao, X.; Lal, R. Priming effect intensity of soil organic carbon mineralization under no-till and residue retention. Appl. Soil Ecol. 2020, 147, 103445. [Google Scholar] [CrossRef]
  14. Li, S.; Cui, Y.; Xia, Z.; Zhang, X.; Zhu, M.; Gao, Y.; An, S.; Yu, W.; Ma, Q. The mechanism of the dose effect of straw on soil respiration: Evidence from enzymatic stoichiometry and functional genes. Soil Biol. Biochem. 2022, 168, 108636. [Google Scholar] [CrossRef]
  15. Lang, D.; Zhou, R.; Hao, Z.Z.P. Effect of Wheat Straw Addition on Organic Carbon Mineralisation and Bacterial Community in Orchard Soil. J. Soil Sci. Plant Nutr. 2023, 23, 4328–4341. [Google Scholar] [CrossRef]
  16. Fontaine, S.; Mariotti, A.; Abbadie, L. The priming effect of organic matter: A question of microbial competition? Soil Biol. Biochem. 2003, 35, 837–843. [Google Scholar] [CrossRef]
  17. Fontaine, S.; Henault, C.; Aamor, A.; Bdioui, N.; Bloor, J.M.G.; Maire, V.; Mary, B.; Revaillot, S.; Maron, P.A. Fungi mediate long term sequestration of carbon and nitrogen in soil through their priming effect. Soil Biol. Biochem. 2011, 43, 86–96. [Google Scholar] [CrossRef]
  18. Gan, Z.; Wang, H.; Ding, C.; Lei, M.; Yang, X.G.; Cai, J.; Qiu, Q.; Hu, Y. Effects of dissolved organic matter derived from different plant and tissues in a subtropical forest on soil priming effect and the underlying mechanisms. Acta Phytoecol. Sin. 2022, 46, 797–810. [Google Scholar] [CrossRef]
  19. Mendoza, O.; De Neve, S.; Deroo, H.; Li, H.; Françoys, A.; Sleutel, S. Soil organic carbon mineralization is controlled by the application dose of exogenous organic matter. Soil 2025, 11, 105–119. [Google Scholar] [CrossRef]
  20. Luo, Z.K.; Wang, E.L.; Sun, O.J. A meta-analysis of the temporal dynamics of priming soil carbon decomposition by fresh carbon inputs across ecosystems. Soil Biol. Biochem. 2016, 101, 96–103. [Google Scholar] [CrossRef]
  21. Sun, Z.; Liu, S.; Zhang, T.; Zhao, X.; Chen, S.; Wang, Q. Priming of soil organic carbon decomposition induced by exogenous organic carbon input: A meta-analysis. Plant Soil 2019, 443, 463–471. [Google Scholar] [CrossRef]
  22. Ren, C.; Mo, F.; Zhou, Z.; Bastida, F.; Delgado-Baquerizo, M.; Wang, J.; Zhang, X.; Luo, Y.; Griffis, T.J.; Han, X.; et al. The global biogeography of soil priming effect intensity. Glob. Ecol. Biogeogr. 2022, 31, 1679–1687. [Google Scholar] [CrossRef]
  23. Tan, C.; Cao, X.; Yuan, S.; Wang, W.; Feng, Y.; Bo, Q. Effects of Long-term Conservation Tillage on Soil Nutrients in Sloping Fields in Regions Characterized by Water and Wind Erosion. Sci. Rep. 2015, 5, 17592. [Google Scholar] [CrossRef] [PubMed]
  24. Zhuang, Y.; Zhu, J.; Shi, L.; Fu, Q.; Hu, H.; Huang, Q. Influence mechanisms of iron, aluminum and manganese oxides on the mineralization of organic matter in paddy soil. J. Environ. Manag. 2022, 301, 113916. [Google Scholar] [CrossRef]
  25. Jing, Z.; Chen, R.; Wei, S.; Feng, Y.; Zhang, J.; Lin, X. Response and feedback of C mineralization to P availability driven by soil microorganisms. Soil Biol. Biochem. 2017, 105, 111–120. [Google Scholar] [CrossRef]
  26. Wei, X.; Zhu, Z.; Liu, Y.; Luo, Y.; Deng, Y.; Xu, X.; Liu, S.; Richter, A.; Shibistova, O.; Guggenberger, G.; et al. C:N:P stoichiometry regulates soil organic carbon mineralization and concomitant shifts in microbial community composition in paddy soil. Biol. Fertil. Soils 2020, 56, 1093–1107. [Google Scholar] [CrossRef]
  27. Peixoto, L.; Elsgaard, L.; Rasmussen, J.; Olesen, J.E. Nitrogen and phosphorus co-limit mineralization of labile carbon in deep subsoil. Eur. J. Soil Sci. 2021, 72, 1879–1884. [Google Scholar] [CrossRef]
  28. Wang, C.; Morrissey, E.M.; Mau, R.L.; Hayer, M.; Pieiro, J.; Mack, M.C.; Marks, J.C.; Bell, S.L.; Miller, S.N.; Schwartz, E.; et al. The temperature sensitivity of soil: Microbial biodiversity, growth, and carbon mineralization. ISME J. 2021, 15, 2738–2747. [Google Scholar] [CrossRef]
  29. Burns, R.G.; Deforest, J.L.; Marxsen, J.; Sinsabaugh, R.L.; Stromberger, M.E.; Wallenstein, M.; Weintraub, M.N.; Zoppini, A. Soil enzymes in a changing environment: Current knowledge and future directions. Soil Biol. Biochem. 2013, 58, 216–234. [Google Scholar] [CrossRef]
  30. Mganga, K.Z.; Razavi, B.S.; Kuzyakov, Y. Microbial and enzymes response to nutrient additions in soils of Mt. Kilimanjaro region depending on land use. Eur. J. Soil Biol. 2015, 69, 33–40. [Google Scholar] [CrossRef]
  31. Sinsabaugh, R.L.; Shah, J.J.F. Ecoenzymatic stoichiometry of recalcitrant organic matter decomposition: The growth rate hypothesis in reverse. Biogeochemistry 2011, 102, 31–43. [Google Scholar] [CrossRef]
  32. Sanaullah, M.; Blagodatskaya, E.; Chabbi, A.; Rumpel, C.; Kuzyakov, Y. Drought effects on microbial biomass and enzyme activities in the rhizosphere of grasses depend on plant community composition. Appl. Soil Ecol. 2011, 48, 38–44. [Google Scholar] [CrossRef]
  33. Sinsabaugh, R.L.; Carreiro, M.M.; Repert, D.A. Allocation of extracellular enzymatic activity in relation to litter composition, N deposition, and mass loss. Biogeochemistry 2002, 60, 1–24. [Google Scholar] [CrossRef]
  34. Zhang, W.; Wang, X.; Wang, S. Addition of External Organic Carbon and Native Soil Organic Carbon Decomposition: A Meta-Analysis. PLoS ONE 2013, 8, e54779. [Google Scholar] [CrossRef]
  35. Chen, S.; Wang, Y.; Hu, Z.; Hui, G. CO2 emissions from a forest soil as influenced by amendments of different crop straws: Implications for priming effects. Catena 2015, 131, 56–63. [Google Scholar] [CrossRef]
  36. Zhao, S.; Zhang, S.; Paz-Ferreiro, J. Linkages between straw decomposition rate and the change in microbial fractions and extracellular enzyme activities in soils under different long-term fertilization treatments. PLoS ONE 2018, 13, e0202660. [Google Scholar] [CrossRef]
  37. Haider, F.U.; Virk, A.L.; Nian, L.; Farooq, M.; Liu, J.; Yang, M.; Huang, W.; Li, Y. Soil Organic Carbon and Aggregate Associated Changes in Three Subtropical Evergreen Forest Ecosystems of China. J. Soil Sci. Plant Nutr. 2024, 24, 7480–7490. [Google Scholar] [CrossRef]
  38. Carter, M.; Gregorich, E. Soil Sampling and Methods of Analysis, 2nd ed.; Soil Sampling Designs; CRC Press: Boca Raton, FL, USA, 2007; Volume 10, p. 1201/9781420005271. [Google Scholar] [CrossRef]
  39. Vance, E.D.; Brookes, P.C.; Jenkinson, D.S. An extraction method for measuring soil microbial biomass C. Soil Biol. Biochem. 1987, 19, 703–707. [Google Scholar] [CrossRef]
  40. Willis, R.B.; Montgomery, M.E.; Allen, P.R. Improved Method for Manual, Colorimetric De-termination of Total Kjeldahl Nitrogen Using Salicylate. J. Agric. Food Chem. 1996, 44, 1804–1807. [Google Scholar] [CrossRef]
  41. Cavagnaro, T.R.; Jackson, L.E.; Six, J.; Ferris, H.; Goyal, S.; Asami, D.; Scow, K.M. Arbuscu-lar Mycorrhizas, Microbial Communities, Nutri-ent Availability, and Soil Aggregates in Organic Tomato Production. Plant Soil 2006, 282, 209–225. [Google Scholar] [CrossRef]
  42. Watanabe, F.S.; Olsen, S.R. Test of an Ascorbic Acid Method for Determining Phosphorus in Water and NaHCO3 Extracts from Soil. Soil Sci. Soc. Am. J. 1965, 291, 677–678. [Google Scholar] [CrossRef]
  43. Marx, M.C.; Wood, M.; Jarvis, S.C. A microplate fluorimetric assay for the study of enzyme diversity in soils. Soil Biol. Biochem. 2001, 33, 1633–1640. [Google Scholar] [CrossRef]
  44. Diacono, M.; Montemurro, F. Long-term effects of organic amendments on soil fertility. A review. Agron. Sustain. Dev. 2010, 30, 401–422. [Google Scholar] [CrossRef]
  45. Shar, A.G.; Peng, Y.; Tian, X.; Siyal, T.A.; Hessini, K. Contrasting effects of maize residue, coal gas residue and their biochars on nutrient mineralization, enzyme activities and CO2 emissions in sandy loess soil. Saudi J. Biol. Sci. 2021, 28, 4155–4163. [Google Scholar] [CrossRef]
  46. Poeplau, C.; Don, A. Carbon sequestration in agricultural soils via cultivation of cover crops—A meta-analysis. Agric. Ecosyst. Environ. 2015, 200, 33–41. [Google Scholar] [CrossRef]
  47. Sanz-Cobena, A.; Garda-Marco, S.; Quemada, M.; Gabriel, J.L.; Almendros, P.; Vallejo, A. Do cover crops enhance N2O, CO2 or CH4 emissions from soil in Mediterranean arable systems? Sci. Total Environ. 2014, 466–467, 164–174. [Google Scholar] [CrossRef]
  48. Kuzyakov, Y.; Friedel, J.K.; Stahr, K. Review of mechanisms and quantification of priming effects. Soil Biol. Biochem. 2000, 32, 1485–1498. [Google Scholar] [CrossRef]
  49. Blagodatskaya, E.; Kuzyakov, Y. Mechanisms of real and apparent priming effects and their dependence on soil microbial biomass and community structure: Critical review. Biol. Fertil. Soils 2008, 45, 115–131. [Google Scholar] [CrossRef]
  50. Cao, Y.F.; Zhang, H.; Liu, K.; Dai, Y.C. Organic acids variation in plant residues and soils among agricultural treatments. Agron. J. 2015, 107, 2171–2180. [Google Scholar] [CrossRef]
  51. Yang, C.; Wang, X.; Miao, F.; Li, Z.; Tang, W.; Sun, J. Assessing the effect of soil salinization on soil microbial respiration and diversities under incubation conditions. Appl. Soil Ecol. 2020, 155, 103671. [Google Scholar] [CrossRef]
  52. Qin, S.; Kou, D.; Mao, C.; Chen, Y.; Chen, L.; Yang, Y. Temperature sensitivity of permafrost carbon release mediated by mineral and microbial properties. Sci. Adv. 2021, 7, eabe3596. [Google Scholar] [CrossRef]
  53. Luo, Y.; Durenkamp, M.; Nobili, M.D.; Lin, Q.; Brookes, P.C. Short term soil priming effects and the mineralisation of biochar following its incorporation to soils of different pH. Soil Biol. Biochem. 2011, 43, 2304–2314. [Google Scholar] [CrossRef]
  54. Fontaine, S.; Barot, S.; Barré, P.; Bdioui, N.; Mary, B.; Rumpel, C. Stability of organic carbon in deep soil layers controlled by fresh carbon supply. Nature 2007, 450, 277–280. [Google Scholar] [CrossRef]
  55. Shen, C.; Wang, J.; Jing, Z. Plant diversity enhances soil fungal network stability indirectly through the increase of soil carbon and fungal keystone taxa richness. Sci. Total Environ. 2022, 8, 151737. [Google Scholar] [CrossRef]
  56. Tamura, M.; Harayil, N. Plant litter chemistry and microbial priming regulate the accrual, composition and stability of soil carbon in invaded ecosystems. New Phytol. 2014, 203, 110–124. [Google Scholar] [CrossRef]
  57. Cao, H.; Jia, M.; Song, J.; Xun, M.; Yang, H. Rice-straw mat mulching improves the soil integrated fertility index of apple orchards on cinnamon soil and fluvo-aquic soil. Sci. Hortic. 2020, 278, 109837. [Google Scholar] [CrossRef]
  58. Shao, Y.; Xie, Y.; Wang, C.; Yue, J.; Yao, Y.; Li, X.; Liu, W.; Zhu, Y.; Guo, T. Effects of different soil conservation tillage approaches on soil nutrients, water use and wheat maize yield in rain fed dry-land regions of North China. Eur. J. Agron. 2016, 81, 37–45. [Google Scholar] [CrossRef]
  59. Xu, J.M.; Tang, C.; Chen, Z.L. The role of plant residues in pH change of acid soils differing in initial pH. Soil Biol. Biochem. 2006, 38, 709–719. [Google Scholar] [CrossRef]
  60. Akhtar, K.; Wang, W.; Ren, G.; Khan, A.; Yang, G. Changes in soil enzymes, soil properties, and maize crop productivity under wheat straw mulching in Guanzhong, China. Soil Tillage Res. 2018, 182, 94–102. [Google Scholar] [CrossRef]
  61. Wieder, W.R.; Grandy, A.S.; Kallenbach, C.M.; Bonan, G.B. Integrating microbial physiology and physio-chemical principles in soils with the MIcrobial-MIneral Carbon Stabilization (MIMICS) model. Biogeosciences 2014, 11, 3899–3917. [Google Scholar] [CrossRef]
  62. Wang, B.; An, S.; Liang, C.; Liu, Y.; Kuzyakov, Y. Microbial necromass as the source of soil organic carbon in global ecosystems. Soil Biol. Biochem. 2021, 162, 108422. [Google Scholar] [CrossRef]
  63. Zhu, E.; Cao, Z.; Jia, J.; Liu, C.; Feng, X. Inactive and inefficient: Warming and drought effect on microbial carbon processing in alpine grassland at depth. Glob. Change Biol. 2021, 27, 2241–2253. [Google Scholar] [CrossRef]
  64. Yang, Y.; Xie, H.; Mao, Z.; Bao, X.; He, H.; Zhang, X.; Liang, C. Fungi determine increased soil organic carbon more than bacteria through their necromass inputs in conservation tillage croplands. Soil Biol. Biochem. 2022, 167, 108587. [Google Scholar] [CrossRef]
  65. West, T.O.; Marland, G. A synthesis of carbon sequestration, carbon emissions, and net carbon flux in agriculture: Comparing tillage practices in the United States. Agric. Ecosyst. Environ. 2002, 91, 217–232. [Google Scholar] [CrossRef]
  66. Stewart, C.E.; Paustian, K.; Conant, R.T.; Plante, A.F.; Six, J. Soil carbon saturation: Concept, evidence and evaluation. Biogeochemistry 2007, 86, 19–31. [Google Scholar] [CrossRef]
  67. Cotrufo, M.F.; Wallenstein, M.D.; Boot, C.M.; Denef, K.; Paul, E. The Microbial Efficiency-Matrix Stabilization (MEMS) framework integrates plant litter decomposition with soil organic matter stabilization: Do labile plant inputs form stable soil organic matter? Glob. Change Biol. 2013, 19, 988–995. [Google Scholar] [CrossRef]
  68. Allison, S.D.; Vitousek, P.M. Responses of extracellular enzymes to simple and complex nutrient inputs. Soil Biol. Biochem. 2005, 37, 937–944. [Google Scholar] [CrossRef]
  69. Yang, Y.; Liu, H.; Dai, Y.; Tian, H.; Zhou, W.; Lv, J. Soil organic carbon transformation and dynamics of microorganisms under different organic amendments. Sci. Total Environ. 2021, 750, 141719. [Google Scholar] [CrossRef]
  70. Liu, C.; Lu, M.; Cui, J.; Li, B.; Fang, C. Effects of straw carbon input on carbon dynamics in agricultural soils: A meta-analysis. Glob. Change Biol. 2014, 20, 1366–1381. [Google Scholar] [CrossRef]
  71. Shu, X.; Hu, Y.; Liu, W.; Xia, L.; Zhang, Y.; Zhou, W.; Liu, W.; Zhang, Y. Linking between soil properties, bacterial communities, enzyme activities, and soil organic carbon mineralization under ecological restoration in an alpine degraded grassland. Front. Microbiol. 2023, 14, 1131836. [Google Scholar] [CrossRef]
  72. Liang, Y.; Li, X.; Zha, T.; Zhang, X. Vegetation Restoration Alleviated the Soil Surface Organic Carbon Redistribution in the Hillslope Scale on the Loess Plateau, China. Front. Environ. Sci. 2021, 8, 614761. [Google Scholar] [CrossRef]
  73. Novara, A.; Mantia, L.T.; Rühl, J.; Badalucco, L.; Kuzyakov, Y.; Gristina, L.; Laudicina, V.A. Dynamics of soil organic carbon pools after agricultural abandonment. Geoderma 2014, 235–236, 191–198. [Google Scholar] [CrossRef]
  74. Chen, Q.; Liu, Z.; Zhou, J.; Xu, X.; Zhu, Y. Long-term straw mulching with nitrogen fertilization increases nutrient and microbial determinants of soil quality in a maize–wheat rotation on China’s Loess Plateau. Sci. Total Environ. 2021, 775, 145930. [Google Scholar] [CrossRef]
  75. Shahbaz, M.; Kuzyakov, Y.; Sanaullah, M.; Heitkamp, F.; Zelenev, V.; Kumar, A.; Blagodatskaya, E. Microbial decomposition of soil organic matter is mediated by quality and quantity of crop residues: Mechanisms and thresholds. Biol. Fertil. Soils 2017, 53, 287–301. [Google Scholar] [CrossRef]
  76. Blagodatskaya, E.; Khomyakov, N.; Myachina, O.; Bogomolova, I.; Blagodatsky, S.; Kuzyakov, Y. Microbial interactions affect sources of priming induced by cellulose. Soil Biol. Biochem. 2014, 74, 39–49. [Google Scholar] [CrossRef]
  77. Xiao, C.; Guenet, B.; Zhou, Y.; Su, J.; Janssens, I.A. Priming of soil organic matter decomposition scales linearly with microbial biomass response to litter input in steppe vegetation. Oikos 2015, 124, 649–657. [Google Scholar] [CrossRef]
  78. Zhang, C.; Tayyab, M.; Abubakar, A.Y.; Yang, Z.; Pang, Z.; Islam, W.; Lin, Z.; Li, S.; Luo, J.; Fan, X.; et al. Bacteria with Different Assemblages in the Soil Profile Drive the Diverse Nutrient Cycles in the Sugarcane Straw Retention Ecosystem. Diversity 2019, 11, 194. [Google Scholar] [CrossRef]
  79. Pan, Z.; Cai, X.; Cai, L.; Dong, B.; Haider, F.U.; Bo, Y.; Hu, Z.; Li, A.; Xue, Q. Soil and Microbial Biomass Response to Land-Use Changes in the Loess Plateau. Sustainability 2024, 16, 10496. [Google Scholar] [CrossRef]
  80. Acosta-Martínez, V.; Cruz, L.; Sotomayor-Ramírez, D.; Pérez-Alegría, L. Enzyme activities as affected by soil properties and land use in a tropical watershed. Appl. Soil Ecol. 2007, 35, 35–45. [Google Scholar] [CrossRef]
  81. Jastrow, J.D.; Amonette, J.E.; Bailey, V.L. Mechanisms controlling soil carbon turnover and their potential application for enhancing carbon sequestration. Clim. Change 2007, 80, 5–23. [Google Scholar] [CrossRef]
  82. Korai, P.; Sial, T.; Pan, G.; Abdelrahman, H.; Sikdar, A.; Kumbhar, F.; Channa, S.; Ali, E.; Zhang, J.; Jörg, R.; et al. Wheat and maize-derived water-washed and unwashed biochar improved the nutrients phytoavailability and the grain and straw yield of rice and wheat: A field trial for sustainable management of paddy soils. J. Environ. Manag. 2021, 297, 113250. [Google Scholar] [CrossRef] [PubMed]
  83. Haider, F.U.; Virk, A.L.; Zhou, S.; Ul Ain, N.; Aguila, L.C.R.; Siddique, K.H.; Farooq, M.; Li, Y. Impact of silicon nitride nanoparticles on soil organic carbon dynamics in subtropical evergreen forest ecosystems of China: An incubation study. Sci. Total Environ. 2025, 965, 178682. [Google Scholar] [CrossRef]
  84. Pan, Z.; Cai, X.; Bo, Y.; Guan, C.; Cai, L.; Haider, F.U.; Li, X.; Yu, H. Response of soil organic carbon and soil aggregate stability to changes in land use patterns on the Loess Plateau. Sci. Rep. 2024, 14, 31775. [Google Scholar] [CrossRef]
  85. Bertrand, I.; Delfosse, O.; Mary, B. Carbon and nitrogen mineralization in acidic, limed and calcareous agricultural soils: Apparent and actual effects. Soil Biol. Biochem. 2007, 39, 276–288. [Google Scholar] [CrossRef]
  86. Zhang, J.; Sayer, E.J.; Zhou, J.; Li, Y.; Li, Y.; Li, Z.; Wang, F. Long-term fertilization modifies the mineralization of soil organic matter in response to added substrate. Sci. Total Environ. 2021, 798, 149341. [Google Scholar] [CrossRef] [PubMed]
  87. Lloyd, D.A.; Ritz, K.; Paterson, E.; Kirk, G.J.D. Effects of soil type and composition of rhizodeposits on rhizosphere priming phenomena. Soil Biol. Biochem. 2016, 103, 512–521. [Google Scholar] [CrossRef]
  88. Razanamalala, K.; Razafimbelo, T.; Maron, P.A.; Ranjard, L.; Chemidlin, N.; Lelièvre, M.; Dequiedt, S.; Ramaroson, V.H.; Marsden, C.; Becquer, T. Soil microbial diversity drives the priming effect along climate gradients: A case study in Madagascar. ISME J. 2017, 12, 451–462. [Google Scholar] [CrossRef]
  89. Hopkins, F.M.; Filley, T.R.; Gleixner, G.; Lange, M.; Top, S.M.; Trumbore, S.E. Increased belowground carbon inputs and warming promote loss of soil organic carbon through complementary microbial responses. Soil Biol. Biochem. 2014, 76, 57–69. [Google Scholar] [CrossRef]
  90. Saviozzi, A.; Cardelli, R.; Puccio, R.D. Impact of Salinity on Soil Biological Activities: A Laboratory Experiment. Commun. Soil Sci. Plant Anal. 2011, 42, 358–367. [Google Scholar] [CrossRef]
  91. Swift, M.J.; Heal, O.W.; Anderson, J.M. Decomposition in terrestrial ecosystems. Stud. Ecol. 1979, 5, 2772–2774. [Google Scholar] [CrossRef]
  92. Wang, Q.; Wang, Y.; Wang, S.; He, T.; Liu, L. Fresh carbon and nitrogen inputs alter organic carbon mineralization and microbial community in forest deep soil layers. Soil Biol. Biochem. 2014, 72, 145–151. [Google Scholar] [CrossRef]
  93. Blagodatskaya, E.V.; Blagodatsky, S.A.; Anderson, T.H.; Kuzyakov, Y. Priming effects in Chernozem induced by glucose and N in relation to microbial growth strategies. Appl. Soil Ecol. 2007, 37, 95–105. [Google Scholar] [CrossRef]
  94. Zhou, J.; Wen, Y.; Shi, L.; Marshall, M.R.; Zang, H. Strong priming of soil organic matter induced by frequent input of labile carbon. Soil Biol. Biochem. 2021, 152, 108069. [Google Scholar] [CrossRef]
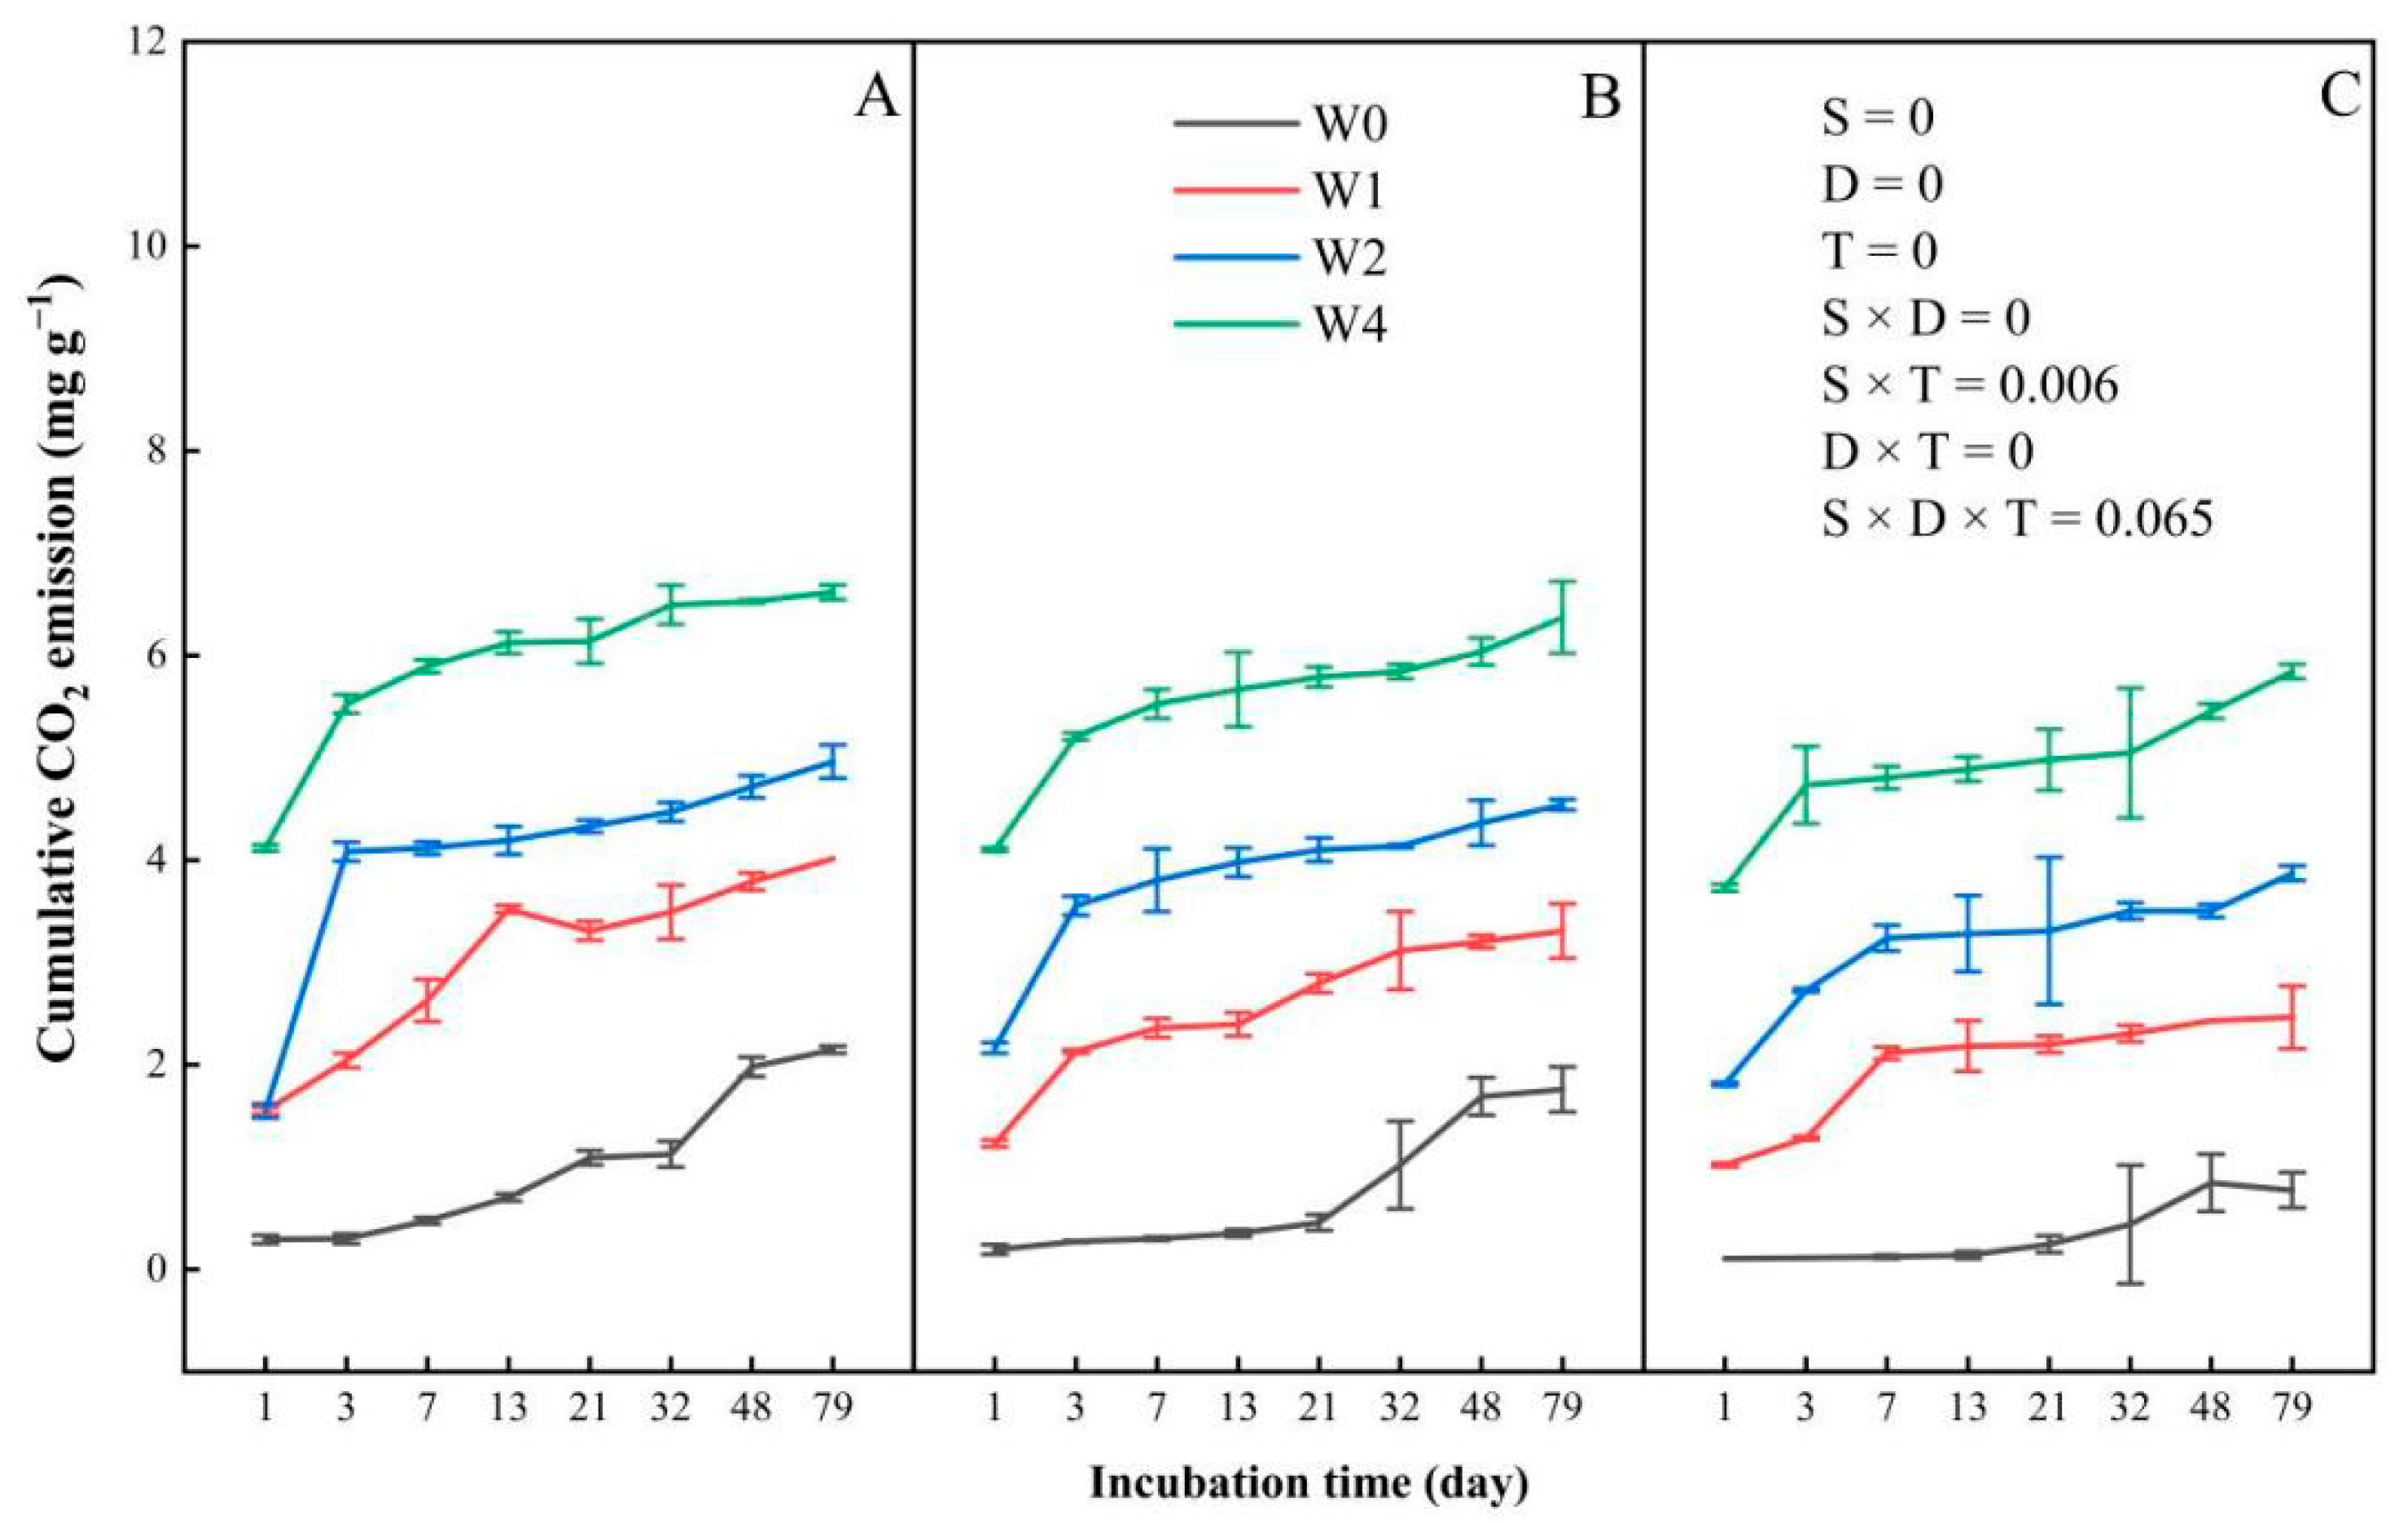
Figure 1. The effect of straw addition amount, soil layer, and incubation time on cumulative carbon dioxide (CO2) emission. W represents wheat straw. 0 (control), 1, 2, and 4 denote the amount of straw added. 1st, 3rd, 7th, 13th, 21st, 32nd, 48th, and 79th denote the incubation time (in days). (AC) represent the 0–10, 10–20, and 20–30 cm soil layers, respectively. S represents soil depth, D represents incubation time, and T represents straw addition levels. Error bars represent the standard error.
Agronomy 15 02642 g001
Figure 2. The effect of straw addition amount, soil layer, and incubation time on carbon dioxide (CO2) emission rate. W represents wheat straw. 0 (control), 1, 2, and 4 denote the amount of straw added. 1, 3, 7, 13, 21, 32, 48, and 79 denote the incubation time (in days). (AC) represent the 0–10, 10–20, and 20–30 cm soil layers, respectively. S represents soil depth, D represents incubation time, and T represents straw addition levels. Error bars represent the standard error.
Agronomy 15 02642 g002
Figure 3. The effect of straw addition amount, soil layer, and incubation time on soil pH, total nitrogen (TN), ammonium nitrogen (NH4+-N), and nitrate nitrogen (NO3-N). (AD) represent the pH, total nitrogen, ammonium nitrogen and nitrate nitrogen, respectively. W represents wheat straw. 0 (control), 1, 2, and 4 represent the amount of straw addition. 0–10 cm, 10–20 cm, and 20–30 cm denote soil layers. 7 and 79 represent the sampling time. S represents soil depth, D represents culture time, and T represents straw addition levels. Error bars represent the standard error. Different lowercase letters denote significant differences at p < 0.05.
Agronomy 15 02642 g003
Figure 4. The effect of straw addition amount, soil layer, and incubation time on total phosphorous (TP), available phosphorous (AP), soil organic carbon (SOC), and dissolved organic carbon (DOC) content. (AD) represent the total phosphorous, available phosphorous, soil organic carbon and dissolved organic carbon, respectively. W represents wheat straw. 0 (control), 1, 2, and 4 represent the amount of straw addition. 0–10 cm, 10–20 cm, and 20–30 cm denote soil layers. 7 and 79 represent the sampling time. S represents soil depth, D represents culture time, and T represents straw addition levels. Error bars represent the standard error. Different lowercase letters denote significant differences at p < 0.05.
Agronomy 15 02642 g004
Figure 5. The effect of straw addition levels, soil layer, and incubation time on BG, CBH, NAG, LAP and ALP activities. (AE) represent the BG, CBH, NAG, LAP and ALP, respectively. W represents wheat straw. 0 (control), 1, 2, and 4 represent the amount of straw addition. 0–10 cm, 10–20 cm, and 20–30 cm denote soil layers. 7 and 79 represent the sampling time. S represents soil depth, D represents culture time, and T represents straw addition levels. Error bars represent the standard error. Different lowercase letters denote significant differences at p < 0.05. Note; β-glucosidase = BG; β-cellobiosidase = CBH; β-1, 4-N-acetylglucosaminidase = NAG; L-leucine aminopeptidase = LAP; and alkaline phosphatase= ALP.
Agronomy 15 02642 g005
Figure 6. Correlation among soil physicochemical properties, activated carbon components, enzyme activities, and cumulative CO2 emission. 1st, 3rd, 7th, 13th, 21st, 32nd, 48th, and 79th (days) represent the time of cumulative CO2 emission during the incubation period, respectively. ** at 0.01 level (two−tailed), the correlation was significant; and * at 0.05 level (two−tailed), the correlation was significant.
Agronomy 15 02642 g006
Figure 7. Effects and simple mechanisms of straw addition to SOC mineralization. The red and blue lines represent the positive and negative effects, respectively, and the thicker the line, the more significant it becomes. (A,B) represent structural equation modelling and total effect, respectively. Dotted lines represent no significance (p > 0.05). Numbers adjacent to the line represent standardized path coefficients, analogous to relative regression weights, and indicate the effect sizes of the relationship (* p < 0.1 and ** p < 0.05).
Agronomy 15 02642 g007
Table 1. Experimental Design Parameter.
Tillage ModesTreatmentsStraw Input Level (kg ha−1)Soil Depth (cm)
Wheat
Traditional tillage with straw returnControl (W0)00–10 cm, 10–20 cm, and 20–30 cm
1 times treatment (W1)3500
2 times treatment (W2)7000
4 times treatment (W4)14,000
Table 2. Corresponding substrates and compounds of enzyme activity.
EnzymeSubstrateCompounds
β-glucosidase (BG)4-MUF-β-d-glucopyranosideCellulose, cellobiose
β-cellobiosidase (CBH)MUF-β-d-cellobiosideCellulose
β-1, 4-N-acetylglucosaminidase (NAG)4-methylum-belliferyl N-acetyl-b-D-glucosaminideChitin
L-leucine aminopeptidase (LAP)L-Leucine-7-amino-4-methyl coumarinProteins
Alkaline phosphatase (ALP)4-MUB-phosphateOrganic P mineralization
Disclaimer/Publisher’s Note: The statements, opinions and data contained in all publications are solely those of the individual author(s) and contributor(s) and not of MDPI and/or the editor(s). MDPI and/or the editor(s) disclaim responsibility for any injury to people or property resulting from any ideas, methods, instructions or products referred to in the content.