Article

Research on Soil Water Leakage and Water Use Efficiency Based on Coupling Biochar and Management Measures

1
Hubei Water Resources Research Institute, Wuhan 430070, China
2
State Key Laboratory of Water Resources Engineering and Management, Wuhan University, Wuhan 430072, China
3
Hubei Water Saving Research Center, Wuhan 430070, China
*
Authors to whom correspondence should be addressed.
Agronomy 2025, 15(11), 2614; https://doi.org/10.3390/agronomy15112614
Submission received: 14 October 2025 / Revised: 11 November 2025 / Accepted: 12 November 2025 / Published: 14 November 2025

Abstract

Biochar has recently been widely used as a soil amendment. However, the interaction effects of biochar with irrigation management on soil water leakage and water use efficiency of paddy black soil remain unclear, which seriously restricts the production potential of black soil. Therefore, the purpose of this paper was to explore the response rule of water loss and water use efficiency of black soil under the coupling effects of biochar, irrigation amounts, and irrigation methods through column experiment, field experiment, and HYDRUS-AquaCrop coupling simulation. Biochar application rates, irrigation amounts, and irrigation methods were set at five levels (B = 0, 1.5, 3, 4.5, 6 kg·m−2), seven levels (I = 0, 60, 120, 180, 240, 300, 360 mm), and two levels (M, conventional irrigation and drip irrigation), respectively. The results showed that B and M had a significant coupling effect on water leakage loss (p < 0.05). Single factor B promoted water loss, but B and M inhibited water loss, which helps reduce water waste and environmental pollution. Compared with a single effect, the synergistic effect of B, I, and M on water consumption (ET), yield (Y), and water use efficiency (WUE) was better, increasing Y by 18.2%–57.9% and WUE by 17.1%–34.9%. Additionally, ET, Y, and WUE were also correlated with hydrological years, and this correlation works best in dry years. The maximum of Y and WUE in wet and normal years occurred in the ‘BDI6, 0 mm’ treatment (saving water and high yield), while that in dry years occurred in the ‘BDI6, 360 mm’ treatment (a stable yield). Therefore, the interaction effects of biochar and irrigation management should be comprehensively considered in black soil agricultural production to improve the agricultural potential of black soil and ensure food security.

1. Introduction

Black soil (mollisol), the world’s most fertile and productive soil (the pandas of arable land), has an important responsibility for ensuring global food security [1,2]. The Northeast Plain, a major rice cultivation region in China, is one of the four mollisol regions in the world, and its yield accounts for 30% of the total yield in China [3]. The black soil area of Northeast China has become a veritable ‘Beidacang’. However, long-term excessive farming and extensive management have led to a multitude of complex challenges (the degradation of the black soil farmland, the waste of water resources, the low water productivity, and environmental pollution [4,5]) that seriously threaten food security. Soil amendments provide a promising way to comprehensively solve the problems of soil degradation and low water use efficiency. Fortunately, an environmentally friendly soil amendment, biochar, has been discovered [6].
Biochar is a carbon-rich, solid, insoluble organic material [7], derived from the pyrolysis of agricultural wastes at 200~1200 °C in the absence of oxygen [8]. As a soil amendment, biochar has shown the ability to enhance soil properties and the use efficiency of water and fertilizer, making it highly promising for soil restoration and agricultural production [6,9]. The addition of biochar can increase soil organic carbon (SOC) [10,11], and promote soil agglomeration to mitigate water and soil loss [12,13]. However, the water and soil loss does not clearly explain the seepage loss of water entering farmland and only considers the runoff loss of rainfall. Biochar inhibited soil and water loss and facilitated the entry of more water into and conservation in the soil [6,14,15,16], while biochar also promoted soil water conductivity [15,17], which creates some uncertainty about the water leakage loss in paddy fields. Therefore, it is necessary to clarify the influence mechanism of biochar on the water leakage of black soil to improve water use efficiency and save water resources. Biochar can affect the water consumption of paddy fields by altering water leakage. In addition, biochar promotes plant root growth and absorbs more nutrients and water owing to the enhancement of soil nutrient content (alkali-hydrolyzed nitrogen, available phosphorus, and available potassium) and available water content [18,19], ultimately achieving high yield [20]. When the yield (Y) increases and water consumption (ET) decreases, the natural resource use efficiency and the potential for sustainable development of agriculture will increase. Therefore, it is more appropriate to use water use efficiency (WUE) to characterize the comprehensive utilization of agricultural resources. Many studies have reported the positive effects of biochar on crop WUE [10,11,21]. Biochar improves WUE by neutralizing soil pH and regulating soil microbial activity to make the soil environment more favorable for crop growth. However, the increase in WUE was not significant (0–13%) considering biochar alone [9,22].
Rice, the most water-consuming cereal, requires long periods of immersion in water to grow, resulting in excessive water use [23,24]. (i) Paddies always retain water levels, causing evaporation to be significant [25,26,27]. (ii) The soil in flooded paddies is saturated, causing serious soil water leakage [3,28]. To reduce ineffective water in paddies while conserving water resources, in addition to the usual agricultural water-saving practices (dry rice, alternate irrigation [29]), drip irrigation is gaining popularity in the paddy field ecosystem [30,31]. The greatest advantage of drip irrigation is the precise application of water and fertilizer and reduced water and fertilizer inputs when compared to other irrigation methods [29]. Water seepage loss in drip irrigation rice fields is less serious than that in conventional rice fields while maintaining a stable yield [32]. In addition to biochar and irrigation methods, irrigation volumes also affect the WUE. It has been found that the parabolic relationship between irrigation volume and WUE is satisfied; that is, the maximum WUE is obtained under a suitable irrigation volume instead of the maximum irrigation volume [33]. Although WUE research is relatively sufficient, it only focuses on the single-factor influence and has a poor effect. Currently, there is a dearth of scientific research on soil water leakage affected by biochar. Agriculture in China is facing the increasing pressure of agricultural water waste, yield decrease, and low irrigation water use efficiency. Consequently, it is necessary to explore the responses of water loss and WUE under the coupling effects of soil amendment and management measures.
The objective of the present study was to (i) analyze the interaction effects of biochar and irrigation management on soil seepage loss under the background of paddy field water input; (ii) examine the adaptability of the coupling model to paddy fields in black soil regions of China; and (iii) explore the responses of water consumption (ET), yield (Y), and water use efficiency (WUE) to the interaction effects of biochar and irrigation management in different typical years. The aim is to give full play to the agricultural production advantages of black soil, protect fertile soil, and ensure food security. Section 2 presents the materials and methods, including column experiments, field experiments, and the HYDRUS-AquaCrop model. Experimental results are explicated in Section 3, followed by a discussion in Section 4 and a conclusion in Section 5.

2. Materials and Methods

2.1. Study Area

The study area was located at the Qingan Irrigation Experimental Station in Heilongjiang Province, a black-soil region of Northeast China, with a geographical location of 46°52′ N, 127°30′ E (Figure 1). Rice (Oryza sativa) is the main crop planted, and the soil type is black soil. This area has a typical semi-arid and semi-humid continental climate with an average annual rainfall of 578.5 mm. Over 70% of the yearly rainfall occurs between July and September. The annual average temperature is 1.69 °C, with great monthly temperature differences and 128 frost-free days. The annual extreme maximum and minimum temperatures occur in July and January, respectively. The spring wind is the strongest, accounting for 70% of the annual wind days. The annual average evaporation is 764.5 mm.

2.2. Laboratory Experiment

The laboratory experiment was aimed at simulating soil water movement in paddy and was conducted in the School of Water Resources and Hydropower Engineering of Wuhan University, Wuhan, China. The column experiment comprised four treatments (2 irrigation methods × 2 biochar application amounts). The irrigation patterns contained conventional irrigation and drip irrigation. The biochar application amount was 0 kg·m−2 and 3 kg·m−2 [34]. In short, the four treatments were, respectively, conventional irrigation (CI), conventional irrigation + biochar (BCI), drip irrigation (DI), and drip irrigation + biochar (BDI). The irrigation water depth was 3 cm in the CI and BCI. The rate of drip irrigation (DI, BDI) was 0.72 L·h−1. A Plexiglas cylinder (height: 110 cm, diameter: 28 cm) filled with soil to a depth of 90 cm was used for the test. There were three layers in the soil, namely, the cultivated layer (CL: 0–20 cm), the plow pan layer (PL: 20–35 cm), and the illuvial layer (IL: 35–90 cm). The groundwater depth was 60 cm. The soil in the column experiment was collected from the study site at a depth of 0–90 cm. The biochar used in this experiment was produced from corn straw under anaerobic conditions of 500 °C. Important physical and chemical properties of the experiment materials (soil and biochar) are summarized in Table 1.
The test soil was ground to pass through a 2 mm sieve after air-drying. Then the Plexiglas cylinder was filled with soil in three layers. Biochar was uniformly mixed into the cultivated layer (0–20 cm, BCI, BDI). An integrated monitor was installed in the soil column to detect moisture, temperature, and negative pressure of each soil layer. Sensors were connected to the data collector, which was calibrated before the experiment. A 50 cm high lateral seepage surface and a lateral seepage collection tank for each soil layer were set on the side wall of the soil column to collect the soil leakage. The water was watered into the column via the inlet pipe. The water pumps in each treatment supplied water simultaneously to reduce the error. The mold of the soil column had a perforated base that allowed drainage. The bottom of the soil column was connected with the groundwater level control device through the water supply chamber. The experimental process lasted 240 h, and three replicates were performed for each treatment.
Soil samples were collected from each treatment 24 h after the trial. Three sampling points were randomly selected for soil sampling in each soil layer. Each soil sample was separated into three parts to measure the bulk density (γ), saturated water content (θs), and saturated hydraulic conductivity (Ks). In addition, the soil infiltration and soil leakage loss were observed and recorded during the experiment. The infiltration data were collected every 30 s, and the infiltration rate was calculated. We recorded the water leakage data every 1 min and calculated the leakage rate. Data on soil water content and negative pressure were collected every 30 s. Based on the column experiment, the process of soil water movement was simulated by HYDRUS-2D (see Section 2 for details).

2.3. Field Experiment

A 2-year field experiment was aimed at calibrating the HYDRUS-AquaCrop coupling model and was conducted in the Qingan Irrigation Experimental Station. The experiment was laid out with conventional irrigation. Test plots were separated by concrete earth ridges, with each plot 8 m × 10 m. Rice was seeded on May 25 in 2017 and 2018, with a growth period of 121 d and 119 d, respectively. A 10–30 mm water depth was maintained for the first 7–10 days after transplanting to facilitate seedling recovery. Thereafter, a 30–50 mm water depth was maintained until 15 days before harvest, with drying for 7–10 days at the late tillering stage. The fertilization method was surface fertilization. Fertilizer, weeding, pesticide, and pest management were carried out following local farmer practices.
Meteorological data were obtained from the farmland micrometeorological stations in the experimental station, including daily rainfall, daily minimum/maximum temperature, relative humidity, sunshine hours, and average wind speed. The height of the water layer in the field was measured by a vertical ruler. The moisture content of the soil was measured by the drying method. The meter reading at the irrigation pipe was the amount of irrigation. A valve was used to control the drainage, and the field water level difference was used to determine the drainage volume. There was an underground water observation well in the test station. The groundwater depth was observed every 3 days with a self-made soft ruler. Three representative plants were selected to measure rice biomass at different growth stages. Three representative 1m2 samples were selected to measure rice yield at maturity.

2.4. HYDRUS-AquaCrop

2.4.1. HYDRUS-2D Model and Its Parameters

This study simulated the process of soil water movement based on HYDRUS-2D 2.04.0580 software. It was assumed that the experimental soil is homogeneous and isotropic, without considering the influence of air, temperature, and hysteresis effects. Soil water movement can be described by the Richard equation (Equation (1)) in the VG model [35]. Soil hydraulic parameters can be expressed with the VG model (Equations (2)–(6)) [36].
θ t = x K h h x + z K h h z ± K h z
θ = θ r + θ s θ r 1 + ( α h ) n m
K ( h ) = K s S e l 1 ( 1 S e 1 / m ) m 2
S e = θ θ r θ s θ r
α = 1 / h b
m = 1 1 / n ,   n > 1
where θ is the volumetric water content (cm3·cm−3), θs and θr are the saturated and residual volumetric water contents, respectively (cm3·cm−3); α, n, and m are fitting parameters of the soil water characteristic curve; and l is the pore connectivity parameter (l = 0.5) [28]; h is the soil water pressure head, (cm); t is time (min); x is the horizontal coordinate (cm); z is the vertical coordinate (positive upward) (cm); K(h) is the unsaturated hydraulic conductivity function (cm·min−1); Ks is the saturated hydraulic conductivity (cm·min−1); Se is the relative saturation; hb is intake suction.
The simulated area corresponded to the two dimensions of the column experiment, with a width of 28 cm and a depth of 90 cm. The initial condition was the negative pressure of the soil measured before the test. We assume that the initial negative pressure value was uniformly distributed in the simulated area, and a linear interpolation between the negative pressure sensors [26]. The upper boundaries of CI and BCI were the constant pressure boundary (3 cm). The upper boundaries of DI and BDI were the atmospheric boundary. The boundaries of the lateral seepage surface of all treatments were the seepage face. The bottom boundaries of all treatments were the constant pressure boundary (90−60 = 30 cm), and the rest were no-flux boundaries.

2.4.2. AquaCrop Model and Its Parameters

This paper simulated the process of rice growth based on AquaCrop software. The AquaCrop model is a water-driven crop growth model developed by the Food and Agriculture Organization (FAO) of the United Nations, which can simulate crop biomass and yield as a function of climate and water availability [37]. The model uses canopy ground cover as the basis to calculate transpiration and to separate soil evaporation from transpiration. Crop yield is calculated as the product of biomass and harvest index (HI) [38] (Equations (7) and (8)).
B = W P * · T r
Y = B · H I
where B is biomass (t·hm−2); Tr is the actual transpiration (mm); WP* is the normalized water productivity (Tr/ET0, g·cm−3); Y is yield (t·hm−2); HI is harvest index (%).

2.4.3. HYDRUS-AquaCrop Coupling Model

The coupling of HYDRUS and the AquaCrop model was used to simulate the effect of biochar on the rice growth process. Major steps include the following. (i) The particle size distribution and bulk density of biochar soil were measured under different biochar application levels. (ii) The measured data were input into the Rosetta module of HYDRUS. Then, the basic parameters of soil with different biochar application rates were output from HYDRUS to simulate the process of water seepage in paddy soil with biochar. (iii) The basic soil parameters output from HYDRUS were fed into the soil module of the AquaCrop model, which represented the soil properties of different biochar application rates. The growth process of rice in biochar soil was simulated by the HYDRUS-AquaCrop coupling model. Root mean square error (RMSE) and coefficient of determination (R2) were used to assess the simulation performance [39,40].

2.4.4. Simulated Scenarios

(1)
To explore the synergistic effect of biochar and irrigation methods on soil water loss, two irrigation methods and five biochar application rates were set. The irrigation methods included conventional irrigation and drip irrigation. The biochar application levels were 0 kg·m−2 (CI, DI), 1.5 kg·m−2 (BCI1.5, BDI1.5), 3 kg·m−2 (BCI3, BDI3), 4.5 kg·m−2 (BCI4.5, BDI4.5), and 6 kg·m−2 (BCI6, BDI6). This simulation was completed with the HYDRUS-2D model.
(2)
In this paper, the Pearson-III curve was used to analyze the rainfall frequency from 1980 to 2018. Rainfall data is sourced from the China Meteorological Information Center (http://data.cma.cn/ (accessed on 4 July 2023)). The wet, normal, and dry years are 1983, 1992, and 2010, with 532.8 mm, 420.5 mm, and 334.6 mm of rainfall during the rice growth period, respectively. In three typical years, the responses of crop water consumption (ET), yield (Y), and water use efficiency (WUE = Y/ET) to the synergistic effects of irrigation methods (M), biochar (B), and irrigation amounts (I) were investigated. There were two irrigation methods (M), five biochar application levels (B), and six irrigation amount levels (I) in this study. M and B were identical to (1), and irrigation amounts (I) were 0, 60, 120, 180, 240, 300, and 360 mm. This simulation was completed with the HYDRUS-AquaCrop coupling model.

3. Results

3.1. Model Validation

3.1.1. HYDRUS-2D Model

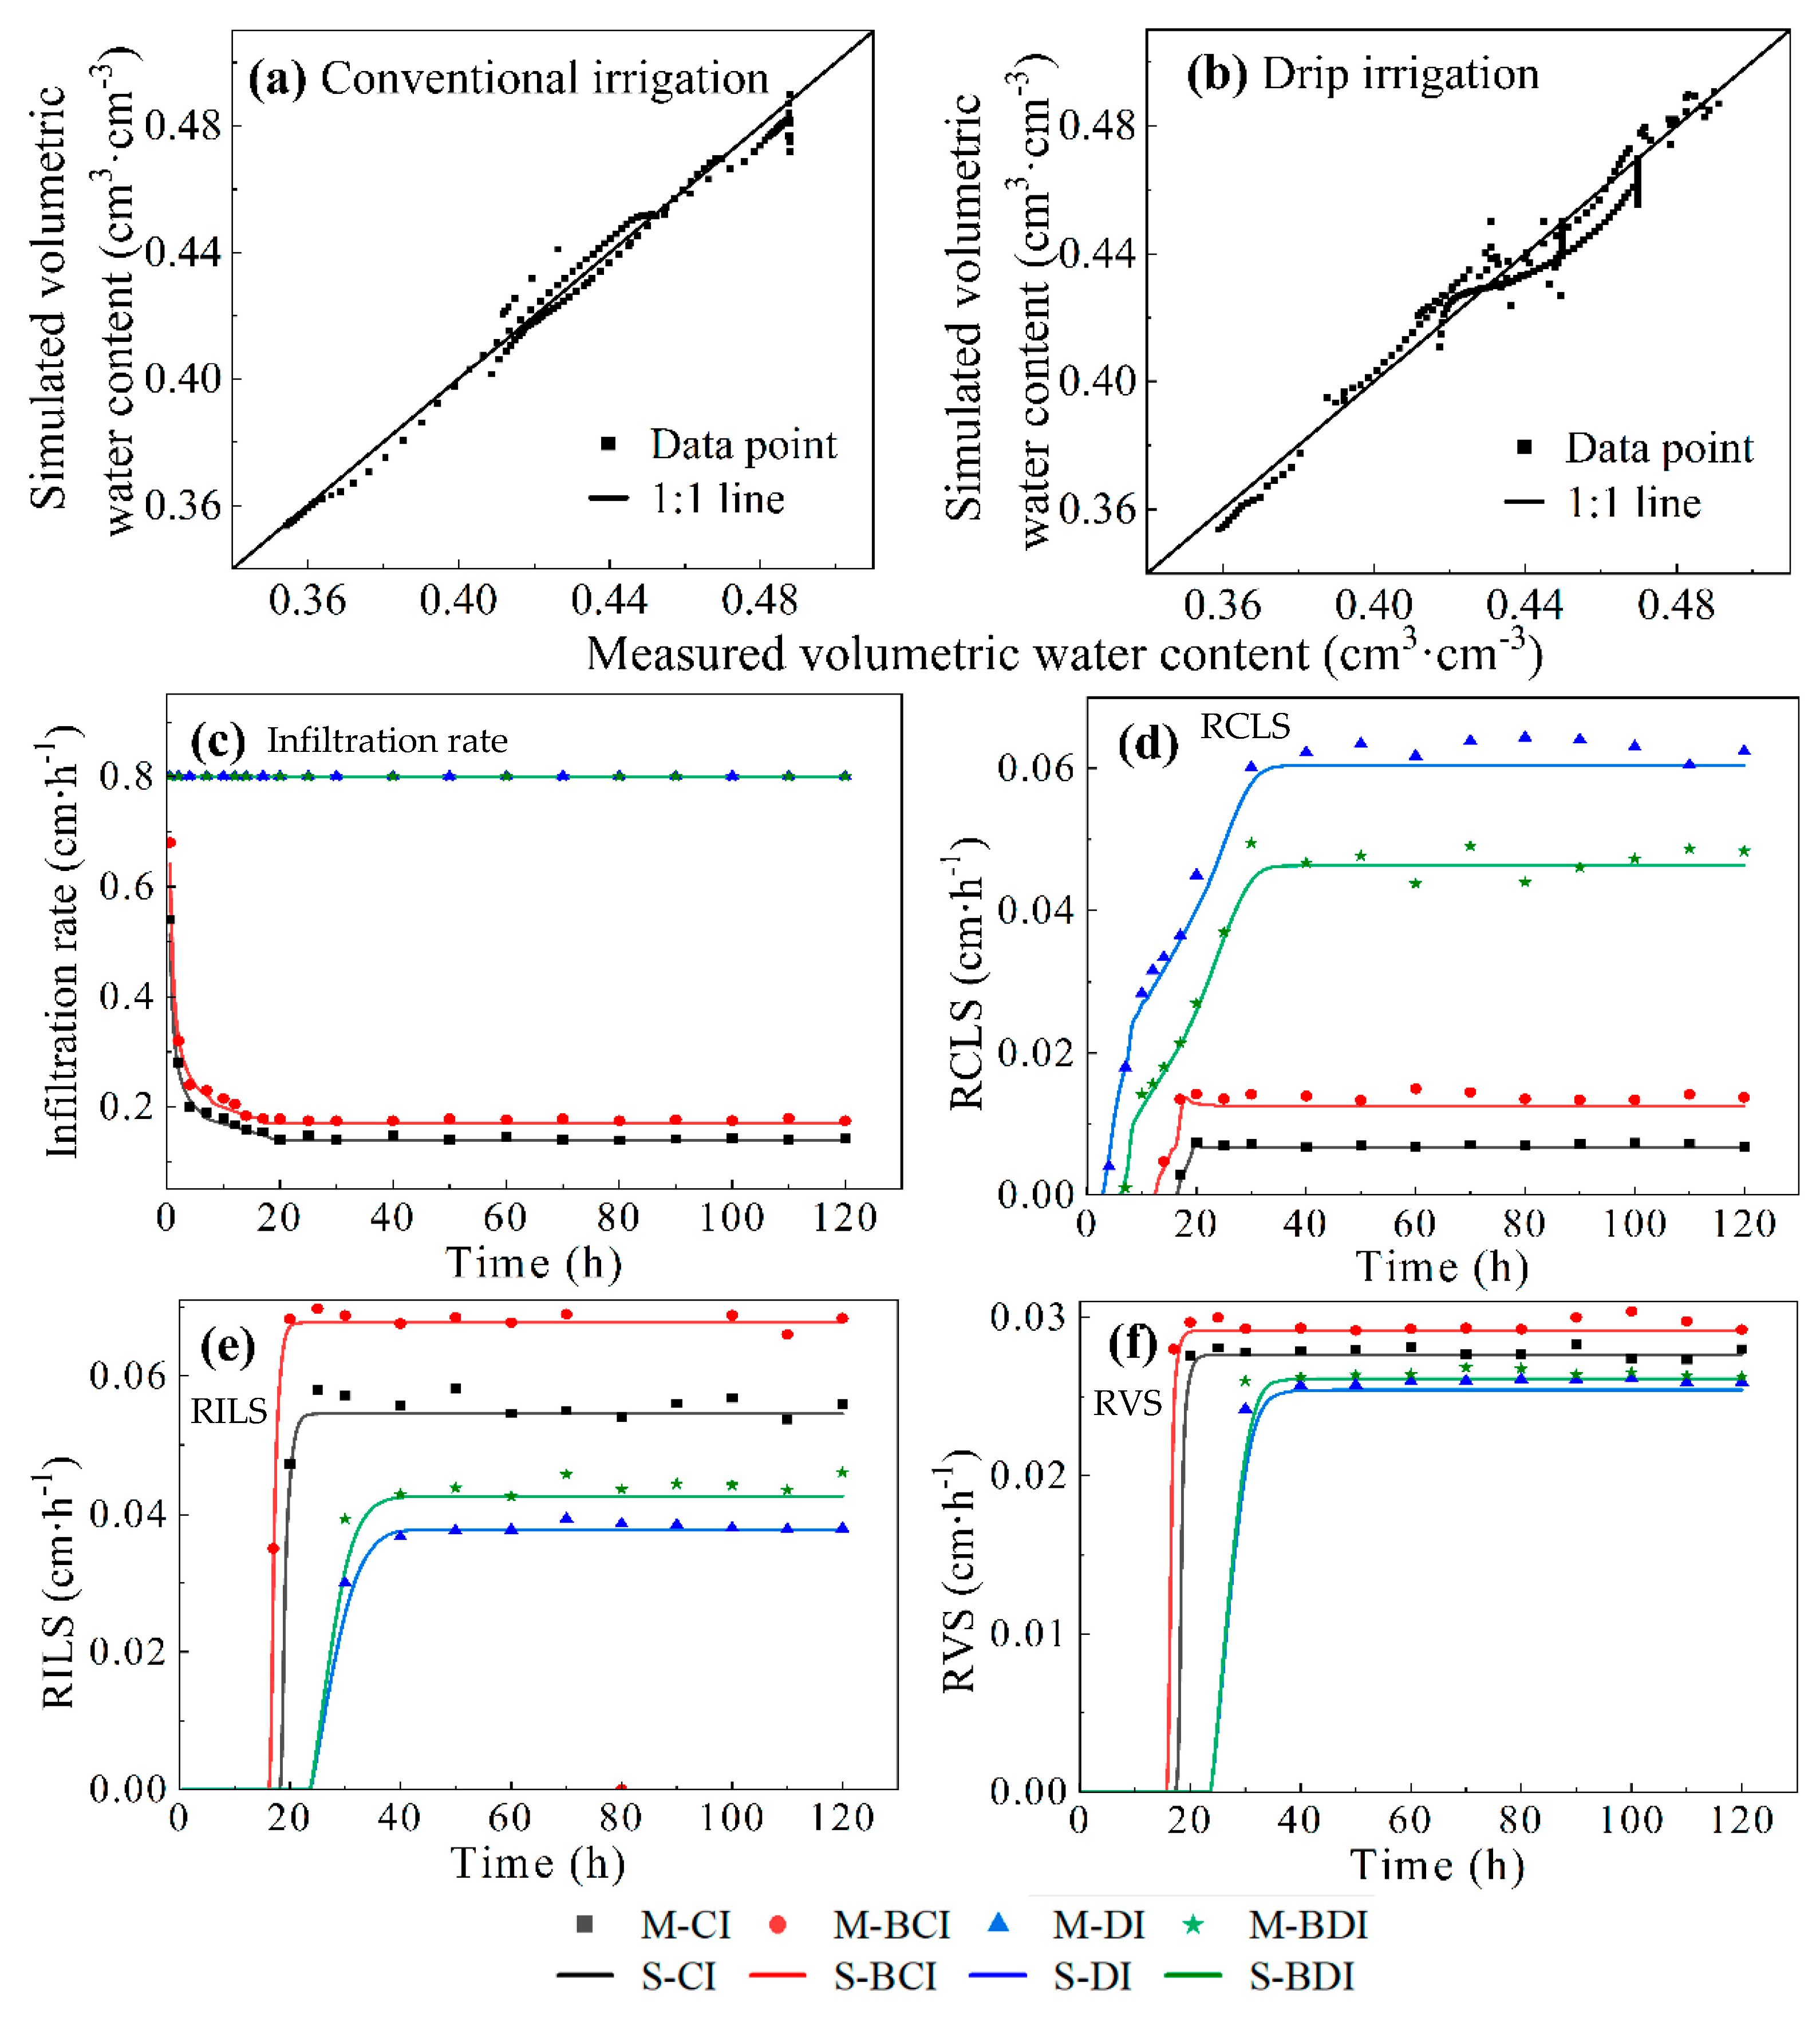
No water leakage of the plow pan layer was detected in the column experiment and the HYDRUS-2D simulation, so the plow pan layer leakage was not considered in this study. The measured and simulated data points of water content were concentrated near the line y = x under conventional irrigation and drip irrigation (Figure 2a,b).
It can be found from Figure 2c,f and Table 2 that the simulated and measured values of infiltration rate, cultivated layer lateral seepage rate (RCLS), illuvial layer lateral seepage rate (RILS), and vertical seepage rate (RVS) were in good agreement (RMSE < 0.6 cm·h−1, R2 > 0.8). RMSE and R2 were 0 cm·h−1 and 1 for DI and BDI due to the same drip irrigation rate. The final hydraulic parameters were shown in Table 3. Biochar increased θs and Ks to promote soil infiltration rate. In short, HYDRUS-2D had a good simulation performance, which was suitable for simulating the soil water seepage process.

3.1.2. AquaCrop Model

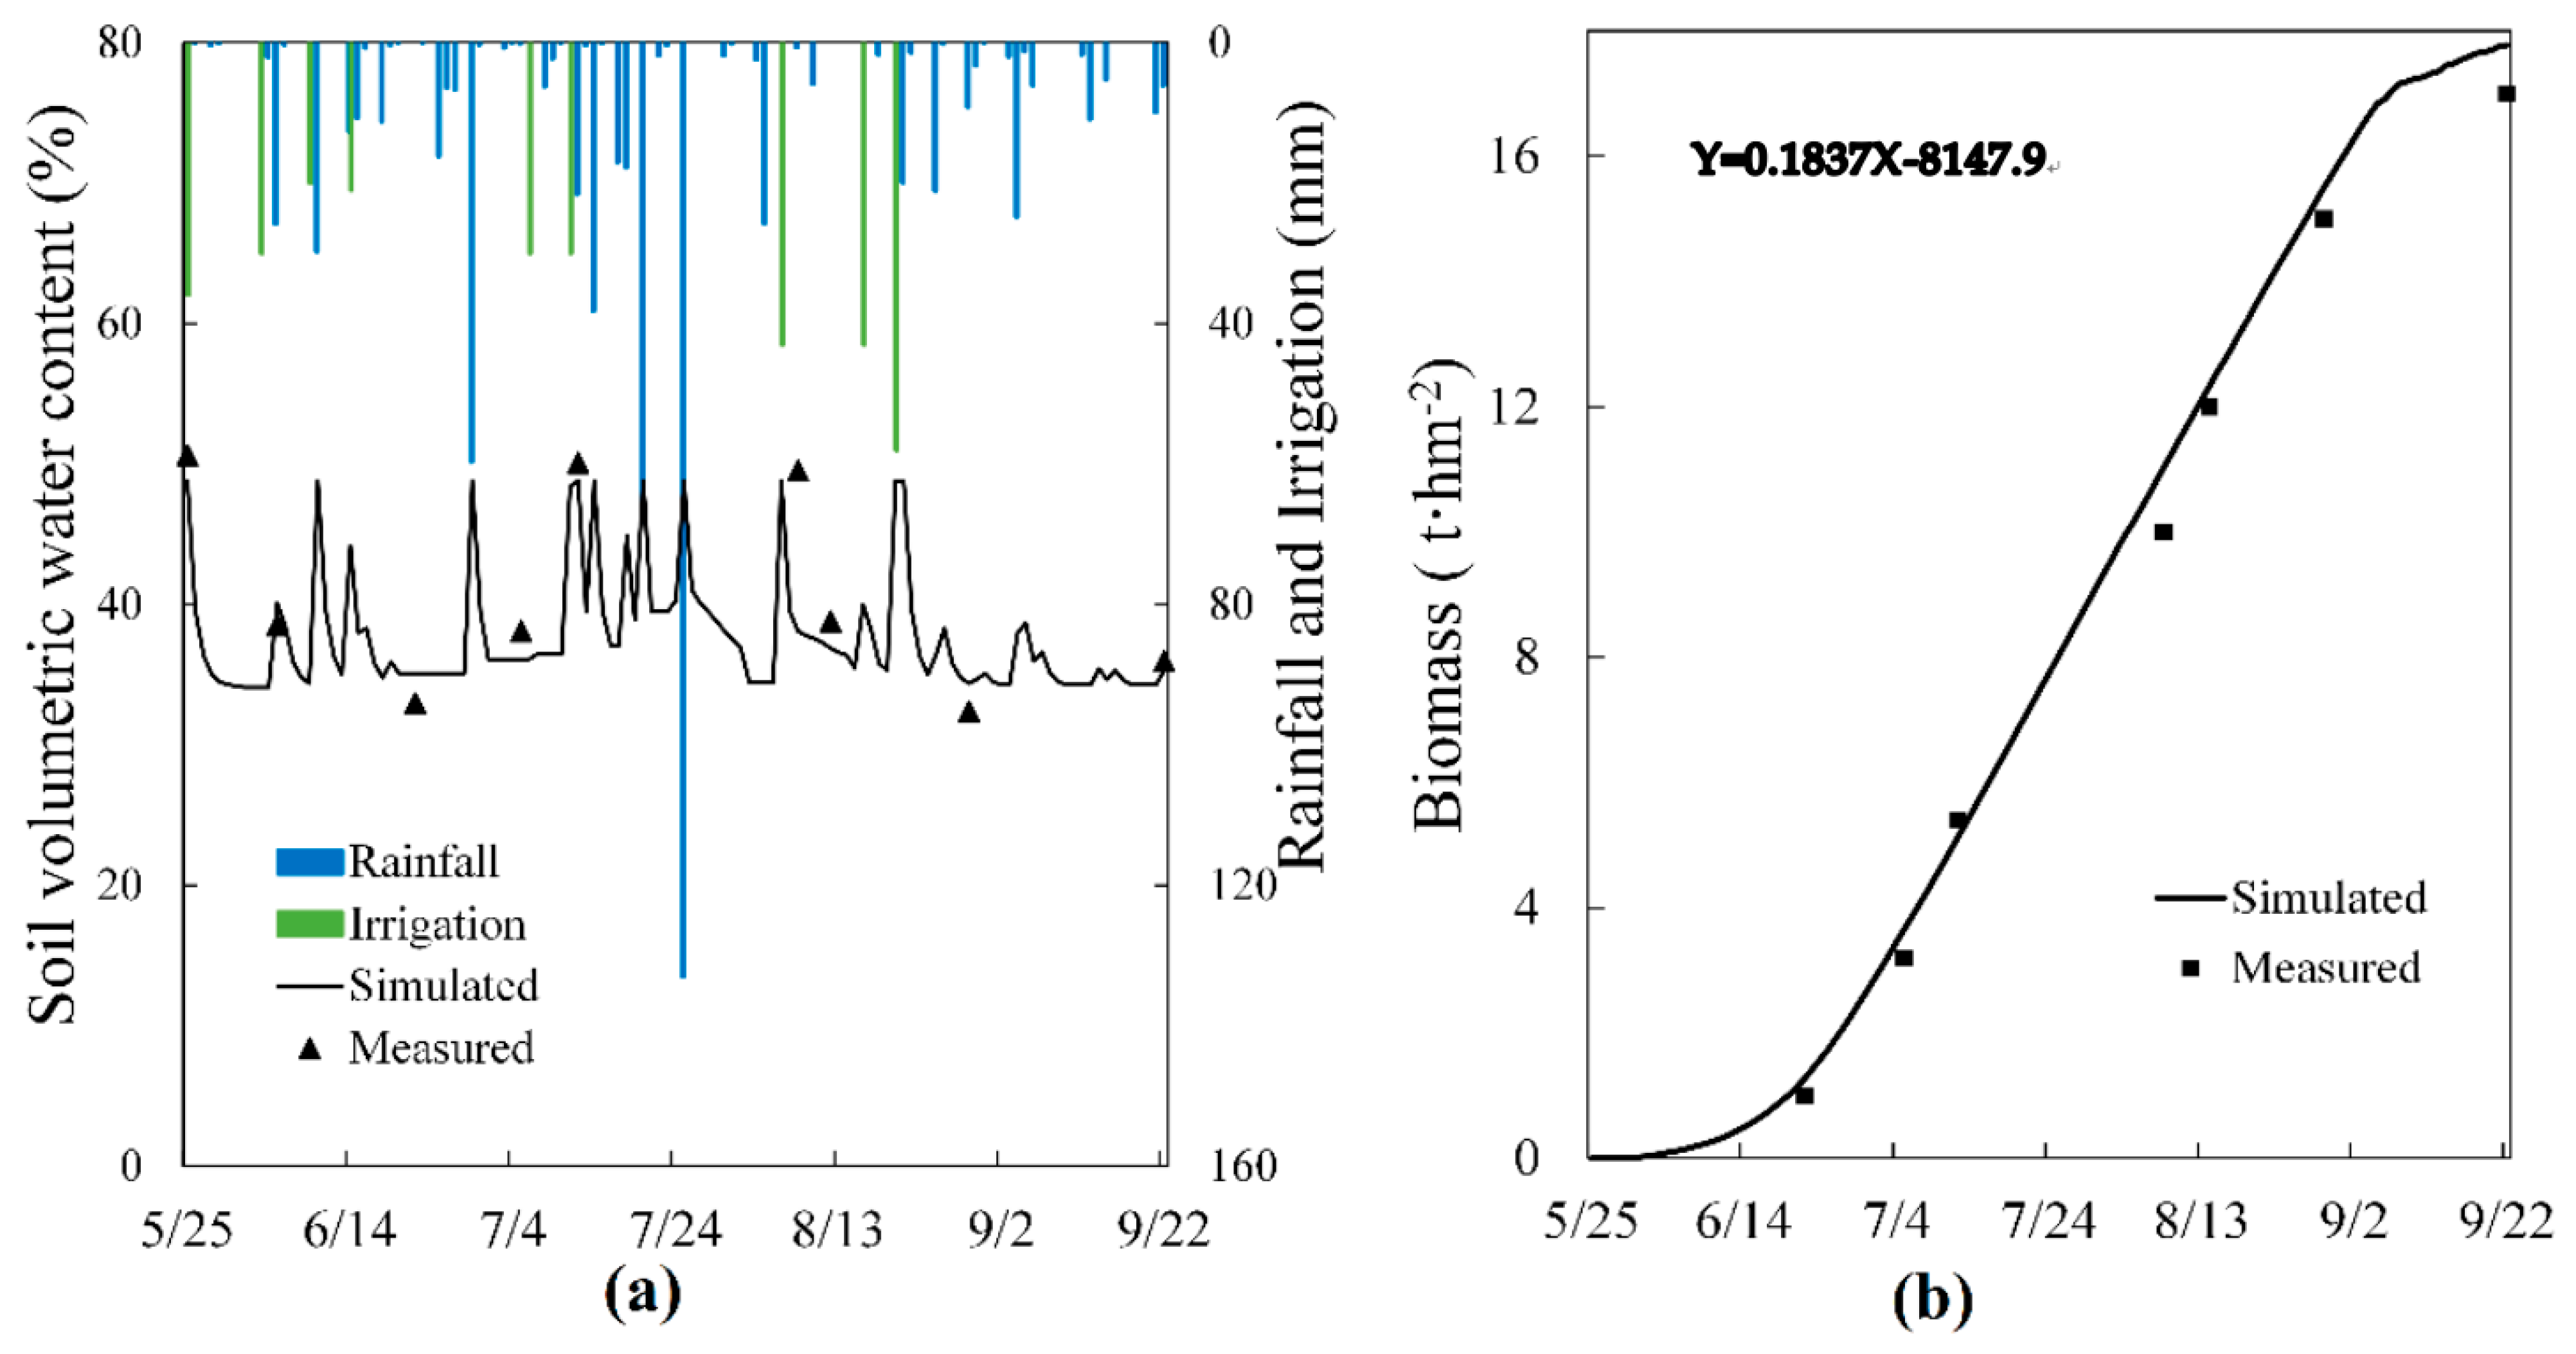
The year 2018 was used to calibrate the model, and 2017 was the validation dataset. After several parameter adjustments, the final rice main parameters of the AquaCrop model were determined in Table 4. The simulated values of soil water content and biomass were close to the measured values (Figure 3). The RMSE, NSE, and R2 values of soil water content were 0.307 cm3·cm−3, 0.973, and 0.993, respectively, while those of biomass were 0.220 t·hm−2, 0.989, and 0.997 in 2018. The RMSE, NSE, and R2 values of soil water content were 0.512 cm3·cm−3, 0.854, and 0.977, respectively, while biomass was 0.475 t·hm−2, 0.867, and 0.891 in 2017. The results indicated that AquaCrop had an excellent simulation performance.

3.2. Response of Soil Water Loss to the Coupling Effect of B and M

3.2.1. Rate and Amount of Water Loss

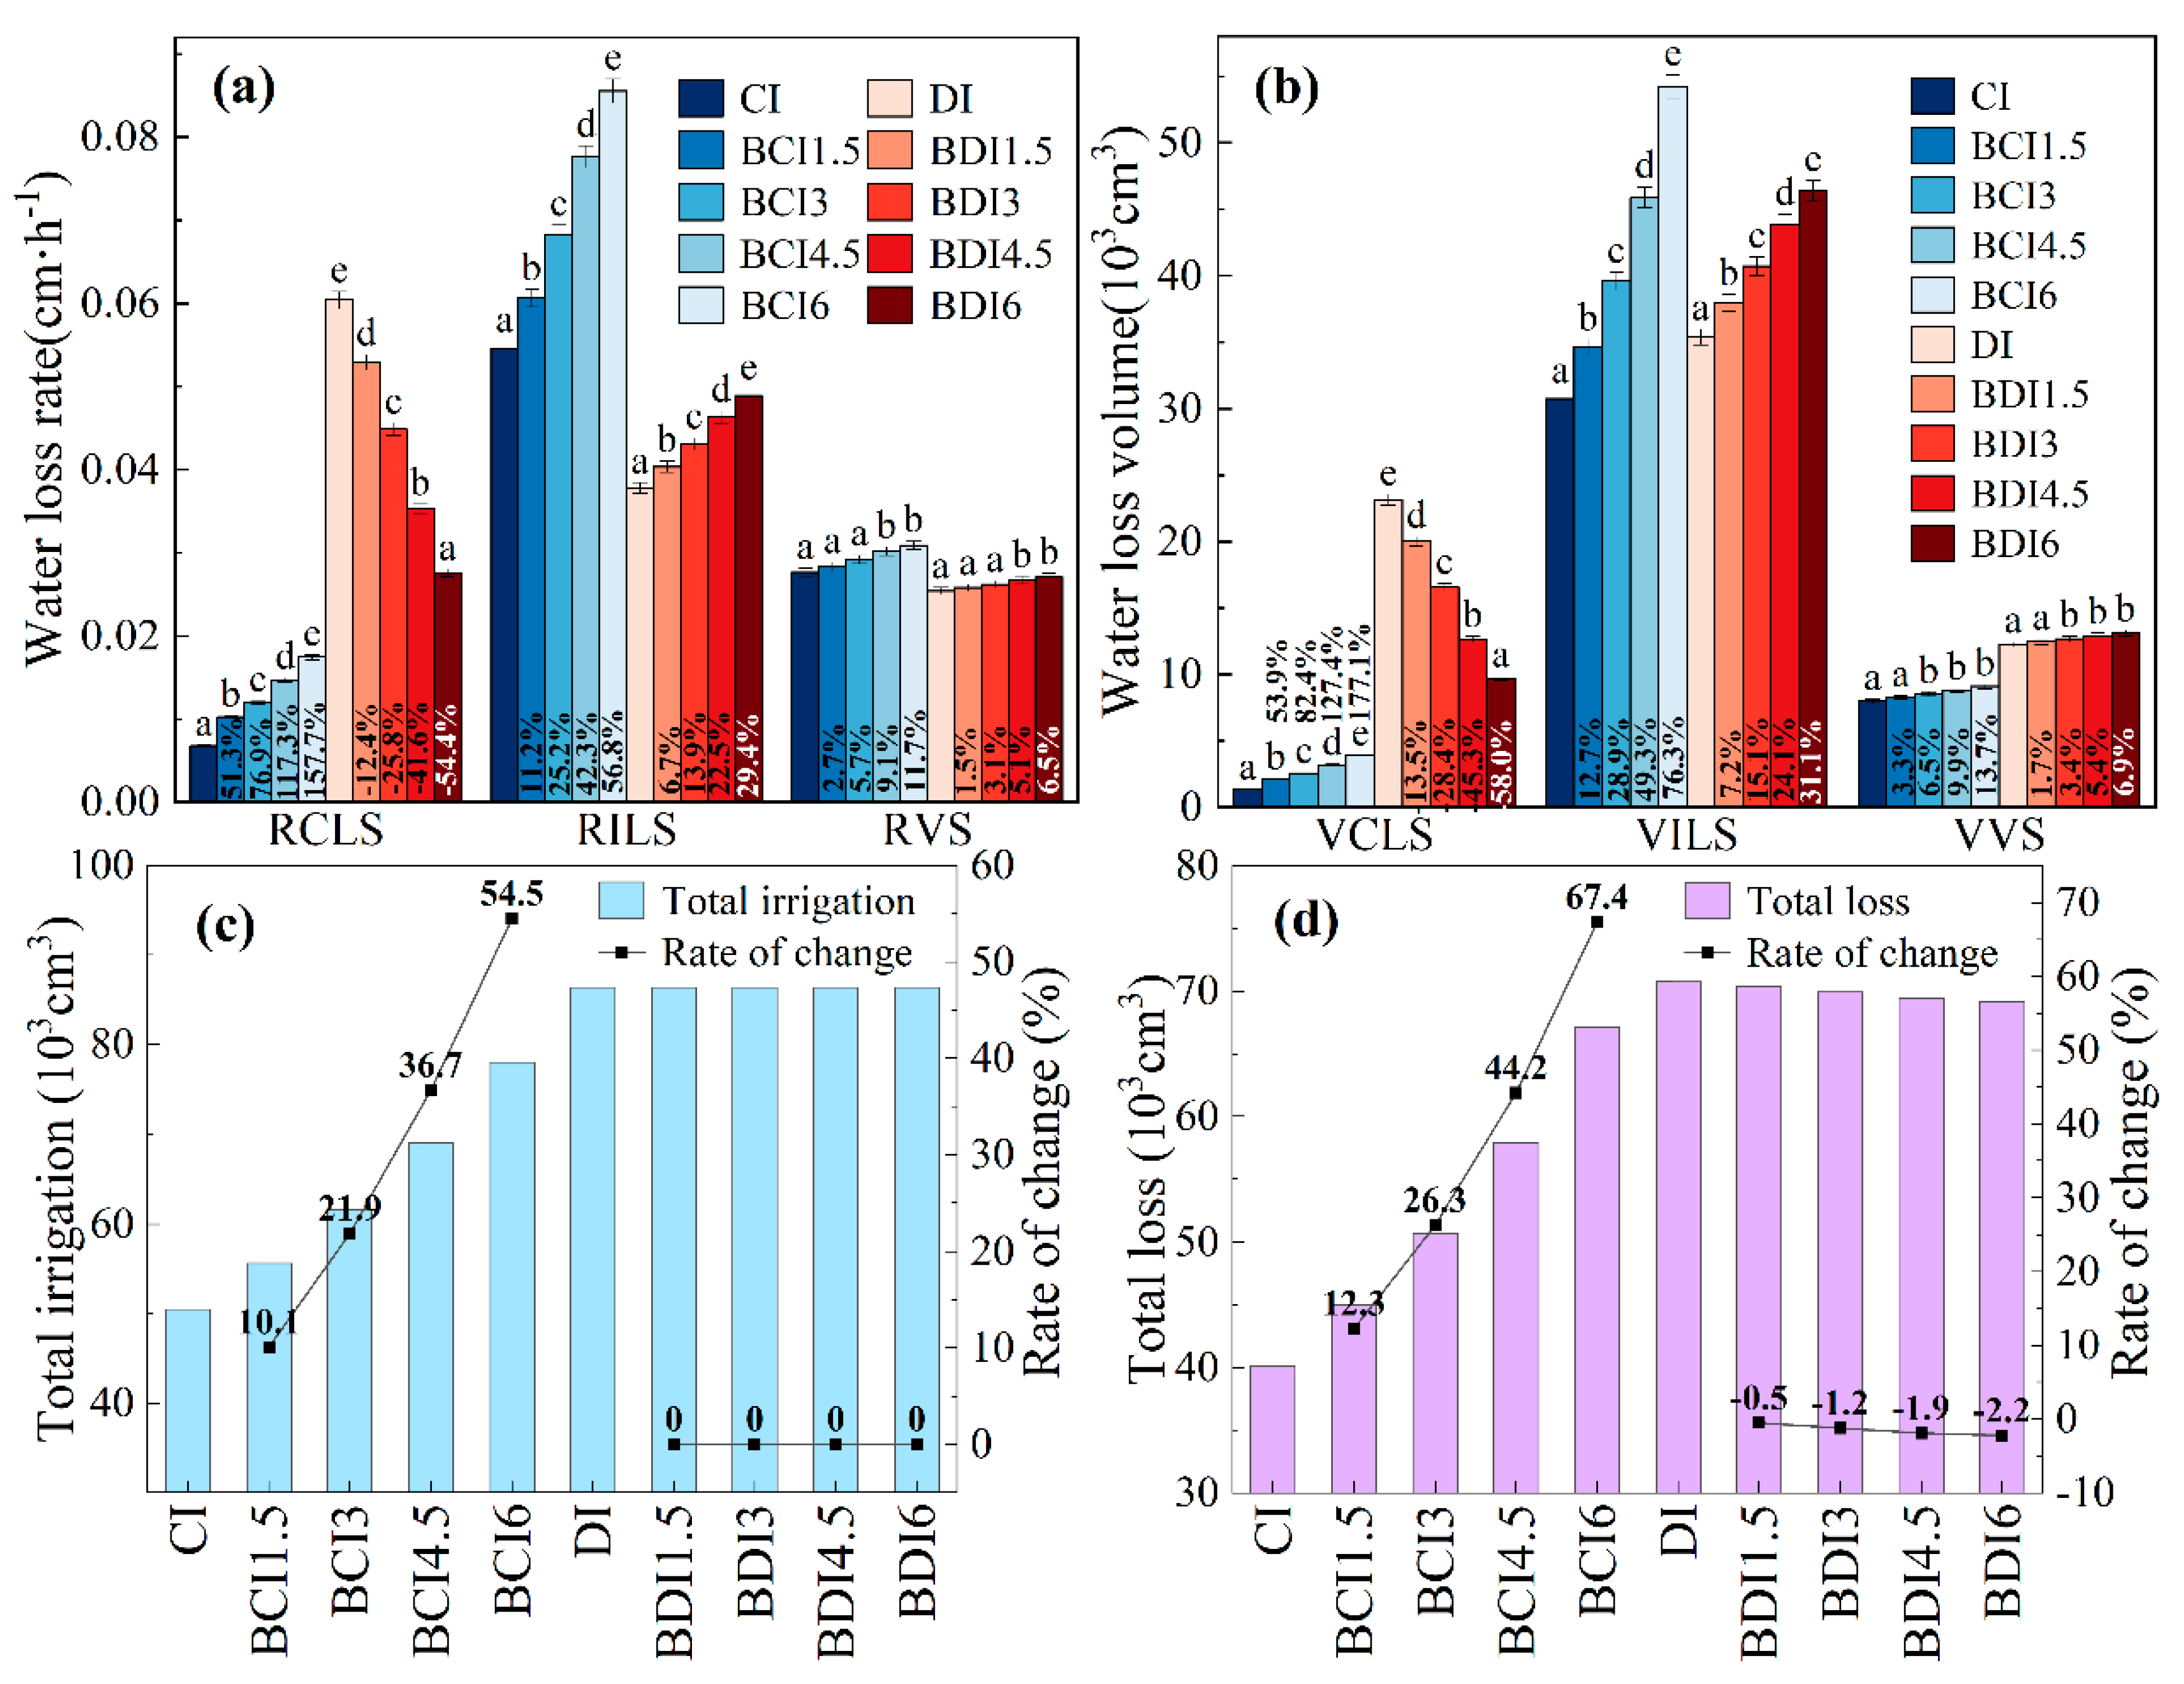
Compared with CI, biochar increased RCLS, RILS, RVS, VCLS, VILS, and VVS with a single-factor biochar (Figure 4a,b). However, the coupling effect of biochar and irrigation methods reduced RCLS and VCLS (Figure 4a,b). The value of RCLS, RILS, VCLS, and VILS changed significantly with the increase in the biochar (p ≤ 0.05), while there was no notable change in RVS and VVS. Additionally, a single factor biochar increased total irrigation and loss by 10.1–54.5% and 12.3–67.4%, respectively, while the total loss was reduced by 0.5–2.2% by coupling biochar and irrigation methods (Figure 4c,d).
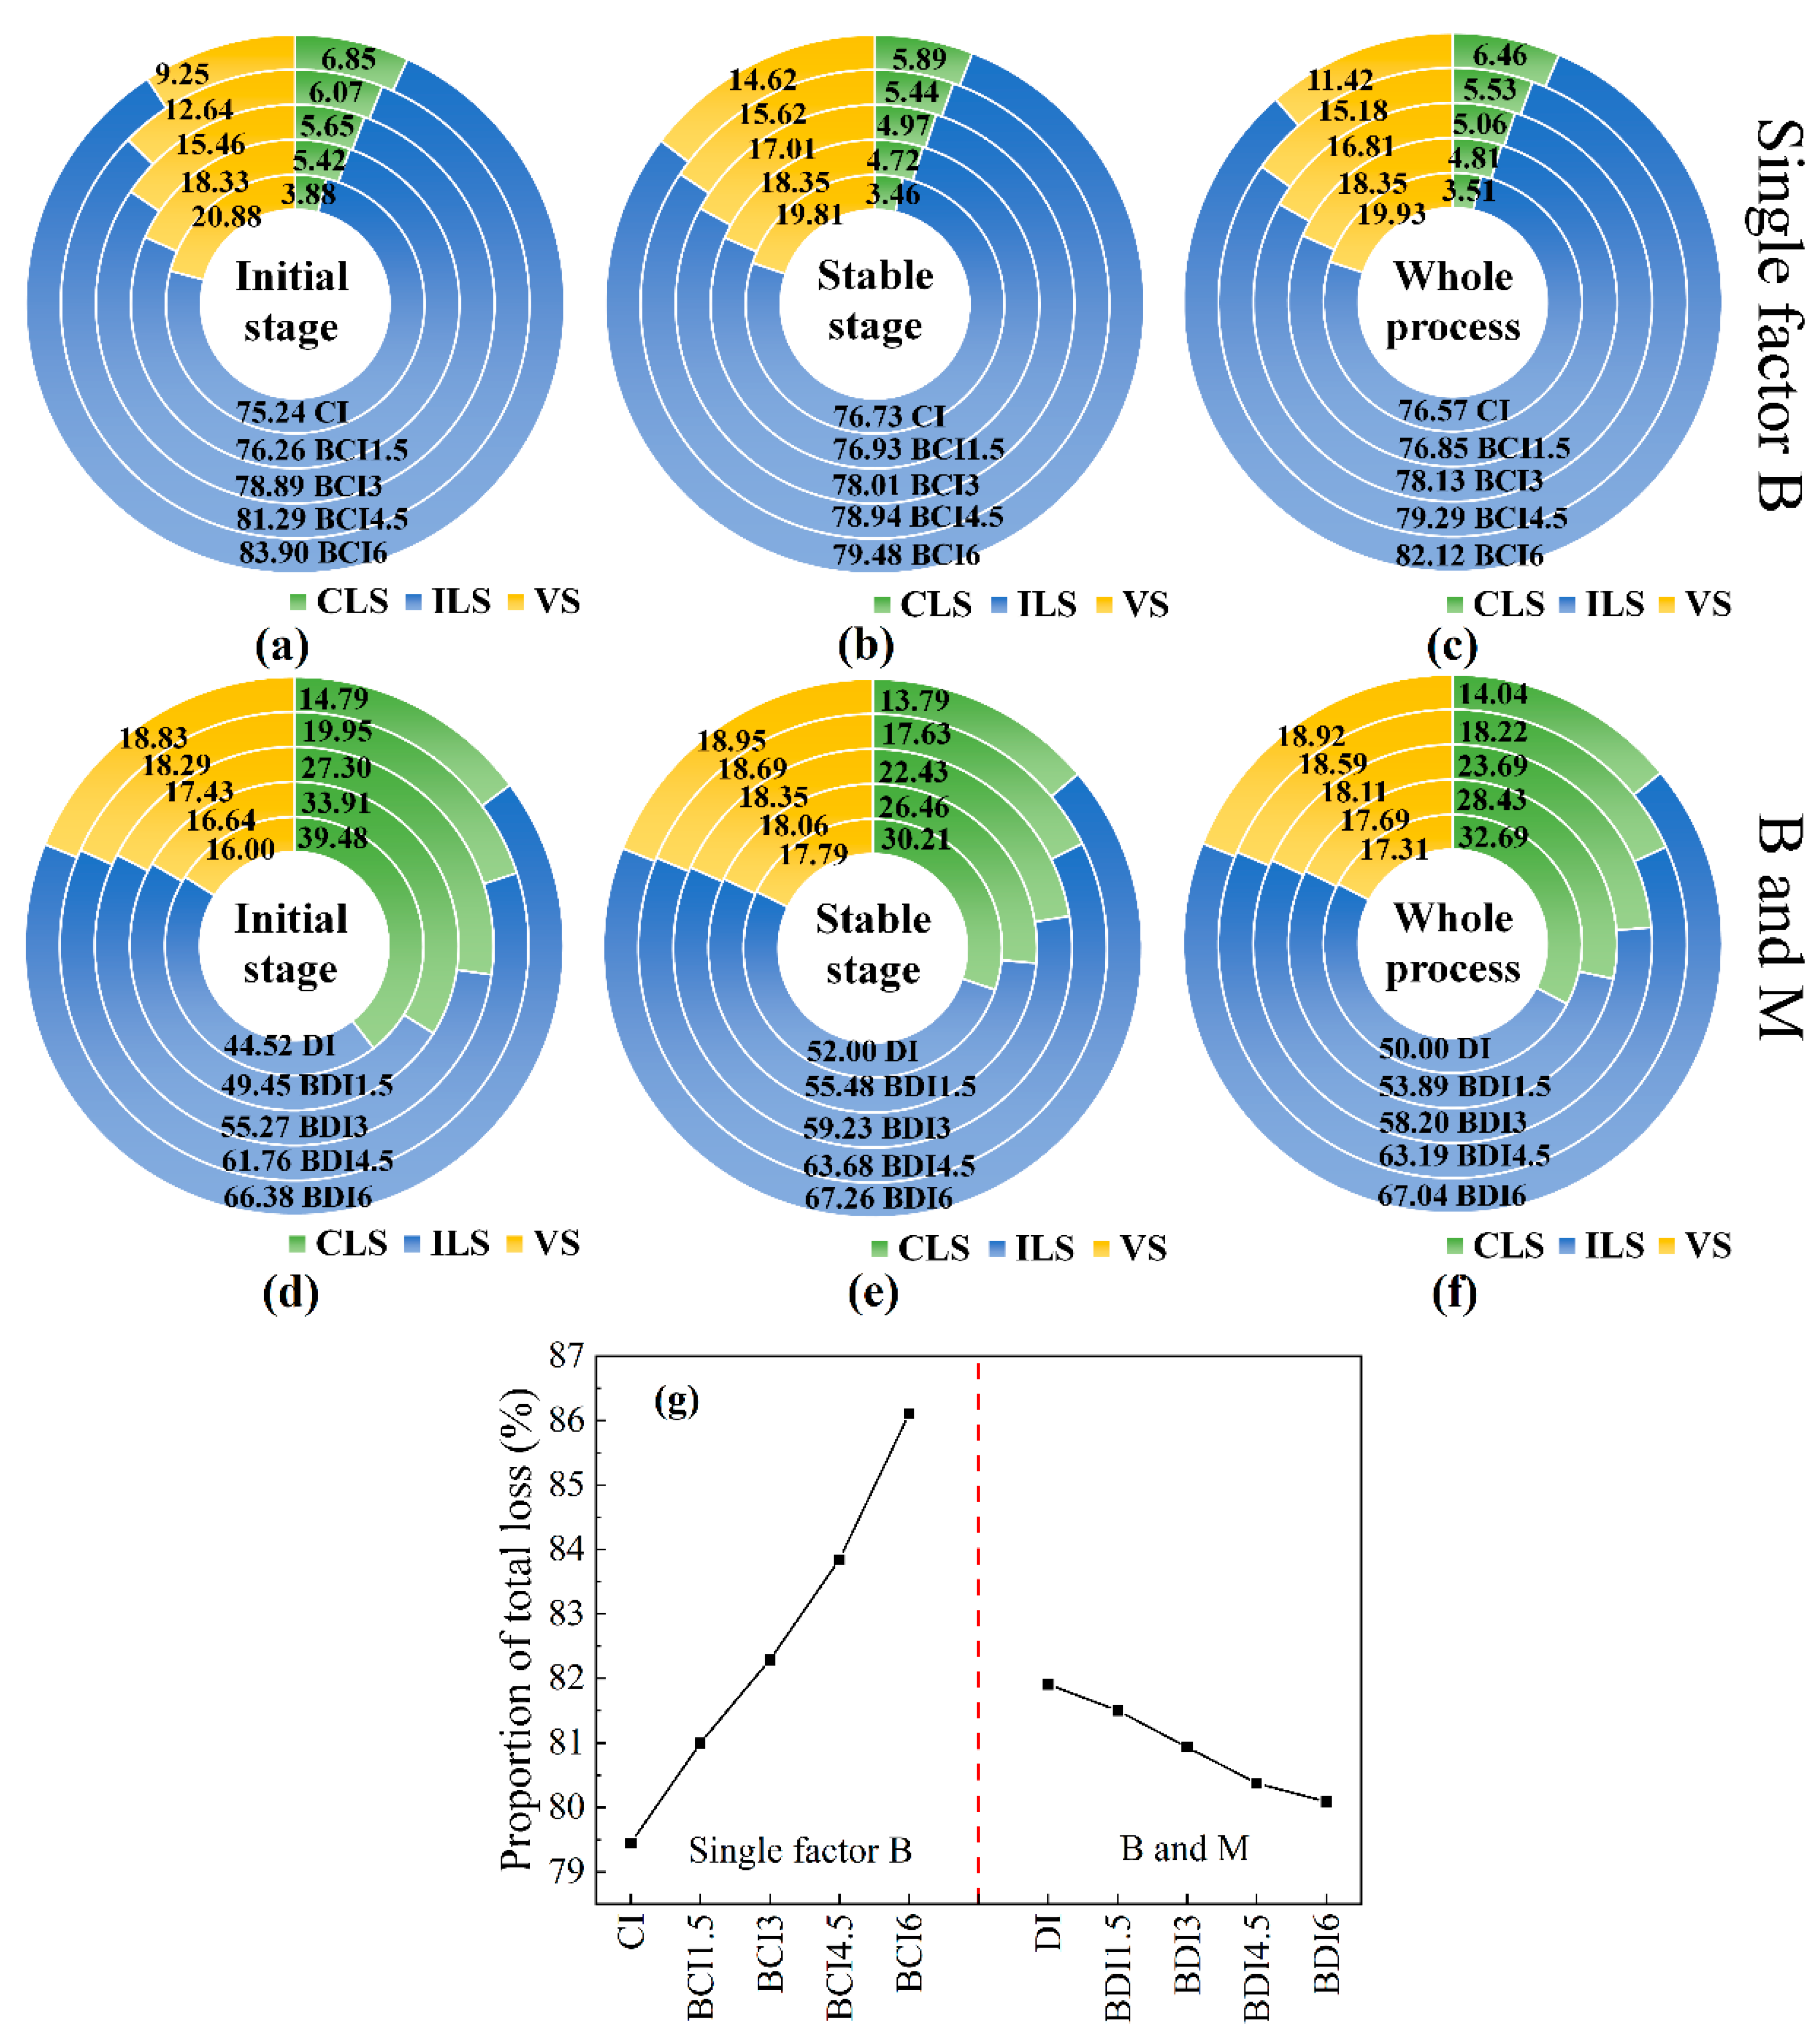
To more intuitively analyze the difference between the single factor and double factors, the corresponding proportion was drawn in Figure 5. A single factor B increased the proportion of CLS and ILS and decreased the proportion of ILS, and the proportion of CLS was enhanced with the coupling effect. Figure 5 revealed that the single factor B promoted the soil water loss, while the coupling of B and M inhibited it. It showed that the coupling effect was more advantageous for achieving water saving.

3.2.2. Correlation and Effect Analysis

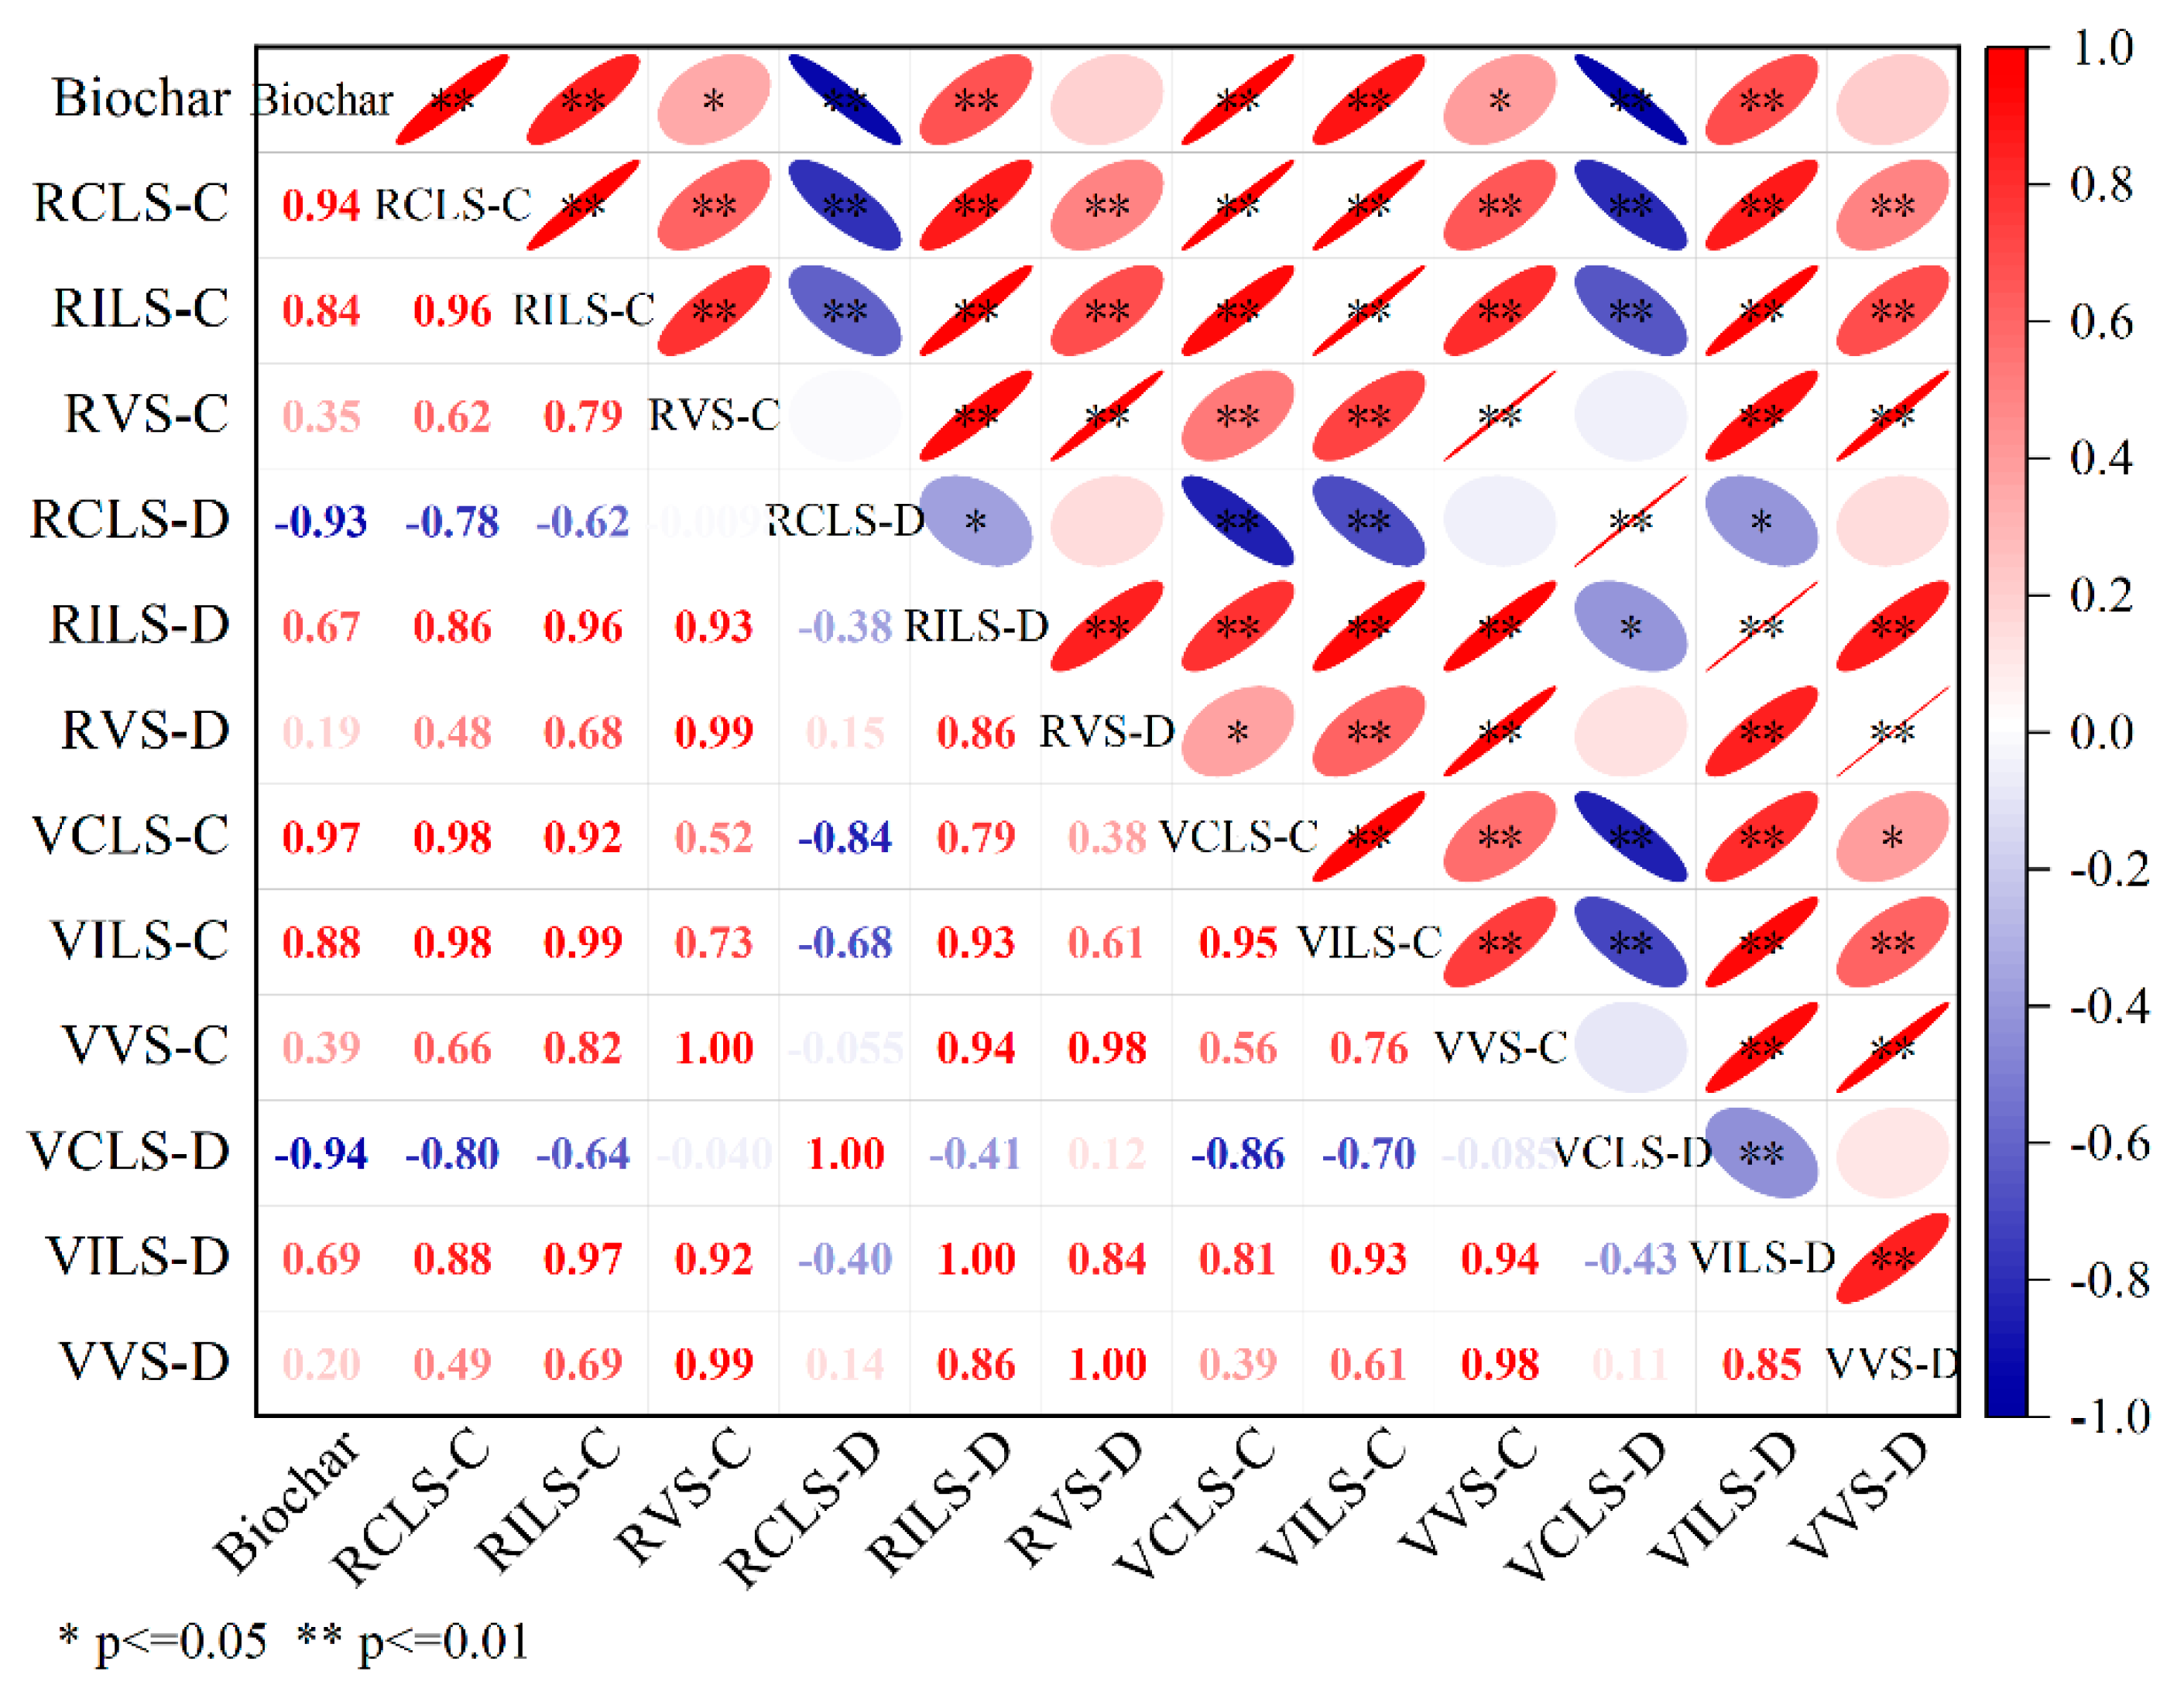
Figure 6 revealed that biochar was negatively correlated with RCLS-D and VCLS-D, while the rest were positively correlated. Biochar had the largest correlation with CLS-related indexes and the smallest correlation with VS-related indexes. The main effects of B and M on the rate and amount of water loss were significant (p ≤ 0.05), and the interaction effect (B × M) was also significant, except for vs. (p > 0.05). The above results showed that B and M had a coupling effect on water loss and had the least effect on VS, which was related to the surface application of biochar.

3.3. Responses of Farmland Water Use Efficiency to Multiple Factors (B, M, I)

3.3.1. Water Consumption, Yield, and Water Use Efficiency

Responses of water consumption (ET), yield (Y), and water use efficiency (WUE) to multiple factors (B, M, I) in different hydrological years are shown in Figure 7. In the wet year, the ET of conventional irrigation increased slightly with the increase in B, increased first and then decreased with the increase in I, and peaked at I = 180 mm (BCI6) (Figure 7a). The ET of drip irrigation (peak at 419.3 mm) was significantly lower than that of conventional irrigation (CI) (peak at 426.1 mm). Compared with the wet years, the ET in normal years was higher, and the ET gap between the two irrigation methods was larger (Figure 7b). Interestingly, ET in both irrigation methods was enhanced with increasing B and I in dry years. The peak of ET appeared in BCI6 (406.0 mm) and BDI6 (398.5 mm) at I = 360 mm, which was significantly less than in wet and normal years (Figure 7c). Under the coupling effects (B, M, I), ET decreased in wet and normal years and increased in dry years.
In wet and normal years, the Y rose with the increase in B, and increased first and then decreased with I (Figure 7d,e). They had the highest Y when the irrigation was 180 mm and the amount of biochar was 6 kg·m−2. Y was higher in drip irrigation and wet years than CI and normal years. In addition, Y was lowest in dry years (Figure 7f), and reached the peak at I = 360 mm and B = 6 kg·m−2. Y increased by 18.2–57.9% under the coupling effects compared with CI.
Influenced by ET and Y, the WUE of three hydrological years was in the range of 1.42–2.09 kg·m−3, and the WUE in wet years was highest (Figure 7g–i). Compared with CI, the WUE increased with the increase in biochar, decreased with the increase in I in wet and normal years, and increased in dry years. The maximum growth rates of WUE for conventional irrigation were 17.1% (BCI6, 0 mm), 17.2% (BCI6, 0 mm), and 32.9% (BCI6, 360 mm) in wet years, normal years, and dry years, respectively, those of drip irrigation were 18.8% (BDI6, 0 mm), 18.8% (BDI6, 0 mm), and 34.9% (BDI 6, 360 mm). WUE was enhanced by 17.1–34.9% under the action of multiple factors.

3.3.2. Path Analysis and Effect Analysis

There was a nonlinear response relationship between ET, Y, WUE, and B, I, and M (Table 5). The size of the path coefficient represents the dominance of the factor. The positive or negative value of the path coefficient represents positive or negative correlations. B played a dominant role in Y_W, Y_N, WUE_W, WUE_N, and WUE_D. Irrigation (I) played a dominant role in ET_W, ET_D, and Y_D. M played a dominant role in ET_N. The contribution rates of B, I, and M were 55.6%, 33.3%, and 11.1%. Interaction effects in 27.8% approached significance (p ≤ 0.05) (Table 6). The above revealed that B, I, and M had a coupling effect on ET, Y, and WUE, of which B contributed the most, followed by I and M.

4. Discussion

4.1. Changes in Soil Water Loss

In the past decades, biochar has been attracting much attention as an emerging soil amendment [4,15,16]. During this period, although the effects of biochar on the physical and chemical properties of the soil have been widely investigated [41,42,43,44], information on how biochar affects soil leakage loss is still limited. In this study, we analyzed the response of soil water loss to the coupling effect of biochar (B) and irrigation methods (M). A single factor (B) raised the soil leakage loss. There were two main reasons for the rise in soil leakage loss caused by biochar: (i) the decrease in water holding capacity and (ii) the obvious increase in total water entering the soil per unit of time. Our findings argue against the first reason. We found that biochar increased soil-saturated water content and promoted soil to absorb more water (Table 3), which has been found in other studies [15,41]. In addition, biochar increased soil infiltration rate and total irrigation amounts (Figure 2c and Figure 5c), which further indicated that the increase in water leakage loss by biochar was mainly due to the second reason. Contrary to our findings, relevant studies have found that B reduces soil water loss [6,13]. Because the water loss they studied was runoff loss, the soil leakage loss was not considered. For farmland soil prone to soil erosion, it was advantageous to increase the amount of water loss. This study found that biochar increased water loss by promoting irrigation water infiltration. When the irrigation amounts were constant, biochar promoted soil water infiltration, which delayed the formation of surface runoff and reduced runoff. It is consistent with the previous research [6,13], which also justifies the rationality of our result. The runoff had a positive correlation effect on soil erosion [12]. Reducing black soil erosion in the study area was conducive to the healthy development of black soil agriculture and the suppression of non-point source pollution [45]. The water eventually drained away in the form of seepage loss, resulting in the waste of water resources. Compared with single factor B, the total loss of paddy fields was reduced under the synergistic effect, further alleviating the waste of water resources (Figure 4d). Moreover, the concentration of fertilizers and pesticides carried by the leakage was decreased with the soil’s slow-release effect, alleviating the threat to the groundwater environment.
Only deep percolation is considered in studies on soil water leakage in paddy fields; the lack of lateral leakage research results in a fuzzy understanding of the actual water loss [25,46,47,48]. In this study, the water seepage loss of paddy fields was vertical seepage (VS) and horizontal seepage, which includes cultivated layer lateral seepage (CLS) and illuvial layer lateral seepage (ILS). Due to the compactness of the plow pan layer, no seepage outflow from that layer, and a similar phenomenon has been observed in related studies [49]. It was found that single-factor biochar significantly increased CLS, ILS, and VS, and the synergistic effect of B and M increased ILS and VS. The leakage loss in different ways was affected by the improvement of soil physical properties by biochar. Putting biochar into soil reduced soil bulk density and increased soil porosity [14,50]. Biochar increased soil water retention due to the large inner surface area and strong adsorption of biochar, enabling the soil to absorb more water [51,52]. On this basis, the soil water conductivity and water infiltration capacity were improved [17,34], facilitating more water flow into the soil and increasing the water leakage loss (especially in fertile soil). Furthermore, we found that the water leakage loss was positively related to the biochar application rate (Figure 4). Other studies have also shown that the greater the biochar application rate, the greater the improvement in soil physicochemical properties, not considering overuse of biochar [53]. Synergistic effects of B and M inhibited CLS, which was the result of the unique drip irrigation [54]. Although the dripper located at the edge of the soil led to the generation of CLS, more moisture was preserved in the soil by biochar and moved downward rapidly, inhibiting the CLS [15,17]. The order of leakage was ILS > vs. > CLS and ILS > CLS > vs. in conventional irrigation and drip irrigation, respectively (Figure 5). It indicated that the main leakage pathway of paddy black soil was ILS, not VS (deep percolation) [46,47].
Water leakage loss is not always harmful in practical agricultural production. For long-saturated paddy fields [55], proper water leakage can balance the redox reaction of paddy fields and mitigate greenhouse gas emissions [21,56,57]. Despite the positive findings of this study, limitations do exist. (i) This study was only a column soil experiment with unplanted soil. (ii) The actual climatic conditions of the field were not considered in this experiment. (iii) The depth of soil in the column test was only 90 cm, which was thinner than the actual farmland soil. To address these issues, a long-term field experiment is essential. Overall, water loss has a positive response to single factor B and single factor M and has a better response to the coupling effect of B and M. The biochar application of 6 kg·m−2 was the best amount in our study. It is suggested that suitable biochar application amounts and irrigation management should be selected according to crop type, water resources, climate, and soil conditions.

4.2. Changes in Water Use Efficiency of Farmland

Different from other crops, rice has higher evapotranspiration and excessive water loss during the growth process, resulting in low WUE [58]. In recent years, the world has been committed to water-saving and production-increasing, among which biochar and farmland irrigation management have been given more and more attention [29]. In this study, the synergistic effects of B, I, and M on ET, Y, and WUE in paddy fields in the northeastern plains of China were investigated by field experiments and HYDRUS–AquaCrop simulations.
An increase in water loss caused by biochar can give a slight rise to rice water consumption. This is consistent with the finding of Shao [59], which found that water consumption in paddy fields was proportional to the amount of water loss. Moreover, ET is closely related to irrigation volume, irrigation method, and hydrological year. In wet and normal years, ET first increased and then decreased with the increase in irrigation amounts (peak at I = 180 mm). In dry years, the rainfall did not meet the requirements of rice growth; the higher the irrigation amounts, the greater the ET (peak at I = 360 mm). With less surface water from drip irrigation, surface evaporation decreased. Consequently, a smaller ET existed in drip irrigation compared with conventional irrigation (Figure 7). Drip irrigation can reduce crop irrigation by 60% in relevant experimental findings [30,60]. However, their result showed that biochar reduced ET, which was inconsistent with the findings of the present study and closely linked to differences in crop types, irrigation, climate, test location, soil properties, and other factors [20]. ET fluctuates during the actual growing season, and that also appears in our simulation.
A long-pursued primary goal of agricultural production is yield [61]. Being a staple food of half of the world’s population, the increased rice production is of paramount importance [23,29]. In the present study, Y was significantly enhanced by B and I synergistically, the largest at the application of biochar 6 kg·m−2 (Figure 7). However, the greater amount of irrigation is not conducive to a high yield, which leads to waste of water resources and reduces WUE. In addition, sufficient rainfall in wet and normal years results in the highest Y at I = 180 mm. While deficient rainfall in dry years caused a lack of water for rice growth and the highest Y at I = 360 mm (Figure 7). Trends in Y were similar to the ET. The addition of biochar into soil increased crop yield owing to improving soil nutrients and water use efficiency [18,19], especially in the root zone [62]. Synergistic effects of B, I, and M had a better yield increase effect, as drip irrigation can transfer water and fertilizer directly to the root zone of the crop, facilitating plant uptake [60]. The yield of drip-irrigated rice was lower due to the low temperature of irrigation water or drought stress caused by drip irrigation [31,63]. Drip irrigation did not harm Y in this experiment because of the synergistic effect of multiple factors and the high indoor temperature.
In agricultural production, WUE is used to judge the level of integrated utilization of resources. To reduce water resource waste in agricultural production, research on how to achieve high WUE in crops is necessary. WUE of rice soils with biochar added in conventional irrigation and drip irrigation increased by 17.1–32.9% and 18.8–34.9%, respectively. Faloye [20] found that biochar increased WUE by 13%, and Sui [21] reported that biochar did not affect WUE. Notably, we had a higher WUE, illustrating that B, I, and M synergies improve better than biochar alone. It was also found that B contributed the most, followed by I and M (Table 5 and Table 6). It means that biochar can be used to improve WUE for the treatment with different I and M. Biochar also promoted WUE in crops such as tobacco, maize, and tomato [10,20]. This is because the addition of biochar improved soil properties, water exchange of crop leaves, and crop yield and reduced water consumption, thereby increasing WUE [9,11]. Overall, our results are worth recommending, because too many biomass materials (straw) can be converted into biochar to mitigate environmental pollution.

5. Conclusions

The water leakage loss of black soil in rice fields of cold regions was affected by the coupling of biochar (B) and irrigation methods (M). Water consumption (ET), yield (Y), and water use efficiency (WUE) were affected by the synergistic effect of B, M, and irrigation amounts (I). The water leakage loss included the cultivated layer lateral seepage (CLS), the illuvial layer lateral seepage (ILS), and the vertical seepage (VS), in which the main leakage way was the ILS. Moisture leakage loss was significantly increased by single-factor biochar (p < 0.05) and was positively correlated with biochar application rate. However, with the coupling effect of B and M, water leakage loss was reduced to help reduce water waste and environmental pollution in farmland. In addition, ET, Y, and WUE were correlated with hydrological years (most obvious in dry years), except for the synergistic effect of B, I, and M. Among the single factors, single factor B contributed the most, followed by I and M. Compared with the single-factor effect, the synergistic effect of biochar and irrigation management was better; rice yield and WUE increased by 18.2–57.9% and 17.1–34.9%. The maximum values of Y and WUE in wet and normal years were the treatment of drip irrigation with biochar and no water (BDI6, 0 mm), and in dry years, drip irrigation with biochar and water (BDI6, 360 mm). The results of this study provide a reference for the efficient and sustainable utilization of water and soil resources in the black soil region of the world. A long-term farmland monitoring experiment is necessary, which is helpful for managers to make an accurate judgment according to the complex farmland environment.

Author Contributions

Conceptualization, H.W. and D.S.; methodology, H.W. and W.D.; writing—original draft preparation, H.W.; software and validation, J.Q. and R.Z.; investigation and data curation, X.Y., M.Z. and L.M.; resource, D.S.; writing—review and editing, W.D., D.S. and L.L.; supervision and funding acquisition, L.L. and J.H. All authors have read and agreed to the published version of the manuscript.

Funding

This research was funded by the Chinese National Natural Science Foundation (No. U21A20156) and the Key Scientific Research Project of Hubei Provincial Water Resources (No. HBSLKY202506).

Data Availability Statement

The original contributions presented in this study are included in the article. Further inquiries can be directed to the corresponding authors.

Acknowledgments

The authors would like to thank the editor and reviewers for their valuable suggestions, which significantly improved the quality of the paper. In addition, the authors would like to thank the Qingan Irrigation Experimental Station and the School of Water Resources and Hydropower Engineering of Wuhan University for providing the study site and meteorological data.

Conflicts of Interest

The authors declare no conflicts of interest.

References

  1. Liu, H.; Qi, Y.; Wang, J.; Jiang, Y.; Geng, M. Synergistic effects of crop residue and microbial inoculant on soil properties and soil disease resistance in a Chinese Mollisol. Sci. Rep. 2021, 11, 24225. [Google Scholar] [CrossRef] [PubMed]
  2. Zhang, Z.; Han, X.; Yan, J.; Zou, W.; Wang, E.; Lu, X.; Chen, X. Keystone microbiomes revealed by 14 years of field restoration of the degraded agricultural soil under distinct vegetation scenarios. Front. Microbiol. 2020, 11, 1915. [Google Scholar] [CrossRef] [PubMed]
  3. Xu, W.; You, Y.; Wang, Z.; Chen, W.; Zeng, J.; Zhao, X.; Su, Y. Dibutyl phthalate alters the metabolic pathways of microbes in black soils. Sci. Rep. 2018, 8, 2605. [Google Scholar] [CrossRef]
  4. Fu, Q.; Zhao, H.; Li, H.; Li, T.X.; Hou, R.J.; Liu, D.; Ji, Y.; Gao, Y.; Yu, P.F. Effects of biochar application during different periods on soil structures and water retention in seasonally frozen soil areas. Sci. Total Environ. 2019, 694, 133732. [Google Scholar] [CrossRef]
  5. Zhou, M.; Liu, C.; Wang, J.; Meng, Q.; Yuan, Y.; Ma, X.; Liu, X.; Zhu, Y.; Ding, G.; Zhang, J.; et al. Soil aggregates stability and storage of soil organic carbon respond to cropping systems on Black Soils of Northeast China. Sci. Rep. 2020, 10, 265. [Google Scholar] [CrossRef]
  6. Abrol, V.; Ben-Hur, M.; Verheijen, F.G.A.; Keizer, J.J.; Martins, M.A.S.; Tenaw, H.; Tchehansky, L.; Graber, E.R. Biochar effects on soil water infiltration and erosion under seal formation conditions: Rainfall simulation experiment. J. Soils Sediments 2016, 16, 2709–2719. [Google Scholar] [CrossRef]
  7. Weber, K.; Quicker, P. Properties of biochar. Fuel 2018, 217, 240–261. [Google Scholar] [CrossRef]
  8. Farhangi-Abriz, S.; Torabian, S.; Qin, R.; Noulas, C.; Lu, Y.; Gao, S. Biochar effects on yield of cereal and legume crops using meta-analysis. Sci. Total Environ. 2021, 775, 145869. [Google Scholar] [CrossRef]
  9. Ahmed, A.; Kurian, J.; Raghavan, V. Biochar influences on agricultural soils, crop production, and the environment: A review. Environ. Rev. 2016, 24, 495–502. [Google Scholar] [CrossRef]
  10. Liu, X.Z.; Wei, Z.H.; Ma, Y.Y.; Liu, J.; Liu, F.L. Effects of biochar amendment and reduced irrigation on growth, physiology, water-use efficiency and nutrients uptake of tobacco (Nicotiana tabacum L.) on two different soil types. Sci. Total Environ. 2021, 770, 144769. [Google Scholar] [CrossRef] [PubMed]
  11. Partovi, Z.; Ramezani Etedali, H.; Kaviani, A. Effects of applying biochar and straw on nitrate leaching and maize yield production. Water Environ. J. 2021, 35, 943–950. [Google Scholar] [CrossRef]
  12. Li, Y.; Zhang, F.; Yang, M.; Zhang, J. Effects of adding biochar of different particle sizes on hydro-erosional processes in small scale laboratory rainfall experiments on cultivated loessial soil. Catena 2019, 173, 226–233. [Google Scholar] [CrossRef]
  13. Li, Z.-G.; Gu, C.-M.; Zhang, R.-H.; Ibrahim, M.; Zhang, G.-S.; Wang, L.; Zhang, R.-Q.; Chen, F.; Liu, Y. The benefic effect induced by biochar on soil erosion and nutrient loss of slopping land under natural rainfall conditions in central China. Agr. Water Manage. 2017, 185, 145–150. [Google Scholar] [CrossRef]
  14. Blanco-Canqui, H. Biochar and Soil Physical Properties. Soil Sci. Soc. Am. J. 2017, 81, 687–711. [Google Scholar] [CrossRef]
  15. Carvalho, M.L.; de Moraes, M.T.; Cerri, C.E.P.; Cherubin, M.R. Biochar Amendment Enhances Water Retention in a Tropical Sandy Soil. Agriculture 2020, 10, 62. [Google Scholar] [CrossRef]
  16. Garg, A.; Xing, X.; Bordoloi, S. Water retention models for soils mixed with waste residues: Application of the modified van-Genuchten and Brooks-Corey models. Biomass Convers. Biorefin. 2020, 12, 5059–5066. [Google Scholar] [CrossRef]
  17. Bordoloi, S.; Garg, A.; Sreedeep, S.; Peng, L.; Mei, G.X. Investigation of cracking and water availability of soil-biochar composite synthesized from invasive weed water hyacinth. Bioresour. Technol. 2018, 263, 665–677. [Google Scholar] [CrossRef]
  18. Mosharrof, M.; Uddin, M.K.; Jusop, S.; Sulaiman, M.F.; Shamsuzzaman, S.M.; Haque, A.N.A. Changes in Acidic Soil Chemical Properties and Carbon Dioxide Emission Due to Biochar and Lime Treatments. Agriculture 2021, 11, 219. [Google Scholar] [CrossRef]
  19. Solaiman, Z.M.; Shafi, M.I.; Beamont, E.; Anawar, H.M. Poultry Litter Biochar Increases Mycorrhizal Colonisation, Soil Fertility and Cucumber Yield in a Fertigation System on Sandy Soil. Agriculture 2020, 10, 480. [Google Scholar] [CrossRef]
  20. Faloye, O.T.; Alatise, M.O.; Ajayi, A.E.; Ewulo, B.S. Effects of biochar and inorganic fertiliser applications on growth, yield and water use efficiency of maize under deficit irrigation. Agr. Water Manag. 2019, 217, 165–178. [Google Scholar] [CrossRef]
  21. Sui, Y.; Gao, J.; Liu, C.; Zhang, W.; Lan, Y.; Li, S.; Meng, J.; Xu, Z.; Tang, L. Interactive effects of straw-derived biochar and N fertilization on soil C storage and rice productivity in rice paddies of Northeast China. Sci. Total Environ. 2016, 544, 203–210. [Google Scholar] [CrossRef] [PubMed]
  22. Liu, Q.; Liu, B.; Ambus, P.; Zhang, Y.; Hansen, V.; Lin, Z.; Shen, D.; Liu, G.; Bei, Q.; Zhu, J.; et al. Carbon footprint of rice production under biochar amendment—A case study in a Chinese rice cropping system. GCB Bioenergy 2016, 8, 148–159. [Google Scholar] [CrossRef]
  23. Godfray, H.C.J.; Beddington, J.R.; Crute, I.R.; Haddad, L.; Lawrence, D.; Muir, J.F.; Pretty, J.; Robinson, S.; Thomas, S.M.; Toulmin, C. Food Security: The Challenge of Feeding 9 Billion People. Science 2010, 327, 812–818. [Google Scholar] [CrossRef]
  24. Saito, H.; Fukuta, Y.; Obara, M.; Tomita, A.; Ishimaru, T.; Sasaki, K.; Fujita, D.; Kobayashi, N. Two Novel QTLs for the Harvest Index that Contribute to High-Yield Production in Rice (Oryza sativa L.). Rice 2021, 14, 18. [Google Scholar] [CrossRef] [PubMed]
  25. Cesari de Maria, S.; Rienzner, M.; Facchi, A.; Chiaradia, E.A.; Romani, M.; Gandolfi, C. Water balance implications of switching from continuous submergence to flush irrigation in a rice-growing district. Agr. Water Manag. 2016, 171, 108–119. [Google Scholar] [CrossRef]
  26. Tan, X.; Shao, D.; Gu, W.; Liu, H. Field analysis of water and nitrogen fate in lowland paddy fields under different water managements using HYDRUS-1D. Agr. Water Manag. 2015, 150, 67–80. [Google Scholar] [CrossRef]
  27. Yang, J.; Yao, Y.; Shao, C.; Li, Y.; Fisher, J.B.; Cheng, J.; Chen, J.; Jia, K.; Zhang, X.; Shang, K.; et al. A novel TIR-derived three-source energy balance model for estimating daily latent heat flux in mainland China using an all-weather land surface temperature product. Agric. For. Meteorol. 2022, 323, 109066. [Google Scholar] [CrossRef]
  28. Xu, B.; Shao, D.; Fang, L.; Yang, X.; Chen, S.; Gu, W. Modelling percolation and lateral seepage in a paddy field-bund landscape with a shallow groundwater table. Agr. Water Manag. 2019, 214, 87–96. [Google Scholar] [CrossRef]
  29. Haque, A.N.A.; Uddin, M.K.; Sulaiman, M.F.; Amin, A.M.; Hossain, M.; Abd Aziz, A.; Mosharrof, M. Impact of Organic Amendment with Alternate Wetting and Drying Irrigation on Rice Yield, Water Use Efficiency and Physicochemical Properties of Soil. Agronomy 2021, 11, 1529. [Google Scholar] [CrossRef]
  30. He, H.; Ma, F.; Yang, R.; Chen, L.; Jia, B.; Cui, J.; Fan, H.; Wang, X.; Li, L. Rice Performance and Water Use Efficiency under Plastic Mulching with Drip Irrigation. PLoS ONE 2013, 8, 83103. [Google Scholar] [CrossRef] [PubMed]
  31. Zhang, J.; Hou, J.; Zhang, H.; Meng, C.; Zhang, X.; Wei, C. Low Soil Temperature Inhibits Yield of Rice Under Drip Irrigation. J. Soil Sci. Plant Nutr. 2019, 19, 228–236. [Google Scholar] [CrossRef]
  32. Guo, Q.; Chen, L. Analysis of advantage and prospects for rice drip irrigation under plastic film cultivation development in China. China Rice 2012, 18, 36–39. [Google Scholar]
  33. Tian, Y.; Shao, D.; Li, S.; Wang, B. Response of Rice Water Requirement to Groundwater Depths and Irrigations Simulation in Cold Region of Northeast China. J. Irrig. Drain. 2019, 38, 68–77. [Google Scholar]
  34. Wang, H.; Shao, D.; Ji, B.; Gu, W.; Yao, M. Biochar effects on soil properties, water movement and irrigation water use efficiency of cultivated land in Qinghai-Tibet Plateau. Sci. Total Environ. 2022, 829, 154520. [Google Scholar] [CrossRef] [PubMed]
  35. Šimůnek, J.; van Genuchten, M.T.; Šejna, M. Development and Applications of the HYDRUS and STANMOD Software Packages and Related Codes. Vadose Zone J. 2008, 7, 587–600. [Google Scholar] [CrossRef]
  36. Vangenuchten, M.T. A Closed Equation for Predicting the Hydraulic Condictivity of Unsatured Soils. Soil Sci. Soc. Am. J. 1980, 44, 892–898. [Google Scholar] [CrossRef]
  37. Steduto, P.; Hsiao, T.C.; Raes, D.; Fereres, E. AquaCrop-The FAO Crop Model to Simulate Yield Response to Water: I. Concepts Underlying Principles. Agron. J. 2009, 101, 426–437. [Google Scholar] [CrossRef]
  38. Raes, D.; Steduto, P.; Hsiao, T.C.; Fereres, E. AquaCrop-The FAO Crop Model to Simulate Yield Response to Water: II. Main Algorithms and Software Description. Agron. J. 2009, 101, 438–447. [Google Scholar] [CrossRef]
  39. Dwivedi, D.; Mohanty, B.P.; Lesikar, B.J. Impact of the Linked Surface Water-Soil Water-Groundwater System on Transport of E. coli in the Subsurface. Water Air Soil Pollut. 2016, 227, 351. [Google Scholar] [CrossRef]
  40. Nash, J.E.; Sutcliffe, J.V. River flow forecasting through conceptual models part I—A discussion of principles. J. Hydrol. 1970, 10, 282–290. [Google Scholar] [CrossRef]
  41. Aller, D.; Rathke, S.; Laird, D.; Cruse, R.; Hatfield, J. Impacts of fresh and aged biochars on plant available water and water use efficiency. Geoderma 2017, 307, 114–121. [Google Scholar] [CrossRef]
  42. Glab, T.; Palmowska, J.; Zaleski, T.; Gondek, K. Effect of biochar application on soil hydrological properties and physical quality of sandy soil. Geoderma 2016, 281, 11–20. [Google Scholar] [CrossRef]
  43. Hallin, I.L.; Douglas, P.; Doerr, S.H.; Bryant, R. The effect of addition of a wettable biochar on soil water repellency. Eur. J. Soil Sci. 2015, 66, 1063–1073. [Google Scholar] [CrossRef]
  44. Hu, F.; Xu, C.; Ma, R.; Tu, K.; Yang, J.; Zhao, S.; Yang, M.; Zhang, F. Biochar application driven change in soil internal forces improves aggregate stability: Based on a two-year field study. Geoderma 2021, 403, 115276. [Google Scholar] [CrossRef]
  45. Oliveira, F.R.; Patel, A.K.; Jaisi, D.P.; Adhikari, S.; Lu, H.; Khanal, S.K. Environmental application of biochar: Current status and perspectives. Bioresour. Technol. 2017, 246, 110–122. [Google Scholar] [CrossRef]
  46. Darzi-Naftchali, A.; Karandish, F.; Simunek, J. Numerical modeling of soil water dynamics in subsurface drained paddies with midseason drainage or alternate wetting and drying management. Agr. Water Manag. 2018, 197, 67–78. [Google Scholar] [CrossRef]
  47. Mohammad, A.; Sudhishri, S.; Das, T.K.; Singh, M.; Bhattacharyya, R.; Dass, A.; Khanna, M.; Sharma, V.K.; Dwivedi, N.; Kumar, M. Water balance in direct-seeded rice under conservation agriculture in North-western Indo-Gangetic Plains of India. Irrig. Sci. 2018, 36, 381–393. [Google Scholar] [CrossRef]
  48. Pereira, L.S.; Cordery, I.; Iacovides, I. Improved indicators of water use performance and productivity for sustainable water conservation and saving. Agr. Water Manag. 2012, 108, 39–51. [Google Scholar] [CrossRef]
  49. Yang, X.; Shao, D.; Xu, B. Indoor experiment and simulation of soil water two-dimensional movement of the paddy fields in the northeast frigid of China. J. Hydraul. Eng. 2018, 49, 1017–1026. [Google Scholar]
  50. Verheijen, F.G.A.; Zhuravel, A.; Silva, F.C.; Amaro, A.; Ben-Hur, M.; Keizer, J.J. The influence of biochar particle size and concentration on bulk density and maximum water holding capacity of sandy vs sandy loam soil in a column experiment. Geoderma 2019, 347, 194–202. [Google Scholar] [CrossRef]
  51. Hussain, R.; Ravi, K.; Garg, A. Influence of biochar on the soil water retention characteristics (SWRC): Potential application in geotechnical engineering structures. Soil Tillage Res. 2020, 204, 104713. [Google Scholar] [CrossRef]
  52. Zhang, J.; Chen, Q.; You, C. Biochar Effect on Water Evaporation and Hydraulic Conductivity in Sandy Soil. Pedosphere 2016, 26, 265–272. [Google Scholar] [CrossRef]
  53. Blanco-Canqui, H. Biochar and Water Quality. J. Environ. Qual. 2019, 48, 2–15. [Google Scholar] [CrossRef] [PubMed]
  54. Faloye, O.T.; Alatise, M.O.; Ajayi, A.E.; Ewulo, B.S. Synergistic effects of biochar and inorganic fertiliser on maize (zea mays) yield in an alfisol under drip irrigation. Soil Tillage Res. 2017, 174, 214–220. [Google Scholar] [CrossRef]
  55. Cao, Y.; Shan, Y.; Wu, P.; Zhang, P.; Zhang, Z.; Zhao, F.; Zhu, T. Mitigating the global warming potential of rice paddy fields by straw and straw-derived biochar amendments. Geoderma 2021, 396, 115081. [Google Scholar] [CrossRef]
  56. Shen, J.; Tang, H.; Liu, J.; Wang, C.; Li, Y.; Ge, T.; Jones, D.L.; Wu, J. Contrasting effects of straw and straw-derived biochar amendments on greenhouse gas emissions within double rice cropping systems. Agr. Ecosyst. Environ. 2014, 188, 264–274. [Google Scholar] [CrossRef]
  57. Xiao, Y.N.; Sun, X.; Ding, J.; Jiang, Z.; Xu, J. Biochar improved rice yield and mitigated CH4 and N2O emissions from paddy field under controlled irrigation in the Taihu Lake Region of China. Atmos. Environ. 2019, 200, 69–77. [Google Scholar]
  58. Bouman, B.A.M.; Feng, L.P.; Tuong, T.P.; Lu, G.A.; Wang, H.Q.; Feng, Y.H. Exploring options to grow rice using less water in northern China using a modelling approach—II. Quantifying yield, water balance components, and water productivity. Agr. Water Manag. 2007, 88, 23–33. [Google Scholar] [CrossRef]
  59. Shao, G.; Gao, Y.; Lin, J.; Liu, Z.; Huang, D. Effects of Biochar on Water Requirement Regulation and Yield of Tomato under Different Groundwater Tables. Trans. Chin. Soc. Agric. Mach. 2019, 50, 250–258. [Google Scholar]
  60. Jia, Y.; Qu, Z.; Ding, Y.; Yang, W.; Ma, G.; Li, Z. The Effects of Soil Amendment with Straw Biochar on Water and Salt Dynamics as Well as Water Use Efficiency of Corn under Different Irrigations. J. Irrig. Drain. 2020, 39, 44–51. [Google Scholar]
  61. Hou, M.; Jin, Q.; Lu, X.Y.; Li, J.Y.; Zhong, H.Z.; Gao, Y. Growth, Water Use, and Nitrate-N-15 Uptake of Greenhouse Tomato as Influenced by Different Irrigation Patterns, N-15 Labeled Depths, and Transplant Times. Front. Plant Sci. 2017, 8, 666. [Google Scholar] [CrossRef] [PubMed]
  62. Zhang, A.F.; Bian, R.J.; Pan, G.X.; Cui, L.Q.; Hussain, Q.; Li, L.Q.; Zheng, J.W.; Zheng, J.F.; Zhang, X.H.; Han, X.J.; et al. Effects of biochar amendment on soil quality, crop yield and greenhouse gas emission in a Chinese rice paddy: A field study of 2 consecutive rice growing cycles. Field Crops Res. 2012, 127, 153–160. [Google Scholar] [CrossRef]
  63. Bai, R.; Chen, L.; Zhang, X.; Wei, G.; Wei, C. Effect of salinity and soil temperature on the growth and physiology of drip-irrigated rice seedlings. Arch. Agron. Soil Sci. 2017, 63, 513–524. [Google Scholar] [CrossRef]
Figure 1. The location of the study area.
Agronomy 15 02614 g001
Figure 2. Comparison of measured (M) and simulated (S) values in the water content, the infiltration rate, the rate of cultivated layer lateral seepage (RCLS), the rate of illuvial layer lateral seepage (RILS), and the rate of vertical seepage (RVS).
Agronomy 15 02614 g002
Figure 3. Comparison of measured and simulated values in soil volumetric water content (a) and biomass (b).
Agronomy 15 02614 g003
Figure 4. Stable water loss rate (a), water loss volume at 120 h (b), total irrigation (c), and total loss (d) under different biochar application rates and irrigation methods. Note: Values are the mean ± SE (n = 5). Lowercase letters indicate significant differences in the changes in the parameters in different biochar application rates under conventional irrigation and drip irrigation (p < 0.05). The data in the column represents the index change rate of the biochar treatment relative to no biochar. +, means increase. −, means decrease.
Agronomy 15 02614 g004
Figure 5. (ag) Proportion difference between a single factor and multiple factors. Note: CLS, cultivated layer lateral seepage. ILS, illuvial layer lateral seepage. VS, vertical seepage.
Agronomy 15 02614 g005
Figure 6. Correlation between biochar and water loss parameters under different irrigation methods. Note: C, conventional irrigation. D, drip irrigation. RCLS, the rate of cultivated layer lateral seepage. RILS, the rate of illuvial layer lateral seepage. RVS, the rate of vertical seepage. VCLS, the volume of cultivated layer lateral seepage. VILS, the volume of illuvial layer lateral seepage. VVS, the volume of vertical seepage. These are not variables generated by unrelated calculation procedures.
Agronomy 15 02614 g006
Figure 7. Changes in water consumption (ET), yield (Y), and water use efficiency (WUE) in different hydrological years.
Agronomy 15 02614 g007
Table 1. Important physical and chemical properties of the experimental materials.
ParametersCL + B
(0~20 cm)
CL
(0~20 cm)
PL
(20~35 cm)
IL
(35~90 cm)
Biochar
(B)
Sand mass fraction (%)11.62 ± 0.3510.22 ± 0.288.86 ± 0.238.09 ± 0.19-
Silt mass fraction (%)56.74 ± 3.2157.33 ± 3.4558.68 ± 3.6658.87 ± 3.68-
Clay mass fraction (%)31.64 ± 1.5832.44 ± 1.6432.46 ± 1.6733.04 ± 1.78-
Bulk density (g·cm−3)1.10 ± 0.0161.20 ± 0.011.40 ± 0.021.35 ± 0.018-
Organic matter content (g·kg−1)4.53 ± 0.064.14 ± 0.03---
pH value7.35 ± 0.096.40 ± 0.07--9.14 ± 0.1
C mass fraction (%)----68.60 ± 3.12
H mass fraction (%)----2.13 ± 0.18
N mass fraction (%)----1.28 ± 0.13
S mass fraction (%)----0.67 ± 0.05
Ash content (%)----25.18 ± 3.96
Particle size range (mm)----1.5-2.0
Note: Data are expressed as the mean ± S.D. -, not determined. CL + B, cultivated layer + biochar. CL, cultivated layer. PL, plow pan layer. IL, illuvial layer.
Table 2. Model performance statistics of simulated infiltration rate and water loss rate.
RateRMSE (cm·h−1)R2
CIBCIDIBDICIBCIDIBDI
Infiltration rate0.200.26000.8970.87111
RCLS0.170.280.520.390.9100.8490.8260.856
RILS0.360.420.120.300.8230.8010.8850.786
RVS0.220.330.220.270.8690.8390.8430.816
Note: CI, conventional irrigation. BCI, conventional irrigation + biochar. DI, drip irrigation. BDI, drip irrigation + biochar. RCLS, rate of cultivated layer lateral seepage. RILS, rate of illuvial layer lateral seepage. RVS, rate of vertical seepage.
Table 3. Soil hydraulic parameters of HYDRUS-2D.
Soil Layerθr (cm3·cm−3)θs (cm3·cm−3)anKs (cm·h−1)
CL + B (0~20 cm)0.09030.50210.00871.52540.1221
CL (0~20 cm)0.09110.48790.00831.54470.0965
PL (20~35 cm)0.08680.45440.00791.5170.3921
IL (35~90 cm)0.08880.46960.00811.41270.5029
Note: CL + B, cultivated layer + biochar. CL, cultivated layer. PL, plow pan layer. IL, illuvial layer. θr, residual volumetric water contents. θs, saturated volumetric water contents. Ks, saturated hydraulic conductivity. α and n, fitting parameters of the soil–water characteristic curve.
Table 4. Rice main parameter list of the AquaCrop model.
Model ParameterDescriptionRecommended ValueCalibration Value
CC0Initial canopy cover (%)0.1–1.53.76
CCxMaximum canopy cover (%)66–10095
CGCCanopy expansion (%)8.6–1611.2
CDCCanopy decline (%)6.5–12.18.4
RDmaxMaximum effective rooting depth (m)0.35–0.650.6
RDminMinimum effective rooting depth (m)0.30.3
KcTrCrop transpiration coefficient1.05–1.201.1
WUE Normalized biomass water productivity (g·m−2)12–2319
HI0Harvest Index (%)30–5642
TminMinimum effective temperature (°C)1010
TmaxMaximum effective temperature (°C)3030
Table 5. Regression equations and path coefficients for biochar (B), irrigation (I), and irrigation method (M) of the water consumption (ET), yield (Y), and water productivity (WUE) in wet year (W), normal year (N), and dry year (D).
Regression EquationPath CoefficientR2
BIM
ET_W = 413.026 + 0.135B + 0.043I − 5.614M0.0180.322 **−0.177 **0.368
ET_N = 429.576 + 0.117B + 0.025I − 11.143M0.0150.180 **−0.334 **0.379
ET_D = 368.902 − 0.508B + 0.148I − 8.746M−0.0380.631 **−0.155 **0.651
Y_W = 7.265 + 0.202B + 0.002I + 0.031M0.843 **0.0060.0300.844
Y_N = 6.813 + 0.188B + 0.001I + 0.026M0.841 **−0.0550.0270.843
Y_D = 5.193 + 0.170B + 0.005I + 0.159M0.440 **0.731 **0.0970.858
WUE_W = 1.761 + 0.048B + 0.001I + 0.032M0.815 **−0.182 **0.130 *0.845
WUE_N = 1.586 + 0.043B + 0.001I + 0.048M0.806 **−0.154 **0.210 **0.847
WUE_D = 1.462 + 0.042B + 0.011I + 0.058M0.599 **0.527 **0.195 **0.821
Note: *, correlation is significant at the 0.05 level. **, correlation is significant at the 0.01 level.
Table 6. Main and interaction effects of biochar (B), irrigation (I), and irrigation method (M) on the water consumption (ET), yield (Y), and water productivity (WUE) in wet year (W), normal year (N), dry year (D).
ET (mm)Y (t·hm−2)WUE (kg·m−3)
ET_WET_NET_DY_WY_NY_DWUE_WWUE_NWUE_D
Main Effects
Bnsns*********************
I*******ns***********
M*******************
Interaction Effects
B×Insns*nsnsnsnsnsns
B×Mnsns*****nsnsnsns
I×Mns***nsns***ns***
B×I×Mnsns*nsnsnsnsnsns
Note: ns, not significant p > 0.05. *, significant at p ≤ 0.05. **, significant at p ≤ 0.01. ***, significant at p ≤ 0.001.
Disclaimer/Publisher’s Note: The statements, opinions and data contained in all publications are solely those of the individual author(s) and contributor(s) and not of MDPI and/or the editor(s). MDPI and/or the editor(s) disclaim responsibility for any injury to people or property resulting from any ideas, methods, instructions or products referred to in the content.