Article

A GWR Approach to Determine Factors Controlling Soil Se in Fujian Province

1
Natural Resources Comprehensive Survey Command Center of China Geological Survey, Beijing 100055, China
2
School of Earth Sciences and Resources, China University of Geosciences, Beijing 100083, China
3
Key Laboratory of Coupling Process and Effect of Natural Resources Elements, Beijing 100055, China
4
Beijing Institute of Control Engineering, Beijing 100094, China
5
State Key Laboratory of Biogeology and Environmental Geology, China University of Geosciences, Wuhan 430078, China
*
Authors to whom correspondence should be addressed.
Agronomy 2025, 15(11), 2560; https://doi.org/10.3390/agronomy15112560
Submission received: 10 September 2025 / Revised: 20 October 2025 / Accepted: 4 November 2025 / Published: 5 November 2025
(This article belongs to the Section Soil and Plant Nutrition)

Abstract

Selenium (Se) is an essential trace element for human health, which is crucial for antioxidant defense, immune function, and disease prevention. Se deficiency affects around 40 countries worldwide, with China being one of the most severely impacted. While previous research has explored factors influencing soil Se content, such as the parent material, climate, and soil properties, the dominant controlling mechanisms across different spatial scales remain a subject of debate, especially in the Se-rich coastal regions of southeastern China. This study focuses on Fujian Province, using hotspot analysis and geographically weighted regression (GWR) to systematically examine the spatial distribution of soil Se and its key influencing factors. Hotspot analysis reveals multi-scale patterns in Se distribution: at the 1 km scale, Se hotspots are closely linked to metal minerals like sulfide and coal deposits; at the 2 km scale, Se-rich carbonate rocks and carbonaceous mudstones dominate; and, at the 10 km scale, Se accumulation is mainly controlled by organic matter and low-temperature conditions in high-altitude areas (≥1200 m). GWR analysis further clarifies the nonlinear relationships between soil Se and key environmental factors: organic matter strongly correlates with Se in coastal regions but weakly in land, indicating that this relationship is modulated by factors such as weathering intensity and clay content. The mobility of Se increases in alkaline soils (pH > 8.5), thus reducing its content; meanwhile, in acidic soils (pH < 4.5), its fixation is more complex. In acidic, low-aluminum settings, iron oxides adsorb Se effectively, whereas organic matter becomes the main carrier under alkaline conditions. Precipitation affects Se via atmospheric deposition and leaching, temperature promotes sulfide substitution through deposition but also accelerates the breakdown of organic matter, and altitude influences Se through hydrothermal variations. This study provides the first comprehensive analysis of the multi-factor mechanisms controlling soil Se in the Se-rich coastal areas of southeastern China at a regional scale, offering a scientific basis for the sustainable use of Se-enriched land resources.

1. Introduction

Selenium (Se) is an essential trace element for human health. Since its identification as a crucial nutrient in the 1950s, Se has gained increasing attention due to its important roles in antioxidant defense, immune function, thyroid hormone metabolism, and cancer prevention [1,2]. Its biological functions are primarily mediated through its incorporation into selenoproteins, such as glutathione peroxidase (GPx) and thioredoxin reductase (TrxR), which help to regulate the body’s redox balance and protect cells against oxidative damage [3]. Epidemiological studies have linked inadequate Se intake to several diseases, including Keshan disease, Kashin–Beck disease, cancer, and cardiovascular disorders [4,5]. At present, Se deficiency is estimated to affect populations in approximately 40 countries, with China being one of the most severely impacted [6,7].
Soil Se content is largely derived from the parent material [8,9], and is further modulated by various environmental and pedogenic factors such as climate [10,11], topography [12], soil-forming processes [13,14,15], and soil physicochemical properties [16]. Previous research has categorized the factors controlling soil Se sources and sinks across four spatial scales: molecular/microscale (10−7–10−3 m), local scale (10−3–101 m), field scale (101–103 m), and regional/large scale (103–106 m) [10]. Nevertheless, the dominant mechanisms influencing soil Se at the regional scale remain a subject of debate. Jones and Winkel [10] emphasized climate and its interaction with soil as the major driver, whereas Clístenes et al. [17] highlighted the combined role of the parent material and climate, attributing only secondary importance to soil properties. Różewicz and Bartosiewicz [2] suggested that extreme Se concentrations, either high (≥3.0 mg/kg) or low (<0.175 mg/kg), are mainly controlled by the parent material’s composition. In contrast, Shand et al. [18] identified soil texture, pH, redox potential (Eh), and organic matter as key influencing factors.
The complex interplay of these factors across scales makes it challenging to identify overarching controls. This is particularly true in the Se-rich coastal regions of southeastern China, where the effects of the climate, parent material, topography, and soil properties on the distribution of Se are still not well understood. Moreover, the nonlinear relationships between Se and environmental variables remain underexplored. To address these research gaps, this study utilizes hotspot analysis and GWR to examine the spatial distribution of soil Se in Fujian Province and its correlations with soil properties and environmental factors. The specific objectives are (1) to characterize the content and spatial distribution of soil Se in high-Se background areas; (2) to identify the multi-scale spatial clustering patterns of Se, soil properties, and environmental variables; and (3) to explore the key factors influencing soil Se content at the regional scale. The findings provide a scientific basis for the sustainable development and utilization of Se-rich land resources in coastal southeastern China.

2. Materials and Methods

2.1. Study Area

Fujian Province (23°33′–28°20′ N, 115°50′–120°40′ E) is situated in southeastern China and is characterized by a subtropical maritime monsoon climate, leading to warm and humid conditions with abundant precipitation. The region has a mean annual temperature ranging from 17 to 21 °C and receives an annual rainfall of 1400–2000 mm, making it one of the wettest provinces in China. Topographically, the area is predominantly mountainous, with hills and mountains accounting for more than 80% of its total land area.
The stratigraphic record of Fujian Province extends from the Archean to the Quaternary, with significant gaps present in the Silurian, lower to middle Devonian, and Paleogene systems. The province displays a diverse lithological composition, with sedimentary, metamorphic, and volcanic rocks each constituting roughly one-third of the topsoil exposures. Archean metamorphic rocks dominate the northern and northwestern regions, whereas central and southwestern areas expose Ordovician to Late Cretaceous shallow metamorphic, sedimentary, and volcanic strata. Eastern Fujian is largely covered by Late Jurassic to Early Cretaceous continental volcanic rocks, and the coastal areas contain scattered Late Tertiary and Quaternary deposits, including basaltic volcanics and marine–continental sediments.
The Carboniferous System, primarily distributed across central and southwestern Fujian, comprises clastic and carbonate sequences that host substantial iron, manganese, and lead-zinc mineralization. The Permian System, which is well-developed in the southwestern part of the province, represents one of the typical Permian successions in South China and constitutes the major coal-bearing stratum in Fujian.

2.2. Data Source and Processing

The soil data utilized in this study were provided by the Nanjing Center of the China Geological Survey. In accordance with the specifications outlined in the DZ/T 0258-2014 “Multi-objective Regional Geochemical Survey (1:250,000)” standard [19], a double-layer network sampling approach was employed. Topsoil samples were predominantly collected from cultivated land, followed by forest land and grassland, with a limited number obtained from construction land. Deep soil samples were collected at the center of each grid cell. The sampling depth for topsoil ranged from 0 to 20 cm, with an analytical sample density of 1 sample per 4 square kilometers, resulting in a total of 31,303 data points. For deep soil samples, the sampling depth ranged from 150 to 180 cm, with an analytical sample density of 1 sample per 16 square kilometers, yielding a total of 7986 samples. All sample collection and preparation procedures strictly adhered to the requirements specified in the DZ/T 0258-2014 standard. Samples were stored in sampling bags, individually wrapped in plastic to prevent cross-contamination, air-dried in a contamination-free environment, sieved through a 20-mesh nylon screen, and subsequently placed in clean polyethylene self-sealing bags for laboratory analysis and testing.
The temperature, precipitation, and elevation data utilized in this study were obtained from the Data Center for Resources and Environmental Sciences. Specifically, temperature and precipitation data from over 50 meteorological stations in Fujian Province covering a period of approximately 10 years were downloaded. These datasets were provided in the form of raster data interpolated at a spatial resolution of 1 km. Similarly, elevation data were also provided as 1 km resolution-interpolated raster data. Within the ArcGIS 10.7 software environment, raster calculations were conducted on the temperature and precipitation datasets to derive average values. Subsequently, the mean annual temperature (MAT), mean annual precipitation (MAP), and elevation (EL) attribute values for each sampling point were extracted using spatial analysis tools (Figure S1).

2.3. Sample Analysis and Quality Control

Sample analysis was conducted at the Fujian Provincial Geological Testing Research Center. All analytical procedures and quality control measures strictly adhered to the guidelines set forth in the Specification for Multi-Target Regional Geochemical Survey (1:250,000) (DZ/T 0258-2014) [19] and the Specification for Land Quality Geochemical Evaluation (DZ/T 0295-2016) [20]. The key analytical indicators and corresponding methodologies are summarized below (Table 1). All data were found to be reliable and valid.
Prior to analysis, the samples were sieved through a 2 mm mesh to remove plant roots and gravel. Soil pH was then measured in this fraction. A representative subsample was obtained using the quartering method from the material passing through the 2 mm sieve. This subsample was further ground to pass completely through a 0.25 mm sieve for the determination of soil organic matter (SOM). The remaining portion was pulverized to 200-mesh (0.074 mm) using a diamond ball mill, followed by analysis of total iron oxide (TFe2O3), phosphorus (P), selenium (Se), and other elements.
For quality assurance, national first-class standard reference materials (GBW07978, GBW07979, GBW07983, GBW07985, GBW07458, GBW07460) were inserted into pre-assigned blank positions within the sample sequence. Additionally, GBW07460 and GBW07990 were employed as monitoring samples for pH measurement. The precision of each element and parameter, expressed in terms of the relative standard deviation (RSD), was calculated. All analytical results complied with the quality control criteria stipulated in the relevant specifications, confirming the high reliability of the data and their suitability for further interpretation.

2.4. Computer Software and Data Transformation

To reduce the impact of outliers, all data were transformed into normal scores in SPSS (ver. 23), to address their “non-normality” [21]. The correlation coefficients and fit degrees for GWR were determined in ArcGIS 10.7, and the R package lctools was used to perform the significance test (ver. 4.0.5, in http://cran.r-project.org/web/packages/lctools/index.html, accessed on 12 May 2024). Statistical estimates were made using Microsoft Excel (ver. 2016) and SPSS (ver. 23), and the resulting maps were obtained using ArcGIS (ver. 10.7).

3. Spatial Analysis

3.1. Hotspot Analysis

Hotspot analysis is a widely employed method for identifying spatial clustering patterns, such as spatial distribution characteristics [16] and ecological risk assessment [21]. In this study, the Hotspot Analysis tool (Getis-Ord Gi*) in ArcMap 10.7 was utilized to investigate the spatial distribution of Se in both top and deep soil layers, as well as its influencing factors within the study area. This method operates from a local perspective of spatial autocorrelation, calculating the sum of each feature’s value and those of its neighbors, which is then compared against the expected sum under spatial randomness. The output includes a z-score and a p-value for each feature in the dataset. A high z-score coupled with a low p-value signifies a significant hotspot, whereas a low z-score with a low p-value indicates a significant cold spot. The Getis-Ord Gi* statistic is computed as follows:
G i *   =   j = 1 n ω i , j x j X ¯ j = 1 n ω i , j S n j = 1 n ω i , j 2   j = 1 n ω i , j 2 n 1
X ¯ = j = 1 n x j n
S = j = 1 n x j 2 n X ¯ 2
where i represents the center of a local cluster; Xj indicates the attribute value at position j; Wi,j is the spatial weight between features i and j; and n represents the total number of features.

3.2. Geographically Weighted Regression

Geographically Weighted Regression (GWR) is a spatial statistical technique used to explore spatial patterns in data and generate exploratory hypotheses [22]. The spatial patterns reveal influential factors that conventional regression models, such as Ordinary Least Squares (OLS), fail to detect. In contrast to OLS, GWR incorporates local variations in spatial relationships, thereby more effectively capturing spatial non-stationarity and heterogeneity between variables, and generally offering higher predictive accuracy. GWR creates continuous surfaces by generating a unique local statistical model for every location in the study area, rather than applying a single global model. For a target location, GWR identifies all nearby sample points within a specified bandwidth, then weights these points based on proximity: points closer to the target cell have a greater influence on the calculation than those that are farther away. A weighted regression is performed using only these local points, producing a unique equation that relates the dependent variable to the independent variables for that specific cell. This local equation is used to predict the value for that target cell. The process is repeated for every single cell in the output grid.
In this study, the GWR analysis was conducted using ArcMap 10.7. The Se content was set as the dependent variable, while various environmental and geological factors served as independent variables. The relationships between the dependent and independent variables may exhibit distinct regional patterns. GWR is particularly suitable for examining the spatial variability in these relationships, as local regression coefficients are calculated using measurements within the neighborhood of each sample point. This allows for the simultaneous estimation of parameters that are specific to each location, based on both dependent and independent variables. The formula for the GWR model is as follows:
Y i   =   β 0 u i , v i + k = 1 n β k u i , v i x ki + ε i
where Y i represents the dependent variable, which is the soil Se concentration at point i ; u i   and   v i represent the geographic coordinates of point i; β 0 u i , v i is the intercept at point i; β k u i , v i is the regression coefficient of the independent variable k at position i; x k i is the value of the independent variable k at position i; and ε i is the error related to the model at position i.
Through analysis of the spatial patterns, various factors that determine the relationships can be identified; notably, these factors cannot be detected when using conventional regression models, such as OLS, as it is assumed that the relationship studied is a global statistic of linear and spatial constants, such that the same estimated parameters apply to the entire research area.
For the GWR model, the Akaike information criterion (AIC) is commonly used to calculate the bandwidth. This method is used in statistical inference to determine the most appropriate bandwidth for a model by weighing the goodness-of-fit against simplicity [21].
In GWR, the bandwidth signifies the spatial scale at which influencing factors operate. As shown in Table S1, which summarizes the results of OLS and GWR models under different bandwidths, the model with a 50 km bandwidth yielded the lowest AICc value, indicating the best model performance. Although the 2 km bandwidth achieved the highest R2 and Adjusted R2, smaller bandwidths often produce overfitted and less generalizable patterns. In contrast, as the bandwidth increases, the underlying spatial patterns become more evident and stable. Therefore, based on the paramount criterion of AICc, the 50 km bandwidth was selected. Notably, the GWR model with this bandwidth outperforms the OLS model across all metrics—AICc, R2, and Adjusted R2.

4. Results and Discussion

4.1. Spatial Distribution Characteristics of Soil Se

The distribution of Se content in top and deep soils in Fujian Province is presented in Figure 1. The Se concentration in topsoil ranges from 0.01 mg/kg to 2.34 mg/kg, with a mean value of 0.34 mg/kg and a median of 0.30 mg/kg. These values exceed the national averages for topsoil Se in China (mean: 0.26 mg/kg, median: 0.21 mg/kg) as reported by Hou et al. [23]. Similarly, in deep soil, Se concentrations vary between 0.02 mg/kg and 3.10 mg/kg, with a mean of 0.30 mg/kg and a median of 0.27 mg/kg—significantly higher than the corresponding national values (mean: 0.17 mg/kg, median: 0.11 mg/kg).
These results indicate that both top and deep soils in Fujian Province exhibit Se concentrations above the national average. Notably, topsoil shows higher Se content than deep soil, suggesting a distinct enrichment effect of Se in the topsoil layer. The fact that the mean Se values are greater than the medians in both soil layers reflects considerable spatial heterogeneity in the distribution of Se.
According to the “Specification for Land Quality Geochemical Evaluation” (DZ/T 0295-2016), the majority of topsoil in Fujian Province is classified as Se-sufficient (62.8%) or Se-rich (27.1%) (Table 2).

4.2. Soil Se Hotspot Analysis

To accurately characterize the spatial clustering patterns of soil Se and relevant geochemical parameters while minimizing the influence of outliers, hotspot analysis was employed in this study. In contrast to conventional interpolation methods, hotspot analysis enables the examination of spatial clustering characteristics across multiple scales through the use of adjustable bandwidths [24,25]. The selection of an appropriate bandwidth depends on the sampling density of the geochemical survey. It is generally recommended that the bandwidth does not exceed half of the maximum distance between any two sample points [24]. In this study, the topsoil sampling interval was 2 km, therefore the minimum bandwidth was set to 1 km. As the bandwidth increased, the regional features became more distinct, and we further selected bandwidths of 2 km and 10 km. Comparative assessments revealed that the derived cold and hotspots effectively captured the spatial distribution patterns of topsoil Se at various scales. For deep soil, where the sampling interval was 4 km, the minimum bandwidth was set to 2 km. Similarly, the spatial distribution patterns of Se were analyzed at 2 and 10 km bandwidths (Figure 2).
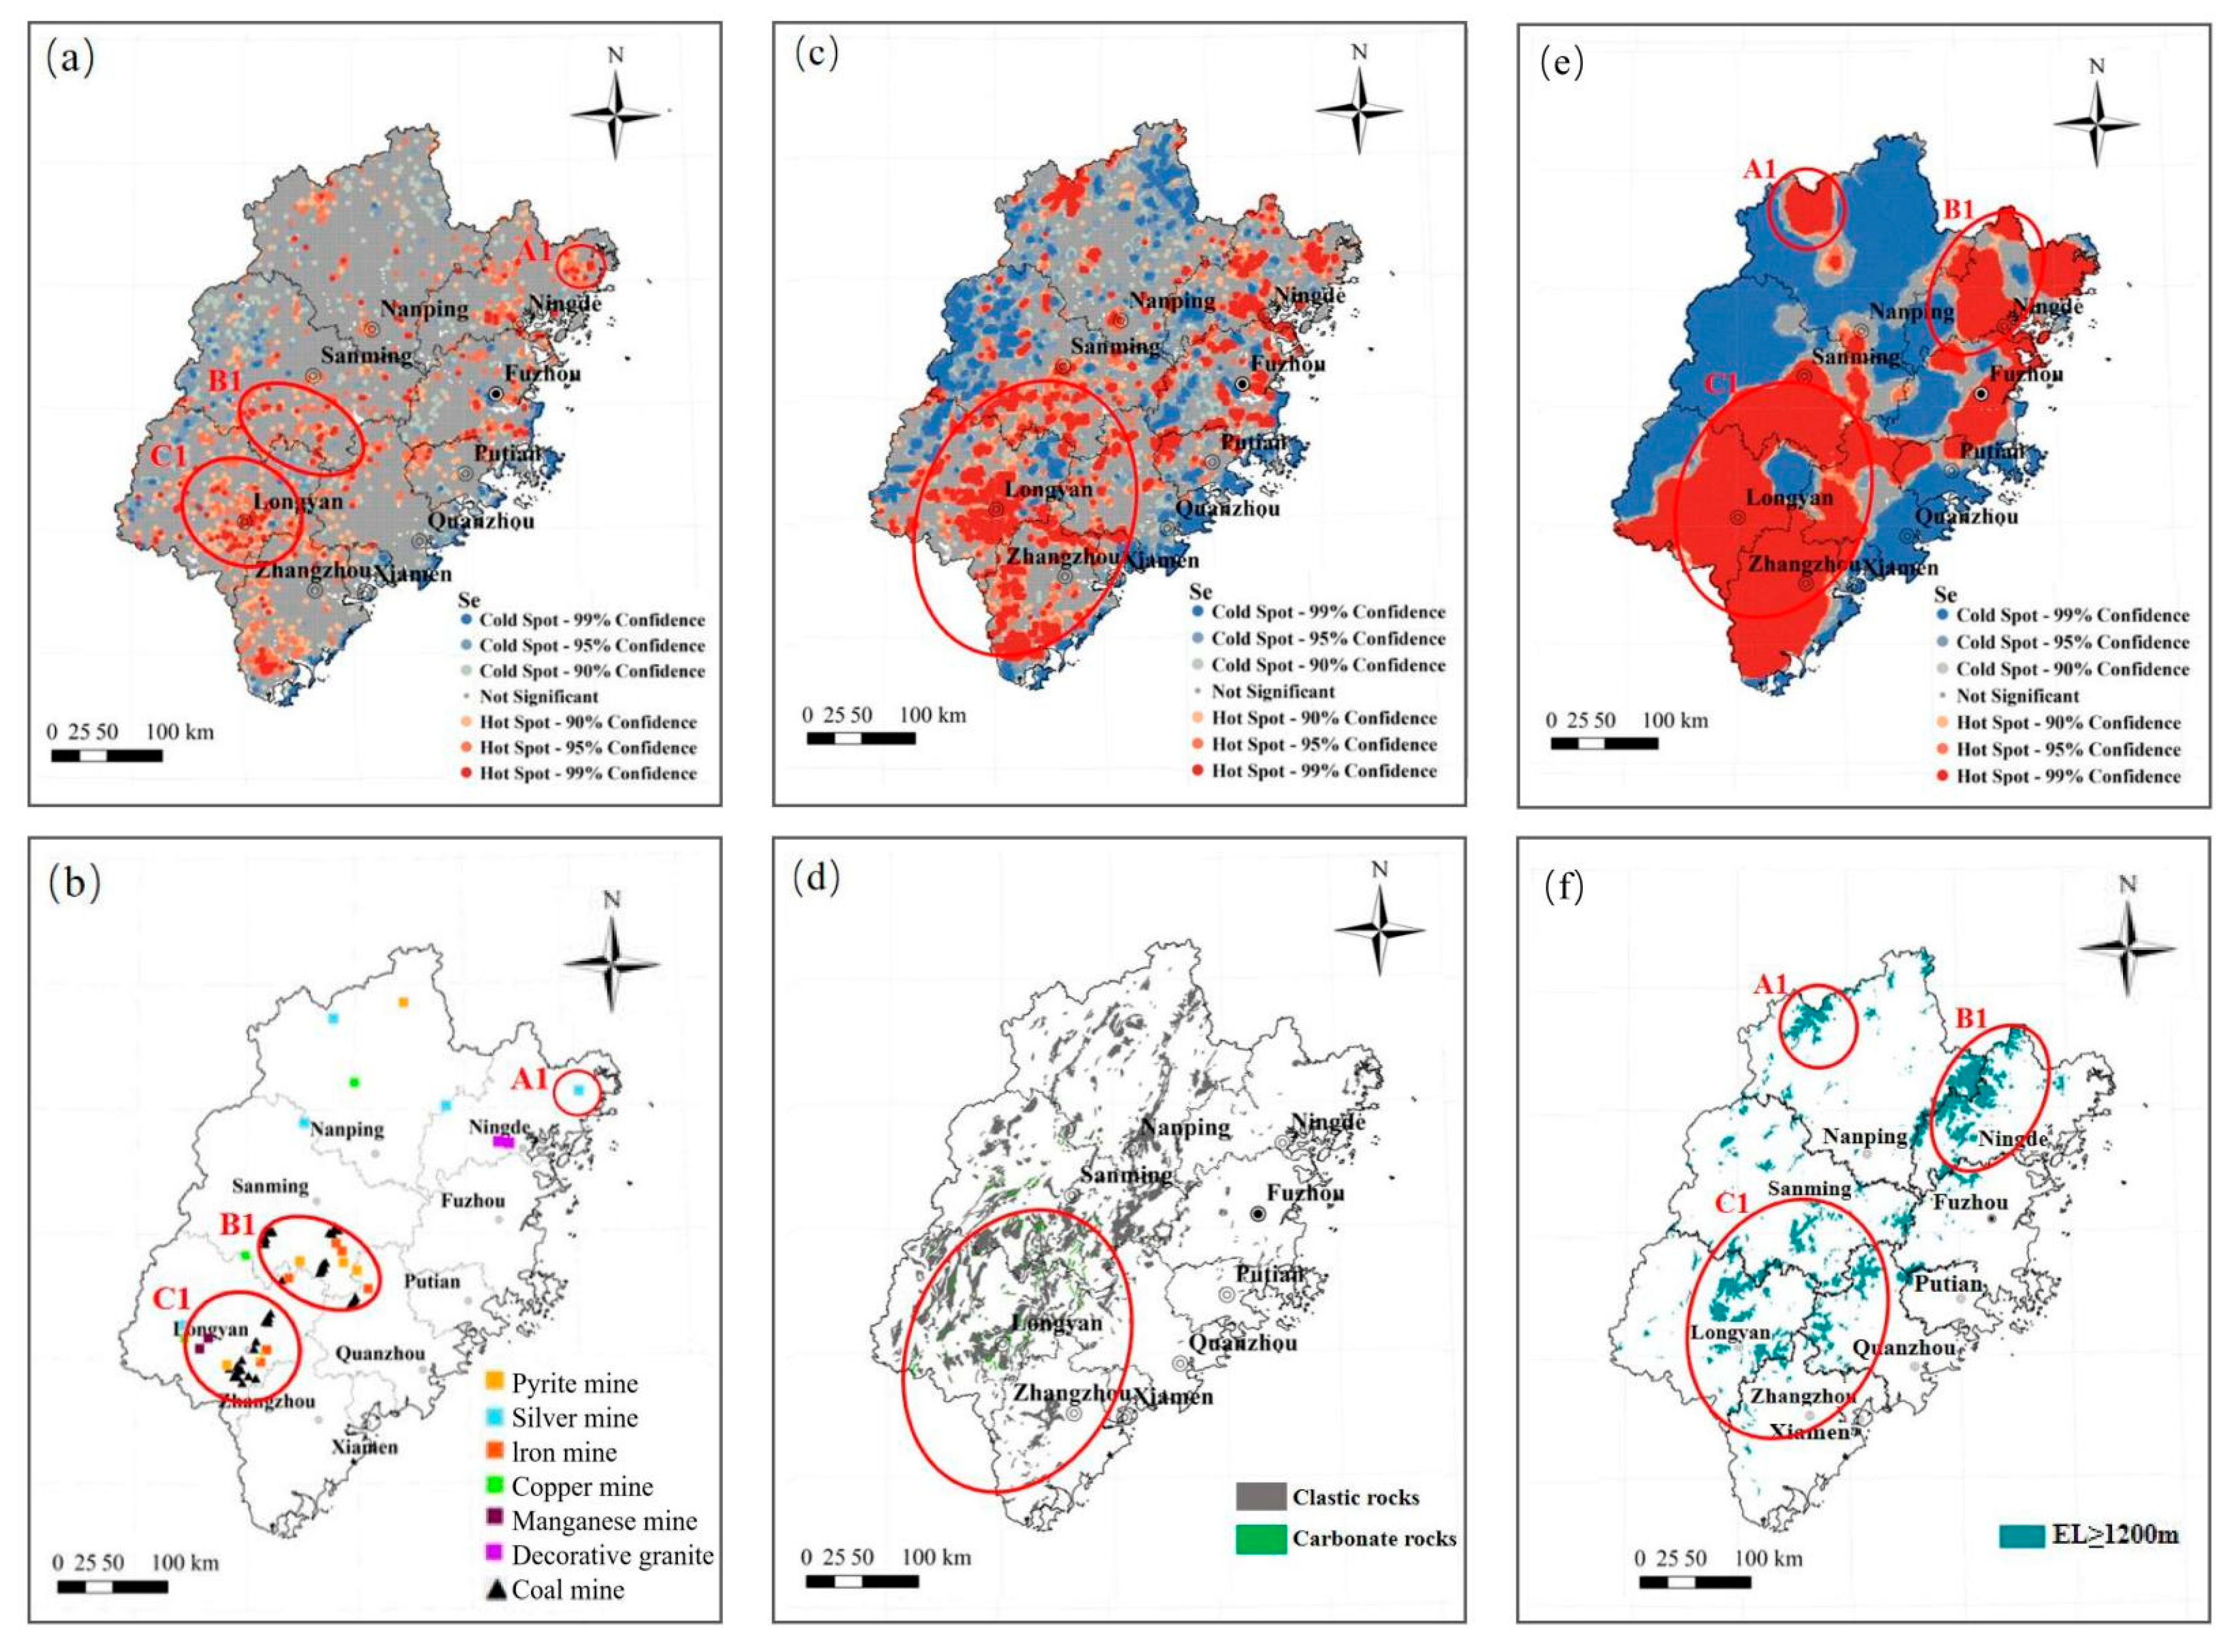
The hotspot map of Se in topsoil at a 1 km bandwidth (Figure 2a) and the mineral distribution map (Figure 2b) indicate that Se hotspots are primarily concentrated in Longyan, southern Sanming, and eastern Ningde. These regions are generally enriched in metal minerals, including sulfur–iron ore, iron ore, manganese ore, copper ore, and coal deposits. Notably, the Se hotspots in Sanming and Longyan show strong spatial overlap with coal mining areas, suggesting that metal minerals and coal deposits may be one of the factors contributing to the exceptionally high Se content in local soils. The environmental fate of Se released from these mining activities is a critical concern, as it can lead to locally excessive Se levels. Se associated with coal and metal sulfides can be mobilized through weathering and runoff. In this way, it can enter aquatic systems where it may bioaccumulate, thus posing risks to aquatic life and potentially entering the human food chain [3].
When the bandwidth increases to 2 km, the spatial pattern of soil Se hotspots (Figure 2c) demonstrates high consistency with the distribution of parent rocks (Figure 2d), particularly carbonate rocks and the Se-rich carbonaceous mudstone of the Wenbimen Formation. As parent rocks represent the primary source of soil Se, the lithological background exerts a major controlling effect on Se distribution. Longyan, Zhangzhou, and southern Sanming are characterized by extensive outcrops of carbonate rocks and carbonaceous mudstone of the Wenbimen Formation, which are recognized as typical high-Se strata in the study area. These rocks are highly susceptible to weathering, facilitating the release of Se into the soil and resulting in a naturally elevated Se background. Previous studies have indicated that the influence of the parent rock on Se content is particularly pronounced in regions with high topsoil Se content. This geological control directly influences human health. Populations living on these high-Se strata are exposed to Se primarily through the consumption of locally grown crops. While Se is an essential micronutrient for antioxidant function and thyroid health, chronic exposure to excessively high levels, a condition known as selenosis, can lead to symptoms including hair loss, nail brittleness, and neurological abnormalities [9]. Therefore, identifying these lithologically derived hotspots is a crucial first step in assessing public health risks.
At a bandwidth of 10 km, the spatial distribution of Se hotspots (Figure 2e) exhibits clear regionalization and a significant correlation with elevation (EL; Figure 2f). In the northern (A1), northeastern (B1), and central-southern (C1) parts of the study area, areas with elevations ≥ 1200 m correspond to distinct Se hotspots. In these high-altitude zones, land use is predominantly forest and grassland, where high inputs of organic matter enhance Se adsorption in soils. Additionally, lower temperatures at higher elevations slow the decomposition of organic matter, further promoting the enrichment of Se in the soil. This biogeochemical cycling at high elevations has dual implications: on one hand, it creates natural reservoirs of Se; on the other hand, the strong retention of Se in organic-rich soils affects its bioavailability to plants [16].
In deep soil layers, Se hotspots are significantly less abundant compared with those in topsoil at 2 km (Figure 3a) and 10 km (Figure 3b) bandwidths. These hotspots exhibit substantial spatial overlap with the distribution of clastic and carbonate rocks (Figure 2d). Furthermore, there is a concentrated distribution of coal mines in the region (Figure 2b), suggesting that the Se content in deep soil might be related to the parent material. This contrast between topsoil and deep soil highlights the dynamic nature of Se’s environmental fate. While the deep soil reflects the primary geogenic source, the enrichment of Se in topsoil is a result of active surface processes such as biological activity, organic matter accumulation, and anthropogenic inputs, which must be considered in any comprehensive risk assessment.
Hotspot analysis helps to visualize the spatial correspondence between soil Se and its potential influencing factors. However, these factors often exhibit overlapping effects. For instance, in the Longyan area, although SOM, pH, EL, and MAP are all potential contributors to soil Se content, the dominant controlling factor remains unclear. Conventional statistical methods are often insufficient to identify the key drivers of local-scale Se distribution [26].

4.3. Soil Se Geographically Weighted Regression

The distribution of soil Se exhibits strong spatial heterogeneity, characterized by significant variability and correlations with various soil properties and key environmental factors. To investigate and elucidate these relationships, we applied GWR. Previous studies have reported significant associations between Se and factors such as organic matter, pH, TFe2O3, MAP, MAT, and EL [27]. In the following sections, we discuss these correlations in detail using the GWR framework.
To assess the potential for multicollinearity among the independent variables, variance inflation factor (VIF) diagnostics were conducted. The results indicated that all VIF values were below 5, which is well under the common threshold of 10 (Table S2). This confirms that multicollinearity is not a significant concern for the subsequent regression analysis.
At the same time, global spatial autocorrelation analysis of soil Se, soil properties and key environmental factors was conducted to detect their spatial aggregation. As shown in Table S3, their global Moran’s I values were in the order: TFe2O3 > MAT > pH > MAP > Se > SOM > EL > 0. The p-values for all influencing factors are less than 0.01, which means that they are significant at the 0.01 significance level.

4.3.1. Soil Se and Organic Matter

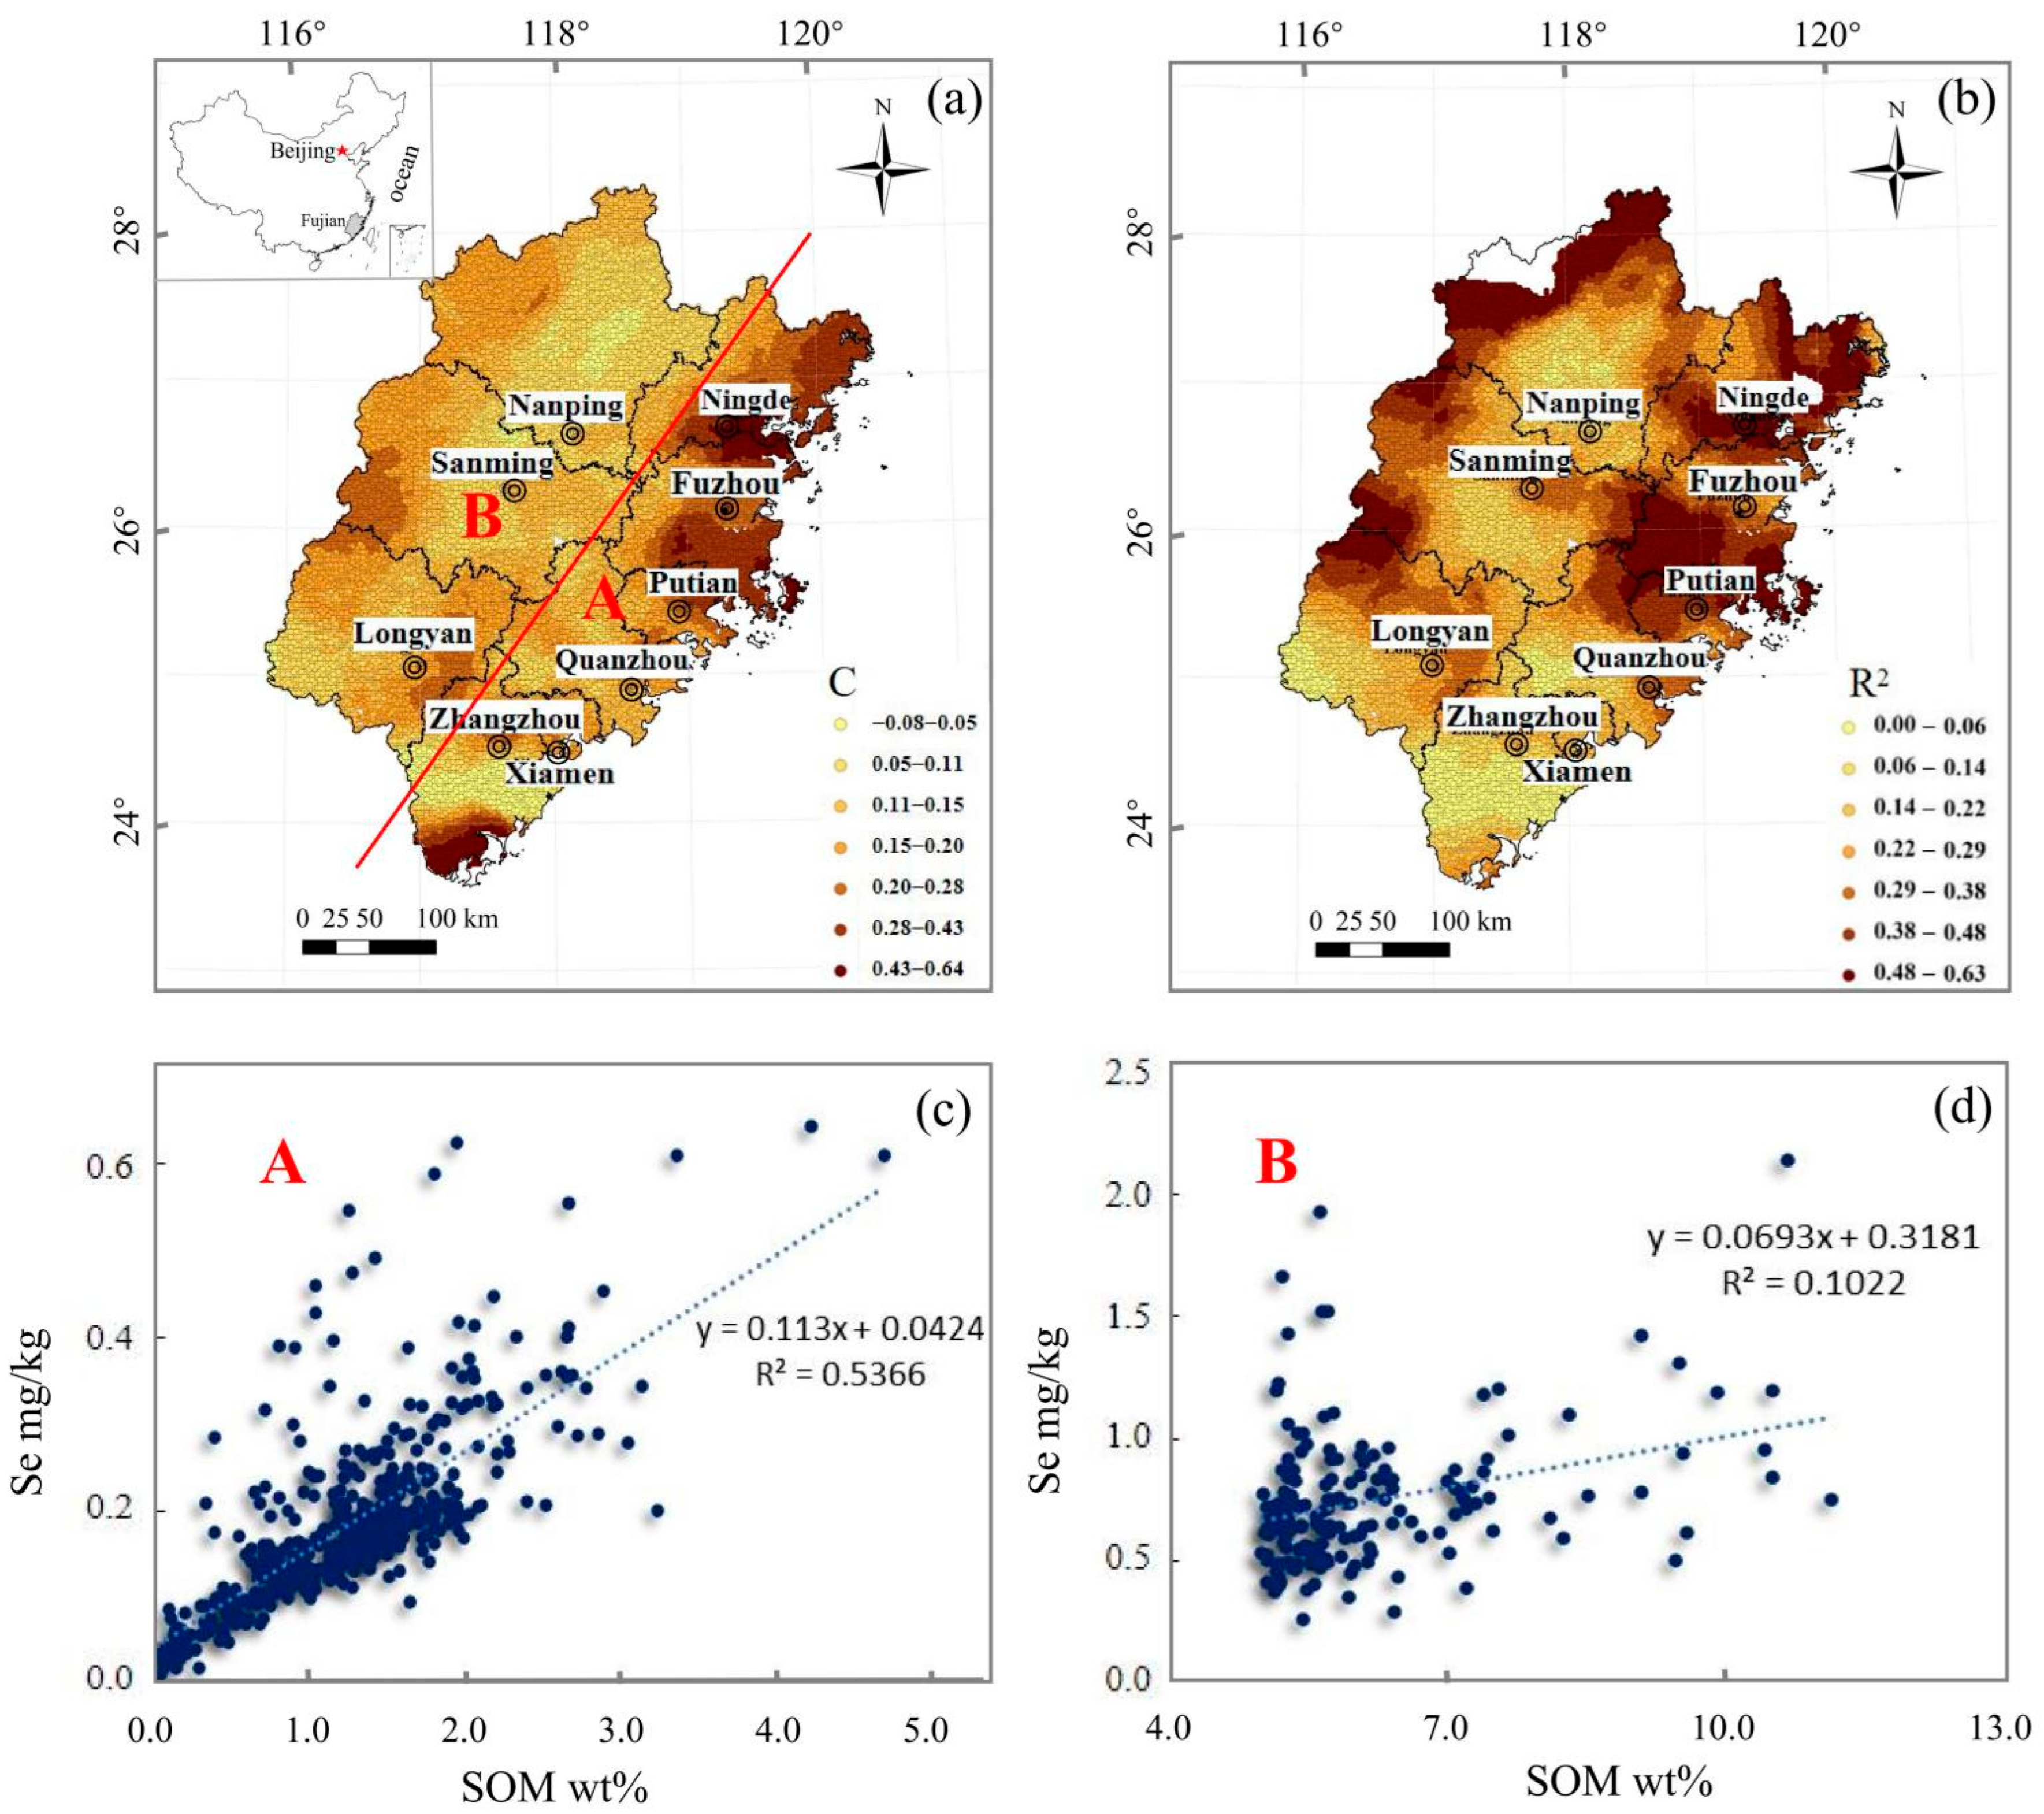
The influence of organic matter on the biogeochemical cycle of Se in soil demonstrates considerable spatial heterogeneity, highlighting the complex interplay between the pedogenic environment, organic matter, and trace elements [28]. Given the distinctive characteristics of coastal ecosystems, this study classified the research area into coastal and non-coastal regions based on a 100 km buffer from the coastline for comparative analysis (Figure 4a).
Pronounced regional differences were observed regarding the regulatory effect of soil organic matter on Se. In the northeastern coastal area, a strong correlation was identified between organic matter and Se (r = 0.73, p < 0.01) (Figure 4c), indicating tight coupling between the two (Figure 4b). In contrast, despite the high organic matter content (SOM > 5%) in non-coastal areas, the correlation with Se remained weak (r = 0.33, p > 0.05) (Figure 4d). These findings are consistent with previous research by Gong et al. [8], who suggested that in regions with elevated levels of both organic matter and Se, such as those dominated by shale and carbonaceous shale, organic matter is not the primary factor controlling soil Se content.
The coastal region exhibits a warm and humid climate, where soils experience intense weathering and contain abundant clay minerals. On one hand, organic matter contributes to the immobilization of Se via adsorption [29]; on the other hand, it can form organo-mineral complexes with clay minerals, substantially enhancing the soil’s capacity for specific adsorption of Se [30]. This synergistic effect creates a stable geochemical barrier that mitigates the lateral transport of Se into adjacent aquatic systems, thereby reducing the loss of Se from the soil. This is consistent with the findings of Clístenes [17]. In the coastal areas of northeastern Brazil, the soil Se content is mainly controlled by organic matter and precipitation.

4.3.2. Soil Se and pH

The GWR results indicate that pH primarily exerts a significant influence on Se content in the eastern coastal regions (Figure 5a), where a strong goodness-of-fit between pH and Se was observed (Figure 5b). This suggests that pH value and Se have a significant correlation in coastal areas [31].
The biogeochemical behavior of Se exhibits a notable negative correlation with soil pH, which can be attributed to the pH-dependent transformation of Se species and their distinct environmental behaviors [32,33]. Under alkaline conditions and high redox potential (Eh), selenate (Se(VI)) becomes the dominant species. Due to its high solubility and low adsorption affinity, Se(VI) is highly mobile, resulting in reduced Se retention in the soil [34,35,36]. This mobility poses a dual risk: it can lead to leaching into groundwater, and it also makes selenate highly bioavailable to plants. In contaminated areas, this can lead to toxic accumulation in crops; however, in coastal areas with already low total Se, it can lead to deficiency as Se is not retained in the root zone [29]. In contrast, under acidic and low-Eh conditions, selenite (Se(IV)) predominates, which tends to be immobilized through adsorption onto clay minerals, iron oxides, and organic matter. This leads to a more complex process of Se distribution involving multiple factors [37]. While this immobilization reduces leaching, Se becomes less bioavailable to plants, which can again result in a disparity between total soil Se and the amount entering the food chain.
Soils in the coastal areas of Fujian are slightly alkaline as a result of marine influence, favoring the formation of mobile selenate. Combined with intense leaching processes, this contributes to the relatively low Se content in these regions. The data further revealed a strong negative correlation (r = −0.68, p < 0.01) between pH and Se in strongly alkaline soils (pH > 8.5) (Figure 5c), whereas the correlation was weak (r = −0.05, p > 0.05) in acidic soils (pH < 4.5) (Figure 5d), highlighting variations in Se retention mechanisms across different pH ranges.

4.3.3. Soil Se and TFe2O3

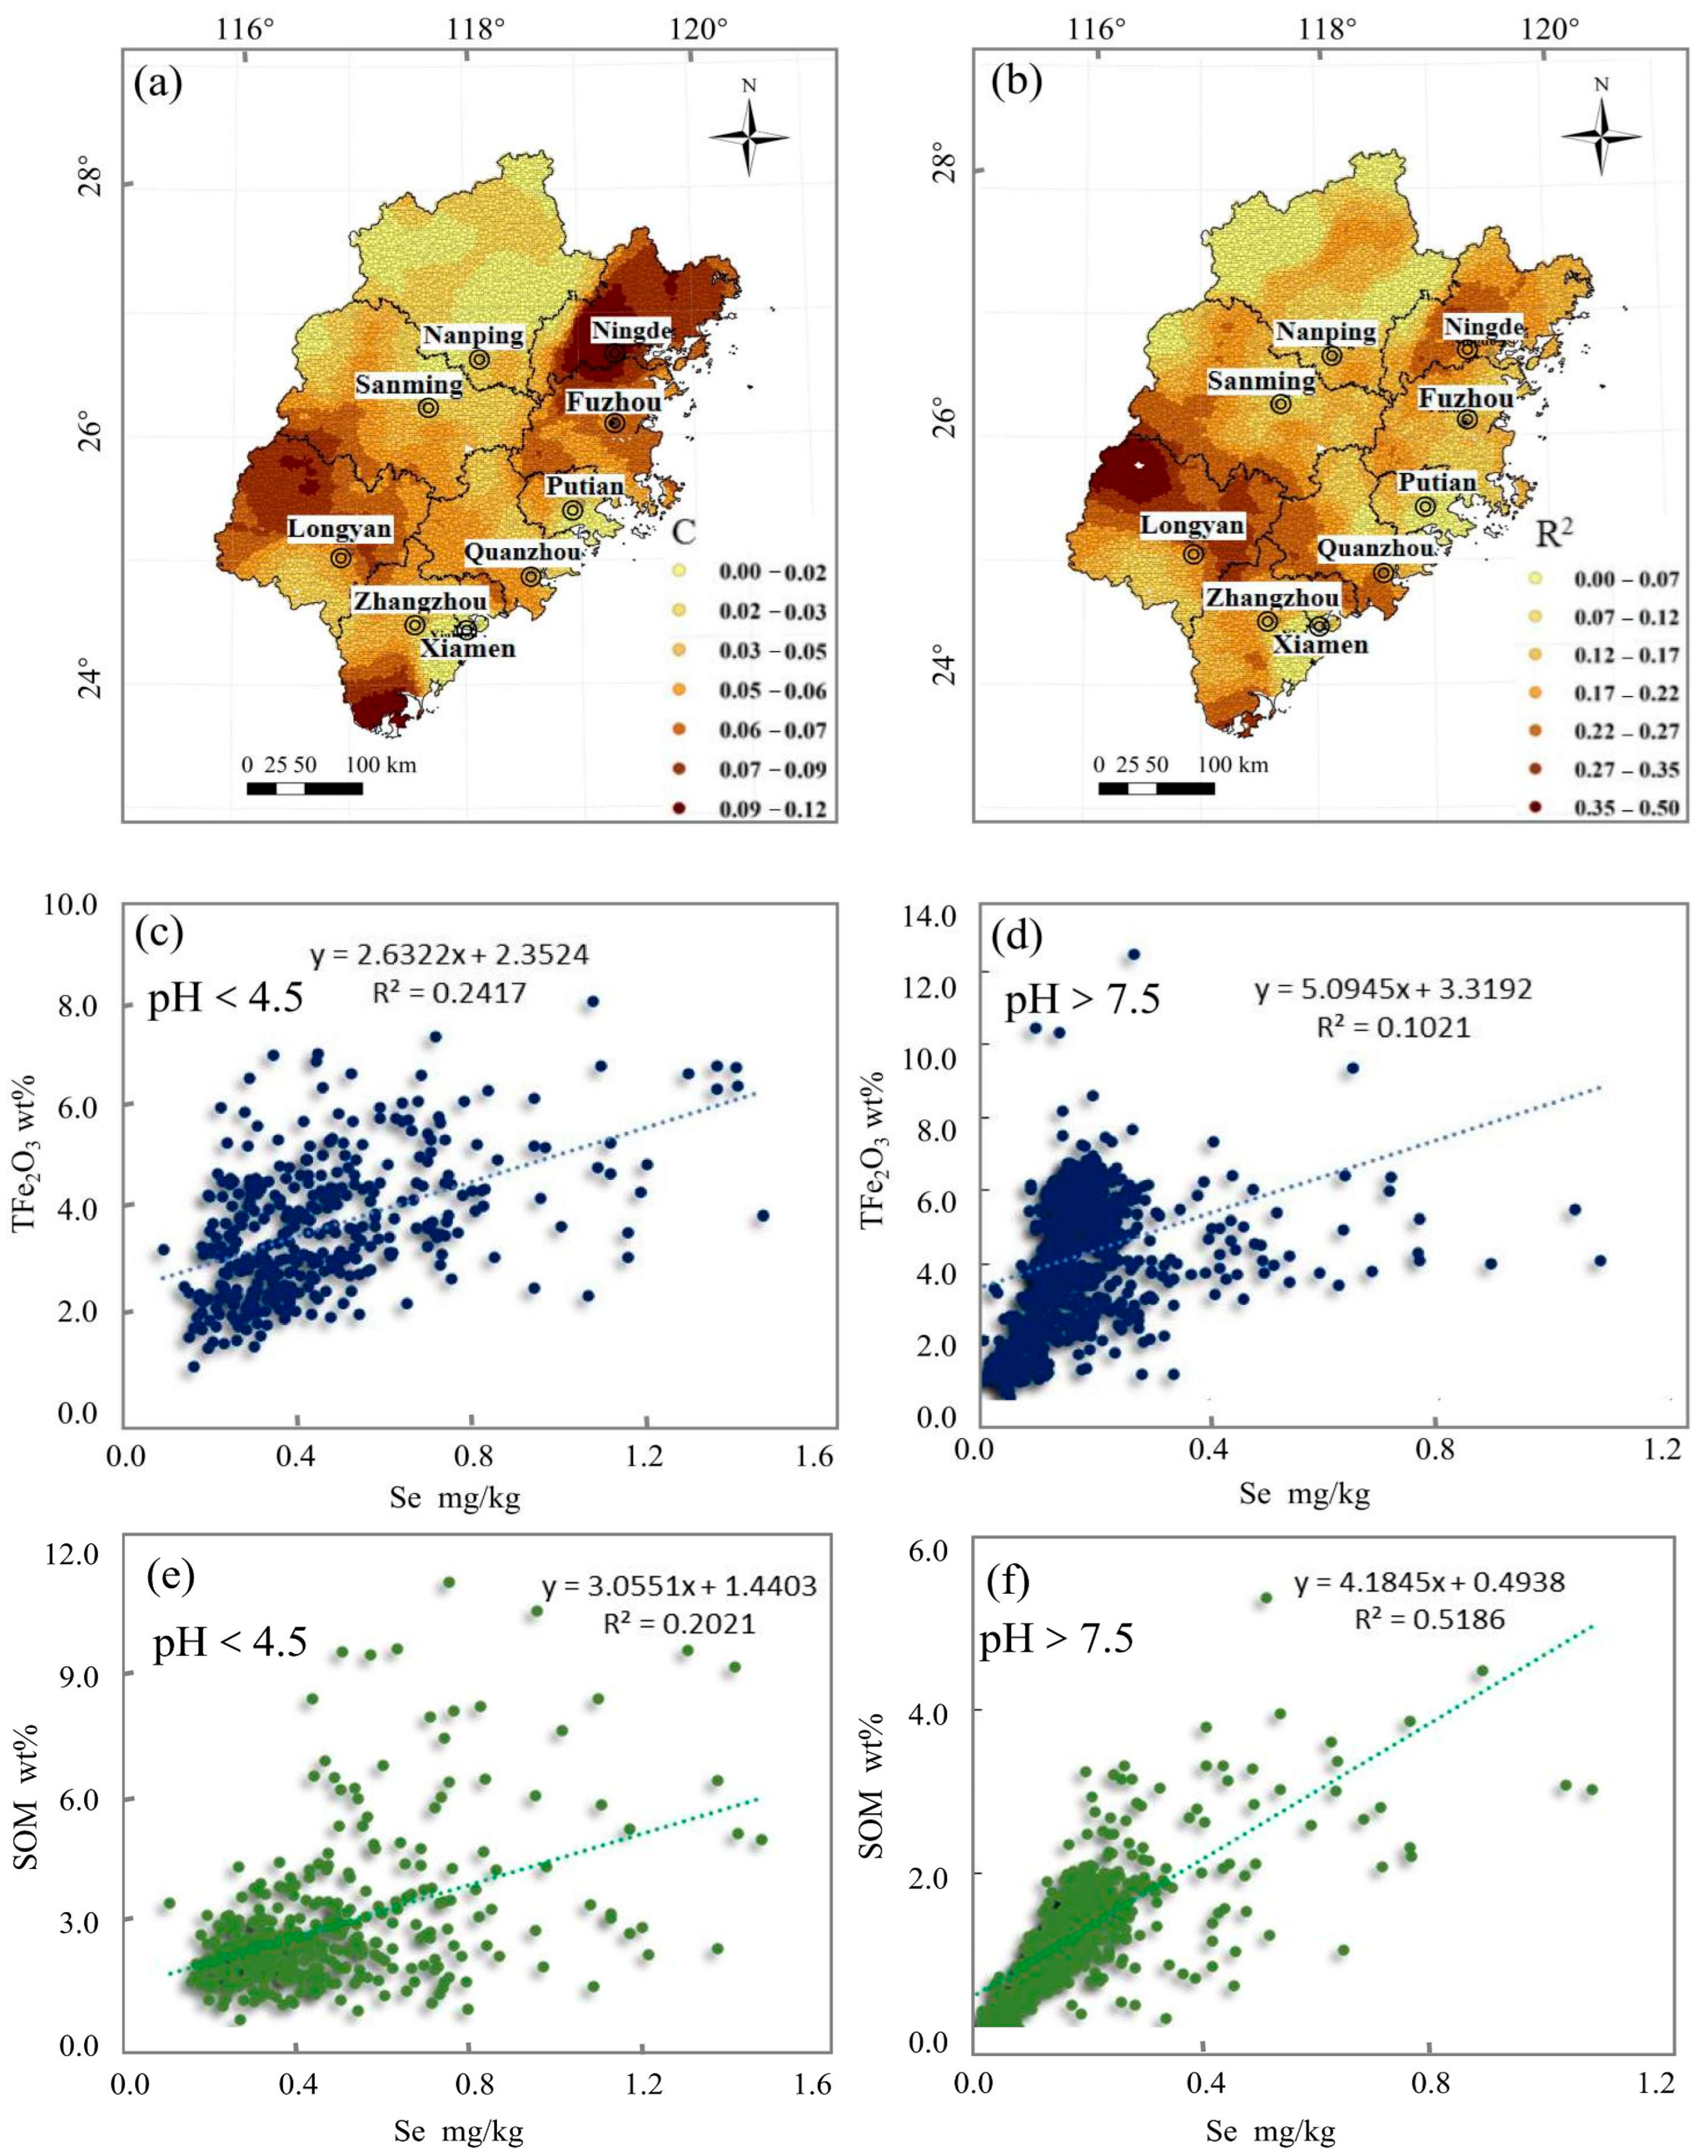
The correlation between TFe2O3 and Se exhibits notable spatial heterogeneity, with the most pronounced association observed in the Ningde and northern Longyan regions (Figure 6a,b). The mechanism behind this regional disparity may be attributed to the unique geochemical conditions in these areas: on one hand, soils in these regions generally exhibit lower pH values (mostly < 5.5), which facilitates the adsorption of Se onto iron oxides; on the other hand, the extreme scarcity of Al2O3 (<5%) prevents the formation of Se–aluminum complexes, thereby promoting Se fixation by iron oxides [38]. This observation aligns with previous findings that, in acidic and oxidizing environments, hydroxyl groups on the surface of iron oxides form stable inner-sphere complexes with SeO32−, presenting binding energies substantially higher than those between Se and organic matter [39].
From a soil pH perspective, the interaction between TFe2O3 and Se demonstrates clear acid–base dependency (Figure 6c,d). In acidic environments (pH < 6.5), increased protonation of iron oxide surfaces significantly enhances their specific adsorption capacity for Se (r = 0.50, p < 0.01). This strong adsorption competition results in a relatively weakened Se fixation effect by soil organic matter (SOM) (r = 0.45, p > 0.05) (Figure 6e). Molecular-scale studies have revealed that under acidic conditions, ≡FeOH2+ groups on iron oxide surfaces form stable ≡FeOSeO2 complexes with SeO32−, exhibiting binding strengths 2–3 orders of magnitude greater than those of Se–organic complexes [40]. In contrast, under alkaline conditions (pH > 7.5), deprotonation of iron oxide surfaces reduces the number of available adsorption sites, leading to a notable decline in Se fixation capacity (r = 0.32, p > 0.05). Under such conditions, organic matter becomes the primary carrier of Se via coordination and physical adsorption (r = 0.72, p < 0.01) (Figure 6f). This pH-dependent adsorption transition mechanism not only elucidates the regional differences in Se distribution patterns but also provides a theoretical basis for predicting the bioavailability of Se under varying environmental conditions [33]. Particularly in ecological risk assessments of Se, the interaction between soil pH and iron oxide content warrants special consideration.

4.3.4. Soil Se and Environmental Factors

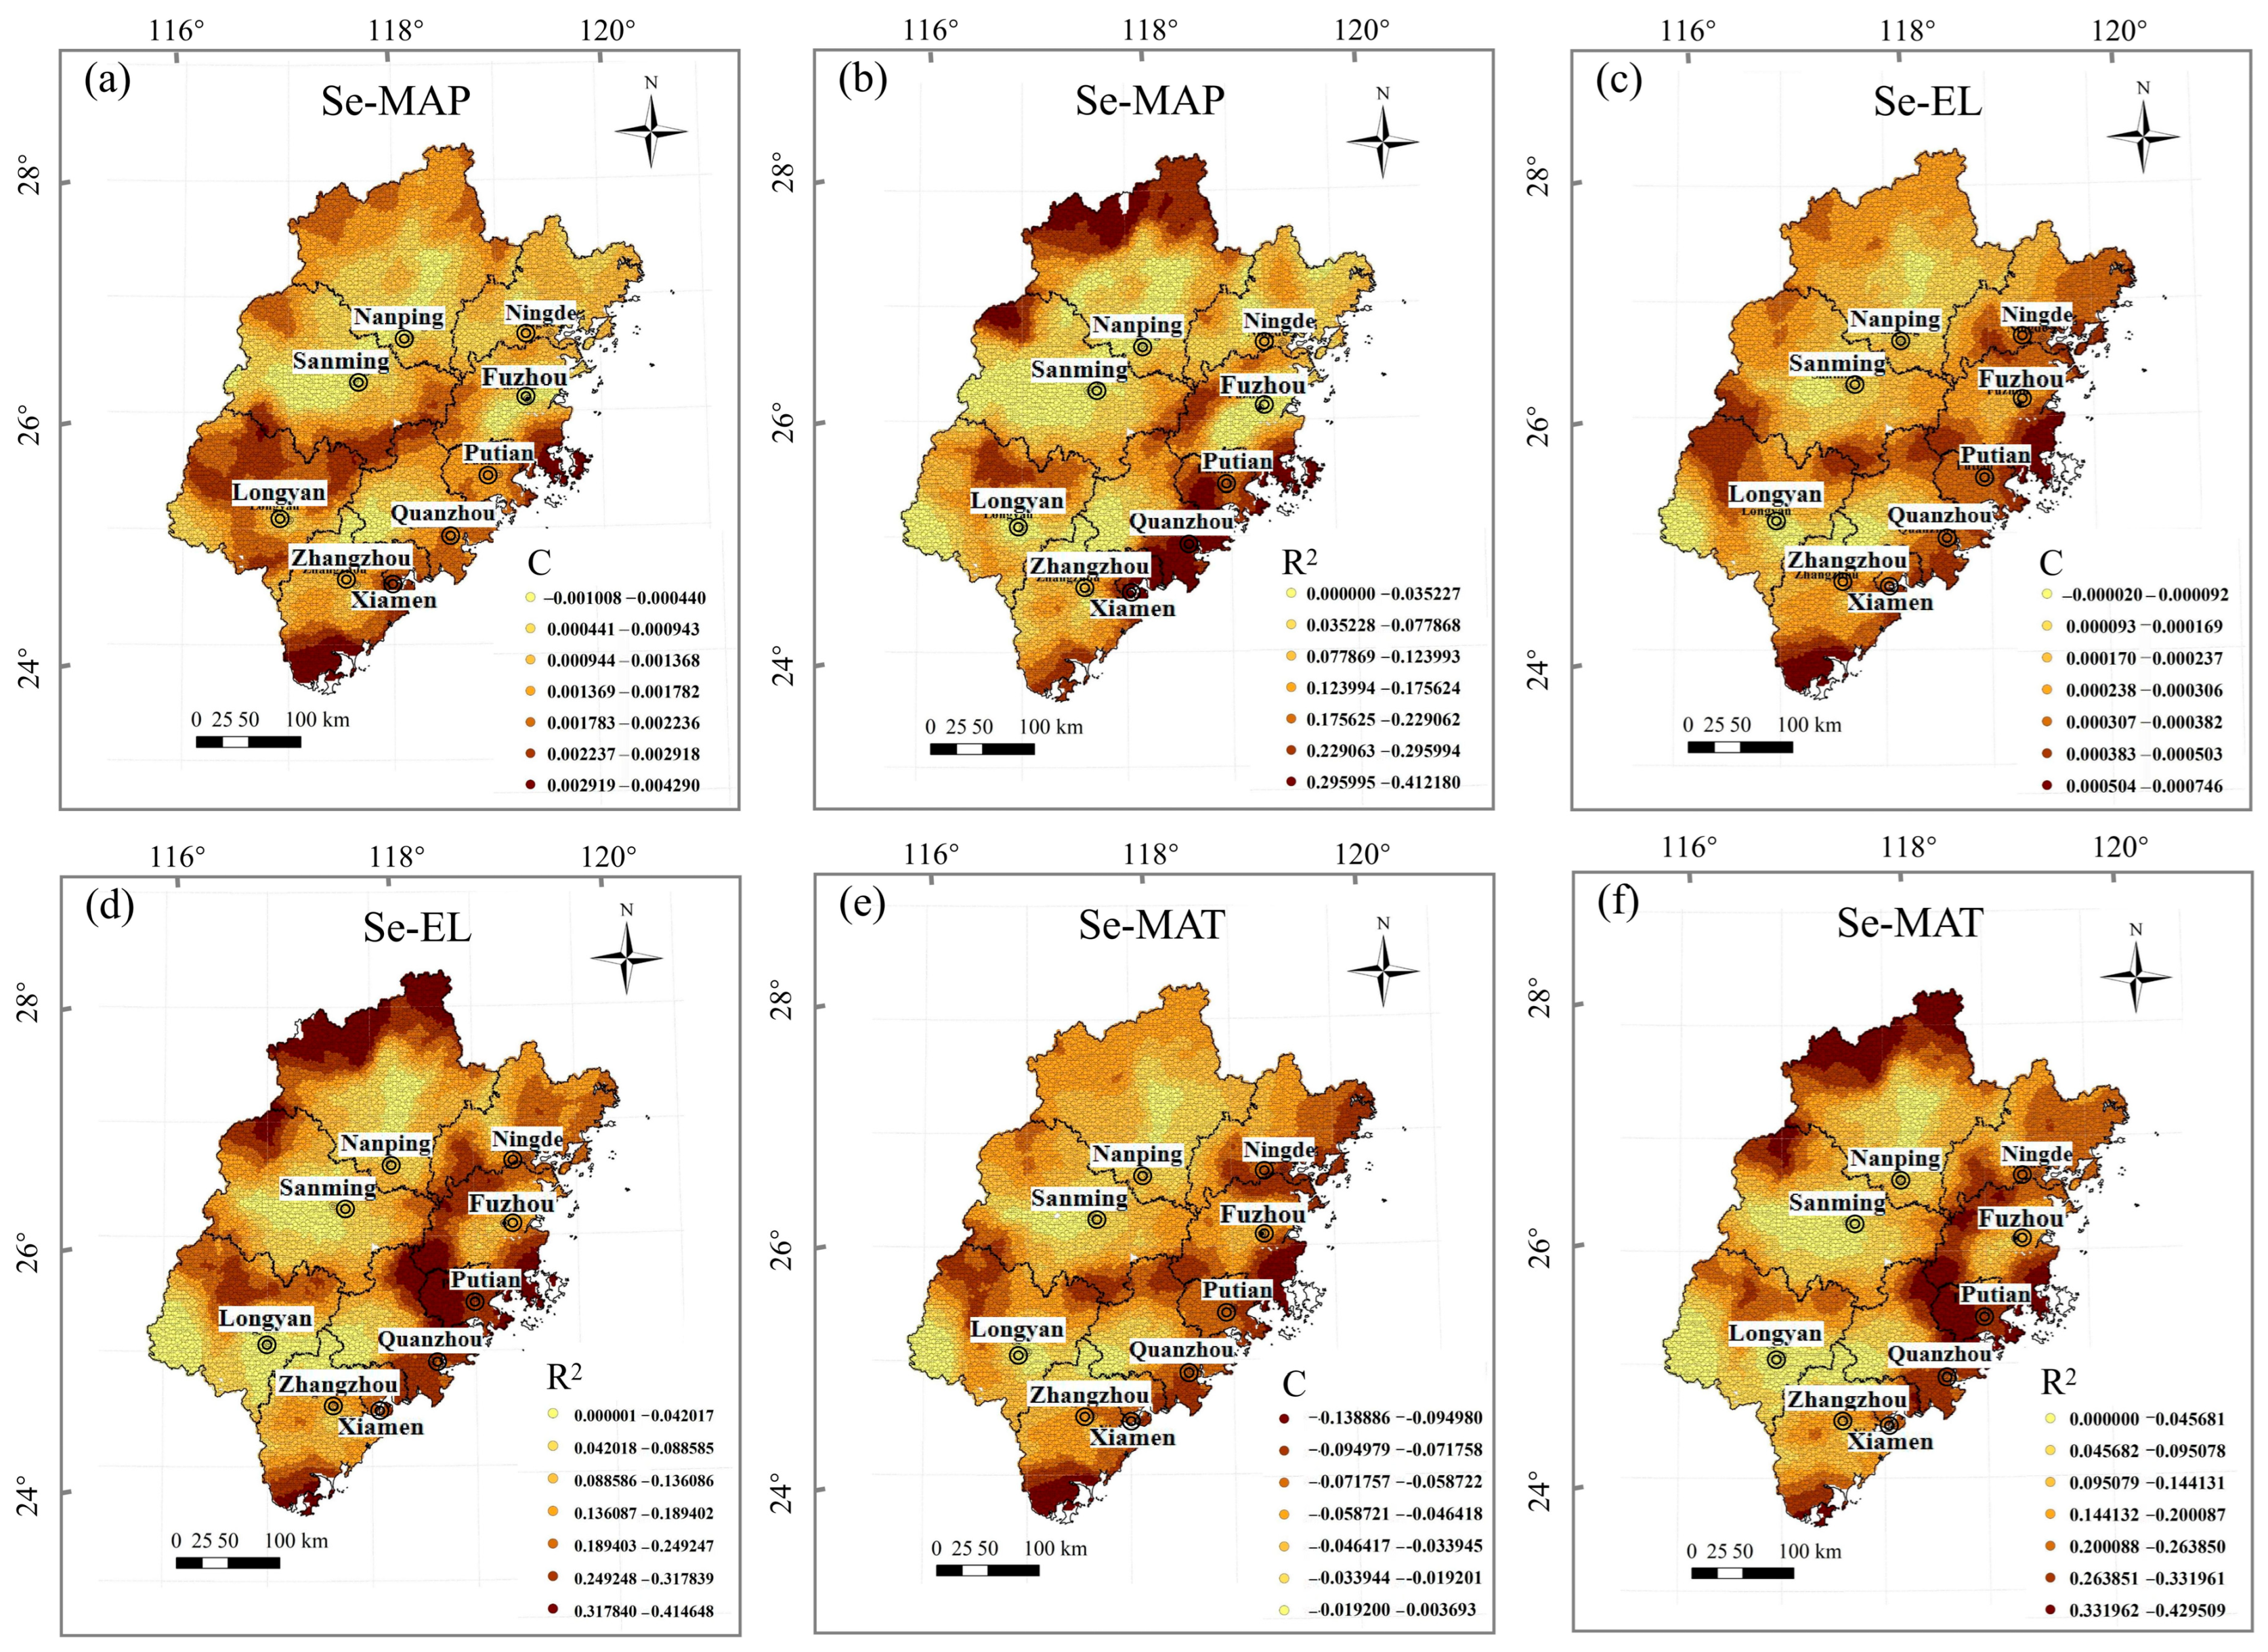
Previous studies have shown that MAP, MAT, and EL are key environmental factors influencing soil Se content [7,26]. The GWR results revealed strong spatial consistency in the effects of these factors, with the greatest influence observed in the central and southeastern coastal regions of the study area. However, a high goodness-of-fit was evident only in the southeast and northwest, indicating pronounced spatial correlation in these regions (Figure 7).
MAP plays a critical role in both the direct and indirect regulation of soil Se. The GWR analysis indicates that the correlation between precipitation and Se is most significant in the central and southeastern coastal areas (Figure 7a,b), reflecting regional differences in atmospheric deposition and geochemical processes [41]. Directly, precipitation introduces Se via atmospheric deposition, particularly in the coastal zones, where marine-derived volatile Se compounds (e.g., dimethyl selenide) are transported and deposited, constituting a major Se source [17]. Studies have reported that precipitation accounts for over 80% of total Se input in soils, with higher deposition fluxes in coastal areas due to marine contributions. Indirectly, precipitation affects the retention of Se by modulating the soil’s pH and SOM content. High rainfall enhances leaching, leading to soil acidification which promotes the adsorption of Se onto iron oxides, thereby increasing Se retention. Additionally, precipitation-driven SOM accumulation (e.g., from forest litter decomposition) can enhance Se complexation, although this effect may be attenuated in high-temperature regions, thus further contributing to spatial heterogeneity [42].
Elevation indirectly shapes the Se distribution through local hydro-thermal conditions. Its effects were found to differ notably between the northwestern high-altitude zone and the southeastern coastal lowlands (Figure 7c,d). The GWR results indicated a high goodness-of-fit for EL and Se in both regions, although through distinct mechanisms: in the northwest, maybe cooler temperatures and higher precipitation slow SOM decomposition and promote Se accumulation in organic-rich layers, while enhanced physical weathering may facilitate the release of mineral-bound Se [43]. In the southeastern coastal lowlands, high temperature and humidity enhance leaching, although marine-derived inputs and iron oxide adsorption help to maintain relatively high Se levels. Importantly, environmental factors interact synergistically: in the southeast, high MAT and MAP jointly intensify weathering and erosion, while EL further modifies the microclimatic conditions, collectively regulating the speciation and distribution of Se. These multi-factor interactions result in nonlinear spatial patterns that cannot be captured by single variables, highlighting the value of spatial analysis methods such as GWR in elucidating dominant controlling factors.
The temperature increases gradually from northwest to southeast across the study area. The GWR results indicated the strongest MAT–Se relationship in the southeastern coastal zone, although this association exhibited complex nonlinearity (Figure 7e,f). High temperatures can facilitate the incorporation of Se into sulfide minerals (e.g., via isomorphic substitution of S2− by Se2− in pyrite), promoting Se enrichment under elevated temperatures [44]. Conversely, higher temperatures also accelerate SOM decomposition, reducing organic-mediated Se adsorption. Consistent with this, southeastern regions with higher temperatures exhibit lower SOM content and a positive correlation between SOM and Se, suggesting that organic matter degradation may lead to the release of Se. These patterns align with the rapid organic turnover and active Se cycling in warm–humid climates, underscoring the need to evaluate the effects of temperature in conjunction with precipitation and redox conditions [45].
In cold-temperate, high-precipitation coastal regions such as Norway and southern Chile, low temperatures and abundant rainfall promote organic matter accumulation, which helps retain selenium. However, intense leaching dominates the net selenium loss, leading to generally low background levels of total selenium in soils. In contrast, across arid and semi-arid coastal zones like California and Peru, low rainfall and high evaporation drive selenium to migrate upward through capillary action and accumulate in surface layers. This often results in selenium-rich but alkaline soils with a high risk of biological toxicity. In Mediterranean-type coastal areas—including the Mediterranean Basin and parts of California—selenium dynamics follow a distinct seasonal rhythm: winter rains replenish selenium inputs but also promote leaching, while summer droughts favor surface retention and concentration. Collectively, these patterns demonstrate that climate regulates the balance among marine input, leaching, adsorption, and biological cycling, thereby shaping the spatial distribution and ecological risks of selenium across global coastal soils.

5. Conclusions

This study clarified the hierarchical factors controlling the soil Se distribution in southeastern China. The primary driver is the lithological background, with Se hotspots in topsoil and deep soil strongly aligned with Se-rich parent rocks, such as carbonaceous mudstone of the Wenbinen Formation.
Beyond this geogenic source, local environmental factors exert secondary, spatially heterogeneous controlling effects. The influence of soil organic matter is highly regional, showing a strong correlation with Se in the northeastern coast (r = 0.73) but a weak one elsewhere. Soil pH is a dominant factor in eastern coastal areas, where alkaline conditions (pH > 8.5) promote the formation of mobile selenate and intense leaching (r = −0.68). Iron oxides are the key controlling factors in Ningde and northern Longyan, especially in acidic soils, where they effectively immobilize Se.
The spatial analysis results confirmed that precipitation, temperature, and elevation exert the strongest influences in the central and southeastern coast regions. These findings provide a quantitative, spatially explicit foundation for managing Se-rich land resources and assessing the bioavailability of selenium and the associated health risks.
The analysis in this study used only total Se content, not its bioavailable form, which is crucial for assessing bioavailability and health risks. At the same time, important variables like human activity and soil microbiology were not included. Future studies should integrate Se speciation analysis with microbial community profiling to clarify bioavailability and biogeochemical pathways. Expanding systematic sampling to all land use types and parent materials across seasonal cycles would provide a more comprehensive understanding of the Se cycle, enabling accurate predictions of its behavior under changing environmental conditions and land management practices.

Supplementary Materials

The following supporting information can be downloaded at: https://www.mdpi.com/article/10.3390/agronomy15112560/s1, Figure S1. Map of MAT (a), MAP (b), EL (c) and mineral distribution (d) in Fujian Province. Table S1. The performance statistics of different bandwidths for GWR and OLS results. Table S2. Result of multicollinearity test. Table S3. Global autocorrelation degree of soil Se and influencing factors.

Author Contributions

Conceptualization, Y.W.; methodology, J.C.; Software, J.C.; validation, J.L. (Jiufen Liu); formal analysis, Y.W. and Z.Y.; investigation, Y.W. and X.Z.; resources, Y.W.; data curation, Y.W.; writing—original draft preparation, Y.W.; writing—review and editing, Y.W. and Z.Y.; visualization, X.L.; supervision, Z.L.; supervision, J.L. (Jia Liu); funding acquisition, J.L. (Jiufen Liu). All authors have read and agreed to the published version of the manuscript.

Funding

Supported by Science and Technology Innovation Foundation of Survey Center of Comprehensive Natural Resources (KC20250001); the project of Experiment Testing Technology Support and Services for Gold Ore and Other Strategic Mineral (DD20240206308); National Technical Support and Services for Gold and Other Strategic Mineral Analysis (DD202502091); Experimental Tests Support key technologies and quality control (DD20250209101); National Key Research and Development Program of China “Precise Identification and Early Warning of Black Soil Degradation” (2024YFD1500906); Young elite scientist sponsorship program by cast (NO.YESS20240578).

Data Availability Statement

The data presented in this study are available on request from the corresponding author due to confidentiality.

Acknowledgments

The authors are grateful for these assistants of the editors and anonymous reviewers for their critical reviews and constructive comments.

Conflicts of Interest

The authors declare no conflicts of interest.

References

  1. Hilal, T.; Killam, B.; Grozdanović, M.; Dobosz-Bartoszek, M.; Loerke, J.; Bürger, J.; Mielke, T.; Copeland, P.R.; Simonovi, M.; Spahn, C.M.T. Structure of the mammalian ribosome as it decodes the selenocysteine UGA codon. Science 2022, 376, 1338–1343. [Google Scholar] [CrossRef]
  2. Różewicz, M.; Bartosiewicz, B. Circulation of Selenium in the Environment. Environ. Prot. Nat. Resour. 2021, 32, 8–16. [Google Scholar] [CrossRef]
  3. Tan, J.; Zhu, W.; Wang, W.; Li, R.; Hou, S.; Wang, D.; Yang, L. Selenium in soil and endemic diseases in China. Sci. Total Environ. 2002, 284, 227–235. [Google Scholar] [CrossRef]
  4. Stone, R. A Medical Mystery in Middle China. Science 2009, 324, 1378–1381. [Google Scholar] [CrossRef] [PubMed]
  5. Kieliszek, M.; Błażejak, S. Selenium: Significance, and outlook for supplementation. Nutrition 2013, 29, 713–718. [Google Scholar] [CrossRef] [PubMed]
  6. Fordyce, F. Selenium geochemistry and health. Ambio 2007, 36, 94–97. [Google Scholar] [CrossRef]
  7. Wang, Y.; Liu, J.; Yang, Z.; Liu, X.; Li, Z.; Zhao, X.; Wang, F.; Wang, C.; Liu, J. Selenium content characteristics of surface soil and rice seed in Fujian province and prediction of selenium-enriched production areas. Rock Miner. Anal. 2025, 44, 1–11. [Google Scholar]
  8. Gong, J.; Yang, J.; Wu, H.; Fu, Y.; Gao, J.; Tang, S.; Ma, S. Distribution of soil selenium and its relationship with parent rocks in Chengmai County, Hainan Island, China. Appl. Geochem. 2022, 136, 105147. [Google Scholar] [CrossRef]
  9. Li, M.; Yang, B.; Xu, K.; Zheng, D.; Tian, J. Distribution of Se in the rocks, soil, water and crops in Enshi County, China. Appl. Geochem. 2020, 122, 104707. [Google Scholar] [CrossRef]
  10. Jones, G.; Winkel, L. Multi-scale factors and processes controlling selenium distributions in soils. In Selenium in Plants: Molecular, Physiological, Ecological and Evolutionary Aspects; Springer International Publishing: Cham, Switzerland, 2017; pp. 3–20. [Google Scholar]
  11. Winkel, L.; Johnson, C.; Lenz, M.; Grundl, T.; Leupin, O.; Amin, M.; Charlet, L. Environmental selenium research: From microscopic processes to global understanding. Environ. Sci. Technol. 2012, 46, 571–579. [Google Scholar] [CrossRef]
  12. Stiles, C.; Mora, C.; Driese, S. Pedogenic iron-manganese nodules in Vertisols: A new proxy for paleoprecipitation? Geology 2001, 29, 943–946. [Google Scholar] [CrossRef]
  13. Kovács, J.; Farics, É.; Szabó, P.; Sajó, I. Fe-Al phosphate microcrystals in pedogenic goethite pisoliths. Minerals 2020, 10, 357. [Google Scholar] [CrossRef]
  14. Kirsten, M.; Mikutta, R.; Vogel, C.; Thompson, A.; Mueller, C.; Kimaro, D.; Bergsm, H.; Feger, K.; Kalbitz, K. Iron oxides and aluminous clays selectively control soil carbon storage and stability in the humid tropics. Sci. Rep. 2021, 11, 5076. [Google Scholar]
  15. Porras, R.; Hicks Pries, C.; McFarlane, K.; Hanson, P.; Torn, M. Association with pedogenic iron and aluminum: Effects on soil organic carbon storage and stability in four temperate forest soils. Biogeochemistry 2017, 133, 333–345. [Google Scholar] [CrossRef]
  16. Xu, Y.; Li, Y.; Li, H.; Wang, L.; Liao, X.; Wang, J.; Chang, K. Effects of topography and soil properties on soil selenium distribution and bioavailability (phosphate extraction): A case study in Yongjia County, China. Sci. Total Environ. 2018, 633, 240–248. [Google Scholar] [CrossRef] [PubMed]
  17. Clístenes, W.; Fernando, B.; Adelazil, B.; Biondi, C.; Lins, S.; Agenor, B. Geopedology-climate interactions govern the spatial distribution of selenium in soils: A case study in northeastern Brazil. Geoderma 2021, 399, 115119. [Google Scholar] [CrossRef]
  18. Shand, C.; Eriksson, J.; Dahlin, A.; Lumsdon, D. Selenium concentrations in national inventory soils from Scotland and Sweden and their relationship with geochemical factors. J. Geochem. Explor. 2012, 121, 4–14. [Google Scholar] [CrossRef]
  19. DZ/T 0258-2014; Specification of Multi-Purpose Regional Geochemical Survey (1:250000). Standards Press of China: Beijing, China, 2014.
  20. DZ/T 0295-2016; Specification of Land Quality Geochemical Assessment. Standards Press of China: Beijing, China, 2016.
  21. Li, B.; Liu, X.; Zhang, C.; Zhang, C.; Yu, T.; Wu, T.; Zhuo, X.; Li, C.; Wang, L.; Lin, K.; et al. Spatially varying relationships of soil Se concentration and rice Se concentration in Guangxi, China: A geographically weighted regression approach. Chemosphere 2023, 343, 140241. [Google Scholar] [CrossRef]
  22. Lu, Y.; Zhao, M.; Wang, L.; Rishe, N. v-TerraFly: Large scale distributed spatial data visualization with autonomic resource management. J. Big Data 2014, 1, 4. [Google Scholar] [CrossRef]
  23. Hou, Q.; Yang, Z.; Yu, T.; Xia, X.; Cheng, H.; Zhou, G. Geochemical Parameters of Soils in China; Geological Publishing House: Beijing, China, 2020. [Google Scholar]
  24. Zhang, C.; Luo, L.; Xu, W.; Ledwith, V. Use of local Moran’s I and GIS to identify pollution hotspots of Pb in urban soils of Galway, Ireland. Sci. Total Environ. 2008, 398, 212–221. [Google Scholar] [CrossRef]
  25. Xu, H.; Croot, P.; Zhang, C. Discovering hidden spatial patterns and their associations with controlling factors for potentially toxic elements in topsoil using hot spot analysis and K-means clustering analysis. Environ. Int. 2021, 151, 106456. [Google Scholar] [CrossRef]
  26. Chen, Z.; Zhang, S.; Geng, W.; Ding, Y.; Jiang, X. Use of geographically weighted regression (GWR) to reveal spatially varying relationships between Cd accumulation and soil properties at field scale. Land 2022, 11, 635. [Google Scholar] [CrossRef]
  27. Blazina, T.; Sun, Y.; Voegelin, A.; Lenz, M.; Berg, M.; Winkel, L. Terrestrial selenium distribution in China is potentially linked to monsoonal climate. Nat. Commun. 2014, 5, 4717. [Google Scholar] [CrossRef]
  28. Li, Z.; Wang, Y.; Yang, Z.; Hou, Q.; Liu, J.; Zhao, X.; Liu, X.; Liu, J. Geochemical characteristics of soil selenium and influencing factors of spatial distribution in Ninghua area, Fujian province. Rock Miner. Anal. 2025, 44, 1–15. [Google Scholar]
  29. Dinh, Q.; Wang, M.; Tran, T.; Zhou, F.; Wang, D.; Zhai, H.; Peng, Q.; Xue, M.; Du, Z.; Bauelos, G. Bioavailability of selenium in soil-plant system and a regulatory approach. Crit. Rev. Environ. Sci. Technol. 2018, 49, 443–517. [Google Scholar] [CrossRef]
  30. Howarth, A.; Katz, M.; Wang, T.; Platero-Prats, A.; Chapman, K.; Hupp, J.; Farha, O. High efficiency adsorption and removal of selenate and selenite from water using metal-organic frameworks. J. Am. Chem. Soc. 2015, 137, 7488–7494. [Google Scholar] [CrossRef]
  31. Favorito, J.; Grossl, P.; Davis, T.; Eick, M.; Hankes, N. Soil-plant-animal relationships and geochemistry of selenium in the Western Phosphate Resource Area (United States): A review. Chemosphere 2021, 266, 128959. [Google Scholar] [CrossRef] [PubMed]
  32. Chang, C.; Zhang, H.; Huang, F.; Feng, X. Understanding the translocation and bioaccumulation of cadmium in the Enshi seleniferous area, China: Possible impact by the interaction of Se and Cd. Environ. Pollut. 2022, 300, 118927. [Google Scholar] [CrossRef]
  33. Li, Z.; Man, N.; Wang, S.; Liang, D.; Liu, J. Selenite adsorption and desorption in main Chinese soils with their characteristics and physicochemical properties. J. Soils Sediments 2015, 15, 1150–1158. [Google Scholar] [CrossRef]
  34. Antoniadis, V.; Levizou, E.; Shaheen, S.M.; Ok, Y.S.; Sebastian, A.; Baum, C.; Prasad, M.N.V.; Wenzel, W.W.; Rinklebe, J. Trace elements in the soil-plant interface: Phytoavailability, translocation, and phytoremediation–a review. Earth-Sci. Rev. 2017, 171, 621–645. [Google Scholar] [CrossRef]
  35. Mehdi, Y.; Hornick, J.; Istasse, L.; Dufrasne, I. Selenium in the environment, metabolism and involvement in body functions. Molecules 2013, 18, 3292–3311. [Google Scholar] [CrossRef]
  36. Shaheen, S.M.; Ali, R.A.; Abowaly, M.E.; Rabie, A.E.-M.A.; El Abbasy, N.E.; Rinklebe, J. Assessing the mobilization of As, Cr, Mo, and Se in Egyptian lacustrine and calcareous soils using sequential extraction and biogeochemical microcosm techniques. J. Geochem. Explor. 2018, 191, 28–42. [Google Scholar] [CrossRef]
  37. Lee, S.; Doolittle, J.; Woodard, H. Selenite adsorption and desorption in selected South Dakota soils as a function of pH and other oxyanions. Soil Sci. 2011, 176, 73–79. [Google Scholar] [CrossRef]
  38. Lei, W.; Cicchella, D.; Liu, T.; Yang, S.; Zhou, Y.; Hu, B.; Liu, Y.; Lin, X. Origin, distribution and enrichment of selenium in oasis farmland of Aksu, Xinjiang, China. J. Geochem. Explor. 2021, 223, 106723. [Google Scholar] [CrossRef]
  39. Muller, J.; Abdelouas, A.; Ribet, S.; Grambow, B. Sorption of selenite in a multi-component system using the “dialysis membrane” method. Appl. Geochem. 2012, 27, 2524–2532. [Google Scholar] [CrossRef]
  40. Feng, P.; Li, Z.; Zhe, Y.; Huang, J.; Liang, D. Selenate adsorption and desorption in 18 kinds of Chinese soil with their physicochemical properties. Environ. Sci. 2016, 37, 3160–3168. [Google Scholar]
  41. Ahmad, S.; Bailey, E.H.; Arshad, M.; Ahmed, S.; Watts, M.; Young, S. Fate of selenium in biofortification of wheat on calcareous soil: An isotopic study. Environ. Geochem. Health 2021, 43, 3643–3657. [Google Scholar] [CrossRef]
  42. Zhang, W.; Zhang, F.; Wang, Y.; Wang, J.; Liu, J.; Zhang, H.; Shi, Q.; Gu, W.; Wang, K.; Du, X. A review of geological characteristics and selenium enrichment in Se-bearing volcanogenic massive sulfide deposits. Int. Geol. Rev. 2024, 67, 1306–1321. [Google Scholar] [CrossRef]
  43. Liu, R.; Zhou, W.; Shang, G.; Zhou, Y.; Xu, Z.; Tang, D.; Cui, H.; Liao, C.; Yu, D. Spatial distribution and enrichment characteristics of selenium in paddy soil and rice around the Dongting Lake. Environ. Pollut. 2024, 359, 124552. [Google Scholar] [CrossRef]
  44. Li, Y.; Lu, Z.; Yang, H.; Jin, L.; Hu, H. Release characteristics of arsenic, selenium, lead and transformation of minerals during ashing process of coal. J. Fuel Chem. Technol. 2022, 50, 11–18. [Google Scholar] [CrossRef]
  45. Audrey, L.; Florence, M.; Dominic, L.; Raoul-Marie, C. Influence of temperature on selenium mobility under contrasting redox conditions: A sediment flow-through reactor experiment. Biogeochemistry 2025, 168, 65. [Google Scholar] [CrossRef] [PubMed]
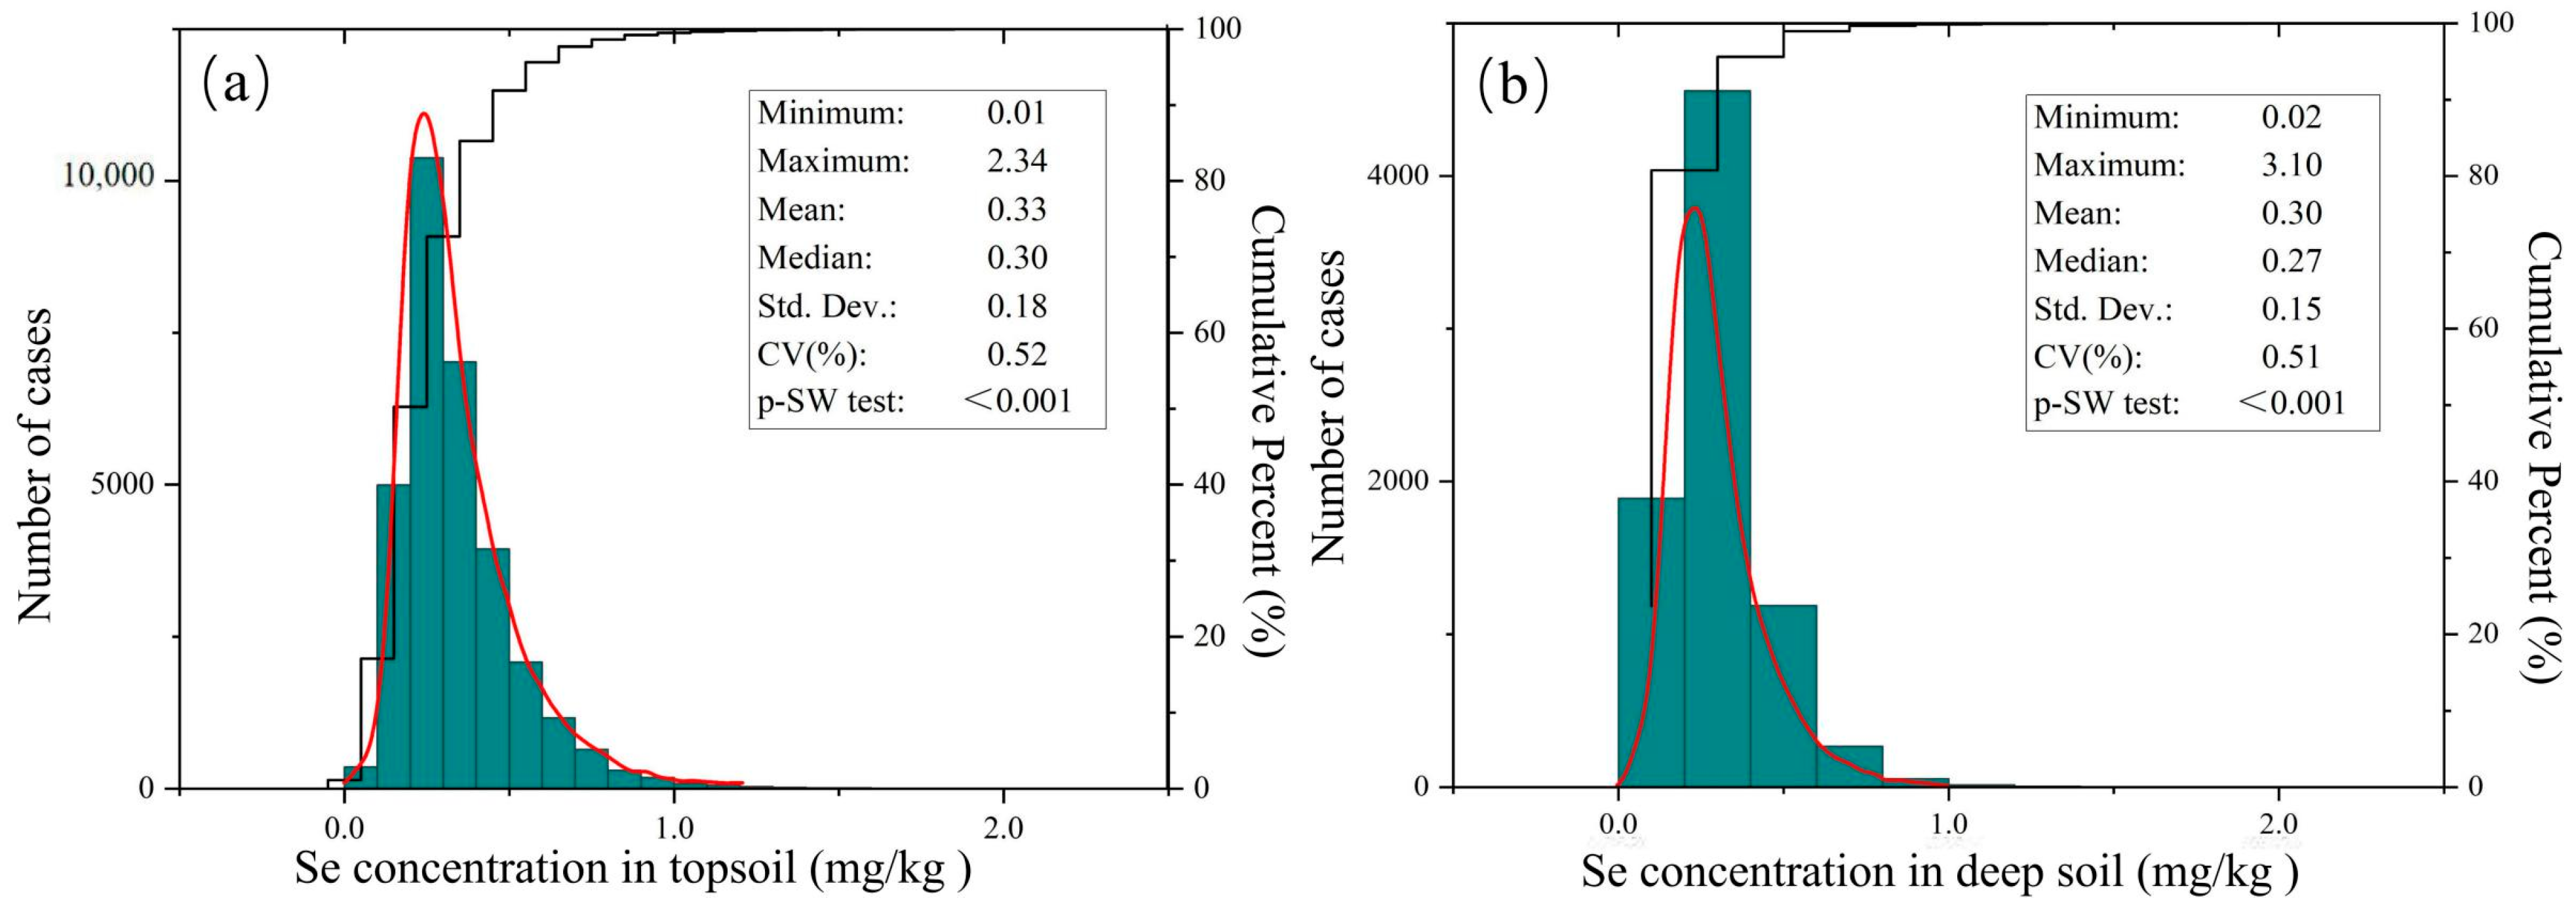
Figure 1. Descriptive statistics and frequency distribution for Se concentrations in soils of Fujian. Red lines in (a,b) represent the normal distribution curve.
Agronomy 15 02560 g001
Figure 2. Cold- and hotspot maps of topsoil Se with different bandwidths ((a) 1 km bandwidth; (b) mineral distribution map; (c) 2 km bandwidth; (d) soil parent material map; (e) 10 km bandwidth; (f) elevation map).
Agronomy 15 02560 g002
Figure 3. Hot and cold spot maps of deepsoil Se with different bandwidths ((a)—2 km bandwidth; (b)—10 km bandwidth).
Agronomy 15 02560 g003
Figure 4. (a) The correlation coefficient C between SOM and Se; (b) The fitting degree R2 between SOM and Se; (c) The relationship between SOM and Se in the coastal area; (d) The relationship between SOM and Se in the non-coastal area.
Agronomy 15 02560 g004
Figure 5. (a) Correlation coefficient C between pH and Se; (b) goodness-of-fit degree R2 between pH and Se; (c) scatter plot of pH and soil Se in alkaline areas; (d) scatter plot of pH and soil Se in acidic areas.
Agronomy 15 02560 g005
Figure 6. (a) Correlation coefficient C between TFe2O3 and Se; (b) goodness-of-fit degree R2 between TFe2O3 and Se; (c) scatter plot of TFe2O3 and Se (pH < 4.5); (d) scatter plot of TFe2O3 and Se (pH > 7.5); (e) scatter plot of SOM and Se (pH < 4.5); (f) scatter plot of SOM and Se (pH > 7.5).
Agronomy 15 02560 g006
Figure 7. (a) Correlation coefficient C between MAP and Se; (b) goodness-of-fit degree R2 between MAP and Se; (c) correlation coefficient C between EL and Se; (d) goodness-of-fit degree R2 between EL and Se; (e) correlation coefficient C between MAT and Se; (f) goodness-of-fit degree R2 between MAT and Se.
Agronomy 15 02560 g007
Table 1. Quality monitoring form for precision and accuracy.
IndicatorsUnitAnalysis MethodDetection LimitRSD% lg C RE%
Semg/kgAFS0.017.560.0104−0.42
pH-ISE0.11.260.0049−0.84
SOM%VOL0.052.980.0156−1.45
TFe2O3%XRF0.012.730.01120.40
Pmg/kgXRF83.150.0090−1.12
lg C   = lg C i lg C s ; RE   =   C i ¯ C s C s × 100 % ; RSD   =   C A C B C A + C B × 2 × 100 % . pH is dimensionless. AFS: atomic fluorescence spectrometry; ISE: ion-selective electrode; VOL: potassium dichromate titration method; XRF: X-ray fluorescence.
Table 2. Soil Se deficiency and excess classification threshold values (mg/kg).
Content ClassificationTotal Se in SoilArea/Square Kilometers
(in Ten Thousand)
Proportion/%
deficient<0.1250.32.4
marginal0.125~0.1750.97.7
sufficient0.175~0.407.862.8
rich0.40~33.427.1
excessive>300
Disclaimer/Publisher’s Note: The statements, opinions and data contained in all publications are solely those of the individual author(s) and contributor(s) and not of MDPI and/or the editor(s). MDPI and/or the editor(s) disclaim responsibility for any injury to people or property resulting from any ideas, methods, instructions or products referred to in the content.