Article

Referenced Transcriptomics Identifies a Core Set of Cytochrome P450 Genes Driving Broad-Spectrum Insecticide Detoxification in Phthonandria atrilineata

Guangxi Key Laboratory of Sericulture Ecology and Intelligent Technology Application, Guangxi Collaborative Innovation Center of Modern Sericulture and Silk, Guangxi Colleges Universities Key Laboratory of Exploitation and Utilization of Microbial and Botanical Resources, School of Chemistry and Bioengineering, Hechi University, Hechi 546300, China
*
Author to whom correspondence should be addressed.
Agronomy 2025, 15(11), 2561; https://doi.org/10.3390/agronomy15112561
Submission received: 11 October 2025 / Revised: 2 November 2025 / Accepted: 4 November 2025 / Published: 5 November 2025

Abstract

Phthonandria atrilineata, also known as the mulberry looper, is a major defoliator of mulberry trees. This feeding behavior directly affects the growth of the trees and reduces the quality and yield of mulberry leaves for its use in sericulture. Despite its importance the molecular basis of its resistance to insecticides remains poorly understood. Therefore, this study aimed to comprehensively characterize the cytochrome P450 monooxygenases (P450s) gene family in P. atrilineata and identify key effectors responsible for responses to diverse chemical stressors. We integrated genome-wide re-annotation, phylogenetic analysis, and comparative transcriptomics following exposure to five chemically distinct insecticides. We identified a high-confidence set of 70 P450 genes, dominated by the CYP6 and CYP4 families, whose expansion was driven by tandem gene duplication. Transcriptomic analysis revealed a powerful yet highly selective “elite-driven” response, wherein a small subset of P450s was strongly induced by multiple insecticides. Random Forest and Support Vector Machine (SVM) models converged with differential expression data to pinpoint a core trio of P450s as primary drivers of detoxification: two generalists, CYP6(09521) and CYP6(04876), responsive to all compounds, and one potent specialist, CYP4(04803), exhibiting massive induction to a specific subset of insecticides. Our findings uncover a complex, energy-efficient metabolic strategy in P. atrilineata and identify pivotal P450 genes for broad-spectrum detoxification. These genes represent high-priority targets for developing molecular diagnostic tools for resistance monitoring and informing scientifically guided insecticide rotation strategies.

1. Introduction

Sustainable management of agricultural pests demands a fundamental understanding of their adaptive mechanisms at the molecular level, particularly those governing insecticide metabolism and resistance development [1,2]. Among diverse enzyme systems mediating xenobiotic detoxification, cytochrome P450 monooxygenases (P450s) serve as a critical interface between pest physiology and chemical control efficacy [3,4]. These versatile enzymes catalyze the oxidative biotransformation of structurally diverse insecticides, often acting as the primary determinant of field-level control failures [4,5].
The mulberry looper, Phthonandria atrilineata (Lepidoptera: Geometridae), is an ideal model for investigating P450-mediated adaptations, as this economically important pest encounters multiple insecticide classes across its agricultural range in East Asia [6,7]. However, current molecular studies on this serious mulberry pest are so limited that we cannot find any literature focusing on such subjects. Molecular characterization of detoxification responses, building on prior genomic data, has potential applications in pest management. For instance, identifying P450 genes induced by specific insecticide classes could serve as markers for monitoring resistance development in real time, allowing adjustments to control strategies prior to field failures [7]. Additionally, analyzing the range and specificity of P450 induction patterns may guide the development of insecticide rotation schemes that reduce selection pressure on shared detoxification pathways. This approach supports a shift from reactive to predictive resistance management [8,9].
Recent advances in genome sequencing and transcriptional profiling have enabled comprehensive cataloging of detoxification gene families in non-model organisms [4,10,11]. For P. atrilineata, available genomic resources now permit systematic investigation of its P450 complement and responses to chemical stressors [6]. This knowledge is particularly valuable given the pest’s exposure to insecticides with diverse modes of action, from acetylcholinesterase inhibitors like organophosphates to mitochondrial complex I disruptors [7]. Investigating P450 responses to these compounds can elucidate baseline detoxification mechanisms and inducible defenses that contribute to cross-resistance in field populations.
This study presents a comprehensive analysis of the P450 gene family in P. atrilineata, combining computational identification from genomic sequences with functional characterization via controlled insecticide exposures. By examining transcriptional responses to representative compounds from organophosphates and mitochondrial inhibitors, we delineated conserved and compound-specific P450 expression signatures. Our findings establish a molecular framework for metabolic adaptation in this pest, providing actionable insights for resistance monitoring tools and optimized chemical control within integrated pest management programs. This work bridges fundamental molecular biology with practical agricultural applications, addressing the need for science-based approaches to sustain effective pest control.

2. Materials and Methods

2.1. Data Source and Experimental Design

The raw RNA-sequencing data used in this study were generated from a previously described experiment and have been deposited in the NCBI Sequence Read Archive (SRA) under accession number PRJNA1288676. Briefly, third-instar larvae of P. atrilineata were collected from mulberry fields in Hechi, Guangxi, China, and maintained as a laboratory colony under controlled conditions (25 °C, 70% relative humidity, 14:10 light: dark cycle). The strain was susceptible to the tested insecticides, with no prior exposure history. Treatments included phoxim, trichlorfon, trichlorfon-malathion mixture (organophosphates), tolfenpyrad (METI complex I inhibitor), and chlorfenapyr (mitochondrial uncoupler). Controls used solvent-treated leaves. Three independent biological replicates per group (six groups total) yielded 18 libraries, sequenced on Illumina NovaSeq 6000 (150 bp paired-end reads). For each biological replicate, 22–25 larvae were exposed to sublethal concentrations (based on preliminary LC50 assays: phoxim (32%), trichlorfon (21%), trichlorfon malathion (27%), tolfenpyrad (30%), and chlorfenapyr (0% mortality but with visible symptoms of poisoning including green regurgitation and body contortion [7].

2.2. Genome Re-Annotation and P450 Gene Identification

The reference genome assembly of P. atrilineata (GenBank accession: GCA_014332785.1) was retrieved from the National Center for Biotechnology Information (NCBI) database. To improve gene model accuracy for this study, we performed a comprehensive, transcriptome-guided re-annotation. First, clean RNA-seq reads from all 18 samples were mapped to the genome using the splice-aware aligner Hisat2 (v2.2.1) [12]. Second, transcripts were assembled for each sample using StringTie (v2.2.1) [13], and the resulting assemblies were merged using stringtie to create a unified, non-redundant set of transcripts. This evidence, plus prior protein homology, was integrated into GETA v2.7.1 (https://github.com/chenlianfu/geta, accessed on 17 May 2025) for high-confidence protein-coding gene prediction. Putative P450 genes were identified from the re-annotated proteome via InterProScan (v5.60-92.0), selecting proteins with Pfam domain PF00067 and GO term GO:0004497 (“monooxygenase activity”). This yielded 70 high-confidence P450 genes for subsequent analyses.

2.3. Phylogenetic, Genomic, and Structural Analysis

To classify the 70 high-confidence P450 proteins, a UPGMA phylogenetic tree was constructed. The full-length protein sequences were aligned using MAFFT (v7.505) [14] with the accurate L-INS-i algorithm. The UPGMA tree was subsequently inferred using MEGA11 v11.0.13 [15] with 1000 bootstrap replicates to assess nodal support. The final tree was visualized and annotated using the Chiplot web server [16]. The physical coordinates of the P450 genes were extracted from the final GFF3 annotation file. Their distribution and clustering on the chromosomes were visualized using the “show gene location” function in TBtools-II (v2.360) [17]. Tertiary structures of the three top candidate P450 proteins—CYP6(09521), CYP4(04803), and CYP6(04876)—were predicted by homology modeling using the SWISS-MODEL server automated pipeline [18]. Models underwent quality assessment: GMQE scores (0.85–0.92) and QMEAN scores (>−1.5) indicated reliable predictions.

2.4. Transcriptomic Analysis and Differential Gene Expression

Reads were pre-processed with fastp (v0.23.2) to remove adapters, low-quality bases (Phred < 20), and short reads (<50 bp). Clean reads mapped to the re-annotated genome via Hisat2. Expression was quantified as FPKM using RSEM (v1.3.3) [19]. Differential expression used edgeR (v3.42.4) in R (v4.3.1) [20].

2.5. Machine Learning-Based Biomarker Identification

Two supervised models identified key P450s in R (v4.3.1). First, a Random Forest (RF) model was implemented using the randomForest package (v4.7-1.1) [21]. The model was trained on the FPKM expression matrix of selected P450 genes from all 18 samples to classify samples into their respective treatment groups. Default parameters (ntree = 500) were used, and the importance of each P450 gene as a predictor was quantified using the Mean Decrease Accuracy metric. Second, a Support Vector Machine (SVM) model with a linear kernel was applied to identify P450s involved in a generalist detoxification response. This model was also trained on the FPKM expression data of P450 genes found to be upregulated in all five insecticide treatments. Using the e1071 package (v1.7-13) [22], a recursive feature elimination approach was employed to rank the importance of each gene in distinguishing the pooled treated samples from the control samples.

2.6. Statistical Analyses and Data Visualization

All statistical plots, including the PCA plot, volcano plots, and bar charts, were generated using the ggplot2 package (v3.4.2) in R [23]. The genomic landscape circular plot was created using the OmicStudio cloud platform at https://www.omicstudio.cn/tool (accessed on 30 September 2025) [24].

3. Results

3.1. Genome Re-Annotation and Transcriptome-Wide Expression Landscape

Using RNA-seq from six conditions, we re-annotated the P. atrilineata genome, yielding 16,841 protein-coding genes. Comprehensive functional annotations (NR, InterProScan) covered 15,878 genes (94.3%), integrating data from NR, Pfam, CDD, SMART, SUPERFAMILY, NCBIfam, PANTHER, InterPro, and GO terms. The 336.55 Mb genome spans 31 chromosomes (Figure 1). An overview of the transcriptional activity revealed that a substantial portion of the genome is actively expressed under both control and insecticide-stressed conditions.
In the control group, a total of 11,870 genes (70.5% of the annotated genome) were expressed. Following insecticide exposure, the number of expressed genes varied depending on the compound. The highest number of expressed genes was observed in the phoxim (12,649 genes, 75.1%) and trichlorfon (12,633 genes, 75.0%) treatments. The tolfenpyrad (12,447 genes, 73.9%) and trichlorfon-malathion mixture (12,394 genes, 73.6%) treatments also showed a broad transcriptional response. The chlorfenapyr treatment resulted in the expression of 11,730 genes (69.6%), a number similar to that of the control group. This comprehensive expression atlas, depicted across the 31 chromosomes in Figure 1, establishes the baseline transcriptional landscape for investigating specific P450 gene family responses to diverse chemical pressures.

3.2. Identification and Annotation of the P450 Gene Complement

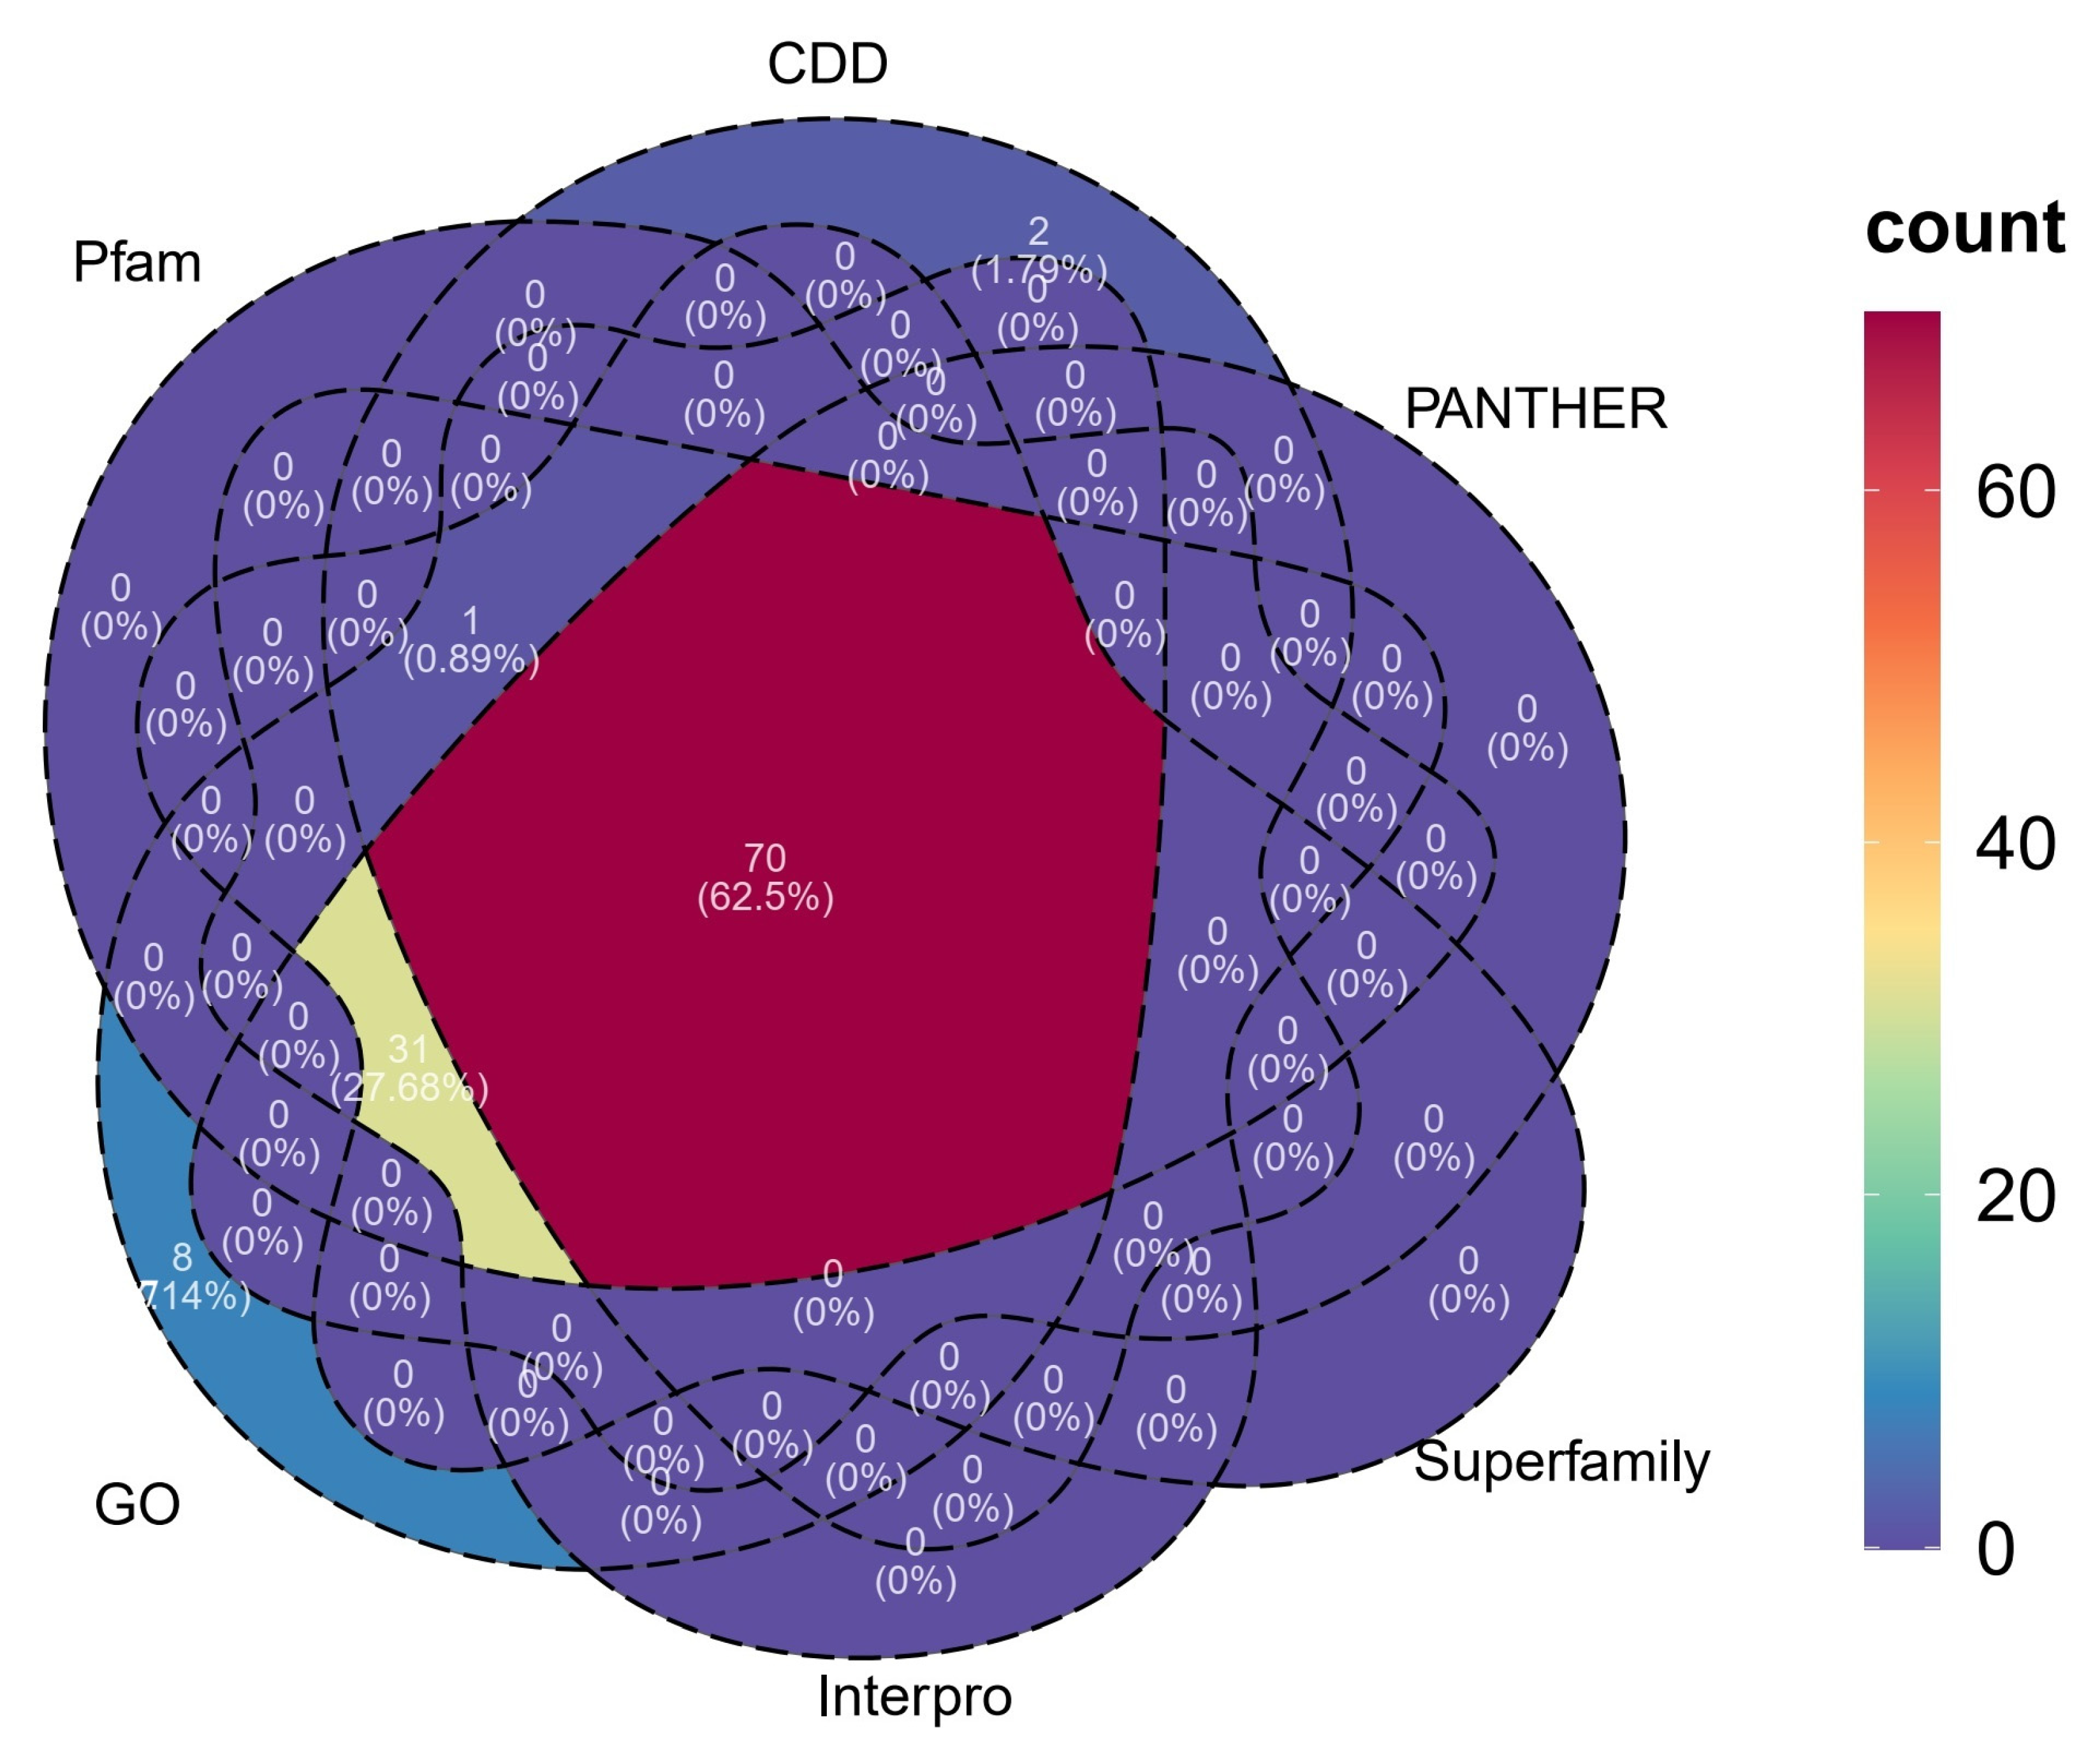
A multi-evidence annotation strategy, querying seven functional and protein domain databases (Table S1), delineated 112 putative P450 genes in the re-annotated Phthonandria atrilineata proteome. Notably, 70 genes (62.5%) were unanimously supported by all sources, establishing a high-confidence core set for downstream analyses (Figure 2). An additional 31 genes received majority endorsement from domain databases but lacked the “monooxygenase activity” GO term, while a minority were single-source detections (e.g., eight via GO alone, three via Pfam or CDD). These peripheral candidates, potentially representing pseudogenes or fragments, were excluded to prioritize functional integrity.
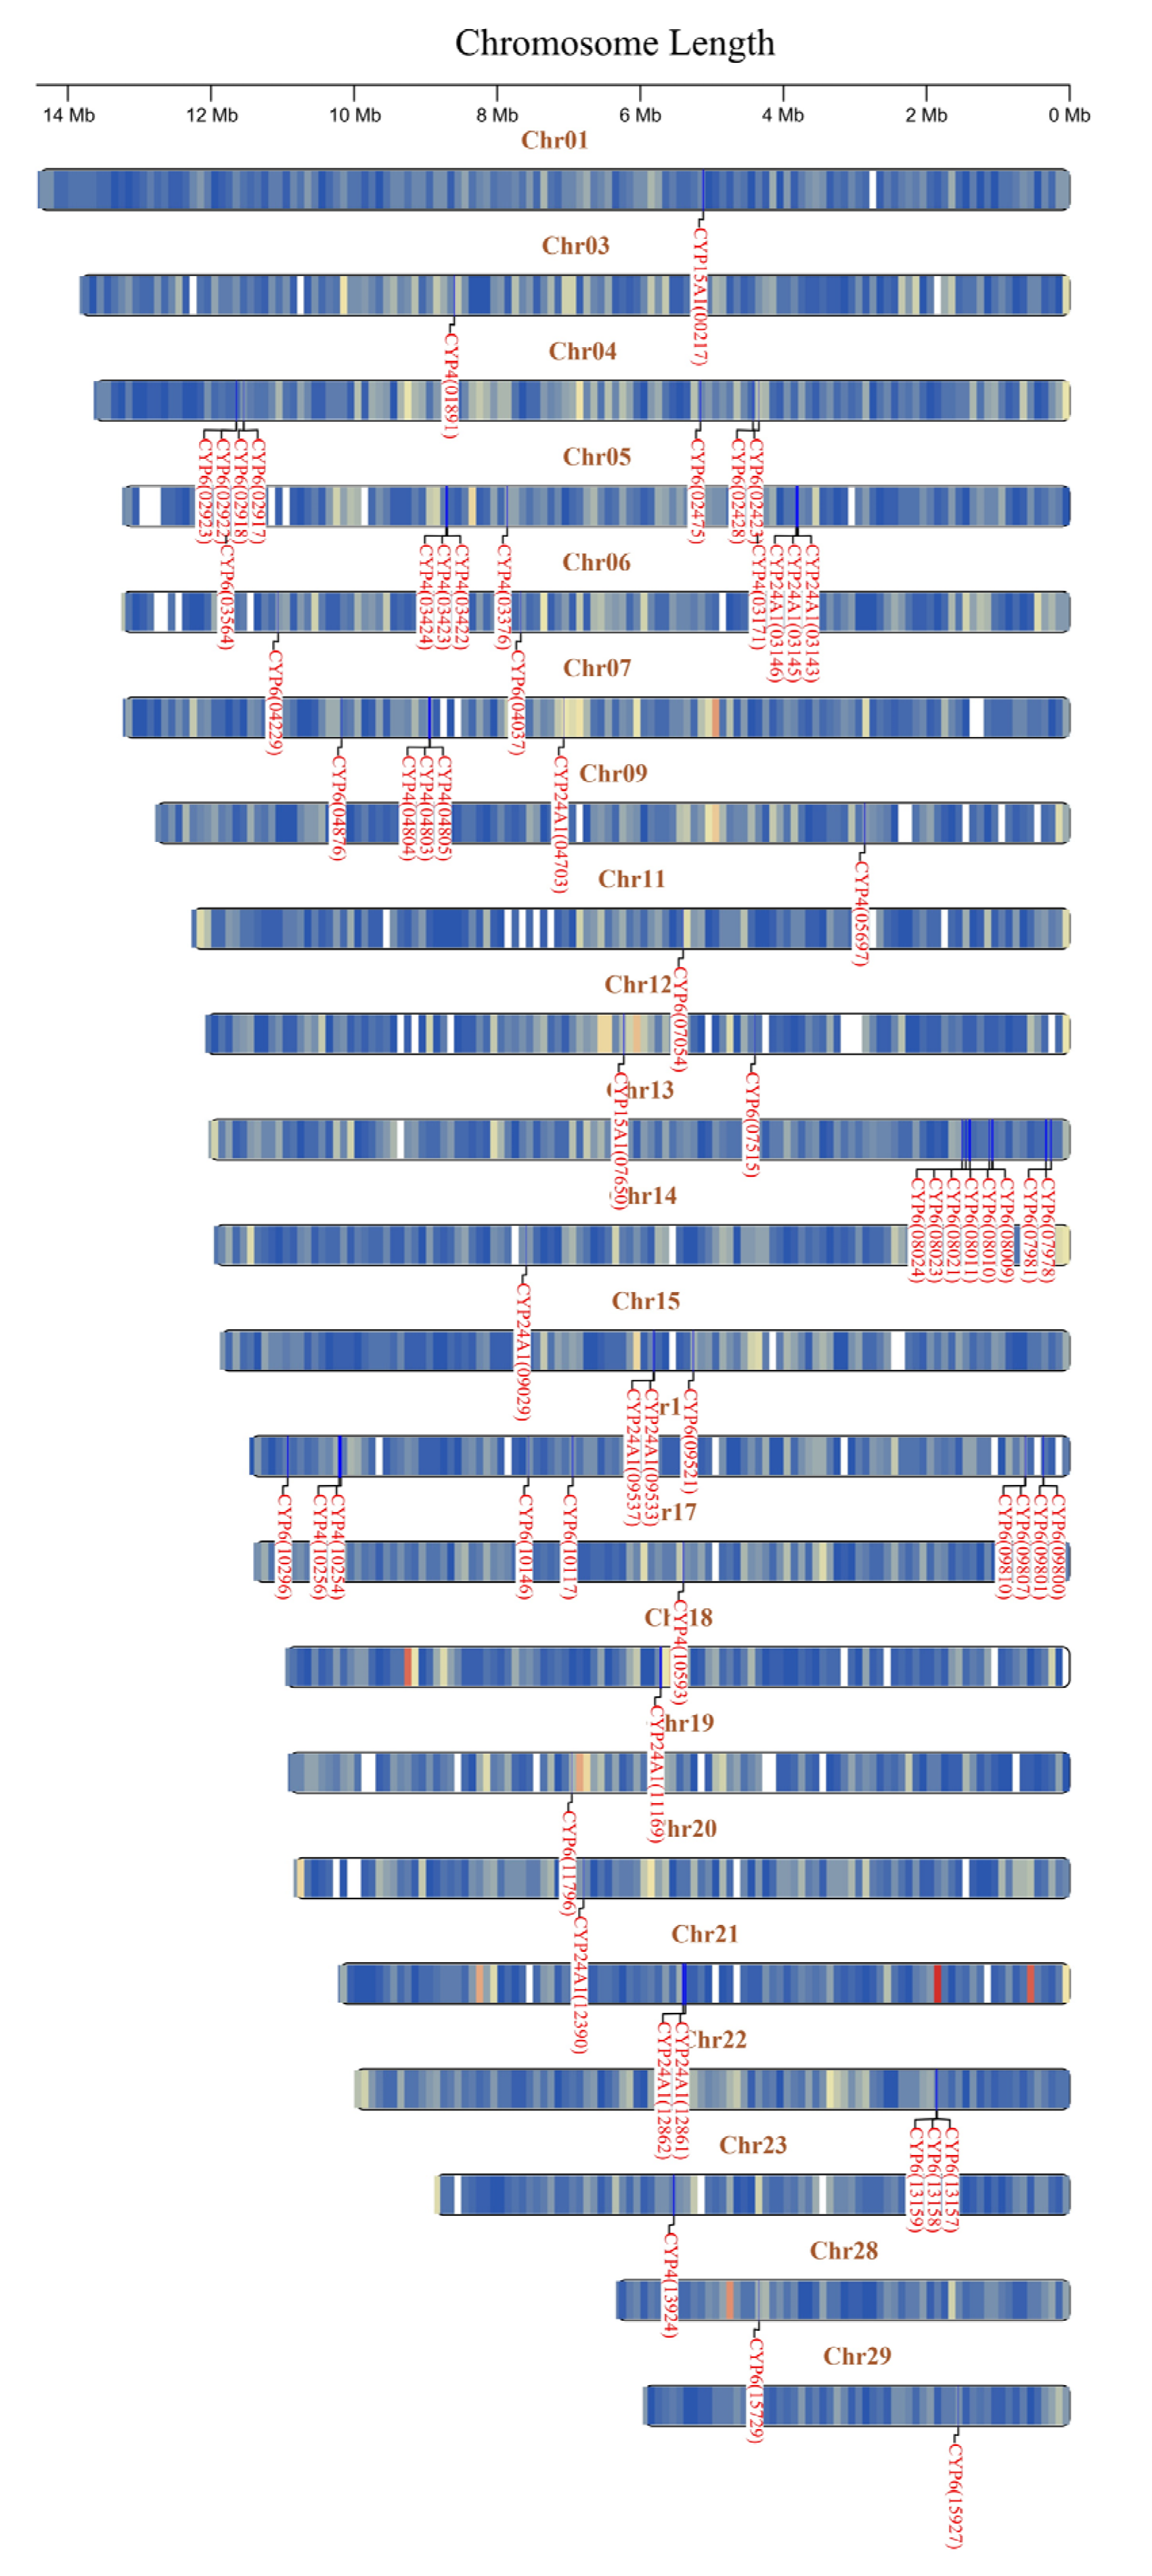
Mapping these 70 genes revealed an uneven chromosomal distribution across 22 chromosomes, characterized by 11 prominent clusters (Figure 3). A striking feature of their distribution was the extensive formation of gene clusters, suggesting that gene duplication events have played a significant role in the family’s evolution. We identified a total of 11 distinct P450 gene clusters. The largest clusters belonged to the CYP6 family, including a remarkable tandem array of eight genes on Chr13 (from CYP6(07978) to CYP6(08024)) and another cluster of four genes on Chr16 (CYP6(09800) to CYP6(09810)). Significant clusters were also observed for the CYP4 family (e.g., three genes on Chr05 and three on Chr07) and the CYP24A1 family (e.g., three genes on Chr05). This clustering pattern strongly indicates that tandem gene duplication has been a primary mechanism driving the expansion of the P450 gene family in P. atrilineata, particularly within the CYP6 and CYP4 clans, which are frequently associated with xenobiotic metabolism.
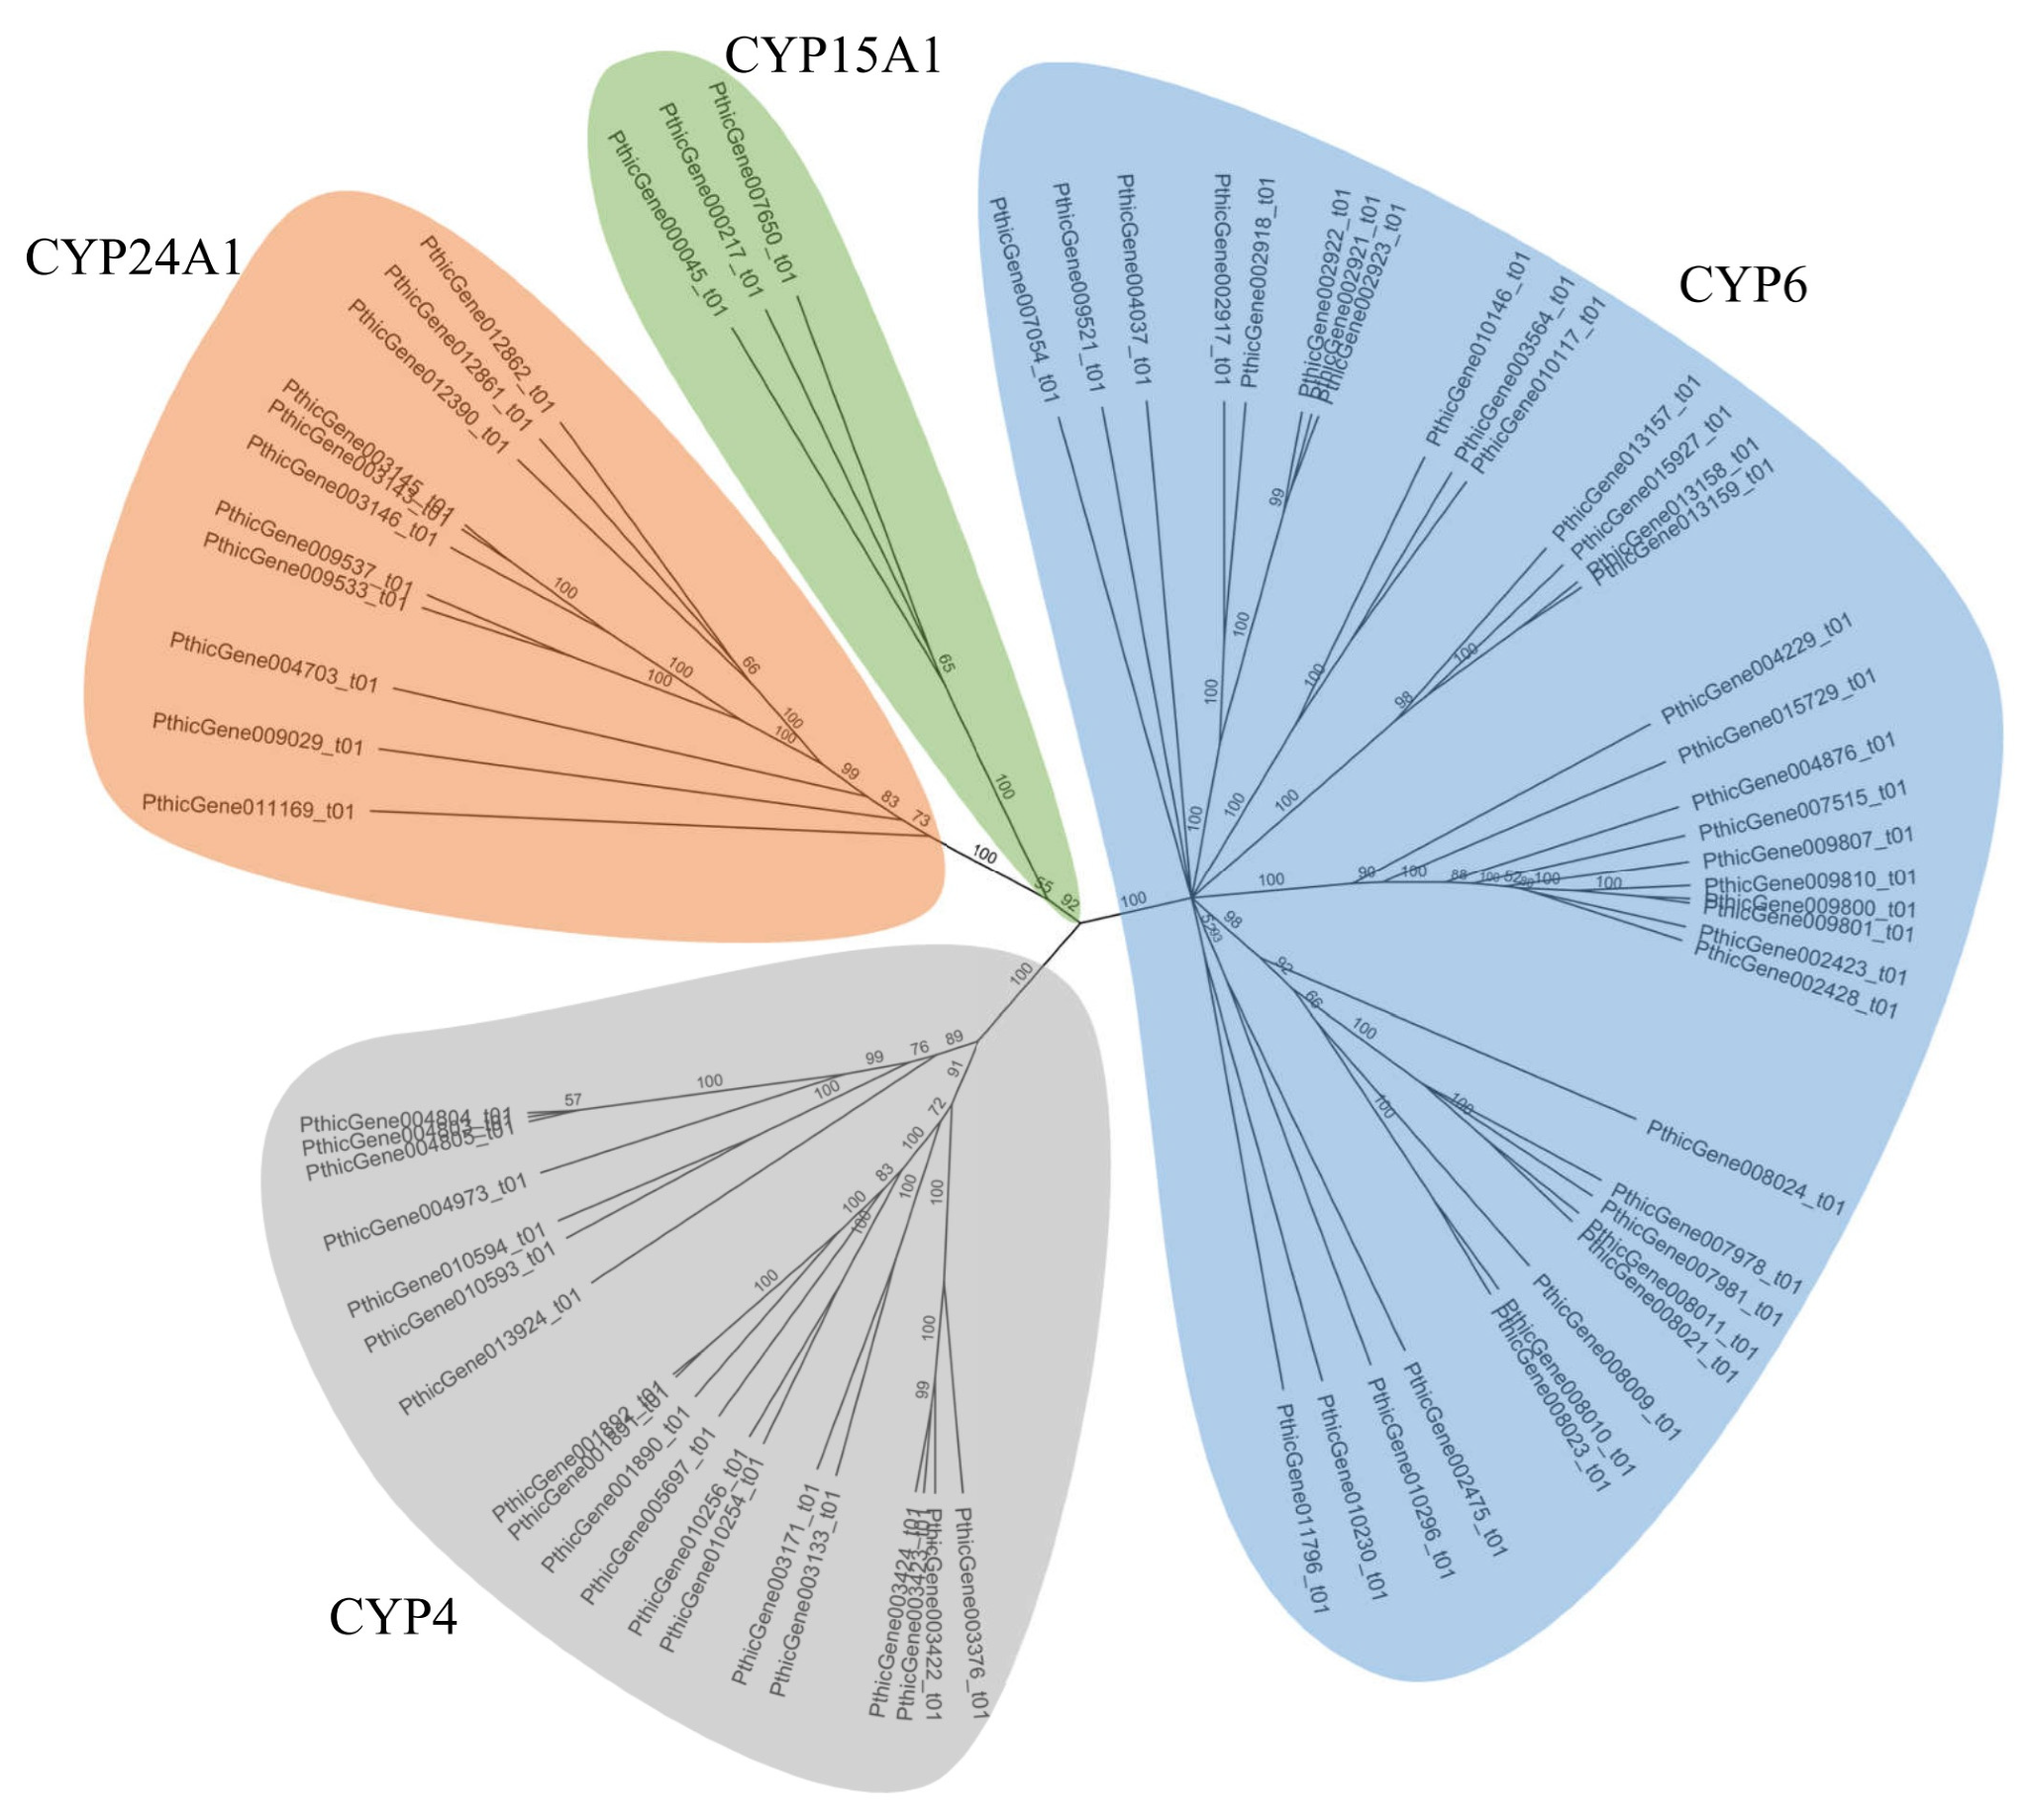
Phylogenetic reconstruction via UPGMA classified the 70 genes into four robust clades, aligning with major P450 families (Figure 4). The largest clade belongs to the CYP6 family, comprising a remarkable 38 members. The second-largest clade represents the CYP4 family, containing 18 members. The remaining two clades were identified as the CYP24A1 family with 11 genes and the CYP15A1 family with 3 genes. The segregation of these four major families was strongly supported by high bootstrap values, many at 100%, indicating a reliable classification that aligns perfectly with their CDD annotations. The vast number observed in the CYP6 and CYP4 families, which together account for 80% (56 of 70) of the high-confidence P450s, strongly suggests their critical and diversified roles in the detoxification of xenobiotics and metabolism of endogenous compounds in P. atrilineata.

3.3. Transcriptional Response of P450 Genes to Insecticide Exposure

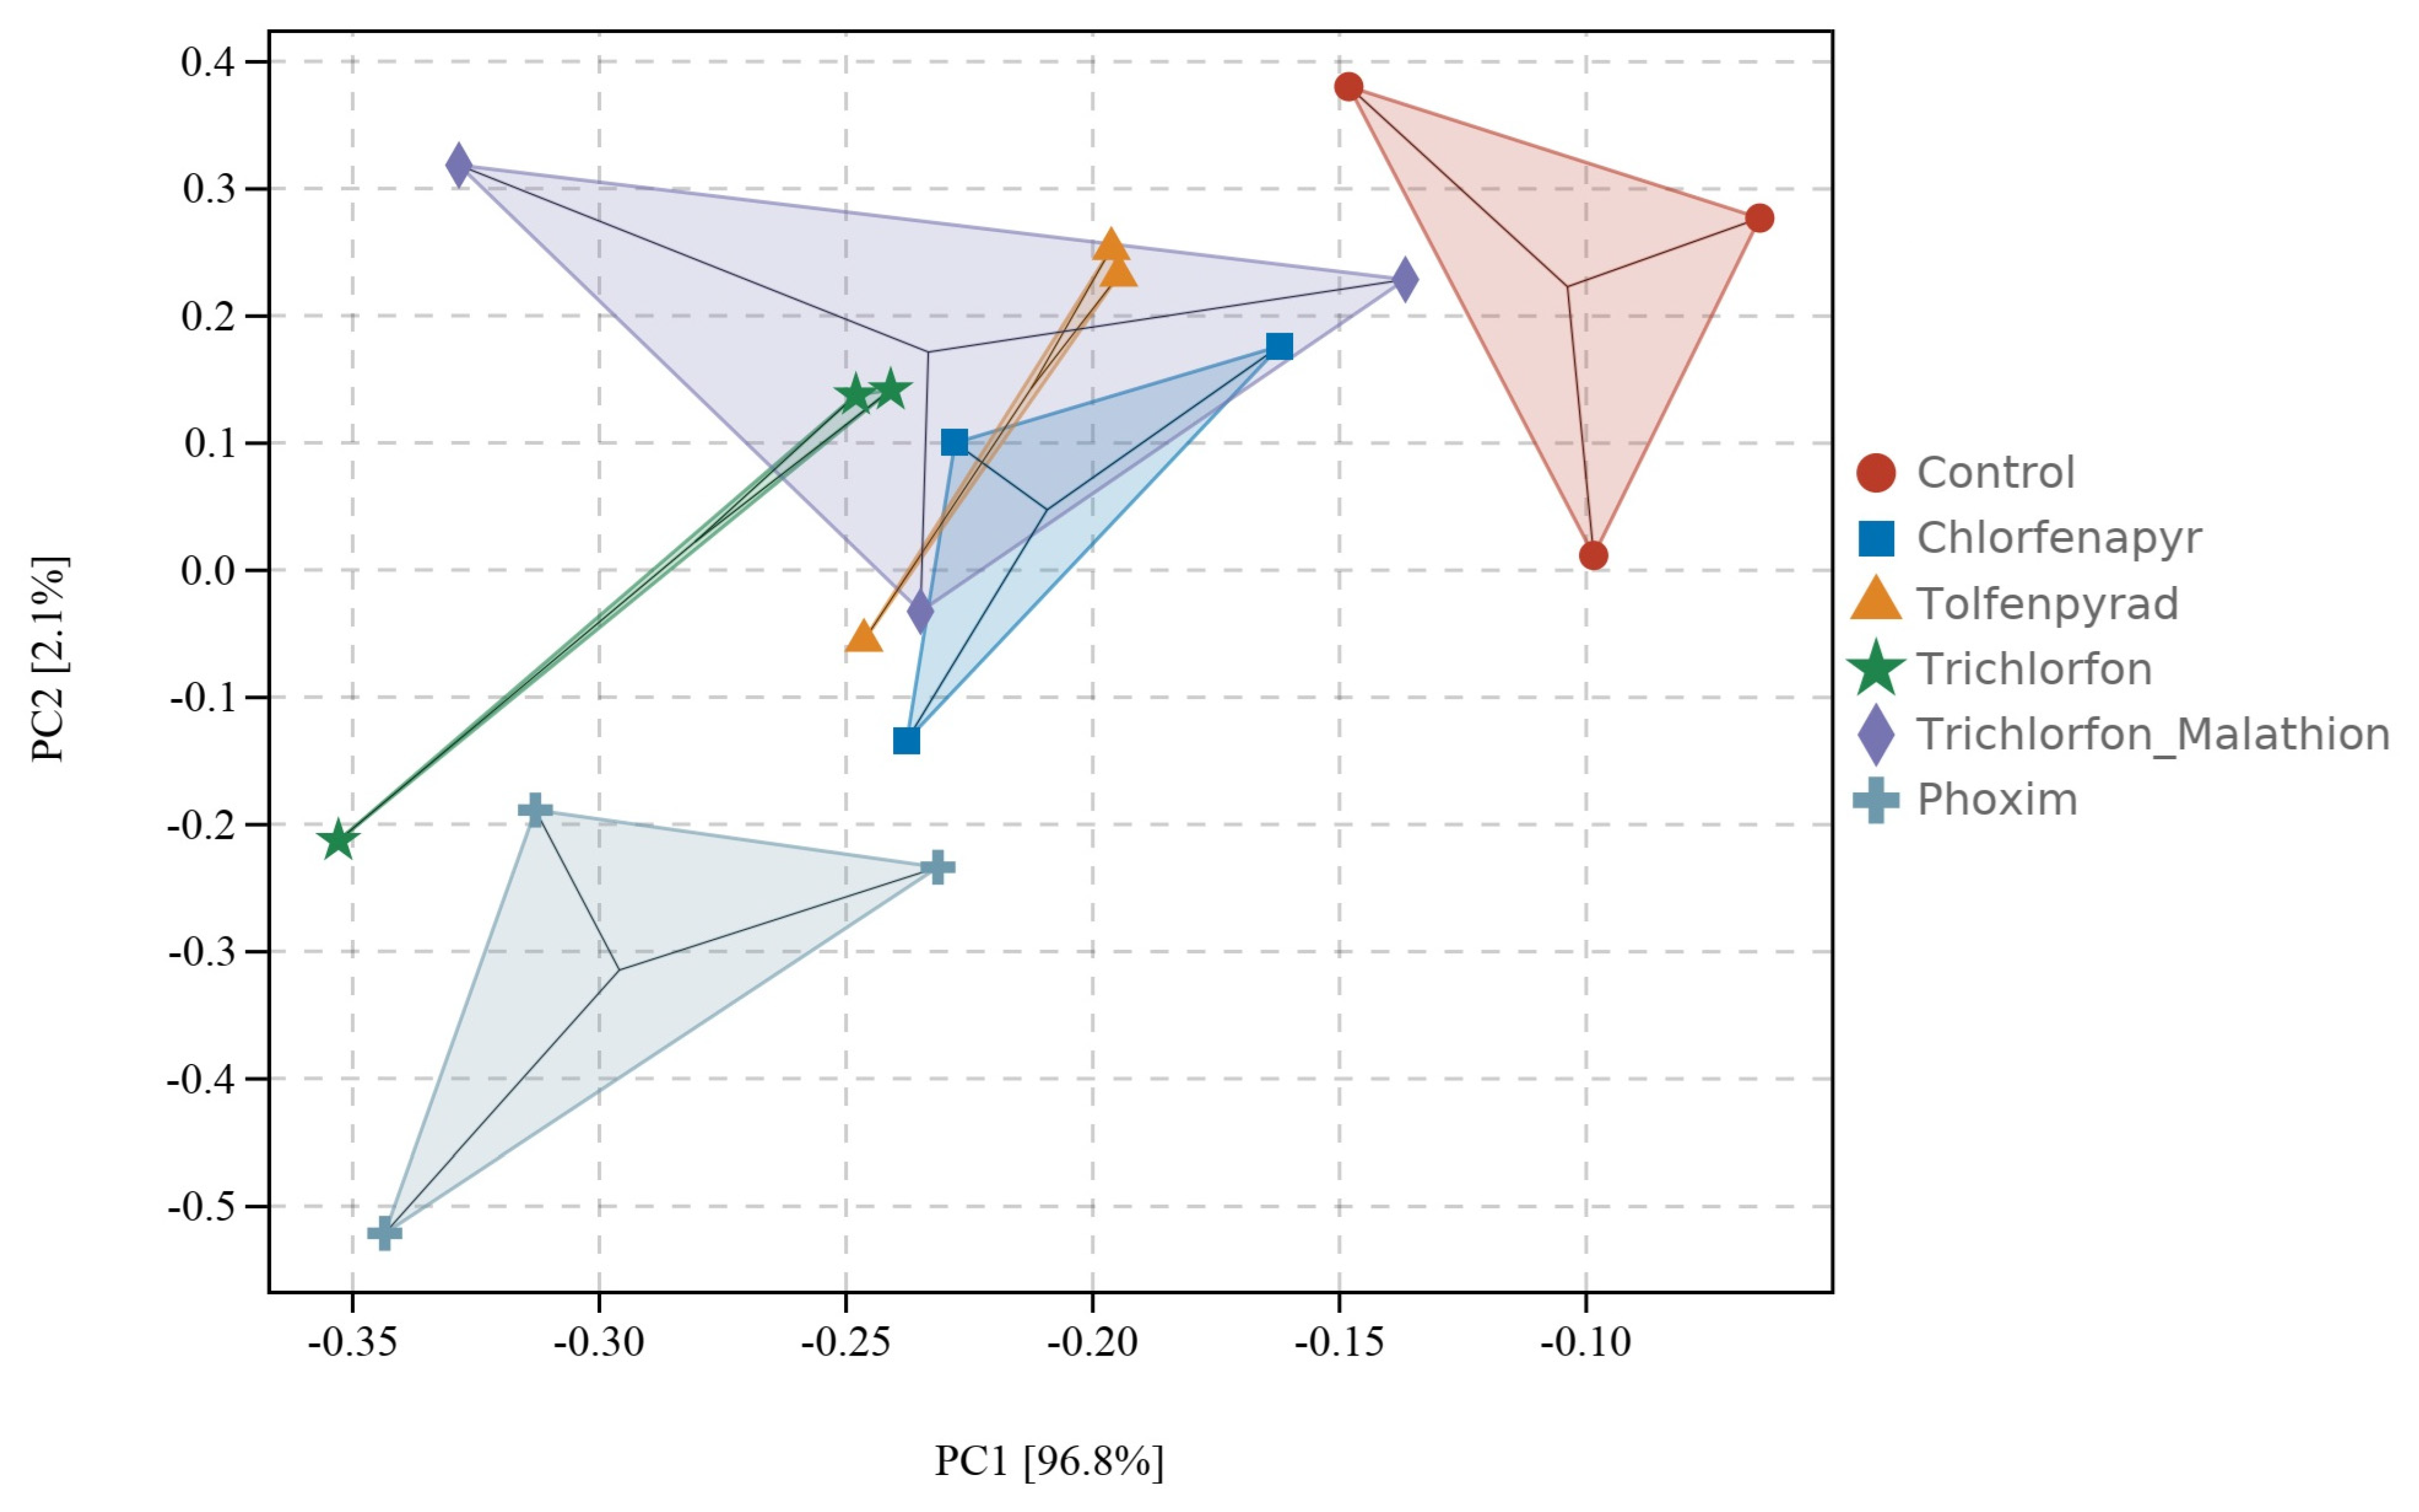
We began by exploring the overall expression patterns of the 70 high-confidence P450 genes across our 18 samples using principal component analysis (PCA). This approach uncovered a stark division between control and insecticide-treated groups, driven largely by the first principal component (PC1), which captured 96.8% of the variance (Figure 5). The control replicates formed a compact cluster, well separated from the treated ones, highlighting a consistent transcriptional shift triggered by chemical exposure. Interestingly, while the various insecticide treatments showed some spread along PC2 (accounting for 2.1% of variance), their general clustering points to shared response mechanisms, despite differences in chemical structures and modes of action.
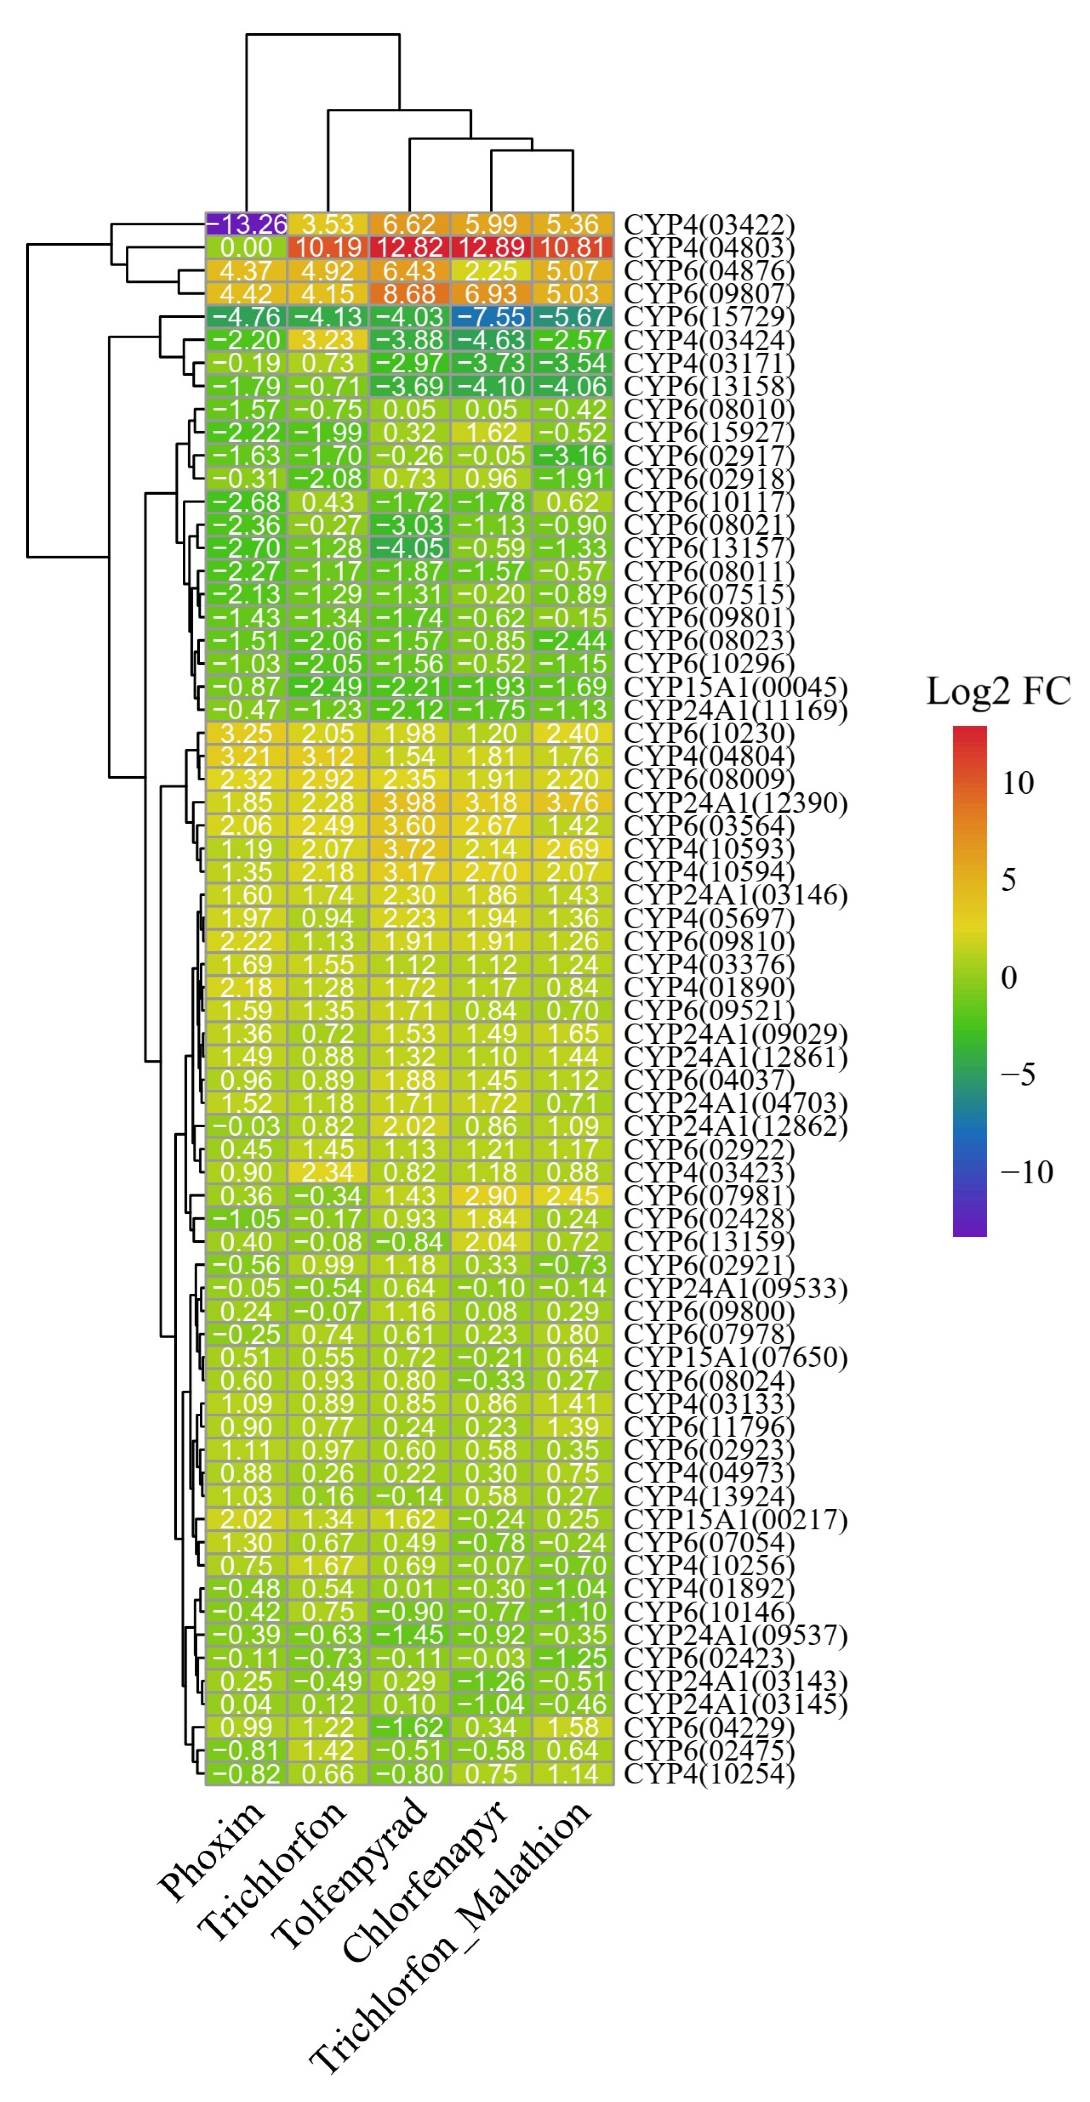
Then, we generated a heatmap based on their log2 fold change (log2FC) values following exposure to the five insecticide treatments to dissect the expression patterns of individual P450 genes (Figure 6). The analysis revealed highly heterogeneous responses. A majority of the P450 genes exhibited either downregulation (blue) or minor changes in expression (green), suggesting that a broad, non-specific induction of the entire P450 family does not occur. Instead, a distinct and small subset of P450s was powerfully upregulated (yellow to red) across multiple treatments. Among the most potently induced genes were CYP4(04803), which showed exceptionally high upregulation (>10-fold) in response to four treatments, and CYP6(09807), which was consistently upregulated across all five insecticides. Other notably induced genes included CYP4(03422), CYP4(10594), and CYP6(04876). Intriguingly, some genes displayed compound-specific regulation; for example, CYP4(03422) was strongly induced by four compounds but was significantly suppressed by Phoxim, indicating complex regulatory mechanisms. The hierarchical clustering further grouped these co-regulated genes, highlighting specific modules of P450s that are likely involved in core detoxification pathways.
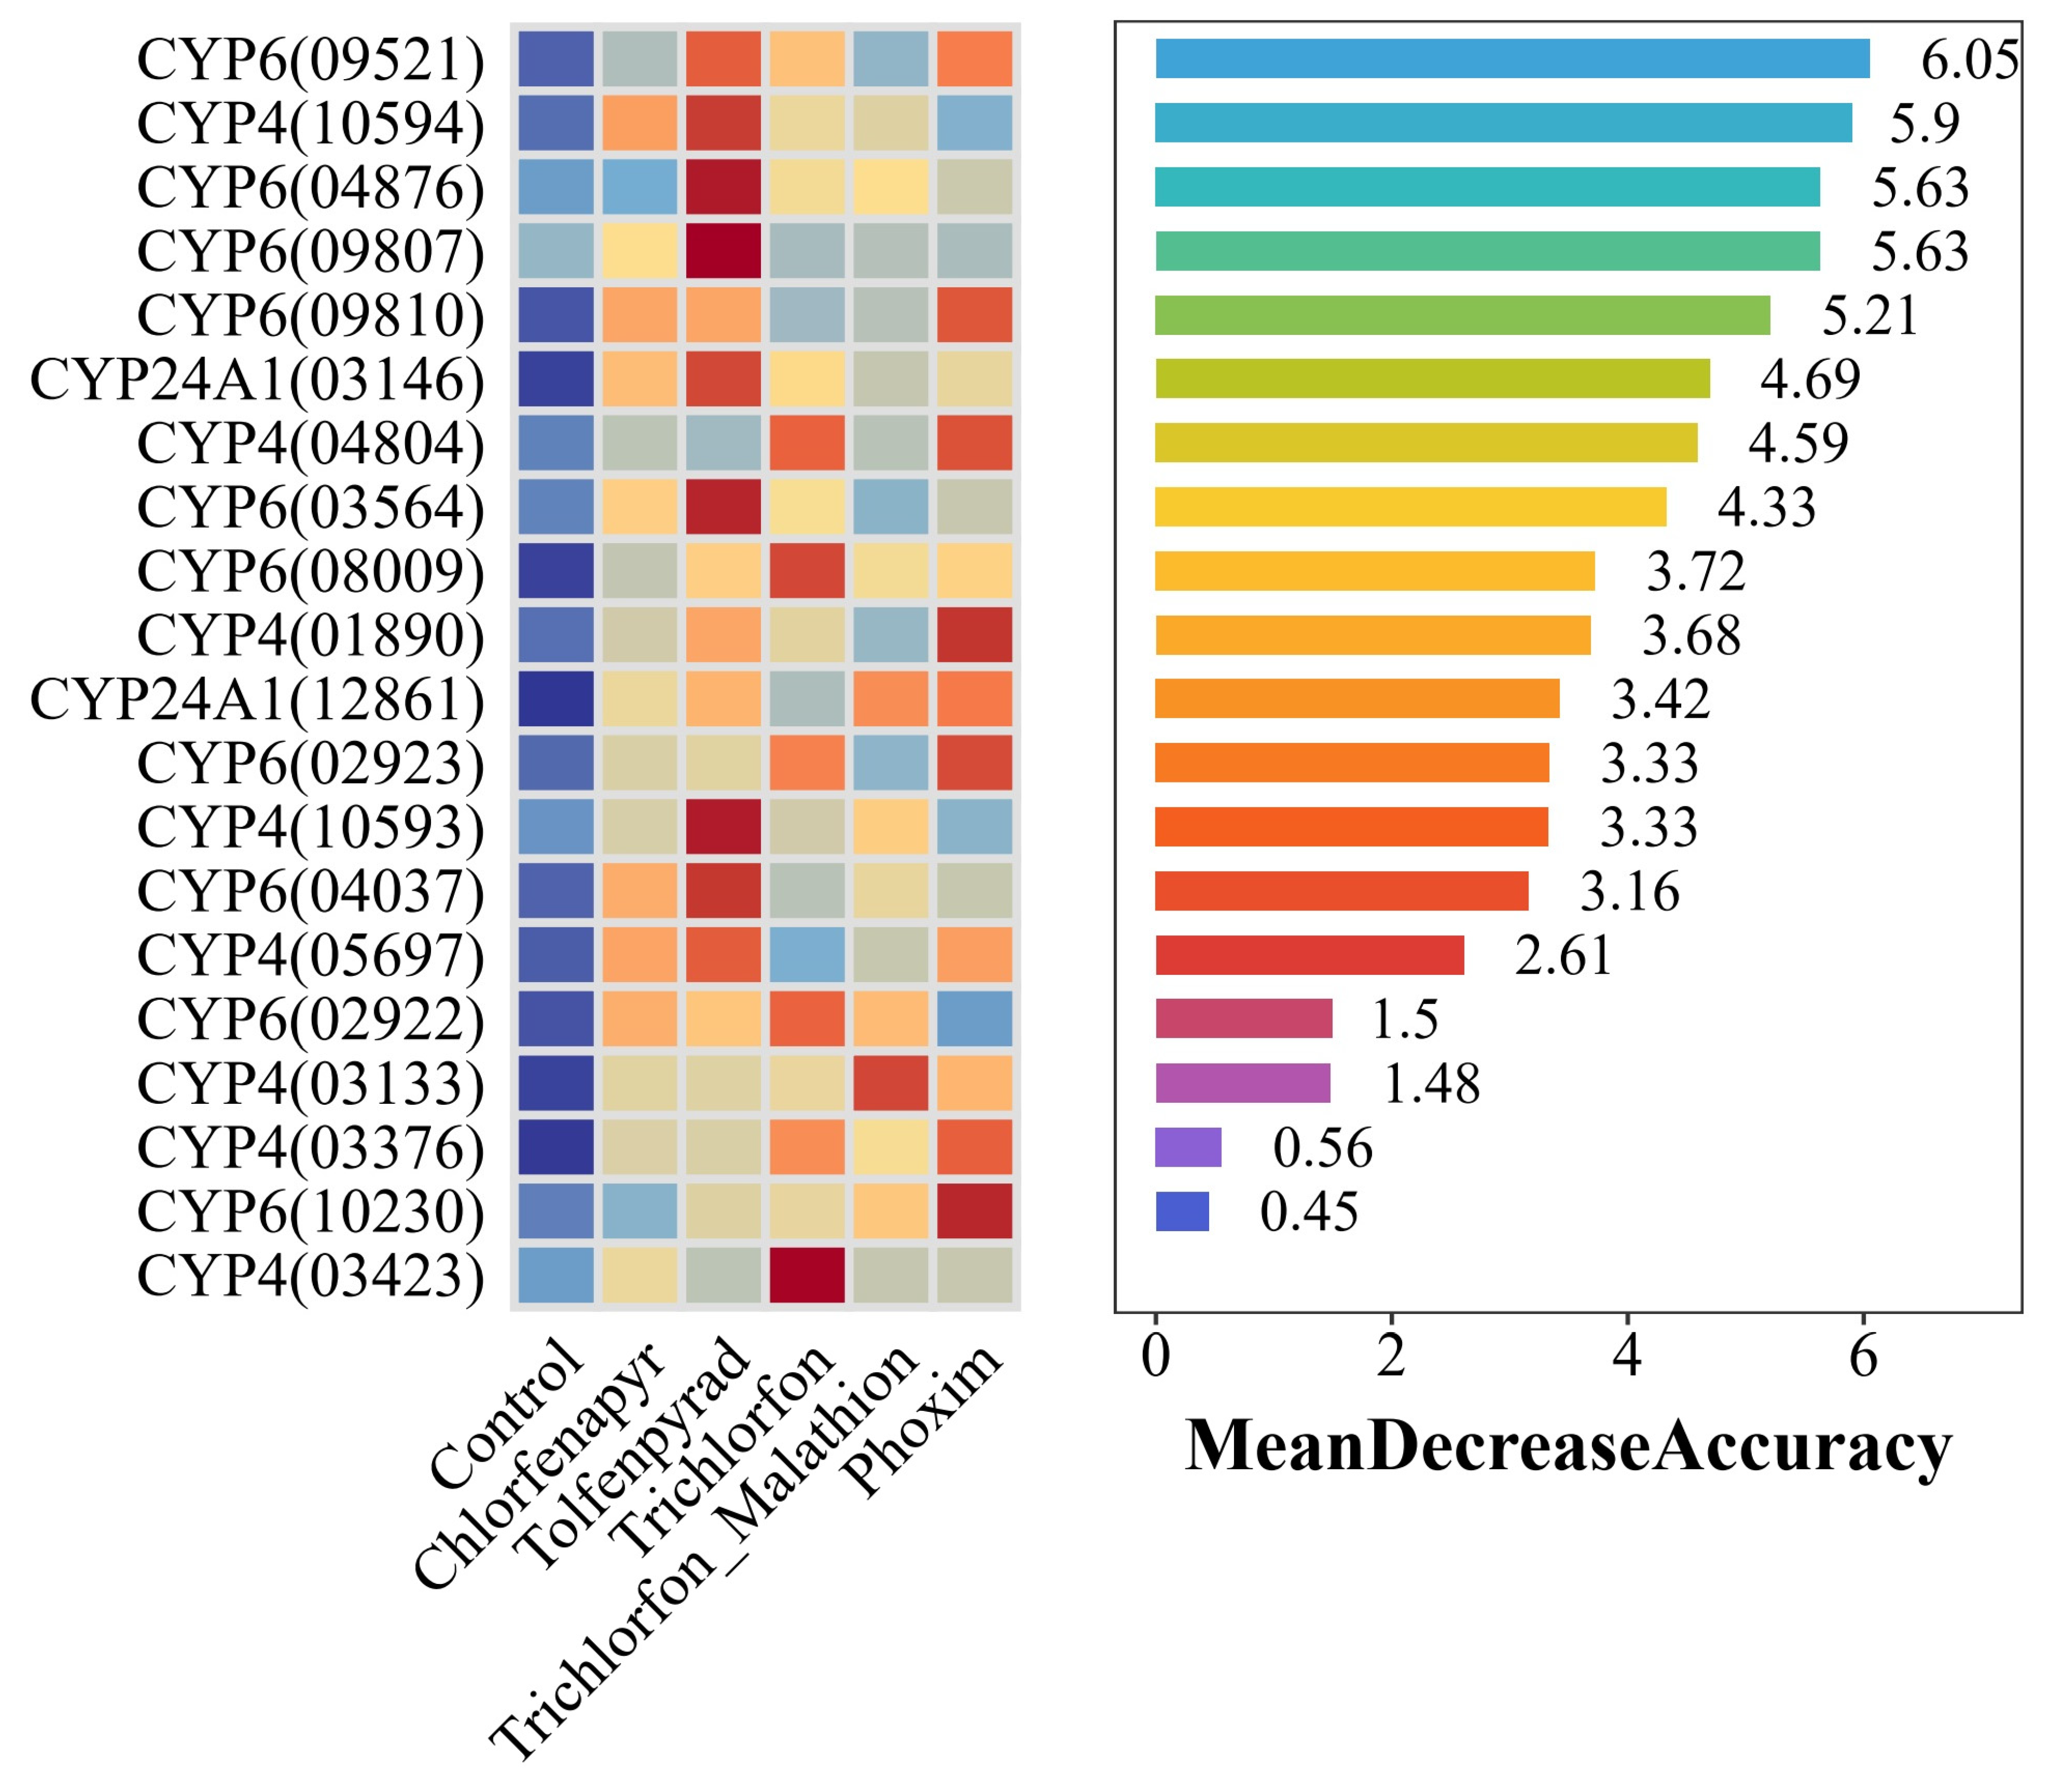
Building on this, we applied a Random Forest model to pinpoint genes most predictive of treatment status, using mean decrease in accuracy as the ranking metric (Figure 7). This machine learning step highlighted a handful of standout performers, such as CYP6(09521) (MDA = 6.05), CYP4(10594) (5.9), and CYP6(04876) (5.63), which aligned closely with the most induced genes from the heatmap. Notably, these top predictors, mainly from the CYP6 and CYP4 families, not only flagged exposure reliably but also hinted at their frontline roles in metabolic defense.
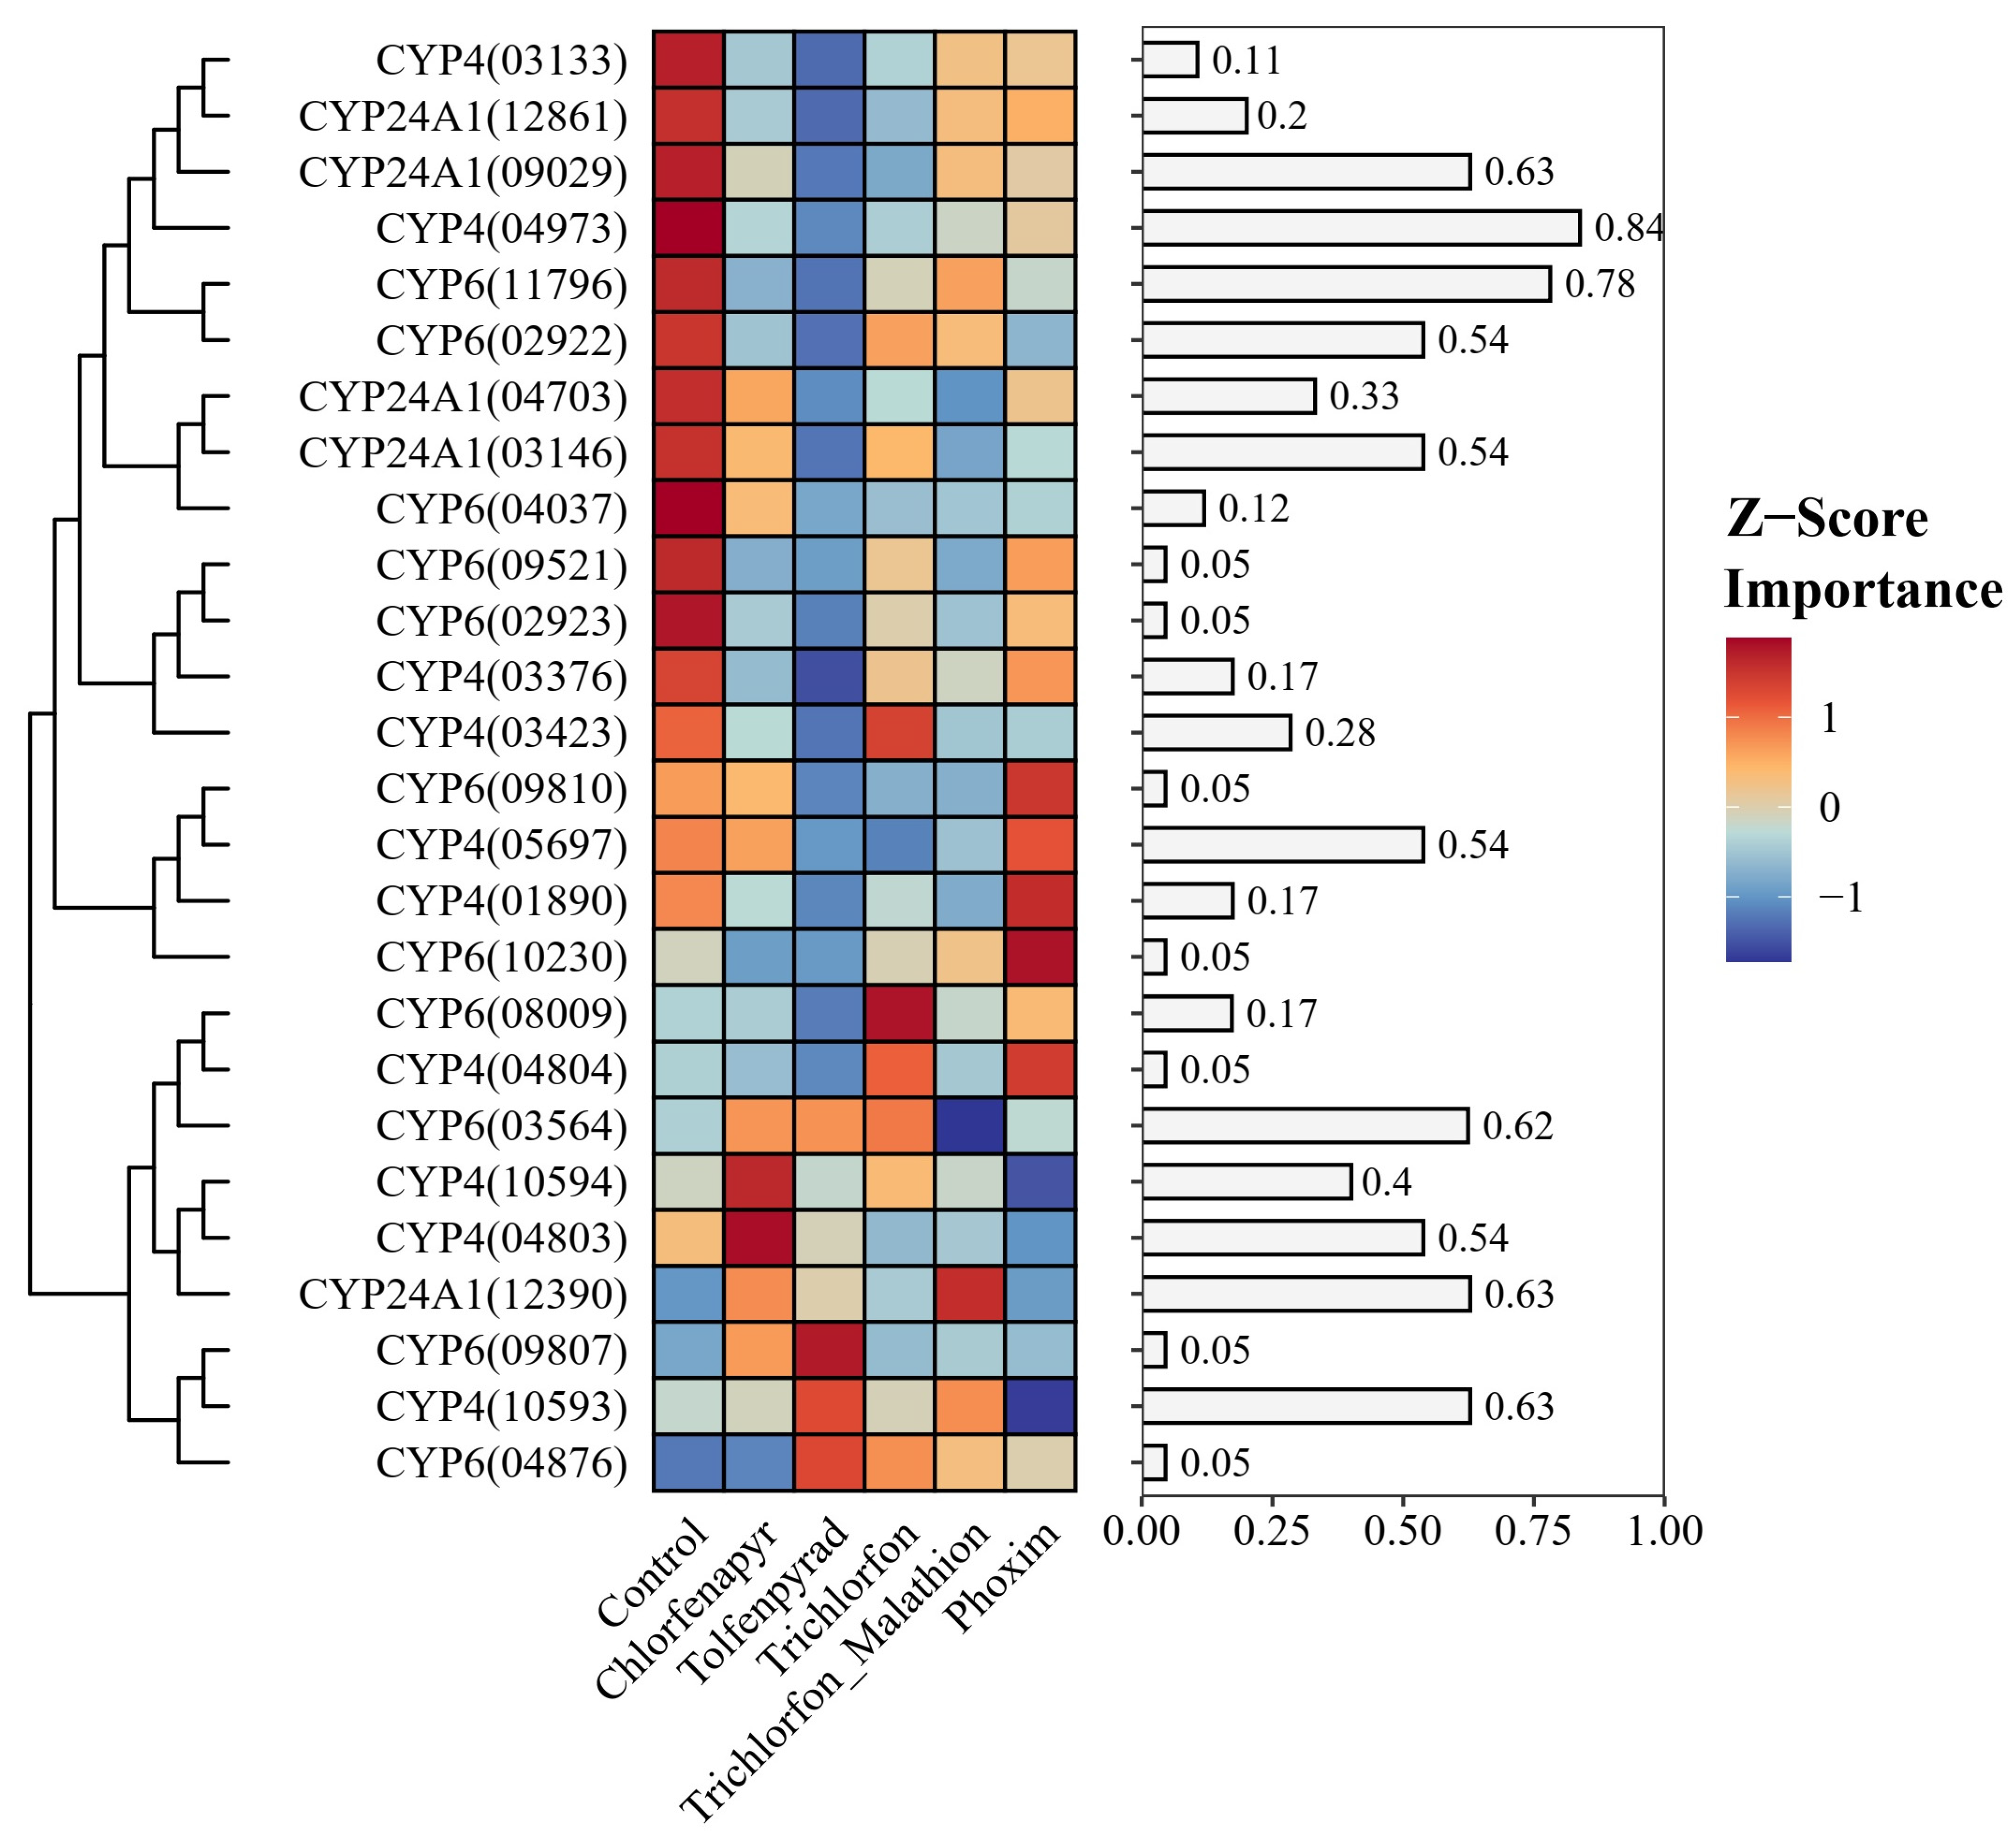
Focusing further on genes upregulated universally across all treatments, we used a Support Vector Machine (SVM) with recursive feature elimination to assess their discriminatory value against controls (Figure 8). The heatmap, displaying the Z-score normalized expression values, visualizes the relative importance of these genes across conditions. Genes such as CYP6(04876), CYP6(09807), CYP4(10594), and CYP6(03564) consistently exhibited high importance values (indicated by red shading) in multiple insecticide treatments, reinforcing their role in a generalized stress response. Hierarchical clustering of these importance scores grouped genes with similar response profiles, suggesting potential co-regulation or functional redundancy in metabolizing a wide array of substrates. For instance, the cluster containing CYP6(09807) and CYP4(10593) shows high importance in response to Tolfenpyrad and Trichlorfon. The False Discovery Rate (FDR) values associated with each gene’s importance score provide statistical confidence in their role as biomarkers. Notably, several genes, including CYP6(04876), CYP6(09807), CYP6(02923), CYP6(09521), and CYP4(04804), showed highly significant FDR values (FDR ≤ 0.05), establishing them as statistically robust indicators of a general xenobiotic detoxification response in P. atrilineata.

3.4. Convergent Evidence Pinpoints a Trio of P450s as Key Effectors of Broad-Spectrum Resistance

Synthesizing our differential expression, Random Forest, and SVM results yielded a focused set of P450 genes central to P. atrilineata’s insecticide tolerance. Three emerged as frontrunners—CYP6(09521), CYP4(04803), and CYP6(04876)—each with compelling evidence of key involvement, though their profiles suggested varied strategic roles. CYP6(09521) and CYP6(04876) exemplified versatile responders, ranking highly in both models and showing uniform upregulation across all insecticides tested. This broad reactivity positions them as likely generalists, adept at processing diverse chemical threats and forming the backbone of the pest’s adaptive arsenal. CYP4(04803), by contrast, exhibited a more specialized pattern: it surged over 10-fold in four treatments but was notably suppressed by phoxim, indicating substrate-specific prowess and regulatory finesse.
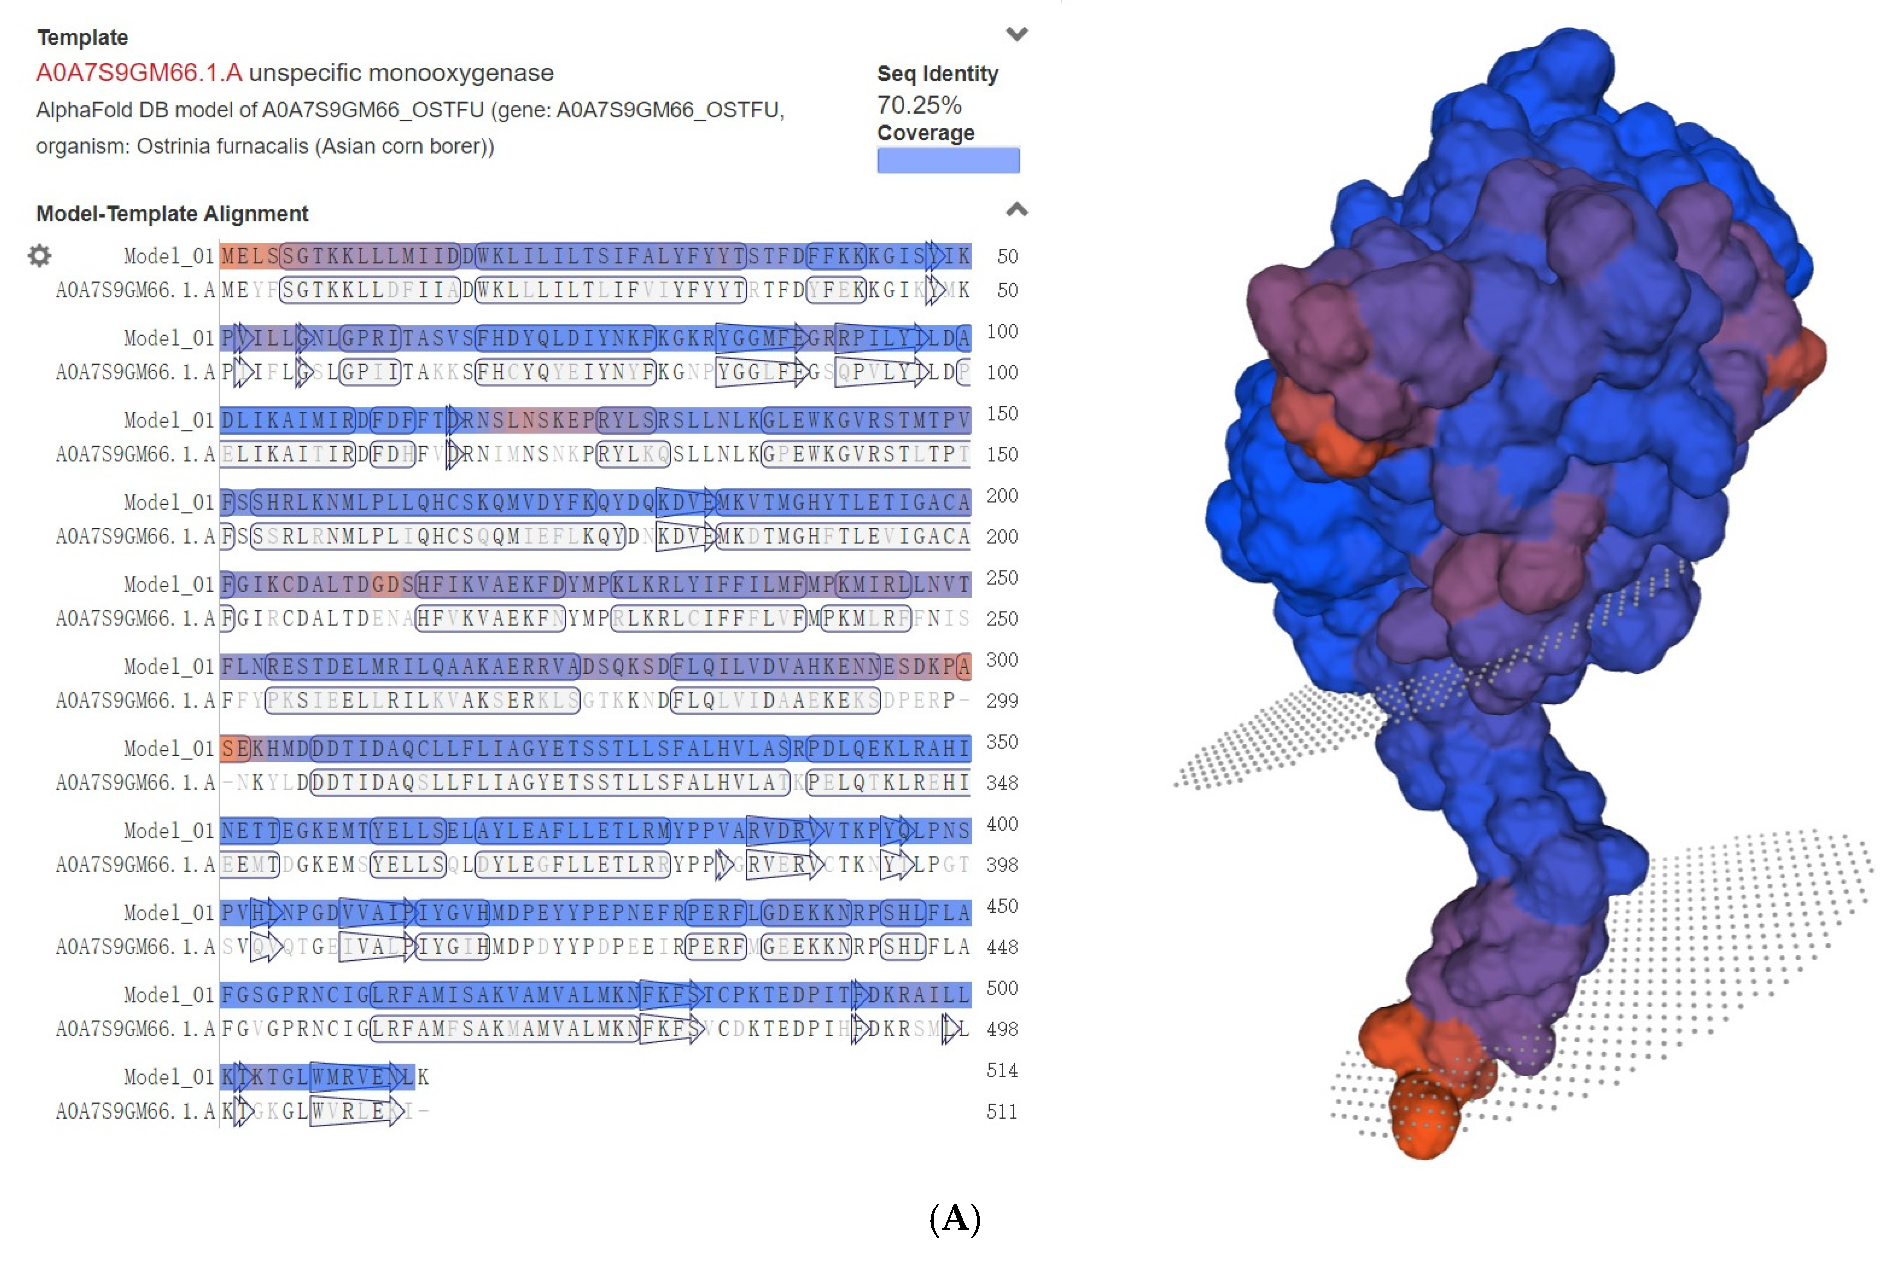
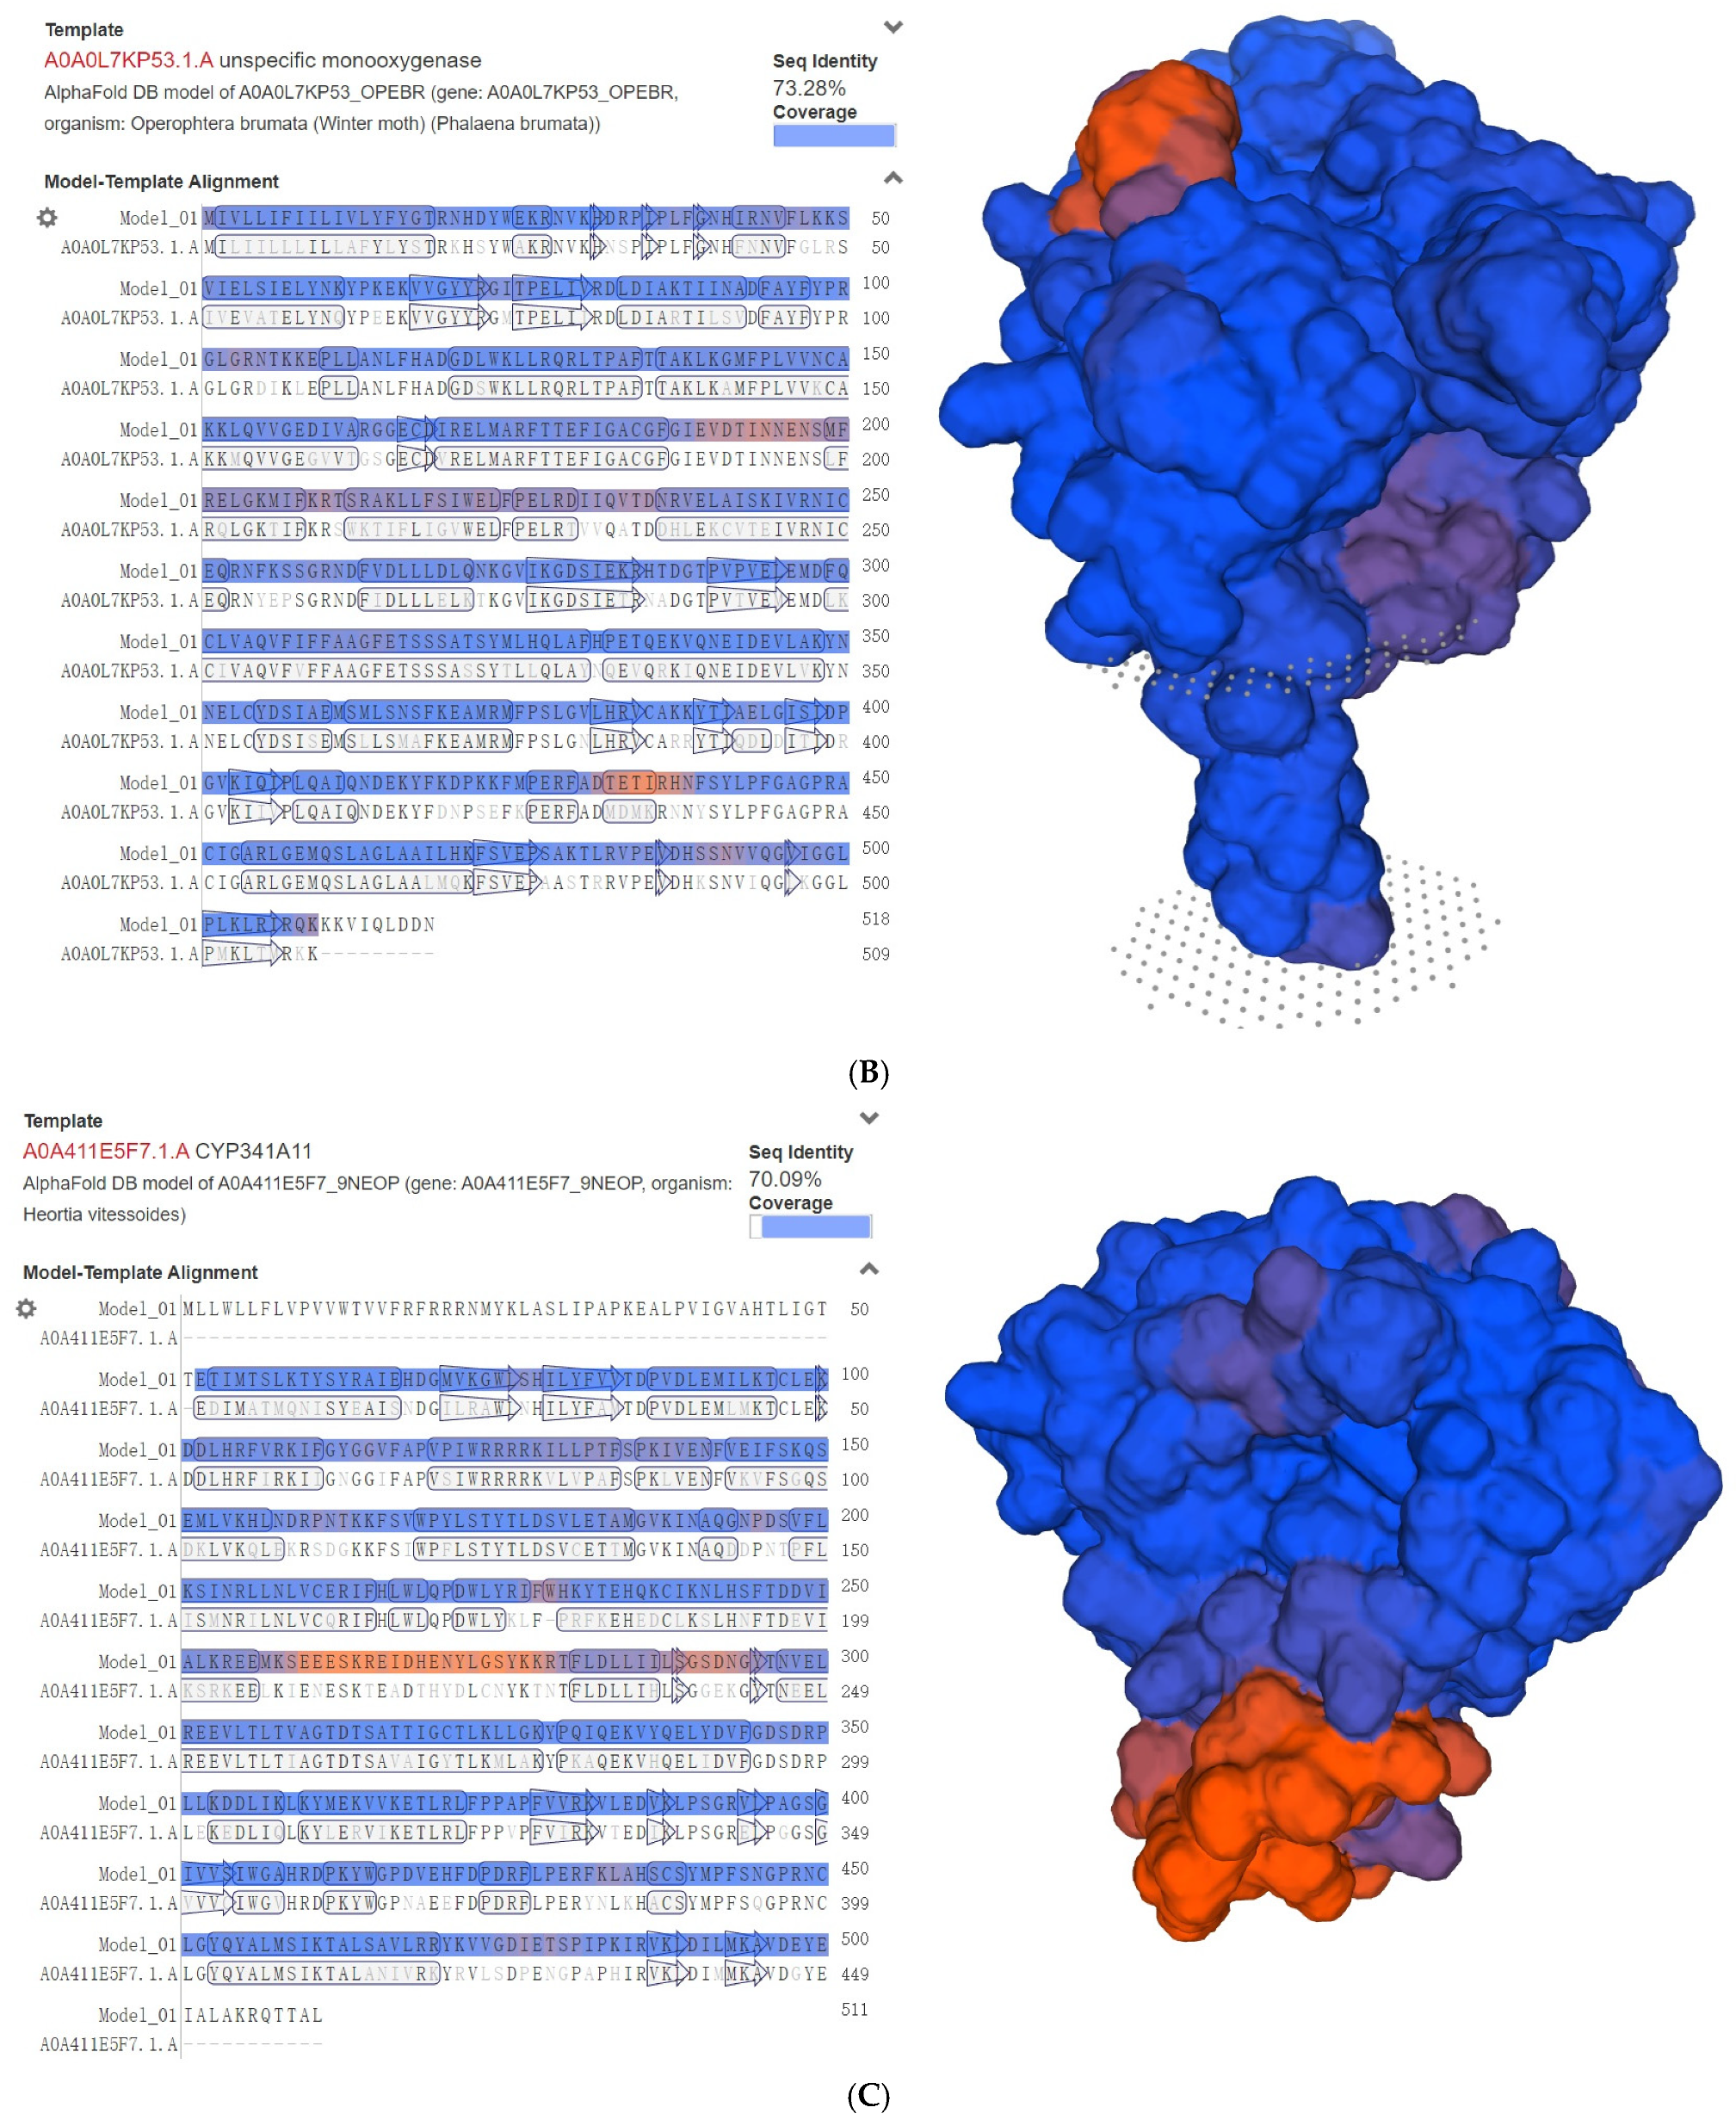
To probe their molecular foundations, we modeled their 3D structures via homology (Figure 9), revealing the classic P450 architecture in each. All three models adopted the canonical, well-conserved globular fold characteristic of cytochrome P450 enzymes, lending structural plausibility to their predicted function. The models for CYP6(09521) and CYP6(04876) were based on templates from other lepidopteran species (Phalera bucephala and Ostrinia furnacalis) with high sequence identity (73.28% and 70.25%, respectively), indicating a reliable structural prediction. Similarly, the CYP4(04803) model was built using a template from Heortia vitessoides with 70.09% identity. The surface-rendered models highlight regions (shown in orange) that correspond to areas of high sequence variability, which typically encompass the substrate recognition sites (SRSs) that define the enzyme’s substrate specificity. The distinct topographies of these regions across the three models may underlie their differential capacities to bind and metabolize a diverse array of insecticide molecules. Collectively, the convergence of robust transcriptional induction, high predictive importance in machine-learning models, and conserved structural architecture provides compelling, multi-faceted evidence that these three P450s are high-priority targets for functional validation and are likely pivotal players in the evolution of insecticide resistance in P. atrilineata.

4. Discussion

This study examined the cytochrome P450 monooxygenase gene family in the mulberry looper, P. atrilineata, an important agricultural pest. Insecticide resistance threatens global food security, making it essential to understand the molecular mechanisms pests employ to detoxify chemicals [25,26]. We combined genomic, transcriptomic, and machine-learning methods to identify the P450 genes in P. atrilineata and determine those involved in broad-spectrum detoxification. These results contribute to understanding metabolic adaptation in this pest and support the development of evidence-based resistance management strategies.
Our systematic re-annotation of the P. atrilineata genome identified a high-confidence set of 70 P450 genes, a number comparable to that found in other lepidopteran pests, such as the rice borer Chilo suppressalis [4,11,27]. The phylogenetic analysis revealed that this gene family is dominated by the CYP6 and CYP4 clans, which together constitute 80% of the entire repertoire. This clan distribution is a well-established evolutionary signature in insects, where the expansion and diversification of the CYP3 and CYP4 clades (to which the insect CYP6 family belongs) are strongly correlated with adaptation to chemical challenges, including both plant allelochemicals and synthetic insecticides [28,29]. A particularly telling finding was the pronounced clustering of these genes on the chromosomes, with a notable tandem array of eight CYP6 genes on chromosome 13. This genomic architecture provides compelling evidence that tandem gene duplication has been the primary evolutionary engine driving the expansion and subsequent functional specialization of the P450 family in P. atrilineata, like in the brown planthopper Nilaparvata lugens [30], equipping it with a versatile enzymatic toolkit to confront diverse xenobiotic threats [31,32].
A key aspect of this study was analyzing the transcriptional responses of P450 genes to insecticide exposure. Principal component analysis (PCA) indicated a consistent response, with the first principal component (PC1) explaining 96.8% of the variance between control and treated samples. This suggests activation of a general detoxification pathway in response to diverse insecticides, including acetylcholinesterase inhibitors and mitochondrial disruptors [33,34,35]. Further examination of gene expression patterns via heatmap analysis showed a selective mechanism. Rather than broad upregulation of all P450 genes, P. atrilineata induced a limited subset, while most genes were downregulated or unchanged [36,37]. A small, specific subset of P450s was powerfully and consistently induced, while the majority of family members were either repressed or unresponsive. Consistent with prior research on P450 genes [4,38,39], these findings indicate an energy-efficient strategy that focuses on specific enzymes for metabolizing various substrates, avoiding the activation of redundant pathways [40,41].
By leveraging supervised machine-learning algorithms, we moved beyond conventional differential expression analysis to identify the most functionally significant P450s with high statistical confidence. The striking convergence of results from Random Forest (RF) and Support Vector Machine (SVM) models with our transcriptomic data provides multi-faceted, robust evidence for the central role of a few key players. Two genes, CYP6(09521) and CYP6(04876), emerged as archetypal “generalist” detoxifiers, exhibiting strong upregulation across all five insecticide treatments and ranking as top biomarkers in both machine-learning models. Their profiles suggest they are central hubs in the insect’s chemical defense system [42,43]. In contrast, CYP4(04803) was strongly induced by four compounds but repressed by phoxim, suggesting specificity to certain substrates and regulated expression. Homology modeling confirmed the typical P450 structure for these proteins, with variations in substrate recognition sites that may account for their differing specificities [40,44,45].
Overall, these findings have implications for sustainable agriculture. The identified P450 genes, including CYP6(09521), CYP6(04876), and CYP4(04803), could be targeted for molecular diagnostics to track resistance alleles in field populations, facilitating early intervention [4,46]. Insights into their generalist and specialist functions may also guide insecticide rotation to minimize cross-resistance and extend the utility of current controls. Future work should validate these genes functionally through RNA interference (RNAi) or CRISPR-Cas9 knockout to assess their contribution to resistance [46,47]. Heterologous expression systems could further characterize their substrate preferences and kinetics against additional insecticides [48,49]. These efforts will help apply our genomic and transcriptomic results to practical pest management.

Supplementary Materials

The following supporting information can be downloaded at: https://www.mdpi.com/article/10.3390/agronomy15112561/s1. Table S1. Multi-evidence annotation of candidate cytochrome P450 genes from the Phthonandria atrilineata proteome.

Author Contributions

Conceptualization, S.Z. and D.G.; methodology, D.G. and J.S.; software, D.G.; validation, D.G., J.S. and Y.Q.; formal analysis, D.G.; investigation, D.G., J.S., Y.Q. and L.X.; resources, S.Z. and X.L.; data curation, D.G.; writing—original draft preparation, D.G.; writing—review and editing, D.G. and S.Z.; visualization, D.G.; supervision, S.Z.; project administration, S.Z.; funding acquisition, S.Z. All authors have read and agreed to the published version of the manuscript.

Funding

This research was funded by the Local Science and Technology Development Fund project guided by the central government (Heke ZY230301), the 2023 Annual Operation Subsidy Project of the Guangxi Key Laboratory of Sericulture Ecology and Applied Intelligent Technology (23-026-08), the Yizhou High-quality Development of Cocoon and Silk Industry Talent Introduction Project (HCZC2024-G3-810273-HZTG). This research was funded by the Special Project of Guangxi Collaborative Innovation Center of Modern Sericulture and Silk (2023GXCSSC04).

Data Availability Statement

The raw RNA-sequencing data generated and analyzed in this study have been deposited in the NCBI Sequence Read Archive (SRA) under BioProject accession number PRJNA1288676 (https://www.ncbi.nlm.nih.gov/bioproject/PRJNA1288676, accessed on 5 October 2025). The reference genome assembly of Phthonandria atrilineata (version GCA_014332785.1) was retrieved from the NCBI GenBank database (https://www.ncbi.nlm.nih.gov/datasets/genome/GCA_014332785.1/, accessed on 5 October 2025).

Acknowledgments

During the preparation of this manuscript, the authors utilized generative AI tools of the Anthropic Claude Sonnet to assist with language editing, improve grammatical accuracy, and enhance the clarity and readability of the text. The AI was not used for data analysis, interpretation, or drawing scientific conclusions. The authors take full responsibility for the content of the manuscript.

Conflicts of Interest

The authors declare no conflicts of interest.

References

  1. Zainab, R.; Hasnain, M.; Ali, F.; Abideen, Z.; Siddiqui, Z.S.; Jamil, F.; Hussain, M.; Park, Y.K. Prospects and challenges of nanopesticides in advancing pest management for sustainable agricultural and environmental service. Environ. Res. 2024, 261, 119722. [Google Scholar] [CrossRef] [PubMed]
  2. Wheeler, W.B. Role of research and regulation in 50 years of pest management in agriculture Prepared for the 50th anniversary of the Journal of Agricultural and Food Chemistry. J. Agric. Food Chem. 2002, 50, 4151–4155. [Google Scholar] [CrossRef] [PubMed]
  3. Joußen, N.; Heckel, D.G. Saltational evolution of a pesticide-metabolizing cytochrome P450 in a global crop pest. Pest Manag. Sci. 2021, 77, 3325–3332. [Google Scholar] [CrossRef] [PubMed]
  4. Hu, B.; Xing, Z.; Dong, H.; Chen, X.; Ren, M.; Liu, K.; Rao, C.; Tan, A.; Su, J. Cytochrome P450 CYP6AE70 Confers Resistance to Multiple Insecticides in a Lepidopteran Pest, Spodoptera exigua. J. Agric. Food Chem. 2024, 72, 23141–23150. [Google Scholar] [CrossRef]
  5. Casida, J.E. Why Prodrugs and Propesticides Succeed. Chem. Res. Toxicol. 2017, 30, 1117–1126. [Google Scholar] [CrossRef]
  6. Guan, D.L.; Qin, Y.C.; Chen, Y.Z.; Zhang, S.H.; Liu, J.P.; Yi, H.Y.; Li, X.D. A high-quality chromosome-level genome assembly of the mulberry looper, Phthonandria atrilineata. Sci. Data 2025, 12, 186. [Google Scholar] [CrossRef]
  7. Guan, D.; Qin, Y.; Song, J.; Qin, Y.; Zhang, S.; Xin, L.; Li, X. Comparative transcriptomics reveal universal and compound-specific mechanisms of insecticide response in the mulberry looper (Phthonandria atrilineata). Genomics 2025, 117, 111121. [Google Scholar] [CrossRef]
  8. Vontas, J.; Katsavou, E.; Mavridis, K. Cytochrome P450-based metabolic insecticide resistance in Anopheles and Aedes mosquito vectors: Muddying the waters. Pestic. Biochem. Physiol. 2020, 170, 104666. [Google Scholar] [CrossRef]
  9. Liu, N.; Li, M.; Gong, Y.; Liu, F.; Li, T. Cytochrome P450s—Their expression, regulation, and role in insecticide resistance. Pestic. Biochem. Physiol. 2015, 120, 77–81. [Google Scholar] [CrossRef]
  10. Lu, K.; Song, Y.; Zeng, R. The role of cytochrome P450-mediated detoxification in insect adaptation to xenobiotics. Curr. Opin. Insect Sci. 2021, 43, 103–107. [Google Scholar] [CrossRef]
  11. Lao, S.H.; Huang, X.H.; Huang, H.J.; Liu, C.W.; Zhang, C.X.; Bao, Y.Y. Genomic and transcriptomic insights into the cytochrome P450 monooxygenase gene repertoire in the rice pest brown planthopper, Nilaparvata lugens. Genomics 2015, 106, 301–309. [Google Scholar] [CrossRef]
  12. Kim, D.; Paggi, J.M.; Park, C.; Bennett, C.; Salzberg, S.L. Graph-based genome alignment and genotyping with HISAT2 and HISAT-genotype. Nat. Biotechnol. 2019, 37, 907–915. [Google Scholar] [CrossRef]
  13. Pertea, M.; Pertea, G.M.; Antonescu, C.M.; Chang, T.C.; Mendell, J.T.; Salzberg, S.L. StringTie enables improved reconstruction of a transcriptome from RNA-seq reads. Nat. Biotechnol. 2015, 33, 290–295. [Google Scholar] [CrossRef]
  14. Katoh, K.; Standley, D.M. MAFFT multiple sequence alignment software version 7: Improvements in performance and usability. Mol. Biol. Evol. 2013, 30, 772–780. [Google Scholar] [CrossRef]
  15. Sohpal, V.K.; Dey, A.; Singh, A. MEGA biocentric software for sequence and phylogenetic analysis: A review. Int. J. Bioinform. Res. Appl. 2010, 6, 230–240. [Google Scholar] [CrossRef]
  16. Xie, J.; Chen, Y.; Cai, G.; Cai, R.; Hu, Z.; Wang, H. Tree Visualization By One Table (tvBOT): A web application for visualizing, modifying and annotating phylogenetic trees. Nucleic Acids Res. 2023, 51, W587–W592. [Google Scholar] [CrossRef]
  17. Chen, C.; Wu, Y.; Li, J.; Wang, X.; Zeng, Z.; Xu, J.; Liu, Y.; Feng, J.; Chen, H.; He, Y.; et al. TBtools-II: A “one for all, all for one” bioinformatics platform for biological big-data mining. Mol. Plant 2023, 16, 1733–1742. [Google Scholar] [CrossRef]
  18. Waterhouse, A.; Bertoni, M.; Bienert, S.; Studer, G.; Tauriello, G.; Gumienny, R.; Heer, F.T.; de Beer, T.A.P.; Rempfer, C.; Bordoli, L.; et al. SWISS-MODEL: Homology modelling of protein structures and complexes. Nucleic Acids Res. 2018, 46, W296–W303. [Google Scholar] [CrossRef] [PubMed]
  19. Li, B.; Dewey, C.N. RSEM: Accurate transcript quantification from RNA-Seq data with or without a reference genome. BMC Bioinform. 2011, 12, 323. [Google Scholar] [CrossRef] [PubMed]
  20. Robinson, M.D.; McCarthy, D.J.; Smyth, G.K. edgeR: A Bioconductor package for differential expression analysis of digital gene expression data. Bioinformatics 2010, 26, 139–140. [Google Scholar] [CrossRef] [PubMed]
  21. Wang, Y.; Zhuang, H.; Jiang, X.H.; Zou, R.H.; Wang, H.Y.; Fan, Z.N. Unveiling the key genes, environmental toxins, and drug exposures in modulating the severity of ulcerative colitis: A comprehensive analysis. Front. Immunol. 2023, 14, 1162458. [Google Scholar] [CrossRef] [PubMed]
  22. Kebede, M.M.; Le Cornet, C.; Fortner, R.T. In-depth evaluation of machine learning methods for semi-automating article screening in a systematic review of mechanistic literature. Res. Synth. Methods 2023, 14, 156–172. [Google Scholar] [CrossRef] [PubMed]
  23. Ito, K.; Murphy, D. Application of ggplot2 to Pharmacometric Graphics. CPT Pharmacomet. Syst. Pharmacol. 2013, 2, e79. [Google Scholar] [CrossRef]
  24. Lyu, F.; Han, F.; Ge, C.; Mao, W.; Chen, L.; Hu, H.; Chen, G.; Lang, Q.; Fang, C. OmicStudio: A composable bioinformatics cloud platform with real-time feedback that can generate high-quality graphs for publication. iMeta 2023, 2, e85. [Google Scholar] [CrossRef] [PubMed]
  25. Ishigami, K.; Jang, S.; Itoh, H.; Kikuchi, Y. Insecticide resistance governed by gut symbiosis in a rice pest, Cletus punctiger, under laboratory conditions. Biol. Lett. 2021, 17, 20200780. [Google Scholar] [CrossRef]
  26. Booth, W. Population genetics as a tool to understand invasion dynamics and insecticide resistance in indoor urban pest insects. Curr. Opin. Insect Sci. 2024, 62, 101166. [Google Scholar] [CrossRef]
  27. Wang, B.; Shahzad, M.F.; Zhang, Z.; Sun, H.; Han, P.; Li, F.; Han, Z. Genome-wide analysis reveals the expansion of Cytochrome P450 genes associated with xenobiotic metabolism in rice striped stem borer, Chilo suppressalis. Biochem. Biophys. Res. Commun. 2014, 443, 756–760. [Google Scholar] [CrossRef]
  28. Xuan, N.; Guo, X.; Xie, H.Y.; Lou, Q.N.; Lu, X.B.; Liu, G.X.; Picimbon, J.F. Increased expression of CSP and CYP genes in adult silkworm females exposed to avermectins. Insect Sci. 2015, 22, 203–219. [Google Scholar] [CrossRef]
  29. Wang, Y.Q.; Li, G.Y.; Li, L.; Song, Q.S.; Stanley, D.; Wei, S.J.; Zhu, J.Y. Genome-wide and expression-profiling analyses of the cytochrome P450 genes in Tenebrionidea. Arch. Insect Biochem. Physiol. 2022, 111, e21954. [Google Scholar] [CrossRef]
  30. Duarte, A.; Pym, A.; Garrood, W.T.; Troczka, B.J.; Zimmer, C.T.; Davies, T.G.E.; Nauen, R.; O’Reilly, A.O.; Bass, C. P450 gene duplication and divergence led to the evolution of dual novel functions and insecticide cross-resistance in the brown planthopper Nilaparvata lugens. PLoS Genet. 2022, 18, e1010279. [Google Scholar] [CrossRef]
  31. Yu, J.; Tehrim, S.; Wang, L.; Dossa, K.; Zhang, X.; Ke, T.; Liao, B. Evolutionary history and functional divergence of the cytochrome P450 gene superfamily between Arabidopsis thaliana and Brassica species uncover effects of whole genome and tandem duplications. BMC Genom. 2017, 18, 733. [Google Scholar] [CrossRef] [PubMed]
  32. Doddapaneni, H.; Chakraborty, R.; Yadav, J.S. Genome-wide structural and evolutionary analysis of the P450 monooxygenase genes (P450ome) in the white rot fungus Phanerochaete chrysosporium: Evidence for gene duplications and extensive gene clustering. BMC Genom. 2005, 6, 92. [Google Scholar] [CrossRef] [PubMed]
  33. Liu, J.; Fernandez, D.; Gao, Y.; Pierre, S.; Gao, Y.; Dai, G. Enzymology, Histological and Ultrastructural Effects of Ar-Turmerone on Culex pipiens pallens Larvae. Insects 2020, 11, 336. [Google Scholar] [CrossRef] [PubMed]
  34. Han, X.; Peng, M.; Zhang, Y.; Wu, P.; Zheng, X.; Zhang, X.; Guo, S.; Ding, Y.; Yang, N.; Li, M.; et al. Transcriptome reanalysis and gene expression of 13 detoxification genes for avermectin and pyridaben resistance in Panonychus citri. Sci. Rep. 2024, 14, 25857. [Google Scholar] [CrossRef]
  35. Gu, Z.; Zhou, Y.; Xie, Y.; Li, F.; Ma, L.; Sun, S.; Wu, Y.; Wang, B.; Wang, J.; Hong, F.; et al. The adverse effects of phoxim exposure in the midgut of silkworm, Bombyx mori. Chemosphere 2014, 96, 33–38. [Google Scholar] [CrossRef]
  36. Ravanfar, R.; Sheng, Y.; Gray, H.B.; Winkler, J.R. Tryptophan-96 in cytochrome P450 BM3 plays a key role in enzyme survival. FEBS Lett. 2023, 597, 59–64. [Google Scholar] [CrossRef]
  37. Doehmer, J.; Goeptar, A.R.; Vermeulen, N.P. Cytochromes P450 and drug resistance. Cytotechnology 1993, 12, 357–366. [Google Scholar] [CrossRef]
  38. Wu, P.; Huang, Y.; Zheng, J.; Zhang, Y.; Qiu, L. Regulation of CncC in insecticide-induced expression of cytochrome P450 CYP9A14 and CYP6AE11 in Helicoverpa armigera. Pestic. Biochem. Physiol. 2023, 197, 105707. [Google Scholar] [CrossRef]
  39. Wang, J.; Ohno, H.; Ide, Y.; Ichinose, H.; Mori, T.; Kawagishi, H.; Hirai, H. Identification of the cytochrome P450 involved in the degradation of neonicotinoid insecticide acetamiprid in Phanerochaete chrysosporium. J. Hazard. Mater. 2019, 371, 494–498. [Google Scholar] [CrossRef]
  40. Katsavou, E.; Riga, M.; Ioannidis, P.; King, R.; Zimmer, C.T.; Vontas, J. Functionally characterized arthropod pest and pollinator cytochrome P450s associated with xenobiotic metabolism. Pestic. Biochem. Physiol. 2022, 181, 105005. [Google Scholar] [CrossRef]
  41. Burns, A.R.; Baker, R.J.; Kitner, M.; Knox, J.; Cooke, B.; Volpatti, J.R.; Vaidya, A.S.; Puumala, E.; Palmeira, B.M.; Redman, E.M.; et al. Selective control of parasitic nematodes using bioactivated nematicides. Nature 2023, 618, 102–109. [Google Scholar] [CrossRef] [PubMed]
  42. Rosli, M.A.F.; Syed Jaafar, S.N.; Azizan, K.A.; Yaakop, S.; Aizat, W.M. Omics approaches to unravel insecticide resistance mechanism in Bemisia tabaci (Gennadius) (Hemiptera: Aleyrodidae). PeerJ 2024, 12, e17843. [Google Scholar] [CrossRef] [PubMed]
  43. Agrawal, A.; Ramasamy, G.G.; Pathak, J.; Nayyar, N.; Muthugounder, M.; Maria, P.; Rai, A.; Thiruvengadam, V. Deciphering the Molecular Mechanisms of Insecticide Resistance From the Transcriptome Data of Field Evolved Spinosad Resistant and Susceptible Populations of Plutella xylostella (Lepidoptera: Plutellidae). J. Econ. Entomol. 2022, 115, 1268–1278. [Google Scholar] [CrossRef] [PubMed]
  44. Pan, D.; Xia, M.; Li, C.; Liu, X.; Archdeacon, L.; O’Reilly, A.O.; Yuan, G.; Wang, J.; Dou, W. CYP4CL2 Confers Metabolic Resistance to Pyridaben in the Citrus Pest Mite Panonychus citri. J. Agric. Food Chem. 2023, 71, 19465–19474. [Google Scholar] [CrossRef]
  45. Nufer, M.I.; Coates, B.S.; Abel, C.A.; O’Neill, P.; McCracken, M.; Jain, D.; Pierce, C.A., 3rd; Glover, J.; Towles, T.; Reddy, G.V.P.; et al. Anatomy of a pest control failure: Introgression of cytochrome P450 337B3 alleles from invasive old-world bollworm into native corn earworm (Lepidoptera: Noctuidae). J. Insect Sci. (Online) 2024, 24. [Google Scholar] [CrossRef]
  46. Siddiqui, J.A.; Fan, R.; Naz, H.; Bamisile, B.S.; Hafeez, M.; Ghani, M.I.; Wei, Y.; Xu, Y.; Chen, X. Insights into insecticide-resistance mechanisms in invasive species: Challenges and control strategies. Front. Physiol. 2022, 13, 1112278. [Google Scholar] [CrossRef]
  47. Kim, Y.H.; Soumaila Issa, M.; Cooper, A.M.; Zhu, K.Y. RNA interference: Applications and advances in insect toxicology and insect pest management. Pestic. Biochem. Physiol. 2015, 120, 109–117. [Google Scholar] [CrossRef]
  48. Ichinose, H.; Hatakeyama, M.; Yamauchi, Y. Sequence modifications and heterologous expression of eukaryotic cytochromes P450 in Escherichia coli. J. Biosci. Bioeng. 2015, 120, 268–274. [Google Scholar] [CrossRef]
  49. Hu, J.; Zhang, Y.; Wu, Y.; Zheng, J.; Yu, Z.; Qian, H.; Yu, J.; Cheng, Z.; Chen, J. Heterologous expression of bacterial cytochrome P450 from Microbacterium keratanolyticum ZY and its application in dichloromethane dechlorination. Environ. Pollut. 2021, 287, 117597. [Google Scholar] [CrossRef]
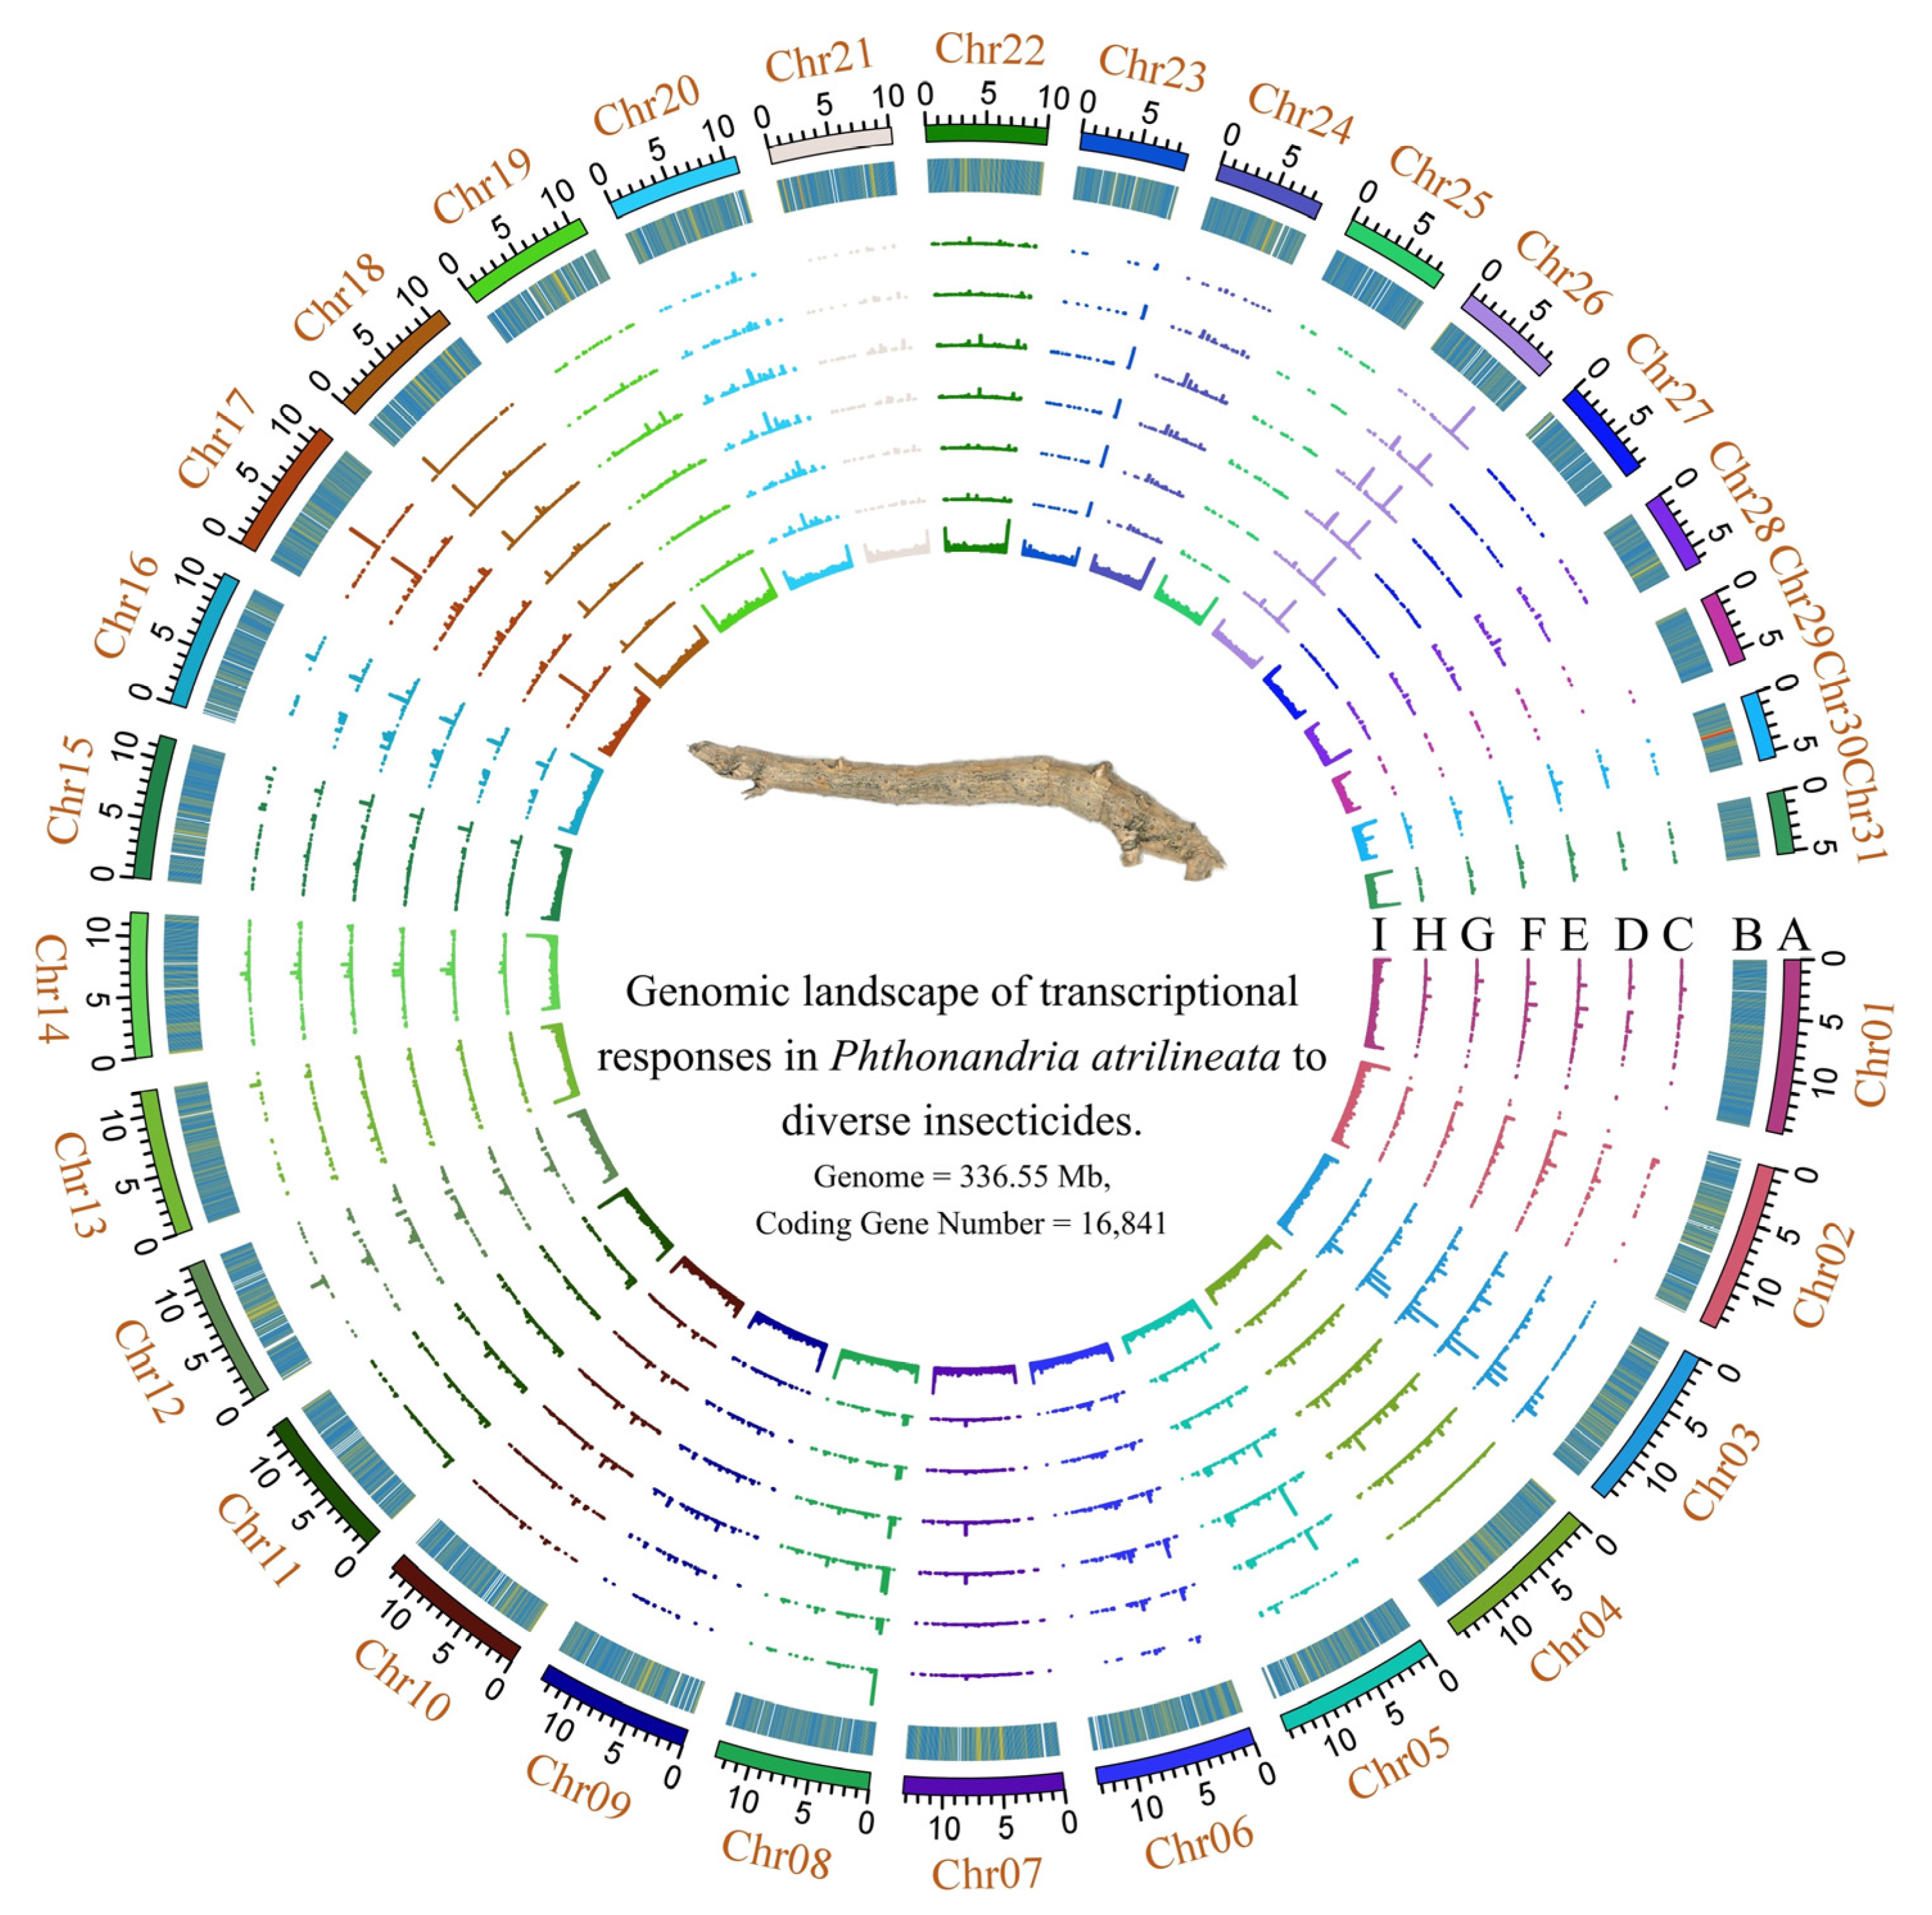
Figure 1. Genomic landscape of transcriptional responses in Phthonandria atrilineata to diverse insecticides. The circular plot illustrates genomic features and expression profiles across the 31 chromosomes (Chr01–Chr31), with chromosome size indicated in megabases (Mb) on the outermost scale. From outside to inside, the tracks represent: (A) Pseudochromosomes; (B) Gene density across the genome, displayed as a heatmap. (CH) Transcriptome-wide gene expression profiles for each treatment group, represented as histograms. The height of the bars corresponds to the gene expression level (TPM value). The tracks correspond to the following treatments: (C) Control, (D) Chlorfenapyr, (E) Tolfenpyrad, (F) Trichlorfon, (G) Trichlorfon–Malathion mixture, and (H) Phoxim. Track (I) represent the GC contents. The central panel displays the updated genome size and the total number of protein-coding genes identified through re-annotation. The image of the P. atrilineata larva is shown in the center.
Agronomy 15 02561 g001
Figure 2. Identification of the cytochrome P450 gene family in P. atrilineata. The Venn diagram illustrates the number of P450 genes identified and the overlap among seven functional annotation sources: Conserved Domain Database (CDD), Pfam, Gene Ontology (GO), PANTHER, Superfamily, and InterPro. Numbers in the intersecting regions represent the count of genes co-identified by the corresponding combination of databases.
Agronomy 15 02561 g002
Figure 3. Chromosomal distribution of the 70 high-confidence cytochrome P450 genes in P. atrilineata. The vertical bars represent the 22 chromosomes containing P450 genes, with the physical scale indicated in megabases (Mb) on the left. The simplified name of each P450 gene is shown at its corresponding physical location on the chromosome. Brackets are used to highlight gene clusters, where multiple P450 genes are located in close physical proximity, indicating potential tandem duplication events. The background shading on the chromosomes reflects the local gene density.
Agronomy 15 02561 g003
Figure 4. Phylogenetic tree of the 70 high-confidence cytochrome P450 genes identified in P. atrilineata. The unrooted tree was constructed using the Unweighted Pair Group Method with Arithmetic Mean (UPGMA) based on the alignment of full-length protein sequences. The four major clades, corresponding to distinct P450 families, are highlighted with different background colors: CYP6 (blue, 38 members), CYP4 (grey, 18 members), CYP24A1 (orange, 11 members), and CYP15A1 (green, 3 members). Numbers at the nodes indicate bootstrap support values derived from 1000 replicates. Gene IDs for each P450 are shown at the tips of the tree branches.
Agronomy 15 02561 g004
Figure 5. Principal Component Analysis (PCA) of P450 gene expression profiles. The plot shows the projection of the 18 transcriptomic samples onto the first two principal components based on the expression levels of 70 P450 genes. Each point represents a biological replicate, with different shapes and colors corresponding to the six treatment groups as indicated in the legend. Convex hulls enclose the samples for each treatment group to visualize within-group variation and between-group separation. The percentage of variance explained by each principal component is shown on the corresponding axis.
Agronomy 15 02561 g005
Figure 6. Heatmap of differentially expressed P450 genes in response to insecticide treatments. The heatmap displays the log2 fold change (log2FC) values for each of the 70 P450 genes (rows) across the five insecticide treatments (columns) relative to the control. The color scale indicates the magnitude of upregulation (red/yellow), downregulation (blue), or no significant change (green). Genes are clustered hierarchically based on the similarity of their expression profiles across treatments, with the dendrogram shown on the left. Gene names are indicated on the right.
Agronomy 15 02561 g006
Figure 7. Identification of key P450 biomarkers using Random Forest analysis. The panel on the right displays the top 20 most important P450 genes ranked by Mean Decrease Accuracy, a metric that quantifies how much each gene contributes to the model’s ability to correctly classify insecticide-treated samples. The color in each cell indicates the gene’s expression level in that specific condition. The panel on the left shows the corresponding expression heatmap (log2FC values) for these 20 key genes, visualizing their expression patterns across the different treatments. The gene names link the two panels. The colors of the bars correspond to the Mean Decrease Accuracy value, creating a visual gradient from the most important genes to the least important.
Agronomy 15 02561 g007
Figure 8. Identification of a Core Set of P450 Genes for Generalist Detoxification using SVM Analysis. The figure displays the results of a Support Vector Machine (SVM) analysis on P450 genes upregulated in all insecticide treatments. The heatmap on the left shows the relative importance of each gene across the control and five insecticide treatments, with values represented as row-wise Z-scores (Red: high importance; Blue: low importance). Genes are clustered hierarchically based on their importance profiles. The bar chart on the right indicates the statistical significance (FDR value) of each gene’s contribution to discriminating between treated and control samples.
Agronomy 15 02561 g008
Figure 9. Homology models of the three top-candidate P450 proteins implicated in broad-spectrum insecticide resistance. The tertiary structures of the three P450s identified as key potential effectors through integrated transcriptomic and machine-learning analyses were predicted. All models display the canonical P450 fold. The colors on the surface represent the local sequence identity when compared to the template structure. Regions of higher variability, potentially encompassing the substrate recognition sites that determine catalytic specificity, are highlighted in orange. (A) Model of CYP6(09521), built using the AlphaFold model of an unspecific monooxygenase from Phalera bucephala (A0A0L7KP53.1) as a template (73.28% sequence identity). (B) Model of CYP4(04803), based on the template of CYP341A11 from H. vitessoides (A0A411E5F7.1, 70.09% identity). (C) Model of CYP6(04876), based on the template of an unspecific monooxygenase from O. furnacalis (A0A7S9GM66.1, 70.25% identity).
Agronomy 15 02561 g009aAgronomy 15 02561 g009b
Disclaimer/Publisher’s Note: The statements, opinions and data contained in all publications are solely those of the individual author(s) and contributor(s) and not of MDPI and/or the editor(s). MDPI and/or the editor(s) disclaim responsibility for any injury to people or property resulting from any ideas, methods, instructions or products referred to in the content.