Article

Global Transcriptome and WGCNA Analysis Uncover Cultivar-Specific Molecular Signatures Associated with Low-Temperature Germination in Brassica napus L.

Key Laboratory of Germplasm Innovation and Genetic Improvement of Grain and Oil Crops (Co-Construction by Ministry and Province), Ministry of Agriculture and Rural Affairs, Crop Breeding and Cultivation Research Institute, Shanghai Academy of Agricultural Sciences, Shanghai 201403, China
*
Author to whom correspondence should be addressed.
Agronomy 2025, 15(11), 2529; https://doi.org/10.3390/agronomy15112529
Submission received: 30 September 2025 / Revised: 23 October 2025 / Accepted: 26 October 2025 / Published: 30 October 2025
(This article belongs to the Special Issue Resistance-Related Gene Mining and Genetic Improvement in Crops)

Abstract

Low-temperature stress inhibits seed germination in rapeseed. Nonetheless, the continuous dynamic changes in seed germination under low-temperature stress, particularly at the transcriptome level, remain poorly understood. In this study, two rapeseed lines with contrasting LTG phenotypes—HY7201 (cold-tolerant) and HY3404 (cold-sensitive)—were subjected to transcriptome analysis. In total, we identified 76,996 DEGs across 18 groups, with a greater number of DEGs detected in HY7201 compared to HY3404. Additionally, genes related to antioxidative metabolism were specifically upregulated in HY7201. Furthermore, WGCNA identified 29 hub candidate genes associated with specific time points. Gene expression changes during LTG were most pronounced between 18 and 96 h. The average fold change relative to the control was 4.74. Among these genes, some exhibited particularly high fold changes, such as LOC106407757 (HERK1) and LOC106437922 (FER), which were upregulated 11.6-fold at 24 h and 35.4-fold at 18 h, respectively. Finally, 17 key candidate genes specifically expressed in the two lines were identified. Among these, BnaRGL2 was of particular interest, as it is predicted to interact with ABI3 to modulate LTG through GA and ABA signaling pathways. The findings provide valuable insights for breeders aiming to utilize rapeseed germplasm resources to advance low-temperature resistance breeding.

1. Introduction

Rapeseed (Brassica napus L.) is one of the most important vegetable oil crops worldwide, and China is the second-largest producer of global seed production (FAO, 2023) [1]. In China, rapeseed oil is an important source of sustainable edible oil, playing a significant role in ensuring the security of edible oil supply and the stable development of the market economy [2,3]. With advancements in technology and rising labor costs, direct seeding has replaced the traditional transplanting method and has become an increasingly popular approach for cultivating rapeseed [4]. However, in recent years, due to conflicts arising from crop stubble management in the rice (Oryza sativa L.)–rapeseed rotation system, the sowing date of rapeseed in the Yangtze River Basin has been delayed [5,6]. This delay exposes the germination stage of rapeseed under direct seeding cultivation to low-temperature stress, ultimately leading to reduced rapeseed yields.
The optimal temperature range for the germination of rapeseed seeds is between 15 °C and 25 °C [7]. Rapeseed is sensitive to low temperatures below approximately 10 °C during the germination period [8,9]. Low temperatures can cause slow and asynchronous seed germination, resulting in poor stand establishment and irregular maturation [10]. Cold stress reduces membrane fluidity in plant cells, disrupts protein stability, inhibits enzyme activities, and affects gene expression and protein biosynthesis [11,12]. Therefore, it is necessary to identify genotypes with rapid germination to increase the likelihood of stable rapeseed yield production in highly unpredictable environments. This can be achieved through the genetic improvement of seed germination under low-temperature conditions. Currently, research on low-temperature germination in rapeseed is progressing relatively slowly.
Low-temperature germination (LTG) is a complex agronomic trait that varies greatly among rapeseed cultivars. Ten LTG-related quantitative trait loci (QTLs) have been detected through biparental mapping using pairs of rapeseed cultivars or by genome-wide association studies (GWASs) [8,9] (Table S1). However, to date, candidate genes have not been functionally validated. In contrast, LTG research in rice and maize has progressed further, dozens of QTLs have been identified, and several genes have been verified, such as ZmDREB1A and OsSAP16 [13,14,15]. Rapeseed, however, lacks functional verification and regulatory mechanism analysis. The lag may be due to rapeseed’s allopolyploid genome and the presence of numerous gene copies, which complicate genetic studies and hinder progress. Therefore, further exploration of genes associated with LTG in rapeseed is necessary.
Transcriptomic analysis serves as a robust approach for the rapid identification of genes implicated in abiotic stress tolerance and the elucidation of associated signaling pathways, thereby providing insights into the intricate regulatory networks governing these responses [16,17]. Since the publication of the de novo genome assembly of the ZS11 rapeseed cultivar in 2017, substantial progress has been made in understanding rapeseed’s responses to various abiotic stresses, including drought, salinity, and low-temperature stress [18,19,20,21]. Transcriptome sequencing of rapeseed, utilizing the reference genome of ZS11 as a scaffold for transcriptome assembly, has become a widely adopted methodology [19,20]. Several investigations have demonstrated that employing both de novo transcriptome assembly and reference genome-guided assembly yields a more comprehensive dataset, facilitating an unbiased interpretation of transcriptomic data [22,23]. The preference for reference-based transcript assembly in rapeseed research is likely attributable to its enhanced accuracy and the representativeness of ZS11 as a semi-winter ecotype, which predominates in China.
In the context of low-temperature stress, Luo et al. (2019) identified 37,823 differentially expressed genes (DEGs) and revealed that key hub genes associated with LTG are involved in phytohormone regulation, signal transduction, the pentose phosphate pathway, lipolytic lipid metabolism, and various transcription factor families, including WRKY, bZIP, EFR, ERF, B3, DREB, NAC, and ERF, as determined through weighted gene co-expression network analysis [21]. Similarly, Song et al. (2023) reported 951 DEGs and 86 differentially accumulated metabolites (DAMs) in two hybrid rapeseed varieties, highlighting five DEGs (LOC_106442643, LOC_106396142, LOC_106447906, LOC_106346620, MSTRG.48536) as critical genes associated with LTG, primarily linked to carbohydrate and amino acid metabolism pathways, notably glutathione metabolism and starch and sucrose metabolism [24]. Furthermore, Wang et al. (2025) proposed that BnaA3.CYP77A4 and BnaA3.NAC078 represent promising candidate genes for LTG based on their expression profiles and haplotype distributions, as revealed by integrated transcriptome sequencing and genome-wide association studies (GWASs) [25]. Nonetheless, these studies have predominantly concentrated on two or three discrete time points during low-temperature exposure, thereby lacking continuous dynamic monitoring and a comprehensive analysis of the mechanisms underlying low-temperature tolerance across diverse rapeseed genotypes.
In the present study, two rapeseed inbred lines, HY3404 (cold-sensitive) and HY7201 (cold-tolerant), screened from 159 inbred lines that were provided by the Shanghai Academy of Agricultural Sciences (SAAS), were used for transcriptome sequencing. Sampling was conducted at ten distinct time points during early germination under low-temperature conditions. The primary objective was to delineate the specific regulatory networks involved in germination and to identify candidate genes potentially responsible for rapid germination under low-temperature stress. The findings contribute to a more comprehensive understanding of the intrinsic mechanisms underlying LTG responses and provide deeper insights into the regulatory pathways governing rapeseed seed germination under cold stress. Moreover, this research offers practical implications for the genetic enhancement of rapeseed seed vigor, thereby supporting the advancement of direct-seeded rapeseed cultivation systems.

2. Materials and Methods

2.1. Plant Materials and Growth Conditions

Two rapeseed inbred lines, ‘HY3404’, which is sensitive to low temperatures, and ‘HY7201’, which is tolerant to low temperatures, were used in this study. Both HY7201 and HY3404 were developed by the Shanghai Academy of Agricultural Sciences (SAAS, Shanghai, China). These stable homozygous inbred lines were derived through multiple generations of self-pollination from distinct hybrid combinations. HY7201 is characterized as a double-low rapeseed line with yellow-brown seeds, while HY3404 is also a double-low rapeseed line but produces black seeds. Both lines belong to the semi-winter ecotype. To accurately assess the germination phenotypes of these two inbred lines, they were cultivated and harvested together under natural field conditions at the research base of the Shanghai Academy of Agricultural Sciences (30.88° N, 121.38° E, Shanghai, China).

2.2. LTG Treatments and Sample Collection

Plump seeds of uniform size from two inbred lines were selected and germinated in Petri dishes (90 × 90 mm) containing two layers of sterilized, wet filter paper at the bottom, with 10 mL of double-distilled water (ddH2O) added to each dish. The germination experiment was conducted in a Thermo Scientific Precision Model 818 Incubator (PR505750L, Thermo Scientific Co., Ltd. Marietta, USA) at either 25 °C (normal temperature) or 8 °C (low temperature) under dark conditions. The relative humidity in the growth chamber/incubator was maintained at 80% ± 5%. Temperature stress was applied throughout the entire imbibition and germination process. The percentage of germination of two rapeseed lines were tested at various time points: 0 h, 24 h, 48 h, and 72 h at 25 °C; and 0 h, 24 h, 48 h, 72 h, 96 h, 120 h, 144 h, and 168 h at 8 °C. Seed germination was defined as the radicle extending to two-thirds of the seed length. The lengths of the hypocotyl and root of the seedling at 72 h at 25 °C and 15 days at 8 °C were measured by ImageJ 1.53k. Samples for RNA sequencing were collected at 0 h, 3 h, 6 h, 9 h, 12 h, 18 h, 24 h, 48 h, 72 h, and 96 h after imbibition at 8 °C. All samples were placed in microtubes, immediately frozen in liquid nitrogen, and stored for transcriptome analysis.

2.3. RNA Sequencing and Identification of DEGs

Total RNA was extracted following the protocol provided with the RNAprep Pure Plant Kit (DP432, TianGen Co. Ltd., Beijing, China). Total RNA was isolated from whole seeds of HY3404 and HY7201 subjected to low-temperature treatment at 0, 3, 6, 9, 12, 18, 24, 48, 72, and 96 h. At each time point, three biological replicates were collected, resulting in a total of 60 samples for RNA sequencing. RNA-seq was performed using the HiSeq™ 2000 (Illumina, San Diego, CA, USA) at Personal Biotechnology Co., Ltd. (Shanghai, China). Raw sequencing data were processed with Fastp [26] to remove low-quality reads. The remaining high-quality reads were aligned to the Brassica napus ZS11_V2.0 genome assembly using HISAT2 (v2.1.0) [27]. The read counts were obtained from the alignment results using HTSeq v0.9.1 [28] and normalized to fragments per kilobase of transcript per million mapped reads (FPKMs) using a custom Perl script.
Differentially expressed genes (DEGs) were screened across eighteen comparison groups: HY3404_0h vs. HY3404_3h (V1_3H), HY3404_0h vs. HY3404_6h (V1_6H), HY3404_0h vs. HY3404_9h (V1_9H), HY3404_0h vs. HY3404_12h (V1_12H), HY3404_0h vs. HY3404_18h (V1_18H), HY3404_0h vs. HY3404_24h (V1_24H), HY3404_0h vs. HY3404_48h (V1_48H), HY3404_0h vs. HY3404_72h (V1_72H), HY3404_0h vs. HY3404_96h (V1_96H), HY7201_0h vs. HY7201_3h (V2_3H), HY7201_0h vs. HY7201_6h (V2_6H), HY7201_0h vs. HY7201_9h (V2_9H), HY7201_0h vs. HY7201_12h (V2_12H), HY7201_0h vs. HY7201_18h (V2_18H), HY7201_0h vs. HY7201_24h (V2_24H), HY7201_0h vs. HY7201_48h (V2_48H), HY7201_0h vs. HY7201_72h (V2_72H), and HY7201_0h vs. HY7201_96h (V2_96H) by using DESeq2 (v1.38.3) [29]. Multiple testing correction was performed using the false discovery rate method. DEGs were defined by thresholds of |log2 fold change (FC)| ≥ 1 and a p-value < 0.05.

2.4. qRT-PCR Analysis

To verify the accuracy of the RNA-seq data, twelve genes were randomly selected for qRT-PCR analysis (Table S2), and primers were designed using DNAMAN 6.0. BnaACTIN7 (BnaC02G0037200ZS) served as the internal reference gene to normalize the results [30]. Gene transcript abundance was calculated using the 2−ΔΔCt method, with three independent biological replicates performed.

2.5. GO and KEGG Pathway Enrichment Analysis

TopGO (v2.50.0) was used for Gene Ontology (GO) enrichment analysis. p-values were calculated using the hypergeometric distribution method, with a significance threshold set at p < 0.05. GO terms significantly enriched among differentially expressed genes (all, upregulated, or downregulated) were identified to determine the primary biological functions of these genes. Additionally, KEGG pathway enrichment analysis was performed using the Cluster Profiler package (v4.6.0) [31], focusing on pathways significantly enriched at p < 0.05.

2.6. Coexpression Network Analysis for Construction of Modules

Weighted gene co-expression network analysis (WGCNA) is a systems biology method used to describe correlation patterns among genes across multiple samples. This method identifies modules of highly correlated genes and associates these modules with external sample traits. Co-expression networks were constructed separately for the 5000 genes with the highest expression abundance in HY3404 and HY7201 using the WGCNA package [32]. The intramodular connectivity of each gene was calculated, and genes with a high degree of connectivity were considered, which might be considered to be potentially important. The networks were visualized using Cytoscape 3.10.3 [33].

2.7. PPI-Network of BnaRGL2

The potential interaction network involving BnaRGL2 was retrieved from the STRING database (https://string-db.org/, accessed on 23 September 2025). The STRING database includes protein–protein interaction (PPI) information for Brassica napus. Using the DELLA protein as the candidate gene, PPI pairs with differentially expressed genes and a confidence score greater than 0.4 were directly extracted based on the results of gene differential expression analysis. The protein interaction network was then constructed using Cytoscape 3.10.3.

2.8. Multiple Sequence Alignment and 3D Protein Structure

The multiple sequence alignment was performed using MEGA 7 and visualized with ESPript 3.0 [34]. Conserved domain analysis was conducted using SMART v 9.0 [35]. The 3D protein structure was predicted using the SWISS-MODEL interactive web server (https://swissmodel.expasy.org, accessed on 23 September 2025) [36].

3. Results

3.1. Morphological Analysis of Two Rapeseed Genotypes with Contrasting LTG

Two rapeseed lines, HY3404 and HY7201, were selected to investigate the effects of normal temperature (25 °C) and low temperature (8 °C) on seed germination. Phenotypic characterization revealed that HY3404 seeds possessed a black seed coat, whereas HY7201 seeds exhibited a yellow-brown mixed seed coat. Under normal temperature conditions (25 °C), no significant differences were observed between the two genotypes in terms of germination rates, hypocotyl length, or root length at 72 h (Figure 1A–C). Both lines achieved near 100% final germination rates at this time point, indicating comparable seed vigor, high germination potential, and low dormancy under optimal conditions.
In contrast, under low temperature treatment (8 °C), a significant divergence in germination percentage was detected (Figure 1D). Germination percentages were recorded at multiple time points (0, 24, 48, 72, 96, 120, 144, and 168 h) for both lines. Radicle emergence in HY7201 was first observed at 96 h, whereas HY3404 exhibited minimal radicle emergence throughout the entire germination period, extending up to 15 days (Figure 1D). From 120 h onward, HY7201 consistently demonstrated significantly higher germination percentages compared to HY3404 at all measured intervals (Figure 1D,E). Notably, after 144 h, the germination rate of HY7201 approached levels comparable to those observed under normal temperature, while HY3404 remained largely ungerminated. After 15 days, HY3404 exhibited only 6% germination, in stark contrast to the 100% seedling emergence observed in HY7201. Additionally, significant differences in hypocotyl and root lengths were noted between the two genotypes under low temperature conditions (Figure 1F). These results collectively indicate that HY7201 exhibits markedly enhanced germination speed and higher germination rates under low temperature stress compared to HY3404, suggesting that HY7201 possesses greater cold tolerance during the germination stage.
Given that HY7201 seeds commenced germination after 96 h, with the emergence of tissues such as the embryonic root alongside the seeds—indicative of post-germination development—our investigation concentrated on the effects of time points preceding 96 h on the ultimate seed germination rate under low-temperature conditions. We assessed the water uptake rate at ten intervals between 0 and 96 h and observed that HY7201 demonstrated a more rapid water uptake compared to HY3404 (Figure 1G), irrespective of whether the temperature was low or normal. Specifically, at 8 °C, HY7201 exhibited a significantly higher water uptake rate than HY3404 at 3 h (p = 0.026); however, by 12 h, the water uptake rates of both genotypes converged. These temporal variations in intrinsic genetic factors have thus garnered considerable interest in our study.

3.2. Global Transcriptome Analysis on LTG in Two Rapeseed Varieties with Contrasting Seed Germination Characteristics

Transcriptome analysis of different stages of seed germination in Brassica napus cultivars under low temperature, which differ in their germination rate and speed (Figure 1D–F), can provide crucial system-level insights into the molecular mechanisms underlying low-temperature germination (LTG). To investigate the dynamics of gene expression patterns during seed germination under low temperature, we performed RNA-seq experiments using total RNA isolated from ten time points (0 h, 3 h, 6 h, 9 h, 12 h, 18 h, 24 h, 48 h, 72 h, and 96 h) of germinating seeds from both rapeseed varieties, HY3404 and HY7201. All samples were analyzed in three independent biological replicates (60 samples in total). After filtering out rRNAs and low-quality reads, more than 2.95 billion clean reads (an average of ~49 million reads per sample) were generated for each of the HY3404 and HY7201 cultivars from the 60 samples (Table S3) and mapped to the reference genome of Brassica napus var. ZS11 v2.0 using HISAT2. For these clean reads, the average mapping rate per sample ranged from 86.6% to 95.3% (Table S3).
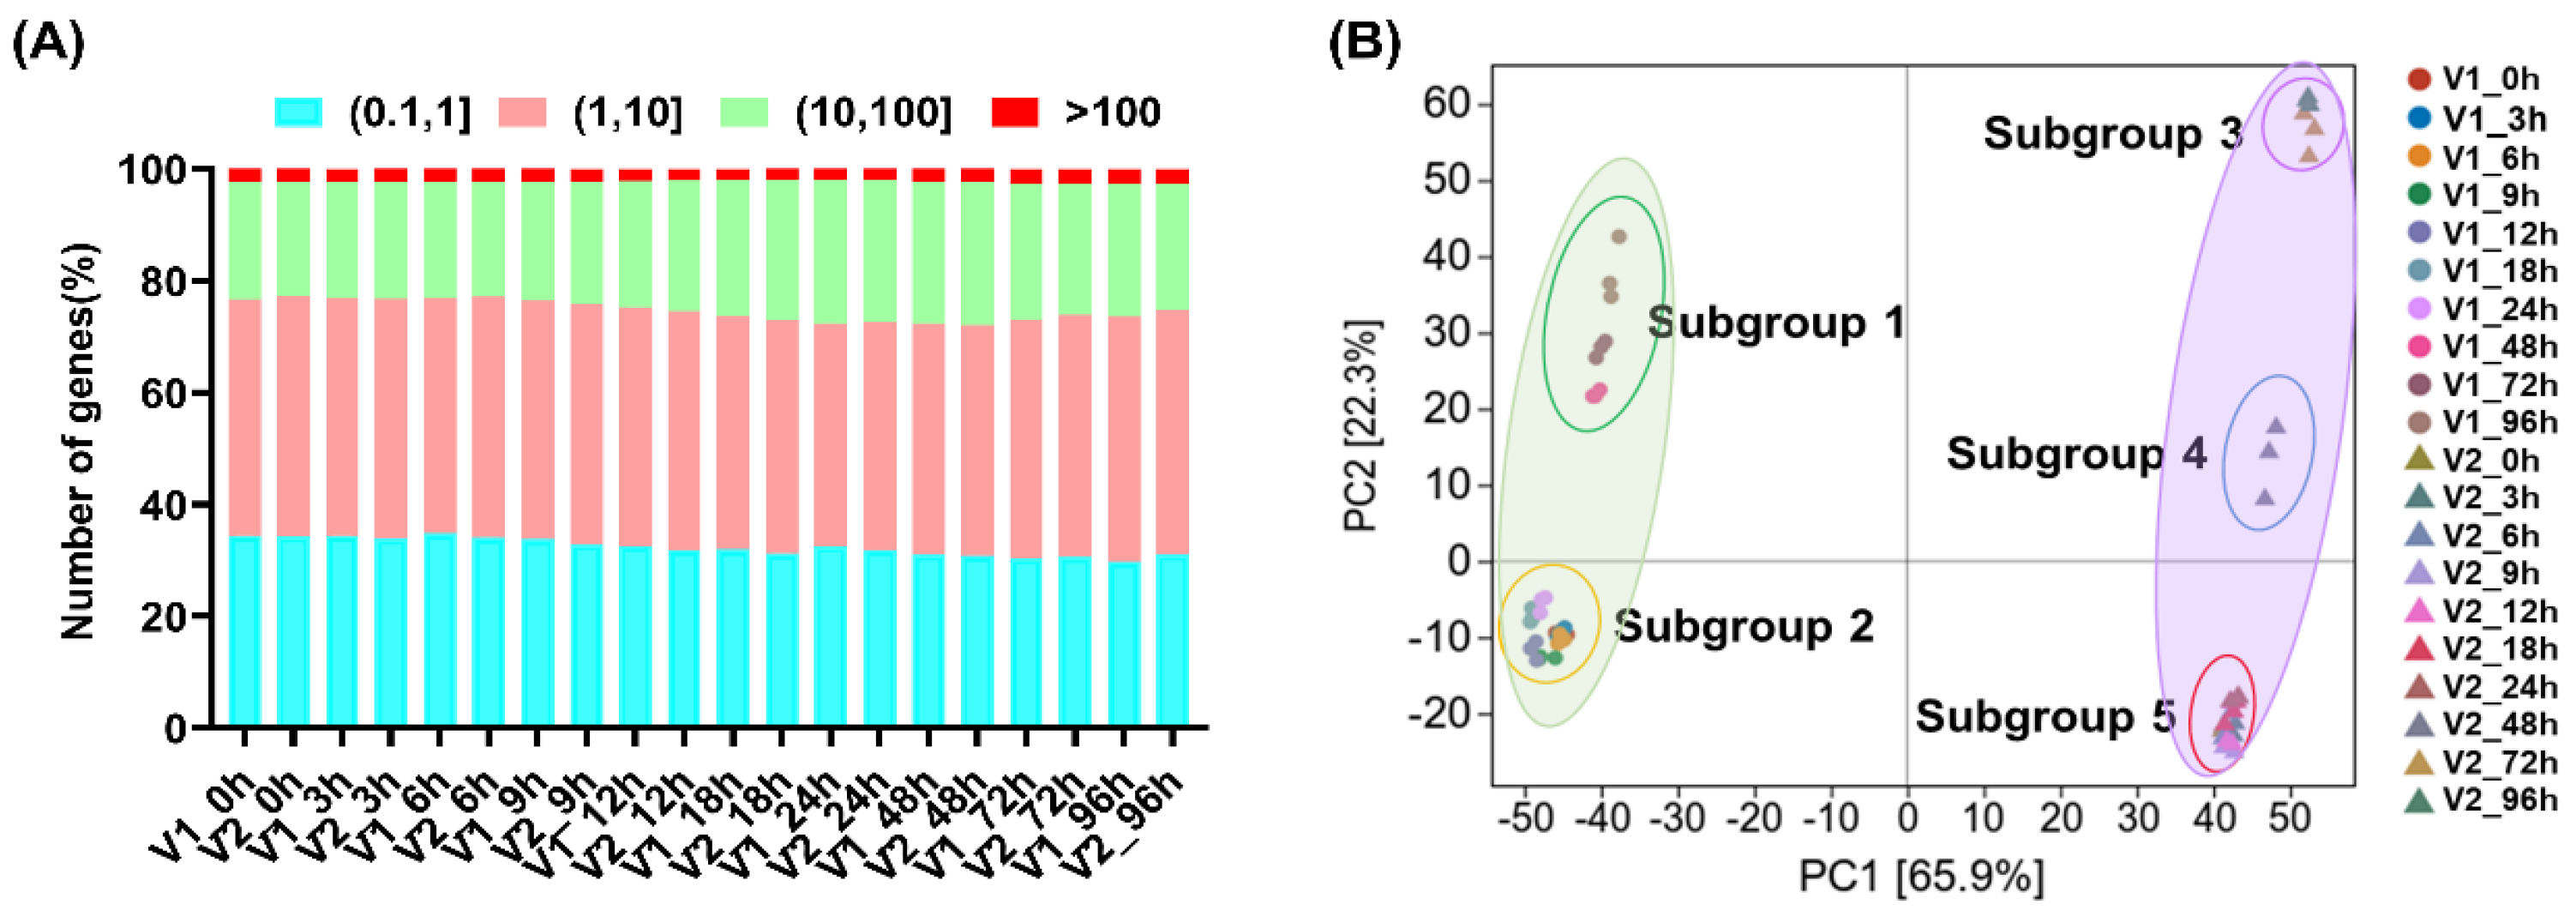
In total, we detected 76,996 known genes and 25,651 novel genes across all 60 samples. Approximately 20.3–25.6% of genes exhibited high levels (10 < FPKM ≤ 100), while 1.9–2.8% of genes showed very high expression levels (FPKM > 100) at the various time points analyzed (Figure 2A). The number of genes with very high (FPKM > 100), high (10 ≤ FPKM < 100), moderate (1 ≤ FPKM < 10), and low (0.01 ≤ FPKM < 1) expression was consistent across all time points (Figure 2A). Notably, the greatest number of genes exhibited very high expression at 72 and 96 h in both cultivars. Overall, these analyses demonstrated sufficient transcriptome coverage during seed germination under low-temperature conditions in rapeseed cultivars.
qRT-PCR analysis was performed to validate the quality of the RNA-Seq data. Twelve genes were randomly selected for qRT-PCR analysis. The expression profiles of these genes, as revealed by qRT-PCR, were similar to those observed in the RNA-Seq data. The correlation coefficient (R) between the RNA-Seq and qRT-PCR analyses was ≥0.70 for all genes tested (Figure S1), indicating the reliability of our transcriptomic profiling data.
To investigate global differences in transcriptome dynamics during LTG in the HY3404 and HY7201 cultivars, we performed principal component analysis (PCA) on the FPKM values of all expressed genes across 60 samples (Figure 2B). The PCA results revealed that the 60 samples could be clearly divided into two groups corresponding to ‘HY3404’ and ‘HY7201’, as well as five subgroups (Figure 2B). The two varieties, which differ in low-temperature tolerance, were separated along the first principal component (PC1) (Figure 2B). According to the PCA score plot, the early stages of LTG—comprising seven time points (0 h, 3 h, 6 h, 9 h, 12 h, 18 h, and 24 h)—showed strong correlation within each cultivar, indicating high similarity in their transcriptional programs. The late stages of LTG (72 h and 96 h) also exhibited close correlation within each cultivar. Interestingly, the clustering of the 48 h time point differed markedly between HY3404 and HY7201: the 48 h sample of HY3404 clustered closely with the late stages (72 h and 96 h), whereas the 48 h sample of HY7201 formed a distinct group, separate from the 72 h and 96 h samples (Figure 2B). This observation suggests that HY7201 progresses more rapidly during the early stages of LTG compared to HY3404, consistent with their respective low-temperature germination phenotypes. Additionally, the PCA showed that the three biological replicates for each germination time point clustered tightly, indicating high reproducibility and data quality (Figure 2B).

3.3. Identification of Genes with Differential Expression in LTG

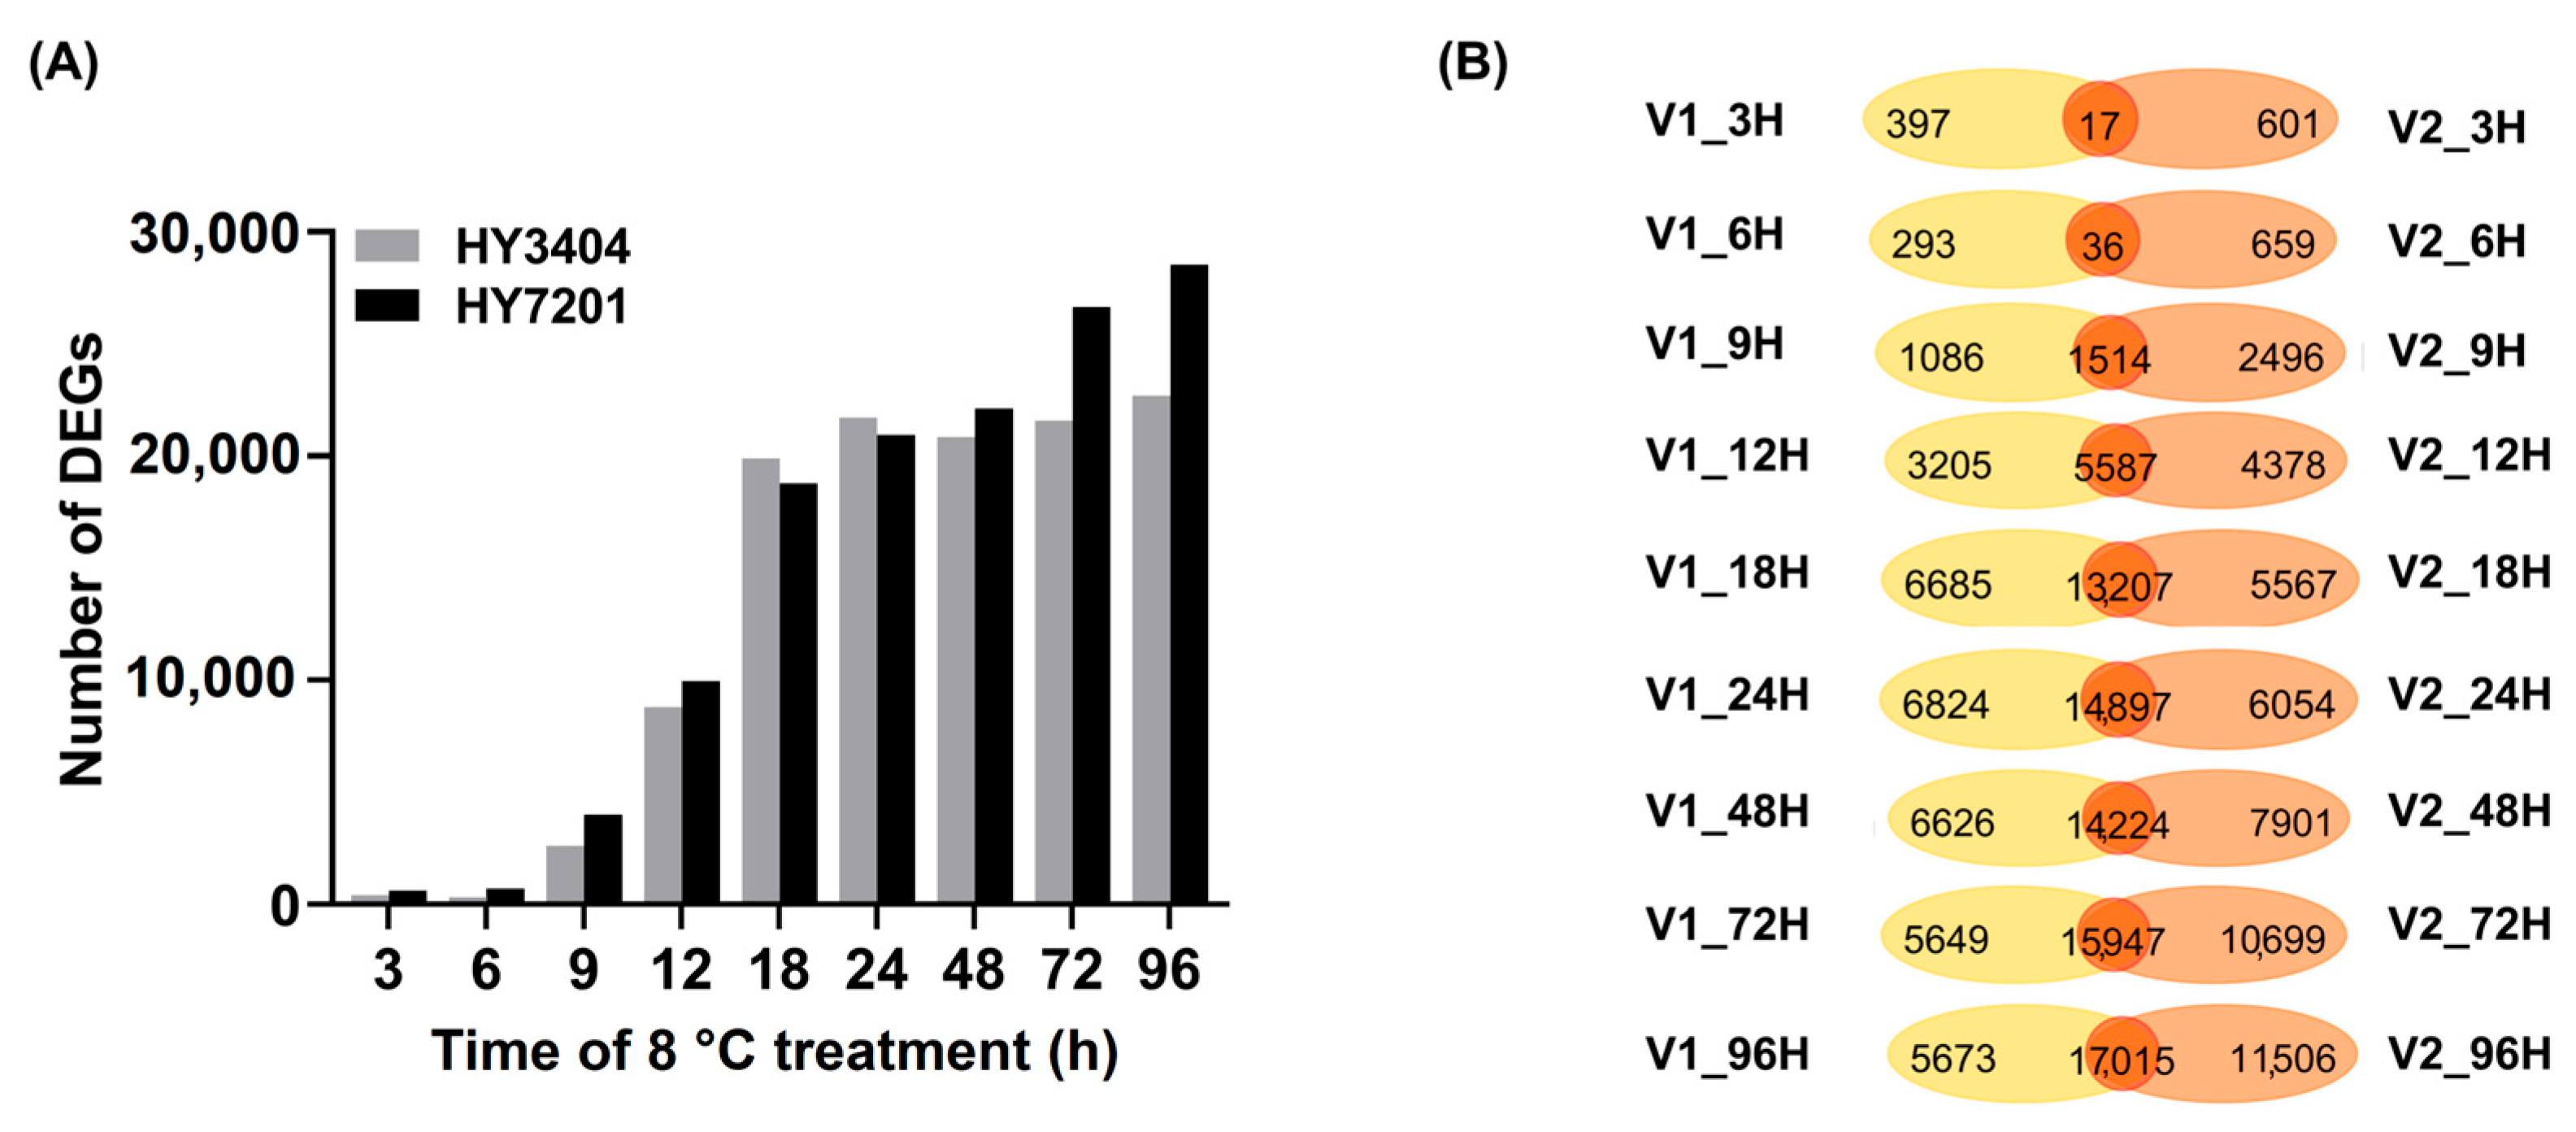
To determine the transcriptional differences characterizing various stages of LTG in both cultivars, we identified preferentially or specifically expressed genes using threshold criteria of a log2 fold change (FC) ≥ 1 and a p-value < 0.05 at each LTG time point for both cultivars. For this analysis, the earliest time point (0 h) in each paired group was defined as the control sample for subsequent comparisons. Over time, the number of differentially expressed genes (DEGs) gradually increased in both rapeseed varieties during germination, particularly in the line ‘HY7201’ (Figure 3A, Table S4). Notably, the number of DEGs in ‘HY7201’ was significantly higher than in ‘HY3404’ at 3 h, 6 h, 9 h, 12 h, 48 h, 72 h, and 96 h, whereas fewer DEGs were identified in ‘HY7201’ compared to ‘HY3404’ at 18 h and 24 h (Figure 3A, Table S4). The findings suggest that gene expression in the ‘HY7201’ seed exhibited more pronounced alterations throughout the low-temperature germination process.
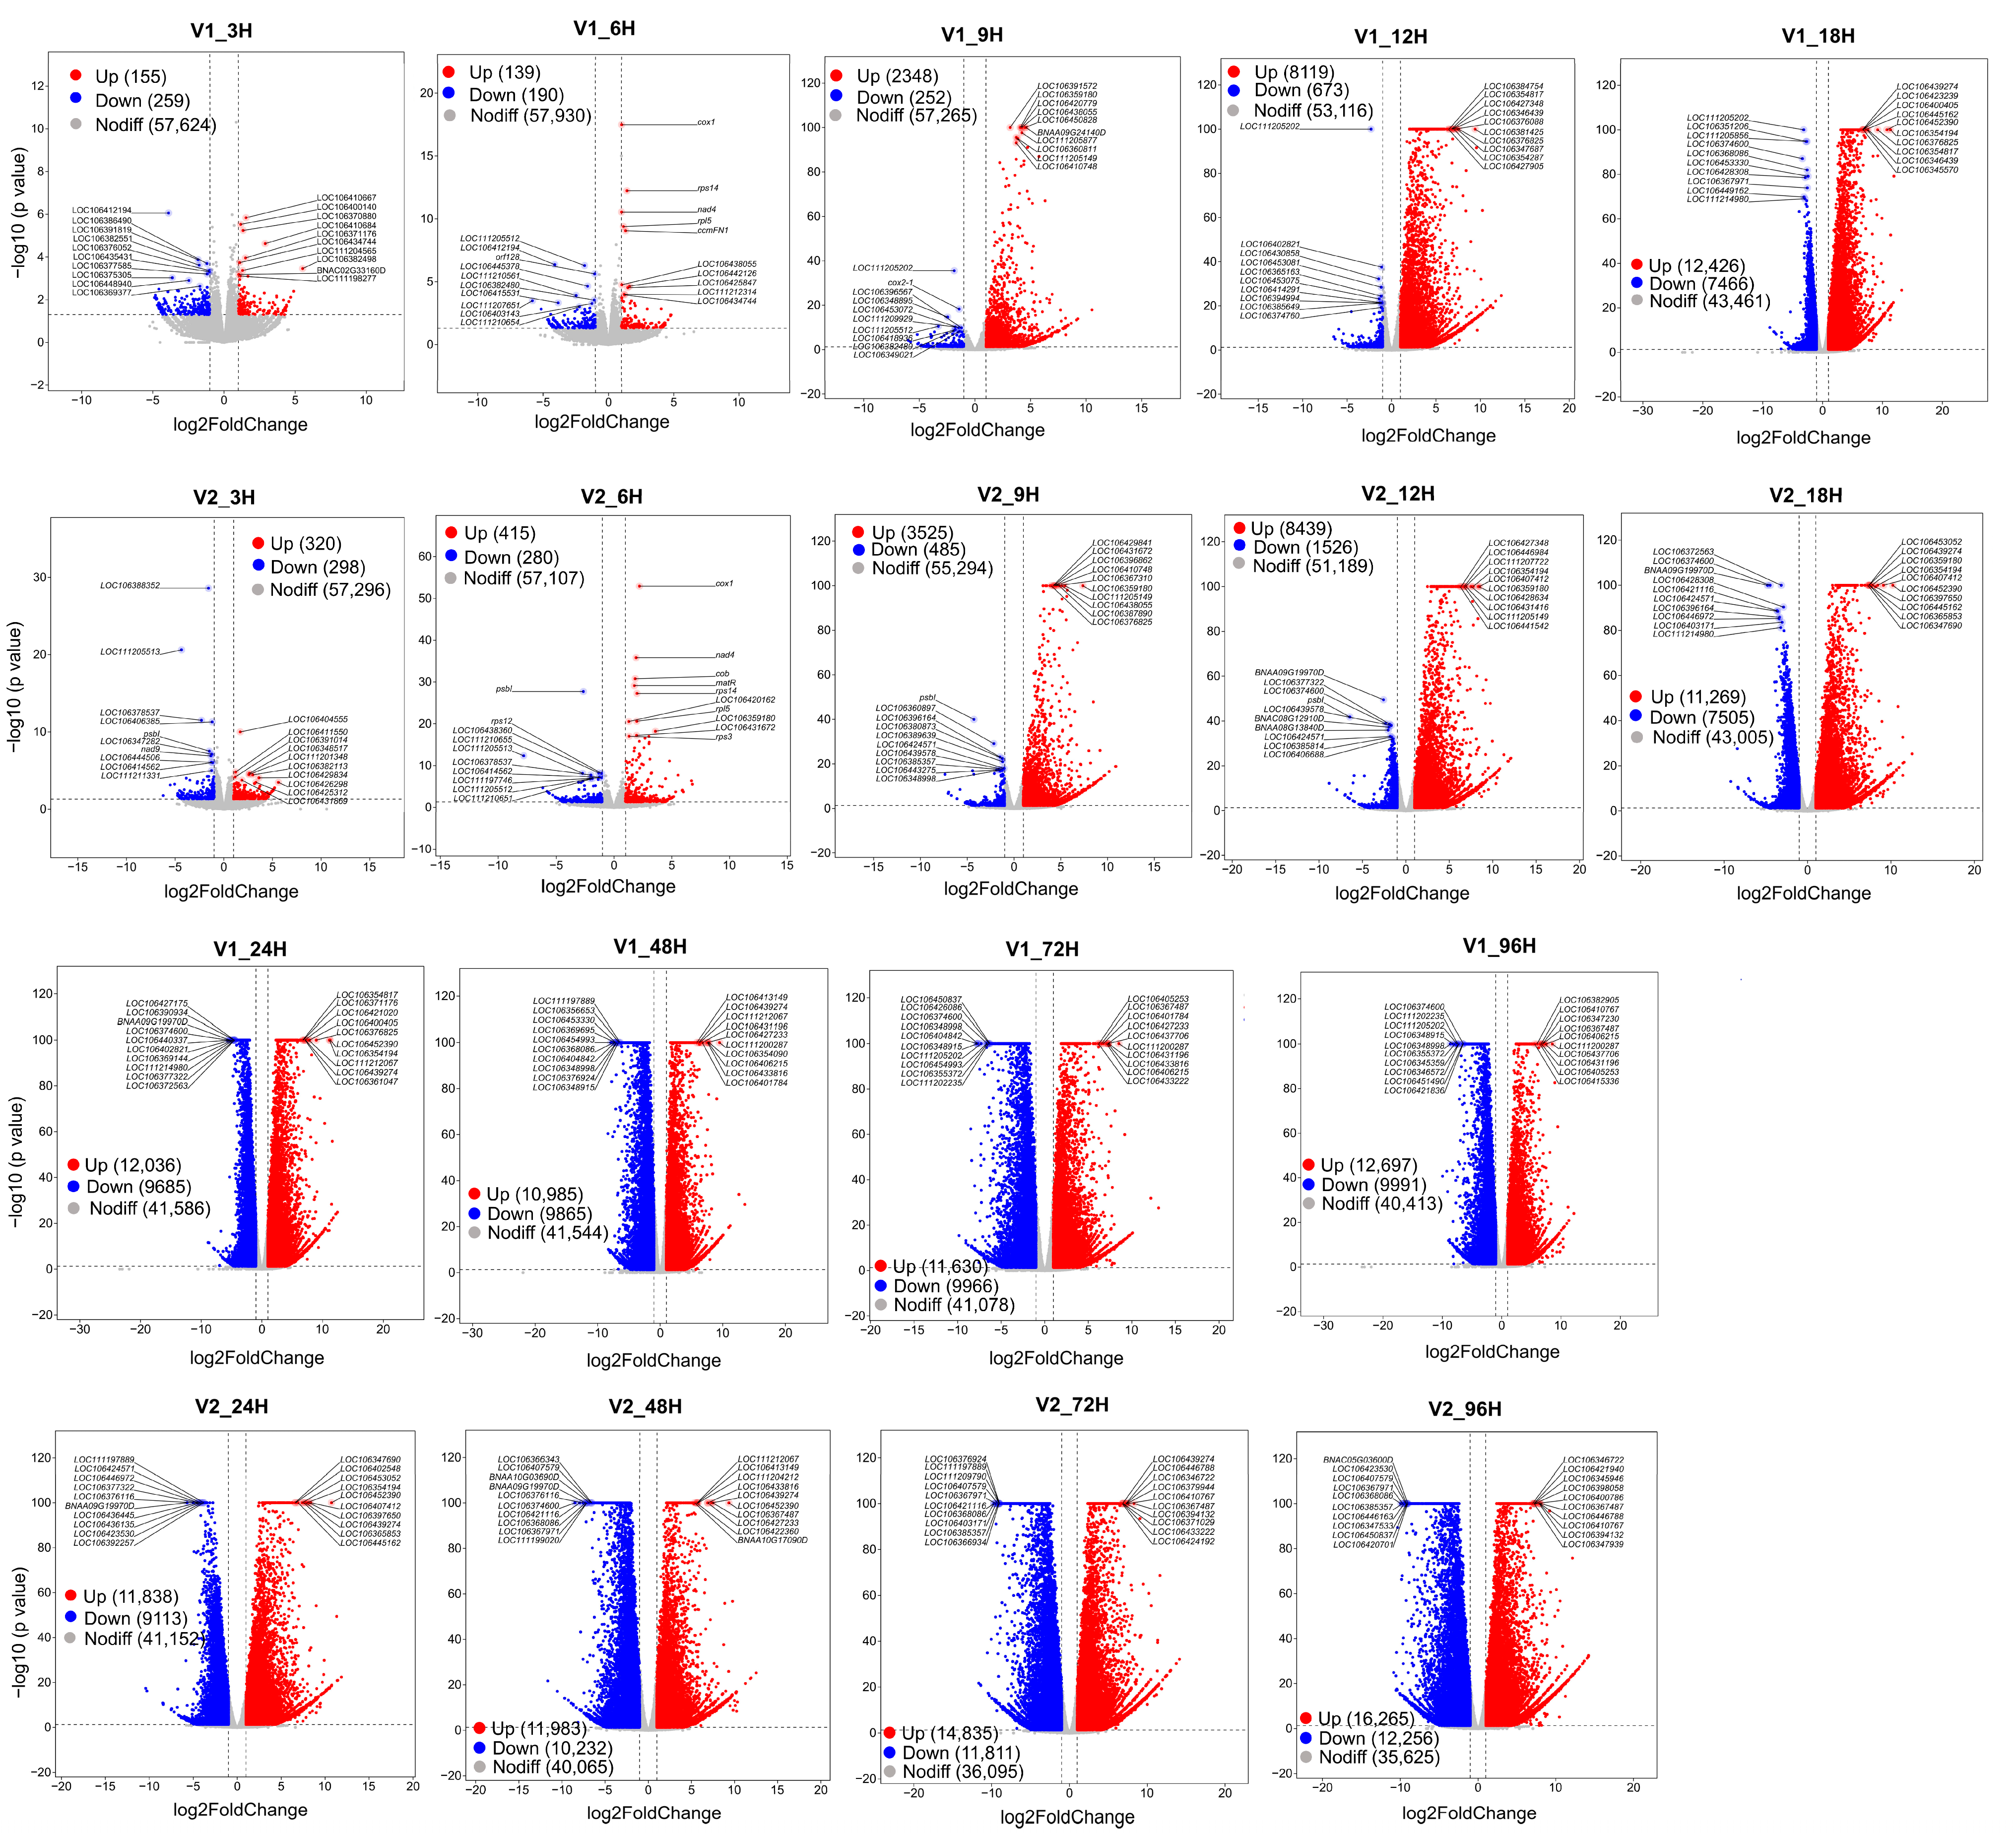
Venn analysis was conducted on DEGs to further identify those related to LTG at each time point between ‘HY3404’ and ‘HY7201’. The Venn diagram shows 17, 36, 1514, 5587, 13,207, 14,897, 14,224, 15,947, and 17,015 common DEGs at 3 h, 6 h, 9 h, 12 h, 18 h, 24 h, 48 h, 72 h, and 96 h, respectively (Figure 3B). The majority of these common DEGs were upregulated in both ‘HY3404’ and ‘HY7201’ (Figure 4 and Figure S2). Although a high similarity in the overall transcriptome was observed across different time points of LTG within and across the cultivars, the number of time-specific genes was significantly different among various stages. The number of time-specific genes varied from 293 to 6824 for HY3404 and 601 to 11,506 for HY7201 (Figure 3B). At 6 h, it showed the lowest number (293) of time-specific genes in HY3404, whereas time-specific genes were lowest at 3 h (601) in HY7201. The largest number of time-specific genes, 6824, was identified in HY3404 at 24 h, while the largest number of time-specific genes, 11,506, was identified in HY7201 at 96 h (Figure 3B). HY7201 exhibits a greater number of specific genes than HY3404 at most time points during the low-temperature germination process (Figure 3B). Due to low temperature significantly altering the germination process in both varieties, the DEGs at specific time points under low-temperature conditions include not only those responding directly to low temperatures but also those regulating the germination process. The varying proportion of preferentially/specifically expressed genes suggests that each time point has its own independent developmental programs. Therefore, in order to obtain time-specific and variety-specific DEGs related to LTG, we will conduct DEGs analysis first separately in each genotype, and further accurately identify the key regulatory genes associated with low-temperature germination between the two varieties. Alternatively, the transcriptional complexity may reflect the intricacy of the captured seed germination stages and cultivars.

3.4. GO and KEGG Analysis of Common and Time-Specific DEGs in LTG

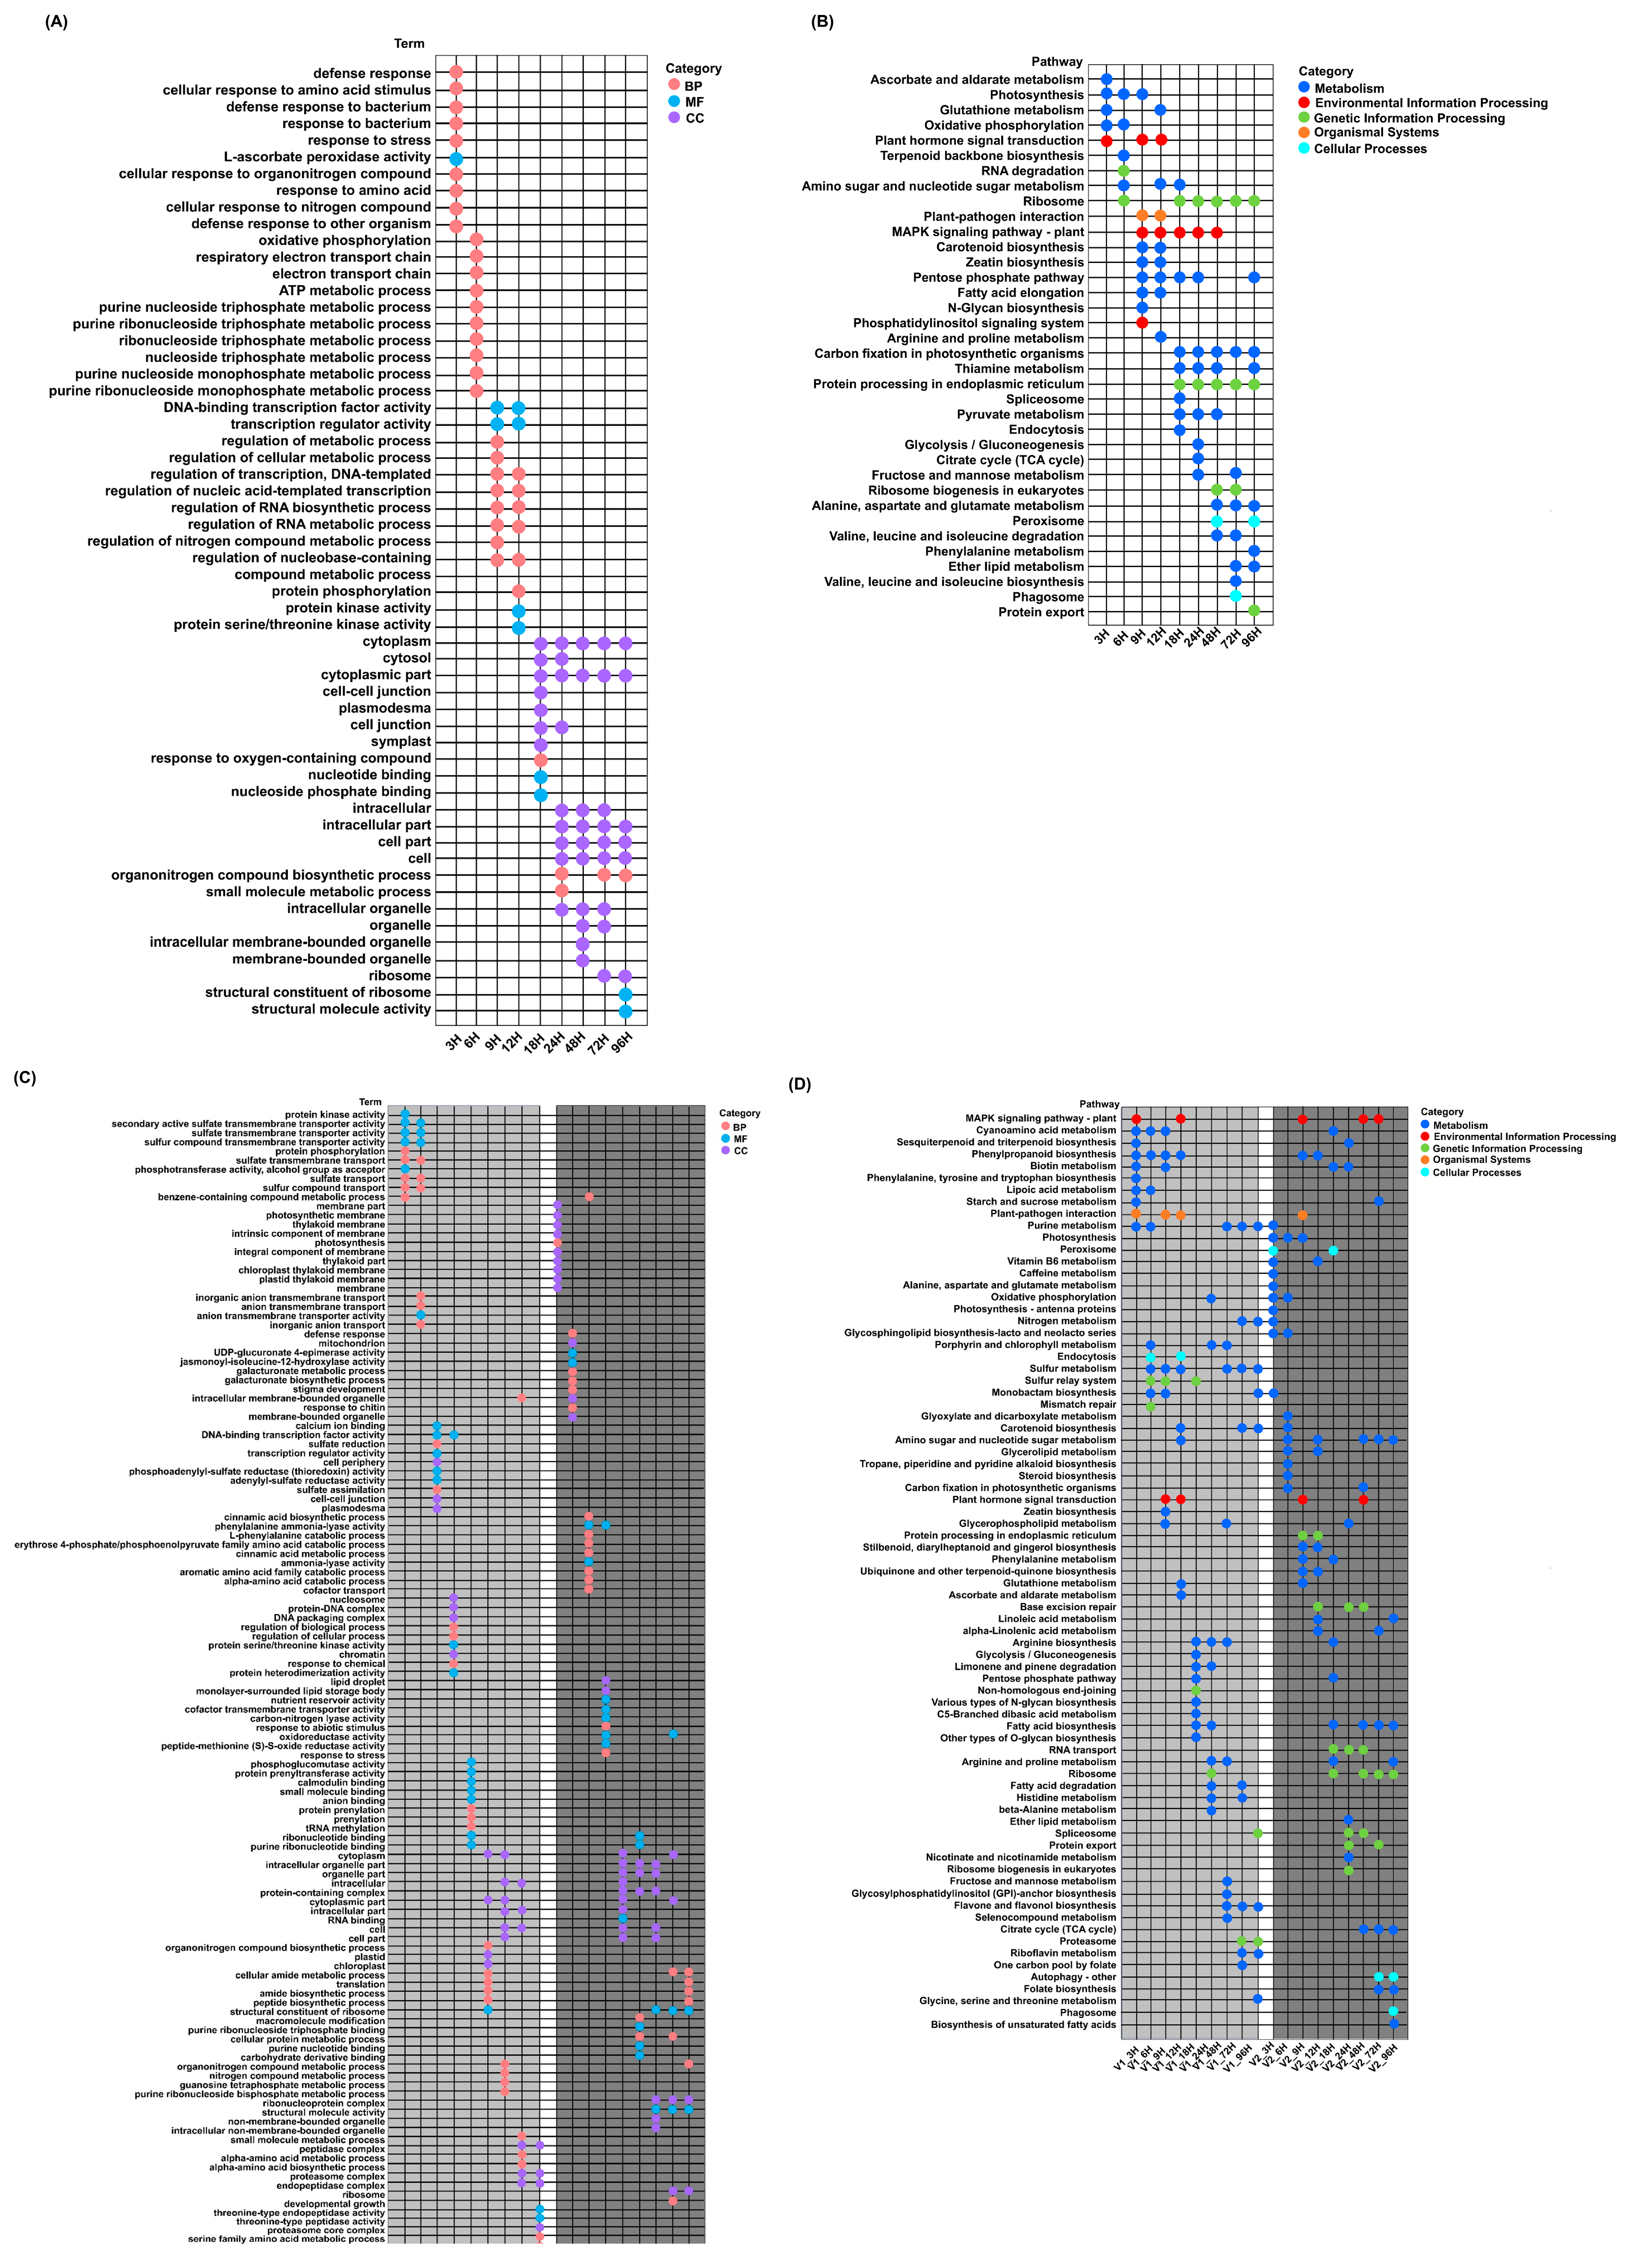
Gene ontology (GO) enrichment analysis of the common differentially expressed genes (DEGs) across all time points between the two genotypes revealed an overrepresentation of genes involved in various biological processes (BPs), molecular functions (MFs), and cellular components (CCs) (Figure 5A, Excel S1). At 3H, 6H, 9H, and 12H, the common DEGs between the two varieties were primarily related to BP and MF, whereas the GO terms of common DEGs were mainly enriched in CC (Figure 5A, Excel S1). The biological processes included stress response, oxidative phosphorylation, the respiratory electron transport chain, transcriptional regulation, and response to oxygen-containing compounds. Additionally, molecular functions such as L-ascorbate peroxidase activity, transcription regulator activity, and protein serine/threonine kinase activity were significantly enriched (Figure 5A, Excel S1). KEGG pathway analysis of these common DEGs identified genes associated with multiple metabolic and environmental response pathways, including ascorbate and aldarate metabolism, glutathione metabolism, oxidative phosphorylation, plant hormone signal transduction, MAPK signaling pathway, carotenoid biosynthesis, pentose phosphate pathway, fatty acid elongation, arginine and proline metabolism, and peroxisome function, among others (Figure 5B, Excel S1). These pathways are well known to be closely linked to seed germination and cold response.
GO enrichment and KEGG pathway analyses were also performed on all time-specific DEGs in HY3404 and HY7201, revealing significant differences in gene enrichment between the two genotypes. The time-specific genes in HY3404 were primarily enriched in BP and MF, whereas HY7201 exhibited a relatively large proportion of genes associated with CC (Figure 5C, Excel S1). KEGG pathway analysis indicated that the HY7201 variety contains more time-specific genes enriched in metabolism and environmental response pathways. Additionally, we found that HY7201 harbors several specifically enriched pathways related to antioxidant responses during germination or low-temperature stress, including vitamin B6 metabolism, glyoxylate and dicarboxylate metabolism, biosynthesis of unsaturated fatty acids, linoleic acid metabolism, alpha-linolenic acid metabolism, alanine, aspartate and glutamate metabolism, caffeine metabolism, nicotinate and nicotinamide metabolism, and the citrate cycle (TCA cycle) (Figure 5D, Excel S1).

3.5. WGCNA Analysis and Module-Specific Hub Gene Association with LTG

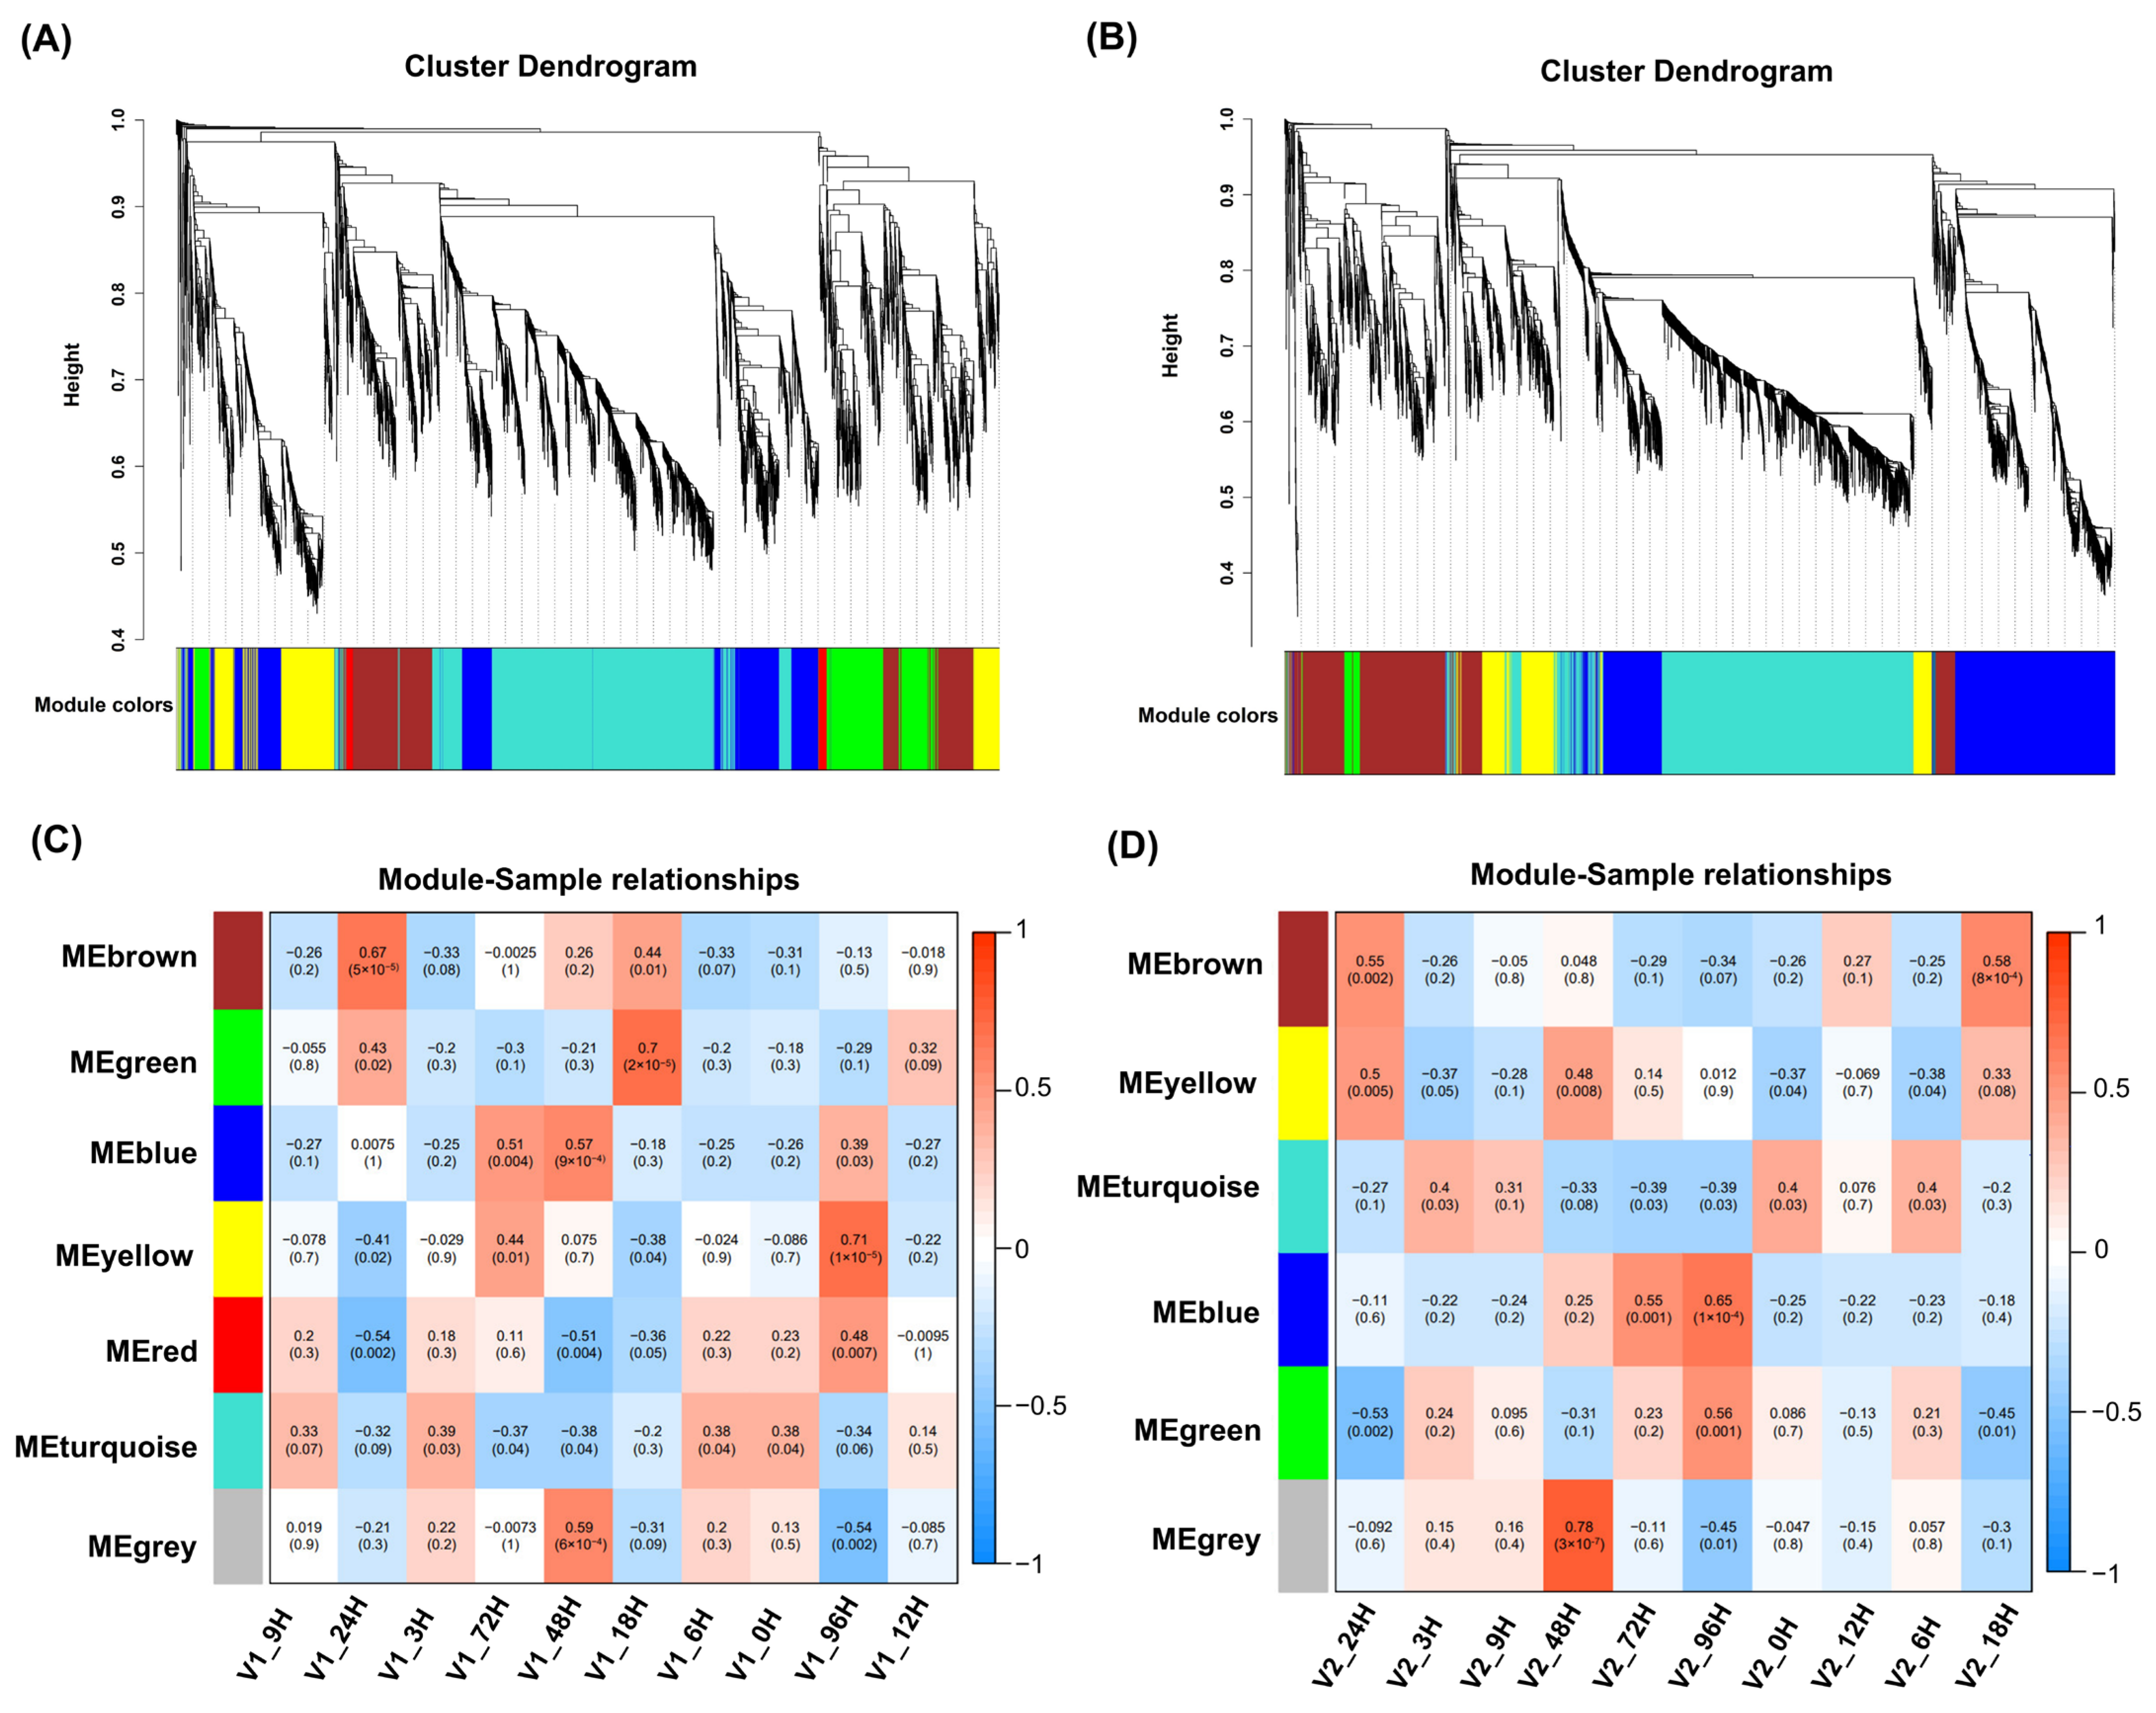
To gain a comprehensive understanding of the gene regulatory network (GRN) at successive germination time points under low temperature across two genotypes, and to identify specific genes highly associated with LTG, a weighted gene co-expression network analysis (WGCNA) was conducted. For each genotype, 5000 genes with high expression abundance were selected for WGCNA. GRN analysis was performed separately for both rapeseed cultivars. This analysis revealed several major subnetworks representing interactions among genes with similar expression profiles, referred to as co-expression modules. A total of seven modules, comprising 23 to 1735 genes, were identified in HY3404 (Figure 6A,C; Excel S2), while six modules, comprising 17 to 1832 genes, were identified in HY7201 (Figure 6B,D; Excel S2). All modules in both HY3404 and HY7201 contained transcription factor (TF)-encoding genes, ranging from 16 (grey) to 905 (turquoise) in HY3404, and from 9 (grey) to 911 (turquoise) in HY7201 (Figure S3). TF-encoding genes accounted for 39% to 62% of the total genes in all modules, indicating tight regulation of transcriptional activity.
Furthermore, we associated each co-expression module with the time points of LTG using Pearson correlation coefficient analysis. Interestingly, five co-expression modules from HY3404 and five from HY7201 showed relatively high correlations (r ≥ 0.55) with LTG time points (Figure 6C, D). In HY3404, the yellow module exhibited the highest correlation coefficient (0.71) with LTG at 96h, whereas in HY7201, the grey module showed the highest correlation coefficient (0.78) with LTG at 48 h. Many modules were correlated with only a specific LTG time point; however, a few were correlated with multiple LTG time points. For example, the yellow module of HY3404 was specifically correlated (r = 0.71) with 96 h. In HY7201, the grey and green modules were specifically correlated with 48 h (r = 0.78) and 96 h (r = 0.56) of LTG, respectively. Additionally, the brown module was correlated with 18 h (r = 0.55) and 24 h (r = 0.58), and the blue module was correlated with 72 h (r = 0.55) and 96 h (r = 0.65).
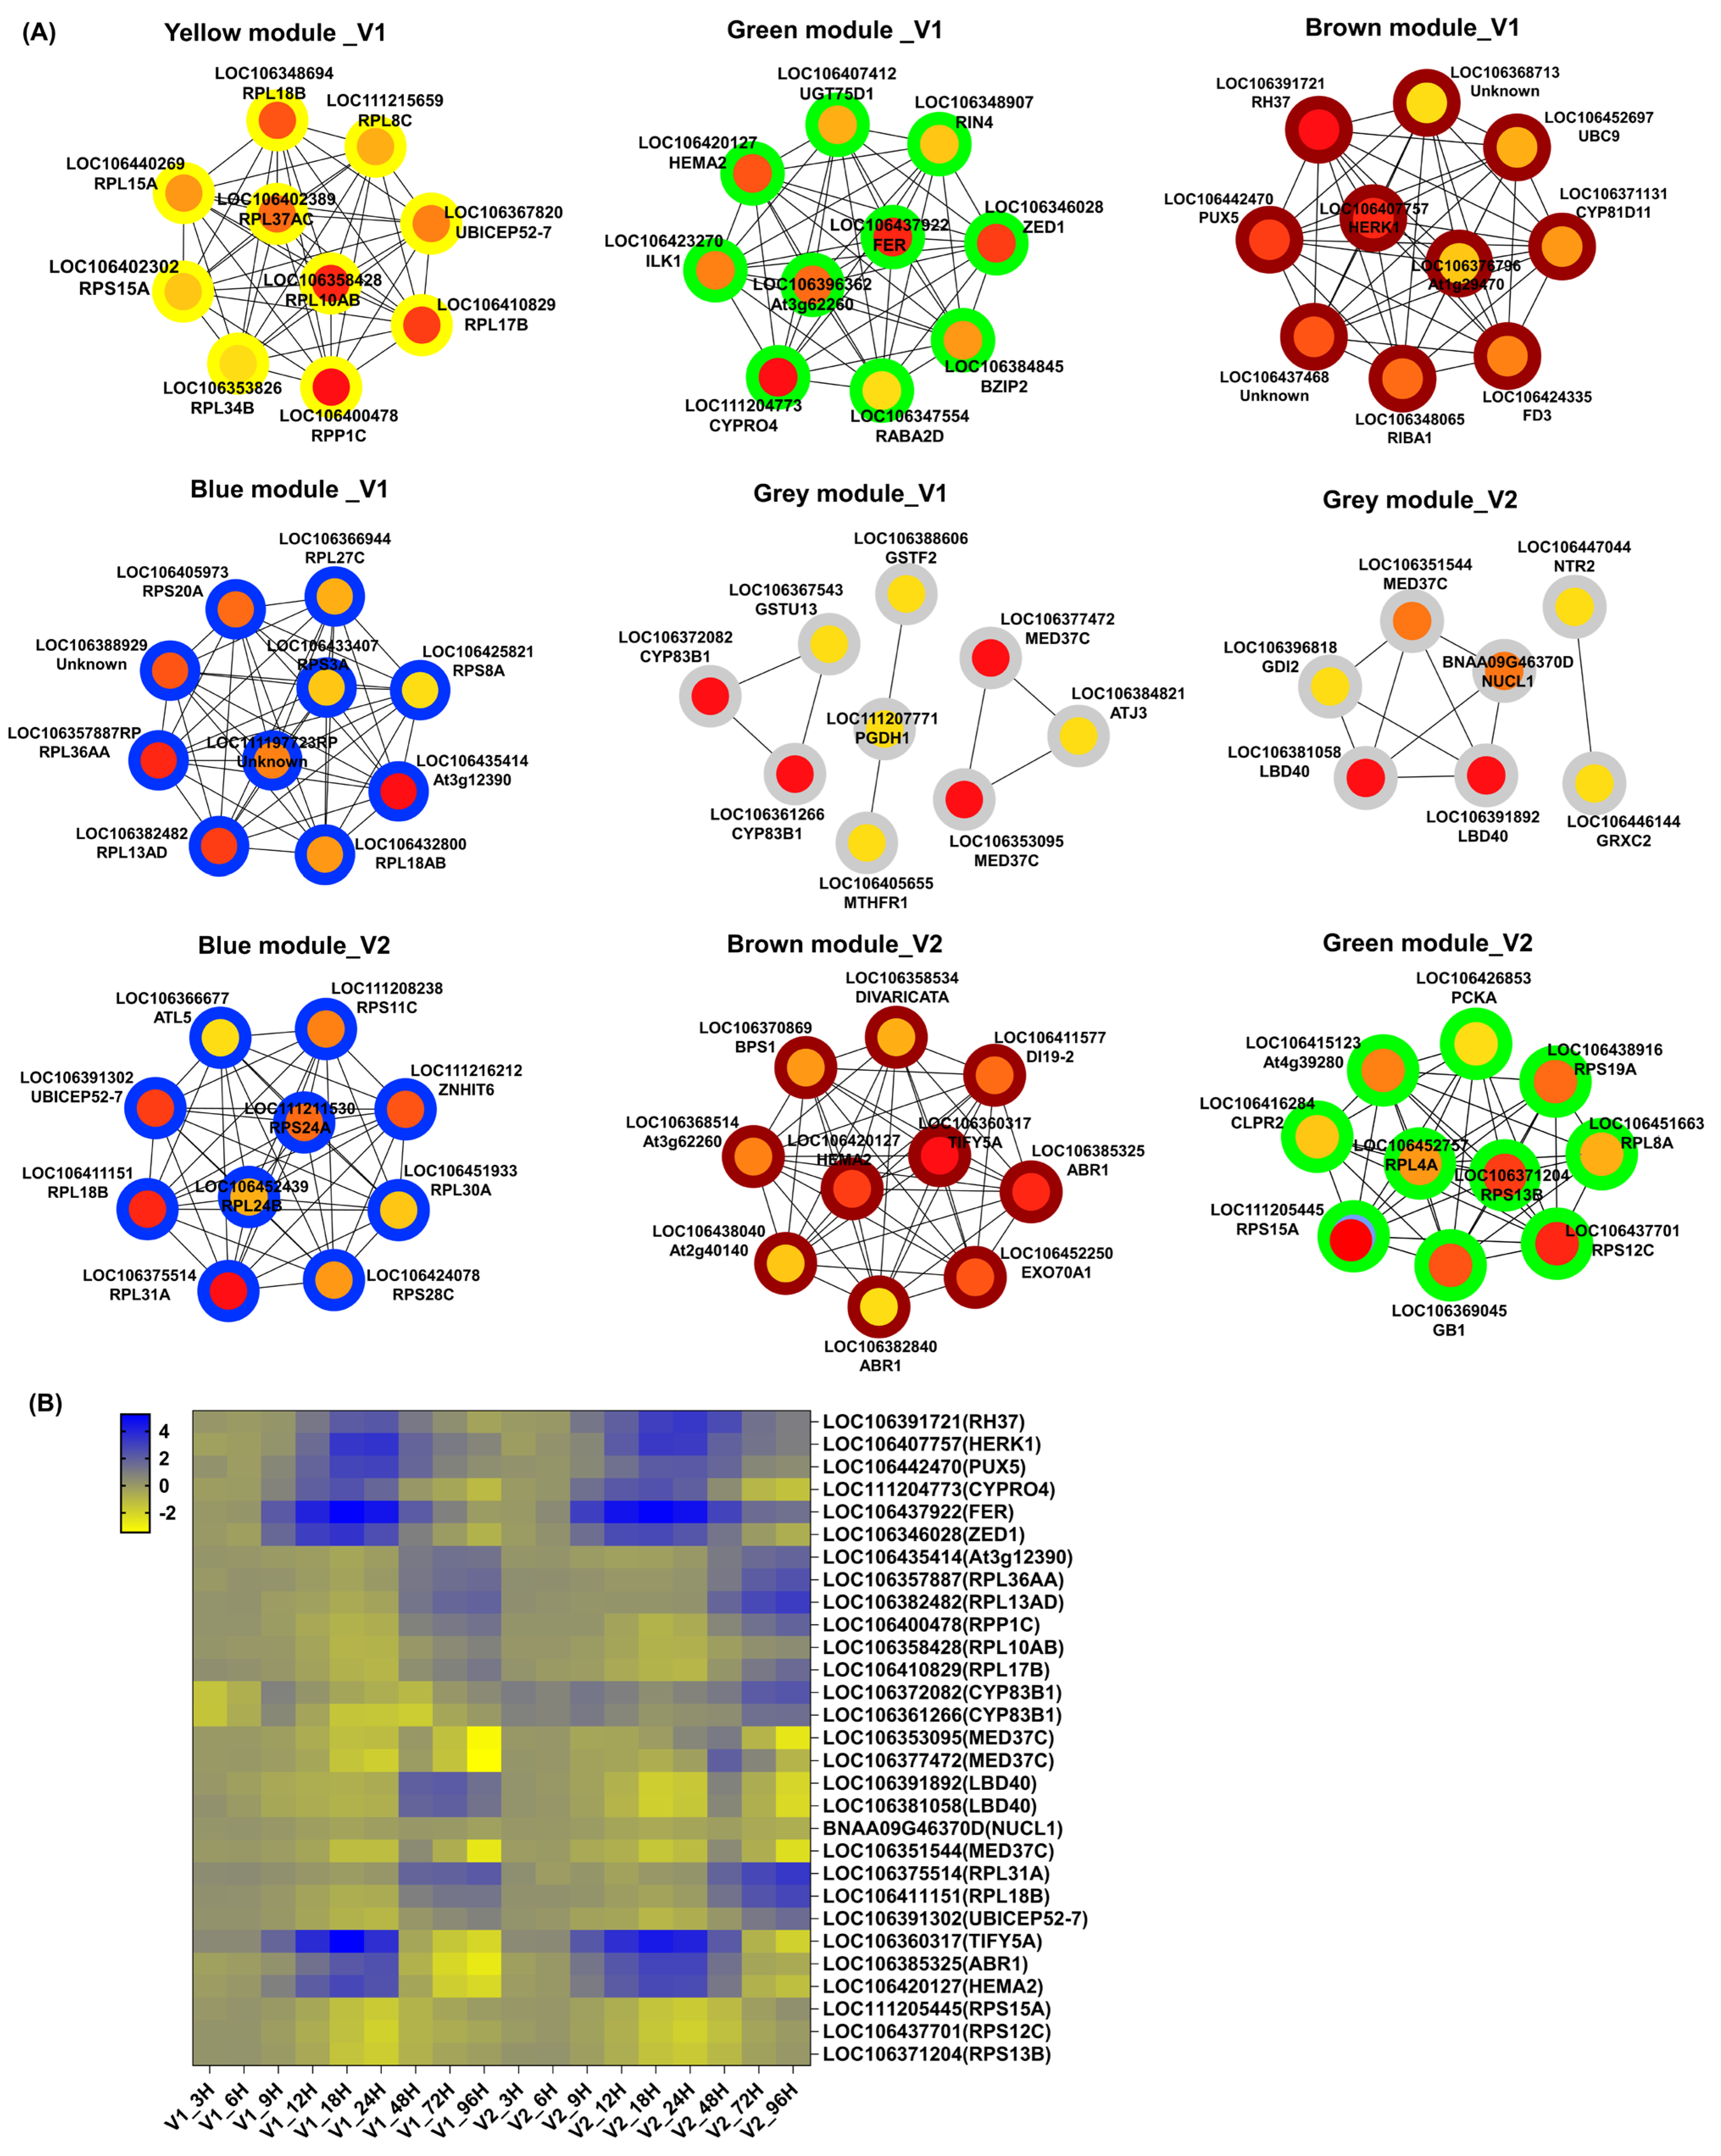
To further identify the hub genes within each module, we employed the MCC method in the CytoHubba (v0.1) plugin of Cytoscape 3.10.3 to determine the top 10 hub genes (Figure 7A). From these, we selected the top-three ranked genes in each module as module-specific candidate genes (Table 1). The top ten genes with the highest scores in each specific module are presented in Figure 7A and Excel S3, while the top three genes for each module are listed in Table 1. These genes exhibit significant upregulation at one or two time points during the seed germination process and are conserved across both genotypes (Figure 7B). Most of these genes are involved in processes such as ribosome biogenesis and translation. In the Brown module of HY7201, hormone-responsive factors LOC106360317 and LOC106385325, which encode TIFY5A/JAZ8 and ABR1, respectively, were identified. These factors act as response elements for jasmonic acid and ethylene signaling and may play important roles in LTG. Previous studies have reported that JAZ proteins play critical roles in germination and stress responses [37,38]. Additionally, an ethylene-responsive transcription factor has been identified as a candidate gene within a significantly associated SNP through GWAS [9].

3.6. Genotype-Specific Candidate Genes Determining LTG

Based on the WGCNA results, we identified 29 time-specific candidate genes; however, we were more interested in identifying DEGs that are continuously expressed across multiple time points and exhibit conserved co-expression in both varieties to regulate low-temperature germination (LTG). Surprisingly, we found that modules with higher correlation in both genotypes were all associated with the time points at 18 h, 24 h, 48 h, 72 h, and 96 h, indicating that genes at these LTG time points exhibit more vigorous expression. The Venn analysis in DEGs at each time point between two genotypes indicated that the changes in differential genes were more significant after 18 h (Table S5). We further conducted a Venn analysis at these five time points (18 h, 24 h, 48 h, 72 h, and 96 h) in ‘HY3404’ and ‘HY7201’ to screen DEGs related to LTG, identifying a total of 4,012 DEGs (Figure 8A, Excel S4). Trend analysis of these 4012 DEGs revealed nine subclusters, with cluster 5 containing 190 genes specifically expressed in HY3404 across all five time points, while cluster 8 included 449 genes specifically expressed in HY7201 (Figure 8B and Figure S4, Excel S4).
To investigate the biological functions, we extracted DEGs from clusters 5 and 8 for further GO term and KEGG pathway analysis. GO analysis revealed that the DEGs in cluster 5 were significantly enriched in 53 biological processes (see Excel S4), whereas the DEGs in cluster 8 were enriched in a total of 83 terms across biological process and molecular function categories based on the adjusted p-value (Excel S4). The top 20 GO terms representing the DEGs in cluster 5 are shown in Figure 8C. Among the biological processes identified were multicellular organismal process (GO:0032501), post-embryonic development (GO:0009791), seed germination (GO:0009845), seedling development (GO:0090351), and response to brassinosteroid (GO:0009741) (Figure 8C). These processes are well known to be involved in various aspects of seed germination. Interestingly, four genes—LOC106394706 (NTL8), LOC106411860 (GID2), LOC106424992 (NMAT1), and LOC106450539 (RGL2)—directly associated with seed germination (GO:0009845) were identified within these biological processes. LOC106394706 (NTL8) encodes a NAC domain-containing protein 40; LOC106411860 encodes the F-box protein GID2; LOC106424992 encodes the mitochondrial protein ymf11; and LOC106450539 encodes the DELLA protein RGL2. Notably, DELLA, a negative regulatory factor in the gibberellin signaling pathway, drew our attention. GID2, which specifically interacts with phosphorylated DELLA protein and regulates gibberellin-dependent degradation of DELLA in rice, was previously reported [39]. It is also highly expressed in the cold-sensitive variety ‘HY3404’ and inhibits seed germination at low temperatures, indicating the role of gibberellin in LTG. Moreover, three genes—LOC106391587, LOC106430656, and LOC106432579—responsive to brassinosteroid (BR) were also identified in cluster 5. Among these, LOC106430656 encodes BES1/BZR1 homolog protein 3, a core transcription factor in the BR signal transduction pathway that promotes seed germination. It has been reported that the BR signaling pathway participates in low-temperature germination [40]. GO enrichment analysis of DEGs in cluster 8 revealed involvement in various biological processes and molecular functions. Biological processes included hormone-mediated signaling pathway (GO:0009755), pentose-phosphate shunt (GO:0009052), regulation of transcription (GO:0006355), and organophosphate ester transport (GO:0015748). Molecular functions included ribose-5-phosphate isomerase activity (GO:0004751) and intramolecular oxidoreductase activity (GO:0016861). Fifteen genes were significantly associated with the hormone-mediated signaling pathway, encompassing auxin, ethylene, and brassinosteroid signaling pathways. Nine genes associated with the auxin-activated signaling pathway were found to be significantly enriched within hormone-mediated signaling pathways. These genes include LOC106361960 (ARF19), LOC106367474 (IAA13), LOC106368488 (ARF18/DOF3.7), LOC106416441 (IAA2), LOC106418427 (ARF6), LOC106427417 (IAA16), LOC106439727 (PIN3), LOC106452205 (IAA26), and LOC106453092 (IAA16).
KEGG analysis revealed that the MAPK signaling pathway and plant hormone signal transduction were the most highly enriched pathways in the DEGs of both cluster 5 and cluster 8 (Figure 8D). Moreover, the DEGs specifically expressed in cluster 5 in the ‘HY3404’ variety were enriched in various metabolic pathways, including ‘other glycan degradation’ (bna00511), ‘glutathione metabolism’ (bna00480), ‘sphingolipid metabolism’ (bna00600), ‘porphyrin and chlorophyll metabolism’ (bna00860), ‘purine metabolism’ (bna00230), and ‘phenylpropanoid biosynthesis’ (bna00940). In contrast, cluster 8, which is specifically expressed in the ‘HY7201’ variety, showed enrichment in a greater number of metabolic pathways, including the ‘pentose phosphate pathway’ (bna00030), ‘fatty acid elongation’ (bna00062), ‘carbon fixation in photosynthetic organisms’ (bna00710), ‘amino sugar and nucleotide sugar metabolism’ (bna00520), ‘C5-branched dibasic acid metabolism’ (bna00660), ‘vitamin B6 metabolism’ (bna00750), ‘glycerophospholipid metabolism’ (bna00564), ‘lysine biosynthesis’ (bna00300), ‘taurine and hypotaurine metabolism’ (bna00430), ‘glycosylphosphatidylinositol (GPI)-anchor biosynthesis’ (bna00563), ‘thiamine metabolism’ (bna00730), ‘pyrimidine metabolism’ (bna00240), ‘starch and sucrose metabolism’ (bna00500), and ‘valine, leucine, and isoleucine biosynthesis’ (bna00290). Among these KEGG pathways, ‘vitamin B6 metabolism’ (bna00750) and ‘starch and sucrose metabolism’ (bna00500) have been reported to be significantly associated with LTG [24]. These results indicate that DEGs specific to each variety during LTG are associated with metabolic pathway functions, with metabolism being more active in ‘HY7201’ under low-temperature conditions.
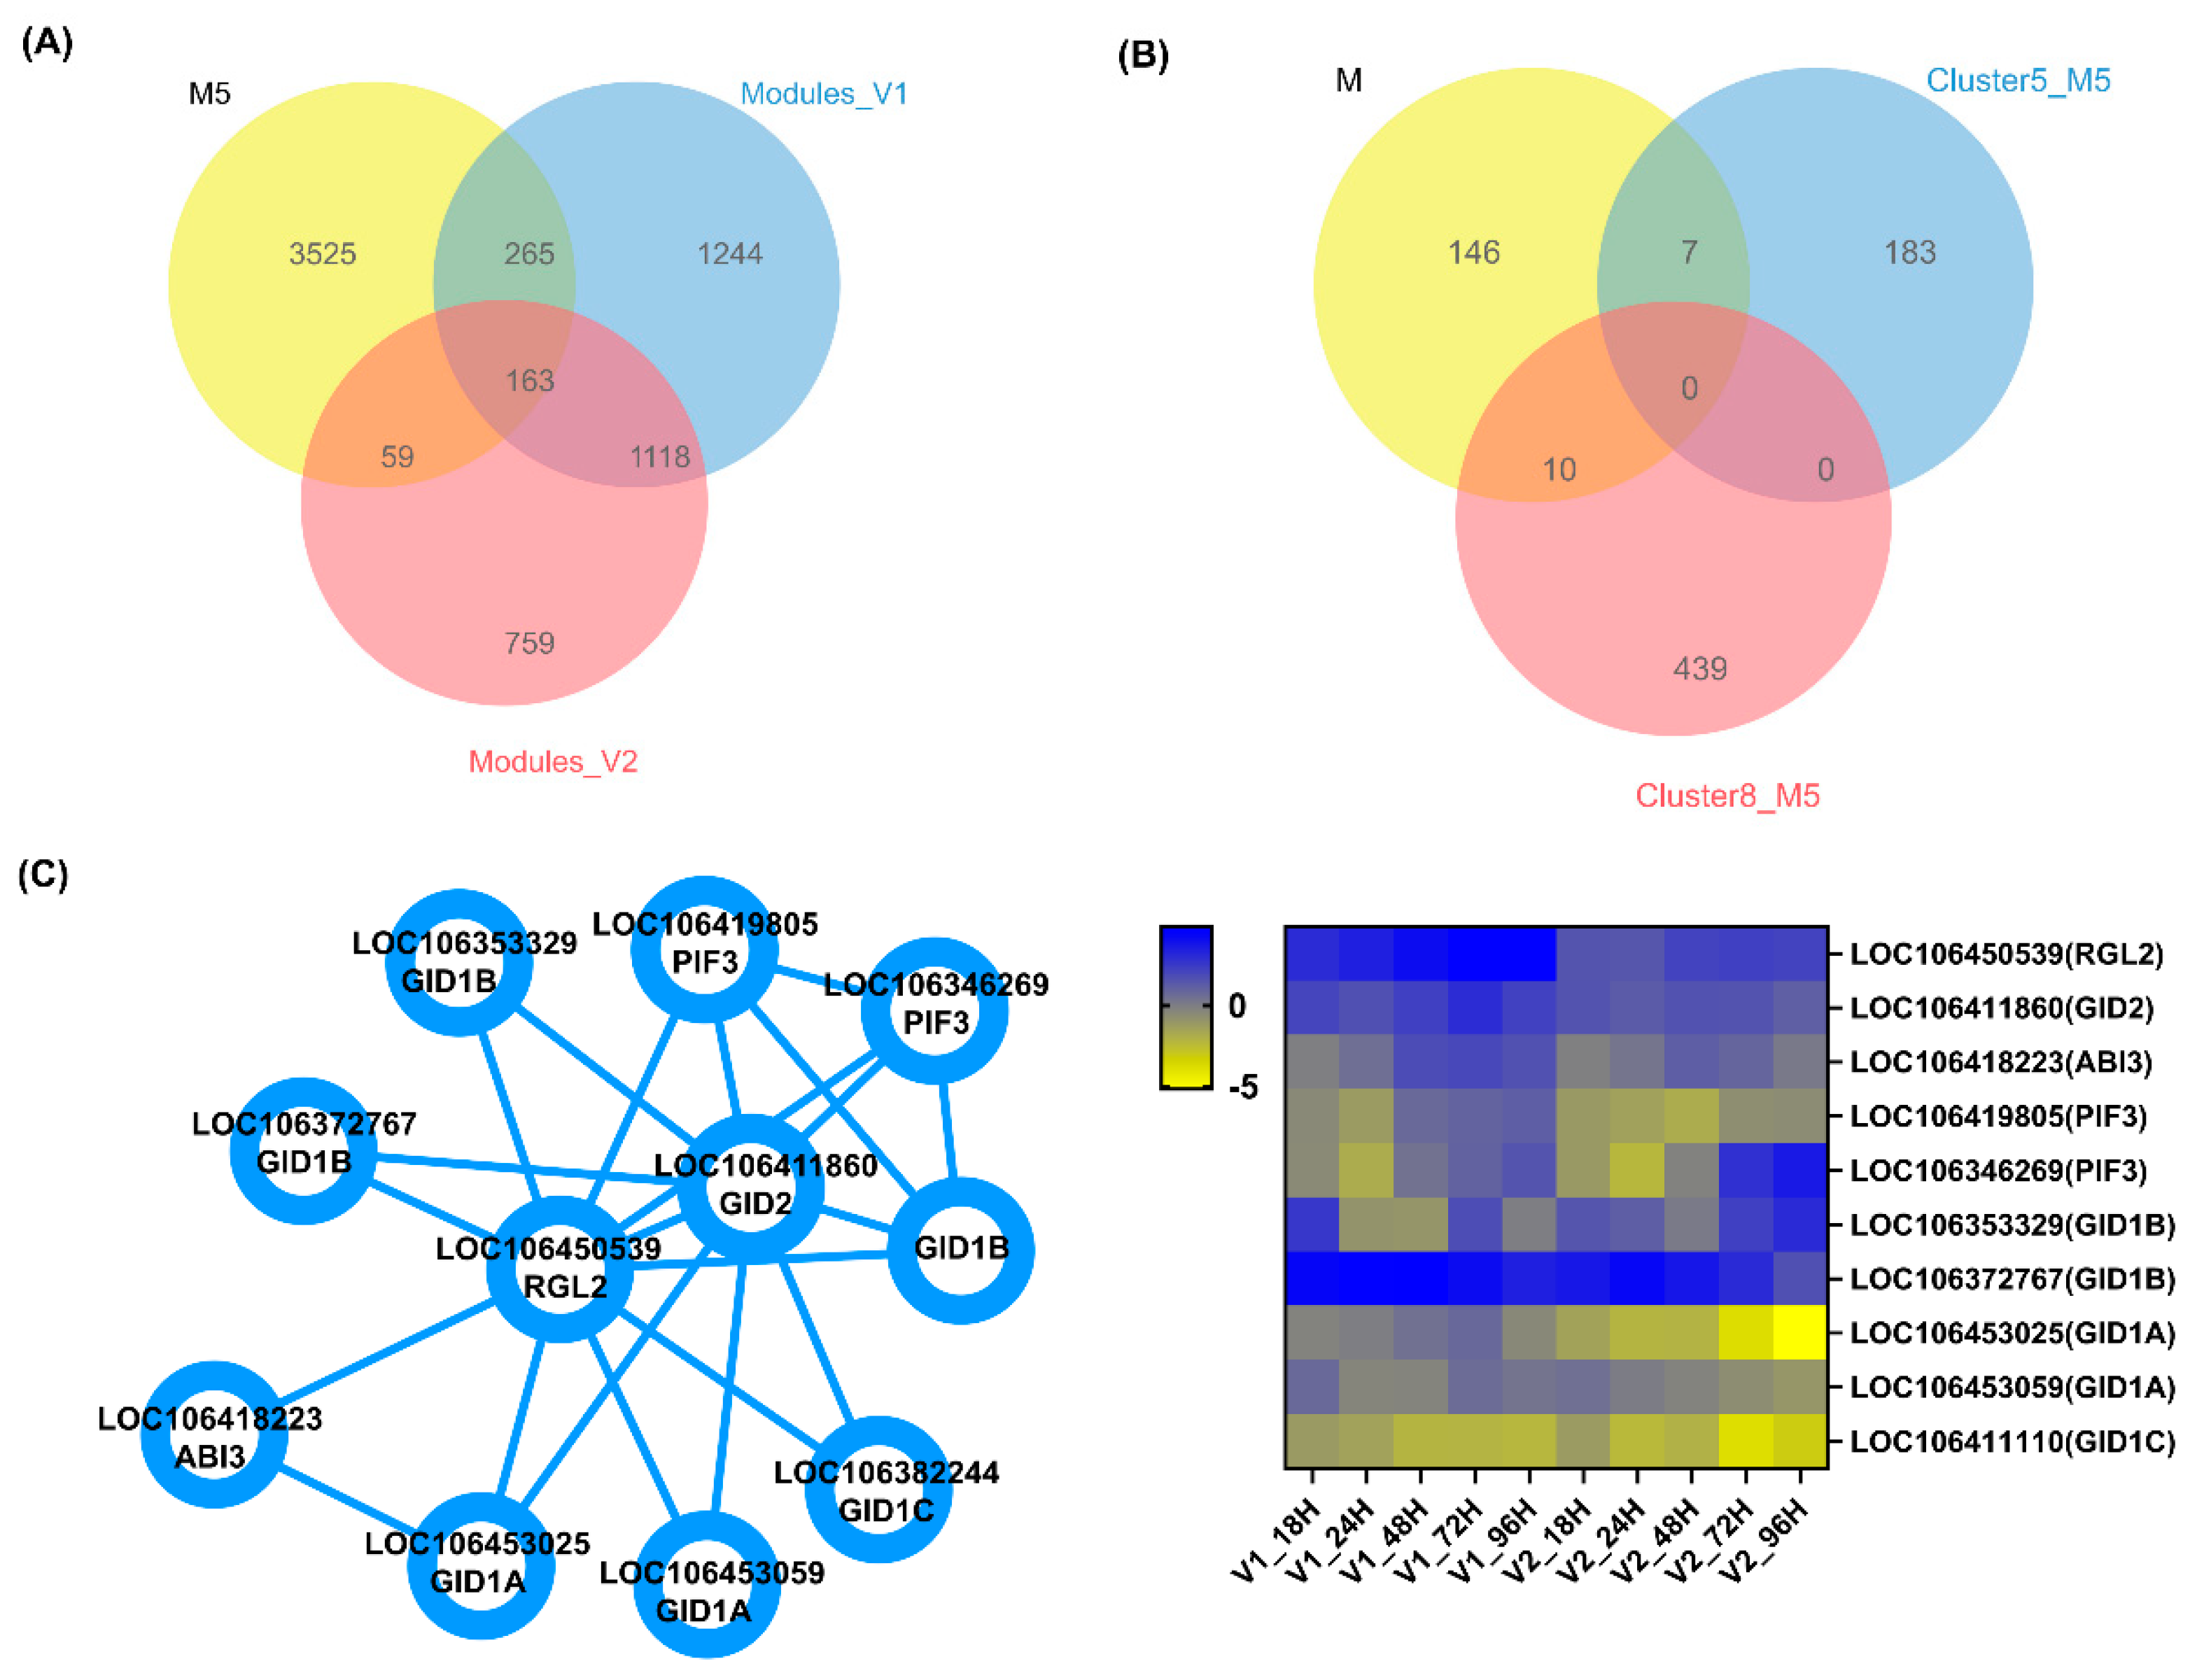
To identify key candidate genes regulating low-temperature germination (LTG), we first performed a Venn analysis of 4012 DEGs identified across five time points and nine highly correlated module genes, selected based on the criteria of module membership (MM) > 0.8, gene significance (GS) > 0.2, and Kwithin > 30. This analysis identified 163 commonly differentially expressed genes, indicating persistent differential expression across multiple time points with high expression levels (Figure 9A). Subsequently, Venn analyses were conducted between these 163 common DEGs and the genes in cluster 5 and cluster 8, yielding 10 and 7 overlapping DEGs, respectively (Figure 9B). A total of 17 genes were thus identified as key candidate regulators of LTG (Table 2). Notably, one of these genes, LOC106450539, encodes a DELLA protein—RGL2—that functions in the gibberellin (GA) signaling pathway. Previous studies have established that GA signaling is a critical regulatory pathway in LTG [41,42], and DELLA proteins are known to be key downstream components in cucumber low-temperature germination [43]. Therefore, we cloned both the coding sequence and the promoter region (2000 bp upstream of the ATG start codon) of RGL2 from ‘HY3404’ and ‘HY7201’. Sequence analysis revealed multiple base deletions and substitutions in RGL2 between the two varieties (Figures S5 and S6). SNP variations in the coding sequence (CDS) resulted in predicted alterations in the protein sequence; specifically, the RGL2 protein in HY7201 appears to lack a low-complexity domain present in HY3404 (Figures S7 and S8A). Additionally, 3D protein structure prediction suggests that the variant site may affect the binding interface with interacting partners (Figures S8B and S8C). However, cis-acting element analysis of the RGL2 promoter sequences showed no differences in known functional elements between the two varieties. Thus, it is hypothesized that CDS sequence variations may indirectly influence RGL2 expression or function. Furthermore, a protein–protein interaction (PPI) network analysis of BnaRGL2 identified 10 potential interaction partners (Figure 9C, Table S6). Intriguingly, several of these interactors are involved in GA and abscisic acid (ABA) signaling pathways, including LOC106411860 (encoding the GA receptor GID2) and LOC106418223 (encoding the ABA-responsive transcription factor ABI3), both of which play essential roles in seed germination. RGL2 acts as a negative regulator in GA signaling and is highly expressed in HY3404, thereby suppressing germination under low temperature. In contrast, its expression is downregulated in HY7201, providing a molecular explanation for the faster germination observed in this variety. Most of the identified interaction partners exhibit similar expression patterns to RGL2. Based on these findings, we propose a hypothetical molecular regulatory mechanism underlying LTG involving crosstalk between GA and ABA signaling. A working model illustrates the potential role of BnaRGL2 in mediating low-temperature germination in Brassica napus: in the LT-tolerant genotype ‘HY7201’, low temperature induces a GA signaling response that leads to reduced accumulation of BnaRGL2. BnaRGL2 may also modulate ABA signaling by interacting with BnaABI3 to regulate downstream ABA-responsive genes, ultimately promoting seed germination.

4. Discussion

Low temperature is a limiting factor for the growth and yield of field crops. Due to the continuous delay in the direct-broadcast rapeseed sowing period, rapeseed is highly sensitive to low temperatures, particularly during seed germination and seedling growth [5,6]. HY7201 is a high-quality yellow-seeded rapeseed variety, while HY3404 is a higher-yielding rapeseed genotype; both are suitable for cultivation in the middle and lower reaches of the Yangtze River. This study compared the effects of low temperature on the seed germination of HY3404 and HY7201 and further investigated the mechanisms underlying seed germination under low-temperature conditions. We found that HY7201 seeds exhibited greater tolerance to low temperature during germination than HY3404 seeds (Figure 1D–F). HY7201 showed a higher germination rate and faster germination speed. The faster water uptake observed in HY7201 seeds may be one reason for their higher germination percentage compared to HY3404 seeds under low-temperature treatments (Figure 1G). Additionally, a greater number of DEGs were detected at most time points in HY7201, indicating more pronounced gene expression changes in HY7201 seeds.
The PCA analysis showed that all 60 samples were clearly divided into two groups corresponding to ‘HY3404’ and ‘HY7201’ (Figure 2B), indicating that these two lines used in this study exhibited distinct differences in both phenotype and transcriptome gene expression levels. This suggests that these lines are representative, and the transcriptome data effectively reflect the differences in germination phenotypes. Additionally, the three biological replicates for each germination time point clustered tightly, with Spearman correlation coefficients among replicates ranging from 0.968 to 0.994 (Figure S9), demonstrating high reproducibility and data quality in the current study. PCA analysis further divided the two rapeseed lines into five subgroups, providing insights into similarities in their transcriptional programs, such as subgroup 2 and subgroup 5 (Figure 2B). These two subgroups comprised seven time points (0 h, 3 h, 6 h, 9 h, 12 h, 18 h, and 24 h) from both ‘HY3404’ and ‘HY7201’. This result indicates parallel similarities between ‘HY3404’ and ‘HY7201’ and high similarity in transcriptional programs during the 0–24 h time points. Interestingly, the clustering of the 48 h time point differed markedly between HY3404 and HY7201. The 48 h sample of HY3404 clustered closely with the late stages (72 h and 96 h), whereas the 48 h sample of HY7201 formed a distinct group, separate from the 72 h and 96 h samples (Figure 2B). We hypothesize that HY7201 progresses more rapidly during the early stages of LTG compared to HY3404, consistent with their respective low-temperature germination phenotypes.
Seed germination is a highly complex and continuous process, involving numerous genes that play roles at each stage. Common DEGs associated with LTG at each time point between HY3404 and HY7201 revealed that genes expressed between 3 and 12 h are primarily related to biological processes, whereas those expressed between 18 and 96 h are mostly involved in cellular components. Among these, genes related to stress response, oxidative phosphorylation, and transcription regulator activity were prominent (Figure 5A). KEGG pathway analysis showed that the most enriched genes were involved in metabolism, genetic information processing, and environmental information processing. Specifically, pathways such as ascorbate and aldarate metabolism, glutathione metabolism, amino acid metabolism, carbon fixation, plant hormone signal transduction, and the MAPK signaling pathway were identified. Song et al. [24] reported 12 differentially accumulated metabolites (DAMs) and 5 DEGs strongly correlated with the induction of rapeseed LTG through integrated transcriptome and metabolome analysis. These were mainly associated with carbohydrate and amino acid metabolism, particularly glutathione metabolism and starch and sucrose metabolism pathways. This suggests that genes involved in these pathways play crucial roles in the low-temperature germination process. Additionally, genes related to glutathione metabolism, amino acid metabolism, carbon fixation, plant hormone signal transduction, and the MAPK signaling pathway have also been identified in rice and maize [42,44]. Moreover, a greater number of time-specific upregulated DEGs at each time point in HY7201 may explain its faster germination rate (Figure 5B,C). For example, genes related to vitamin B6 metabolism, peroxisome function, linoleic acid metabolism, glyoxylate and dicarboxylate metabolism, nicotinate and nicotinamide metabolism, and base excision repair were specifically upregulated in the HY7201 line. Low-temperature tolerance in seeds can be enhanced through antioxidant effects mediated by vitamin B6 metabolism and nicotinate and nicotinamide metabolism [45,46]. Base excision repair also plays a critical role in the DNA repair system in response to stress [47]. Glyoxylate and dicarboxylate metabolism is a specialized pathway in oilseeds such as rapeseed, playing a central role in utilizing stored oil for seed germination and seedling establishment [48]. Although some genes related to antioxidant stress responses, such as those involved in flavone and flavonol biosynthesis and ascorbate and aldarate metabolism, were also identified in HY3404, the stress response pathways in HY7201 appear to be more diverse and effective under low-temperature conditions. However, quantitative metabolite analysis is necessary to determine whether these substances are directly and significantly associated with low-temperature germination.
Plant hormones play significant roles in low-temperature germination. In this study, we identified 29 hub genes with time-specific expression patterns using WGCNA, which exhibited similar expression profiles between genotypes (Table 1, Figure 7B), indicating that these genes are highly conserved at specific time points. These genes are involved in processes such as peroxisome function, protein phosphorylation, translation, defense response, ATP binding, regulation of transcription, and oxidation-reduction (Table 1). Among them, three genes, TIFY5A/JAZ8, ABR1, and HEMA2, from the brown module in HY7201 are involved in jasmonic acid (JA) and ethylene responses, and glutamyl-tRNA reduction, respectively. Subsequently, we identified two clusters, cluster 5 and cluster 8, with genotype-specific expression in HY3404 and HY7201, respectively. Seventeen key candidate genes were identified within these clusters. Notably, several hormone-responsive genes were found, including the gibberellin (GA) signaling-responsive gene RGL2, the auxin-responsive gene SAUR64, and the ethylene-responsive transcription factor ABI4. Previous studies have reported that ethylene-responsive transcription factors are candidate genes for LTG in rapeseed, identified through GWAS analysis [9]. GA and ABA have been reported as key regulatory factors for low-temperature germination [42,43,44,49]. Sequence alignment and gene expression analysis identified LOC106450539 as a gene of interest, which is highly expressed in HY3404 seeds and encodes a highly conserved, low-temperature-regulated DELLA family protein, RGL2. PPI-network analysis predicted that it interacts with the ABA downstream transcription factor ABI3 (score > 0.7). We speculate that BnaRGL2 reduces the expression of ABA-responsive genes by interacting with ABI3, ultimately promoting rapid seed germination in HY7201. Similarly, the CsGAI gene, identified through map-based cloning, regulates seed germination at low temperatures via the GA and ABA signaling pathways in cucumber [43]. DELLAs have also been shown to interact with the transcription factor ABA INSENSITIVE5 (ABI5), which controls germination by positively regulating a set of ABA-responsive genes [50]. Given that ABI3 is known to act upstream of ABI5 during seed germination in response to ABA [51], we propose that BnaRGL2 first interacts with ABI3, which subsequently positively regulates the expression of ABI5. Both ABI3 and ABI5 could promote the expression of downstream ABA-responsive genes such as LEA, ultimately repressing seed germination at low temperatures. However, BnaRGL2 expression is lower in the cold-tolerant genotype HY7201, which exhibits higher and faster germination. Further experiments are required to confirm the interaction between RGL2 and ABI3 in the future.

5. Conclusions

In this study, we demonstrated that the rapeseed line HY7201 exhibited a significantly higher LTG compared to HY3404 at 8 °C. A total of 76,996 DEGs were identified across the two rapeseed lines within 18 experimental groups. GO and KEGG analyses indicated that these DEGs are predominantly associated with plant hormone signaling, trehalose metabolism, and antioxidant activity. Furthermore, HY7201 displayed several uniquely enriched pathways related to antioxidant responses during germination under low-temperature stress, including vitamin B6 metabolism, caffeine metabolism, and nicotinate and nicotinamide metabolism. These pathways likely contribute to the enhanced tolerance and rapid germination observed in HY7201 under low-temperature conditions. Additionally, 29 time-specific and 17 cultivar-specific DEGs were identified. Of particular interest, the gene LOC106450539, located on chromosome A5 and encoding the DELLA protein BnaRGL2, emerged as a promising candidate involved in GA and ABA signaling pathways for improving LTG capacity in HY7201. Overall, our transcriptomic analysis elucidates the regulatory mechanisms underlying rapeseed germination at low temperatures and provides valuable genetic resources for advancing LTG traits in rapeseed breeding programs, particularly within the Yangtze River Basin.

Supplementary Materials

The following supporting information can be downloaded at: https://www.mdpi.com/article/10.3390/agronomy15112529/s1, Figure S1: Correlation between expression profiles of selected genes obtained from RNA-seq and RT-qPCR analysis; Figure S2: Analysis of differentially expressed genes (DEGs) in HY3404 and HY7201; Figure S3: Distribution of number of genes and transcription factors (TFs) in different modules in V1 (A) and V2 (B); Figure S4: Trend analysis and expression patterns of 4012 DEGs in 18h, 24h, 48h, 72h, and 96h in two genotypes; Figure S5: Multiple sequence alignment of the promoter sequences (2000 bp upstrem of ATG) of BnaRGL2 in ‘V1’ and ‘V2’; Figure S6: Multiple sequence alignment of the code sequences of BnaRGL2 in ‘V1’ and ‘V2’; Figure S7: Multiple sequence alignment of the putative protein sequences of BnaRGL2 in ‘V1’ and ‘V2’; Figure S8: Domain and 3D protein structure prediction in BnaRGL2; Figure S9: Spearman correlation coefficient (SCC) analysis of RNA-seq data from all 60 samples. Table S1: QTLs have been detected in rapeseed; Table S2: The primers of RT-qPCR; Table S3: Number of reads after filtering rRNA and low quality; Table S4: Comparing the numbles of DEGs of HY3404 (V1) and HY7201 (V2); Table S5: DEGs between HY3404 and HY7201; Table S6: Interactions prediction in RGL2. Excel S1: KEGG analysis of common DEGs, GO analysis of common DEGs, KEGG of time-specific DEGs, GO of time-specific DEGs; Excel S2: Blue module_HY3404, Brown module_HY3404, Green module_HY3404, Grey module_HY3404, Yellow module_HY3404, Red module_ HY3404, Turquoise module_HY3404 Blue module in HY7201, Brown module_HY7201, Green module_HY7201, Grey module_HY7201, Turquoise module_HY7201, Yellow module_HY7201; Excel S3: Brown_top10_HY3404, Green_top10_HY3404, Blue_top10_HY3404, Yellow_top10_HY3404, Grey_top9_HY3404, Grey_top7_HY7201, Blue_top10_HY7201, Brown_top10_HY7201, Green_top10_HY7201; Excel S4: 4012 DEGs in five points, 9 clusters of trend analysis, GO analysis of cluster 5, KEGG pathway of cluster 5, GO analysis of cluster 8, KEGG pathway of cluster 8, 163 DEGs in M1&M2&M3.

Author Contributions

J.Z., and L.L. conceived and designed the study. L.L. wrote the manuscript. J.Z., and X.Z. revised the manuscript. X.M. analyzed the experimental data. W.W. and H.L. collected samples. All authors jointly interpreted the data. W.W., and H.L. The final manuscript was approved by all authors. All authors have read and agreed to the published version of the manuscript.

Funding

This research was funded by Sponsored by Shanghai Sailing Program, grant number ‘’23YF1439500”.

Data Availability Statement

The original contributions presented in this study are included in the article/Supplementary Material. Further inquiries can be directed to the corresponding author(s) in the system.

Acknowledgments

During the preparation of this manuscript, the author(s) used AI-assisted tools Wordvice AI (https://wordvice.ai/cn, accessed on 26 September 2025) for the purposes of checking grammar and polishing the text. The authors have reviewed and edited the output and take full responsibility for the content of this publication.

Conflicts of Interest

The authors declare no conflicts of interest.

Abbreviations

The following abbreviations are used in this manuscript:
LTGLow-temperature germination
DEGsDifferentially Expressed Genes
WGCNAWeighted gene co-expression network analysis
GOGene Ontology
KEGGKyoto Encyclopedia of Genes and Genomes
GWASGenome-wide association studies
GAGibberellin
ABAAbscisic Acid

References

  1. FAO. Available online: https://www.fao.org/faostat/zh/#data/QCL/visualize (accessed on 3 September 2025).
  2. Tan, Z.; Han, X.; Dai, C.; Lu, S.; He, H.; Yao, X.; Che, P.; Yang, C.; Zhao, L.; Yang, Q.Y.; et al. Functional genomics of Brassica napus: Progresses, challenges, and perspectives. J. Integr. Plant Biol. 2024, 66, 484–509. [Google Scholar] [CrossRef]
  3. Hu, Q.; Hua, W.; Yin, Y.; Zhang, X.K.; Liu, L.L.; Shi, J.Q.; Zhao, Y.G.; Qin, L.; Chen, C.; Wang, H.Z. Rapeseed research and production in China. Crop J. 2017, 5, 127–135. [Google Scholar] [CrossRef]
  4. Wang, R.; Cheng, T.; Hu, L. Effect of wide-narrow row arrangement and plant density on yield and radiation use efficiency of mechanized direct-seeded canola in central China. Field Crops Res. 2015, 172, 42–52. [Google Scholar] [CrossRef]
  5. Wang, Z.; Han, Y.; Luo, S.; Rong, X.; Song, H.; Jiang, N.; Li, C.; Yang, L. Calcium peroxide alleviates the waterlogging stress of rapeseed by improving root growth status in a rice-rape rotation field. Front. Plant Sci. 2022, 13, 1048227. [Google Scholar] [CrossRef]
  6. Tian, Z.; Ji, Y.; Sun, L.; Xu, X.; Fan, D.; Zhong, H.; Liang, Z.; Gunther, F. Changes in production potentials of rapeseed in the Yangtze River Basin of China under climate change: A multi-model ensemble approach. J. Geogr. Sci. 2018, 28, 1700–1714. [Google Scholar] [CrossRef]
  7. Haj Sghaier, A.; Tarnawa, A.; Khaeim, H.; Kovacs, G.P.; Gyuricza, C.; Kende, Z. The effects of temperature and water on the seed germination and seedling development of rapeseed (Brassica napus L.). Plants 2022, 11, 2819. [Google Scholar] [CrossRef] [PubMed]
  8. Luo, T.; Zhang, Y.; Zhang, C.; Nelson, M.N.; Yuan, J.; Guo, L.; Xu, Z. Genome-wide association mapping unravels the genetic control of seed vigor under low-temperature conditions in rapeseed (Brassica napus L.). Plants 2021, 10, 426. [Google Scholar] [CrossRef]
  9. Zhu, J.; Wang, W.; Jiang, M.; Yang, L.; Zhou, X. QTL mapping for low temperature germination in rapeseed. Sci. Rep. 2021, 11, 23382. [Google Scholar] [CrossRef] [PubMed]
  10. Bhattacharya, A. Physiological Processes in Plants Under Low Temperature Stress; Springer: Singapore, 2022; pp. 1–106. [Google Scholar]
  11. Shi, Y.; Ding, Y.; Yang, S. Molecular Regulation of CBF Signaling in Cold Acclimation. Trends Plant Sci. 2018, 23, 623–637. [Google Scholar] [CrossRef] [PubMed]
  12. Ding, Y.; Shi, Y.; Yang, S. Regulatory networks underlying plant responses and adaptation to cold stress. Annu. Rev. Genet. 2024, 58, 43–65. [Google Scholar] [CrossRef]
  13. Li, D.; Zhang, C.; Dong, Z.; Yang, L.; Wang, H.; Wang, X.; Dirk, L.M.A.; Downie, A.B.; Zhao, T. ZmDREB1A Regulates myo-inositol-1-phosphate synthase 2 controlling maize germination at low temperatures. J. Agric. Food Chem. 2025, 73, 7562–7573. [Google Scholar] [CrossRef] [PubMed]
  14. Liu, J.; Chen, S.; Yuan, X.; Chen, J.; Tian, M.; Zhao, Z.; Guo, T.; Xiao, W. OsNAL11 and OsBURP12 affect rice seed germination at low temperature. Plant Cell Environ. 2025, 48, 6118–6139. [Google Scholar] [CrossRef]
  15. Wang, X.; Zou, B.; Shao, Q.; Cui, Y.; Lu, S.; Zhang, Y.; Huang, Q.; Huang, J.; Hua, J. Natural variation reveals that OsSAP16 controls low-temperature germination in rice. J. Exp. Bot. 2018, 69, 413–421. [Google Scholar] [CrossRef] [PubMed]
  16. Farooq, M.A.; Zeeshan Ul Haq, M.; Zhang, L.; Wu, S.; Mushtaq, N.; Tahir, H.; Wang, Z. Transcriptomic insights into salt stress response in two pepper species: The role of MAPK and plant hormone signaling pathways. Int. J. Mol. Sci. 2024, 25, 9355. [Google Scholar] [CrossRef]
  17. Liu, E.; Xu, L.; Luo, Z.; Li, Z.; Zhou, G.; Gao, H.; Fang, F.; Tang, J.; Zhao, Y.; Zhou, Z.; et al. Transcriptomic analysis reveals mechanisms for the different drought tolerance of sweet potatoes. Front Plant Sci. 2023, 14, 1136709. [Google Scholar] [CrossRef] [PubMed]
  18. Sun, F.; Fan, G.; Hu, Q.; Zhou, Y.; Guan, M.; Tong, C.; Li, J.; Du, D.; Qi, C.; Jiang, L.; et al. The high-quality genome of Brassica napus cultivar ‘ZS11’ reveals the introgression history in semi-winter morphotype. Plant J. 2017, 92, 452–468. [Google Scholar] [CrossRef]
  19. Wang, P.; Liu, F.; Wang, Y.; Chen, H.; Liu, T.; Li, M.; Chen, S.; Wang, D. Deciphering crucial salt-responsive genes in Brassica napus via statistical modeling and network analysis on dynamic transcriptomic data. Plant Physiol. Biochem. 2025, 220, 109568. [Google Scholar] [CrossRef]
  20. Liu, W.; Wang, Z.; Ren, R.; Liu, Y.; Qian, L.; Guan, M.; Guan, C.; He, X. Transcriptome uncovers BnaFBH3-mediated regulatory networks associated with tolerant to abiotic stress in Brassica napus. Environ. Exp. Bot. 2023, 216, 105541. [Google Scholar] [CrossRef]
  21. Luo, T.; Xian, M.; Zhang, C.; Zhang, C.; Hu, L.; Xu, Z. Associating transcriptional regulation for rapid germination of rapeseed (Brassica napus L.) under low temperature stress through weighted gene co-expression network analysis. Sci. Rep. 2019, 9, 55. [Google Scholar] [CrossRef]
  22. Privitera, G.F.; Treccarichi, S.; Nicotra, R.; Branca, F.; Pulvirenti, A.; Piero, A.R.L.; Sicilia, A. Comparative transcriptome analysis of B. oleracea L. var. italica and B. macrocarpa Guss. genotypes under drought stress: De novo vs reference genome assembly. Plant Stress 2024, 14, 100657. [Google Scholar] [CrossRef]
  23. Singh, K.P.; Kumari, P.; Yadava, D.K. Development of de-novo transcriptome assembly and SSRs in allohexaploid Brassica with functional annotations and identification of heat-shock proteins for thermotolerance. Front Genet. 2022, 13, 958217. [Google Scholar] [CrossRef] [PubMed]
  24. Song, J.; Chen, Y.; Jiang, G.; Zhao, J.; Wang, W.; Hong, X. Integrated analysis of transcriptome and metabolome reveals insights for low-temperature germination in hybrid rapeseeds (Brassica napus L.). J. Plant Physiol. 2023, 291, 154120. [Google Scholar] [CrossRef]
  25. Wang, R.; Wu, G.; Zhang, J.; Hu, W.; Yao, X.; Jiang, L.; Zhu, Y. Integration of GWAS and transcriptome analysis to identify temperature-dependent genes involved in germination of rapeseed (Brassica napus L.). Front. Plant Sci. 2025, 16, 1551317. [Google Scholar] [CrossRef]
  26. Chen, S.; Zhou, Y.; Chen, Y.; Gu, J. fastp: An ultra-fast all-in-one FASTQ preprocessor. Bioinformatics 2018, 34, i884–i890. [Google Scholar] [CrossRef] [PubMed]
  27. Kim, D.; Paggi, J.M.; Park, C.; Bennett, C.; Salzberg, S.L. Graph-based genome alignment and genotyping with HISAT2 and HISAT-genotype. Nat. Biotechnol. 2019, 37, 907–915. [Google Scholar] [CrossRef]
  28. Anders, S.; Pyl, P.T.; Huber, W. HTSeq-a Python framework to work with high-throughput sequencing data. Bioinformatics 2015, 31, 166–169. [Google Scholar] [CrossRef]
  29. Cui, Z.; Liu, Y.; Zhang, J.; Qiu, X. Super-delta2: An enhanced differential expression analysis procedure for multi-group comparisons of RNA-seq data. Bioinformatics 2021, 37, 2627–2636. [Google Scholar] [CrossRef]
  30. Cui, Z.; Liu, Y.; Zhang, J.; Qiu, X. A survey of quantitative real-time polymerase chain reaction internal reference genes for expression studies in Brassica napus. Anal. Biochem. 2010, 405, 138–140. [Google Scholar] [CrossRef] [PubMed]
  31. Wu, T.; Hu, E.; Xu, S.; Chen, M.; Guo, P.; Dai, Z.; Feng, T.; Zhou, L.; Tang, W.; Zhan, L.; et al. cluster Profiler 4.0: A universal enrichment tool for interpreting omics data. Innovation 2021, 2, 100141. [Google Scholar]
  32. Langfelder, P.; Horvath, S. WGCNA: An R package for weighted correlation network analysis. BMC Bioinform. 2008, 9, 559. [Google Scholar] [CrossRef]
  33. Shannon, P.; Markiel, A.; Ozier, O.; Baliga, N.S.; Wang, J.T.; Ramage, D.; Amin, N.; Schwikowski, B.; Ideker, T. Cytoscape: A software environment for integrated models of biomolecular interaction networks. Genome Res. 2003, 13, 2498–2504. [Google Scholar] [CrossRef]
  34. Robert, X.; Gouet, P. Deciphering key features in protein structures with the new ENDscript server. Nucleic Acids Res. 2014, 42, W320–W324. [Google Scholar] [CrossRef]
  35. Letunic, I.; Khedkar, S.; Bork, P. SMART: Recent updates, new developments and status in 2020. Nucleic Acids Res. 2021, 49, D458–D460. [Google Scholar] [CrossRef]
  36. Waterhouse, A.; Bertoni, M.; Bienert, S.; Studer, G.; Tauriello, G.; Gumienny, R.; Heer, F.T.; de Beer, T.A.P.; Rempfer, C.; Bordoli, L.; et al. TSWISS-MODEL: Homology modelling of protein structures and complexes. Nucleic Acids Res. 2018, 46, W296–W303. [Google Scholar] [CrossRef] [PubMed]
  37. Zhao, X.Q.; He, Y.Q.; Liu, Y.X.; Wang, Z.F.; Zhao, J. JAZ proteins: Key regulators of plant growth and stress response. Crop J. 2024, 12, 1505–1516. [Google Scholar] [CrossRef]
  38. Ju, L.; Jing, Y.; Shi, P.; Liu, J.; Chen, J.; Yan, J.; Chu, J.; Chen, K.M.; Sun, J. JAZ proteins modulate seed germination through interaction with ABI5 in bread wheat and Arabidopsis. New Phytol. 2019, 223, 246–260. [Google Scholar] [CrossRef]
  39. Gomi, K.; Sasaki, A.; Itoh, H.; Ueguchi-Tanaka, M.; Ashikari, M.; Kitano, H.; Matsuoka, M. GID2, an F-box subunit of the SCF E3 complex, specifically interacts with phosphorylated SLR1 protein and regulates the gibberellin-dependent degradation of SLR1 in rice. Plant J. 2004, 37, 626–634. [Google Scholar] [CrossRef] [PubMed]
  40. Xu, Q.; Song, Y.; Bao, D.; Meng, L.Z.; Di, H.; Zhang, L.; Dong, L.; Zeng, X.; Zhang, J.Y.; Li, C.X.; et al. ZmBARK1 as a low-temperature tolerance gene in maize germination. Crop J. 2025, 73, 7562–7573. [Google Scholar] [CrossRef]
  41. Yamauchi, Y.; Ogawa, M.; Kuwahara, A.; Hanada, A.; Kamiya, Y.; Yamaguchi, S. Activation of Gibberellin biosynthesis and response pathways by low temperature during imbibition of seeds. Plant Cell. 2004, 16, 367–378. [Google Scholar] [CrossRef]
  42. Li, Q.; Yang, A. Comparative studies on seed germination of two rice genotypes with different tolerances to low temperature. Environ. Exp Bot. 2020, 179, 104216. [Google Scholar] [CrossRef]
  43. Li, C.; Dong, S.; Beckles, D.M.; Miao, H.; Sun, J.; Liu, X.; Wang, W.; Zhang, S.; Gu, X. The qLTG1.1 candidate gene CsGAI regulates low temperature seed germination in cucumber. Theor. Appl. Genet. 2022, 135, 2593–2607. [Google Scholar] [CrossRef] [PubMed]
  44. Zhang, Y.; Liu, P.; Zou, C.; Chen, Z.; Yuan, G.; Gao, S.; Pan, G.; Shen, Y.; Ma, L. Comprehensive analysis of transcriptional data on seed germination of two maize inbred lines under low-temperature conditions. Plant Physiol. Biochem. 2023, 201, 107874. [Google Scholar] [CrossRef]
  45. Berglund, T.; Wallström, A.; Nguyen, T.V.; Laurell, C.; Ohlsson, A.B. Nicotinamide; antioxidative and DNA hypomethylation effects in plant cells. Plant Physiol. Biochem. 2017, 118, 551–560. [Google Scholar] [CrossRef]
  46. Meng, A.; Wen, D.; Zhang, C. Dynamic Changes in Seed Germination under Low-Temperature Stress in Maize. Int. J. Mol. Sci. 2022, 23, 5495. [Google Scholar] [CrossRef]
  47. Zhao, Y.; Chen, D.; Grin, I.R.; Zharkov, D.O.; Yu, B. Developing plant-derived DNA repair enzyme resources through studying the involvement of base excision repair DNA glycosylases in stress responses of plants. Physiol. Plant. 2025, 177, e70162. [Google Scholar] [CrossRef]
  48. Eastmond, P.J.; Graham, I.A. Re-examining the role of the glyoxylate cycle in oilseeds. Trends Plant Sci. 2001, 6, 72–78. [Google Scholar] [CrossRef]
  49. Liu, J.; Yuan, X.; Tian, M.; Chen, J.; Chen, C.; Luo, Z.; Guo, T.; Huo, X.; Xiao, W. OsNAL11 and OsGASR9 Regulate the low-temperature germination of rice seeds by affecting GA content. Int. J. Mol. Sci. 2024, 25, 11291. [Google Scholar] [CrossRef] [PubMed]
  50. Yang, L.; Jiang, Z.; Liu, S.; Lin, R. Interplay between REVEILLE1 and RGA-LIKE2 regulates seed dormancy and germination in Arabidopsis. New Phytol. 2020, 225, 1593–1605. [Google Scholar] [CrossRef] [PubMed]
  51. Lopez-Molina, L.; Mongrand, S.; McLachlin, D.T.; Chait, B.T.; Chua, N.H. ABI5 acts downstream of ABI3 to execute an ABA-dependent growth arrest during germination. Plant J. 2002, 32, 317–328. [Google Scholar] [CrossRef]
Figure 1. Seed germination phenotypes of Brassica napus inbred lines ‘HY3404’ and ‘HY7201’ under normal temperature (25 °C) and low temperature (8 °C). (A) Visual representation of germination in ‘HY3404’ and ‘HY7201’ at 24, 48, and 72 h under dark conditions at 25 °C. (B) Germination rates of ‘HY3404’ and ‘HY7201’ measured at 25 °C. (C) Measurements of hypocotyl and root lengths for both lines at 72 h under 25 °C. (D) Germination progression of ‘HY3404’ and ‘HY7201’ at 72, 96, 120, 144, and 168 h under dark conditions at 8 °C. (E) Germination rates of ‘HY3404’ and ‘HY7201’ at 8 °C. (F) Hypocotyl and root lengths of both lines after 15 days at 8 °C. (G) Water uptake rates of HY3404 and HY7201 prior to radicle emergence at 25 °C and 8 °C. A significant difference in water uptake between HY3404 and HY7201 at 8 °C after 3 h was observed (p = 0.026). Statistical significance was determined using a two-tailed Student’s t-test, with * indicating p < 0.05, *** indicating p < 0.001, and ns denoting no significant difference. Temperature treatment starts from 0 h of dry seeds and runs through the entire imbibition and germination process.
Agronomy 15 02529 g001
Figure 2. Global gene expression profiling in early seed germination under low temperature. (A) Fraction of genes expressed at different expression levels (based on FPKM) in different time points of development in ‘HY3404’ (V1) and ‘HY7201’ (V2) are shown in the bar graphs. (B) Principal component analysis (PCA) of the RNA-Seq data showing clustering of transcriptomes of different time points of LTG in HY3404 (V1_0h–V1_96h) and HY7201 (V2_0h–V2_96h).
Agronomy 15 02529 g002
Figure 3. Preferential/time-specific expression of genes during seed germination under low temperature in rapeseed cultivars. (A) Bar graph showing the number of DEGs in HY3404 and HY7201 at each time point of LTG. (B) Veen analysis showing the number of preferentially expressed genes specifically and commonly in HY3404 (V1) and HY7201(V2) at each time point of LTG.
Agronomy 15 02529 g003
Figure 4. Time-specific gene expression during LTG in HY3404 (V1) and HY7201 (V2) at each time point. The vertical dotted lines in the volcano plot represent the screening threshold reference lines (|log2FC| ≥ 1 and p-value < 0.05) and mark the top 20 significantly upregulated and downregulated genes.
Agronomy 15 02529 g004
Figure 5. GO terms and KEGG pathways were significantly enriched, commonly or specifically, in HY3404 and HY7201. GO terms (A) and KEGG (B) pathways significantly enriched common DEGs between HY3404 and HY7201 at 3 h, 6 h, 9 h, 12 h, 18 h, 24 h, 48 h, 72 h, and 96 h. GO terms (C) and KEGG (D) pathways significantly enriched time-specific genes in HY3404 and HY7201 at 3 h, 6 h, 9 h, 12 h, 18 h, 24 h, 48 h, 72 h, and 96 h.
Agronomy 15 02529 g005
Figure 6. Cluster dendrogram and correlation heatmap of module eigengenes with seed germination time points under low temperature in HY3404 (V1) and HY7201 (V2). (A,B) Cluster dendrograms of module eigengenes in V1 (A) and V2 (B). (C,D) Heatmaps showing correlation of module eigengenes with different time points of LTG in V1 (C) and V2 (D). Pearson correlation coefficient of each module with different time points of LTG is given and colored according to the score. MEgrey represents all small modules in (A,B).
Agronomy 15 02529 g006
Figure 7. The ten most significant hub genes within the transcriptional regulatory network corresponding to the identified modules. (A) The top ten hub genes in each module exhibiting relatively strong correlations in HY3404 and HY7201. The color of the outer circle denotes the respective module color, while the intensity of the inner circle shading reflects the gene’s hub score, with darker shades indicating higher scores. (B) Expression patterns of 29 hub genes in both genotypes.
Agronomy 15 02529 g007
Figure 8. Differentially expressed genes (DEGs) in both genotypes at 18 h, 24 h, 48 h, 72 h, and 96 h during LTG treatment. (A) Venn diagram analysis of DEGs across the time points (18 h, 24 h, 48 h, 72 h, and 96 h) in both genotypes. (B) Trend analysis and expression profiles of cluster 5 and cluster 8. (C) Gene Ontology (GO) enrichment analysis for cluster 5 and cluster 8. (D) KEGG pathway enrichment analysis for cluster 5 and cluster 8.
Agronomy 15 02529 g008
Figure 9. Candidate genes conserved in two genotypes. (A) Veen analysis identified the common DEGs among M5, Module_V1, and Module_V2. M5 indicates the five time points at 18H, 24H, 48H, 72H, and 96H in both genotypes, which are all relative to 0h as the control. Module_V1 indicates the genes from the five modules have relatively high correction in HY3404, whereas Module_V2 indicates the genes from the four modules have relatively high correction in HY7201. (B) Veen analysis identified the common DEGs among M, Cluster5_M5, and Cluster8_M5. M indicates the common DEGs in (A). (C) PPI network of BnaRGL2 and the expression pattern in BnaRGL2 and interaction factors.
Agronomy 15 02529 g009
Table 1. Twenty-nine hub genes with relatively high correction modules in V1 and V2.
GenotypeModulesTime SpecificGene IDFunction PredictionGene Name
HY3404Brown24 hLOC106391721DEAD-box ATP-dependent RNA helicase 37, BnaC04g48400DRH37
LOC106407757receptor-like protein kinase HERK 1HERK1
LOC106442470serine/threonine protein phosphatase 2A, BnaA03g41870DPUX5
Green18 hLOC111204773Vacuolar import/degradation, Vid27 related protein, BnaC05g33690D CYPRO4
LOC106437922receptor-like protein kinase FERONIA isoform X2 FER
LOC106346028non-functional pseudokinase ZED1-likeZED1
Blue48 h & 72 hLOC106435414nascent polypeptide-associated complex subunit alpha-like protein 1At3g12390
LOC10635788760S ribosomal protein L144 RPL36AA
LOC10638248260S ribosomal protein L13a-4-like RPL13AD
Yellow96 hLOC10640047860S acidic ribosomal protein family, BnaC05g00800D RPP1C
LOC10635842860S ribosomal protein L10a-2-likeRPL10AB
LOC10641082960S ribosomal protein L17-2-like, BnaA07g25010D RPL17B
Grey48 hLOC106372082cytochrome P450 83B1, BnaC08g05690DCYP83B1
LOC106361266cytochrome P450 83B1 CYP83B1
LOC106353095probable mediator of RNA polymerase II transcription subunit 37c MED37C
LOC106377472probable mediator of RNA polymerase II transcription subunit 37cMED37C
HY7201Grey48 hLOC106391892LOB domain-containing protein 40LBD40
LOC106381058LOB domain-containing protein 40, BnaC02g17190DLBD40
BNAA09G46370DRNA binding (RRM/RBD/RNP motifs) family protein, BnaA09g46370D NUCL1
LOC106351544probable mediator of RNA polymerase II transcription subunit 37c MED37C
Blue72 h & 96 hLOC10637551460S ribosomal protein L31-1-likeRPL31A
LOC10641115160S ribosomal protein L18-2-like RPL18B
LOC106391302ubiquitin-60S ribosomal protein L40-like UBICEP52-7
Brown18 h & 24 hLOC106360317protein TIFY 5A-like, jasmonate zim domain protein 8 (JAZ8)TIFY5A
LOC106385325ethylene-responsive transcription factor ABR1-like, BnaC03g49530DABR1
LOC106420127glutamyl-tRNA reductase 2, chloroplastic-likeHEMA2
Green96 hLOC111205445cytosolic ribosomal protein S15, BnaC05g02380DRPS15A
LOC10643770140S ribosomal protein S12-2, BnaC03g17910DRPS12C
LOC10637120440S ribosomal protein S13-2-like RPS13B
Table 2. Seventeen key genotype-specific candidate genes for LTG.
ClustersGene_IDChromosomeFunction PredictionGene Name
5LOC106450539NW_019168954.1DELLA protein RGL2 isoform X2 [Brassica napus]RGL2
5LOC106391695NC_027770.2multifunctional methyltransferase subunit TRM112-like protein At1g22270 isoform X4 [Brassica napus], BnaC07g13840D At1g22270
5LOC106361648NC_027764.2auxin-responsive protein SAUR64-like [Brassica napus]SAUR64
5LOC106401784NC_027771.2protein LHY-like [Brassica napus]LHY
5LOC106363703NC_027765.2homeodomain-leucine zipper protein [Brassica napus]ATHB-6
5LOC106417715NW_019169007.1F-box protein DOR-like [Brassica napus], BnaC04g13150D DOR
5BNAC08G30070DNC_027774.2uncharacterized protein LOC106413893 [Brassica napus], BnaC08g30070D -
8LOC106392538NC_027770.2uncharacterized protein, BnaC04g03310D [Brassica napus]ARL
8LOC106367598NC_027765.2probable galacturonosyltransferase-like 8 [Brassica napus], BnaA09g29710D GATL8
8LOC106443577NC_027759.2ethylene-responsive transcription factor ABI4-like [Brassica napus]ABI4
8LOC106375427NC_027768.2selenoprotein H-like [Brassica napus], BnaC01g07140D SELENOH
8LOC106389643NW_019168773.1nuclear transport factor 2 [Brassica napus]NTF2B
8LOC111197801NC_027762.2probable trehalose-phosphate phosphatase J [Brassica napus]TPPJ
8LOC106411651NC_027773.2ribosomal L1 domain-containing protein 1-like [Brassica napus], BnaC04g23460DRSL1D1
8LOC106426182NC_027775.2xylulose 5-phosphate/phosphate translocator, chloroplastic-like [Brassica napus], BnaC09g40320DXPT
8LOC106448658NC_027769.260S ribosomal protein L4-1 [Brassica rapa]RPL4A
8LOC106411239NC_027761.2uncharacterized protein LOC106411239 [Brassica napus]-
Disclaimer/Publisher’s Note: The statements, opinions and data contained in all publications are solely those of the individual author(s) and contributor(s) and not of MDPI and/or the editor(s). MDPI and/or the editor(s) disclaim responsibility for any injury to people or property resulting from any ideas, methods, instructions or products referred to in the content.