Article

The Effects of Maize–Soybean and Maize–Peanut Intercropping on the Spatiotemporal Distribution of Soil Nutrients and Crop Growth

College of Agriculture, Shihezi University, Shihezi 832003, China
*
Authors to whom correspondence should be addressed.
Agronomy 2025, 15(11), 2527; https://doi.org/10.3390/agronomy15112527
Submission received: 28 September 2025 / Revised: 25 October 2025 / Accepted: 29 October 2025 / Published: 30 October 2025
(This article belongs to the Section Innovative Cropping Systems)

Abstract

The spatiotemporal dynamics of soil nutrients in the crop row zone are critical determinants of crop yield, necessitating precision fertilization for optimal plant growth. However, previous studies have predominantly focused on plant-available nutrient status at the scale of entire cropping systems, yet a granular understanding of their distribution patterns across precise temporal and spatial dimensions remains limited. Therefore, this study investigated maize–legume intercropping systems to quantify the dynamics of soil alkaline-hydrolyzable nitrogen (AN), available phosphorus (AP), and available potassium (AK) across distinct growth stages, soil depths, and row positions. The experiment comprised five treatments: maize–soybean intercropping, maize–peanut intercropping, and monocultures of maize, soybean, and peanut. Throughout the two-year study, maize–soybean intercropping significantly enhanced the plant height of both maize and soybean relative to their respective monocultures (p < 0.05). In contrast, within the maize–peanut system, intercropping significantly promoted peanut plant height but suppressed stem diameter in both species (p < 0.05); these effects were consistent across both study years. Both systems exhibited a “benefit-sacrifice” pattern, where dry matter was preferentially allocated to maize, thereby increasing total system productivity despite suppressing legume growth. Furthermore, during the mid-to-late growth stages, intercropped maize showed an enhanced capacity for nitrogen uptake from deeper soil layers. In contrast, the alkaline-hydrolyzable nitrogen content in intercropped soybean and peanut remained lower than in their respective monocultures throughout the growth period, with reductions ranging from 8.49% to 34.79%. Intercropping significantly increased the soil available phosphorus content in the root zones of maize, soybean, and peanut compared to their respective monocultures. The available phosphorus content in the 0–20 cm soil layer was consistently higher than in monoculture systems, with a maximum increase of 41.70%. Moreover, intercropping effectively mitigated soil potassium depletion, resulting in a smaller decline in available potassium. This effect was most pronounced in the maize–peanut intercropping pattern within the 20–40 cm soil layer. The distribution of soil available nutrients (N, P, K) was also influenced by drip tape placement. The levels of these nutrients for soybean and peanut were higher at 50 cm from the drip tape than at 30 cm, while for maize, levels were higher at 80 cm than at 40 cm. Intercropping increased the thousand-kernel weight of maize and soybean but decreased that of peanut. Overall, the strategic row configuration optimized the yield performance of both intercropping systems, resulting in land equivalent ratios greater than 1, which indicates distinct yield advantages for both intercropping patterns.

1. Introduction

Global agricultural systems are confronting mounting pressures from climate change, arable land degradation, and a shrinking labor force. According to the China Agricultural Outlook Report (2024–2033), China’s grain consumption is projected to grow steadily at an annual rate of 0.3%, with the actual growth potential likely surpassing current projections. Despite China’s total grain production reaching a historic high of 1.4 trillion jin (700 million metric tons) in 2024, the fundamental “tight balance” between supply and demand persists. For populous countries like China, sustaining agricultural development is paramount; however, this cannot be achieved through unrestrained resource inputs. The solution lies in enhancing the utilization efficiency of limited land resources while minimizing external inputs [1]. Furthermore, long-term monoculture systems often lead to inefficient resource use, diminished biodiversity, and soil fertility degradation. Therefore, sustainable agricultural intensification is essential to actively respond to national policies aimed at expanding oilseed production, alleviating land competition between maize and soybeans, and conserving natural resources [2]. The adoption of maize–soybean intercropping systems presents a promising strategy to address these challenges and achieve a win-win scenario by enhancing both total yield and resource utilization efficiency.
Soil fertility is a cornerstone of sustainable agriculture, as it governs the supply of essential nutrients for crop growth [3]. In intercropping systems, the uptake dynamics of the three primary mineral elements—nitrogen (N), phosphorus (P), and potassium (K)—are intrinsically linked to the observed yield advantages [4,5]. Nitrogen is indispensable for plant growth and development [6,7,8,9]. Absorbed primarily as nitrate (NO3) and ammonium (NH4+) through the root system, nitrogen is integral to critical physiological processes including cell division, elongation, and the regulation of photosynthesis and respiration [10,11]. Phosphorus is another vital nutrient for crops [9,12,13]. Its bioavailability in ecosystems is determined by both its content and chemical forms [14], and it plays a central role in various metabolic processes, including nucleic acid synthesis, respiratory metabolism, and enzyme activity [15]. Liu et al. (2022) [16] demonstrated that maize–soybean intercropping significantly enhances the concentration of rhizosphere organic acids, such as citric and malic acid. These organic acids effectively mobilize sparingly soluble phosphorus (e.g., Ca-P and Fe/Al-P) into plant-available forms through ligand exchange and soil acidification, an effect that was more pronounced in the maize rhizosphere. This was evidenced by a decline in the concentrations of readily available phosphorus (Ca2-P) and moderately labile phosphorus (Al-P, Fe-P), confirming that root exudates are a pivotal mechanism driving phosphorus activation. This interspecific complementarity, characterized as “legume-driven phosphorus activation and cereal-driven phosphorus acquisition,” was further elucidated by Ou et al. (2024) [17]. Their research revealed that soybean, through the formation of cluster roots and the secretion of substantial organic acids and protons, specifically mobilizes recalcitrant phosphorus pools (e.g., Fe-P, Ca2-P) that are otherwise poorly available to cereals. In a complementary strategy, maize, with its more extensive root system, efficiently absorbs the mobilized phosphorus. The differentiation and synergy in phosphorus acquisition strategies between the two species underpin the enhanced phosphorus use efficiency observed in intercropping systems [17]. Moreover, potassium is fundamental to overall ecosystem sustainability [18], playing a crucial role in enhancing stress resistance, improving photosynthetic efficiency, and boosting crop quality and yield [19]. The synergistic interactions of N, P, and K in intercropping systems create a characteristic “spatiotemporal nutrient complementary effect.” This effect manifests as deep-rooted components activating sparingly soluble soil phosphorus pools through rhizosphere acidification [20,21], while shallow-rooted components preferentially absorb nitrogen from the topsoil. This niche differentiation thereby enhances the overall nutrient use efficiency of the system.
However, current research has predominantly centered on the vertical interactions between crops and soil [22,23,24]. These studies often rely on static sampling at key growth stages and primarily evaluate the overall benefits of intercropping, thereby failing to capture the continuous dynamics of interspecific nutrient competition throughout the growth cycle. A particular limitation is the imprecise identification of critical nutrient uptake periods. Consequently, enhanced monitoring and analysis of the spatiotemporal dynamics of soil nutrients are needed to elucidate the competitive and complementary nutrient acquisition relationships in intercropping and to provide a precise basis for optimizing fertilization strategies. Therefore, a detailed investigation of the spatiotemporal dynamics of soil nutrients—encompassing horizontal distribution, vertical migration, and temporal variation—in intercropping systems is essential. Such research can inform the development of scientific fertilization schemes, thereby improving nutrient uptake efficiency [24], reducing reliance on external inputs [25], enhancing soil health and system resilience, and ultimately boosting overall agricultural productivity. This understanding is critical for advancing sustainable intensification of agriculture. This study aims to investigate the spatiotemporal dynamics of soil nutrients in intercropping systems and their relationship with crop growth, thereby deepening our understanding of the yield-enhancing mechanisms and providing a basis for system optimization.
A two-year field experiment was conducted with five treatments: maize–soybean intercropping (IMS), maize–peanut intercropping (IMP), maize monoculture (MM), soybean monoculture (MS), and peanut monoculture (MP). The objectives of this study were to (a) investigate the spatiotemporal dynamics of key soil nutrients in intercropping systems; (b) examine the effects of intercropping on crop growth and biomass accumulation; (c) evaluate the yield advantages of intercropping systems using the land equivalent ratio (LER); and (d) compare the performance of soybean and peanut in these systems to identify the more effective legume partner for intercropping with maize. We hypothesized that (a) intercropping would increase soil alkaline-hydrolyzable nitrogen (AN) in the maize row but decrease it in the legume rows while enhancing available phosphorus (AP) content across all crop rows and mitigating soil available potassium (AK) depletion, and (b) dry matter would be preferentially allocated to maize, increasing total system yield at the expense of legume growth.

2. Materials and Methods

2.1. Experimental Site

Field experiments were conducted in 2024 and 2025 in Erlian, Beiquan Town, Shihezi City, Xinjiang, China (44°40′ N, 85°94′ E), a region characterized by a temperate continental arid climate and reliant on irrigated agriculture. Meteorological conditions during the experimental period are shown in Figure 1. The total precipitation during the growing season (April to September) was 98.5 mm in 2024 and 135.7 mm in 2025. The highest mean monthly temperature in both years was recorded in July. However, the months with the maximum monthly precipitation differed between the two years, occurring in April 2024 and May 2025.
To characterize initial soil fertility, baseline soil samples were collected at sowing from three depth increments (0–20, 20–40, and 40–60 cm) with three replicates per depth. The initial soil properties are summarized in Table 1.

2.2. Experimental Design and Crop Management

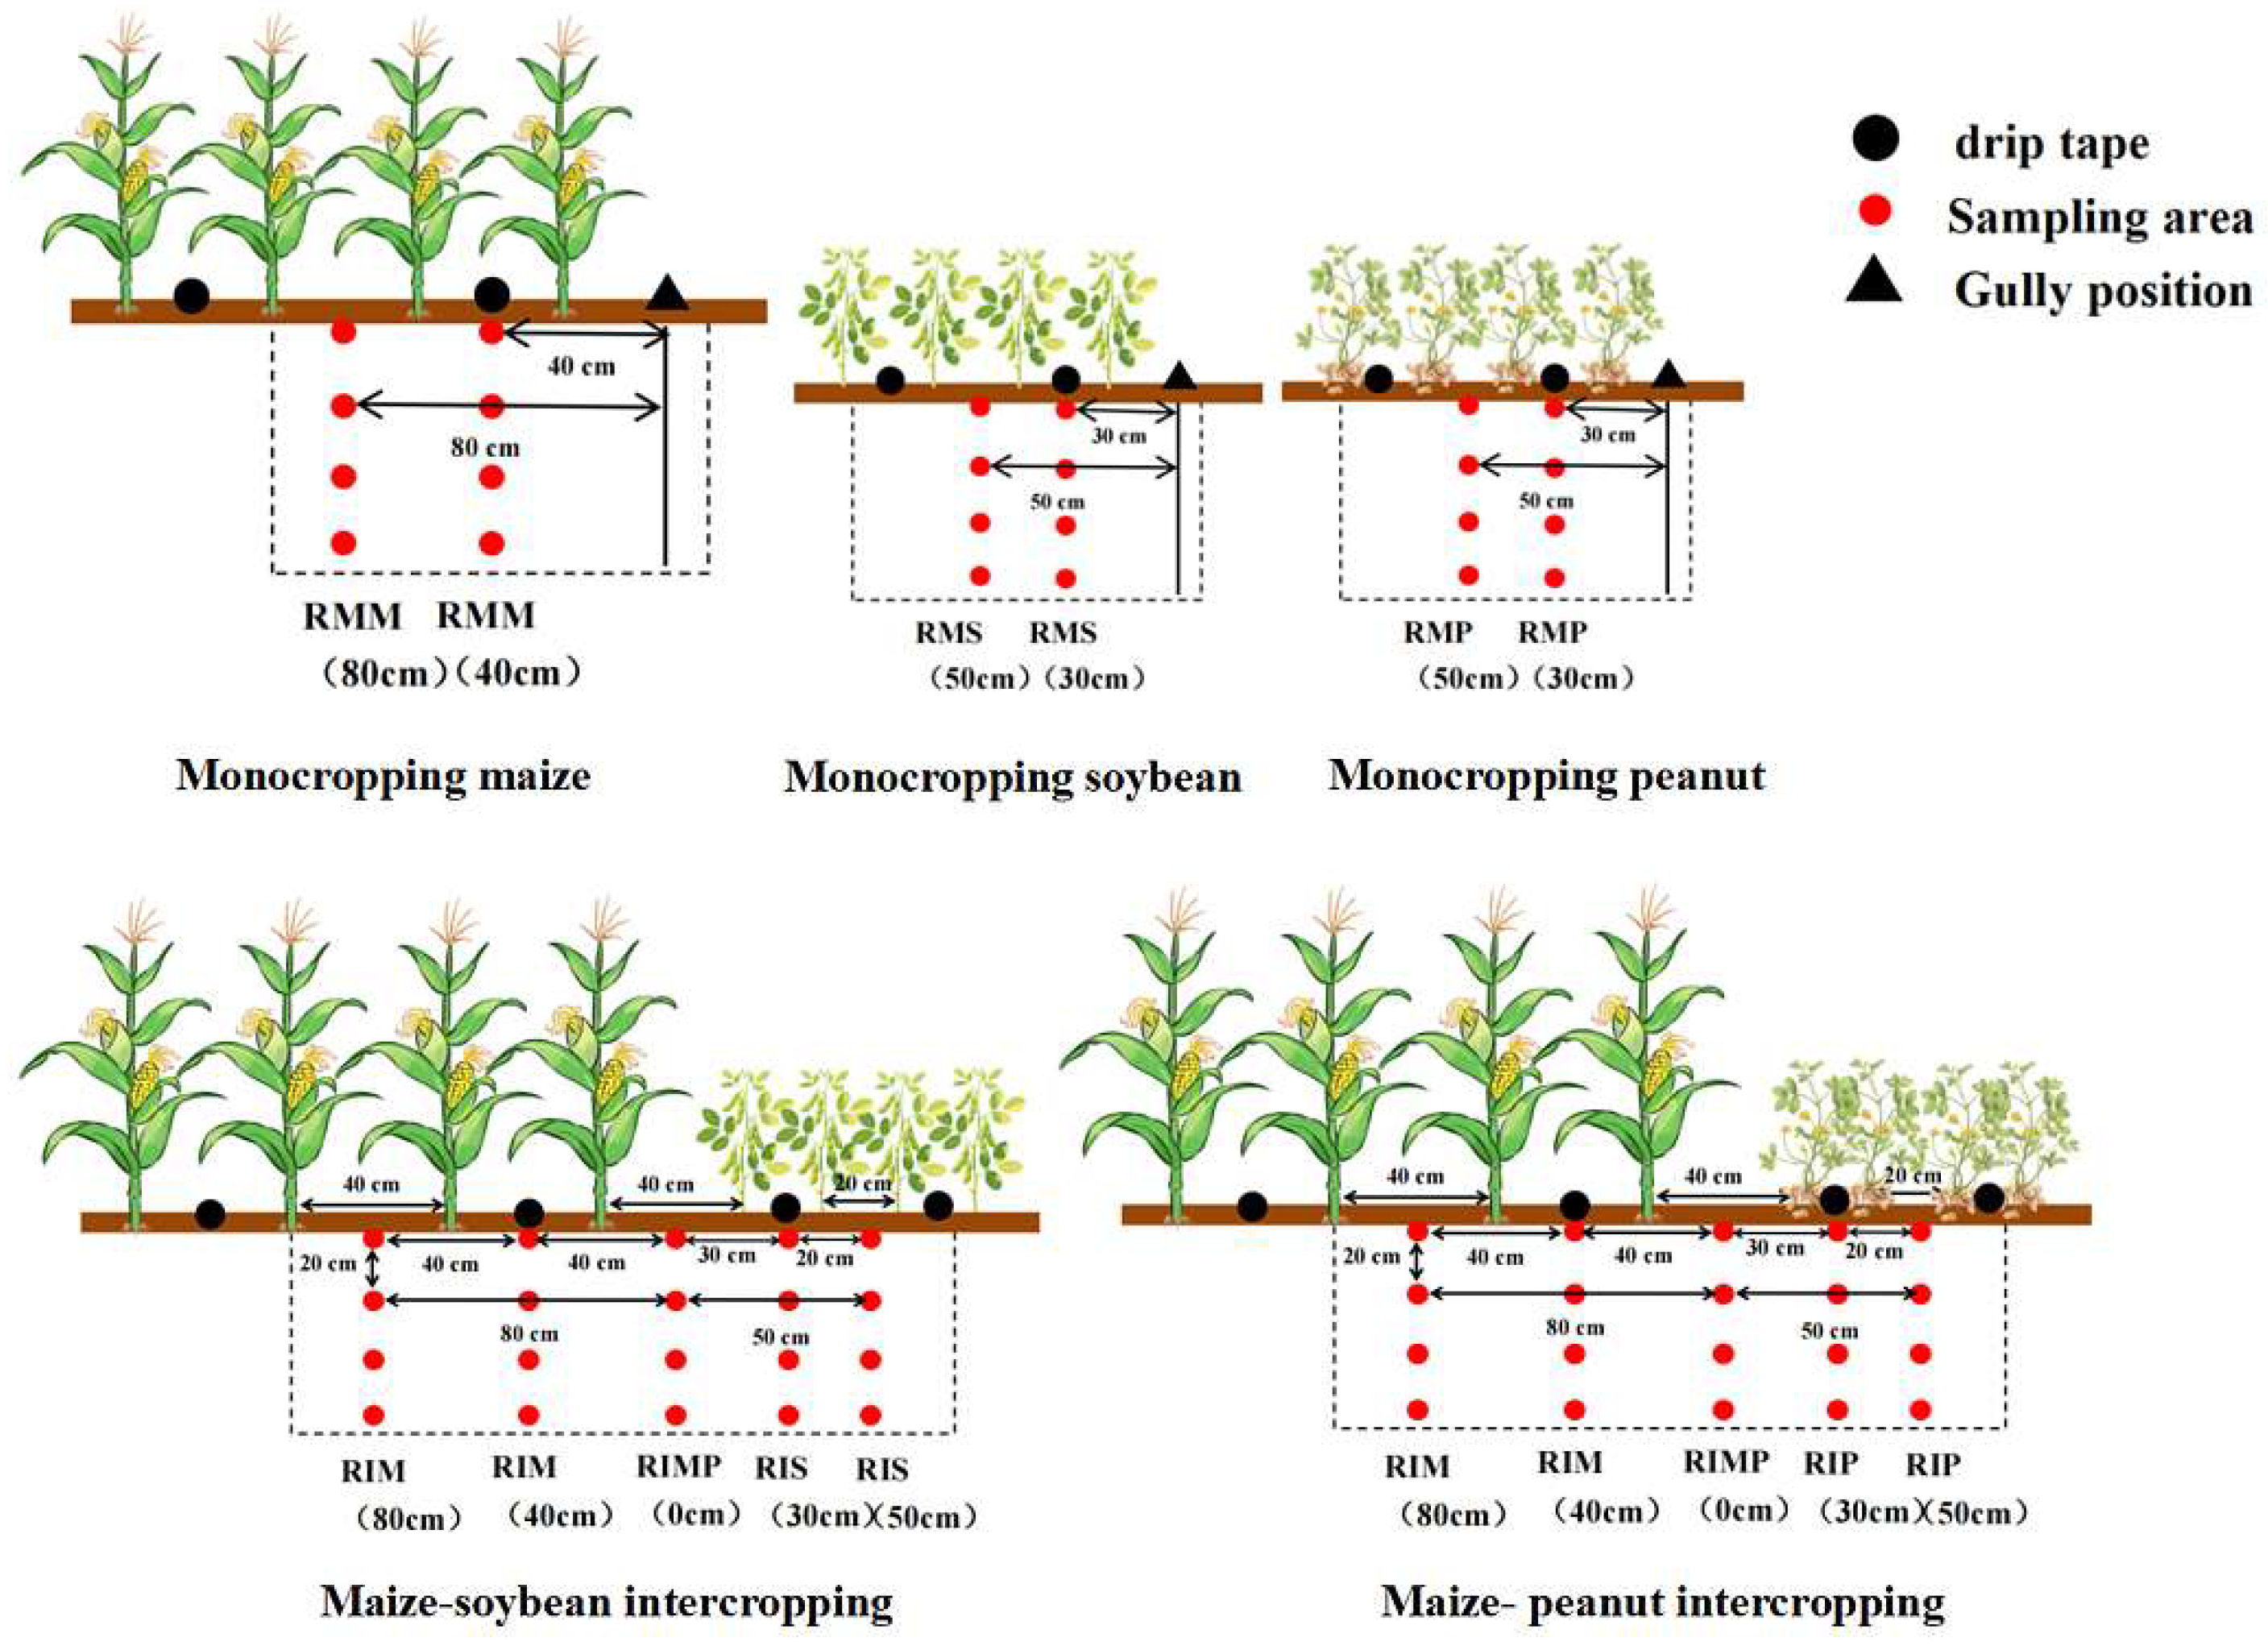
The maize cultivar “Zhengdan 958”, the soybean cultivar “Dongsheng No. 5”, and the peanut cultivar “Wanhua No. 3” were selected as experimental materials for both monoculture and intercropping trials (all three crops are widely cultivated varieties in this region). The trial employed a completely randomized block design with five treatments and three replications. The treatments were as follows: (a) maize–soybean intercropping (IMS); (b) maize–peanut intercropping (IMP); (c) maize monoculture (MM); (d) soybean monoculture (MS); and (e) peanut monoculture (MP). Each plot measured 24 m2 (3 m × 8 m). The inter-row spacing for maize and legumes was uniformly 0.40 m. Maize row spacing was 0.40 m with 0.20 m plant spacing, while soybean and peanut row spacing was 0.20 m with 0.10 m plant spacing (Figure 2). Following emergence, one plant per hill was retained for maize and one plant per hill for soybean and peanut. The planting density for maize monoculture was 1.20 × 10⁵ plants ha−1, while for maize intercropped with legumes it was 8.00 × 10⁴ plants ha−1. The planting density for soybean and peanut monocultures was 3.50 × 10⁵ plants ha−1, and for soybean and peanut intercropped with maize it was 1.60 × 10⁵ plants ha−1. Maize and soybeans were sown simultaneously. Nitrogen fertilizer was applied as urea according to field requirements: maize received 150 kg N ha−1 (40% as basal fertilizer, 60% as top dressing during the jointing stage), while soybeans received 30 kg N ha−1 as basal fertilizer. Phosphate fertilizer (NH4H2PO4) and potassium fertilizer (K2SO4) were applied as basal fertilizer in a single application at rates of 102 kg NH4H2PO4 ha−1 and 69 kg K2SO4 ha−1, respectively. Prior to sowing, fertilizers were uniformly broadcast onto the soil surface and incorporated into the 0–20 cm soil layer through tillage. Irrigation was conducted via drip irrigation, with a frequency of once every 10–15 days. Each irrigation application delivered 609 m3 hm−2, totaling 10 irrigation events. Topdressing was administered through water–fertilizer integration technology.

2.3. Soil Sample Collection

Soil samples were collected in triplicate at each sampling site during three key growth stages (T1, T2, and T3) of the crops in the 2024 and 2025 growing seasons: the first sampling was conducted in mid-June, corresponding to the jointing stage of maize, the branching stage of soybean, and the flowering and pod-setting stage of peanut. The second sampling was carried out in mid-to-late July, coinciding with the tasseling stage of maize and the pod-setting stage of both soybean and peanut. The final sampling was performed in mid-to-late September at the maturity stage of all three crops. Intact soil cores were collected using a cylindrical stainless steel sampler (inner diameter: 4.5 cm; volume: 141 cm3) manually driven vertically into the soil profile with a sledgehammer. At each sampling point, soil cores were collected at three depths: 0–20 cm, 20–40 cm, and 40–60 cm. Sampling locations included the following: (a) between the first and second rows of maize monoculture RMM (40 cm) and between the second and third rows RMM (80 cm); (b) between the first and second rows of soybeans grown in monoculture RMS (30 cm), and between the second and third rows RMS (50 cm); (c) between the first and second rows of peanuts grown in monoculture RMS (30 cm), and between the second and third rows RMS (50 cm); (d) in maize–soybean intercropping systems, the spacing between the first and second maize rows is RIM (40 cm), the spacing between the second and third maize rows is RMM (80 cm), the spacing between maize and soybean rows is RIMS (0 cm), the spacing between the first and second soybean rows is RIS (30 cm), and the spacing between the second and third soybean rows is RIS (50 cm); (e) in the maize–peanut intercropping system, the spacing between the first and second maize rows is RIM (40 cm), between the second and third maize rows is RMM (80 cm), between maize and peanut rows is RIMP (0 cm), between the first and second soybean rows is RIP (30 cm), and between the second and third soybean rows is RIP (50 cm).

2.4. Soil Sample Analysis

The alkaline-hydrolyzable nitrogen (AN) content of each soil sample was analyzed in triplicate via the alkaline diffusion method. Briefly, 2.00 g of air-dried soil was placed in the outer chamber of a diffusion dish. The inner chamber was charged with 2 mL of 2% boric acid solution containing a mixed indicator (methyl red and bromocresol green). After sealing the rim with an alkaline gel and covering it with a ground glass lid, 10.0 mL of 1.0 mol L−1 NaOH was rapidly introduced into the outer chamber. The sealed assembly was incubated at 40 °C for 24 h. The absorbed ammonia in the inner chamber was then titrated with standardized 0.005 mol L−1 H2SO4 to the endpoint (color transition from blue to faint red), with blank corrections applied. The AN content was calculated using the following formula:
A N ( m g / k g ) = 0.005 × ( V V 1 ) × 14 m × 1000
In the formula, AN denotes the soil alkali-hydrolyzable nitrogen content (mg kg−1); V and V1 signify the titration volumes of standard acid for the sample and blank, respectively (mL); 14 is the molar mass of nitrogen (g mol−1); m represents the mass of the air-dried soil sample (g); and 1000 is the factor for conversion to mg per kg.
The concentration of soil available phosphorus (AP) was measured via the Olsen method, using NaHCO3 extraction followed by molybdenum blue colorimetry. Briefly, 2.50 g of soil was shaken with 0.5 mol/L NaHCO3 (pH 8.5) for 30 min at 25 °C. After filtration, the released phosphate in the extract was reacted with a molybdate–ascorbic acid solution to generate a blue complex, and its absorbance was read at 880 nm. A standard curve was used for quantification. The calculation formula is
A P ( m g / k g ) = ρ × V × t s m
In the formula: AP, soil available phosphorus content (mg kg−1); ρ, phosphorus concentration from the standard curve (μg mL−1); V, final volume of the assay solution (50 mL); ts, dilution factor (total extract volume/aliquot used for color development); and m, mass of the air-dried soil sample (g).
Soil available potassium (AK) was extracted with 1.0 mol/L neutral ammonium acetate (NH4OAc, pH 7.0) and measured by flame photometry. Briefly, 5.00 g of air-dried soil was mixed with 50 mL of extractant (a 1:10 soil-to-solution ratio) in a plastic bottle. The suspension was shaken for 30 min at room temperature (20–25 °C) and then filtered through a dry, quantitative filter paper. The potassium concentration in the clear filtrate was determined directly by flame photometry. The AK content was calculated as follows:
A K ( m g / k g ) = ρ × V m
In the formula: AK, soil available potassium content (mg kg−1); ρ, potassium concetration in the filtrate (mg L−1); V, volume of extractant added (50 mL); m, mass of the air-dried soil sample (g).

2.5. Measurement of Plant Height and Stem Diameter

At three critical growth stages (T1, T2, and T3), 15 representative plants of each crop (maize, soybean, and peanut) were randomly selected within each plot. Measure plant height using a tape measure and stem diameter using a vernier caliper. For maize, measure stem diameter at the third internode; calculate the average value. For maize, plant height was measured from the base of the plant to the apex of the cob. For soybeans, plant height was measured from the cotyledon node to the growing point. For peanuts, plant height was measured from the point where the aboveground stem or main stem contacted the ground to the apex of the peanut inflorescence.

2.6. Determination of Dry Matter

At three critical growth stages (T1–T3), three representative plants each of maize, soybean, and peanut were randomly sampled per plot. Their roots, stems, leaves, and grains were separated into kraft paper bags, oven-dried at 105 °C for 30 min, and then at 75 °C to constant weight. The dry weight of each organ was measured using a 0.0001 g precision electronic balance.

2.7. Determination of Yield, Yield Components, and Land Equivalent Ratio (LER)

At crop maturity (T3 stage), five plants were randomly selected from each treatment plot to determine the yield components of maize, soybean, and peanut. After air-drying, the grains of maize, soybean, and peanut harvested from each treatment group were weighed. The yield per hectare was then calculated based on the effective plot area. Land equivalent ratio served as the metric for assessing intercropping yield advantage, calculated as follows:
LER   =   Y a Y A   +   Y b Y B
In the equation, YA denotes the yield of MM, Ya represents the yield of IM, YB signifies the yield of MS or MP, and Yb indicates the yield of IS or IP. Should LER > 1, it signifies that the total yield per unit area of the intercropped land exceeds the sum of the respective yields when grown as monocultures, indicating a clear yield advantage for the system. Conversely, if LER < 1, it indicates that the overall yield benefit of the intercropping system is lower than that of monoculture, signifying a yield disadvantage for the system.

2.8. Data Analysis

Data collation for this study was conducted using Microsoft Excel 2016, while statistical analyses were performed with SPSS version 19.0 (SPSS, Chicago, IL, USA). Significant differences between treatments were evaluated using one-way analysis of variance (ANOVA), followed by multiple comparisons at the α = 0.05 significance level, utilizing the Least Significant Difference (LSD) test and Duncan’s multiple range test. Additionally, Origin 2025 software (Northampton, MA, USA) was employed to create three-dimensional bar charts that illustrate the spatial distribution of soil alkali-hydrolyzable nitrogen, available phosphorus, and available potassium.

3. Result

3.1. Crop Plant Height

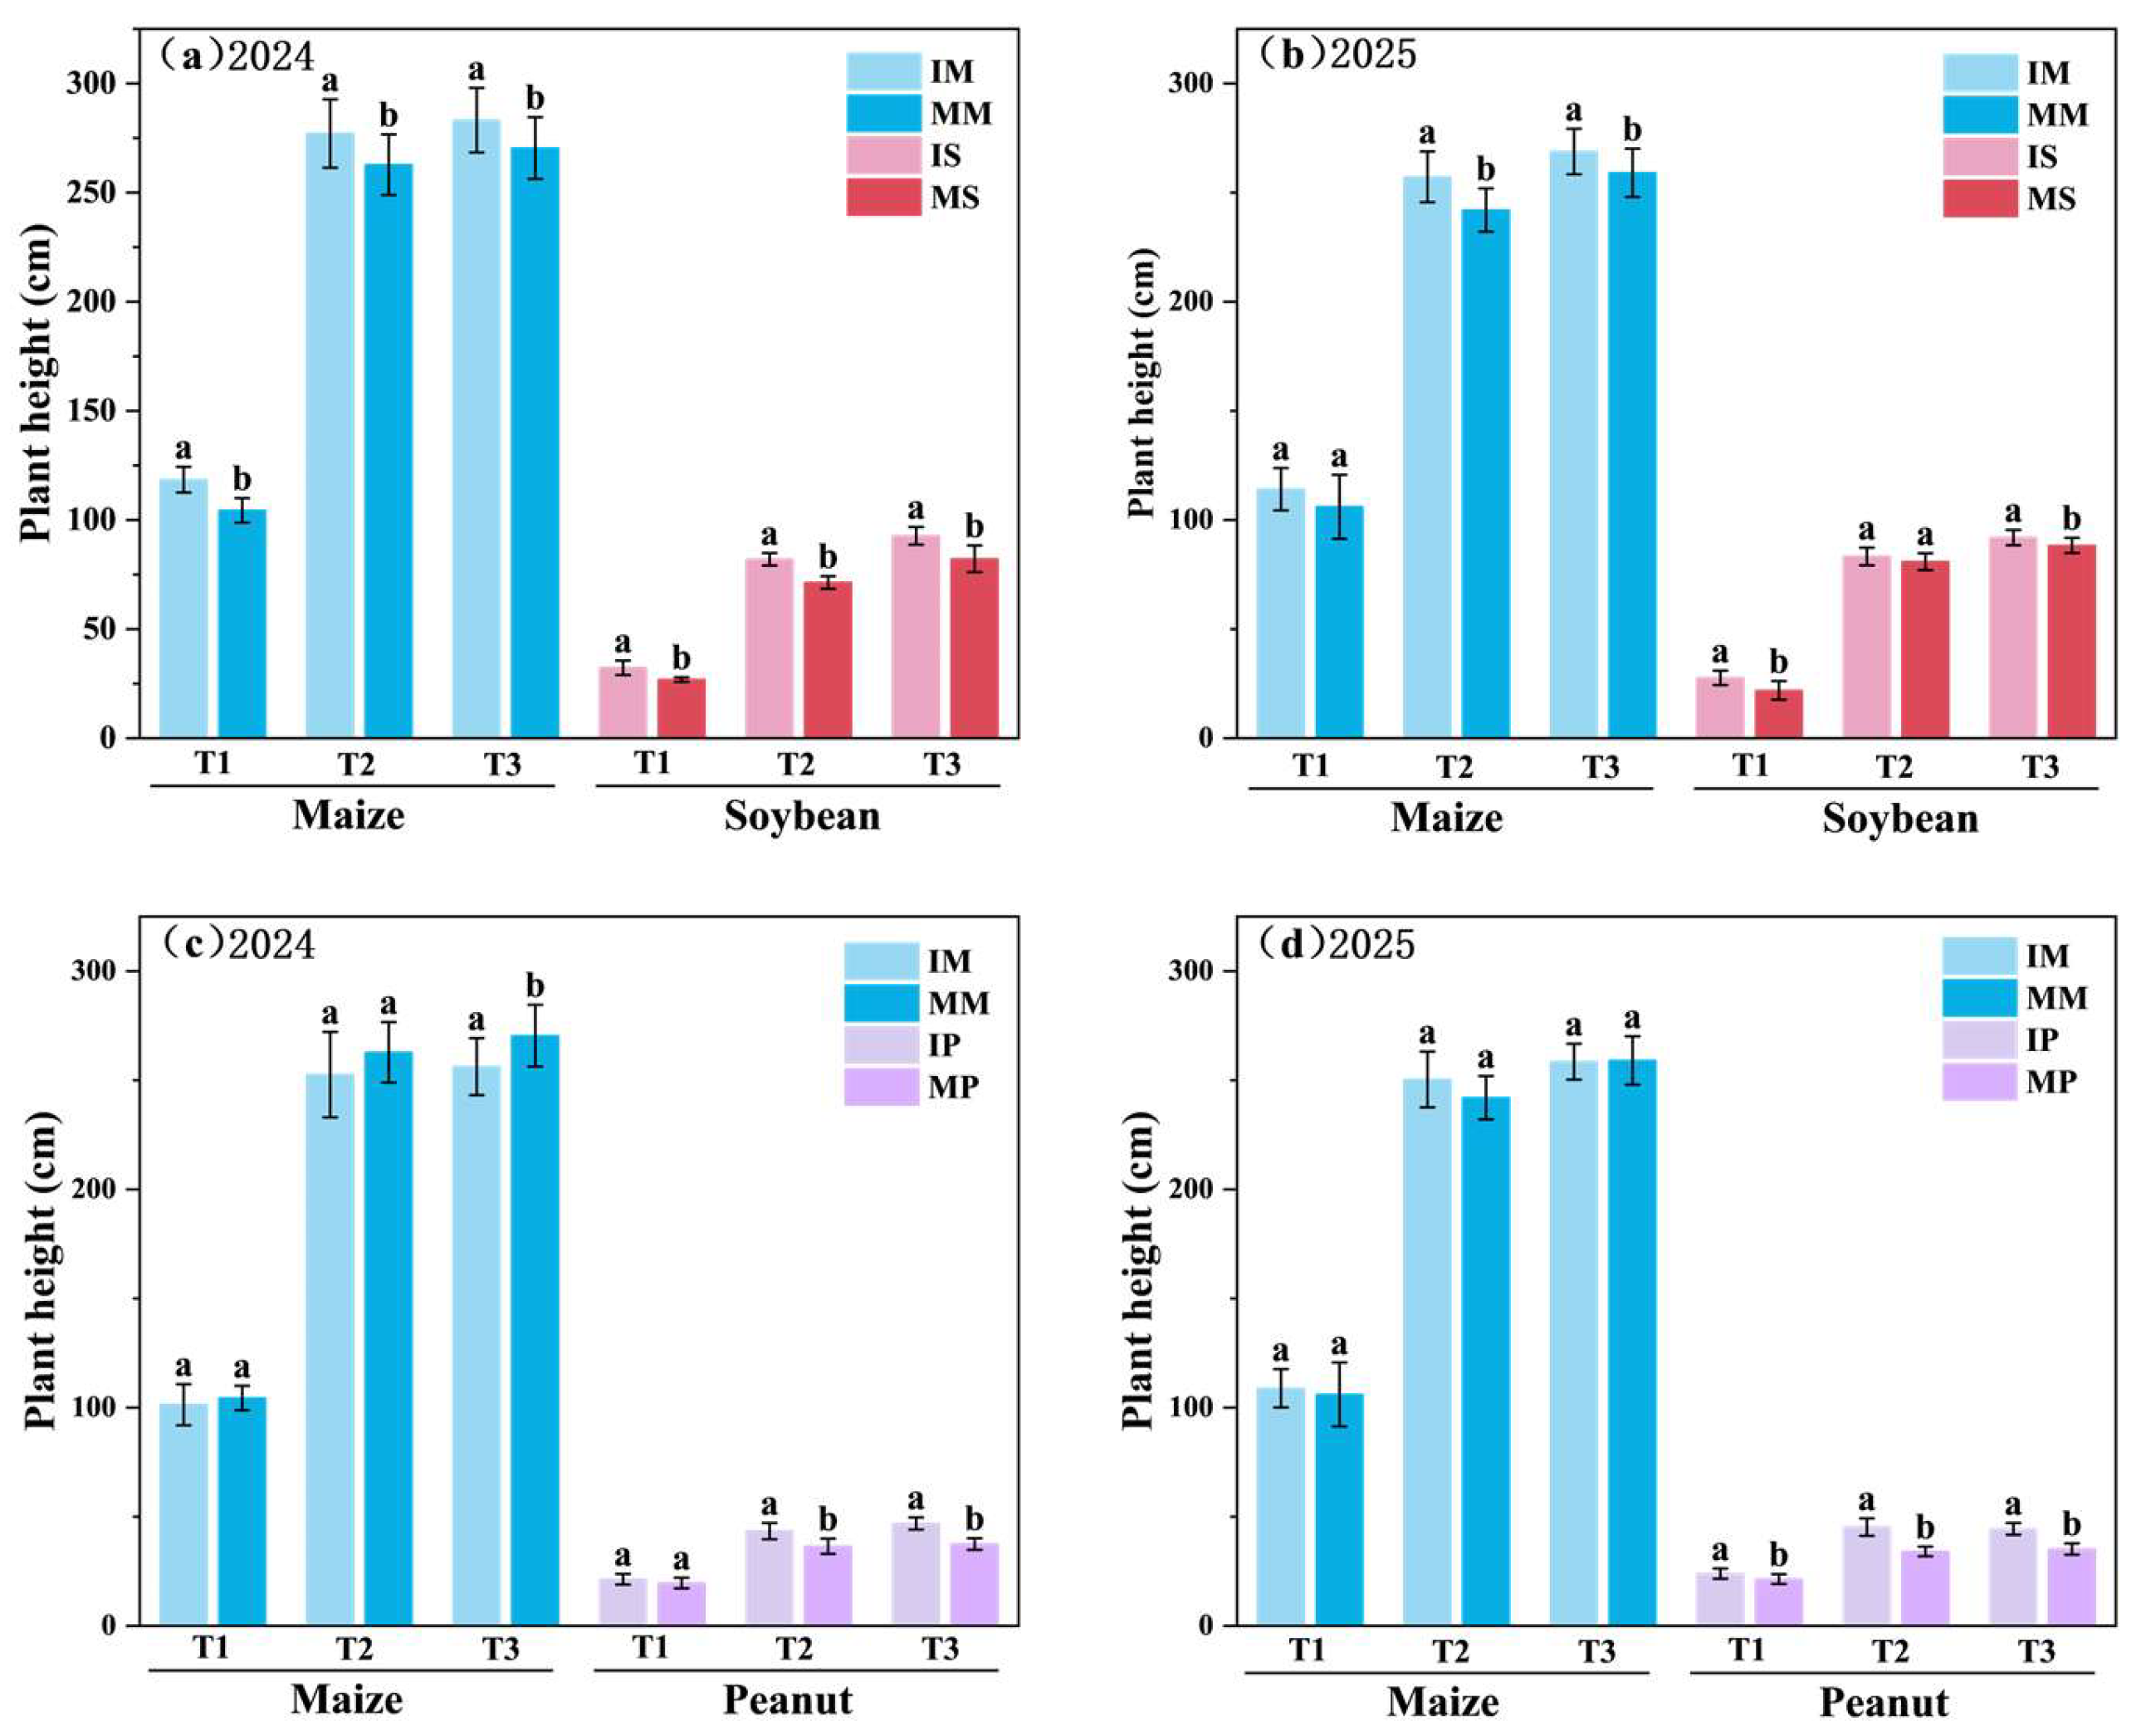
Plant height—the vertical distance from the crop base to the apical growing point of the main stem—was a critical determinant of yield [26]. Its dynamics exhibited a characteristic sigmoidal pattern, increasing throughout the growth cycle before stabilizing during the later stages (Figure 3). Crop systems significantly influence this trait. Results from two years indicate that within the maize–soybean intercropping system, intercropped maize exhibited height increases of 10.58%, 5.86%, and 4.24% at stages T1, T2, and T3, respectively, compared to monocropping, while soybeans showed concurrent increases of 23.09%, 8.85%, and 8.43%. In the maize–peanut intercropping system, intercropped maize plant height showed a slight decrease (ranging from 0.17% to 5.44%) during stages T1–T3 compared to monocropping, while intercropped peanuts exhibited a significant increase (ranging from 10.17% to 25.61%).

3.2. Main Stem Thickness

Stem thickness is a key factor influencing crop lodging resistance, with its degree indirectly affecting yield levels [27]. Results indicate that stem thickness increased rapidly during the TI to T2 period across all treatments (monoculture and intercropping of maize, soybean, and peanut), with a slight decrease observed from T2 to T3 (Figure 4). Results from the two-year trials indicate that within the maize–soybean intercropping system, intercropped maize stem diameter was reduced by 8.37%, 4.41%, and 2.48% during growth stages T1, T2, and T3, respectively, compared to monocropping (no significant difference between T2 and T3 in 2025, p > 0.05). Intercropped soybean exhibited significantly lower stem diameters than monoculture at all stages, with reductions of 10.77% (T1), 6.75% (T2), and 10.57% (T3) (p < 0.05). Within the maize–peanut intercropping system, both maize and peanut stem diameters were significantly lower than their respective monocropping counterparts during T1, T2, and T3 (p < 0.05). The reductions for maize were 16.33%, 7.89%, and 11.77% at T1, T2, and T3, respectively, while those for peanut were more substantial, reaching 16.41%, 15.60%, and 33.21%.

3.3. Dry Matter Accumulation (DMA)

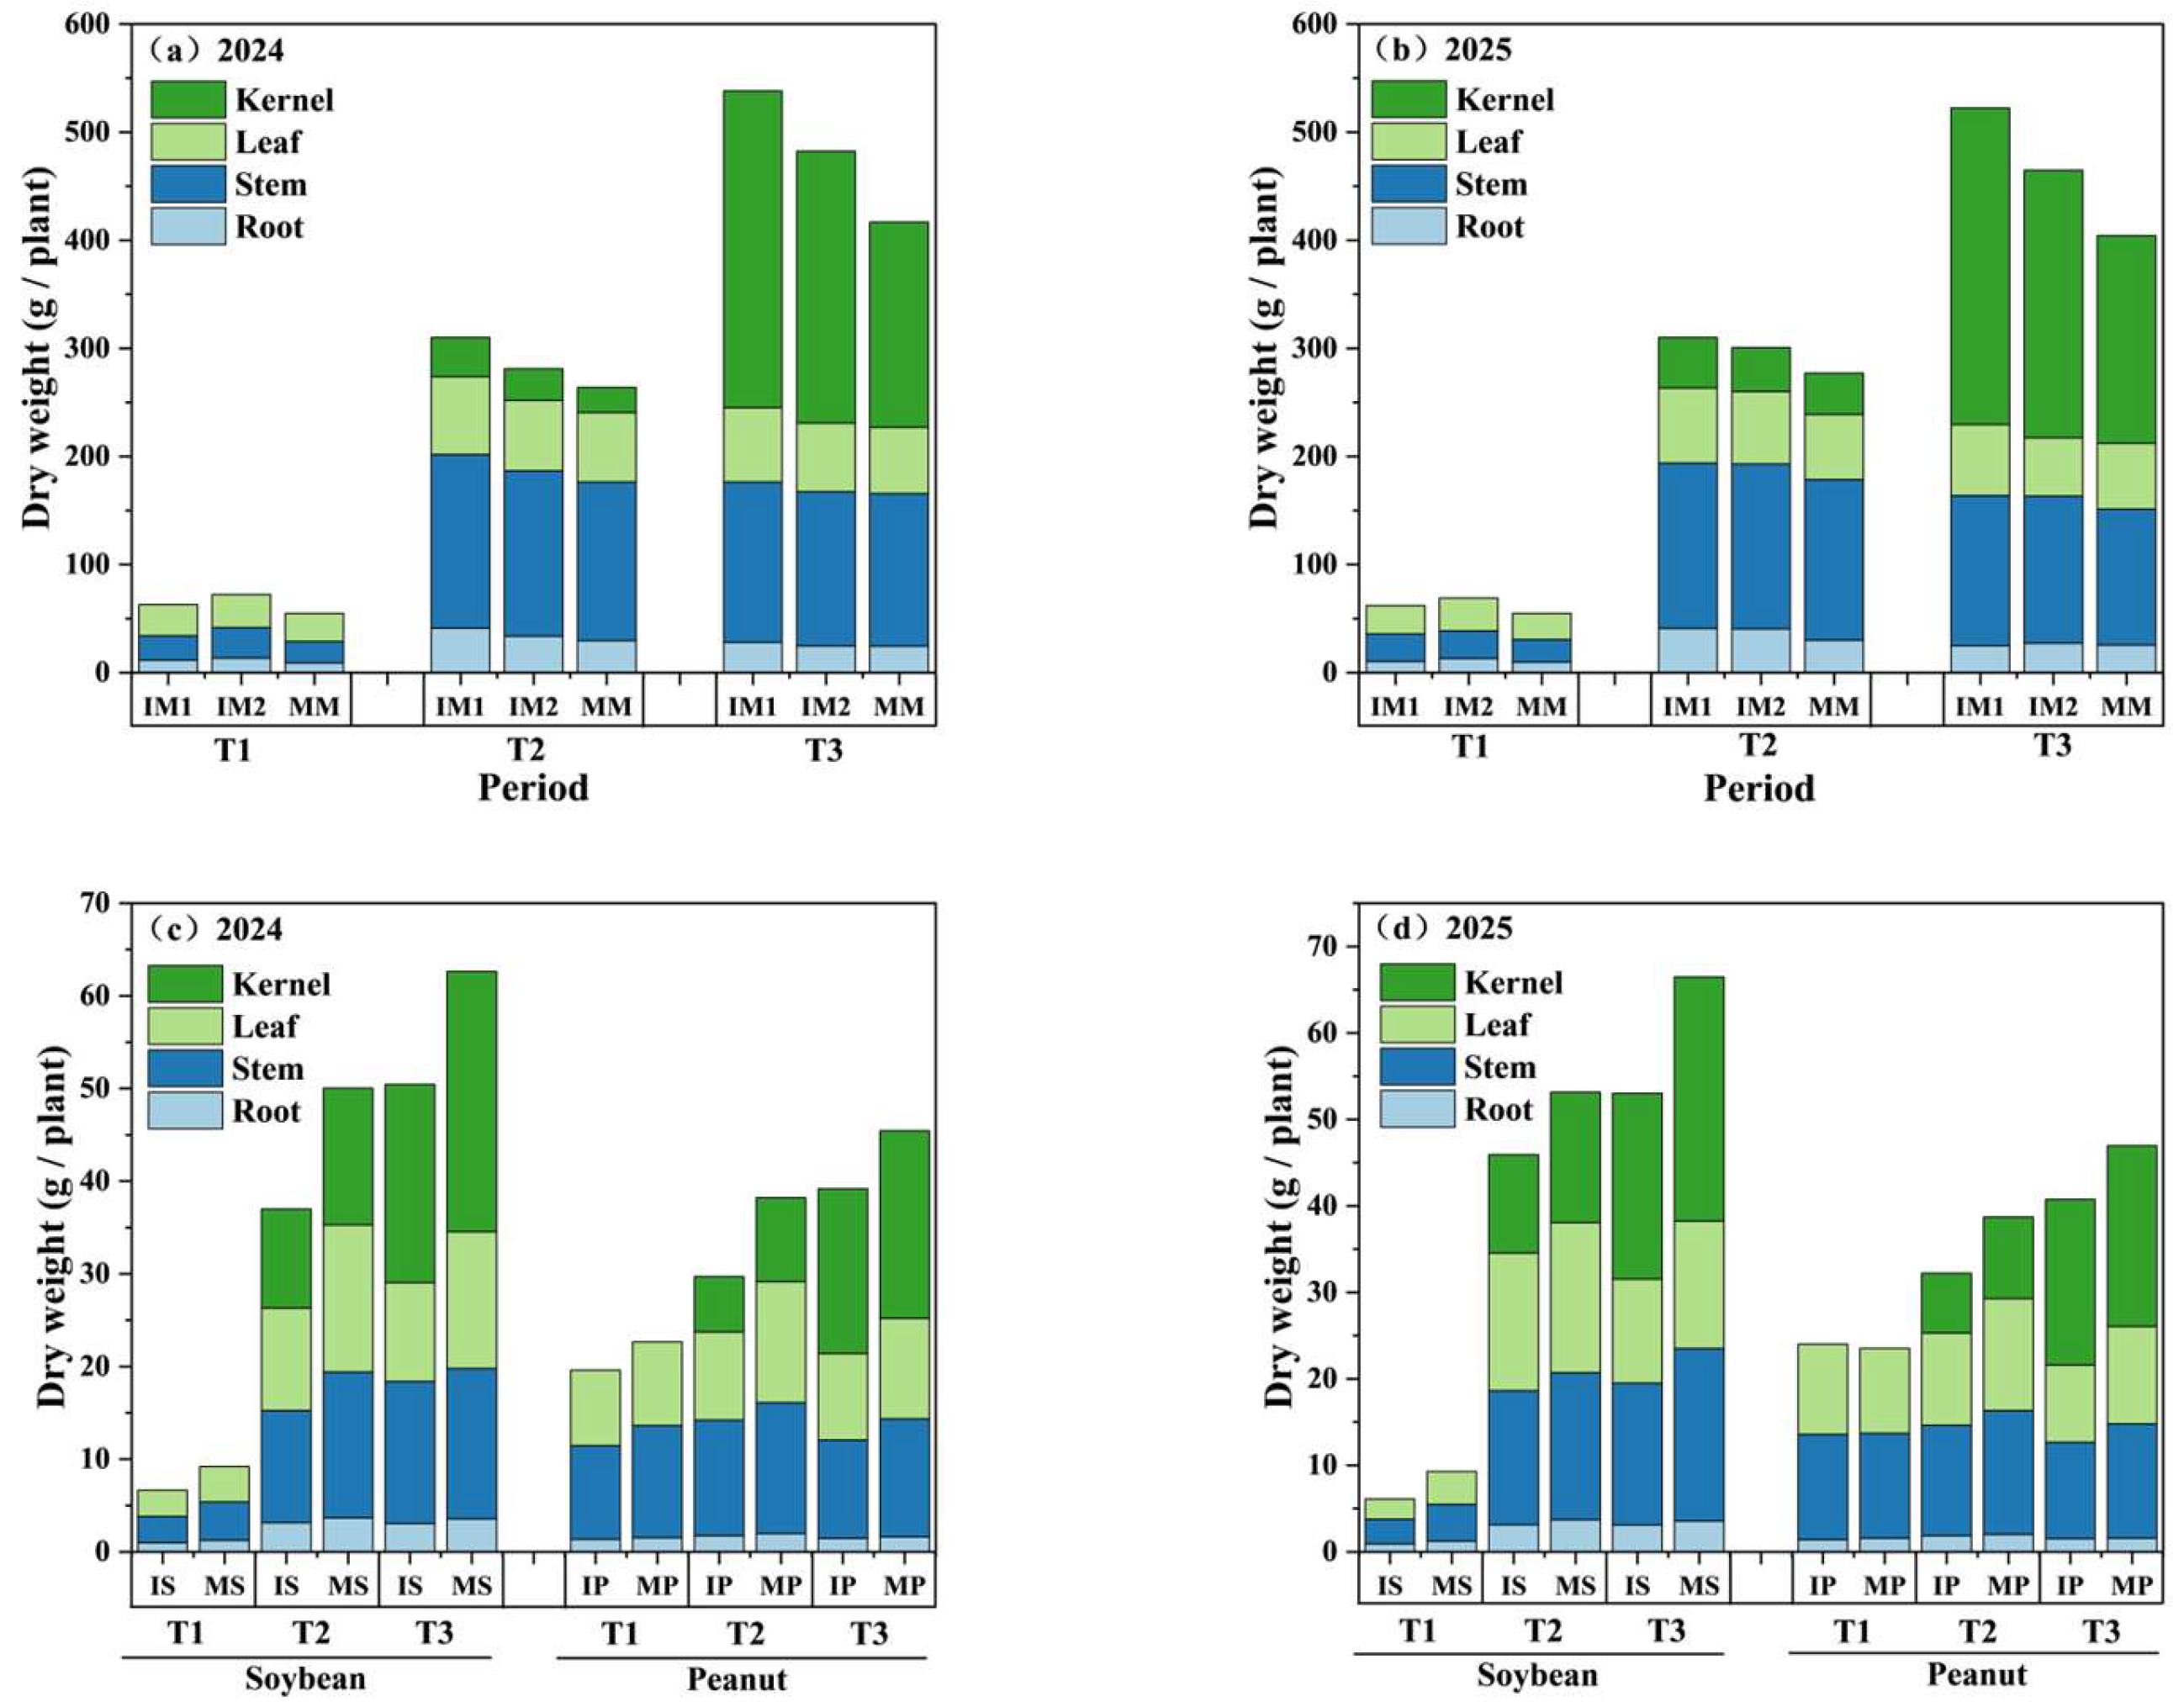
Total dry matter accumulation (DMA) of maize, soybean, and peanut showed a consistent upward trend during the growing season, with significant differences among treatments (p < 0.05; Figure 5).
Over the two-year study, both intercropping systems significantly increased the total DMA of maize by 23.29% (maize–soybean) and 14.55% (maize–peanut) compared to monoculture (p < 0.05), with no significant interannual variation (p > 0.05). At the T1 stage, root dry matter of intercropped maize increased by 18.21% (IM-S) and 42.42% (IM-P) compared to MM. Similarly, stem DMA increased by 16.97% and 31.98%, and leaf DMA by 10.31% and 22.44%, for the respective systems. By T2, root DMA increases reached 37.66% (IM-S) and 24.32% (IM-P). Stem and leaf DMA also increased by 6.27% and 7.02%, and 13.81% and 6.38%, respectively, accompanied by significant grain DMA improvements of 38.6% and 15.8%. At T3, grain DMA further increased by 53.4% (IM-S) and 30.68% (IM-P), whereas increases in root, stem, and leaf DMA were more modest, ranging from 3.71% to 9.99%.
In soybean, root and leaf DMA in both monoculture and intercropping initially increased and then declined during the growing season, whereas stem and seed DMA showed a continuous increase. Two-year data showed that total DMA of intercropped soybean was significantly lower than in monoculture, with reductions of 22.23% (2024) and 18.52% (2025) (p < 0.01). In 2024, DMA of roots, stems, leaves, and seeds in intercropped soybean decreased by 14.81%, 16.22%, 27.07%, and 25.14%, respectively. In 2025, the reductions were slightly smaller, at 15.74%, 15.66%, 15.66%, and 24.17% for the respective organs.
In peanut, root, stem, and leaf DMA in both monoculture and intercropping decreased throughout the growth period, whereas grain DMA consistently increased. Over the two years, total DMA of intercropped peanut was significantly reduced by 16.75% (2024) and 11.18% (2025) compared to monoculture (p < 0.05). Compared to monoculture, intercropping significantly reduced DMA in all peanut organs: reductions in 2024 were 11.03% (roots), 14.81% (stems), 18.12% (leaves), and 18.78% (seeds); in 2025, they narrowed to 7.59%, 8.97%, 11.73%, and 14.08%, respectively.

3.4. Soil Alkaline-Hydrolyzable Nitrogen (AN) Content

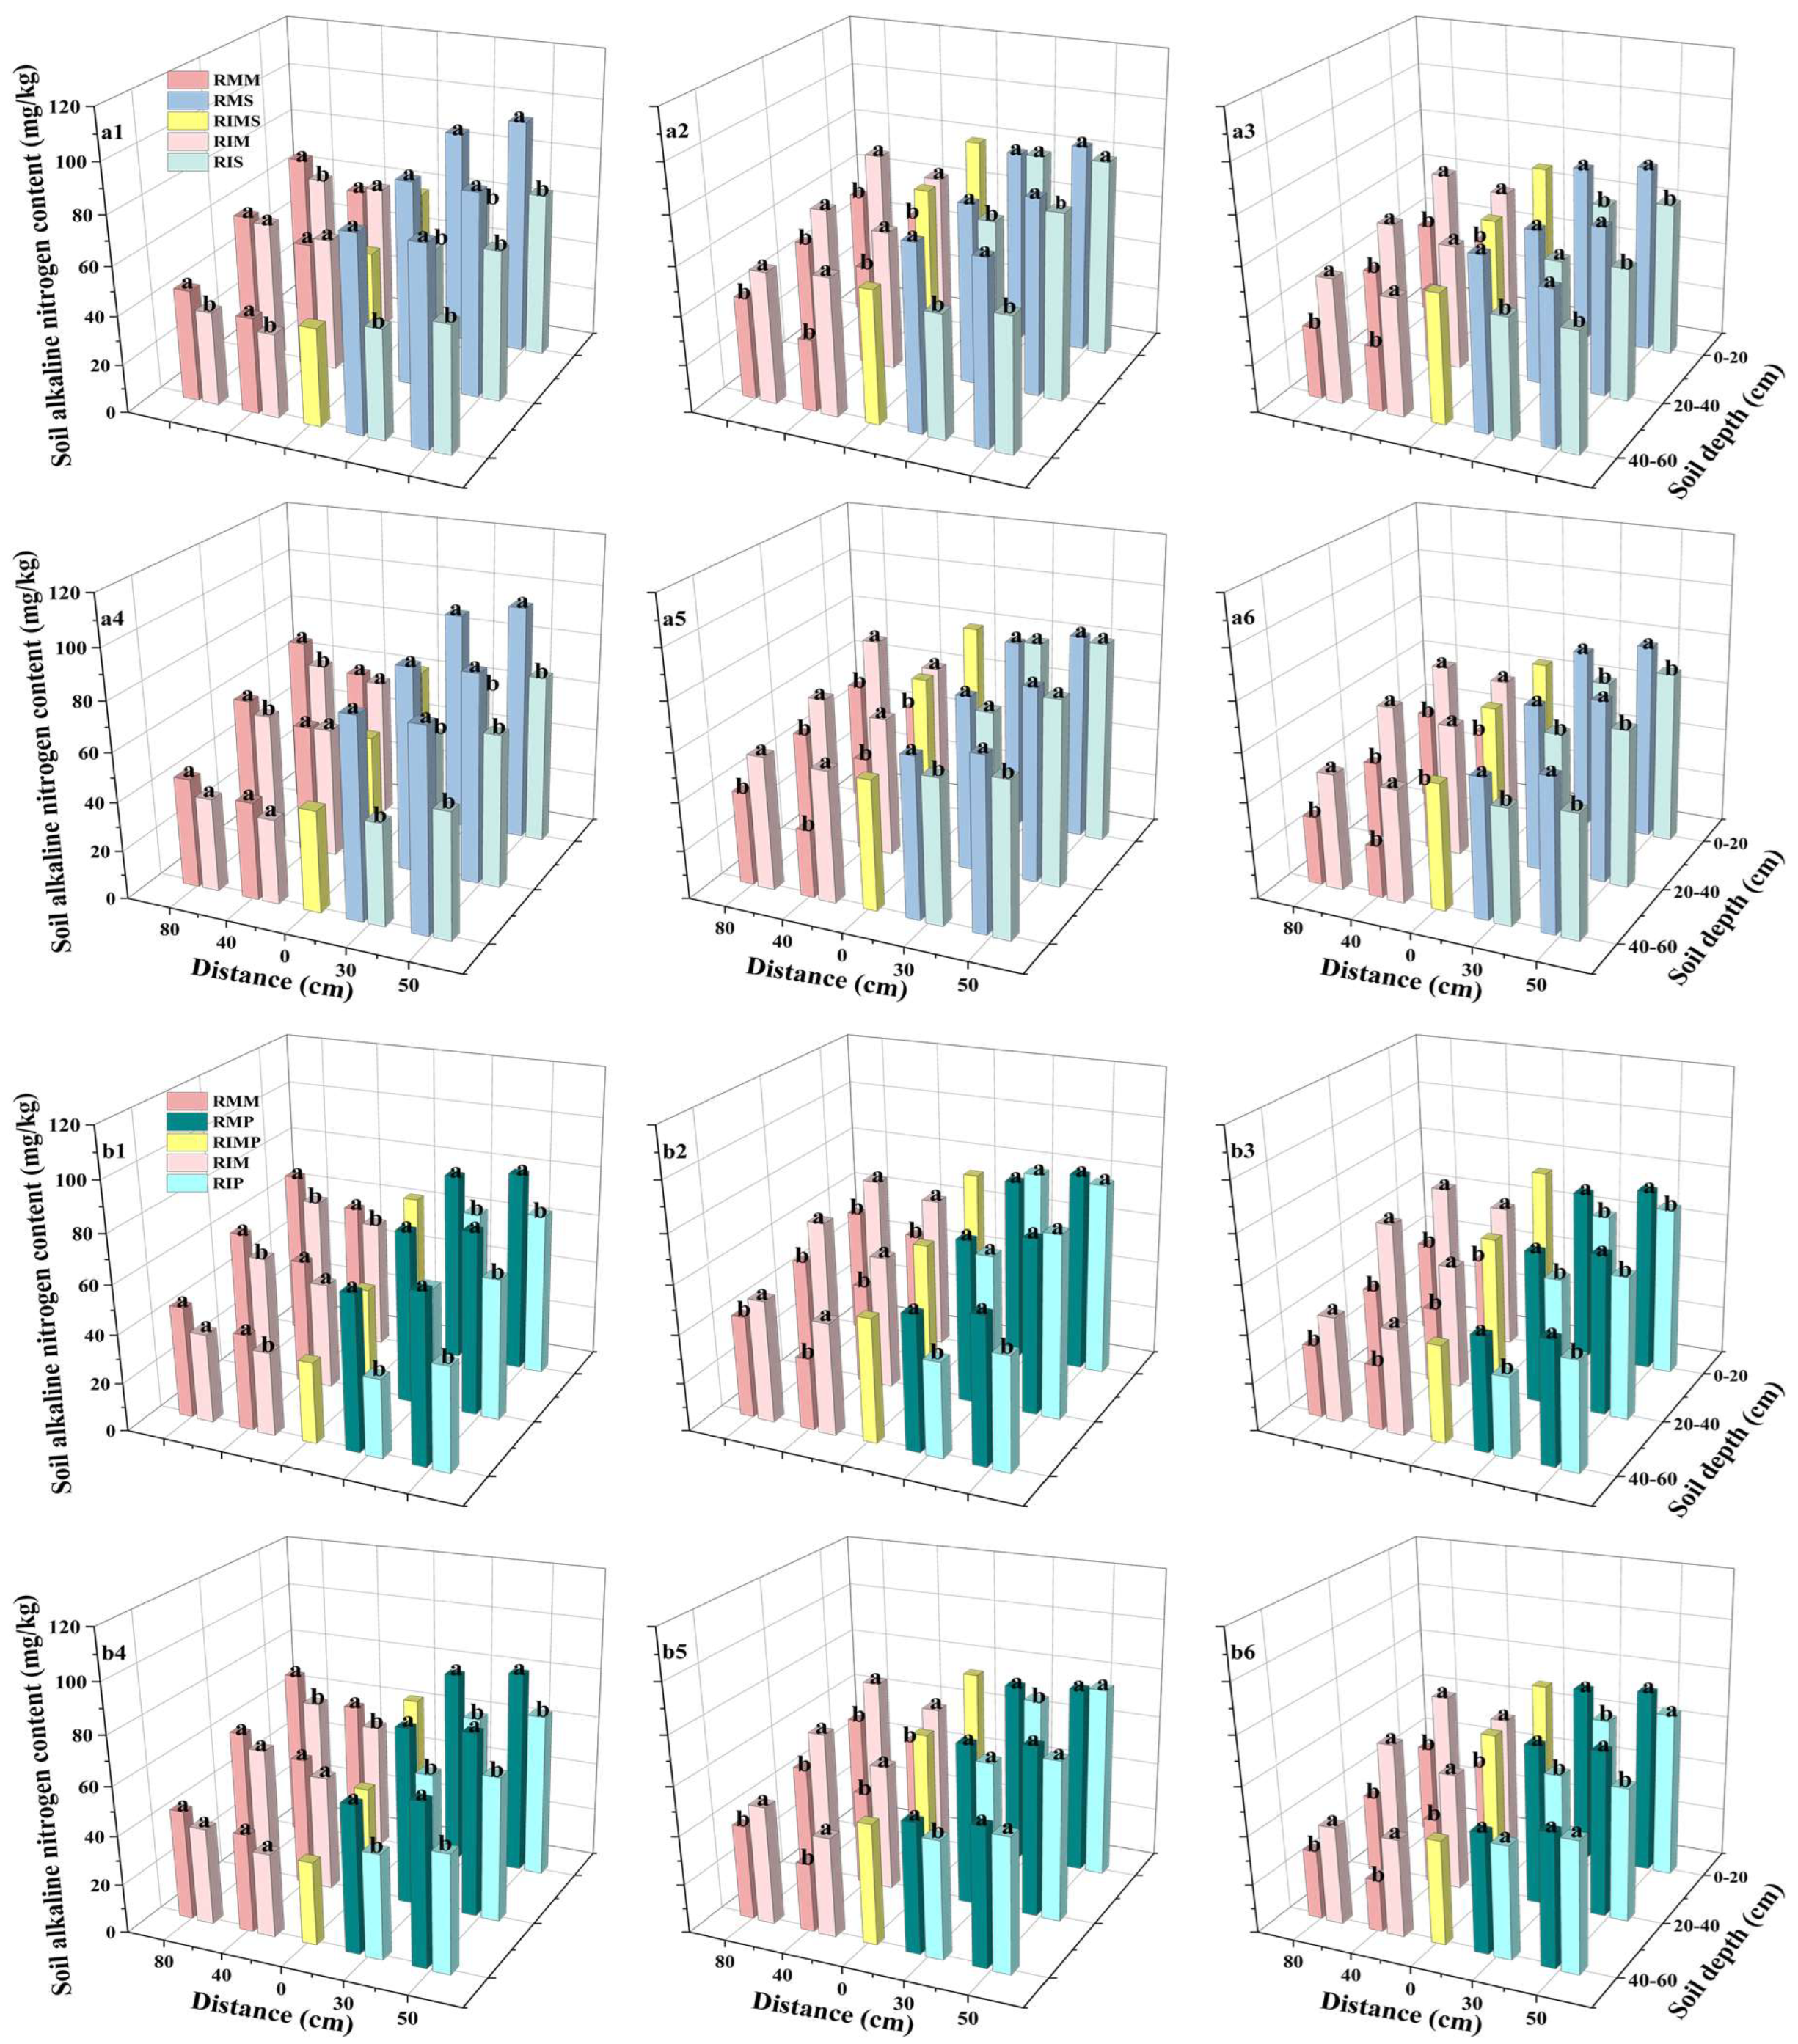
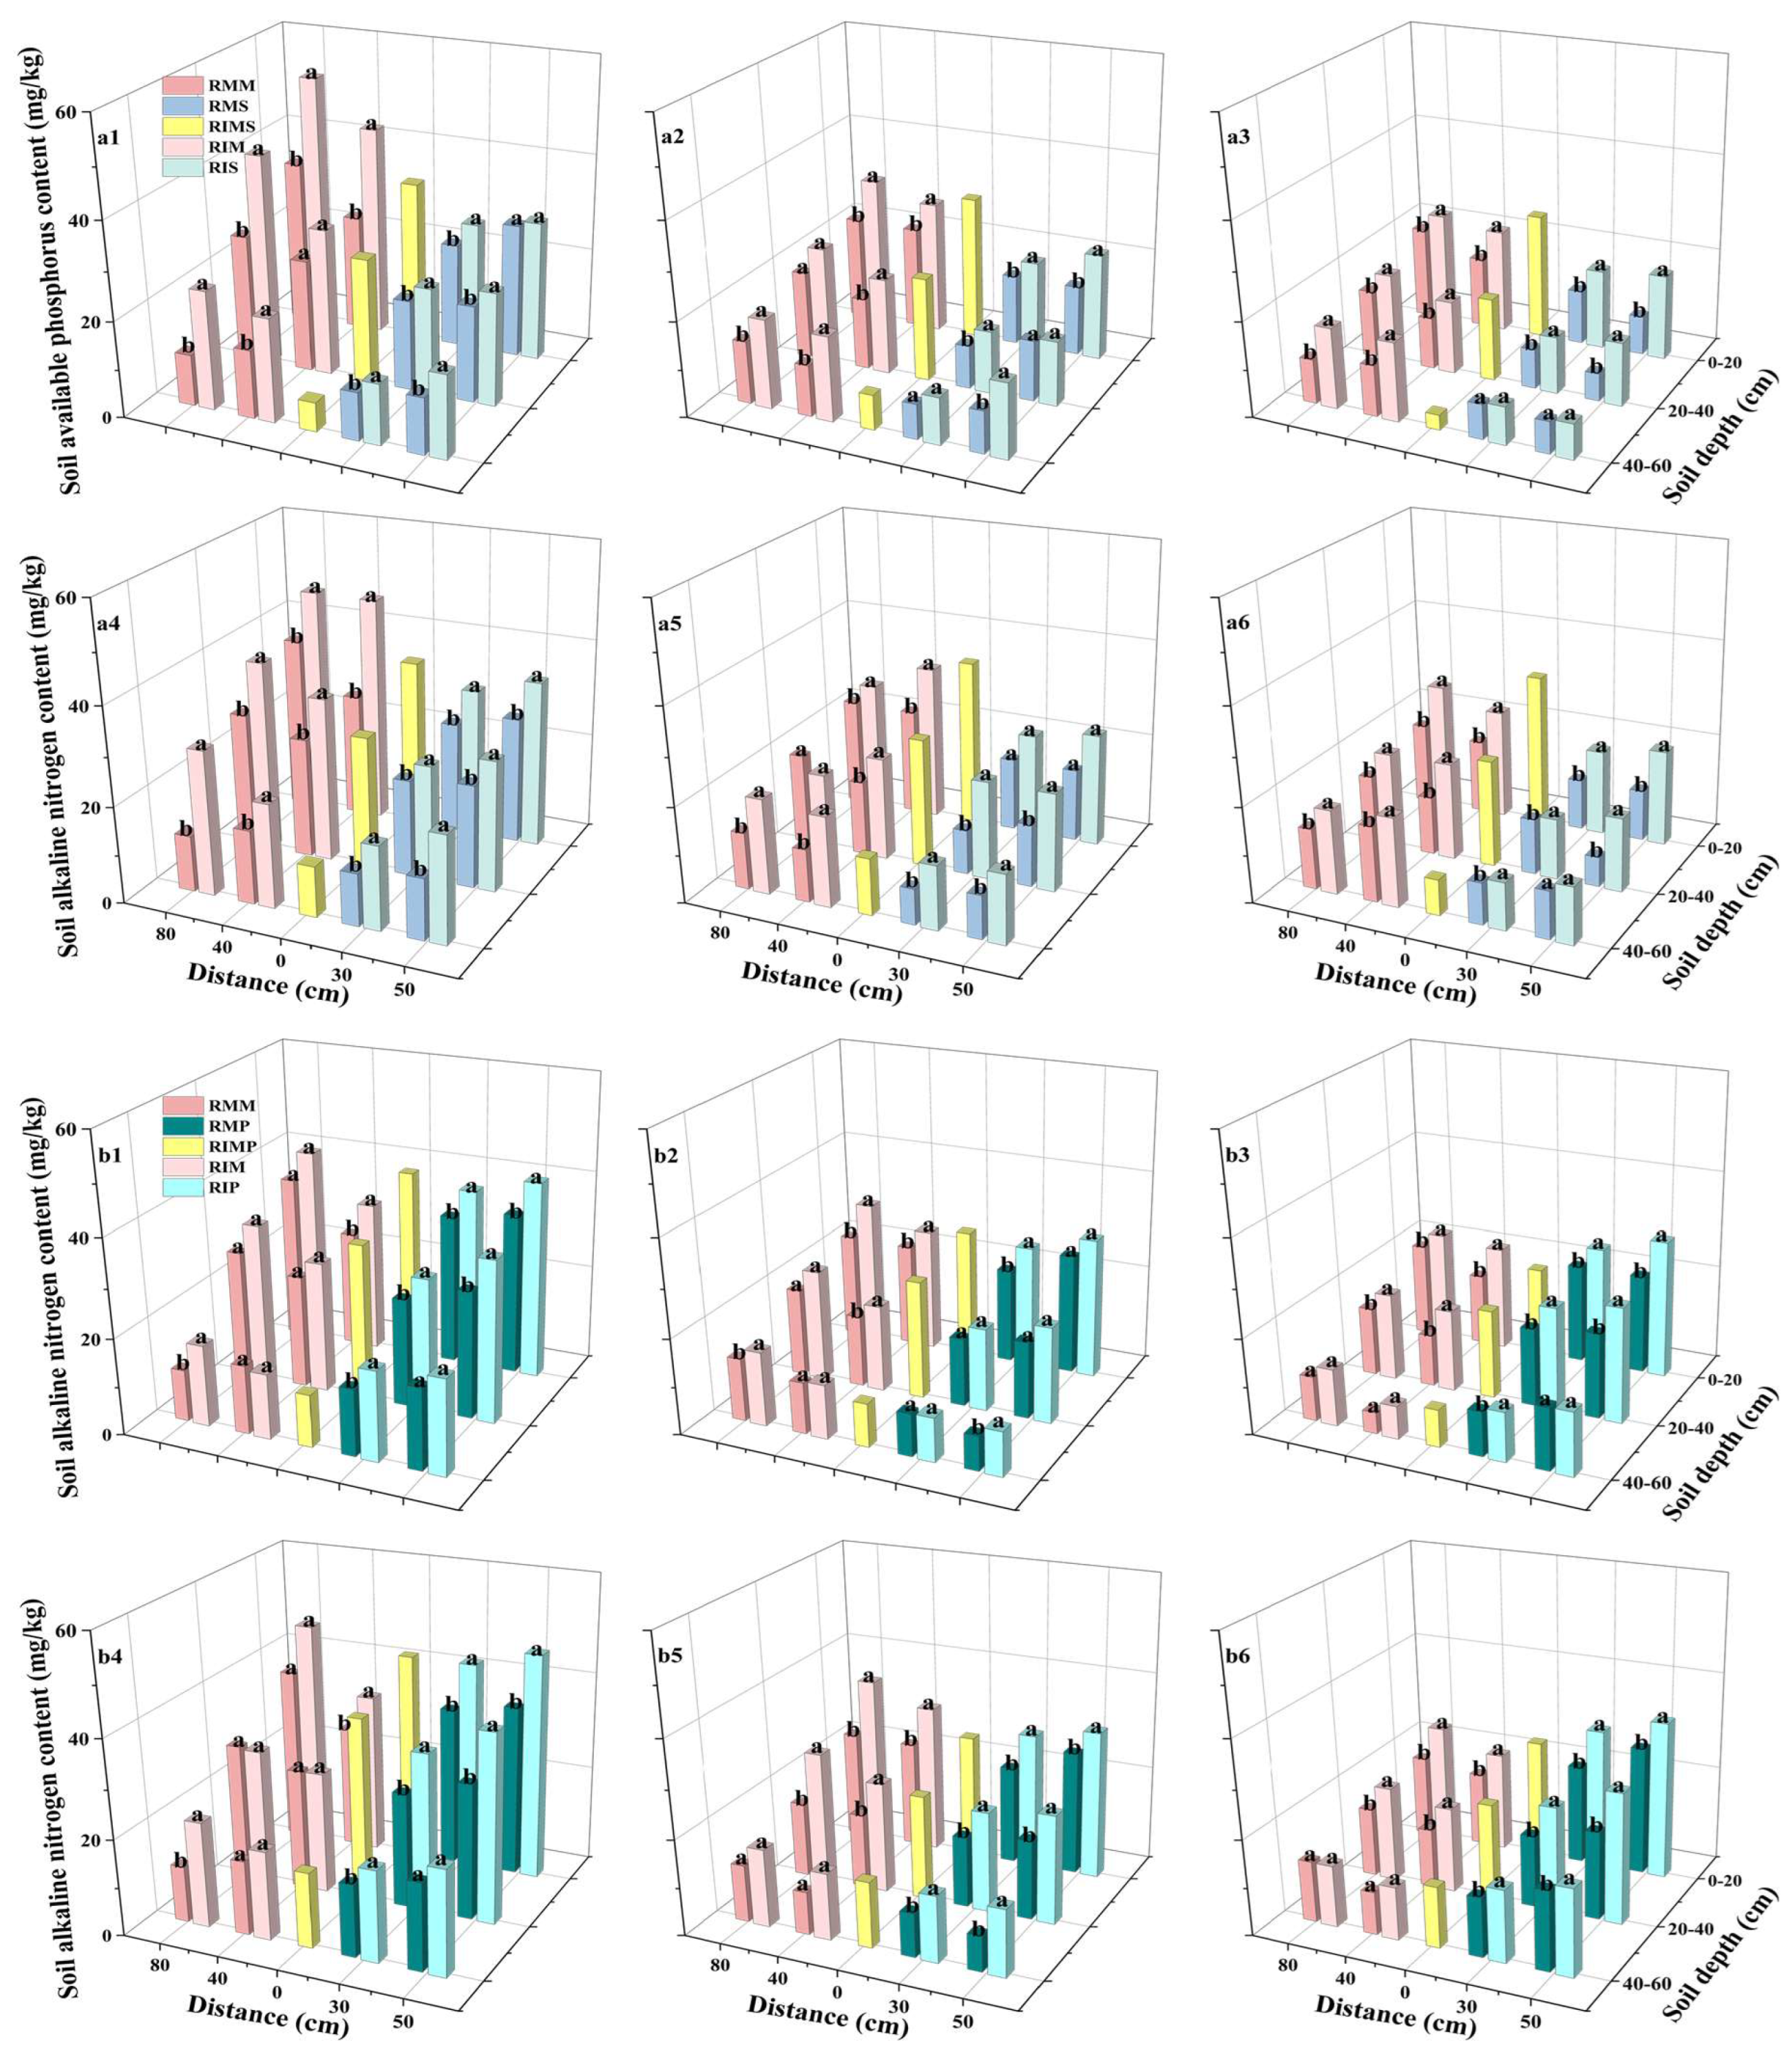
Soil alkaline-hydrolyzable nitrogen (AN) content exhibited distinct temporal dynamics between cropping systems. In monoculture, AN content in all crop rows showed a consistent decline throughout the growing season. In contrast, intercropping systems displayed an initial increase from T1 to T2, followed by a decrease from T2 to T3. No significant interannual variation was observed (p > 0.05; Figure 6).
In the maize–soybean system, AN content varied significantly with growth stage, row position, and soil depth. At T1, AN content at RIM-40, RIM-80, RIS-30, and RIS-50 was reduced by 2.28%, 10.73%, 34.79%, and 30.38%, respectively, compared to corresponding monocultures. Notably, intercropped soybean (across RIS positions) showed significantly lower AN than its monoculture in all soil layers (p < 0.05), with the most pronounced reduction (up to 46.28%) in the 40–60 cm layer (Figure 6(a1,a4)). By T2, a reversal occurred: AN at maize rows (RIM-40, RIM-80) increased by 54.75% and 36.92%, whereas at soybean rows (RIS-30, RIS-50) it decreased by 9.07% and 8.49% compared to their respective monocultures. Intercropped maize had significantly higher AN than monoculture (p < 0.05), particularly in the 40–60 cm layer, where increases at RIM-40 and RIM-80 reached 93.00% and 36.33%, respectively (Figure 6(a2,a5)). At T3, the pattern of maize-row increase and soybean-row decrease persisted. AN at RIM-40 and RIM-80 increased by 80.72% and 67.81%, while at RIS-30 and RIS-50 it decreased by 18.91% and 17.28%, compared to their respective monocultures. Significant differences between intercropping and monoculture were observed across all soil layers (0–60 cm; p < 0.05), with increases in maize rows most pronounced in the deeper layers (Figure 6(a3,a6)). The total soil alkali-hydrolyzable nitrogen content ranked as follows: RMS (50 cm) > RMS (30 cm) > RIMS (0 cm) > RIS (50 cm) > RIS (30 cm) > RIM (80 cm) > RIM (40 cm) > RMM (80 cm) > RMM (40 cm).
The soil AN content in the maize–peanut system was generally lower than in the maize–soybean system. During T1, intercropping significantly reduced AN across all row positions (RIM-40, RIM-80, RIP-30, RIP-50) by 12.48% to 27.67% compared to monoculture. Reductions in peanut rows (RIP) were significant across all soil layers (p < 0.05), being most substantial (up to 39.21%) in the 40–60 cm layer (Figure 6(b1,b4)). By T2, AN in maize rows (RIM-40, RIM-80) increased significantly (by 31.18–38.26%) compared to monoculture, with the increase in the 40–60 cm layer at RIM-40 reaching 50.80%. Conversely, AN in peanut rows (RIP-30, RIP-50) decreased by 4.04–8.09% (Figure 6(b2,b5)). At T3, AN in maize rows remained significantly higher (increases of 64.5–69.3%) than in monoculture across all soil layers, while peanut rows showed reductions of 10.36–15.23% (Figure 6(b3,b6)). The total soil alkali-hydrolyzable nitrogen content ranked as follows: RMP (50 cm) > RMP (30 cm) > RIP (50 cm) > RIMS (0 cm) > RIM (80 cm) > RIP (30 cm) > RIM (40 cm) > RMM (80 cm) > RMM (40 cm).

3.5. Soil Available Phosphorus (AP) Content

Soil available phosphorus (AP) exhibited distinct temporal dynamics among the cropping systems. In both monoculture and intercropped maize and soybean, AP content showed a consistent decreasing trend throughout the growing season. In contrast, peanut systems (both monoculture and intercropped) displayed a significant decline from T1 to T2, followed by a slight recovery from T2 to T3. No significant interannual differences were observed (p > 0.05; Figure 7).
In the maize–soybean system, AP content in the root zone decreased significantly from T1 to T2 across all treatments (p < 0.05) and generally declined with increasing soil depth. Throughout the growth period, intercropping consistently enhanced AP content in the root zone compared to monoculture. At T1, increases at RIM-40, RIM-80, RIS-30, and RIS-50 were 55.24%, 61.76%, 27.64%, and 28.03%, respectively. These advantages persisted at T2 (43.96%, 28.11%, 109.04%, 49.38%) and T3 (43.94%, 41.10%, 32.45%, 80.60%). Spatially, in the 0–20 cm layer, AP content under intercropping consistently surpassed that of monoculture. In the 20–40 cm layer, intercropping significantly increased AP content during the soybean pod-setting stage (T2). In the 40–60 cm layer, maize rows (RIM-40, RIM-80) maintained higher AP than monoculture, whereas no significant differences were found for soybean at this depth (p > 0.05). The overall AP content across the profile was ranked as follows: RIM-80 > RIM-40 > RIMS-0 > RIS-50 > RMM-80 > RIS-30 > RMM-40 > RMS-50 > RMS-30 (Figure 7(a1–a6)).
In the maize–peanut system, the readily available phosphorus content was significantly higher than in the maize–soybean system (p < 0.05). Intercropping consistently increased AP content across all row positions (RIM-40, RIM-80, RIP-30, RIP-50) throughout the growth stages (T1: 16.26–28.03%; T2: 28.64–41.98%; T3: 26.26–42.22%). In the 0–20 cm layer, AP content under intercropping remained significantly higher than in monoculture, with a less pronounced decline (17.48–38.14%) compared to the maize–soybean system. In the 20–40 cm layer, AP in the maize root zone was significantly higher in intercropping during T2 and T3 (p < 0.05). In the 40–60 cm layer, the peanut root zone maintained higher AP levels than the maize root zone during T2 and T3. The overall AP content was ranked as: RIP-50 > RIM-80 > RIP-30 > RIMP-0 > RMP-50 > RIM-40 > RMM-80 > RMP-30 > RMM-40 (Figure 7(b1–b6)).

3.6. Soil Available Potassium (AK) Content

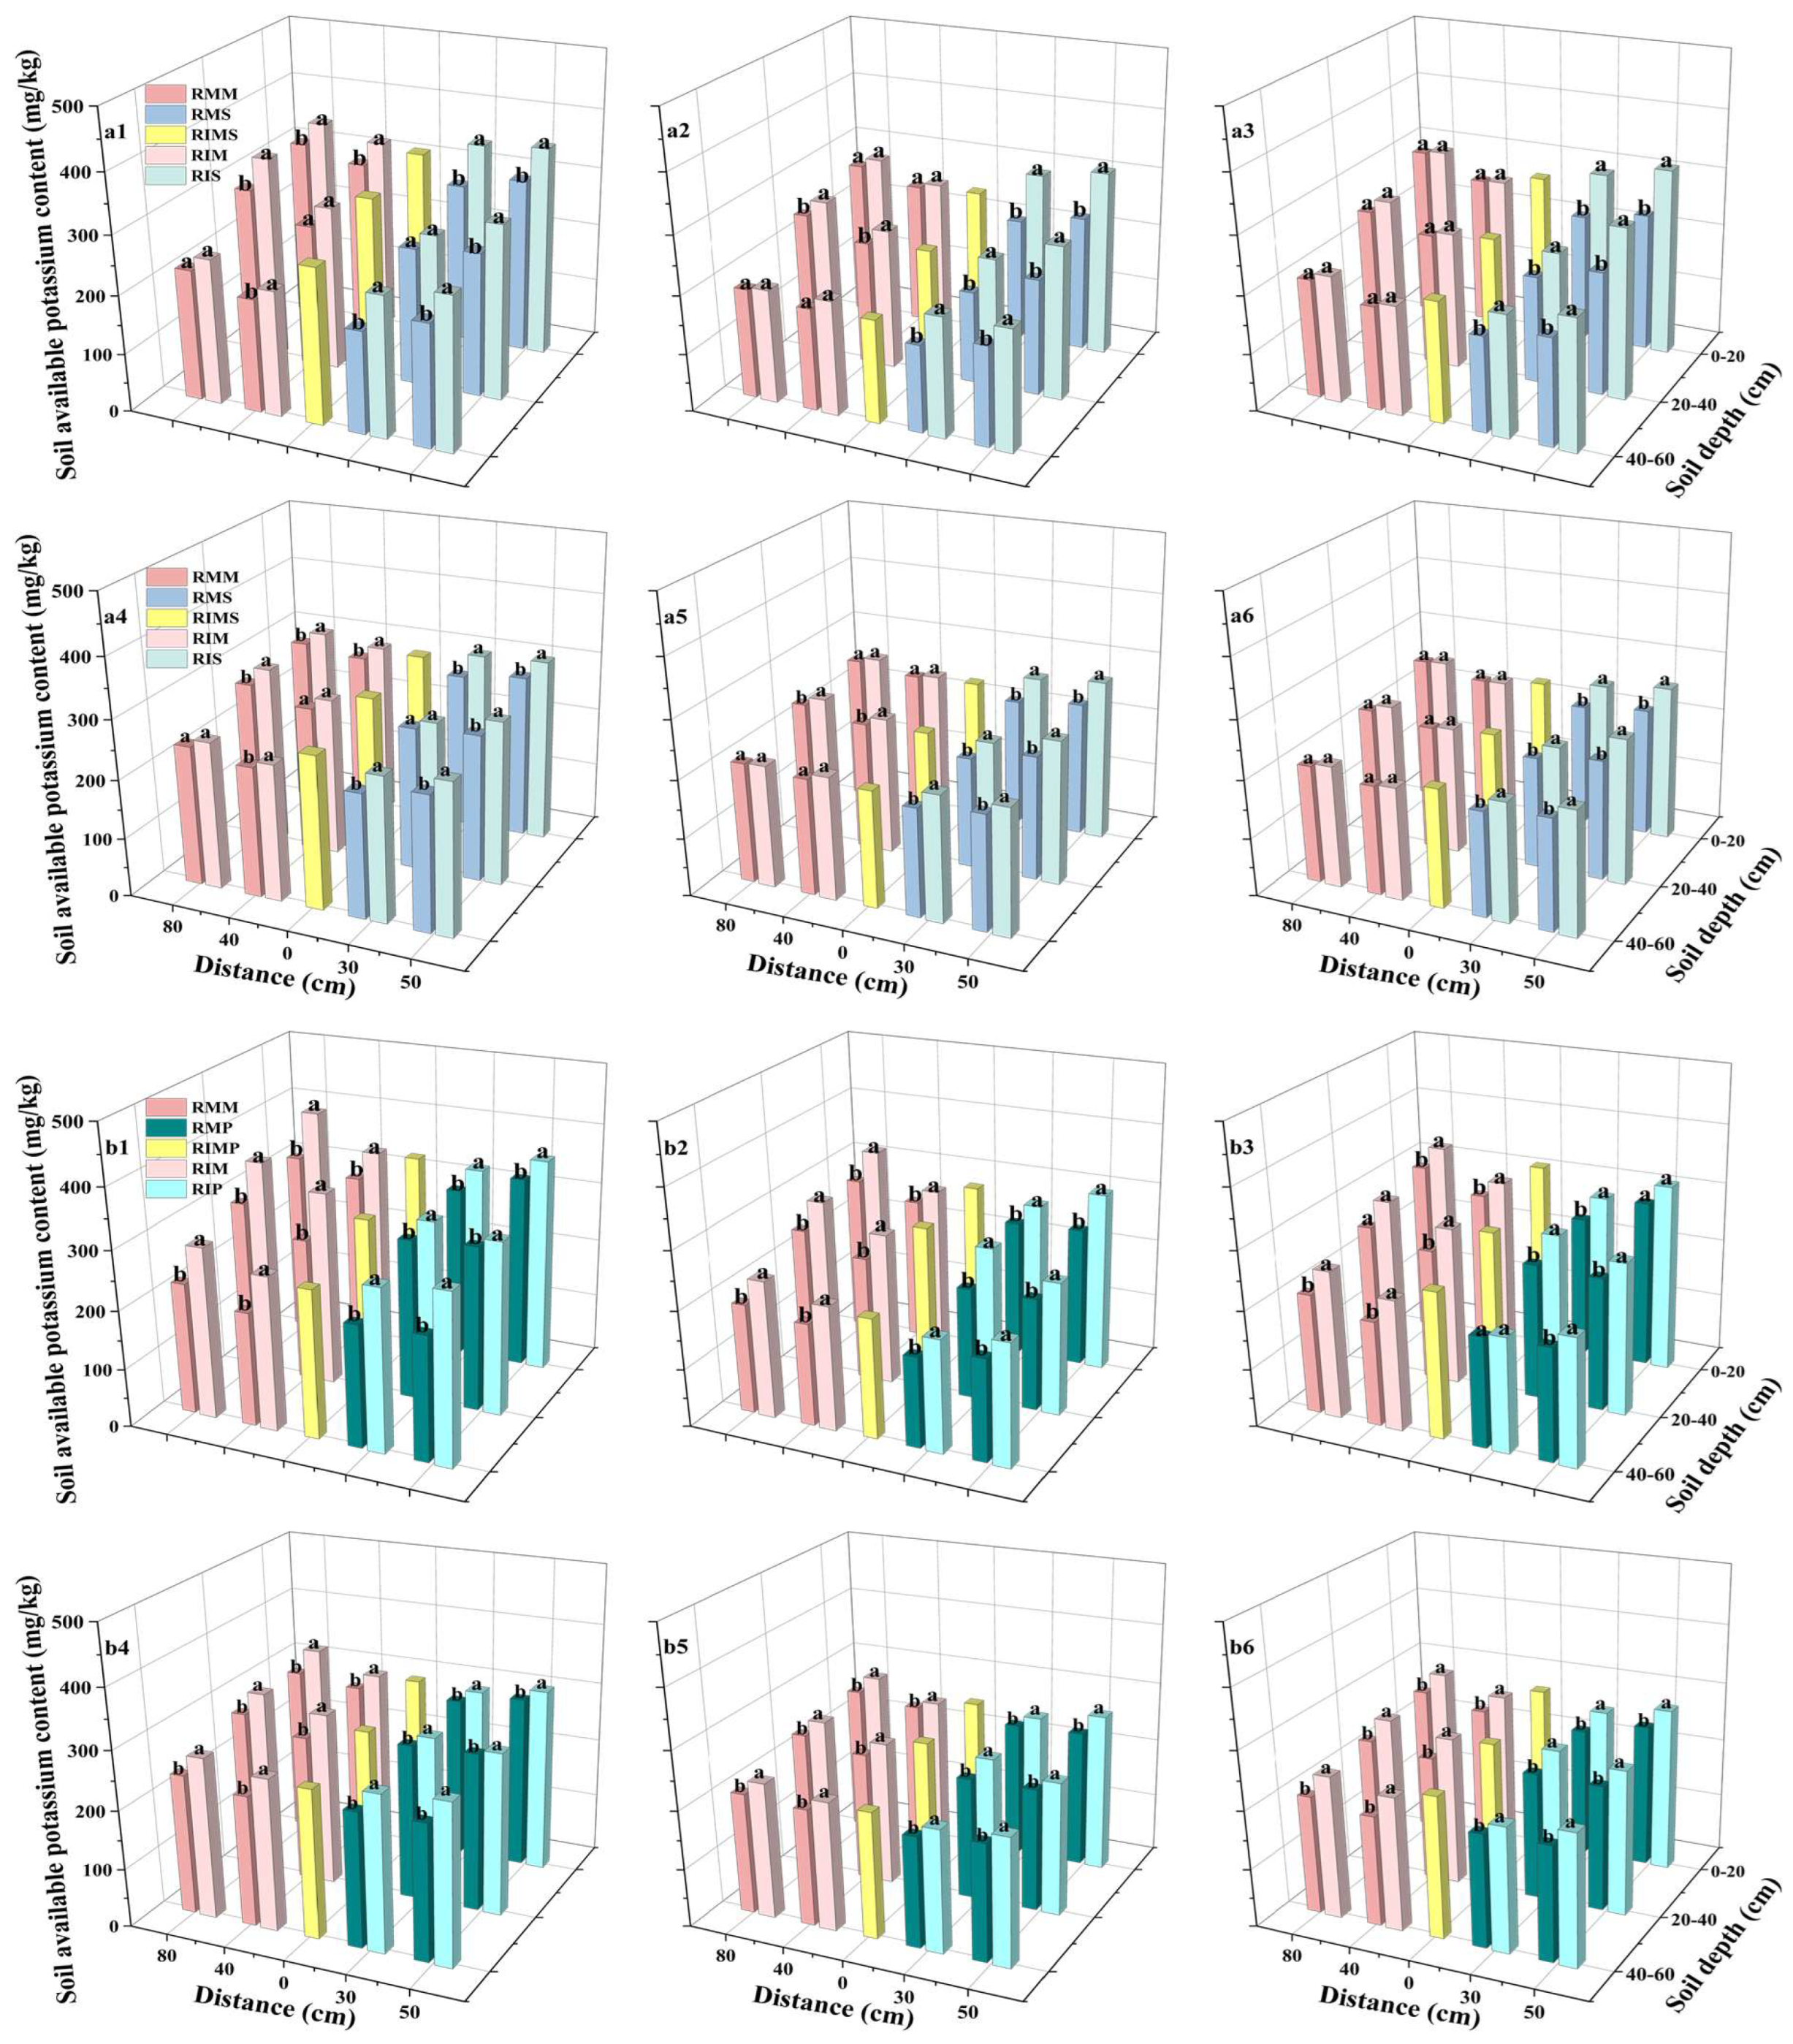
Soil available potassium (AK) content across all sampling points in both monoculture and intercropping systems exhibited a characteristic V-shaped trend during the growing season, decreasing initially before recovering. No significant interannual differences were observed (p > 0.05; Figure 8).
In the maize–soybean system, from T1 to T3, AK content at all root zone sampling points in the intercropping system consistently surpassed levels in the corresponding monoculture system, although the magnitude of increase varied dynamically with growth stage. Throughout the growth stages, intercropping consistently enhanced AK content compared to monoculture. Increases were observed at T1 (RIM-40: 10.38%, RIM-80: 11.71%, RIS-30: 18.37%, RIS-50: 16.72%), T2 (7.08%, 5.87%, 28.57%, 22.78%), and T3 (2.61%, 4.72%, 23.13%, 25.38%) for the respective positions. AK content in the root zone generally decreased with increasing soil depth. In the 0–20 cm layer, intercropped soybean (RIS-30, RIS-50) maintained significantly higher AK levels than monoculture from T1 to T3 (p < 0.05), with increases of 21.39% and 15.93% at T1, 31.03% and 27.91% at T2, and 23.13% and 25.38% at T3. In the 20–40 cm layer at T2, AK content was higher in intercropping than in monoculture at RIM-40 (3.33%), RIM-80 (7.85%), RIS-30 (19.78%), and RIS-50 (30.06%). In the 40–60 cm layer, intercropped soybean (RIS-30, RIS-50) consistently showed significantly higher AK content than monoculture at T1 (25.75%, 17.94%), T2 (25.49%, 15.18%), and T3 (19.72%, 16.68%) (p < 0.05). The content ranking was as follows: RIS (50 cm) > RIM (80 cm) > RIS (30 cm) > RMM (80 cm) > RIMS (0 cm) > RIM (40 cm) > RMM (40 cm) > RMS (50 cm) > RMS (30 cm) (Figure 8(a1–a6)).
In the maize–peanut intercropping system, soil available potassium (AK) content in the root zone was significantly enhanced under intercropping compared to the corresponding monocultures. This enhancement was consistent across growth stages, with AK content increases at T1 (RIM-40: 21.44%, RIM-80: 21.72%, RIP-30: 14.54%, RIP-50: 12.39%), T2 (13.21%, 17.70%, 19.19%, 16.83%) and T3 (17.71%, 18.22%, 16.66%, 14.13%) for the respective positions. The most pronounced intercropping advantages were observed in the 20–40 cm soil layer, although AK content generally decreased with increasing soil depth. In the 20–40 cm layer, the increases due to intercropping were substantial: at T1 (RIM-40: 26.73%, RIM-80: 20.70%, RIP-30: 10.57%, RIP-50: 4.39%), T2 (17.13%, 17.72%, 29.42%, 13.41%), and T3 (19.38%, 19.58%, 23.07%, 15.18%). The overall AK content across the experimental profile ranked as follows: RIM-80 > RIMP-0 > RIP-50 > RIM-40 > RIP-30 > RMM-80 > RMP-50 > RMM-40 > RMP-30 (Figure 8(b1–b6)).

3.7. Yield, Yield Components, and Land Equivalent Ratio (LER)

Crop yields were significantly influenced by intercropping systems and planting patterns, as illustrated in Table 2 and Table 3. In the maize–soybean intercropping system, maize yield exhibited a decrease of 21.59% compared to monoculture; however, the thousand-grain weight increased by 7.50%. Conversely, both the thousand-grain weight and yield of soybean experienced substantial declines of 13.65% and 64.10%, respectively. The average land equivalence ratio for this system over two years was 1.15, indicating a clear yield advantage. Similarly, in the maize–peanut intercropping system, maize yield decreased by 26.84% compared to monoculture, yet the thousand-grain weight increased by 6.19%. Peanut yield, however, saw a significant decline of 67.43%. The average land equivalence ratio for this system was 1.06, further demonstrating the yield advantage of intercropping.

4. Discussion

4.1. Intercropping Suppressed the Plant Height of Maize Grown with Peanuts, While Simultaneously Reducing the Stem Diameter of Maize, Soybeans, and Peanuts Within Each System

In this study, maize, as the dominant crop in the intercropping system, suppressed stem thickening by prioritizing resources towards vertical growth (increased plant height) to capture more sunlight. Conversely, soybean and peanut responded to shading stress through stem elongation, resulting in reduced stem thickness [28,29]. However, maize’s increased height and reduced stem diameter may also relate to soybean nodule nitrogen fixation during the T1 stage, despite this phase contributing merely 20–30% of total nitrogen fixation over the entire growth period [30]. Combined with pre-sowing basal fertilizer application, this resulted in maize exhibiting maximum height gain and minimal stem diameter reduction during T1. As the growing season progressed and competition intensified, these increases moderated [31]. Peanuts exhibit high root system spatial overlap with maize. As a crop with low nitrogen contribution rates and high phosphorus sensitivity [32,33,34], peanuts engage in intense competition for nitrogen and phosphorus throughout the entire growth period. This competition results in lower maize plant height and stem diameter compared to monoculture.

4.2. Intercropping Significantly Increased Maize Total Dry Weight (p < 0.05), Whilst Simultaneously Significantly Suppressing the Total Dry Weight Accumulation of Soybeans (p < 0.01) and Peanuts (p < 0.001)

During two years of field trials, intercropping treatments significantly enhanced biomass accumulation across all maize organs in both intercropping systems. Dry weights of roots, stems, leaves, and grains were significantly higher than in monocropping (p < 0.05). Fu et al. (2023) [35] observed that both intercropping systems increased maize plant-level total dry weight by 44.7% and 53.0%, respectively. Zhang et al. (2021) [36] demonstrated that maize–soybean/peanut strip intercropping significantly enhanced maize root, stem, leaf, and grain dry weight, with average increases of 25–40%. The present study aligns with these literature findings, demonstrating increased total maize dry matter weight. In contrast, under intercropping conditions, soybean root and leaf dry weight exhibited a typical ‘initial increase followed by decline’ dynamic pattern [37,38], while stem and grain dry weight maintained a sustained growth trend [39]; the dry weight of peanut’s vegetative organs (roots, stems, leaves) exhibited a significant decreasing trend (p < 0.05) as the growing season progressed, yet reproductive organ (grain) dry weight maintained stable growth. This reflects how soybean and peanut adapt to intercropping environments by adjusting the source (leaves)-sink (grain) relationship, prioritizing reproductive growth to enhance yield. Overall, within the intercropping system, maize total dry weight increased, whereas total dry weight of both soybean and peanut decreased.

4.3. Soil Alkaline-Hydrolyzable Nitrogen Content in Intercropped Maize, Soybean, and Peanut Fields Gradually Increased from T1 to T2, Then Decreased from T2 to T3

Research has demonstrated that maize–legume intercropping systems can effectively enhance nitrogen use efficiency through interspecific interactions, significantly reducing nitrogen losses and improving system nitrogen recovery rates [40,41,42]. The present study demonstrates that, within both intercropping systems, soil alkaline-hydrolyzable nitrogen content exhibits significant spatiotemporal dynamics influenced by the combined effects of growth stage, row position, and soil layer depth. Specifically, within the maize–soybean intercropping system, the impact of intercropping on nitrogen distribution underwent a dynamic transition from competitive to complementary effects. During the T1 period, soil alkaline-hydrolyzable nitrogen content decreased in the intercropped soybean rows, with the reduction intensifying with increasing soil depth. This indicates that soybean growth in the early stage was strongly inhibited by maize nitrogen competition, consistent with Kosslak’s findings that significant nodulation competition between strains in the early stage can indirectly cause nitrogen competition inhibition [43]. At the T2 and T3 growth stages, the soil alkaline hydrolyzable nitrogen content was significantly increased in the maize intercropping rows, with a particularly prominent increase in the deeper soil layer (40–60 cm), which reached 98.34% at the T3 stage. This suggests a strong capacity for deep nitrogen uptake by maize during its mid-to-late growth stages. Conversely, nitrogen content in the root zone of intercropped soybeans remained consistently and significantly lower than in the sole cropping system throughout the entire growth period, confirming soybeans’ role as a ‘nitrogen contributor’ within the system. In the maize–peanut intercropping system, total soil alkaline-hydrolyzable nitrogen was lower than in the maize–soybean system, indicating more intense nitrogen competition, with peanuts consistently at a disadvantage. During T1, peanut rows exhibited intense nitrogen consumption with the most pronounced decline in deeper layers (reaching 39.21%); during T2 and T3, maize rows showed significantly higher nitrogen content than monocropping (T3 increase of 79.60%), particularly in the middle-lower soil layers (40–60 cm), indicating its capacity to absorb deep-layer nitrogen. Conversely, peanut rows maintained significantly lower alkaline-hydrolyzable nitrogen throughout the entire growth period compared to monocropping. Compared to the maize–soybean system, the maize–peanut system exhibited lower overall soil alkali-hydrolyzable nitrogen content, indicating more intense depletion of soil nitrogen reserves. Furthermore, influenced by drip tape distribution, soybean and peanut alkali-hydrolyzable nitrogen was higher at 50 cm than at 30 cm, while maize showed higher levels at 80 cm than at 40 cm, suggesting crop water and nutrient uptake is closely linked to irrigation placement.

4.4. The Readily Available Phosphorus Content in Soil Decreased Progressively for Maize and Soybean Intercropping Systems. For Peanut Intercropping, Readily Available Phosphorus Levels Declined Significantly Between Treatment Periods T1 and T2, Before Showing a Slight Recovery Between T2 and T3

Phosphorus is frequently regarded as one of the most critical limiting nutrients in agricultural ecosystems [44]. However, its poor mobility within soil results in generally low crop utilization rates, typically ranging from 10% to 25% [45]. The present study demonstrates that in maize–soybean intercropping systems, soil available phosphorus content significantly decreased across all treatments during crop development (from T1 to T2), indicating vigorous absorption during the active growth phase as the primary driver. Nevertheless, phosphorus content increases in intercropped treatments persisted at most sites, suggesting the positive effects of intercropping extend throughout the entire growing season. Soil available phosphorus content varied with soil depth and distance from roots. The intercropping effect was most pronounced and stable in the topsoil (0–20 cm). In the middle soil layer (20–40 cm), significant increases occurred during the soybean pod-setting stage and in the later stages of the peanut system. In the deep soil layer (40–60 cm), the phosphorus advantage in the maize root zone (RIM 40 cm/80 cm) was maintained, highlighting the potential for deep-rooted crops to utilize nutrients in deeper soil layers. Throughout the maize–peanut intercropping system, soil available phosphorus content in intercropped maize and peanut rows remained significantly higher than in monocropping (p < 0.05) with sustained elevated increases, indicating stable enhancement of phosphorus availability through intercropping. Furthermore, akin to soil alkali-hydrolyzable nitrogen, soil available phosphorus distribution was influenced by drip tape placement, with row positions exhibiting consistent variation patterns.

4.5. In Intercropped Maize, Soybean, and Peanut Plots, Soil Available Potassium Content Exhibited a V-Shaped Trend Across Growth Stages, Initially Decreasing Before Subsequently Increasing

Soil potassium (K) deficiency poses a serious challenge to global agricultural production and threatens food security [46]. China, as the world’s largest consumer of potassium fertilizer, annually uses 16–18 million tons, accounting for about 25% of global consumption, while possessing only 3% of the world’s potassium salt reserves. As a result, K deficiency is widespread across Chinese croplands. Our findings reveal distinct patterns of available potassium distribution under different intercropping systems. In the maize–soybean system, available K accumulated preferentially in the soybean root zone (RIS 30 cm/50 cm), showing a significant and consistent increase across soil layers throughout the growth period, with the highest rise reaching 31.03%. This advantage was most pronounced in the 40–60 cm deep soil layer. In contrast, the increase in the maize root zone gradually declined from approximately 11% at the T1 stage to about 4% by the T3 stage, suggesting that this system favors K absorption and utilization by soybean. In the maize–peanut intercropping system, maize root zone dominance was evident. Potassium content in the intercropped maize root zone (RIM 40 cm/80 cm) showed a significant and stable increase (maintaining growth rates of 17–22% throughout the growing season), with the most pronounced intercropping advantage observed in the 20–40 cm middle soil layer. Although the increase in soil available potassium in the intercropped peanut root zone was less pronounced than that in maize, its reduction was smaller compared to monocropped peanut, indicating a relative improvement in potassium availability. Furthermore, the distribution of soil available potassium, alkaline-hydrolyzable nitrogen, and available phosphorus was also influenced by the placement of drip irrigation belts, resulting in consistent spatial patterns across row positions. In summary, both intercropping systems enhanced soil potassium availability and optimized its spatial distribution and utilization efficiency.

4.6. Both Intercropping Systems Demonstrate Yield Advantages

The yield advantage of intercropping has been confirmed in multiple trials across China [47,48]. In this study, both maize–soybean and maize–peanut intercropping systems achieved significant system-level yield increases through marginal effects and complementary interactions between crops and ecological niche, temporal sequence, and spatial configuration [49]. Although the individual yields of maize and leguminous crops (soybean/peanut) were significantly lower in intercropping than in their respective monocultures (maize yield reduction of 21.59–26.84%, leguminous crops yield reduction of 64.10–67.43%), the marked increase in maize thousand-kernel weight (6.19–7.50%) indicates improved grain filling processes [50]. However, the reduced maize planting area in intercropping systems compared to monocropping led to a decrease in maize plant density per unit area, ultimately resulting in lower maize yields than in monocropping systems [51]. Nevertheless, both intercropping systems partially offset the yield reduction from decreased planting area by efficiently utilizing spatial niches for soil nutrients such as nitrogen, phosphorus, and potassium. Leveraging the yield contribution from legumes, both systems ultimately achieved yield advantages, with the maize–soybean system demonstrating a more pronounced intercropping advantage.

5. Conclusions

Overall, maize–soybean and maize–peanut intercropping systems significantly improved land productivity, despite showing systematic differences in crop performance and nutrient use. Both systems exhibited clear intercropping advantages, with land equivalent ratios (LERs) above 1. The maize–soybean system (LER = 1.15) showed a stronger advantage compared to the maize–peanut system (LER = 1.06). In terms of crop growth, maize–soybean intercropping synergistically promoted plant height in both crops. In contrast, the maize–peanut system increased peanut plant height but significantly reduced stem diameter in both species. Dry matter allocation followed a “maize benefit-legume sacrifice” pattern, with a pronounced shift in dry matter toward maize in both systems. While this restricted legume growth, it ultimately enhanced total system productivity. Regarding soil nutrient dynamics, the two systems displayed contrasting patterns of nutrient accumulation and depletion. Nitrogen accumulated in the maize rows during the mid to late growth stages, but this was accompanied by a greater depletion of soil alkaline-hydrolyzable nitrogen in the maize–peanut system. The intercropping systems enhanced phosphorus supply, and the maize–peanut system was significantly more effective than the maize–soybean system in activating and maintaining soil available phosphorus. Potassium distribution exhibited species-specific patterns. In the maize–soybean system, potassium was predominantly accumulated in the soybean rows, especially in deeper soil layers. In contrast, accumulation in the maize–peanut system was more pronounced in the maize rows, particularly within the 20–40 cm soil layer.

Author Contributions

Conceptualization, W.Z. (Wei Zhang) and W.Z. (Wenwen Zhang); methodology, W.Z. (Wei Zhang) and W.Z. (Wenwen Zhang); software, W.Z. (Wenwen Zhang) validation, W.W. and Y.Z.; formal analysis, W.Z. (Wenwen Zhang); investigation, W.Z. (Wenwen Zhang) and G.L.; resources, L.S. and Z.L.; data curation, W.Z. (Wenwen Zhang); writing—original draft, W.Z. (Wenwen Zhang); writing—review and editing, W.Z. (Wenwen Zhang); visualization, W.Z. (Wenwen Zhang); supervision, W.Z. (Wei Zhang) and T.T.; project administration, W.Z. (Wei Zhang); funding acquisition, W.Z. All authors have read and agreed to the published version of the manuscript.

Funding

This research was supported by the Xinjiang Production and Construction Corps Talent Special Project (CZ005110).

Data Availability Statement

The original contributions presented in this study are included in the article. Further inquiries can be directed to the corresponding author(s).

Conflicts of Interest

The authors declare no conflicts of interest.

References

  1. Zhao, C.; Gao, F.; Li, Z.; Yang, J.; Zhou, X. Effects of Different Maize-Soybean Intercropping Row Ratios on Soybean Photosynthetic Characteristics and Yield. Sichuan Agric. Univ. 2023, 41, 820–825. [Google Scholar] [CrossRef]
  2. Dai, J.; Qiu, W.; Wang, T.; Nakanishi, H.; Zuo, Y. From Leguminosae/Gramineae intercropping systems to see benefits of intercropping on iron nutrition. Front. Plant Sci. 2019, 10, 605. [Google Scholar] [CrossRef]
  3. Zhang, H.; Wang, C.; Xu, G.; Qin, Y.; Zhang, S. Soil Fertilizer and Agricultural Sustainable Development. Ahnui. Agric. Sci. Bull. 2008, 21. 045. [Google Scholar] [CrossRef]
  4. Li, L.; Sun, J.; Zhang, F.; Li, X.; Yang, S.; Rengel, Z. Wheat/maize or wheat/soybean strip intercropping: I. Yield advantage and interspecific interactions on nutrients. Field Crops Res. 2001, 71, 123–137. [Google Scholar] [CrossRef]
  5. Yu, W.; Jiang, Z.; Zhou, Y.; Ma, Q.; Shen, S. Crop yield and fertilizer contribution under different fertilization systems. Chin. J. Ecol. Agric. 2007, 15, 54–58. [Google Scholar]
  6. Li, S.; Shen, C. Research progress on regulation of nitrate nitrogen metabolism and utilization in crops. J. Nanjing Agric. Univ. 2022, 45, 8. [Google Scholar] [CrossRef]
  7. Yang, X.; Fu, Y.; Kang, Q.; Zhang, Z.; Yuan, S. Study on the molecular mechanism of nitrogen interaction in plant leaf development. In Proceedings of the First Conference on Frontiers in Plant Science, Nanjing, China, 18 July 2022. [Google Scholar] [CrossRef]
  8. Meng, X.; Zhang, S.; Lv, Y.; Wang, Y.; Wang, L. Chlorophyll fluorescence reflects the nitrogen nutrition status of maize leaves under long-term nitrogen deficiency. In Proceedings of the 20th Annual Conference of the Chinese Crop Science Society, Changsha, China, 1 November 2023. [Google Scholar] [CrossRef]
  9. Li, S. Occurrence form and environmental significance of phosphorus in mountain soil at different altitudes in Shennongjia. J. Huazhong Agric. Univ. 2015. [Google Scholar]
  10. Wu, Y. Study on the Epigenetic Mechanism of Maize Seedling Roots under Nitrogen Deficiency and Re-nitrogen Treatment. J. Northwest A F Univ. 2012. [Google Scholar]
  11. Zhang, D.; Che, Z.; Liu, J.; Yang, J. Research progress on the response and mechanism of maize to nitrogen forms. J. Plant Nutr. Fertil. 2024, 30, 1020–1031. [Google Scholar] [CrossRef]
  12. Ma, H.; Yu, X.; Yu, Q.; Wu, H.; Zhang, H.; Pang, J.; Gao, Y. Maize/alfalfa intercropping enhances yield and phosphorus acquisition. Field Crops Res. 2023, 303, 109136. [Google Scholar] [CrossRef]
  13. Li, C. Effects of Coniferous and Broadleaf Mixed Transformation on Nitrogen and Phosphorus Fractions and Their Transformation in Rhizosphere Soil of Chinese Fir Plantation. Master’s Thesis, Guangxi University, China, 2024. [Google Scholar] [CrossRef]
  14. Liao, D.; Zhang, C.; Lambers, H.; Zhang, F. Changes in soil phosphorus fractions in response to long-term phosphate fertilization under sole cropping and intercropping of maize and faba bean on a calcareous soil. Plant Soil 2021, 463, 589–600. [Google Scholar] [CrossRef]
  15. Khashi u Rahman, M.; Wang, X.; Gao, D.; Zhou, X.; Wu, F. Root exudates increase phosphorus availability in the tomato/potato onion intercropping system. Plant Soil 2021, 464, 45–62. [Google Scholar] [CrossRef]
  16. Liu, J.; Li, Y.; Han, C.; Yang, D.; Yang, J.; Cade-Menun, B.J.; Sui, P. Maize-soybean intercropping facilitates chemical and microbial transformations of phosphorus fractions in a calcareous soil. Front. Microbiol. 2022, 13, 1028969. [Google Scholar] [CrossRef] [PubMed]
  17. Ou, Y.; Jia, X.; Shi, J.; Wei, M.; Teng, W. Research progress on effects of intercropping on crops, soils and microorganisms. Jiangsu Agric. Sci. 2024, 52, 18–30. [Google Scholar] [CrossRef]
  18. Johnson, R.; Vishwakarma, K.; Hossen, M.; Kumar, V.; Shackira, A.; Puthur, J.; Hasanuzzaman, M. Potassium in plants: Growth regulation, signaling, and environmental stress tolerance. Plant Physiol. Biochem. 2022, 172, 56–69. [Google Scholar] [CrossRef]
  19. Zhang, Y.; Yang, C.; Li, N.; Zhang, J. Discussion on Extraction of Potassium from Plant Ash. Agric. Technol. 2016, 36, 2. [Google Scholar] [CrossRef]
  20. McGivern, B.; Cronin, D.; Ellenbogen, J.; Borton, M.; Knutson, E.; Freire-Zapata, V.; Wrighton, K. Microbial polyphenol metabolism is part of the thawing permafrost carbon cycle. Nat. Microbiol. 2024, 9, 1454–1466. [Google Scholar] [CrossRef]
  21. Lv, Y. Study on Phosphorus Balance and Soil Phosphorus Availability in Paddy-upland Rotation System. J. China Agric. Univ. 2016. [Google Scholar]
  22. Li, Y.; Sun, J.; Yu, C.; Zhang, F.; Li, L. Effects of nitrogen application rate and faba bean/maize intercropping on spatial and temporal distribution of soil inorganic nitrogen. J. Plant Nutr. Fertil. 2009, 15, 815–823. [Google Scholar] [CrossRef]
  23. Liu, Z.; Wu, X.; Tang, L.; Zheng, Y.; Li, H.; Pan, H.; Zhu, D.; Wang, J.; Huang, S.; Qin, X.; et al. Dynamics of N acquisition and accumulation and its interspecific N competition in a wheat-faba bean intercropping system. Plant Nutr. Fertil. Sci. 2020, 26, 11. [Google Scholar] [CrossRef]
  24. Yu, R.; Yang, H.; Xing, Y.; Zhang, W.; Lambers, H.; Li, L. Belowground processes and sustainability in agroecosystems with intercropping. Plant Soil 2022, 476, 263–288. [Google Scholar] [CrossRef]
  25. Wang, X.; Li, Y.; Yang, M.; Liang, W.; Zhang, X. Intercropping with appropriate nitrogen reduction achieves the trade-off among soil biological health, soil multifunctionality, and crop productivity. Field Crops Res. 2025, 333, 110085. [Google Scholar] [CrossRef]
  26. Zhang, J.; Yao, Q.; Zhou, G.; Wu, W.; Xiu, X.; Wang, J. Intelligent Identification of Crop Agronomic Traits and Morphological Structure Phenotypes: A Review. Smart Agric. 2024, 6, 14. [Google Scholar] [CrossRef]
  27. Xiang, D.; Song, Y.; Wu, Q.; Ma, C.; Zhao, J.; Wan, Y.; Zhao, G. Relationship between stem characteristics and lodging resistance of Tartary buckwheat (Fagopyrum tataricum). Plant Prod. Sci. 2019, 22, 202–210. [Google Scholar] [CrossRef]
  28. Zhao, J.; Sun, J.; Chen, L.; Li, W. Effects of maize row spacing on growth and interspecific competitiveness of soybean/maize intercropping crops. Soybean Sci. 2019, 38, 229–235. [Google Scholar]
  29. Raza, M.; Bin Khalid, M.; Zhang, X.; Feng, L.; Khan, I.; Hassan, M.; Yang, W. Effect of planting patterns on yield, nutrient accumulation and distribution in maize and soybean under relay intercropping systems. Sci. Rep. 2019, 9, 4947. [Google Scholar] [CrossRef]
  30. Liu, W.; Yong, T.; Liu, X.; Chen, P.; Dong, Q.; Xu, T.; Yang, W. Effects of reduced nitrogen application on nitrogen fixation and nitrogen absorption and utilization of soybean nodules in maize-soybean relay strip intercropping system. Soybean Sci. 2014, 33, 705–712. [Google Scholar] [CrossRef]
  31. Zhang, X.; Chen, P.; Pang, T.; Du, Q.; Fu, Z.; Zhou, Y.; Yong, T. Effects of maize/legume intercropping patterns on dry matter accumulation, distribution and yield of crops. J. Sichuan Agric. Univ. 2017, 35, 484–490. [Google Scholar] [CrossRef]
  32. Jiao, N.; Wang, J.; Ma, C.; Zhang, C.; Guo, D.; Zhang, F.; Jensen, E. The importance of aboveground and belowground interspecific interactions in determining crop growth and advantages of peanut/maize intercropping. Crop J. 2021, 9, 1460–1469. [Google Scholar] [CrossRef]
  33. Zhang, X.; Chen, P.; Du, Q.; Zhou, Y.; Ren, J.; Jin, F.; Yong, T. Effects of maize/soybean and maize/peanut intercropping systems on crops nitrogen uptake and nodulation nitrogen fixation. Chin. J. Eco-Agric. 2019, 27, 1183–1194. [Google Scholar] [CrossRef]
  34. Jiao, N.; Hou, L.; Ning, T.; Li, Z.; Li, Y.; Fu, G. Analysis on the advantages of maize-peanut intercropping nitrogen and phosphorus nutrition intercropping. Crops 2007, 4, 50–53. [Google Scholar] [CrossRef]
  35. Fu, Z.; Chen, P.; Zhang, X.; Du, Q.; Zheng, B.; Yang, H.; Yong, T. Maize-legume intercropping achieves yield advantages by improving leaf functions and dry matter partition. BMC Plant Biol. 2023, 23, 438. [Google Scholar] [CrossRef] [PubMed]
  36. Zhang, R.; Meng, L.; Li, Y.; Wang, X.; Ogundeji, A.; Li, X.; Li, S. Yield and nutrient uptake dissected through complementarity and selection effects in the maize/soybean intercropping. Food Energy Secur. 2021, 10, 379–393. [Google Scholar] [CrossRef]
  37. Raza, M.; Gul, H.; Wang, J.; Yasin, H.S.; Qin, R.; Khalid, M.; Yang, W. Land productivity and water use efficiency of maize-soybean strip intercropping systems in semi-arid areas: A case study in Punjab Province, Pakistan. J. Clean. Prod. 2021, 308, 127282. [Google Scholar] [CrossRef]
  38. Fang, P. Effects of maize-soybean intercropping on dry matter accumulation, yield and quality of vegetable soybean. J. Sichuan Agric. Univ. 2016. [Google Scholar]
  39. Ye, D.; Song, Y.; Yue, Y.; Yang, Y. Study on dry matter accumulation and transport characteristics of different varieties of soybean under maize-soybean intercropping. Shaanxi J. Agric. Sci. 2024, 70, 18–22. [Google Scholar] [CrossRef]
  40. Li, Y.; Sun, J.; Li, C.; Li, L.; Cheng, X.; Zhang, F. Effects of nitrogen application on agronomic traits and nodulation characteristics of faba bean in faba bean/maize intercropping system. Sci. Agric. Sin. 2009, 42, 3467–3474. [Google Scholar] [CrossRef]
  41. Yang, Y.; Wu, B. Research of Intercropping Benefit of Crop Intercropping Systems. Chin. Agric. Sci. Bull. 2007, 11, 192–196. [Google Scholar] [CrossRef]
  42. Brewer, M.; Kanissery, R.; Strauss, S.; Kadyampakeni, D. Impact of cover cropping on temporal nutrient distribution and availability in the soil. Horticulturae 2023, 9, 1160. [Google Scholar] [CrossRef]
  43. Kosslak, R.; Bohlool, B.; Dowdle, S.; Sadowsky, M. Competition of Rhizobium japonicum strains in early stages of soybean nodulation. Appl. Environ. Microbiol. 1983, 46, 870–873. [Google Scholar] [CrossRef]
  44. Kang, G.; Wang, P.; Li, Y.; Wang, J.; Han, Q. Progress on mechanism on the phosphorus-efficient absorption and utilization in wheat (Triticum aestivum L.). J. Plant Nutr. Fertil. 2025, 31, 800–809. [Google Scholar] [CrossRef]
  45. Ding, Y.; Hou, Y.; Ge, C. Molecular regulatory mechanisms of rice response to low phosphorus stress at seedling stage. J. Plant Nutr. Fertil. 2024, 30, 2230–2236. [Google Scholar] [CrossRef]
  46. Liu, Z.; Yuan, X.; Zhang, Z.; Yang, X.; Ai, C.; Wang, Z.; Xu, X. Revisiting potassium-induced impacts on crop production and soil fertility based on thirty-three Chinese long-term experiments. Field Crops Res. 2025, 322, 109732. [Google Scholar] [CrossRef]
  47. Zhang, W.; Fornara, D.; Yang, H.; Yu, R.; Callaway, R.; Li, L. Plant litter strengthens positive biodiversity–ecosystem functioning relationships over time. Trends Ecol. Evol. 2023, 38, 473–484. [Google Scholar] [CrossRef]
  48. Li, C.; Stomph, T.; Makowski, D.; Li, H.; Zhang, C.; Zhang, F.; Werf, D. The productive performance of intercropping. Proc. Natl. Acad. Sci. USA 2023, 120, e2201886120. [Google Scholar] [CrossRef]
  49. Li, X.; Fan, C.; Xu, Q.; Hou, J.; Wang, H.; Liu, Y.; Han, W. Effects of different maize and soybean planting patterns on crop yield, economic benefits and soil nutrients. Chin. Agric. Sci. Bull. 2025, 41, 22–28. [Google Scholar] [CrossRef]
  50. Wang, Y.; Fan, L.; Zhang, D.; Mao, S.; Hu, F.; Yin, W.; Chao, Q. The response of maize yield sustainability to intercropping green manure under different irrigation amounts. Acta Agron. Sin. 2025, 41, 22–28. [Google Scholar] [CrossRef]
  51. Zhao, J.; Sun, J.; Li, L.; Li, W. Effects of changing maize row spacing on yield of pea/maize intercropping system. Chin. J. Eco-Agric. 2012, 20, 1451–1456. [Google Scholar] [CrossRef]
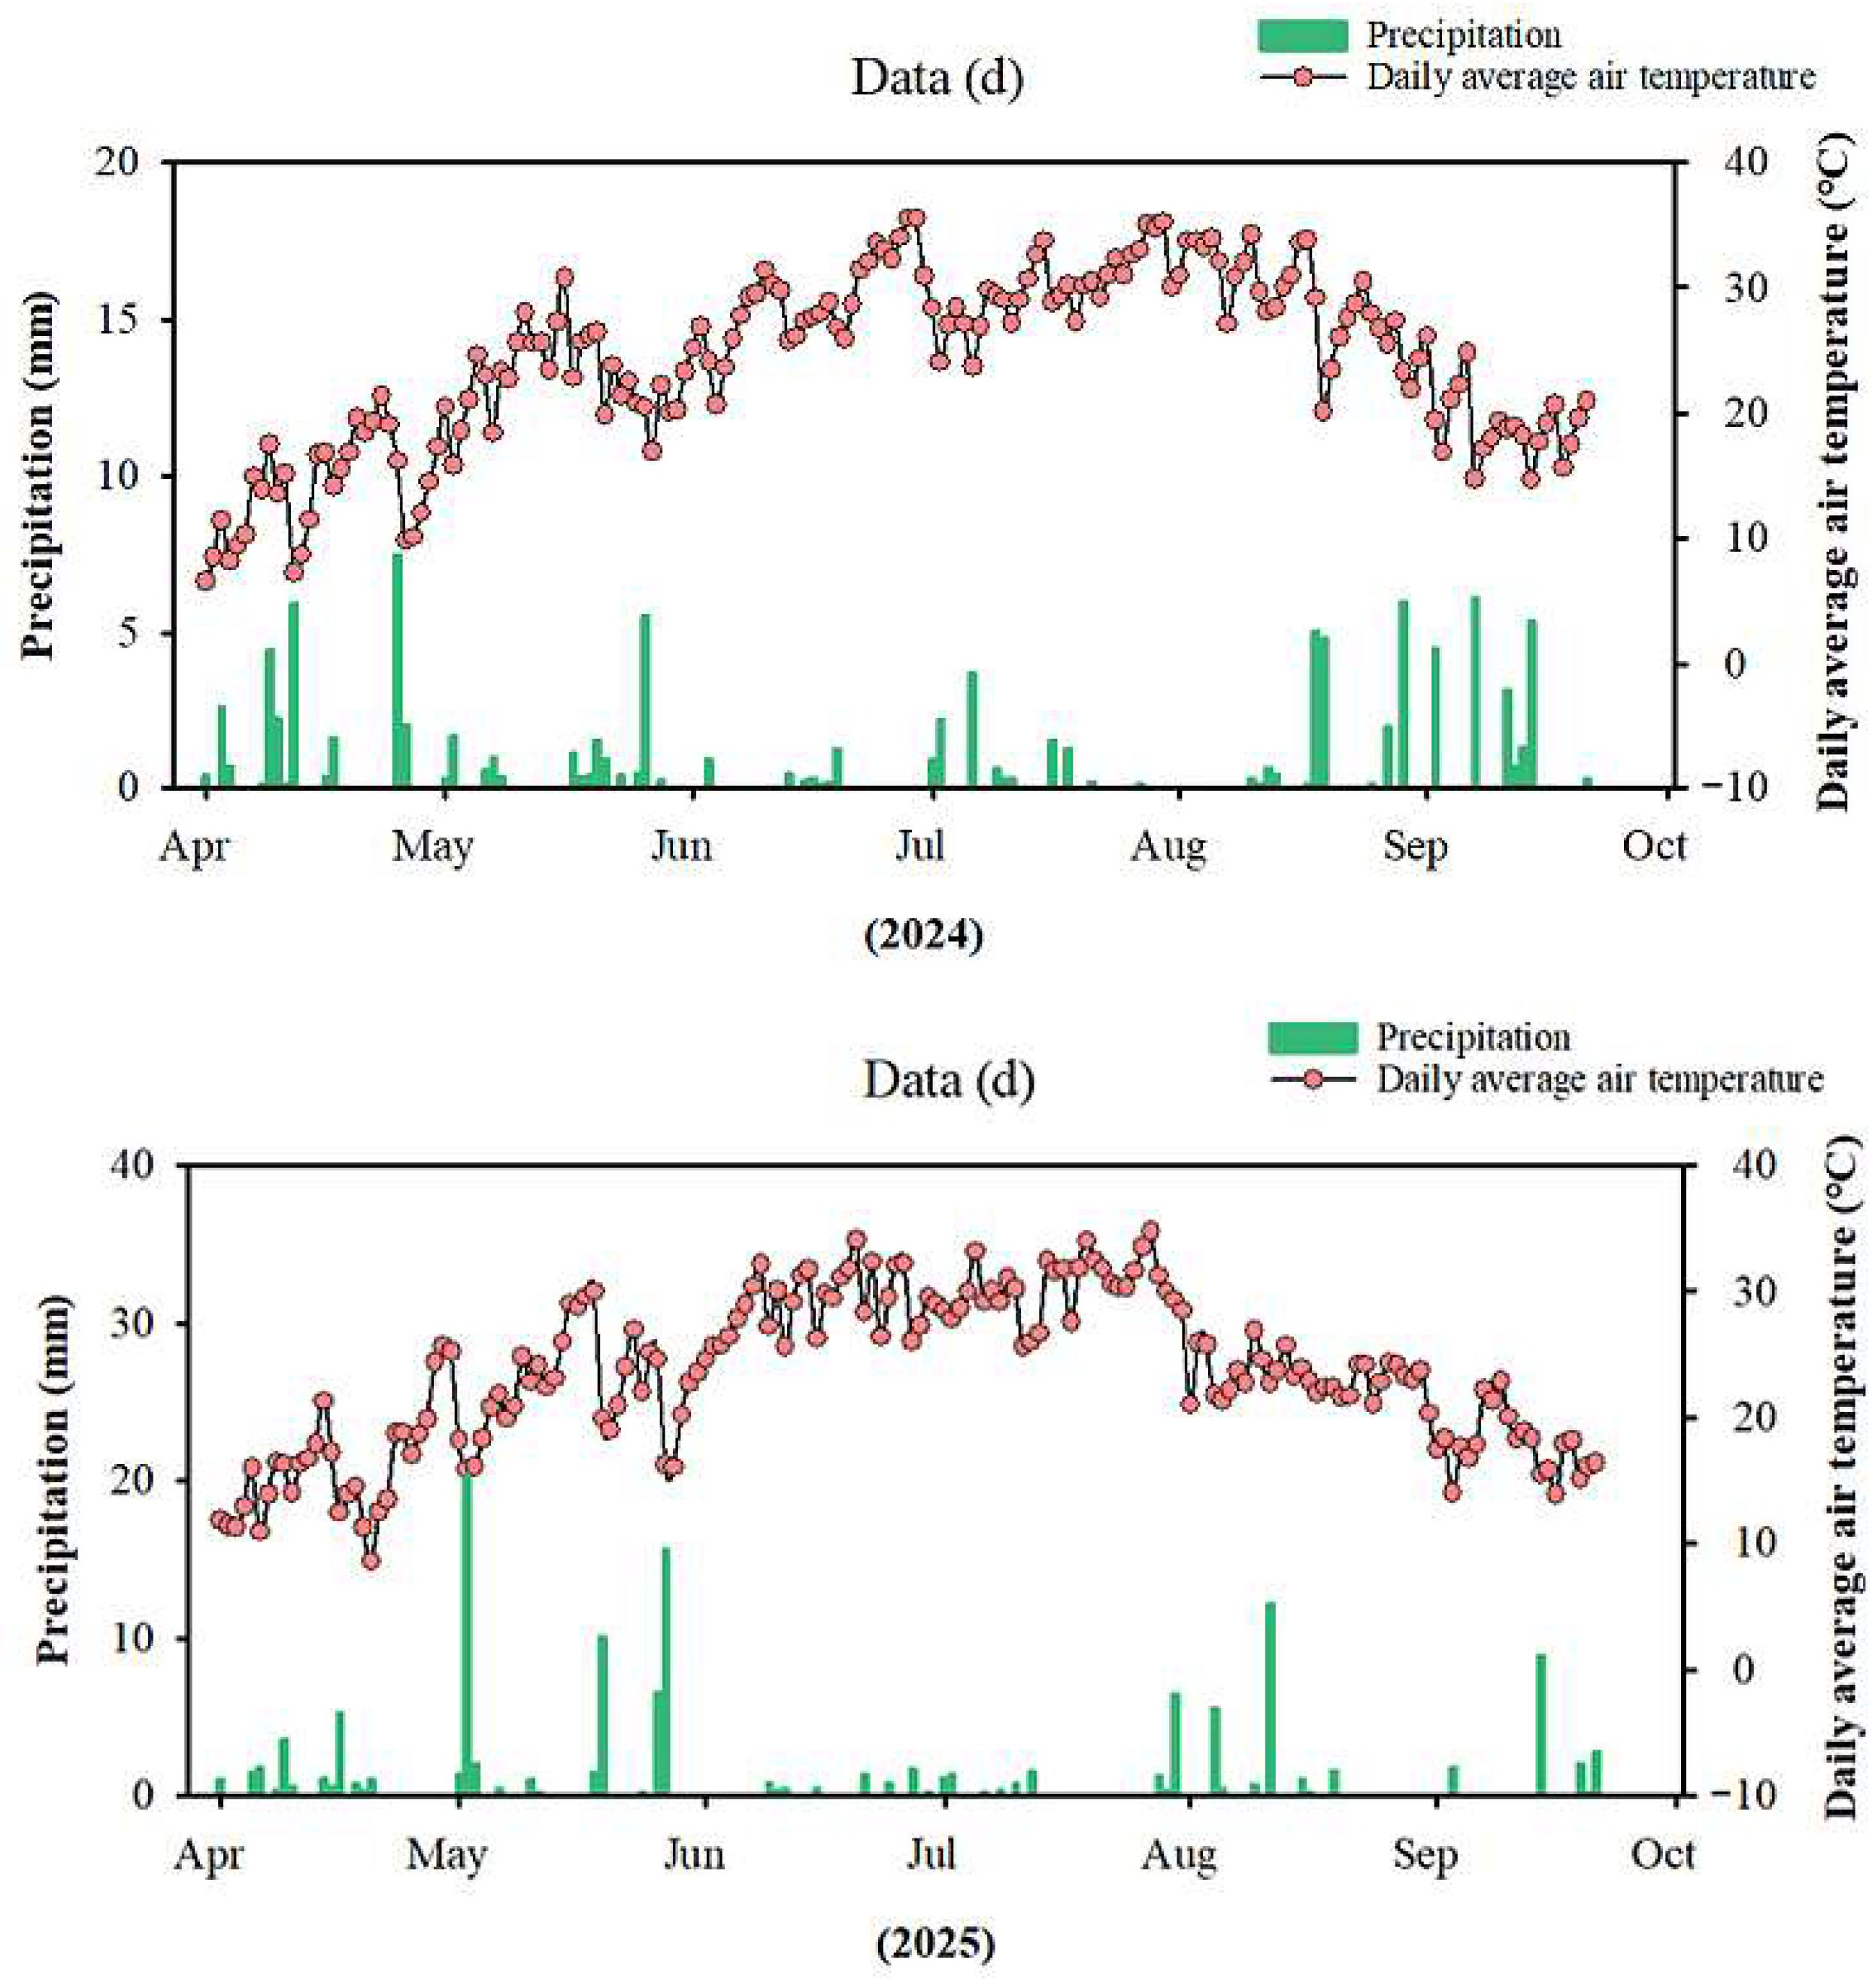
Figure 1. Daily precipitation and average temperature from April to September in 2024 and 2025.
Agronomy 15 02527 g001
Figure 2. Experimental layout diagram.
Agronomy 15 02527 g002
Figure 3. Effects of maize–soybean and maize–peanut intercropping systems on plant height (2024–2025). Panels (ad) show the results for the maize–soybean and maize–peanut systems, respectively. IM, intercropped maize; IS, intercropped soybean; IP, intercropped peanut; MM, monocropped maize; MS, monocropped soybean; MP, monocropped peanut. Error bars indicate SD. Different lowercase letters indicate significant difference between different treatments in same period (p < 0.05).
Agronomy 15 02527 g003
Figure 4. Effects of different intercropping systems on crop stem diameter. (a) 2024; (b) 2025. IM-S: maize intercropped with soybean; IM-P: maize intercropped with peanut. MM-S, MM-P: Monoculture treatments. For other abbreviations (IS, MS, IP, MP), see Figure 3. Error bars indicate SD. Different lowercase letters indicate significant difference between different treatments in same period (p < 0.05).
Agronomy 15 02527 g004
Figure 5. Dry matter content in different organs of maize, soybean, and peanut under different intercropping systems (2024–2025). (a,b) Maize; (c,d) Soybean and peanut. IM1 denotes maize intercropped with soybean, and IM2 denotes maize intercropped with peanut. For other abbreviations (IS, MS, IP, MP), see Figure 3.
Agronomy 15 02527 g005
Figure 6. Soil alkaline-hydrolyzable nitrogen content in maize–soybean and maize–peanut intercropping systems (T1 period: (a1,a4,b1,b4); T2 period: (a2,a5,b2,b5); T3 period: (a3,a6,b3,b6); 2024: (a1a3,b1b3); 2025: (a4a6,b4b6). Error bars indicate SD. Different lowercase letters indicate significant difference between different treatments in same period (p < 0.05).
Agronomy 15 02527 g006
Figure 7. Soil available phosphorus content in maize–soybean and maize–peanut intercropping systems (T1 period: (a1,a4,b1,b4); T2 period: (a2,a5,b2,b5); T3 period: (a3,a6,b3,b6); 2024: (a1a3,b1b3); 2025: (a4a6,b4b6). Error bars indicate SD. Different lowercase letters indicate significant difference between different treatments in same period (p < 0.05).
Agronomy 15 02527 g007
Figure 8. Maize–soybean intercropping system and maize–peanut intercropping system soil available potassium content (T1 period: (a1,a4,b1,b4); T2 period: (a2,a5,b2,b5); T3 period: (a3,a6,b3,b6); 2024: (a1a3,b1b3); 2025: (a4a6,b4b6). Error bars indicate SD. Different lowercase letters indicate significant difference between different treatments in same period (p < 0.05).
Agronomy 15 02527 g008
Table 1. Soil nutrient content in the 0–60 cm soil layer before sowing.
Soil Depth
(cm)
Organic Matter (g/kg)Total Nitrogen (g/kg)Alkali-Hydrolyzable Nitrogen (mg/kg)Phosphorus (mg/kg)Rapid-Acting Potassium (mg/kg)
0–2023.33 ± 2.591.29 ± 0.3064.40 ± 3.1223.73 ± 1.00207.59 ± 8.27
20–4017.19 ± 1.040.90 ± 0.1552.33 ± 8.1519.79 ± 1.64161.26 ± 7.10
40–6011.68 ± 1.340.44 ± 0.1035.79 ± 4.4714.39 ± 0.69122.62 ± 8.10
Table 2. The yield, yield components, and land equivalent ratio of maize–soybean intercropping system.
YearTreatmentNumber of Rows Per Ear/Number of Effective Pods Grain Number Per Panicle/Grain Number Per PlantThousand Grain Weight (g)Yield (kg·hm−2)LER
2024MM15.00 ± 1.05 a600.93 ± 52.81 a334.17 ± 4.11 a13,783.01 ± 169.53 a
MS32.60 ± 2.41 a79.00 ± 22.63 a242.40 ± 9.57 a2680.96 ± 105.84 a
IM14.80 ± 1.03 a611.33 ± 42.80 a354.50 ± 13.36 a10,409.31 ± 392.37 b1.12 ± 0.02
IS26.20 ± 1.48 b73.40 ± 12.76 a207.30 ± 7.90 b973.82 ± 37.12 b
2025MM14.90 ± 1.52 a628.80 ± 73.17 a319.70 ± 6.44 b12,489.19 ± 101.70 a
MS32.00 ± 1.87 a83.80 ± 21.15 a234.87 ± 13.55 a2755.47 ± 158.98 a
IM15.10 ± 1.29 a607.33 ± 51.50 a348.203 ± 15.38 a10,154.05 ± 448.61 b1.17 ± 0.06
IS26.80 ± 2.17 b74.80 ± 12.19 a204.77 ± 7.90 b980.26 ± 37.82 b
Note: Means followed by different letters are significantly different at 0.05 levels. IM, intercropped maize; IS, intercropped soybean; MM, monocropped maize; MS, monocropped soybean.
Table 3. The yield, yield components, and land equivalent ratio of maize–peanut intercropping system.
YearTreatmentNumber of Rows Per Ear/Number of Pods Per Plant Grain Number Per Panicle/Full Fruit Number Per PlantThousand Kernel Weight (g)Yield (kg·hm−2)LER
2024MM15.00 ± 1.05 a600.93 ± 52.81 a334.17 ± 4.11 a13,783.01 ± 169.53 a
MS23.00 ± 2.39 a19.00 ± 1.41 a725.65 ± 44.62 a5066.88 ± 311.59 a
IM15.00 ± 1.41 a625.47 ± 76.12 a341.37 ± 4.45 a9745.58 ± 127.04 b1.05 ± 0.05
IS22.63 ± 1.69 a15.50 ± 1.07 b662.48 ± 26.90 a1725.10 ± 70.05 b
2025MM14.90 ± 1.52 a628.80 ± 73.17 a319.70 ± 6.44 b12,489.19 ± 101.70 a
MS25.13 ± 1.55 a21.50 ± 2.45 a756.71 ± 32.47 a5409.58 ± 232.10 a
IM15.00 ± 1.15 a593.53 ± 64.37 a352.40 ± 11.68 a9443.77 ± 168.69 b1.07 ± 0.02
IS22.38 ± 2.00 b15.88 ± 1.81 b662.30 ± 27.95 b1682.26 ± 71.00 b
Note: Means followed by different letters are significantly different at 0.05 levels. IM, intercropped maize; IP, intercropped peanut; MM, monocropped maize; MP, monocropped peanut.
Disclaimer/Publisher’s Note: The statements, opinions and data contained in all publications are solely those of the individual author(s) and contributor(s) and not of MDPI and/or the editor(s). MDPI and/or the editor(s) disclaim responsibility for any injury to people or property resulting from any ideas, methods, instructions or products referred to in the content.