Article

Sugarcane–Peanut Intercropping Enhances Farmland Productivity: A Multi-Omics Investigation into the Coordination of Zinc Homeostasis and Hormonal Signaling

1
Xianghu Laboratory, Hangzhou 311231, China
2
College of Animal Science, Fujian Agriculture and Forestry University, Fuzhou 350002, China
3
National Engineering Research Center for Sugarcane, Fujian Agriculture and Forestry University, Fuzhou 350002, China
4
Province and Ministry Co-Sponsored Collaborative Innovation Center of Sugar Industry, Guangxi University, Nanning 530004, China
*
Author to whom correspondence should be addressed.
Agronomy 2025, 15(11), 2510; https://doi.org/10.3390/agronomy15112510
Submission received: 15 September 2025 / Revised: 21 October 2025 / Accepted: 23 October 2025 / Published: 29 October 2025
(This article belongs to the Special Issue Strategies for Sustainable Sugarcane Health and Productivity)

Abstract

Intercropping triggers coordinated changes in gene expression and metabolite accumulation across sugarcane roots, stems, and leaves, leading to higher crop yields—an effect that has drawn growing attention. Yet, how this transcriptional and metabolic interplay precisely enhances productivity remains poorly understood, limiting insight into intercropping’s yield-promoting mechanisms. This research explored the relationships between sugarcane, its metabolites, and transcriptomes through field trials integrated with multi-omics analysis. Data from the field showed clear differences in gene expression and metabolite patterns between monoculture and intercropped sugarcane. Plants under intercropping displayed stronger differential gene expression, greater metabolite diversity, and shifts in physiological traits. Metabolite variation was closely linked to gene regulation and network complexity, which in turn affected key agricultural characteristics including plant height, stem thickness, and sugar content. Follow-up experiments confirmed that applying zinc—a element boosted by intercropping—improved growth in monoculture sugarcane and modified its hormonal composition. These results highlight the important role of coordinated transcriptome-metabolite activity in intercropping systems. The study provides valuable perspectives for making intensive farming more economical and sustainable, supporting efforts to raise crop output and improve ecosystem functions.

1. Introduction

Sugarcane (Saccharum hybrids), belonging to the genus Saccharum within the family Poaceae, is a perennial, tall, solid-stemmed herbaceous plant extensively cultivated in tropical regions of the southern hemisphere. It serves as a primary economic crop for tropical sugar production worldwide. Owing to its substantial biomass, well-developed root system, high sugar content, and considerable economic benefits, sugarcane is an ideal source for sugar extraction. This plant has found versatile applications in various industries, including sucrose production [1], organic compound extraction [2,3,4], forage [5], environmental pollution remediation [6,7], papermaking, and even as a construction material [8].
The planting pattern of sugarcane is a pivotal factor that significantly influences its internode growth and yield. Different planting patterns exert unique effects on the crop’s development and productivity [9]. Intercropping with various species can leverage root interactions to supply essential soil nutrients to sugarcane, thereby enhancing its nutrient uptake, promoting stem elongation, and facilitating sugar storage [10]. The consequent increase in internode length may result in taller sugarcane plants, which, in turn, provide more space and light for the leaves. The expanded plant spacing also facilitates better light capture and gas exchange, which stimulates photosynthetic efficiency and supports more vigorous growth, leading to enhanced crop development. This is advantageous for sugarcane’s growth and development and contributes to higher sucrose yields. It has been demonstrated through isotopic tracing and molecular analysis that intercropping systems enable plant organisms to regulate zinc uptake effectively [11]. In contrast, sole cropping can lead to reduced, shortened, or even unprofitable internodes due to competition for light among the leaves, ultimately impacting overall output and sucrose production.
Therefore, when selecting sugarcane planting patterns, it is essential to consider local climatic conditions, water quality, soil characteristics, as well as the specific traits and growth habits of the sugarcane cultivar. Furthermore, when choosing companion crops, it is crucial to assess their root interactions and light competition dynamics to design the most appropriate planting system that maximizes profit margins. Within this context, transitioning from traditional sole cropping to intercropping with peanuts emerges as a promising strategy. This approach not only boosts sugarcane yield but also balances economic and ecological benefits. Leaves primarily engage in photosynthesis. The yield advantage in intercropping systems stems from the synergistic underground interactions between crops. Microorganisms and metabolites play pivotal roles in the sugarcane–peanut intercropping system, as root interactions facilitate nutrient uptake, utilization, and yield enhancement [12]. Resident microbial communities are silent transformers of plant health and disease [13], and in intercropping systems, root-root interactions may induce microbial community shifts that bolster plant resistance to pests, diseases, or adverse environmental stresses [14]. Consequently, microbial community studies in plants have gained attraction [15]. Studies suggest that microbial community stimulation in sugarcane–peanut intercropping promotes soil health and crop productivity, and some reports indicate that the sugarcane yield in intercropping systems can reach 120.4 t·ha−1; the yield is 10% to 30% higher than that of other intercropping treatments [16,17,18]. The stems of sugarcane, while serving as structural support, are also the primary site of storing sucrose in the plant. Intercropping practices can potentially facilitate stem internode elongation and sugar storage. Furthermore, under intercropping conditions, competition for light among sugarcane leaves is reduced, which promotes photosynthesis within the plants. This enhancement in photosynthetic activity strengthens the carbon cycle, ultimately fostering the accumulation of sugars within the plant body. However, competitive effects within intercropping systems, such as maize-soybean intercropping, while enhancing system productivity, can diminish soybean yield due to interspecific competition [19]. Thus, intercropping research is crucial for agricultural development and land use optimization. Understanding gene translation and expression patterns in intercropping systems will elucidate competition and interaction mechanisms, informing the development of novel farming methods to address global population growth and agricultural support policies. However, the scarcity of molecular and physiological studies on sugarcane intercropping systems limits yield enhancement efforts.
Recent advancements in molecular biology have facilitated the exploration of plant responses to environmental changes. RNA sequencing (RNA-seq) rapidly and comprehensively profiles gene expression in specific cells or tissues, elucidating the molecular mechanisms underlying physiological and metabolic responses in intercropping conditions [20]. RNA-seq data contribute insights into novel gene discovery, including annotated genes, differentially expressed genes (DEGs), and molecular markers [21]. Compared to traditional sequencing methods, RNA-seq offers high throughput, low cost, and high sensitivity, enabling the detection of low-abundance transcripts. This technique has been applied to various crops, such as maize (Zea mays) [22,23,24], konjac (Amorphophallus konjac) [25], and sowthistle (Sonchus asper L. Hill.) [26], to investigate their responses to intercropping systems. Concurrently, analytical chemistry methods, particularly liquid chromatography-tandem mass spectrometry (LC-MS/MS), have gained prominence in hormone analysis due to their accuracy, efficiency, and high sensitivity, catering to the demands of rapid and precise detection in complex samples [27,28,29,30,31].
In response to the scarcity of transcriptome and metabolite profile information in current studies on sugarcane intercropping systems, this study employed Illumina high-throughput sequencing to identify intercropping-responsive genes in sugarcane roots, stems, and leaves. DEGs were analyzed using integrated bioinformatics approaches encompassing functional annotation, metabolic pathway enrichment, and transcription factor prediction to clarify tissue-specific molecular responses to intercropping. As few intercropping-related genes have been reported in Saccharum species, these findings enhance the mechanistic understanding of sugarcane intercropping systems and provide a theoretical basis for improving crop yield and production efficiency. The study also contributes a transcriptomic database for future genetic studies in graminaceous crops.
Complementary physiological data were obtained through inductively coupled plasma mass spectrometry (NexION®1000 ICP-MS, PerkinElmer, Shelton, CT, USA) for heavy metal quantification and high-performance liquid chromatography–tandem mass spectrometry (HPLC-MS/MS, Agilent Technologies, Santa Clara, CA, USA) for measuring metabolites and eight endogenous hormones, offering further insight into physiological adaptations under intercropping.

2. Materials and Methods

2.1. Experimental Materials

The experiments were conducted at Fujian Agriculture and Forestry University in 2021, using the sugarcane variety “FN 41”. The peanut variety was “Minhua 6” sourced from the research group led by Professor Zhuang Weijian at Fujian Agriculture and Forestry University.
The experiment was designed with two treatments based on different planting patterns of sugarcane: monoculture and intercropping. Specifically, six experimental configurations were established: roots, stems, and leaves of sugarcane intercropped with peanuts (isR, isS, isL) (Figure S1A), and roots, stems, and leaves of sugarcane under monoculture (msR, msS, msL) (Figure S1B). The intercropped sugarcane was planted with a row spacing of 2.4 m, while the monoculture treatment employed a row spacing of 1.2 m. Before sowing, basal fertilizers were applied, including 10 kg of calcium magnesium phosphate fertilizer and 20 kg of compound fertilizer (15-15-15). During the later stage of sugarcane growth, Durui™ (0.05 L·ha−1) was mixed with fertilizer for soil preparation. Durui™ is a commercial name for a pesticide containing chlorantraniliprole and thiamethoxam. Specifically, it is a 30% suspension concentrate formulation with 10% chlorantraniliprole and 20% thiamethoxam as active ingredients. It is a novel, highly effective, and low-toxicity insecticide developed by Syngenta. For peanuts, 40 kg·ha−1 of calcium magnesium phosphate fertilizer was used as basal fertilizer, with a row spacing greater than 50 cm from the sugarcane rows. The intra-row spacing for peanuts was 30–40 cm, and single-seed precision planting was performed at a plant-to-plant distance of 13.5 cm, accompanied by 30 kg·ha−1 of compound fertilizer. After peanut harvest and yield measurement, unilateral soil preparation was conducted for sugarcane, followed by the application of 50 kg·ha−1 of compound fertilizer (20-10-15) slow-release controlled-release fertilizer during the sugarcane elongation stage. Except for the differences in sugarcane varieties and planting row spacing, all other field management practices were kept consistent across treatments. Four independent biological replicates were collected for determination of heavy metal content, RNA-Seq analysis and metabolite determination. Immediately after collection, tissues were immersed in liquid nitrogen for fixation and stored at −80 °C until extraction and measurement.

2.2. Determination of Heavy Metal Content in the Roots, Stems, and Leaves of Sugarcane

We determined the concentrations of 12 metals in the roots, stems, and leaves. The samples were digested using an HF-HNO3-H2O2 mixture to eliminate silicon interference with the elements being measured. The concentrations were then analyzed using an inductively coupled plasma mass spectrometer (NexION® 1000 ICP-MS). The results were calculated using Equation (1):
E l e m e n t a l c o n t e n t mg / kg = c × V m × D
c—Concentration of the element in the solution (mg/L); V—Extraction volume (mL); D—Dilution factor; m—Sample mass (g).

2.3. Determination of Metabolites and Endogenous Hormones Concentrations in the Roots, Stems, and Leaves of Sugarcane

LC-MS/MS analysis was performed using a UHPLC system (1290, Agilent Technologies, Santa Clara, CA, USA) coupled with a UPLC BEH Amide column (1.7 μm, 2.1 × 100 mm, Waters) and a TripleTOF 5600 (Q-TOF, AB Sciex) mass spectrometer. The TripleTOF mass spectrometer was chosen due to its capability to acquire MS/MS spectra based on information-dependent acquisition (IDA) during the LC/MS experiment. In this mode, the acquisition software (Analyst TF 1.7, AB Sciex) continuously evaluates the full-scan MS data against pre-selected criteria when collecting and triggering MS/MS spectra.
Methanol was used for extraction, followed by the addition of internal standards. The samples were then subjected to ultrasonication on ice for 10 min and incubated at −20 °C for 1 h to precipitate proteins. Subsequently, the samples were centrifuged at 28,300× g for 15 min at 4 °C. The supernatants were transferred to 2 mL LC/MS glass vials and used as QC samples for endogenous hormone determination. Meanwhile, an equal volume of supernatant was taken for metabolite analysis using UHPLC-QTOF-MS.
The raw MS data (.d) files were converted to mzXML format using ProteoWizard and processed using the R package XCMS (version 3.2). The preprocessing resulted in a data matrix consisting of retention time (RT), mass-to-charge ratio (m/z) values, and peak intensities. Following XCMS data processing, peak annotation was performed using the R package CAMERA. An in-house MS2 database was used for metabolite identification. The significance analysis of the differences in the relevant data was conducted using SPSS 20.0. Differential Metabolites were used for KEGG functional annotation and enrichment analysis.

2.4. Total RNA Extraction, Transcriptome Library Construction, Sequencing and Functional Annotation

High-quality total RNA was extracted from the roots, stems and leaves of sugarcane using the TRIzol (Invitrogen, USA) RNA extraction kit. Total RNA extracted was commissioned for detection, library construction and sequencing by BestMS Technologies Co., LTD (Qingdao, China) (http://www.bestms.cn/). Library construction was performed on qualified RNA samples, and the fragment size was selected using AMPure XP beads (Beckman Coulter, Pasadena, CA, USA). Finally, PCR enrichment was performed to obtain the cDNA library, and sequencing was carried out using the PE150 mode on the Illumina NovaSeq6000 platform.
The original sequencing data (original read) obtained from the preprocessing undergoes a strict cleaning process, and finally high-quality clean data is obtained. Subsequently, calculate the GC content, Q20, Q30 and sequence repetition level of the clean data. The HISAT2 (v2.2.1) [32] software was used to perform alignment of clean reads with the reference genome. Subsequently, StringTie [33] utilized the reference Annotation-based Transcription (RABT) assembly method to identify and assemble known reads from the alignment results of HISAT2. The reference genome version used for the comparison of sugarcane transcriptome data is Saccharum_officinarum.Customer_v20191009.genome.fa.
For functional annotation of the newly identified genes [34,35,36,37,38,39], the predicted amino acid sequences were analyzed using InterProScan [40] to obtain Gene Ontology (GO) terms [41], combined with HMMER [42] for alignment against Pfam database [43], and finally the annotation information of the new genes was obtained.

2.5. Gene Expression Quantification and Differential Expression Analysis

Gene expression quantification was performed using StringTie, which employs a maximum flow algorithm and normalizes the number of mapped reads and transcript lengths through the use of FPKM (Fragments Per Kilobase of transcript per Million Fragments mapped) as a standardization method [44]. This allowed for the calculation of FPKM values for each transcript.
In the differential expression, for groups with biological replicates, DESeq [45] software was utilized. For groups without biological replicates, edgeR [46] software was employed for the same purpose. A fold change threshold of ≥2 and FDR (False Discovery Rate) as the significance criterion were adopted. The p-values for differential significance were adjusted to obtain FDR, enabling the identification of DEGs. For ease of comparison, fold changes were represented as |log2(FoldChange)|, and a p-value threshold of <0.05 was employed.

2.6. GO Functional and KEGG Pathway Enrichment Analysis

To investigate the biological significance of DEGs, GO enrichment analysis was conducted at the second-level classification of the GO database based on the gene annotation results. This analysis leveraged the GO database to identify enriched GO terms among the DEGs. Furthermore, the KEGG database was employed to analyze the various metabolic pathways associated with the DEGs, providing insights into their functional roles in biological processes.

2.7. Weighted Gene Co-Expression Network Analysis (WGCNA)

The Weighted Gene Co-expression Network Analysis (WGCNA) approach was employed to investigate the relationships between genes and physiological traits, as well as the interactions among genes. Genes with FPKM (Fragments Per Kilobase Million) values less than 1 were filtered out, and the remaining genes were input into the construction of the WGCNA network using the WGCNA v1.72.5 package in R. The gene correlations and soft-thresholding power were calculated using the Pearson correlation matrix and network topology analysis, respectively. Subsequently, the adjacency matrix was transformed into a topological overlap matrix (TOM). In standard WGCNA networks, the parameters of power, minModuleSize, and mergeCutHeight were set to 6, 180, and 0.3, respectively.

2.8. Verification of Zinc Pathways

To validate the regulatory functions of zinc and IAA across root, stem, and leaf tissues in sugarcane under this framework, a replicated field trial was conducted comparing monoculture cultivation systems. Metabolomic and KEGG pathway analyses also suggested that IAA is likely a major hormone regulated under intercropping. To verify the roles of zinc and IAA in sugarcane roots, stems, and leaves under this system, a pot experiment was carried out using soil from an earlier monoculture field trial. Two treatments were set up according to planting method: an untreated control (CK) and a zinc sulfate treatment (Z). Both groups received the same fertilizer used previously, but the Z group was also supplied with 50 kg/ha−1 of zinc sulfate [47]. After six months, agronomic traits were measured. The plants were then sampled to analyze endogenous hormone levels in roots, stems, and leaves. The results were compared to assess the predicted changes in IAA and to examine zinc-related signal transduction mechanisms.

2.9. Measurement of Sugarcane Agronomic Traits in Roots, Stems, and Leaves

The results and analysis obtained through the previous experiments, we repeated the trial and added the determination items of key agronomic traits and endogenous hormones to verify the prediction of related signal transduction in the transcriptome. The agronomic trait data, including plant height, stem diameter, sugar content, and single cane weight, were collected for sugarcane grown under Z and CK. Additionally, sugar yield and economic benefits were calculated. For root phenotypic data, we measured the total root length, total projected area, and total surface area of the sugarcane root system.

3. Results

3.1. Accumulation of Metals Across Sugarcane Tissues Under Varied Cultivation Conditions

Twelve common metals were detected in the roots, stems, and leaves. The distribution characteristics of metals in different detected parts were significantly different (Figure 1).
The accumulation of Fe (Iron) and Al (Aluminum) in the roots was higher than that in the above-ground parts. For example, the Fe content in the msS group was only 118–144 mg/kg, while the P (Phosphorus) contents (1.89~3.39 mg/kg) were significantly higher in the above-ground parts than in the roots (0.74~1.35 mg/kg). In the msR, intercropped sugarcane showed significantly reduced contents of Al and Cd (Cadmium), while the contents of Fe, Mg (Magnesium), and Zn (Zinc) were significantly increased. In the stems, there was no significant difference in Fe content under intercropping conditions, but it was significantly lower than that in the roots. The contents of Zn, P, and other elements were significantly higher than those in monoculture, and the S (Sulfur) content showed no significant change but was higher than that in the roots. In the leaves, the contents of Zn and P were significantly higher than those in msL, following the same trend as observed in the roots and stems.

3.2. Analysis of Endogenous Metabolites in the Root, Stem, and Leaf of Sugarcane

We hypothesize that different planting patterns, such as intercropping sugarcane with peanuts, alter the crop’s utilization of light and soil resources. This, in turn, affects the transport of photoassimilates from source to sink tissues within the sugarcane plant. Furthermore, the presence of peanut roots may alter the composition of endogenous metabolites in the sugarcane’s roots, stems, and leaves.
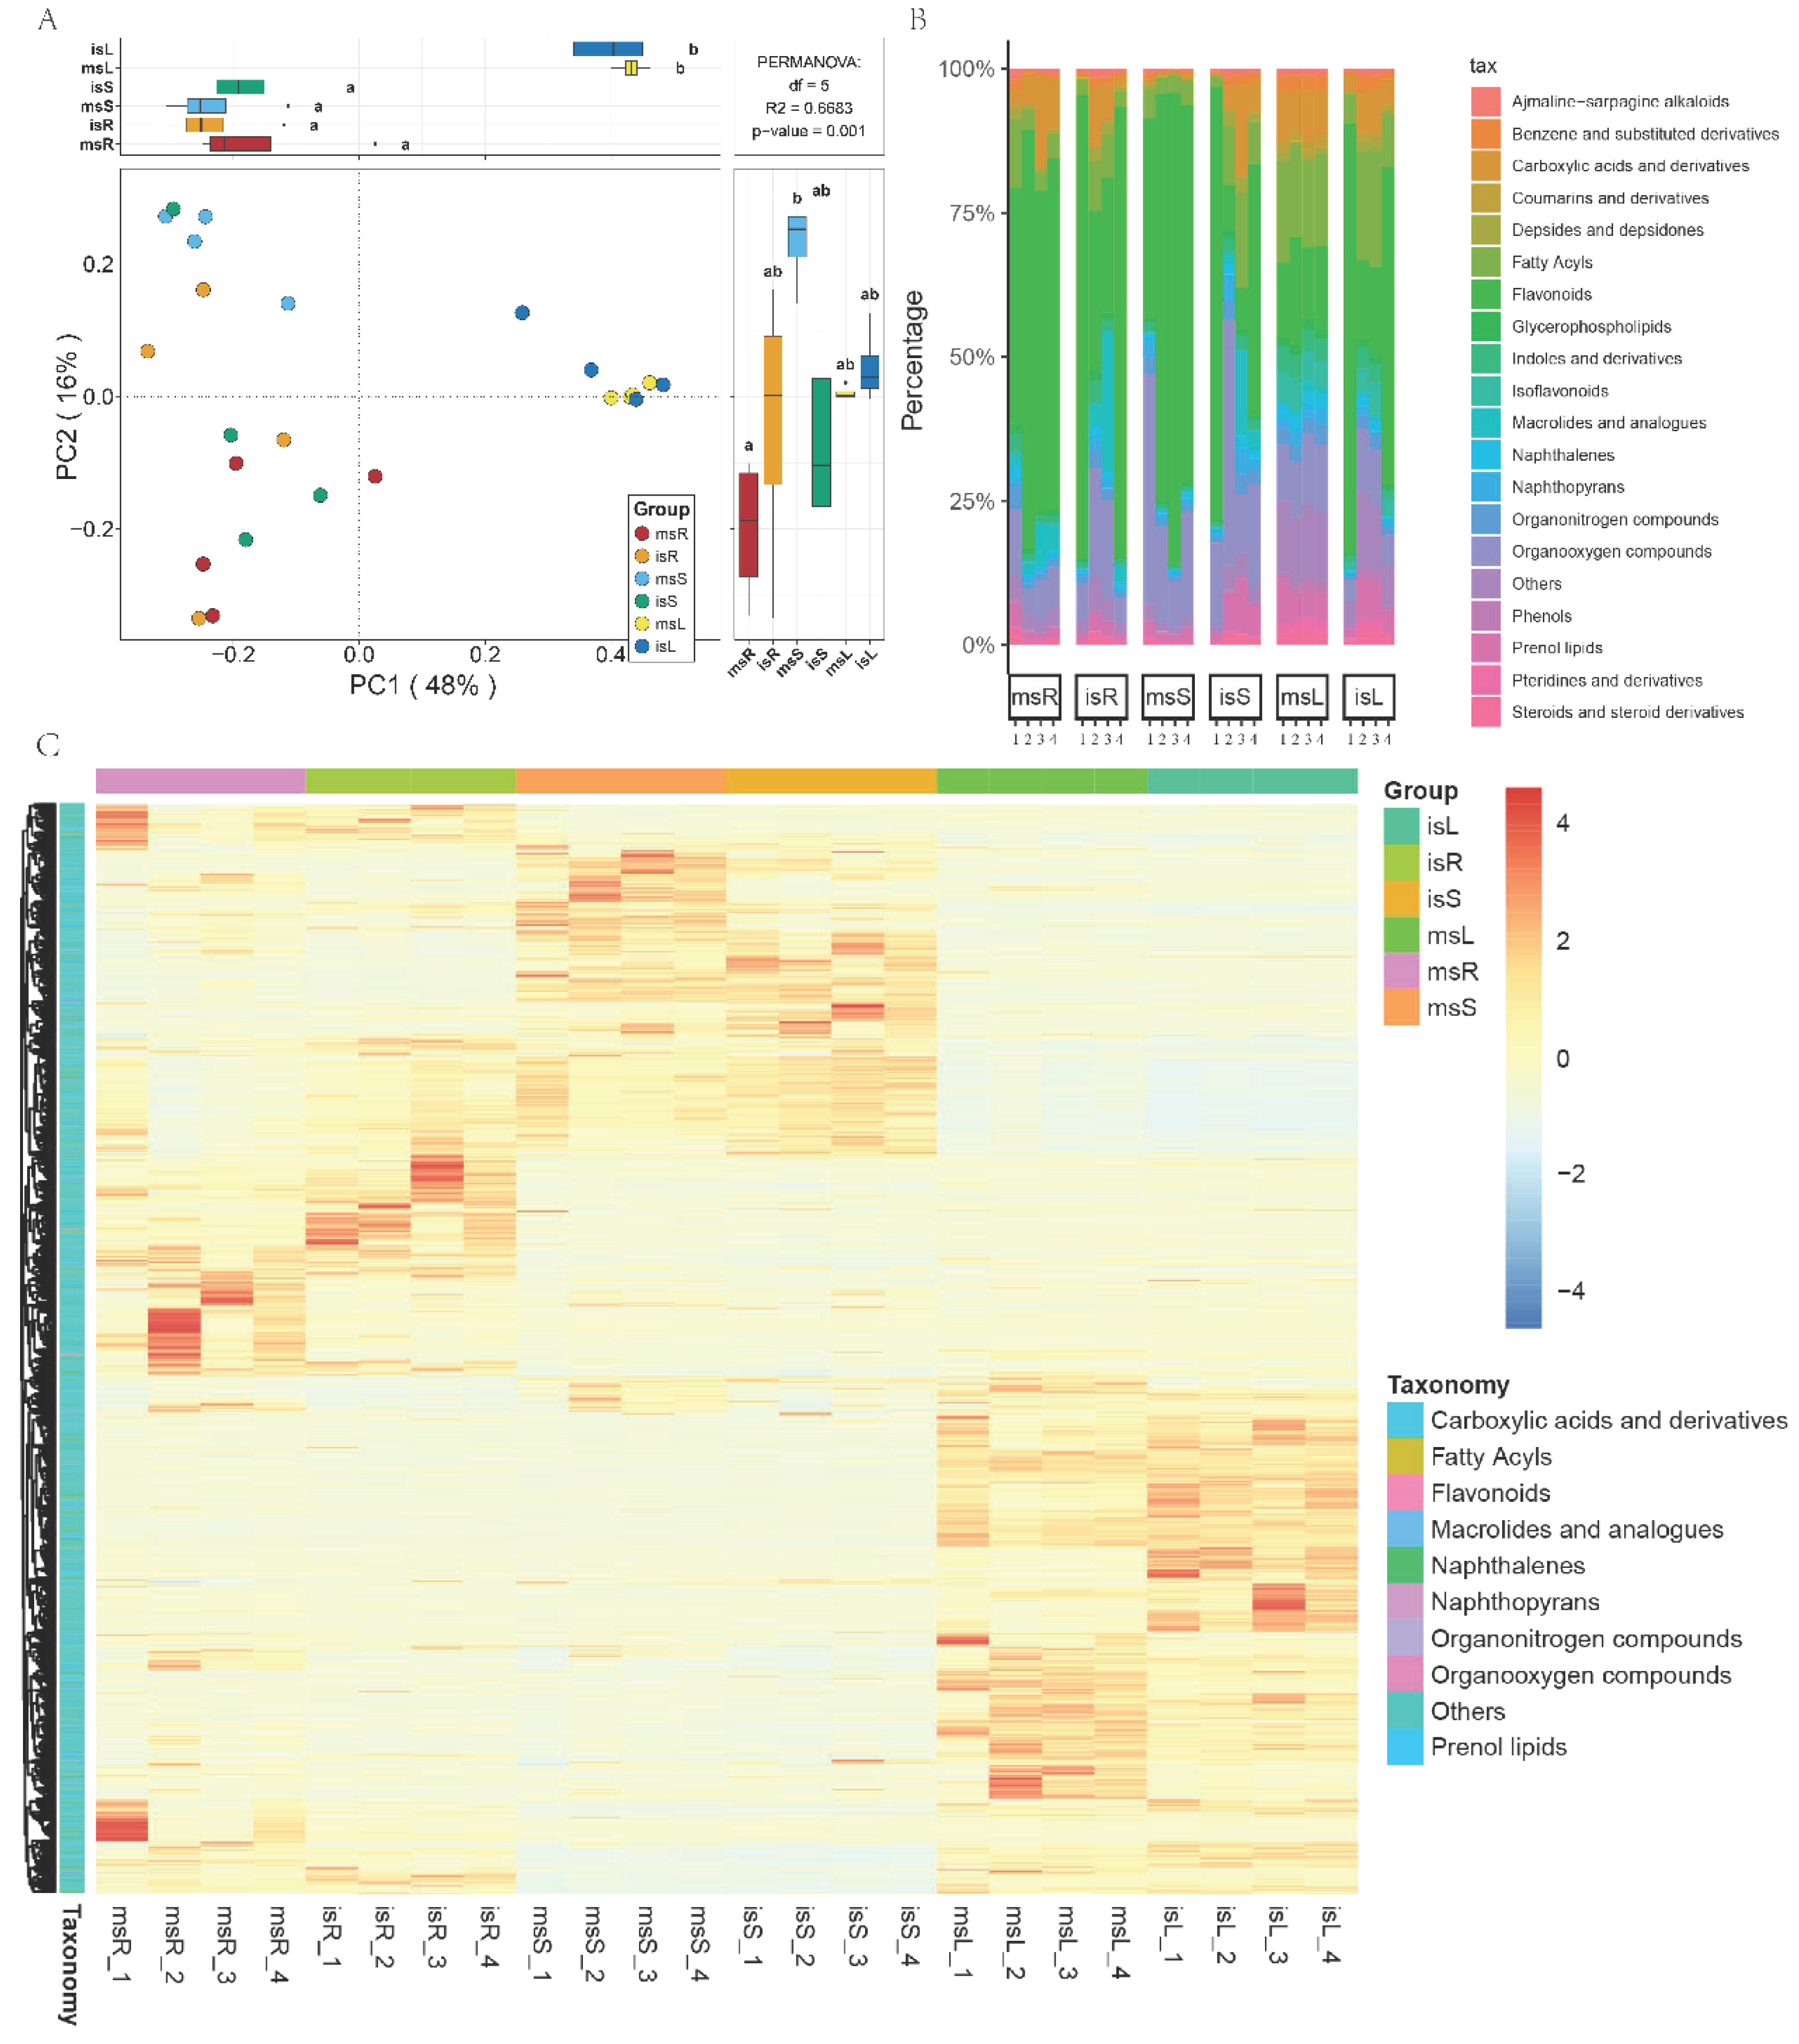
Among the 24 samples from the intercropping experiment, a total of 3705 metabolites were detected. Among these, 2420 metabolites remained unclassified, while 1285 were successfully classified and annotated (Figure 2C and Table S1A). Within the annotated metabolites, organic oxides, fatty acyls, carboxylic acids and derivatives constituted the three most abundant groups, accounting for 11.83%, 11.36%, and 10.66% of the total metabolite count, respectively. In terms of relative abundance, flavonoids, organic oxides, and carboxylic acids and derivatives were the three most abundant classes, representing 43.57%, 13.37%, and 5.58% of the total metabolite abundance, respectively. Additionally, other significant classes of substances were also identified, including phenols, propenol esters, benzenes and derivatives, among others.
Through Principal Coordinate Analysis (PCoA) of the endogenous metabolic compositions in the roots, stems, and leaves of sugarcane under monoculture and intercropping conditions, significant differences in metabolic compositions were observed among all sample groups according to Permanova analysis (Permanova, p < 0.001). PC1 and PC2 explained 48% and 16% of the variance in metabolic compositions, respectively. Samples from sugarcane roots and stems were predominantly distributed on the left side of PC1, whereas samples from sugarcane leaves were distributed on the right side of PC1. This result indicates that the tissue origin of the samples is the primary factor contributing to the differences in metabolic substances, far outweighing the cultivation method of monoculture or intercropping. Furthermore, the metabolic compositions of sugarcane roots and stems showed separation along the PC2 axis due to the influence of monoculture and intercropping. This suggests that monoculture and intercropping do have an impact on the endogenous metabolic composition of sugarcane roots and stems (Figure 2A).
The metabolic compound classification stacked plot illustrates the relative abundance of the top 15 primary classifications of metabolites across all groups. As shown in Figure 2B and Table S2B, under different planting conditions, the distribution ranges of Organooxygen compounds in sugarcane roots vary between 7.62% and 11.84%; Flavonoids range from 52.43% to 57.63%; Carboxylic acids and derivatives range from 4.83% to 8.05%; and Fatty Acyls range from 5.42% to 5.67%. In sugarcane stem samples, the distribution of Flavonoids ranges from 33.59% to 63.26%; Organooxygen compounds range from 20.85% to 21.44%; and Fatty Acyls range from 3.77% to 8.92%. For sugarcane leaves, Flavonoids range from 14.73% to 39.80%; Fatty Acyls range from 13.31% to 16.13%; Organooxygen compounds range from 7.50% to 10.99%; Carboxylic acids and derivatives range from 5.39% to 8.26%; Prenol lipids range from 4.91% to 5.75%; and Isoflavonoids range from 3.54% to 5.25%.
Through the analysis of intergroup differences presented in Table S1B, we summarized the metabolic classifications where the number or the relative abundance exceeds 1% of the known classifications. The results indicate that there are pronounced differences in the relative abundance of metabolic classifications in the roots, stems, and leaves of sugarcane. Additionally, intercropping with peanuts has an impact on the composition of endogenous metabolic substances in the roots, stems, and leaves of sugarcane. Compared to monoculture, intercropping significantly (p < 0.05) increased the endogenous content of Naphthalenes, Keto acids and derivatives, Benzimidazole ribonucleosides and ribonucleotides, and Naphthopyrans in sugarcane roots, while significantly (p < 0.05) decreasing the content of Prenol lipids. No significant changes were observed in sugarcane stem samples, whereas in leaves, the endogenous content of Naphthalenes, Coumarins and derivatives, Benzimidazole ribonucleosides and ribonucleotides, and Naphthopyrans all significantly (p < 0.05) decreased.
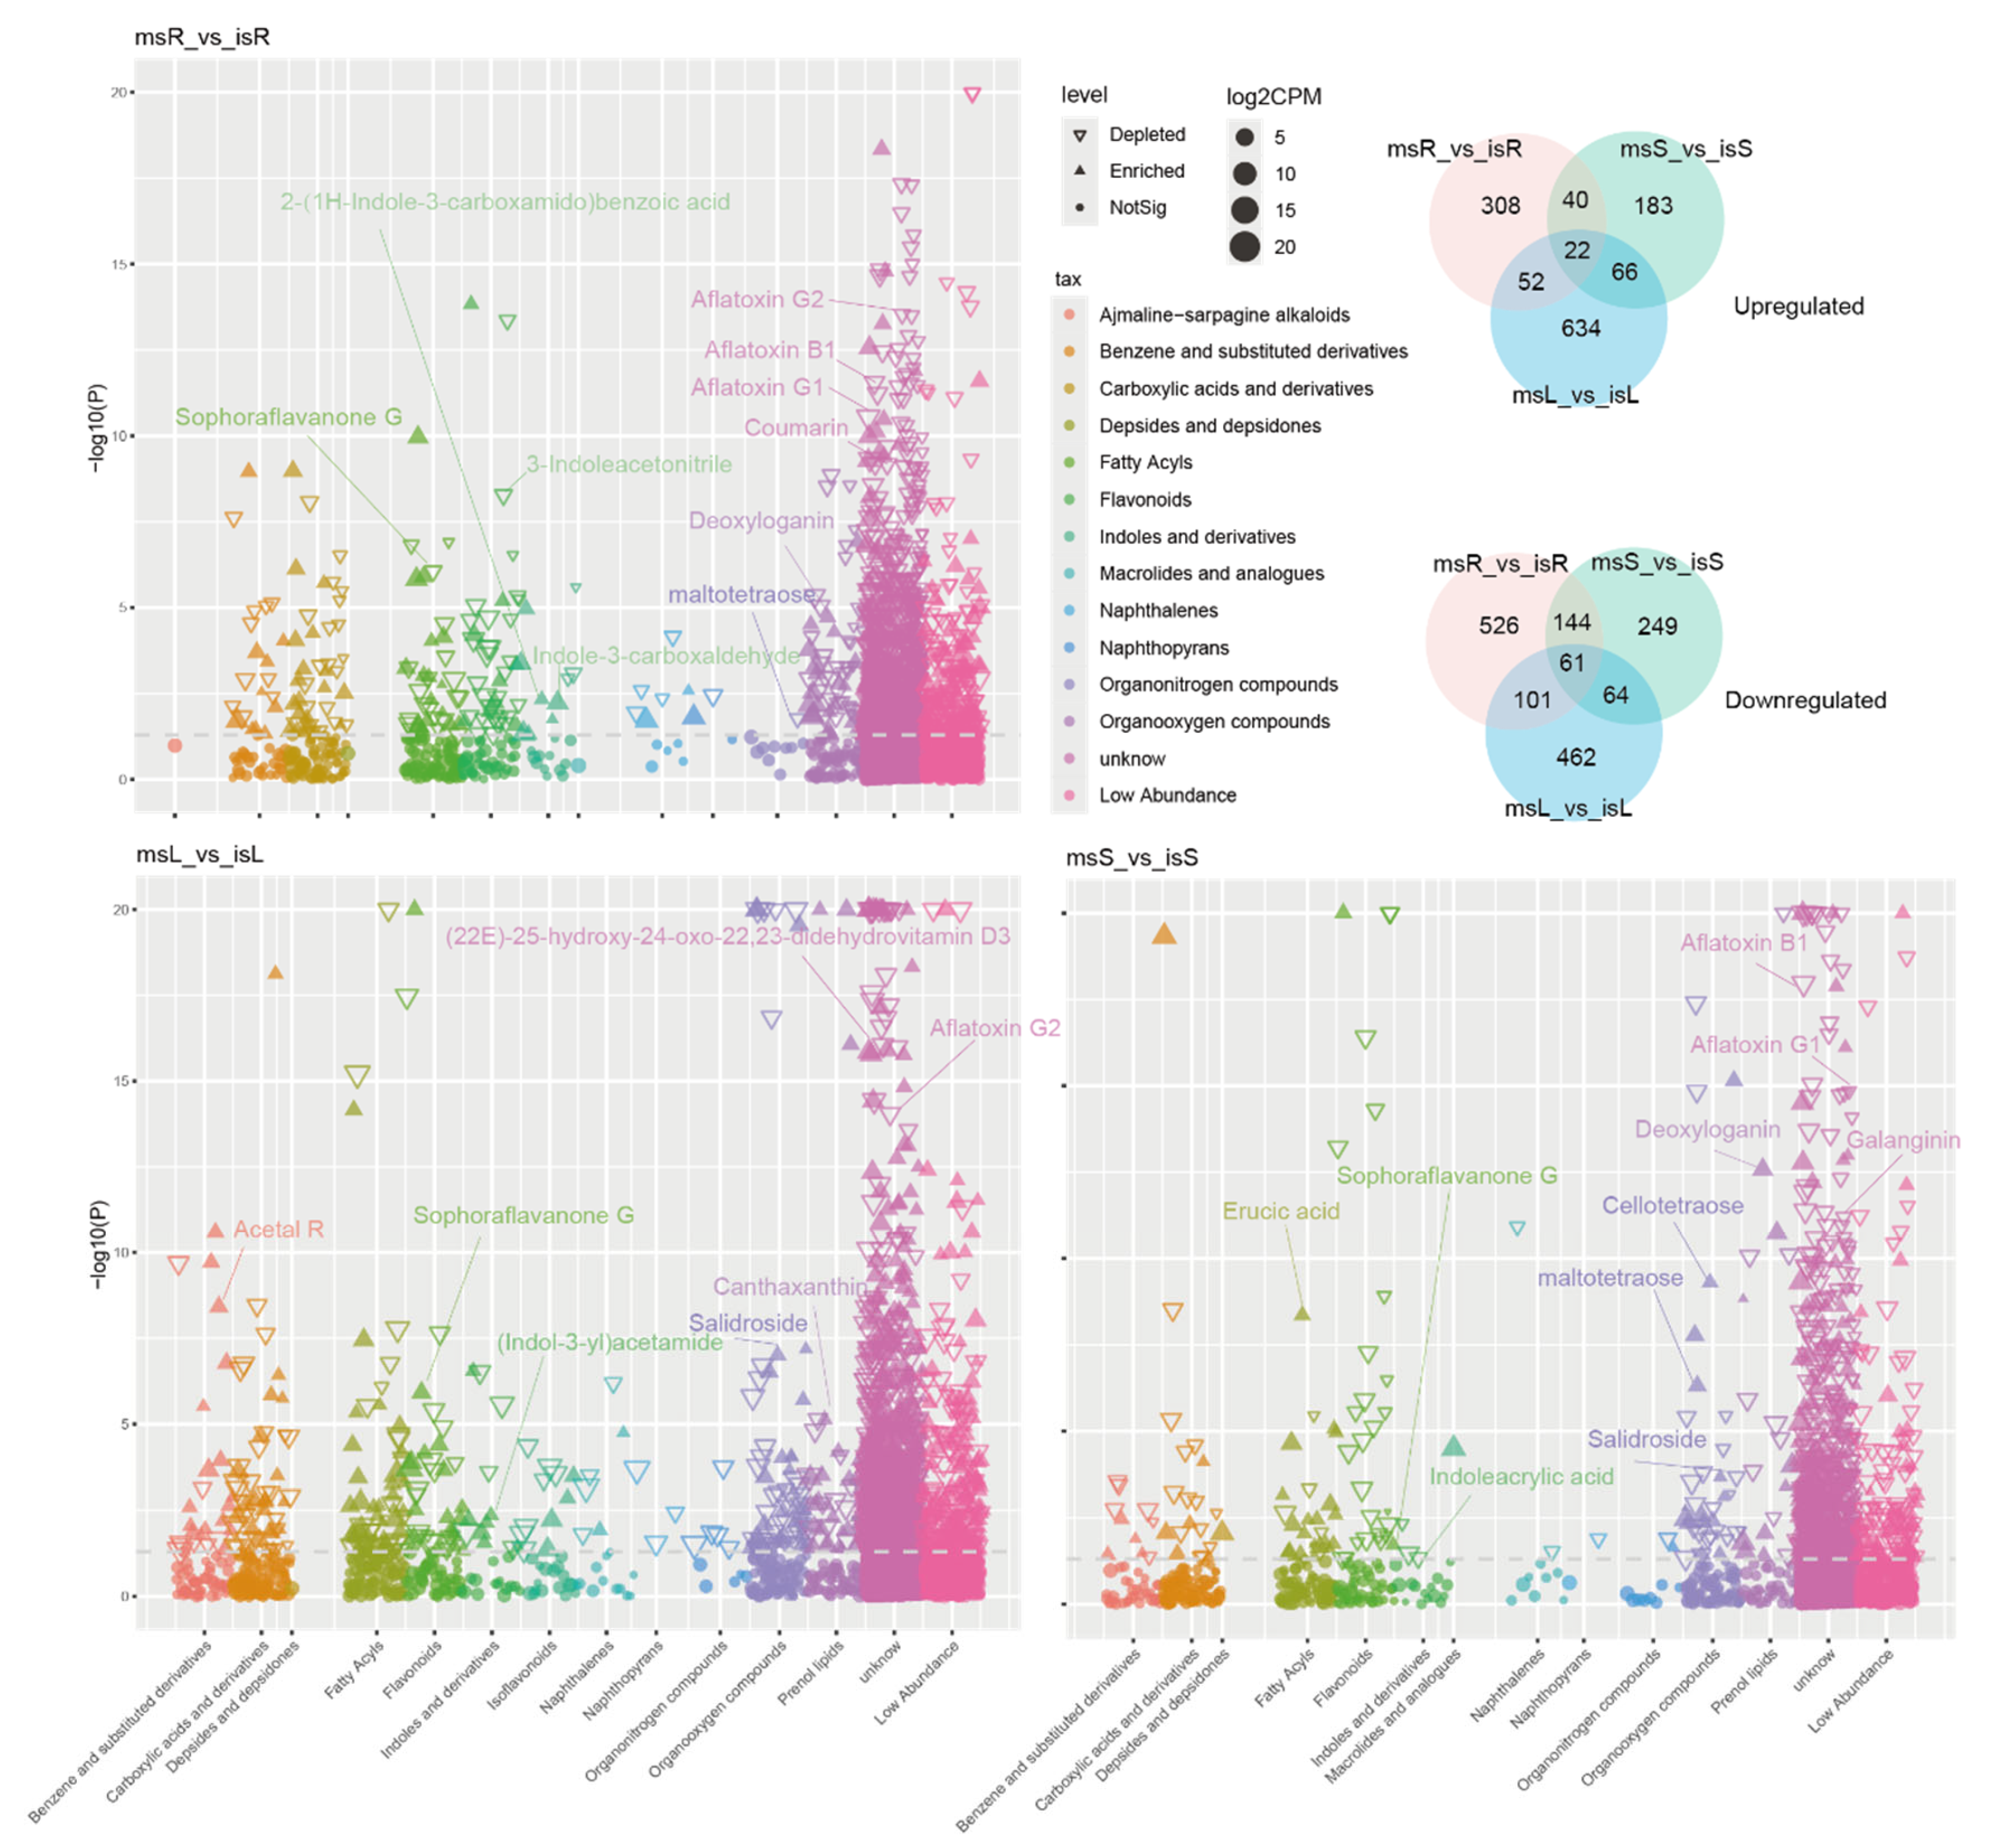
Utilizing DeSeq2 differential analysis simultaneously on monoculture and intercropping conditions in the roots, stems, and leaves of sugarcane, it was found that compared to monoculture, 422, 311, and 774 compounds, respectively, significantly (p < 0.05) increased in abundance in the three different parts. Notably, 22 compounds consistently increased significantly (p < 0.05) across all three parts, including Flavonoids such as Sophoraflavanone G (Figure 3, Venn diagram). Additionally, 66 compounds significantly (p < 0.05) increased in both stems and leaves, encompassing Organooxygen compounds like Salidroside. There were 52 compounds that significantly (p < 0.05) increased in both leaves and roots, and 40 compounds in both roots and stems, including Prenol lipids such as Deoxyloganin. Specifically, 308 compounds uniquely increased significantly (p < 0.05) in roots, including Carboxylic acids and derivatives like Glycyl-Tyrosine, Trp-Tyr, 2-(1H-Indole-3-carboxamido)benzoic acid and Benzene and substituted derivatives like Propyl gallate. In stems, 183 compounds specifically increased significantly (p < 0.05), including Carboxylic acids and derivatives like Oxytocin, Macrolides and analogues like Avermectin A1a, Indoles and derivatives such as Indole-3-carboxaldehyde, Benzene and substituted derivatives like Gallic acid and Isoflavonoids like Coumestrol. Lastly, 634 compounds uniquely increased significantly (p < 0.05) in leaves, including Indoles and derivatives like (Indol-3-yl) acetamide (Figure 3).
Furthermore, the opposite trend was also observed, with 832, 518, and 688 compounds, respectively, significantly (p < 0.05) decreasing in abundance in the roots, stems, and leaves of sugarcane under intercropping conditions (Figure 3 Venn diagram). Among these, 144 compounds significantly (p < 0.05) decreased in both roots and stems under intercropping, including Methyl dioxindole-3-acetate, Aflatoxin B1 and Aflatoxin G1. Additionally, 61 compounds consistently decreased significantly (p < 0.05) in all three parts, including gamma-Linolenoyl-CoA. There were 101 compounds that significantly (p < 0.05) decreased in both roots and leaves under intercropping, such as Aflatoxin G2 and substituted derivatives like Gallic acid (Figure 3). A key finding was the significant reduction in the root concentration of 3-Indoleacetonitrile, a metabolic precursor to IAA (p < 0.05). Up- and down-regulated metabolites identified across various tissues included IAA precursors and derivatives, suggesting a correlation between sugarcane mono- and inter-cropping practices and alterations in auxin (IAA) levels.
These findings suggest that intercropping with peanuts significantly affects the endogenous metabolic substances in the roots, stems, and leaves of sugarcane, and that the composition of endogenous compounds differs in response among different plant parts.

3.3. Transcriptome Sequencing and Assembly Analysis

In this study, a total of 24 cDNA libraries were constructed for monoculture (sugarcane and peanut), intercropping (sugarcane and peanut), and partitioned intercropping (sugarcane and peanut), with msR, msS, msL, isR, isS, and isL designated for each condition. Four biological replicates were included for each scenario. The sequencing overview is presented in Table S2A, where over 97.61% of the bases had a Q-value ≥ 20, and approximately 93.49% of the bases had a Q-value ≥ 30 among the raw reads. The GC content ranged from 53.59 to 56.40 (Table S2A). All raw FASTQ data files were submitted to the NCBI Sequence Read Archive (SRA) under accession number PRJNA974890. After filtering out low-quality reads, a total of 688 million clean reads were generated from the six samples (Table S2A). HISAT2 was employed for rapid and accurate alignment of clean reads to the reference genome, followed by assembly of aligned reads using StringTie. A total of 210,189 novel genes were discovered.

3.4. Functional and Pathway Annotation of Genes

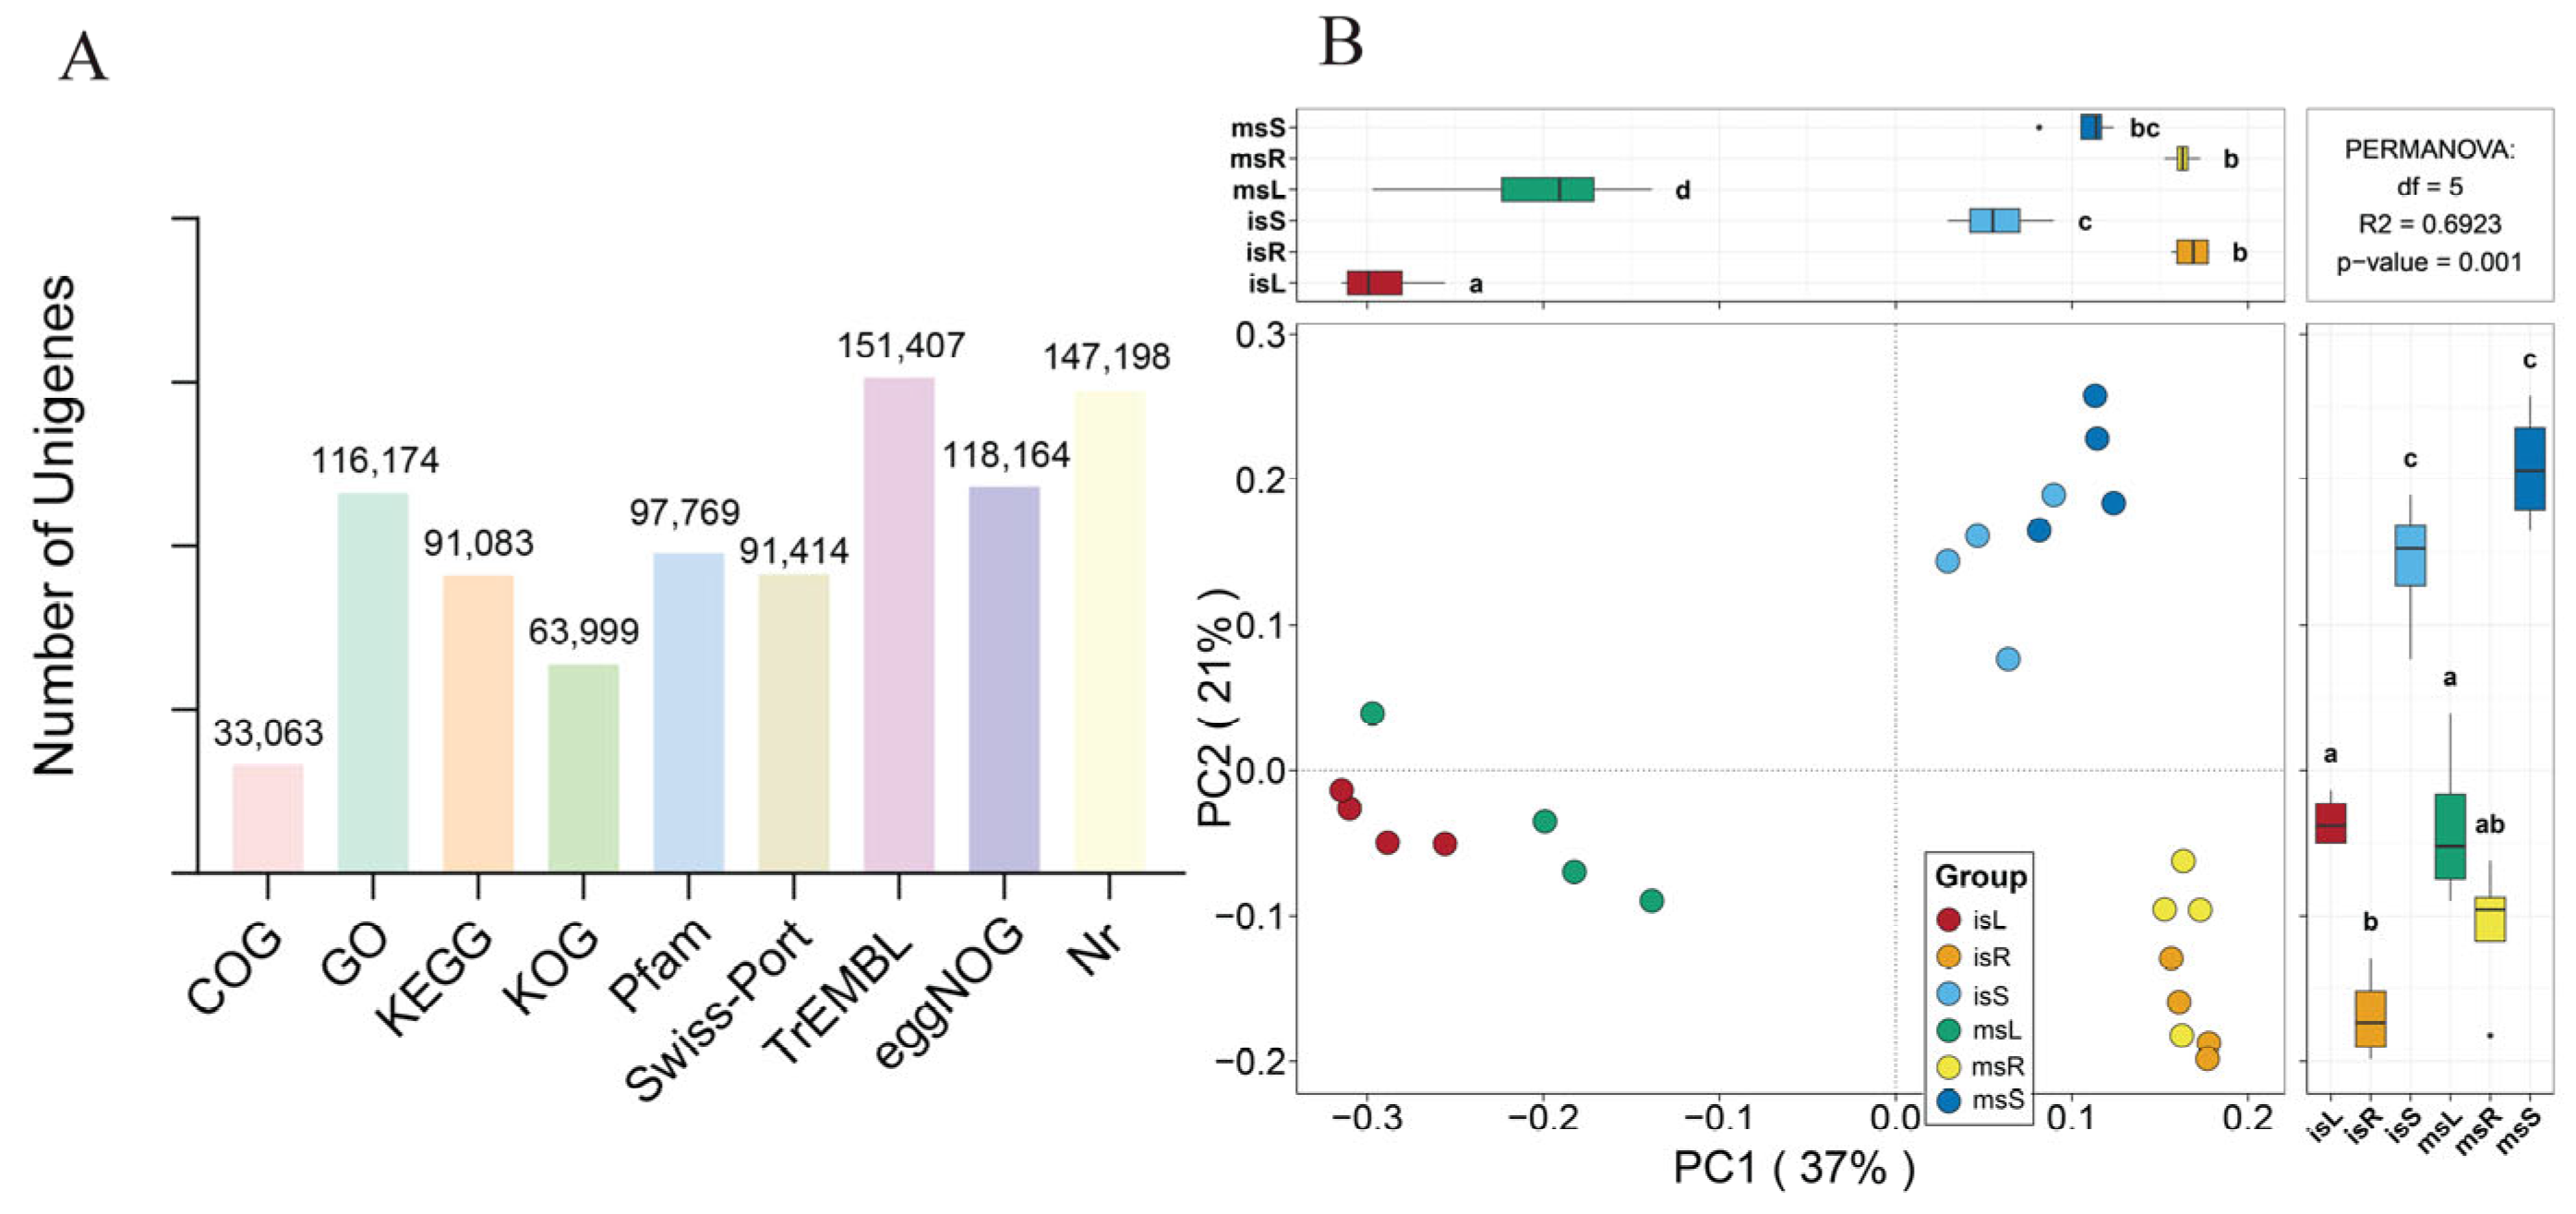
To investigate gene functions, all assembled novel genes were annotated against the COG, GO, KEGG, KOG, Pfam, Swiss-Prot, TrEMBL, eggNOG, and Nr databases (see Materials and Methods). A total of 152,621 novel genes, accounting for 72.61% of all novel genes, were annotated in at least one database. Specifically, 19,392 novel genes (9.23%) were annotated in all major databases. The numbers of novel genes annotated in COG, GO, KEGG, KOG, Pfam, Swiss-Prot, TrEMBL, eggNOG, and Nr databases were 33,063 (15.73%), 116,174 (55.27%), 91,083 (43.33%), 63,999 (30.45%), 97,769 (46.51%), 91,414 (43.49%), 154,107 (72.03%), 118,164 (56.22%), and 147,198 (70.03%), respectively (Figure 4A, Table S2B).

3.5. DEGs in Sugarcane Samples Under Different Cultivation Conditions

StringTie was used to calculate and normalize the gene expression levels of DEGs in sugarcane and peanut under different cultivation conditions, employing the maximum flow algorithm. A threshold of |log2(FoldChange)| > 1 and an adjusted p-value < 0.05 was set to identify significantly DEGs. Principal Coordinate Analysis (PCoA) was performed on DEGs from sugarcane and peanut roots under different cultivation conditions. PC1 and PC2 explained 37% and 21% of the variance in DEG composition, respectively. Samples from sugarcane roots and stems were distributed on the right side of PC1 and separated vertically along PC2, while leaf samples were located on the left side of PC1. This result indicates that the tissue origin is the primary contributor to the differences in DEGs, outweighing the effects of various cultivation methods. Additionally, the segregation of sugarcane DEGs under different cultivation systems suggests that these systems have a certain impact on the DEGs in sugarcane roots (Figure 4B).
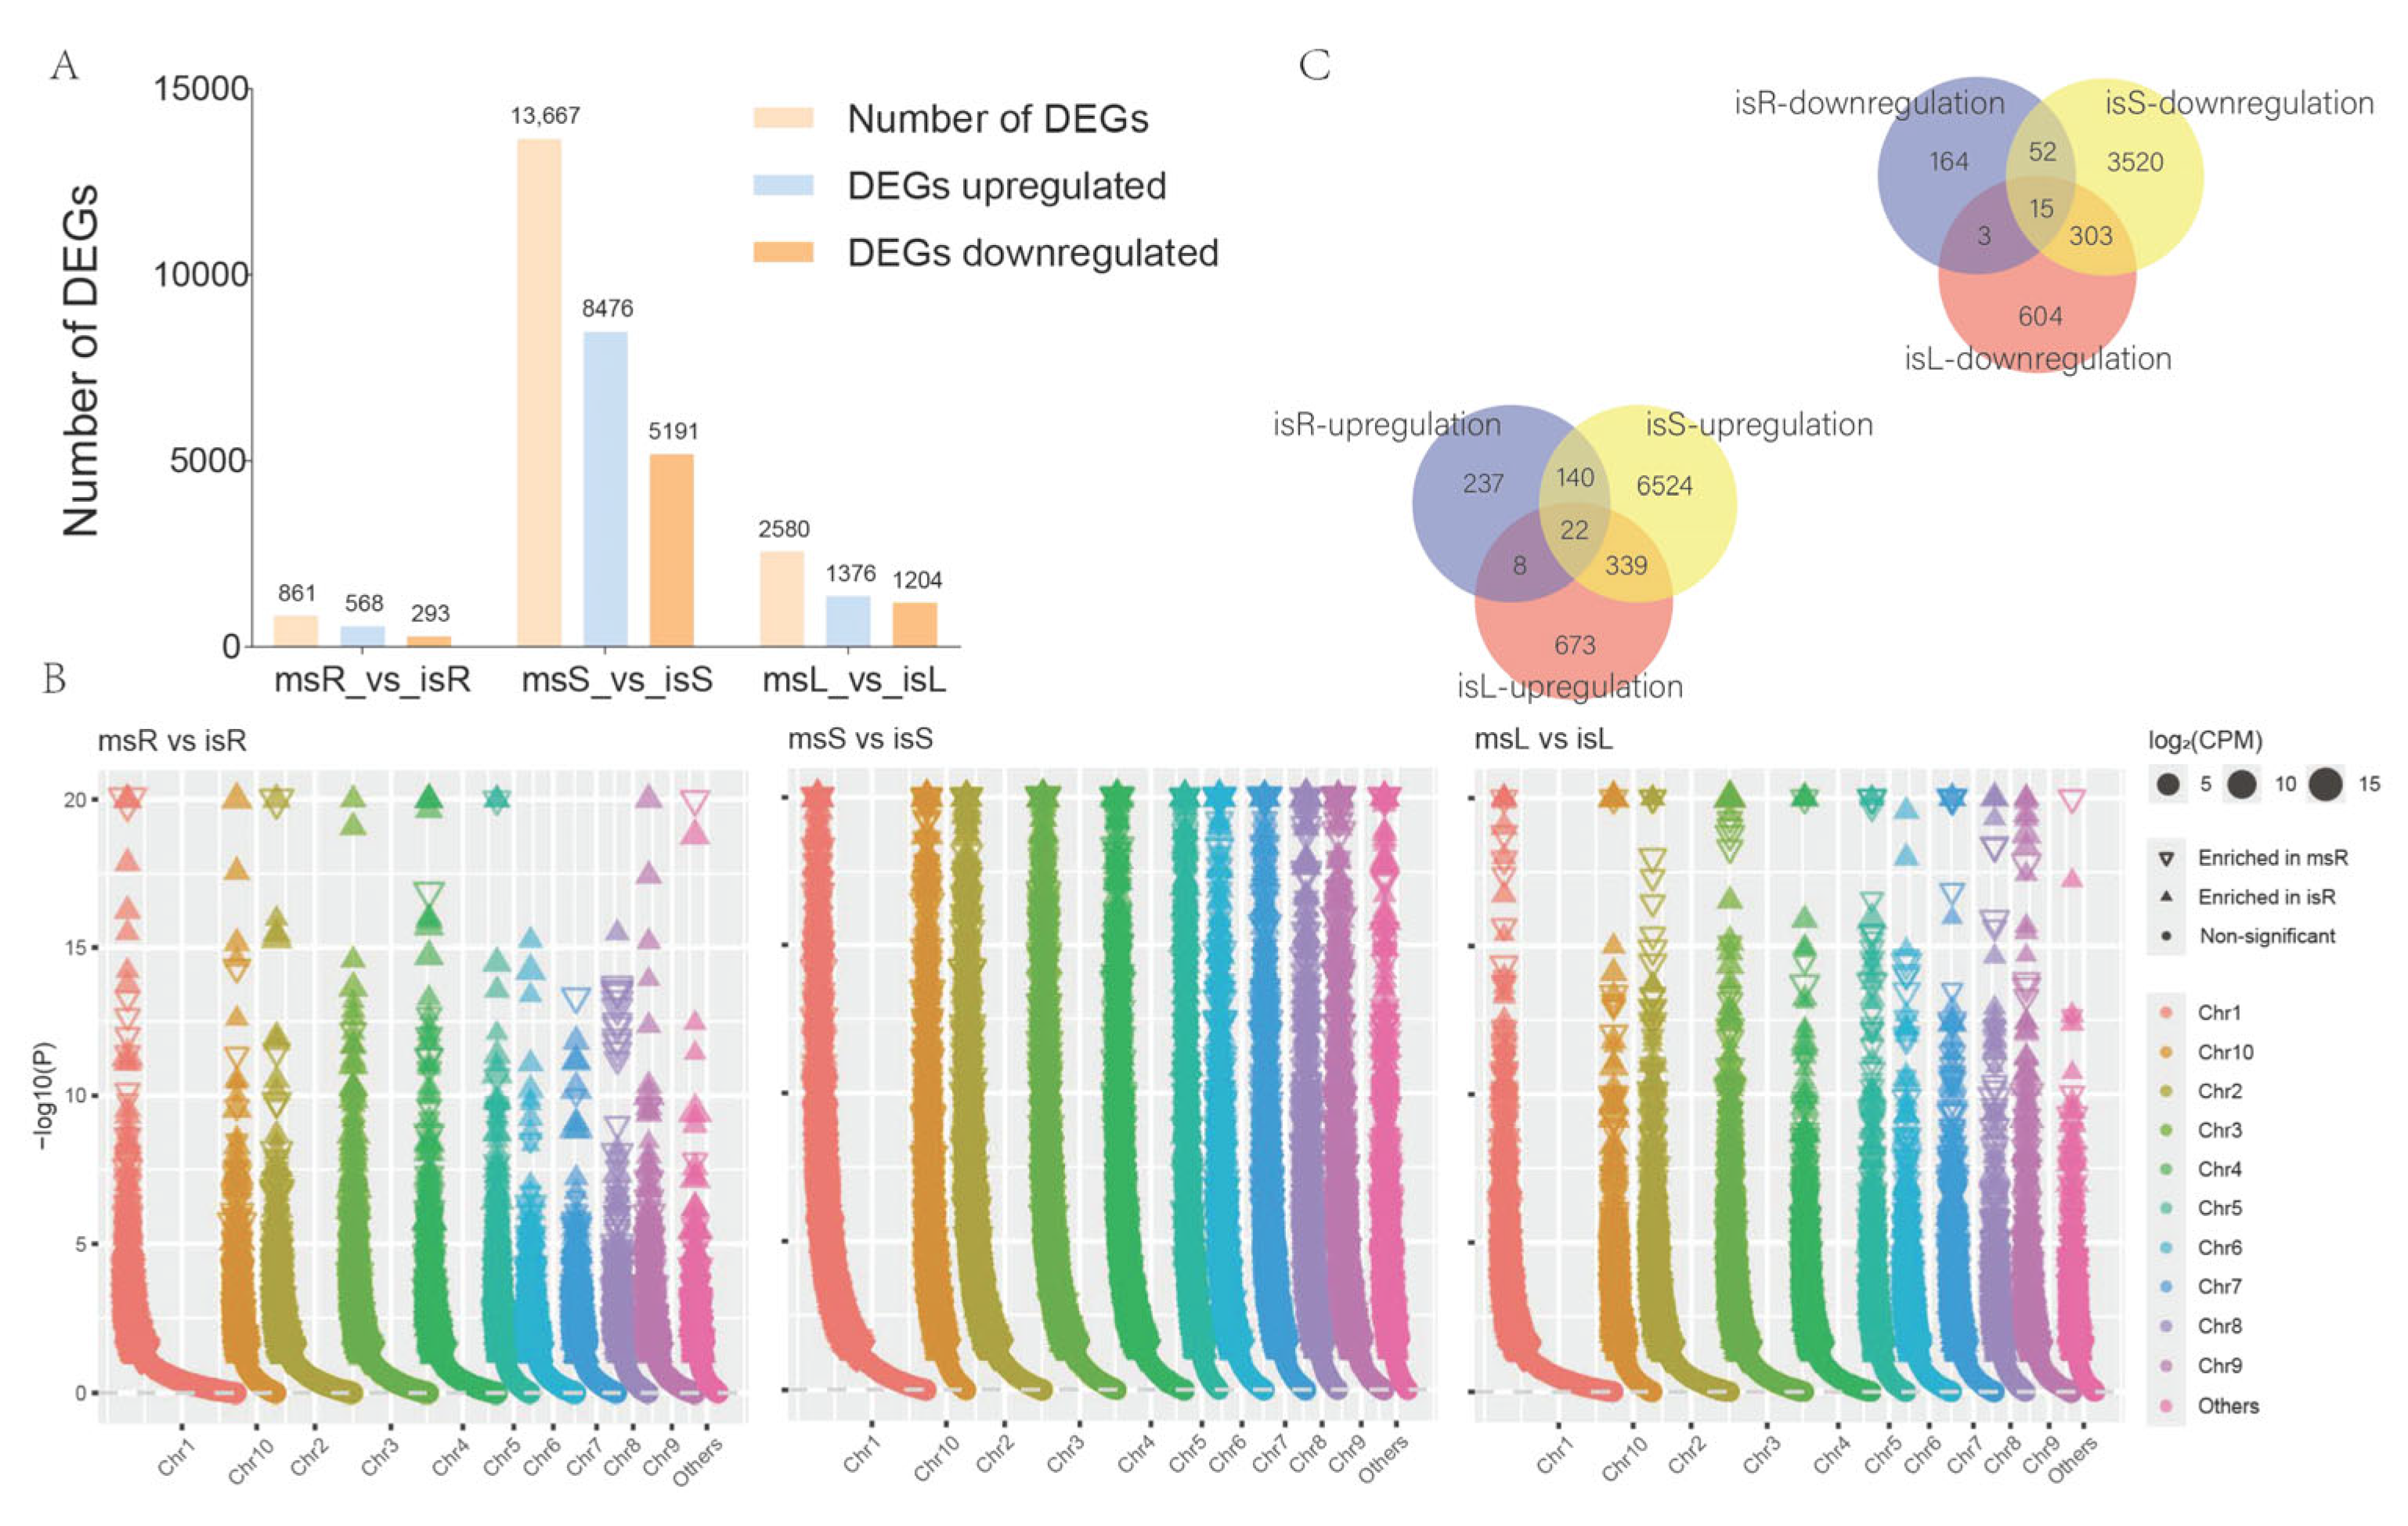
Compared to the monoculture treatment, we identified 15,747 novel DEGs in the intercropping treatment samples. Specifically, 861, 13,667, and 2580 DEGs were detected in the isR, isS, and isL, respectively. Among them, 293 (34.03%) DEGs were downregulated and 568 (65.97%) were upregulated in isR compared to msR; 8476 (62.02%) DEGs were upregulated and 5191 (37.98%) were downregulated in isS compared to msS; 1376 (53.33%) DEGs were upregulated and 1204 (46.67%) were downregulated in isL compared to msL (Figure 5A).
Through the screening and analysis of DEGs across different treatments, it was found that the number of DEGs between the stems of sugarcane in msS and isS was the highest, being 15.87 times that of the roots, indicating that more genes in the stems were involved in expression regulation to respond to intercropping. Conversely, the lower number of DEGs in the roots of intercropped sugarcane suggested a lesser impact from belowground interactions. Meanwhile, the number of DEGs in leaves ranked second, indicating that although they were also influenced by root interactions, the effect was less pronounced than in the stems. This data demonstrates that sugarcane is indeed affected by the intercropping system, but the extent of the effect varies by tissue.
To identify common novel genes across different sugarcane tissues under varying planting conditions, a Manhattan plot was used to visualize comparisons (Figure 5B).
These DEGs play crucial roles in activating regulatory expression in response to stress in crops, indicating that different parts of sugarcane are influenced by the intercropping system, thereby activating the regulatory expression of genes related to biotic or abiotic stress. Additionally, we employed Venn diagrams (Figure 5C) to compare the upregulated or downregulated DEGs across different parts and found that among the upregulated DEGs in isR, 140 DEGs were also upregulated in isS, 8 DEGs were upregulated in isL, whereas 339 DEGs upregulated in isS were also upregulated in isL, with 22 DEGs commonly upregulated in all three parts. In contrast, there were 15 commonly downregulated DEGs among the three parts. Simultaneously, isR shared 52 and 3 commonly downregulated DEGs with isS and isL, respectively, while isS and isL shared 303 commonly downregulated DEGs. These common DEGs demonstrate the consistency across different samples within the same crop, while the distinct DEGs signify the variability arising from their origin in different parts.

3.6. GO Functional Annotation and Enrichment Analysis of DEGs

To identify the predominant biological processes expressed in different parts, we present the GO enrichment analysis of upregulated and downregulated DEGs in sugarcane parts within the intercropping system based on FDR < 0.05 (Table S3). Based on the GO enrichment results, we selected the most significant functional annotations to explain the physiological changes. In distinct sugarcane parts, pathways related to chloroplast thylakoid membrane and photosynthesis were enriched in upregulated DEGs of isS and isL, while pathways involving mismatch repair, maintaining the fidelity of DNA-dependent DNA replication, negative regulation of telomere looping, negative regulation of T-loop formation, regulation of double-strand break repair via homologous recombination, and maintenance of rDNA were enriched in upregulated DEGs of isR. Pathways associated with chloroplast, chloroplast stroma, and photosystem II were enriched in upregulated DEGs of isS, and those related to ribonuclease T2 activity, thylakoid, and protein nucleotidylation were enriched in upregulated DEGs of isL.
Concurrently, we observed that pathways linked to cortical microtubule, transverse to long axis, protein homotrimerization, phosphofructokinase activity, malate-acetate isomerase activity, and peroxidase activity were enriched in downregulated DEGs of isR. Pathways associated with auxin-activated signaling pathway, DNA-binding transcription factor activity, glucuronosyltransferase activity, structural constituent of cytoskeleton, and protein binding were enriched in downregulated DEGs of isS. Moreover, pathways related to Golgi organization, cytoplasmic vesicle, programmed cell death during cell development, discarded Golgi cisterna, and functions of the endomembrane system were enriched in downregulated DEGs of isL.

3.7. KEGG Pathway Enrichment Analysis

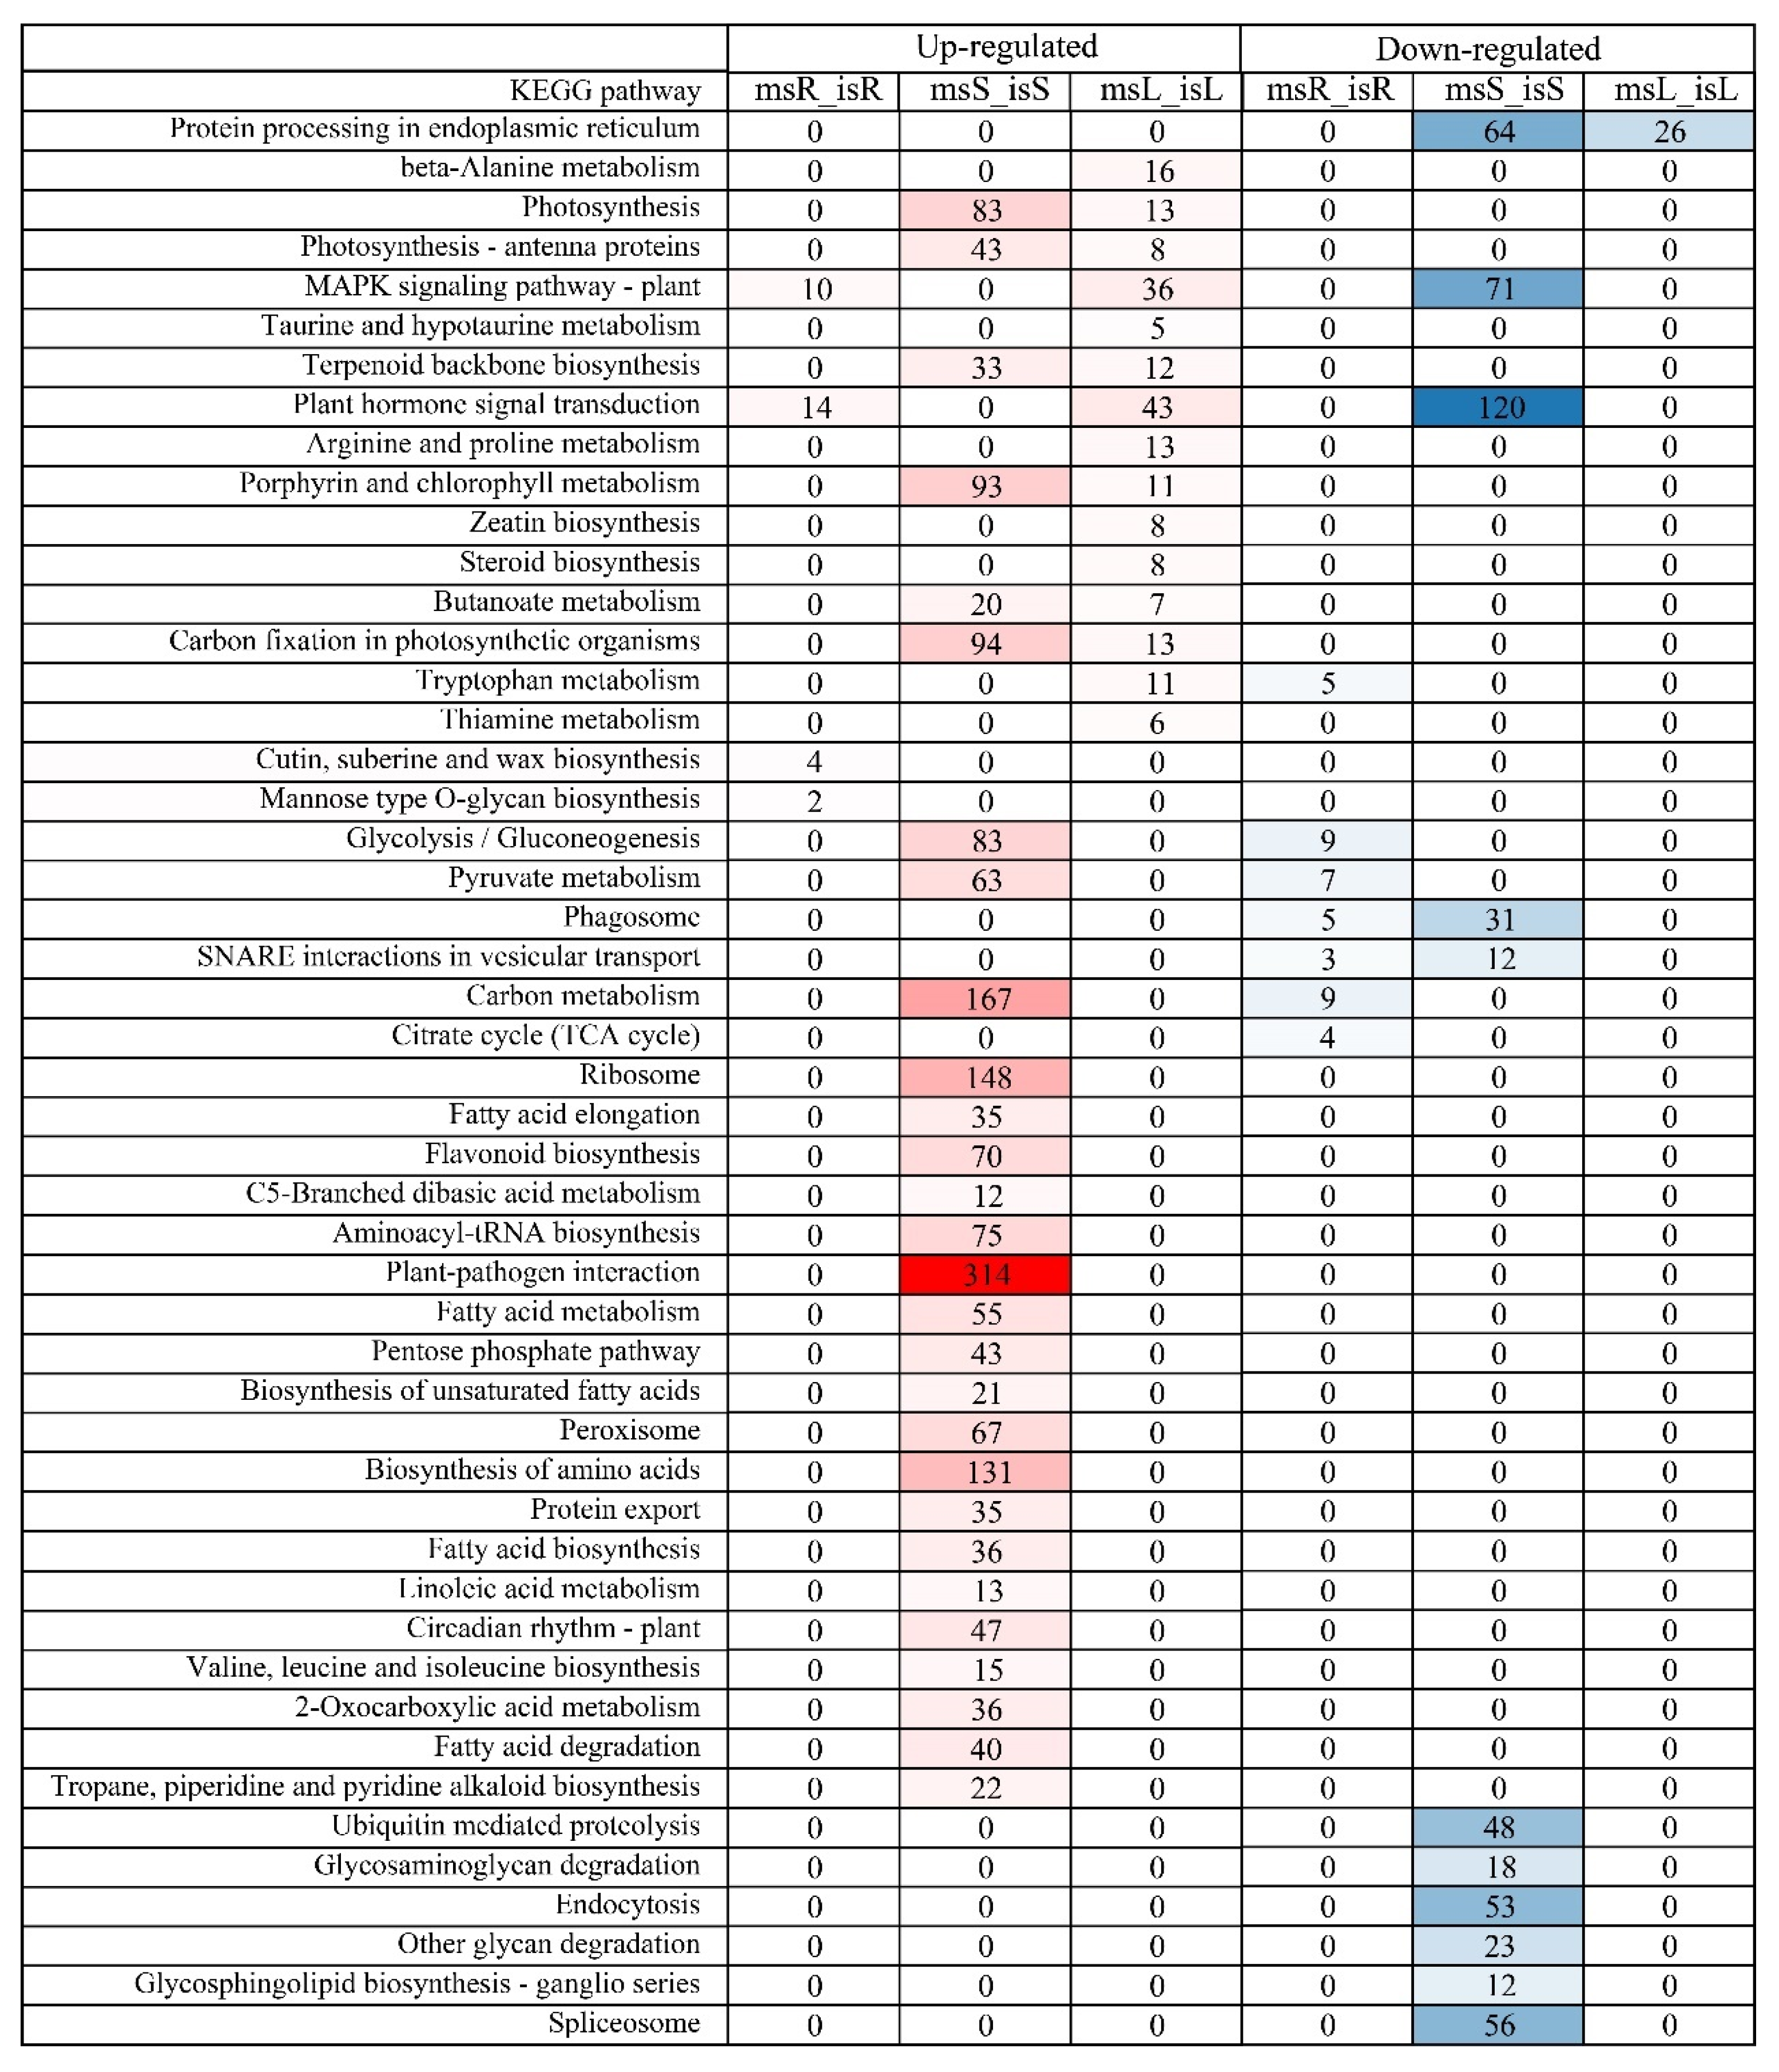
A KEGG pathway enrichment analysis revealed that, compared to monocropping, the roots of isR exhibited upregulation of 188 genes and downregulation of 149 genes, which were associated with 91 distinct pathways (Table S2C). In the isS, 4378 upregulated and 1671 downregulated DEGs were annotated to 133 and 117 different pathways, respectively. In the isL, 634 upregulated and 409 downregulated DEGs were annotated to 103 and 89 different pathways, respectively. A heatmap generated based on the KEGG pathway analysis illustrates the distribution of significantly enriched pathways across various biological processes (Figure 6).
Among these pathways, the MAPK signaling pathway—plant and plant hormone signal transduction were enriched among the upregulated DEGs in isR and isL, but were enriched among the downregulated DEGs in isS. Pathways associated with photosynthesis, photosynthesis-antenna proteins, terpenoid backbone biosynthesis, porphyrin and chlorophyll metabolism, butanoate metabolism, and carbon fixation in photosynthetic organisms were enriched in the upregulated DEGs of isS and isL. In contrast, pathways involved in cutin, suberine, and wax biosynthesis, as well as mannan degradation, were specifically enriched only in isR (Table S4).
A number of pathways exhibited tissue-specific enrichment patterns among the upregulated DEGs in intercropped sugarcane isS. These included Ribosome, Fatty acid elongation, Plant-pathogen interaction, Pentose phosphate pathway, Fatty acid metabolism, C5-branched dibasic acid metabolism, Peroxisome, Protein export, Linoleic acid metabolism, Circadian rhythm—plant, 2-Oxocarboxylic acid metabolism, Fatty acid degradation, as well as the Biosynthesis of flavonoids, Aminoacyl-tRNA biosynthesis, Unsaturated fatty acids, Fatty acids, Amino acid metabolism, Valine, leucine and isoleucine biosynthesis, and Tropane, piperidine and pyridine alkaloid biosynthesis. Furthermore, central carbon metabolic pathways such as Glycolysis/Gluconeogenesis, Pyruvate metabolism, and Carbon metabolism were also significantly enriched in the upregulated DEGs of isS (Table S4).
In the isL, the upregulated DEGs showed unique enrichment in β-Alanine metabolism, Taurine and hypotaurine metabolism, Arginine and proline metabolism, Zeatin biosynthesis, Steroid biosynthesis, and Thiamine metabolism. Notably, Tryptophan metabolism was enriched in both the upregulated DEGs of isL and the downregulated DEGs of isS (Table S4).
For the downregulated DEGs, Phagosome and SNARE interactions in vesicular transport pathways were co-enriched in both isR and isS. The Citrate cycle (TCA cycle) was exclusively suppressed in isR. Protein processing in endoplasmic reticulum was downregulated in both isS and isL. Additionally, pathways including Ubiquitin mediated proteolysis, Glycosaminoglycan degradation, Endocytosis, Other glycan degradation, Glycosphingolipid biosynthesis—ganglio series, and Spliceosome were specifically enriched in the downregulated DEGs of isS (Table S4).

3.8. The Responses of Key Genes to Metal Transport and Hormone Signal Transduction Processes

In the comparative transcriptomic analysis of isR, isS, and isL groups, DEGs displayed distinct condition-specific expression patterns and coordinated regulation among transcription factors and transporter genes. Among upregulated DEGs, the isR group was notably enriched in ethylene-responsive transcription factors (e.g., ERFs), WRKY transcription factors, and zinc finger proteins. The isS group showed upregulation of auxin response factors (ARFs), ethylene response transcription factors, bHLH and WRKY family genes, as well as magnesium transporters (including MRS2-A and NIPA2). In isL, upregulated DEGs were predominantly associated with auxin response factors and proteins, copper-transporting ATPases, potassium transporters, and inorganic phosphate transporters.
WRKY transcription factors were co-upregulated in isR and isS, while auxin response factors were upregulated in both isS and isL. Ethylene-responsive transcription factors were also jointly elevated in isR and isS, highlighting their key regulatory roles under specific treatment conditions.
Among downregulated DEGs, isR was characterized by suppression of NAC transcription factors, TGA2.3, bHLH49, auxin-responsive proteins, and metal transporters. The isS group exhibited downregulation of various auxin response factors and proteins, ethylene response transcription factors, MYB and TGA2.3 transcription factors, WRKYs, as well as multiple transporters involved in copper, magnesium, potassium, silicon (e.g., LSI3), and zinc translocation. In isL, downregulated genes included auxin response factors, bHLH transcription factors, TGA2.3, ammonium transporters, copper and broad-metal transporters, ferritin, phospholipid-transporting ATPases, inorganic phosphate transporters, two-pore calcium channels, and zinc transporters.
Notably, TGA2.3 was consistently downregulated across all three conditions, suggesting a generalized repressive response. Auxin response factors were downregulated in both isS and isL, and metal ion transporters—such as those for zinc and copper—were reduced in these two groups, implying common mechanisms of ion homeostasis regulation under distinct treatment conditions.
In summary, the expression profiles of transcription factors and transporters reveal both shared and condition-specific regulatory strategies employed by plants in response to different environmental cues. These results underscore the plasticity of transcriptional and transport systems in mediating adaptive responses to stress. The findings further illuminate mechanistic aspects related to zinc transport and auxin (IAA) signaling pathways in sugarcane under varying cropping systems.

3.9. Key Genes Involved in Plant Hormone Signal Transduction

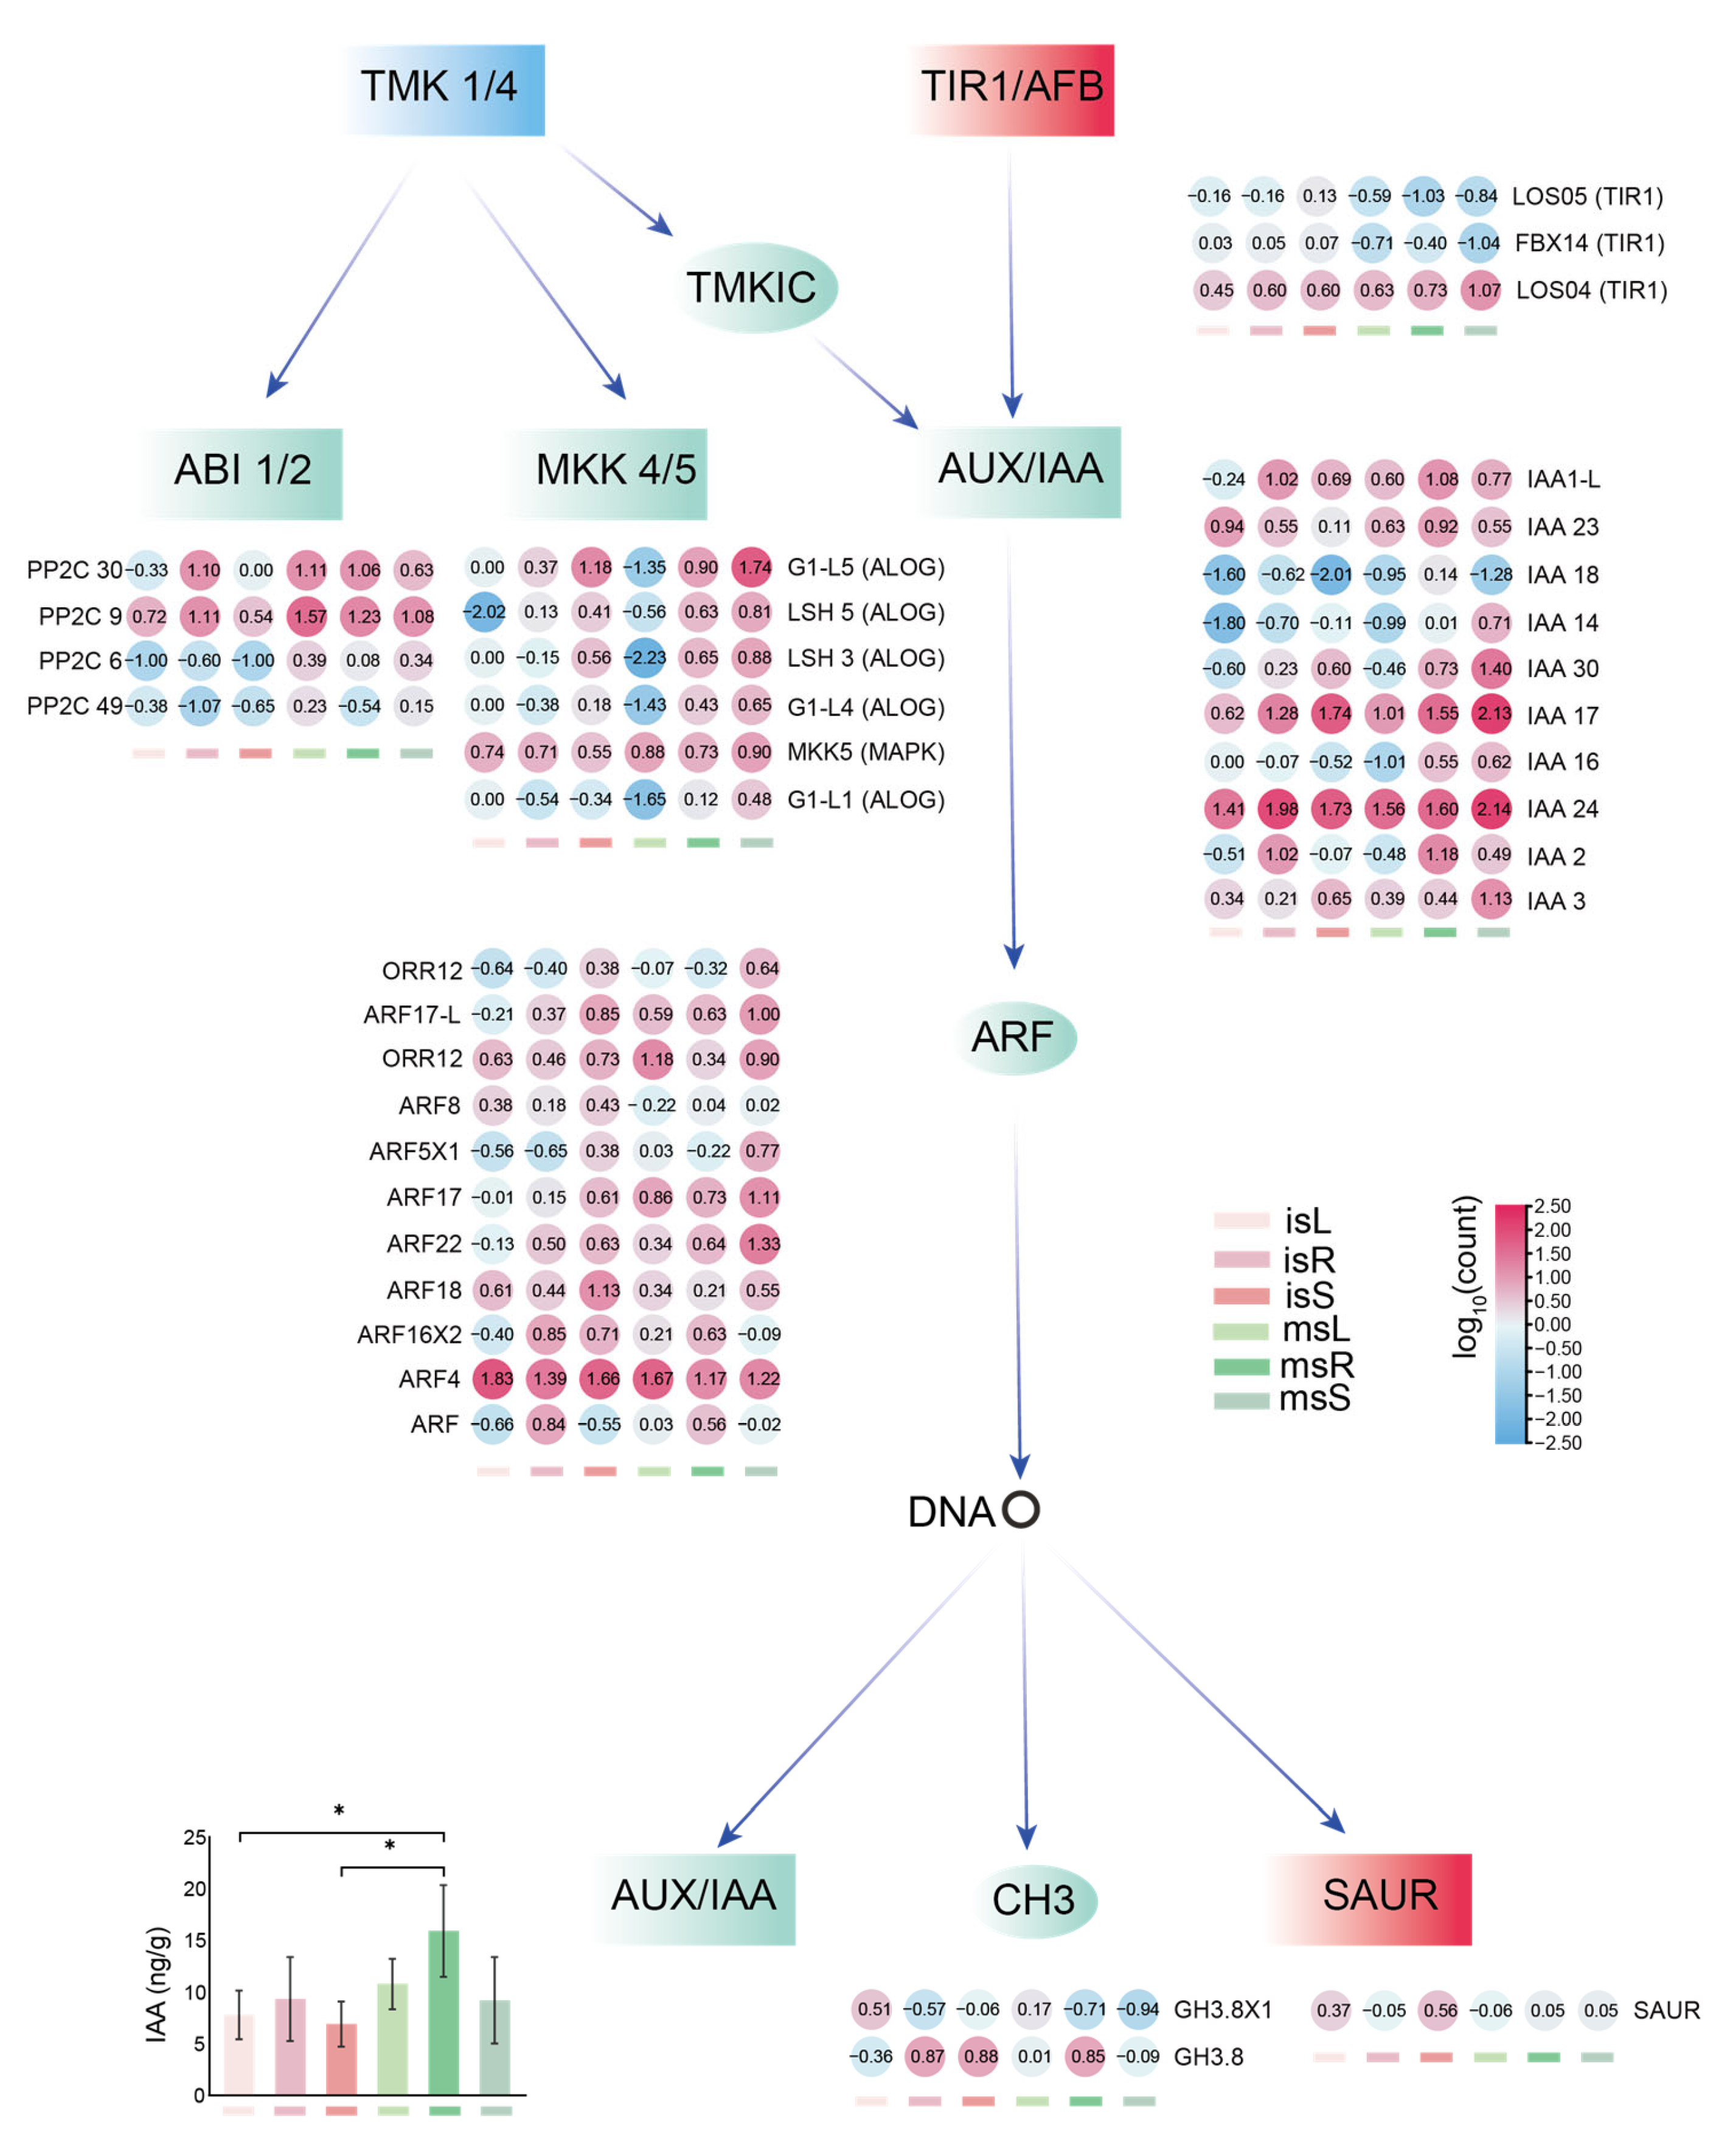
We conducted enrichment analysis of hormone signal transduction pathways in the roots, stems, and leaves of sugarcane under different cropping systems. A total of 318 DEGs were enriched in the plant hormone signal transduction pathways in intercropped sugarcane, with 19,256 and 72 DEGs enriched in the roots, stems, and leaves, respectively. Focusing on the auxin signal transduction pathway, we found that 5, 60, and 17 DEGs related to auxin signal transduction were enriched in the roots, stems, and leaves, respectively. Specifically, in the roots, 2 genes were upregulated and 3 were downregulated, including 1 upregulated TIR1, 1 upregulated PP2C, and 1 downregulated PP2C, 1 downregulated ARF, and 1 downregulated AUX/IAA. In the stems, 17 genes were upregulated and 43 were downregulated, including 3 upregulated TIR1s, 9 upregulated ARFs, 4 upregulated GH3s, 1 upregulated SAUR, 7 downregulated MKK4/5s, 14 downregulated AUX/IAAs, 3 downregulated TIR1s, 9 downregulated ARFs, 1 downregulated GH3, and 9 downregulated PP2Cs. In the leaves, 6 genes were upregulated and 11 were downregulated, with 3 upregulated AUX/IAAs, 3 upregulated ARFs, 1 downregulated AUX/IAA, 5 downregulated ARFs, and 5 downregulated PP2Cs.
We selected these auxin-related DEGs to construct and analyze the hormone pathway on the KEGG map (Figure 7), focusing on genes involved in the IAA signal transduction pathway such as TIR1, AUX/IAA, GH3, SAUR, MKK4/5, ARF, and PP2C. In the auxin-related MAPK signal transduction pathway, MKK4/5 gene expression was significantly reduced. During the interaction between auxin and abscisic acid, PP2C (ABI1) gene expression showed 1 upregulated and 1 downregulated in the roots, while it was significantly downregulated in the leaves. In the auxin transport inhibitor response, NewGene_152162 (TIR1-L Os05) was significantly upregulated in both roots and stems, while NewGene_29527 and NewGene_50961 (FBX14) were significantly upregulated in stems. Additionally, NewGene_79623, NewGene_88267, and NewGene_95379 (TIR1-L Os04) were significantly downregulated in stems. Among AUX/IAA genes, NewGene_179898, NewGene_183531, and NewGene_176452 (IAA23) were significantly upregulated in leaves, while other IAA family genes were significantly downregulated in all tissues. In auxin regulation, ARF expression varied between upregulation and downregulation in roots, stems, and leaves, with NewGene_177259 (ARF17) significantly downregulated in all tissues. The auxin-responsive promoter NewGene_208568 (GH3.8) was significantly downregulated in stems, while other GH3 genes were significantly upregulated in stems. The auxin-responsive gene NewGene_122002 (SAUR) was significantly upregulated only in stems. These results suggest that significant changes in the growth environment of sugarcane under intercropping conditions trigger variations in the expression of auxin signal transduction-related genes, with some differences due to the growth needs of different plant tissues.

3.10. Module Identification and Functional Enrichment Analysis in Weighted Gene Co-Expression Network Analysis

Weighted gene co-expression network analysis was employed to investigate the gene co-expression profiles of sugarcane roots, stems, and leaves under intercropping conditions, aiming to detect relationships between genes and endogenous metabolites, endogenous metal, as well as inter- or intra-genic interactions. A total of 26 co-expression modules and their corresponding correlation coefficients were identified (Figure 8).
The metal Zinc showed a positive correlation with the brown module, with a correlation coefficient of 0.43. The metal calcium and aluminum both showed a positive correlation with the midnight blue module, with correlation coefficient ranging from 0.55 to 0.62. The primary metabolite class Organooxygen compounds was positively correlated with the green module, with correlation coefficient of 0.58. The primary metabolite class Carboxylic acids and derivatives showed a positive correlation with the turquoise module, with a correlation coefficient of 0.52. The metabolite Indole-3-carboxaldehyde was positively correlated with the cyan module, with a correlation coefficient of 0.68. The metabolite 3-Indoleacetonitrile showed positive correlations with the dark turquoise module, with correlation coefficients of 0.46. The metabolite Glycyl tryptophan positively correlated with the light cyan module, with a correlation coefficient of 0.71.
However, certain phenotypes demonstrated negative correlations with sugarcane gene expression. The metal calcium showed a negative correlation with the green module, with a correlation coefficient of 0.6. The primary metabolite class Carboxylic acids and derivatives showed a negative correlation with the blue module, with a correlation coefficient of 0.45, and the primary metabolite class Benzene and substituted derivatives, Indoles and derivatives demonstrated negative correlations with tan module, with a correlation coefficient ranging from 0.52 to 0.58.

3.11. Zinc Regulates Agronomic Traits and Endogenous Hormone Levels in Sugarcane: An Integrative Assessment

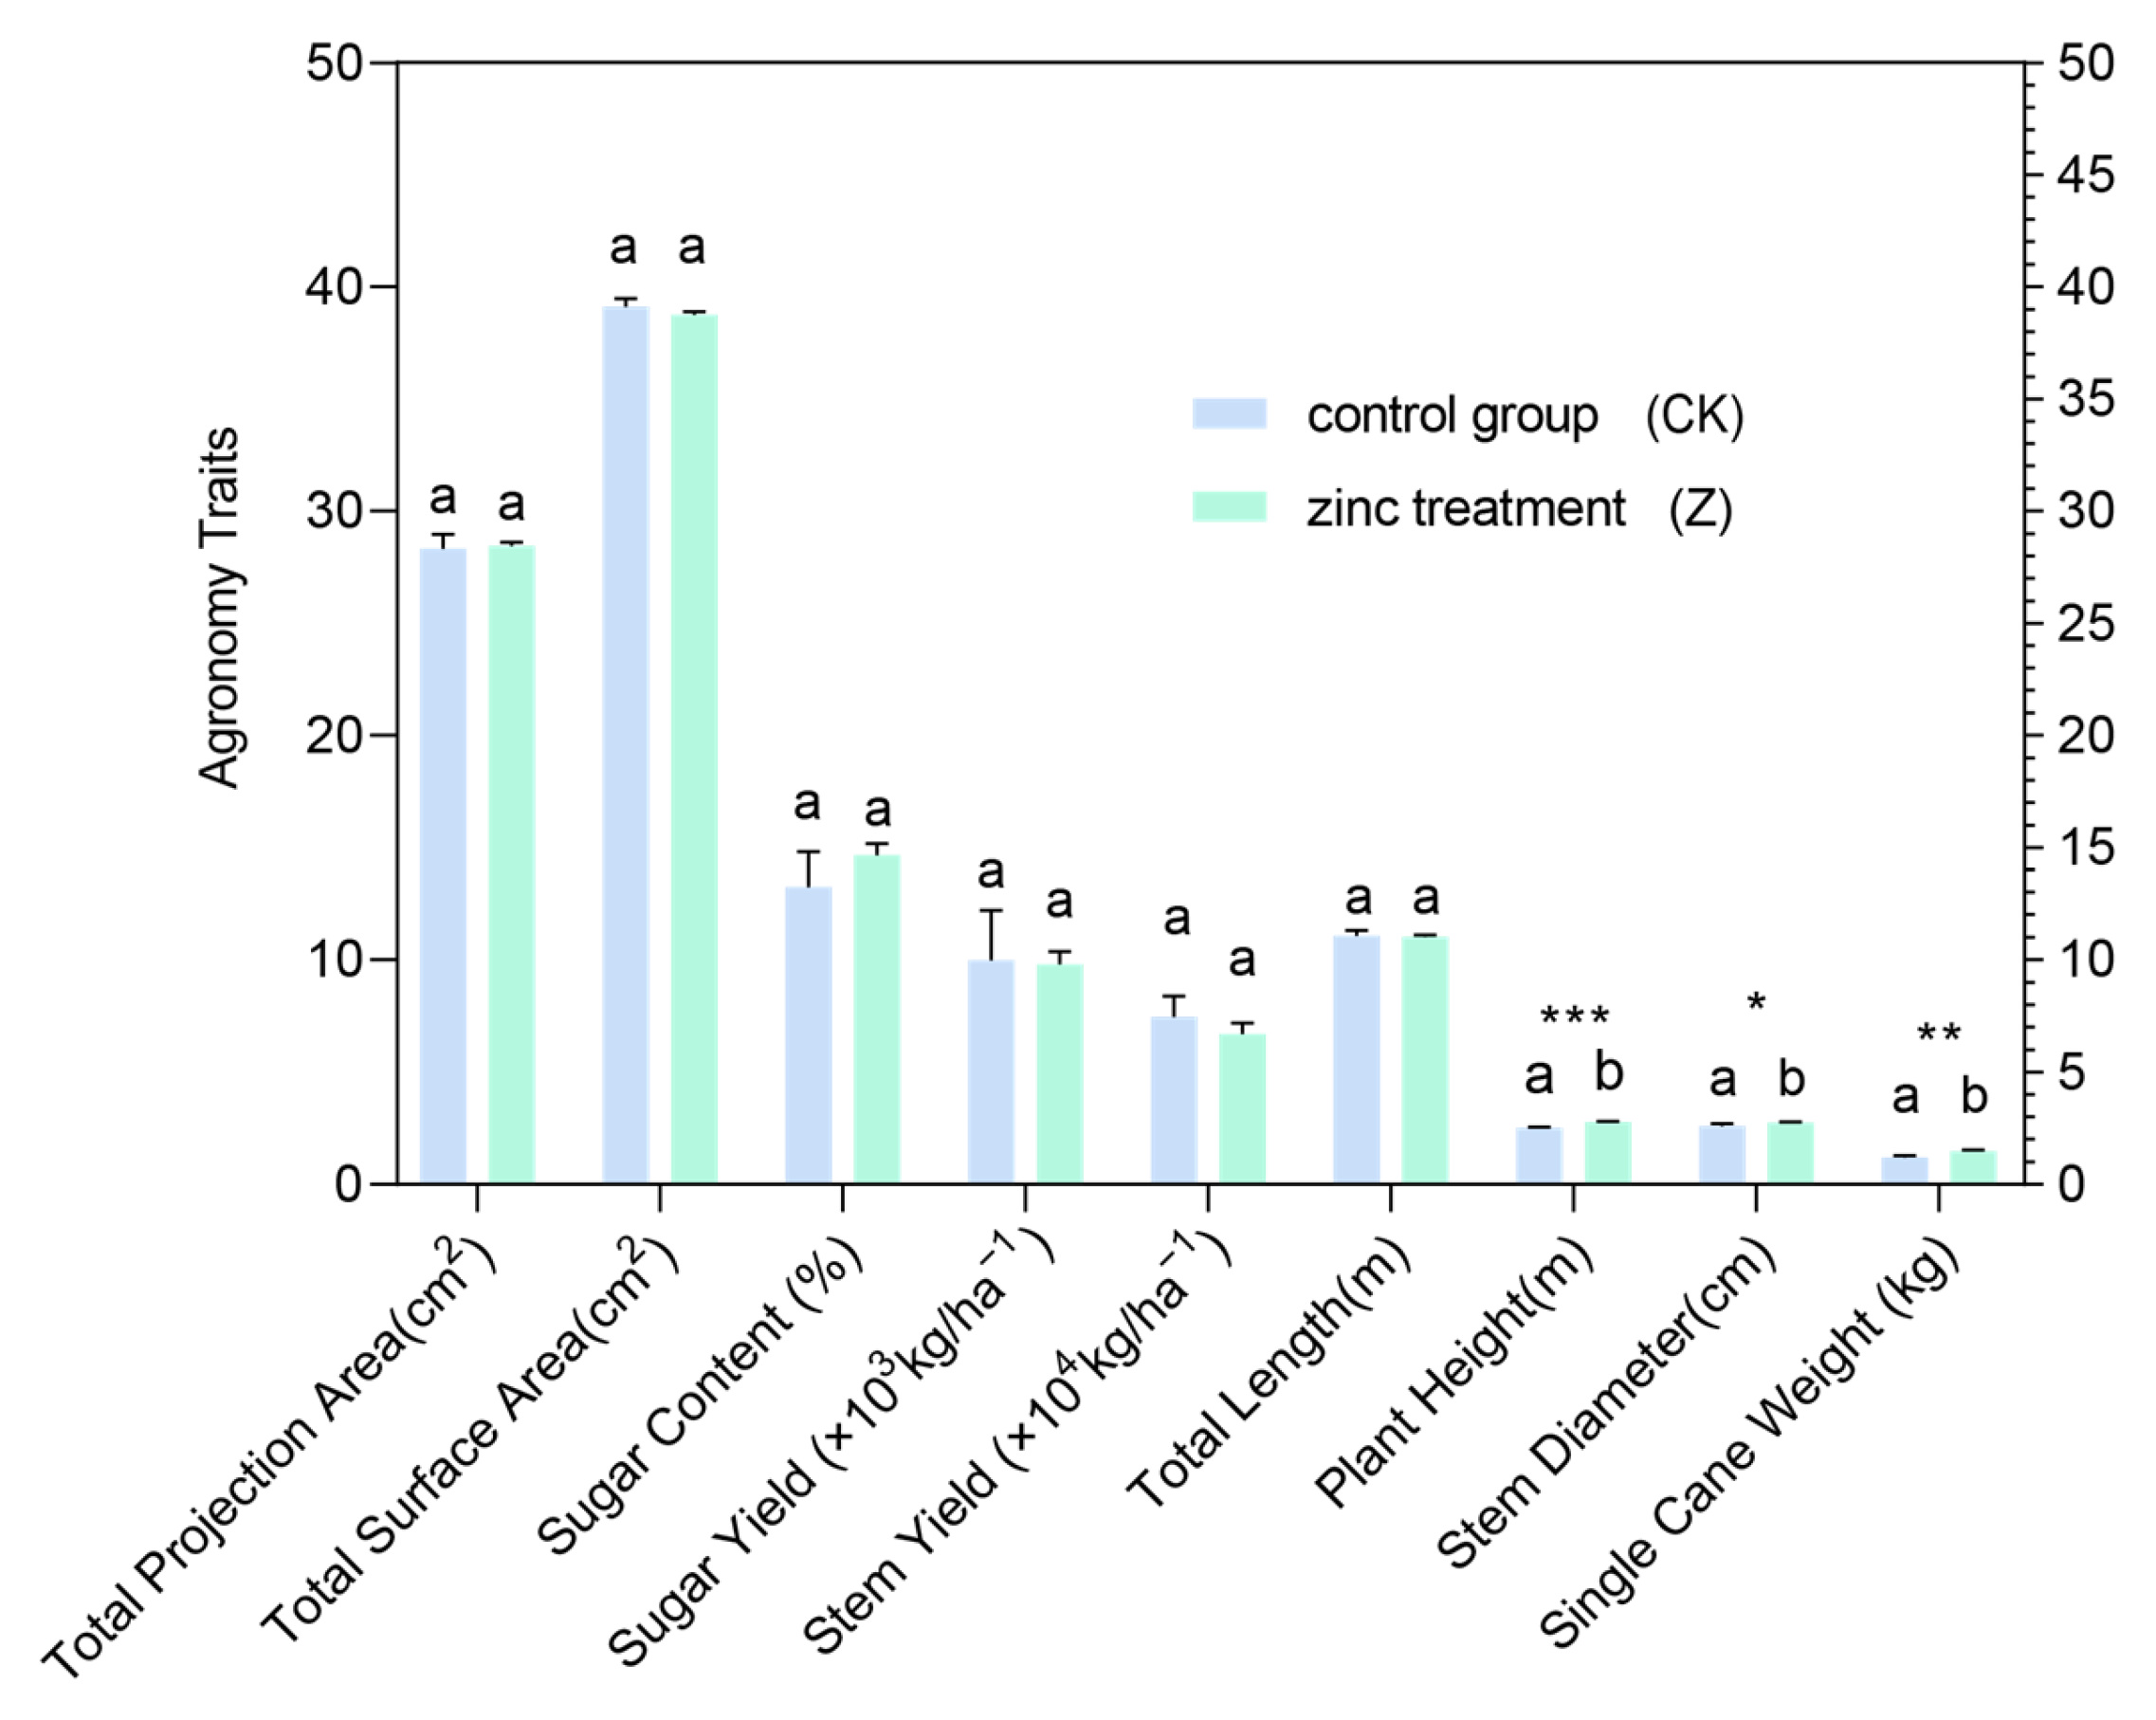
Given the observed strong correlation between zinc enrichment in the roots, stems, and leaves of intercropped plants and their growth traits and endogenous hormone levels, this study used field experiments to examine the potential co-regulatory interplay between endogenous hormones and metallic elements in sugarcane. Results showed that zinc treatment (Z) led to marked improvements in key growth metrics relative to the control (CK), such as plant height, stem diameter, and single cane weight (p < 0.05). Sugar content in the zinc treatment was higher than that in the control group, but the difference was not significant (p > 0.05). As shown in Figure 9, plant height in the Z varied from 2.50 to 2.82 m, while stem diameter ranged between 2.49 and 2.79 cm. Sugar content values fell between 1.07% and 1.53%, and average stem weight ranged from 1.07 to 1.53 kg. These outcomes confirm that zinc application enhances both sugarcane growth and sugar accumulation. Field validation confirmed that intercropping maintained sugarcane yields at levels comparable to monoculture while introducing a yield advantage through peanut production. The resulting increase in overall system productivity was accompanied by only minor, non-significant changes in root length, sugar yield, and economic benefits, which may reflect the lower planting density or competitive dynamics of the intercropping configuration.
Endogenous hormone contents were further quantified across three tissue types under each treatment (Table S5A). KEGG enrichment (Figure 10A) and principal coordinate analysis (Figure 10B) indicated clear tissue-based differences in hormone profiles, with treatment also significantly affecting hormonal makeup within each tissue. Notably, auxin IPA (3-indolepropionic acid) and cytokinin tZR (trans-zeatin riboside) were significantly suppressed in the ZS and ZR of zinc-treated plants (p < 0.05). In contrast, the auxin precursor TRA (tryptophan) increased significantly in ZR, ZS, and ZL (leaves; p < 0.05). ICAld (indole-3-carboxaldehyde) content decreased in ZL but rose in ZR and ZS (Table S5B). These outcomes align with earlier metabolomic KEGG predictions and endogenous metabolite patterns.
Specifically, zinc supplementation significantly enhanced plant height, stem diameter, sugar content, single-stem weight, and TRA levels in monoculture sugarcane, while reducing IPA and tZR concentrations. TRA levels also showed clear tissue-specific differences among roots, stems, and leaves.

4. Discussion

Intercropping (or relay cropping) systems represent a complex biological process that is governed and modulated by a myriad of genes in plants. Roots, stems, and leaves of plants exhibit distinct responses and undergo varied changes even under identical environmental conditions. This study adopts physiological and transcriptomic approaches to explore the molecular mechanisms underlying the physiological responses. High-throughput sequencing and transcriptome assembly were employed to investigate the molecular responses of sugarcane to different cropping systems.

4.1. Intercropping Significantly Influences the Metal Profile, Metabolite Composition, and Gene Expression in Sugarcane

When grown alongside companion species, sugarcane can trigger a range of physiological adaptations. These include the regulation of gene expression and the production of secondary metabolites [48]. The incorporation of different intercropping partners thus alters the accumulation of metals and the spectrum of metabolites within the sugarcane plants [49]. Similarly, our findings reveal significant differences in the metal and metabolite profiles across various sugarcane tissues between monoculture and intercropping systems (Figure 1, Figure 2 and Figure 3). These results align with previous metabolite studies, which have reported shifts in chemical diversity and composition under intercropping conditions, accompanied by corresponding changes in transcriptional regulation [50]. Therefore, the substantial influence of intercropping on metabolite composition is strongly associated with increased plant diversity [49]. Our results demonstrate that intercropping promotes the accumulation of certain metabolites—such as Gallic acid and sophoraflavanone G—in the roots, stems, and leaves of sugarcane, while inhibiting the enrichment of others, including aflatoxin G1 and methyl dioxindole-3-acetate (Table S1). Based on these results, it can be observed that different planting systems exert a certain influence on the relative abundance of material classifications in the roots, stems, and leaves of sugarcane. Specifically, the relative abundance of each material classification may increase or decrease under different planting conditions. These findings provide valuable insights into understanding the changes in the metabolic composition of sugarcane roots, stems, and leaves and the effects of intercropping with peanuts on sugarcane growth. The interactions between different crop species in intercropping systems may result in either beneficial or detrimental effects, underscoring the importance of species selection when designing intercropping regimes. These effects include enhanced diversity of plant metabolites and increased secretion of specific chemical compounds in key crops under intercropping conditions [51]. For example, artemisinin suppresses root and shoot elongation in lettuce seedlings by triggering overproduction of reactive oxygen species (ROS) and lipid peroxidation, which results in cell cycle arrest and reduced cell viability [52]. Similarly, under intercropping conditions, shading stress promoted lignin accumulation in soybean seed coats, which improved their mechanical strength and extended seed longevity during unfavorable storage [53]. Conversely, intercropping enhances the growth environment for both corn and peanuts through more efficient resource use, thereby indirectly mitigating the accumulation of stress-induced harmful metabolites—such as reactive oxygen species and ethylene [54]. In conclusion, our findings, in alignment with previous studies, support the hypothesis that intercropping contributes to increased chemical diversity of rhizosphere metabolites and promotes the enrichment of specific compounds.
Interestingly, our results show that intercropping can modulate gene expression and alter transcriptional activity in plants (Figure 4 and Figure 5 and Table S2). Under environmental stress, plants alter their metabolic pathways and biosynthesis by regulating gene expression [55]. Pairwise comparisons of root, stem, and leaf tissues from sugarcane under different treatments revealed a notable enrichment of key stress-responsive unigenes among the DEGs in intercropped plants. These included WRKY and bHLH transcription factors, auxin-responsive proteins, and auxin response factors (ARFs), which are associated with responses to both biotic and abiotic stresses. The results imply that intercropping activates stress-related gene expression across multiple sugarcane tissues, likely as an adaptive mechanism to interspecific interactions with peanut.
Additionally, differential expression was observed in genes encoding inorganic phosphate transporters and metal transporters, suggesting that intercropping enhances nutrient acquisition and internal translocation in sugarcane. GO term enrichment analysis further identified significant involvement of biological processes related to chloroplast thylakoid membrane organization, photosynthetic activities, and auxin-activated signaling pathways. These molecular changes are consistent with improved biomass production and yield traits observed in intercropped sugarcane, thereby corroborating previous reports of its superior growth and yield performance compared to monoculture [56,57,58].
In conclusion, both our findings and earlier evidence collectively indicate that intercropping markedly alters the metabolite profile and transcriptional regulation in sugarcane, thereby advancing the mechanistic understanding of intercropping-induced physiological adaptations.

4.2. Strong Linkages Between Rhizosphere Metabolites and Microbiomes

Understanding the intricate relationship between plant metabolites and transcriptomes can help elucidate how plants respond to intercropping conditions, while also offering practical strategies for improving crop yield within sustainable farming systems [59]. Our results demonstrate strong associations among transcriptional regulation, physiological and biochemical traits, and the chemical diversity as well as composition of metabolites in roots, stems, and leaves (Figure 6 and Tables S3–S5). The profound impact of transcriptional activity on metabolite variation and plant physiological characteristics is well established and supported by previous studies [60,61]. Accumulating studies show that changes in transcriptional regulation enhance the production of beneficial metabolites, leading to increased accumulation of essential phytohormones and metal cofactors that support plant development and stress adaptation [62,63,64]. Transcriptome function as regulatory signals that modulate plant metabolic activity, either stimulating or inhibiting metabolite synthesis and ultimately altering physiological and biochemical responses [65]. As emphasized by Liu et al. [66], a positive correlation was observed between the soybean transcription factor GmSTOP1-3 and the accumulation of flavonoid compounds in metabolites. Moreover, numerous transcriptional regulators and metabolites such as gallic acid play a crucial role in enhancing cadmium stress tolerance [67]. Furthermore, certain metabolites, including precursors of indole-3-acetamide, have been demonstrated to significantly regulate endogenous IAA levels [68]. Therefore, the differential expression of key genes partly governs variations in metabolite profiles. In cassava, the coordinated regulation of carbohydrate-related pathways and genes substantially influences starch accumulation patterns [66]. Our data demonstrate a robust interconnection between gene expression, metabolite dynamics, and physiological and biochemical characteristics (Figure 8), supporting a consistent distribution pattern. The observed integration of transcriptomic, metabolomic, and endogenous metal profiles indicates that plant constituents and metabolites jointly modulate metabolic activity via gene regulatory networks, with consequent effects on overall productivity.
Significant correlations were identified between major physiological and biochemical traits, transcriptomic activity, and metabolite composition (Figure 8). The inhibitory responses of certain plant genes to metabolite changes align with their conserved behavior under environmental variation, reflecting a consistent regulatory pattern [60]. Within these enriched pathways, the constituent metabolites show strong intercorrelations, allowing them to share similar substrate preferences and respond to environmental changes through the modulation of endogenous hormone precursors or associated signaling pathways [69]. Numerous studies indicate that signaling pathways associated with key genes play a central role in shaping plant metabolite composition and physiological functions, particularly in response to alterations in the external environment [70]. As reported by Xu et al., overexpression of specific functional genes can lead to a significant reduction in endogenous auxin levels [71]. Studies have demonstrated a significant positive correlation between differential expression of certain genes and crop yield or production performance [72]. In contrast, elevated concentrations of toxic metals commonly found as contaminants show a clear negative association with agricultural productivity. Transcriptional regulation of key genes affects metabolic and physiological processes, enabling plants to adapt to metal stress [73,74].
Intercropping has been shown to enhance the synthesis and spatial distribution of hormones, metals, and metabolites in sugarcane [75], which strengthens root-shoot coordination and improves nutrient uptake [76], resulting in better agronomic performance. These effects are driven by differential expression of genes related to heavy metal homeostasis [77,78,79], hormone biosynthesis and signaling [80], and metabolic regulation [81]. The resulting shifts in hormone and metabolite levels further improve root-microbe interactions, photosynthetic capacity, and sugar accumulation, highlighting their essential functions in sugarcane development and environmental resilience [82]. In conclusion, peanut intercropping facilitates sugarcane growth by modulating the expression of key genes, reorganizing metabolic pathways, and adjusting the allocation of metal ions and hormonal cues throughout root, stem, and leaf tissues.

4.3. Regulation of Metal Transport by Transcriptomic and Metabolomic Networks Promotes Plant Growth and Hormonal Homeostasis

Elucidating the mechanisms that regulate plant growth is critical for developing sustainable and high-productivity agricultural systems. This study reveals that in sugarcane, gene expression and metabolite dynamics significantly shape physiological and biochemical traits by modulating metal transport, metabolite profiles, and systemic regulatory networks (Figure 8). The results confirm that genetic and metabolic factors are pivotal in reorganizing the spatial distribution of metal ions and endogenous hormones [83,84]. Such reorganization, driven by active metabolite secretion, supports improved physiological performance and plant fitness [85]. For example, plant genes modulate metal transport through transcriptional regulation, thereby improving the uptake efficiency of Ca, K and P [86]. Intercropping triggers shifts in plant gene expression and metabolite composition, facilitating the synthesis and storage of endogenous hormones and metal ions, which leads to improved nutrient uptake [23].
Our findings reveal that the reduction in endogenous IAA levels in sugarcane and the associated improvement in production traits under zinc supplementation are mediated by a coordinated network of functional genes and metabolites (Figure 9 and Figure 10). These results support the hypothesis that functional genes and specific metabolites influence plant growth and hormonal changes not directly, but through the regulation of signal transduction pathways, enrichment of DEGs in relevant functional categories, and the accumulation of transport proteins or metabolic precursors. As a beneficial metal, zinc participates in a highly conserved dynamic equilibrium network across land plants [87]. Soil and foliar application of zinc can enhance the biofortification, bioavailability and productivity of wheat [88]. Zinc can also improve the growth, yield, osmosis, cell vitality and antioxidant system of plants [89]. Therefore, zinc plays a critical role in stimulating crop growth and improving nutrient uptake. Zinc enrichment acts as a central regulator in this system. Triggered by belowground interactions with peanut, increased zinc levels coordinately modulated the expression of genes involved in metal transport and auxin signaling, thereby fine-tuning IAA homeostasis and ultimately maintaining yield stability under intercropping. We therefore posit that the fine-tuning of the IAA pool via transcriptional and metabolic changes prompted a strategic trade-off. Resources were redirected from vigorous vegetative growth toward a more balanced developmental program, which in turn provided the physiological basis for yield stability despite the competitive intercropping conditions. Further field studies are nevertheless needed to validate these results, also take into account the possible impact of germplasm spacing on this result. Collectively, our findings clarify how intercropping drives changes in endogenous hormones and metal distribution through functional gene–metabolite synergy, thereby increasing overall productivity.

5. Conclusions

Our findings show that enhanced plant growth and yield in intercropping systems arise mainly from synergistic rhizosphere metabolite–transcriptome interactions. Field comparisons between monoculture and intercropped sugarcane reveal notable differences in endogenous metal content, metabolite profiles, and gene expression, and demonstrate close links between metabolite diversity, metal composition, and transcriptional activity. Transcriptomic and metabolic processes notably affect plant development by regulating hormone precursors, metal ion balance, signaling components, and transport proteins. Experiments further confirm that certain metabolites and DEGs promote growth and material transport in sugarcane by shaping metal and hormonal composition.
These results emphasize the role of metabolite–transcriptome coordination in increasing intercropping yield, providing practical insights for agriculture. The study supports the use of targeted metals, metabolites, or genetic approaches to improve crop performance.

Supplementary Materials

The following supporting information can be downloaded at: https://www.mdpi.com/article/10.3390/agronomy15112510/s1, Figure S1: Schematic Diagrams of Sugarcane Intercropped with Peanut and Monoculture Sugarcane. A. Illustrates the Intercropping System of Sugarcane and Peanut. B. Depicts the Monocropping System of Sugarcane. Table S1: A. Changes in metabolite contents across different planting modes. B. Relative Abundance (%) of Metabolite Classifications Across Groups. Table S2: A. Overview of the sequencing. B. Unigene information annotated in different database. C. Number of differential genes annotated by KEGG pathway. Table S3: GO Analysis of the Most Significantly Upregulated and Downregulated DEGs (FDR < 0.05). Table S4: KEGG enrichment analysis of DEGs under different cropping systems. Table S5: A. Comparison of hormone contents under different planting modes. B. Differences in Endogenous Hormones in Different Parts of Sugarcane under Different Cultivation Conditions.

Author Contributions

S.C.: writing—original draft, data curation, Investigation, Methodology, Visualization. X.G. and X.W.: Writing—review and editing. T.L. writing—review, editing and software. Y.Z., T.W. and P.L.: Methodology, Visualization, Analysis data. Z.Y. and Z.P.: Funding acquisition, Resources. Z.P.: Supervision, Methodology, Investigation, Project administration. All authors have read and agreed to the published version of the manuscript.

Funding

This work was supported by “Pioneer” and “Leading Goose” R&D Program of Zhejiang (Grants No. 2024SSYS0103), the China Postdoctoral Science Foundation under (Grant No. 2025M774007), the Innovation Team Basic Research Project of Zhejiang (2023R01009), and this work was supported by the Key Scientific Research Projects of Xianghu Laboratory (Grants No. 2023C4S02001).

Data Availability Statement

The original data presented in the study are openly available in NCBI at https://www.ncbi.nlm.nih.gov/bioproject/PRJNA974890 (accessed on 26 July 2024).

Conflicts of Interest

The authors declare that they have no competing interests.

References

  1. Li, K.; Zhao, M.; Li, Y.; He, Y.; Han, X.; Ma, X.; Ma, F. Spatiotemporal Trends of the Carbon Footprint of Sugar Production in China. Sustain. Prod. Consum. 2024, 46, 502–511. [Google Scholar] [CrossRef]
  2. Brobbey, M.S.; Louw, J.; Görgens, J.F. Biobased propylene glycol production in a sugarcane biorefinery through lactic acid, glycerol, or sorbitol: A techno-economic and environmental evaluation of intermediates and downstream processing methods. Biochem. Eng. J. 2024, 205, 109292. [Google Scholar] [CrossRef]
  3. Islam, M.N.; Liza, A.A.; Dey, M.; Das, A.K.; Faruk, M.O.; Khatun, M.L.; Ashaduzzaman, M.; Xi, X. Bio-based composites from bagasse using carbohydrate enriched cross-bonding mechanism: A formaldehyde-free approach. Carbohydr. Polym. Technol. Appl. 2024, 7, 100467. [Google Scholar] [CrossRef]
  4. Ortiz, I.; Valdez-Vazquez, I.; Hernandez-Vazquez, A.; Olivares-Hernández, R.; Carillo- Reyes, J.; Alatriste-Mondragón, F.; Buitrón, G.; Razo-Flores, E. Process design and economic evaluation for methane and electricity production from Agave bagasse using different pretreatments. Energy Convers. Manag. 2024, 306, 118319. [Google Scholar] [CrossRef]
  5. Liu, J.; Yu, X.; Ma, J.; Deng, K.; Feng, X.; Zheng, J.; Fan, Y. Effects of replacing corn straw silage with sugarcane tip silage on growth performance, digestion and metabolism and meat quality of Hu sheep. J. Nanjing Agric. Univ. 2024, 47, 351–358. [Google Scholar]
  6. He, N.; Tian, Z.; Wang, W.; Huan, Q.; Jin, H.; Bai, S. Application of Sugarcane Biomass Carbon in Interface Solar Seawater Desalination. J. S. China Norm. Univ. Nat. Sci. Ed. 2024, 56, 44–52. [Google Scholar]
  7. Sherpa, S.W.; Ponnuchamy, M.; Kapoor, A.; Jacob, M.M.; Sivaraman, P. Facile removal of sulfamethoxazole antibiotic from contaminated water using bagasse-derived pyrolytic biocarbon: Parametric assessment, mechanistic insights and scale-up analysis. J. Water Process Eng. 2024, 60, 105110. [Google Scholar] [CrossRef]
  8. Liu, C.; Lu, K.; Wu, Z.; Liu, X.; Grag, A.; Qin, Y.; Mei, G.; Lv, C. Expansive soil improvement using industrial bagasse and low-alkali ecological cement. Constr. Build. Mater. 2024, 423, 135806. [Google Scholar] [CrossRef]
  9. Arafat, Y.; Shah, A.; Din, I.U.; Jamal, M.; Shah, M.; Kuchkarova, N.; Lin, W.; Lin, S.; Shao, H. Root interactions in wheat/fababean intercropping system enhanced growth performance and yield. Rhizosphere 2025, 33, 101007. [Google Scholar] [CrossRef]
  10. Sun, Y.; Wu, Z.; Hu, F.; Fan, H.; He, W.; Zhao, L.; Guo, C.; Bao, X.; Chai, Q.; Zhao, C. Maize and Pea Root Interactions Promote Symbiotic Nitrogen Fixation, Thereby Accelerating Nitrogen Assimilation and Partitioning in Intercropped Pea. Agronomy 2025, 15, 1615. [Google Scholar] [CrossRef]
  11. Xue, Y.; Xia, H.; Christie, P.; Zhang, Z.; Li, L.; Tang, C. Crop acquisition of phosphorus, iron and zinc from soil in cereal/legume intercropping systems: A critical review. Ann. Bot. 2016, 117, 363–377. [Google Scholar] [CrossRef]
  12. Zhang, L.; Tang, L.; Dong, Y.; Zheng, Y. Nitrogen Absorption of Crops Affected by Root Interaction in Maize and Soybean Intercropping. J. Yunnan Agric. Univ. Nat. Sci. 2016, 31, 1111–1119. [Google Scholar] [CrossRef]
  13. Lv, T.; Zhan, C.; Pan, Q.; Xu, H.; Fang, H.; Wang, M.; Matsumoto, H. Plant pathogenesis: Toward multidimensional understanding of the microbiome. iMeta 2023, 2, e129. [Google Scholar] [CrossRef] [PubMed]
  14. Wang, Z.; Song, Y. Toward understanding the genetic bases underlying plant-mediated “cry for help” to the microbiota. iMeta 2022, 1, e8. [Google Scholar] [CrossRef]
  15. Gao, Y.; Peng, K.; Bai, D.; Bai, X.; Bi, Y.; Chen, A.; Chen, B.; Chen, F.; Chen, J.; Chen, L.; et al. The Microbiome Protocols eBook initiative: Building a bridge to microbiome research. iMeta 2024, 3, e182. [Google Scholar] [CrossRef]
  16. Fallaj, N.; Pang, Z.; Zhou, Y.; Yuan, Z.; Lin, W. Sugarcane-peanut intercropping stimulatory effects on arbuscular mycorrhizal and entomopathogenic fungi promote soil health and crop productivity. Field Crops Res. 2023, 303, 109110. [Google Scholar] [CrossRef]
  17. Yuan, Z.; Liu, Q.; Pang, Z.; Fallah, N.; Liu, Y.; Hu, C.; Lin, W. Sugarcane Rhizosphere Bacteria Community Migration Correlates with Growth Stages and Soil Nutrient. Int. J. Mol. Sci. 2022, 23, 10303. [Google Scholar] [CrossRef]
  18. Singh, S.R.; Yadav, P.; Singh, D.; Shukla, S.K.; Tripathi, M.K.; Bahadur, L.; Mishra, A.; Kumar, S. Intercropping in Sugarcane Improves Functional Diversity, Soil Quality and Crop Productivity. Sugar Tech. 2021, 23, 794–810. [Google Scholar] [CrossRef]
  19. Cai, D.; Zhao, L.; Ren, Y. Effect of root separation on yield and interspecific competition in maize/soybean intercrops. J. Baoji Univ. Arts Sci. Nat. Sci. 2023, 43, 53–59. [Google Scholar] [CrossRef]
  20. Martin, L.B.B.; Fei, Z.; Giovannoni, J.J.; Rose, J.K.C. Catalyzing plant science research with RNA-seq. Front. Plant Sci. 2013, 4, 66. [Google Scholar] [CrossRef] [PubMed]
  21. Li, W.; Jiang, T. Transcriptome assembly and isoform expression level estimation from biased RNA-Seq reads. Bioinformatics 2012, 28, 2914–2921. [Google Scholar] [CrossRef]
  22. Aguirre-Noyola, J.L.; Rosenblueth, M.; Santiago-Martínez, M.G.; Martínez, R.E. Transcriptomic Responses of Rhizobium phaseoli to Root Exudates Reflect Its Capacity to Colonize Maize and Common Bean in an Intercropping System. Front. Microbiol. 2021, 12, 740818. [Google Scholar] [CrossRef]
  23. Dai, J.; Qiu, W.; Wang, N.; Nakanishi, H.; Zuo, Y. Comparative transcriptomic analysis of the roots of intercropped peanut and maize reveals novel insights into peanut iron nutrition. Plant Physiol. Biochem. 2018, 127, 516–524. [Google Scholar] [CrossRef]
  24. Ma, C.; Feng, Y.; Wang, J.; Zheng, B.; Wang, X.; Jiao, N. Integrative Physiological, Transcriptome, and Proteome Analyses Provide Insights into the Photosynthetic Changes in Maize in a Maize—Peanut Intercropping System. Plants 2024, 13, 65. [Google Scholar] [CrossRef]
  25. He, F.; Li, C.; Faisal, S.; Liu, F.; Duan, Y.; Wang, M.; Ruan, J.; Wei, M.; Jiang, H.; Ma, X. Transcriptome Analysis of Amorphophallus konjac with Different Root Barriers. Acta Agric. Boreali-Sin. 2023, 38, 65–74. [Google Scholar]
  26. Pu, L.; Mei, X.; Zhan, F.; Zu, Y.; Li, Y. Transcriptome Analysis of the Root of Sonchus asper under Cadmium and Lead Stress in the Intercropping System with RNA-Seq. J. Yunnan Agric. Univ. Nat. Sci. 2018, 33, 324–333. [Google Scholar]
  27. Liu, B.; Li, R.; Xu, W.; Zhang, Y.; Wng, G.; Tao, L.; Zhan, X.; Li, Z. Determination of five endogenous hormones in Zizania caduciflora by ultra-high performance liquid chromatography-tandem mass spectrometry. Agrochemicals 2022, 61, 280–284. [Google Scholar] [CrossRef]
  28. Xu, Z.; Jin, G.; Wu, T.; Wang, Y.; Chen, Y.; Kan, S. Determination of plant endogenous hormones in Scutellaria by high-performance liquid chromatography-mass spectrometry. Text. Aux. 2023, 40, 51–56. [Google Scholar]
  29. Yi, Y.; Tang, X.; Lin, X.; Liu, Y.; Lin, L.; Xu, C. Determination of 4 Kind of Plant Hormones in Sargassum by Ultra Performance Liquid Chromatography Tandem Mass Spectrometry. Chin. J. Anal. Chem. 2016, 44, 124–130. [Google Scholar]
  30. Zhao, Y.; Wang, Y.; Liu, H.; Wu, H.; Zou, D. Simultaneous Determination of Five Endogenous Plant Hormones in Lettuce Leaves by Ultra-Performance Liquid Chromatography Tandem Mass Spectrometry (UPLC-MSMS). North. Hortic. 2021, 16, 8–15. [Google Scholar]
  31. Zhong, D.; Ding, M.; Tang, F.; Mo, R.; Teng, Y. Simultaneous Determination of Four Endogenous Plant Hormones in Phyllostachys heterocycla cv pubescens Shoots by High-Performance Liquid Chromatography-Tandem Mass Spectrometry (HPLC-MSMS). Chin. J. Anal. Chem. 2013, 41, 1739–1743. [Google Scholar]
  32. Kim, D.; Langmead, B.; Salzberg, S.L. HISAT: A fast spliced aligner with low memory requirements. Nat. Methods 2015, 12, 357–360. [Google Scholar] [CrossRef] [PubMed]
  33. Pertea, M.; Pertea, G.M.; Antonescu, C.M.; Chang, T.C.; Mendell, J.T.; Salzberg, S.L. StringTie enables improved reconstruction of a transcriptome from RNA-seq reads. Nat. Biotechnol. 2015, 33, 290–295. [Google Scholar] [CrossRef] [PubMed]
  34. Buchfink, B.; Xie, C.; Huson, D.H. Fast and sensitive protein alignment using DIAMOND. Nat. Methods 2015, 12, 59–60. [Google Scholar] [CrossRef]
  35. Deng, Y.; Li, J.; Wu, S.; Zhu, Y.; Chen, Y.; He, F. Integrated nr Database in Protein Annotation System and Its Localization. Comput. Eng. 2006, 32, 71–73. [Google Scholar]
  36. Apweiler, R.; Bairoch, A.; Wu, C.H.; Barker, W.C.; Boeckmann, B.; Ferro, S.; Gasteiger, E.; Huang, H.; Lopez, R.; Magrane, M.; et al. UniProt: The Universal Protein knowledgebase. Nucleic Acids Res. 2004, 32, D115–D119. [Google Scholar] [CrossRef]
  37. Tatusov, R.L.; Galperin, M.Y.; Natale, D.A.; Koonin, E.V. The COG database: A tool for genome-scale analysis of protein functions and evolution. Nucleic Acids Res. 2000, 28, 33–36. [Google Scholar] [CrossRef]
  38. Koonin, E.V.; Fedorova, N.D.; Jackson, J.D.; Jacobs, A.R.; Krylov, D.M.; Makarova, K.S.; Mazumder, R.; Mekhedov, S.L.; Nikolskaya, A.N.; Rao, B.S.; et al. A comprehensive evolutionary classification of proteins encoded in complete eukaryotic genomes. Genome Biol. 2004, 5, R7. [Google Scholar] [CrossRef]
  39. Kanehisa, M.; Goto, S.; Kawashima, S.; Okuno, Y.; Hattori, M. The KEGG resource for deciphering the genome. Nucleic Acids Res. 2004, 32, D277–D280. [Google Scholar] [CrossRef]
  40. Jones, P.; Binns, D.; Chang, H.; Fraser, M.; Li, W.; McAnulla, C.; McWilliam, H.; Maslen, J.; Mitchell, A.; Nuka, G.; et al. InterProScan 5: Genome-scale protein function classification. Bioinformatics 2014, 30, 1236–1240. [Google Scholar] [CrossRef]
  41. Ashburner, M.; Ball, C.A.; Blake, J.A.; Botstein, D.; Bulter, H.; Cherry, J.M.; Davis, A.P.; Dolinski, K.; Dwight, S.S.; Sherlock, G. Gene Ontology: Tool for the unification of biology. Nat. Genet. 2000, 25, 25–29. [Google Scholar] [CrossRef]
  42. Eddy, S.R. Profile hidden Markov models. Bioinform. Rev. 1998, 14, 755–763. [Google Scholar] [CrossRef]
  43. Bateman, A.; Birney, E.; Cerruti, L.; Durbin, R.; Etwiller, L.; Eddy, S.R.; Griffiths-Jones, S.; Howe, K.L.; Marshall, M.; Sonnhammer, E.L.L. The Pfam Protein Families Database. Nucleic Acids Res. 2002, 30, 276–280. [Google Scholar] [CrossRef]
  44. Trapnell, C.; Williams, B.A.; Pertea, G.; Mortazavi, A.; Kwan, G.; van-Baren, M.J.; Salzberg, S.L.; Wold, B.J.; Pachter, L. Transcript assembly and quantification by RNA-Seq reveals unannotated transcripts and isoform switching during cell differentiation. Nat. Biotechnol. 2010, 28, 511–515. [Google Scholar] [CrossRef] [PubMed]
  45. Love, M.I.; Huber, W.; Anders, S. Moderated estimation of fold change and dispersion for RNA-seq data with DESeq2. Genome Biol. 2014, 15, 550. [Google Scholar] [CrossRef]
  46. Robinson, M.D.; McCarthy, D.J.; Smyth, G.K. edgeR: A Bioconductor package for differential expression analysis of digital gene expression data. Bioinformatics 2010, 26, 139–140. [Google Scholar] [CrossRef]
  47. Chitkala Devi, T.; Bharathalakshmi, M.; Kumari, M.B.G.S.; Naidu, N.V. Effect of Sources and Levels of Phosphorus with Zinc on Yield and Quality of Sugarcane. Sugar Tech. 2012, 14, 195–198. [Google Scholar] [CrossRef]
  48. Li, Q.; Liu, P.; Zhao, H.; Song, X.; Lin, H.; Shen, Y.; Li, L.; Wan, S. Effects of Maize Root Exudates on Allelopathy of Phenolic Acids in Soil of Continuous Cropping Peanut. J. Agric. Sci. Technol. 2020, 22, 119–130. [Google Scholar] [CrossRef]
  49. Zhou, X.; Zhang, J.; Rahman, M.K.U.; Gao, D.; Wei, Z.; Wu, F.; DiniAndreote, F. Interspecific plant interaction via root exudates structures the disease suppressiveness of rhizosphere microbiomes. Mol. Plant 2023, 16, 849–864. [Google Scholar] [CrossRef] [PubMed]
  50. Yu, P.; He, X.; Baer, M.; Beirinckx, S.; Tian, T.; Moya, Y.A.T.; Zhang, X.; Deichmann, M.; Frey, F.P.; Bresgen, V.; et al. Plant flavones enrich rhizosphere Oxalobacteraceae to improve maize performance under nitrogen deprivation. Nat. Plants 2021, 7, 481–499. [Google Scholar] [CrossRef] [PubMed]
  51. Jiang, P.; Wang, Y.; Zhang, Y.; Fei, J.; Rong, X.; Peng, J.; Yin, L.; Luo, G. Intercropping enhances maize growth and nutrient uptake by driving the link between rhizosphere metabolites and microbiomes. New Phytol. 2024, 243, 1506–1521. [Google Scholar] [CrossRef]
  52. Yan, Z.; Wang, D.; Ding, L.; Cui, H.-Y.; Jin, H.; Yang, X.; Yang, J.; Qin, B. Mechanism of artemisinin phytotoxicity acton: Induction of reactive oxygen species and cell death in lettuce seedlings. Plant Physiol. Biochem. 2015, 88, 53–59. [Google Scholar] [CrossRef]
  53. Deng, J.; Guo, J.; Qin, W.; Chen, J.; He, Y.; Zhang, Q.; Vanholme, B.; Yang, W.; Liu, J. Shading stress promotes lignin biosynthesis in soybean seed coat and consequently extends seed longevity. Int. J. Biol. Macromol. 2025, 298, 139913. [Google Scholar] [CrossRef] [PubMed]
  54. Gao, H.; Zhang, C.; van der Werf, W.; Ning, P.; Zhang, Z.; Wan, S.; Zhang, F. Intercropping modulates the accumulation and translocation of dry matter and nitrogen in maize and peanut. Field Crops Res. 2022, 284, 108561. [Google Scholar] [CrossRef]
  55. Leister, D.; Wang, L.; Kleine, T. Organellar Gene Expression and Acclimation of Plants to Environmental Stress. Front. Plant Sci. 2017, 8, 387. [Google Scholar] [CrossRef]
  56. Pang, Z.; Fallah, N.; Weng, P.; Zhou, Y.; Tang, X.; Tayyab, M.; Liu, Y.; Liu, Q.; Xiao, Y.; Hu, C.; et al. Sugarcane-Peanut Intercropping System Enhances Bacteria Abundance, Diversity, and Sugarcane Parameters in Rhizospheric and Bulk Soils. Front. Microbiol. 2022, 12, 815129. [Google Scholar] [CrossRef]
  57. Shukla, S.K.; Sharma, L.; Jaiswal, V.P.; Dwivedi, A.P.; Yadav, S.K.; Pathak, A.D. Diversification Options in Sugarcane-Based Cropping Systems for Doubling Farmers’ Income in Subtropical India. Sugar Tech. 2022, 24, 1212–1229. [Google Scholar] [CrossRef] [PubMed]
  58. Viaud, P.; Heuclin, B.; Letourmy, P.; Christina, M.; Versini, A.; Mansuy, A.; Chetty, J.; Naudin, K. Sugarcane yield response to legume intercropped: A meta-analysis. Field Crops Res. 2023, 295, 108882. [Google Scholar] [CrossRef]
  59. Mathieu, L.; Ballini, E.; Morel, J.; Méteignier, L. The root of plant-plant interactions Belowground special cocktails. Curr. Opin. Plant Biol. 2024, 80, 102547. [Google Scholar] [CrossRef] [PubMed]
  60. Zhou, J.; Chen, S.; Shi, W.; Davd, S.R.; Li, S.; Yang, F.; Lin, Z. Transcriptome profiling reveals the effects of drought tolerance in Giant Juncao. BMC Plant Biol. 2021, 21, 2. [Google Scholar] [CrossRef]
  61. Wen, B.; Peng, X.; Tian, J.; Wu, Q.; Wang, H.; Tang, X. Cloning and expression of the FrWRKY28 gene from Fagopyrum tataricum under low phosphorus and hormone treatment. Acta Bot. Boreali-Occident. Sin. 2024, 44, 930–937. [Google Scholar]
  62. Lei, L.; Zhu, Q.; Xu, P.; Jing, Y. The intercropping and arbuscular mycorrhizal fungus decrease Cd accumulation in upland rice and improve phytoremediation of Cd-contaminated soil by Sphagneticola calendulacea (L.) Pruski. J. Environ. Manag. 2021, 298, 113516. [Google Scholar] [CrossRef] [PubMed]
  63. Jia, Z.; Giehl, R.F.H.; von Wire N, N. Nutrient-hormone relations Driving root plasticity in plants. Mol. Plant 2021, 15, 86–103. [Google Scholar] [CrossRef]
  64. Pan, Y.; Cheng, S. Research Progress on Oat Genomics Study. J. Plant Genet. Resour. 2021, 22, 304–308. [Google Scholar] [CrossRef]
  65. Cai, J.; Wang, Q.; Wu, Y.; Liu, H.; Zhu, C. Effects of phytohormone on tomato root growth under aluminum stress. J. Anhui Sci. Technol. Univ. 2024, 38, 39–46. [Google Scholar] [CrossRef]
  66. Ding, Z.; Fu, L.; Chen, G.; Yan, Y.; Tie, W.; Meng, X.; Yang, J.; Qiu, X.; Zhang, J.; Hu, W. Coordinated transcriptional regulation of carbohydrate-related pathways contributes to the difference of starch accumulation between starchy cassava and sugary cassava. Carbohydr. Polym. 2025, 354, 123314. [Google Scholar] [CrossRef]
  67. Mendes, J.O.T.; Ribeiro, P.R.; Sfor ç a, M.L.; Rocco, S.A.; Ferraz, C.G. Foliar application of gallic acid improves tolerance to cadmium stress in wheat: An NMR-based metabolomics approach. Plant Physiol. Biochem. 2025, 229, 110405. [Google Scholar] [CrossRef]
  68. Tsavkelova, E.; Oeser, B.; Oren-young, L.; Israeli, M.; Sasson, Y.; Tudzynski, B.; Sharon, A. Identification and functional characterization of indole-3-acetamide-mediated IAA biosynthesis in plant-associated Fusarium species. Fungal Genet. Biol. 2012, 49, 48–57. [Google Scholar] [CrossRef]
  69. Fang, Z.; Yang, Q.; Xie, J.; Du, S. The role and mechanism of cytokinin in phytoremediation of heavy metal contaminated soil. Acta Ecol. Sin. 2022, 42, 3056–3065. [Google Scholar] [CrossRef]
  70. Cui, S.; Zhang, Z.; Fu, X.; Liu, J.; Yang, H. Key Genes in Response to Drought Stress in Plant Hormone Signal Transduction Pathway of Oat. J. Triticeae Crops 2023, 43, 1384–1393. [Google Scholar]
  71. Feng, X.; Xu, Y.; Peng, L.; Yu, X.; Zhao, Q.; Feng, S.; Zhao, Z.; Li, F.; Hu, B. TaEXPB7-B, a beta-expansin gene involved in low-temperature stress and abscisic acid responses, promotes growth and cold resistance in Arabidopsis thaliana. J. Plant Physiol. 2019, 240, 153004. [Google Scholar] [CrossRef]
  72. Pirona, R.; Frugis, G.; Locatelli, F.; Mattana, M.; Genga, A.; Baldoni, E. Transcriptomic analysis reveals the gene regulatory networks involved in leaf and root response to osmotic stress in tomato. Front. Plant Sci. 2023, 14, 1155797. [Google Scholar] [CrossRef]
  73. Ueno, D.; Yamaji, N.; Kono, I.; Huang, C.; Ando, T.; Yano, M.; Ma, J. Gene limiting cadmium accumulation in rice. Proc. Natl. Acad. Sci. USA 2010, 107, 16500–16505. [Google Scholar] [CrossRef]
  74. Hänsch, R.; Mendel, R.R. Physiological functions of mineral micronutrients (Cu, Zn, Mn, Fe, Ni, Mo, B, Cl). Curr. Opin. Plant Biol. 2009, 12, 259–266. [Google Scholar] [CrossRef] [PubMed]
  75. Yang, Z.; Zhu, Q.; Zhang, Y.; Jiang, P.; Wang, Y.; Fei, J.; Rong, X.; Peng, J.; Wei, X.; Luo, G. Soil carbon storage and accessibility drive microbial carbon use efficiency by regulating microbial diversity and key taxa in intercropping ecosystems. Biol. Fert. Soils 2024, 60, 437–453. [Google Scholar] [CrossRef]
  76. Li, Y.; Yu, C.; Cheng, X.; Li, C.; Sun, J.; Zhang, F.; Lambers, H.; Li, L. Intercropping alleviates the inhibitory effect of N fertilization on nodulation and symbiotic N2 fixation of faba bean. Plant Soil 2009, 323, 295–308. [Google Scholar] [CrossRef]
  77. Bian, F.; Zhang, X.; Li, Q.; Huang, Z.; Zhong, Z. Enhancement of Phytoremediation of Heavy Metal Pollution Using an Intercropping System in Moso Bamboo Forests: Characteristics of Soil Organic Matter and Bacterial Communities. Forests 2023, 14, 1895. [Google Scholar] [CrossRef]
  78. Kama, R.; Liu, Y.; Zhao, S.; Hamani, A.K.M.; Song, J.; Cui, B.; Aidara, M.; Liu, C.; Li, Z. Combination of intercropping maize and soybean with root exudate additions reduces metal mobility in soil-plant system under wastewater irrigation. Ecotoxicol. Environ. Saf. 2023, 266, 115549. [Google Scholar] [CrossRef] [PubMed]
  79. Wang, L.; Zhou, T.; Cheng, B.; Du, Y.; Qin, S.; Gao, Y.; Xu, M.; Lu, J.; Liu, T.; Li, S.; et al. Variable Light Condition Improves Root Distribution Shallowness and P Uptake of Soybean in Maize/Soybean Relay Strip Intercropping System. Plants 2020, 9, 1204. [Google Scholar] [CrossRef]
  80. Ulloa-Inostroza, E.M.; Córdova, C.; Campos, M.; Reyes Díaz, M. Methyl Jasmonate Improves Antioxidants, Protecting Photosynthetic Apparatus in Blueberry Plants under Water Deficit. Horticulturae 2024, 10, 259. [Google Scholar] [CrossRef]
  81. Andersen, I.K.L.; Dragsted, L.O.; Rasmussen, J.; Fomsgaard, I.S. Intercropping of Hordeum vulgare L. and Lupinus angustifolius L. causes the generation of prenylated flavonoids in Lupinus angustifolius L. J. Plant Interact. 2023, 18, 2255039. [Google Scholar] [CrossRef]
  82. Vacheron, J.; Desbrosses, G.; Bouffaud, M.; Touraine, B.; Moënne-Loccoz, Y.; Muller, D.; Legrndre, L.; Wisniewski-Dyé, F.; Prigent-Combaret, C. Plant growth-promoting rhizobacteria and root system functioning. Front. Plant Sci. 2013, 4, 356. [Google Scholar] [CrossRef] [PubMed]
  83. Li, A.; Wu, Q.; Yang, S.; Liu, J.; Zhao, Y.; Zhao, P.; Wang, L.; Lu, W.; Huang, D.; Zhang, Y.; et al. Dissection of genetic architecture for desirable traits in sugarcane by integrated transcriptomics and metabolomics. Int. J. Biol. Macromol. 2024, 280, 136009. [Google Scholar] [CrossRef]
  84. Clemens, S.; Aarts, M.G.M.; Thomine, S.B.; Verbruggen, N. Plant science: The key to preventing slow cadmium poisoning. Trends Plant Sci. 2013, 18, 92–99. [Google Scholar] [CrossRef] [PubMed]
  85. Shah, S.A.; Mishra, A.K.; Rehaman, A.; Gandhi, S.G.; Jan, A.T. Nitric oxide in plant stress: Rewilding and restoring signaling for enhancing plant growth and development. Biochim. Biophys. Acta 2025, 1869, 130837. [Google Scholar] [CrossRef]
  86. Maathuis, F.J. Physiological functions of mineral macronutrients Frans JM Maathuis. Curr. Opin. Plant Biol. 2009, 12, 250–258. [Google Scholar] [CrossRef]
  87. Sinclair, S.A.; Krämer, U. The zinc homeostasis network of land plants. Biochim. Biophys. Acta 2012, 18223, 1553–1567. [Google Scholar] [CrossRef]
  88. Somanath, N.; Singh, S.Y.; Radha, P.; Sunil, M.; Shamima, P.; Kirttiranjan, B.; Sreenivasa, R.K. Soil and foliar application of Zn enhances its biofortification, bioavailability and productivity in both biofortified and non-biofortified wheat varieties. J. Food Compos. Anal. 2023, 124, 105691. [Google Scholar] [CrossRef]
  89. Singh, T.; Saffeullah, P.; Umar, S. Foliar application of zinc oxide (ZnO) nanoparticles ameliorates growth, yield traits, osmolytes, cell viability, and antioxidant system of Brassica juncea (L.) Czern, grown in lead (Pb) stress. Chemosphere 2025, 370, 143950. [Google Scholar] [CrossRef] [PubMed]
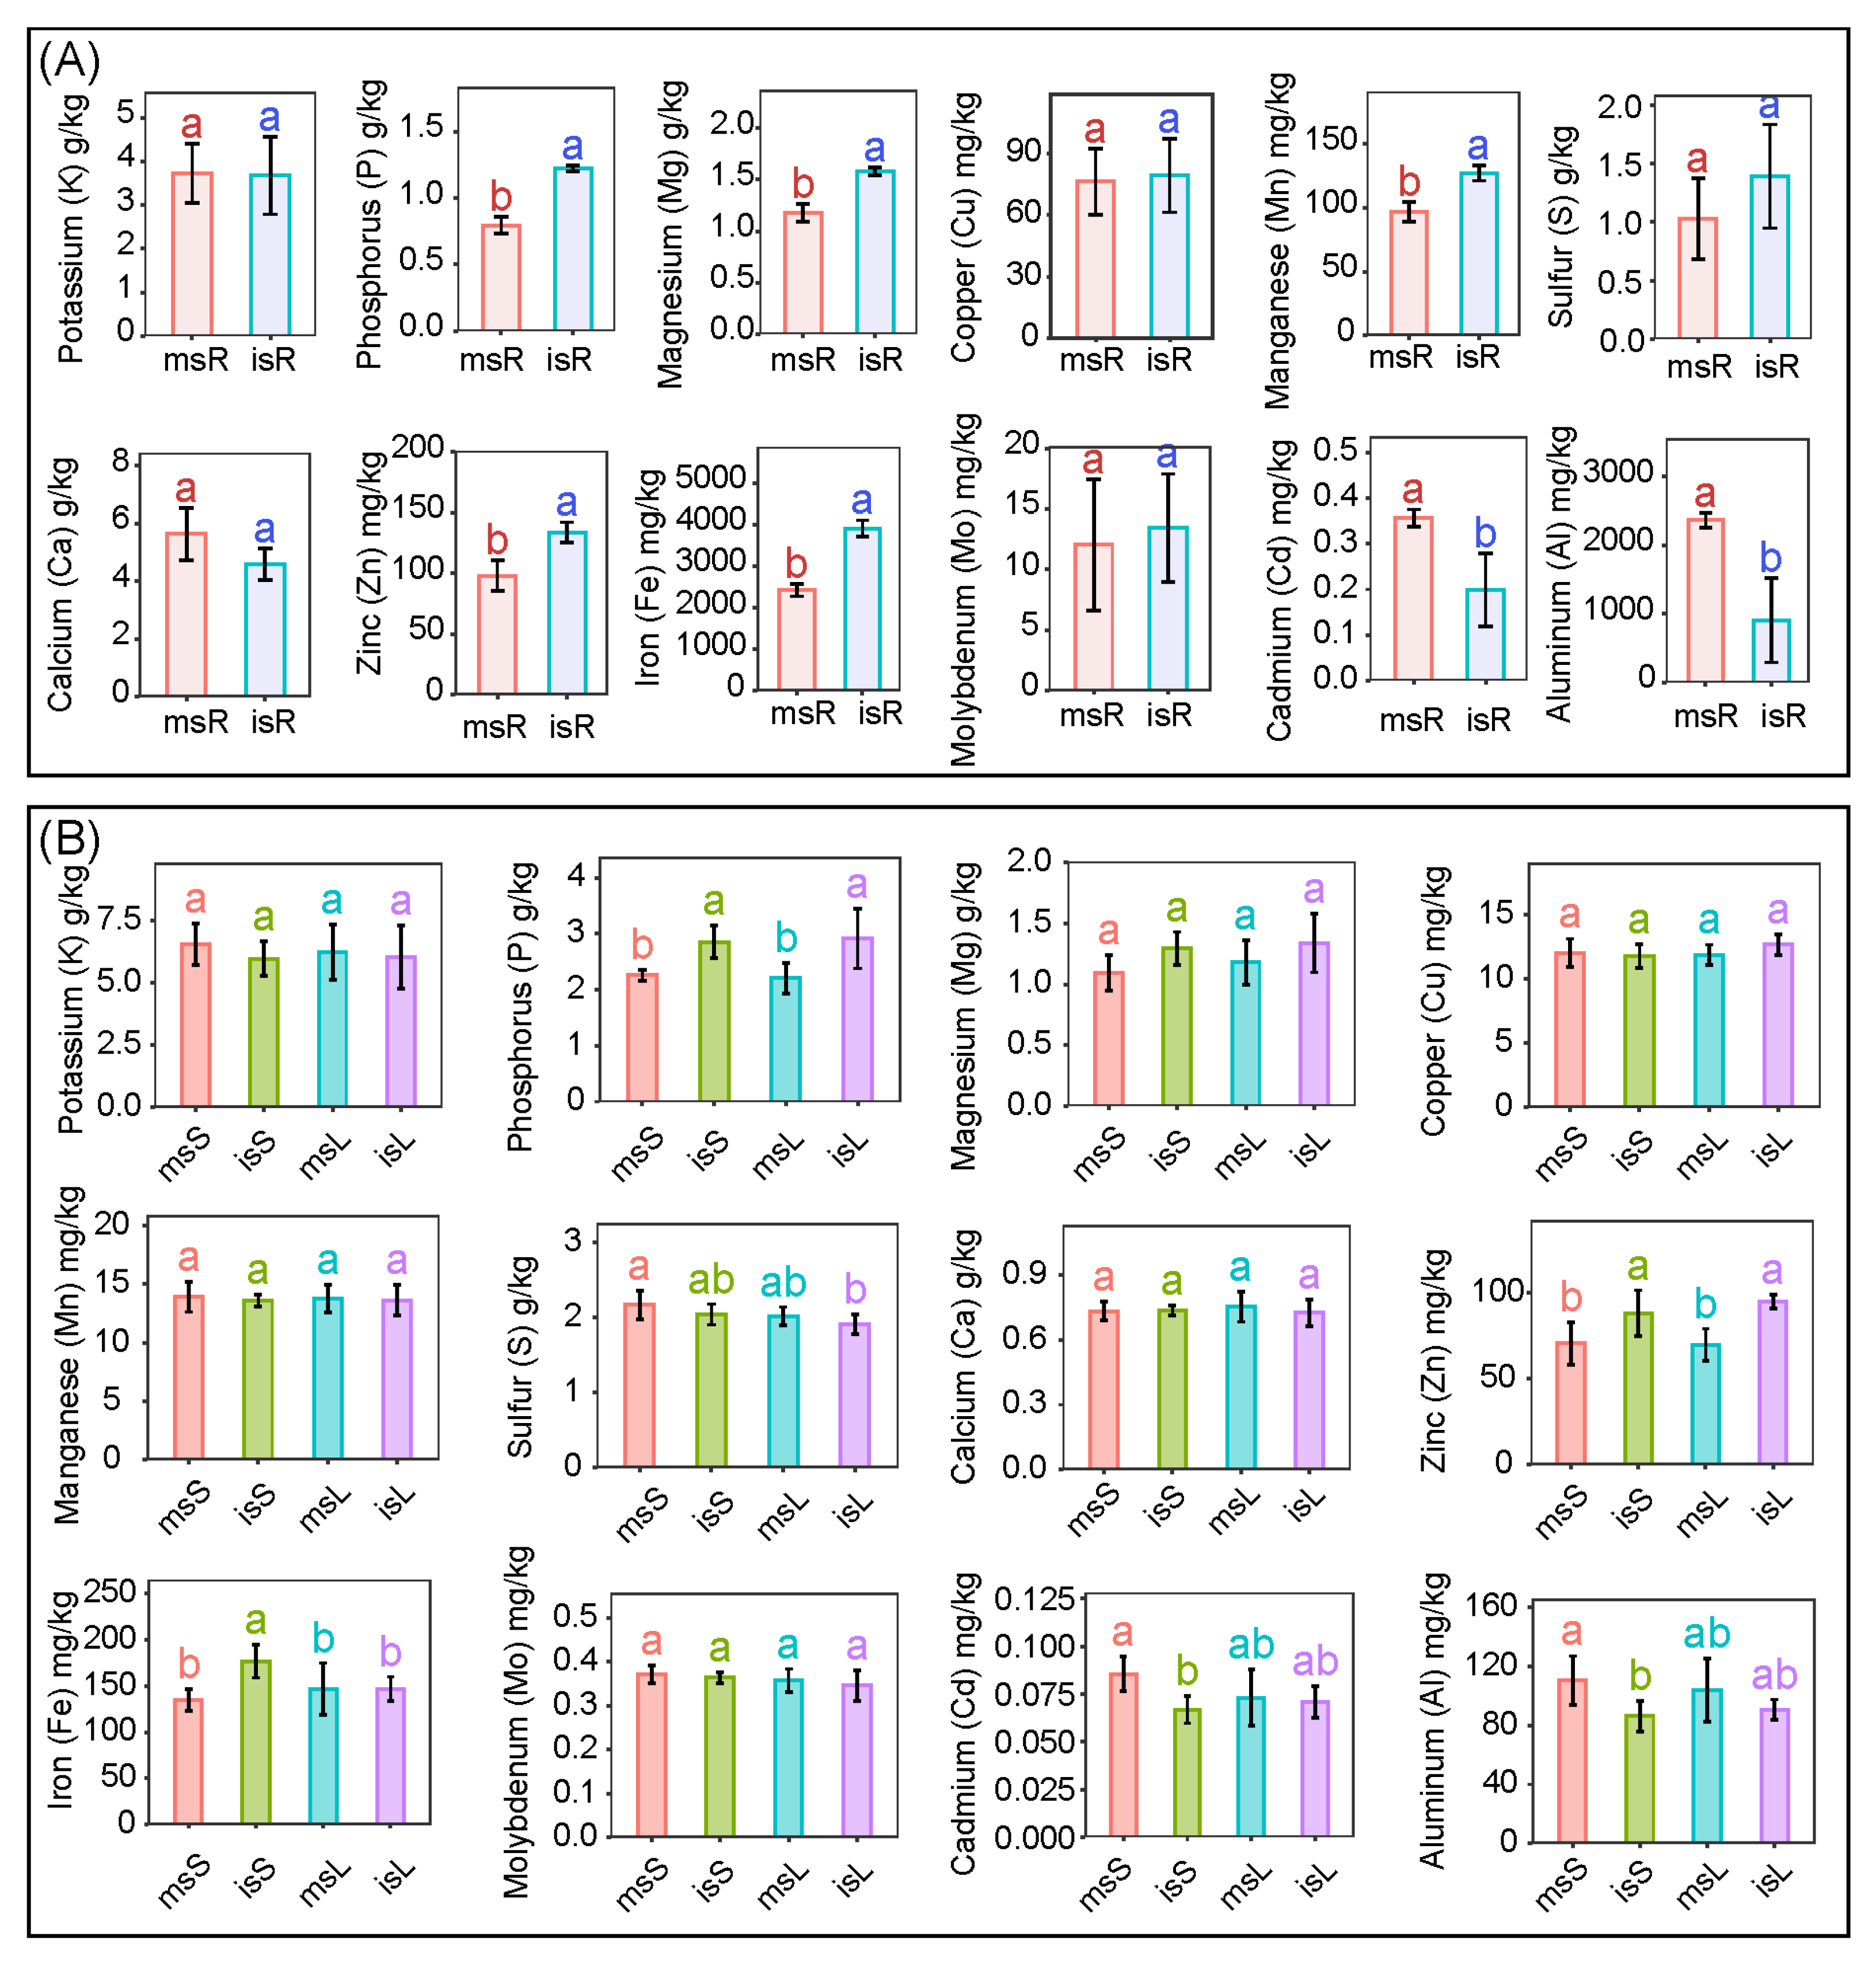
Figure 1. Comparison of Different Metal Content Data Across Samples. (A) Comparison of Different Metal Content Data Across Roots. (B) Comparison of Different Metal Content Data Across Steams and Leaves. m: Monoculture, i: Intercropping, s: Sugarcane, R: Root, S: Stem, L: Leaf. Different lowercase letters represent significant differences (p < 0.05).
Agronomy 15 02510 g001
Figure 2. Changes in the metabolic composition of sugarcane roots, stems, and leaves under different planting conditions. (A) Principal Coordinate Analysis (PCoA) of metabolites from all samples of sugarcane roots, stems, and leaves under monoculture and intercropping conditions. The top right corner of the figure explains the significant structural differences in metabolites between groups (Permanova, p-value = 0.001). Different lowercase letters represent significant differences (p < 0.001). (B) The top 15 primary classifications of metabolites based on average abundance within each group, with all other classifications grouped as ‘Others’. (C) Heatmap of metabolite abundance across samples. Each column represents a biological replicate, with the sample name indicating the tissue (R: root, S: stem, L: leaf) and planting pattern (M: monoculture, I: intercropping).
Agronomy 15 02510 g002
Figure 3. Venn diagrams and Manhattan plots reveal the differences in endogenous metabolites in the roots, stems, and leaves of intercropped and monoculture sugarcane. The Manhattan plot demonstrates the results of all differentially expressed metabolites (DEM) in different parts between intercropped and monoculture sugarcane.
Agronomy 15 02510 g003
Figure 4. DEGs in Sugarcane under Different Conditions. (A) Annotation of Unigenes in Different Databases; (B) PCoA Analysis of DEGs in Sugarcane Roots, Stems, and Leaves under Different Cultivation Conditions. Different lowercase letters represent significant differences (p < 0.001).
Agronomy 15 02510 g004
Figure 5. Statistics of upregulated or downregulated DEGs observed between different treatment methods. (A) Statistics of differentially regulated DEGs between treatments within the same tissue. (B) Distribution of DEGs between treatments presented in a Manhattan plot. (C) Overlap of DEGs from intercropping versus monoculture comparisons across tissues.
Agronomy 15 02510 g005
Figure 6. A heatmap reflecting the dynamics of enriched biological processes in the KEGG analysis. Physiological categories associated with intercropping obtained from KEGG enrichment (Table S4). The heatmap includes enriched processes with FDR < 0.05. Red and blue colors represent upregulated and downregulated DEGs, respectively. The intensity of colors reflects the number of DEGs exhibited at each physiological stage.
Agronomy 15 02510 g006
Figure 7. Heatmap of Enrichment Analysis of DEGs Related to Auxin Signal Transduction Pathway. Statistical significance was evaluated using p-values and indicated as follows: * p < 0.05.
Agronomy 15 02510 g007
Figure 8. Module relationship between module traits and metals, and metabolites. The numbers represent the correlation coefficients between modules and agronomic traits, metals, hormones, and metabolites. The number in the bracket means p-value.
Agronomy 15 02510 g008
Figure 9. Statistics on the Measurement Data of Sugarcane Agronomic Traits under Different Treatments. Different lowercase letters represent significant differences (p < 0.05). Statistical significance was evaluated using p-values and indicated as follows: * p < 0.05, ** p < 0.01, and *** p < 0.001.
Agronomy 15 02510 g009
Figure 10. (A) Heatmap of metabolite abundance across samples. (B) Variations in Hormone Composition within Roots, Stems, and Leaves of Sugarcane under Different treatments; CK: control group, Z: zinc treatment, s: sugarcane, R: root, S: stem, L: leaf. Different lowercase letters represent significant differences (p < 0.001).
Agronomy 15 02510 g010
Disclaimer/Publisher’s Note: The statements, opinions and data contained in all publications are solely those of the individual author(s) and contributor(s) and not of MDPI and/or the editor(s). MDPI and/or the editor(s) disclaim responsibility for any injury to people or property resulting from any ideas, methods, instructions or products referred to in the content.