Article

Infection Dynamics of Zarea fungicola and Its Impact on White Button Mushroom Yield

by
Joanna Szumigaj-Tarnowska
*,
Czesław Ślusarski
and
Zbigniew Uliński
Laboratory of Vegetable and Edible Mushroom Cultivation, The National Institute of Horticultural Research, Konstytucji 3 Maja 1/3, 96-100 Skierniewice, Poland
*
Author to whom correspondence should be addressed.
Agronomy 2025, 15(11), 2464; https://doi.org/10.3390/agronomy15112464
Submission received: 29 September 2025 / Revised: 17 October 2025 / Accepted: 22 October 2025 / Published: 23 October 2025
(This article belongs to the Special Issue Research Progress on Pathogenicity of Fungi in Crops—2nd Edition)

Abstract

The ascomycetous fungus, Zarea fungicola (syn. Lecanicillium fungicola), is the most common fungal pathogen of the white button mushroom, Agaricus bisporus. The objective of this study was to assess the impact of the timing and concentration of spore inoculation on the development of dry bubble disease, its progression, and the yield of mushrooms. Experiments included two factors: inoculation timing (at casing, three days after casing (4th day), onset of induction (7th day), primordia formation (12th day), and mixing spores with casing soil) and different inoculum concentrations (105 m−2, 106 m−2, and 107 m−2 casing). The first symptoms of dry bubble appeared at the beginning of the first flush (14–16 days of cultivation) in trials where spore inoculum was applied three days after casing and during the induction phase. In contrast, the longest disease latent period (26–28 days) occurred when spores were mixed with the casing soil. A significant interaction was observed between inoculation timing and spore concentration, which influenced disease incidence and yield. Area under the disease progress curve (AUDPC) analysis indicated the fastest disease progression following inoculation three days after casing (4th day) and at induction phase (7th day). Correspondingly, the highest reductions in yield and biological efficiency were observed at these inoculation timings. In addition, an increase in conidial concentration generally led to more severe disease symptoms. The results indicate that the period from casing application up to the induction phase requires strict hygiene measures, as infection during this time causes the most significant reduction in yields. Furthermore, the stage of mushroom development and inoculum concentration critically determines the severity of dry bubble, providing important guidance for disease management in white button mushroom cultivation.

1. Introduction

Zarea fungicola (Preuss) Khons., Thanakitp. and Luangsa-ard [syn. Lecancillium fungicola (Preuss) Zare and Gams; Verticillium fungicola (Preuss) Hassebrauk; Verticillium malthousei (Preuss) Ware] is the causal agent of dry bubble disease in cultivated mushrooms (Agaricus bisporus (Lange) Imbach), leading to substantial economic losses [1,2,3,4]. There are two varieties of the pathogen: Z. fungicola var. fungicola, which predominates in Europe and Z. fungicola var. aleophilum, common in the USA and Canada [3,5]. The pathogen does not attack vegetative mycelium of A. bisporus [6,7], but can infect small primordia of 1–2 mm in diameter, leading to undifferentiated spherical masses known as dry bubbles. Infections occurring at later stages of mushroom development cause bent or split stipes (blowout) and superficial brown lesions on the sporophores cap. The severity of symptoms depends on the developmental stage at the time of infection, with early infections resulting in the most severe malformations [8,9].
The pathogen is widespread in the natural environment, and its propagules (spores and mycelial fragments) can be introduced into mushroom cultivation via dust, contaminated equipment, water, insect vectors, and human activity [10,11,12]. Mushroom casing, composed of peat and a neutralizing agent such as sugar beet lime, is highly susceptible to spore contamination and is therefore frequently identified as a primary source of Z. fungicola inoculum [13]. However, low moor peat derived from deeper layers does not provide a favorable environment for the development of Z. fungicola, but its spores can survive in moist or dry casing soil for 7–12 months under abiotic stress conditions [3,14]. Spore germination occurs only near the mushroom mycelia after they colonize the casing layer. After spore germination, germ tubes of the pathogen grow along with the hyphae of A. bisporus and the infection process is initiated by Z. fungicola attached to host mycelium [6,10,15,16]. Pathogen infection seems to occur first by adhesion of hydrophobins present in the wall of both fungi. After the initial connection, the pathogen can grow inter- and intracellularly, due to weakening of the cell wall of A. bisporus by the action of lytic enzymes and mechanical pressure of the pathogen [17,18].
Dry bubble infection can potentially occur at any stage of cultivation of the white button mushroom [8,11]. Currently, control of fungal diseases relies mainly on hygiene and cultural practices, as the use of chemical treatments in Poland is limited to a single fungicide, metrafenone [19,20,21,22]. Assessing the effect of infection timing and spore concentration of Z. fungicola on disease severity, beginning of symptoms, infection dynamics, and mushroom yield under controlled conditions is essential for understanding dry bubble epidemiology. Furthermore, understanding the infection dynamics, rapid symptom identification, and appropriate intervention is crucial for improving disease management and optimizing mushroom cultivation practices.
The aim of the study was to evaluate the influence of inoculation timing of white button mushroom crop with spores of Zarea fungicola sp. fungicola and inoculum concentrations on the appearance of the first dry bubble disease symptoms, mushroom yield, and disease progression.

2. Materials and Methods

2.1. Cropping Trials

The experiments were carried under controlled conditions in the mushroom growing chambers using pots with a top diameter of 220 mm, a height of 180 mm, and a bottom diameter of 170 mm (surface area was 0.04 m2). Each pot was filled with 1.7 kg of phase III compost fully colonized with the A. bisporus strain Triple X at the rate of 0.75% (w/w) (Amycel, Vendôme, France). The substrate surface was covered with a 40 mm peat casing layer made of black peat and spent sugar beet lime at the rate of 10% (v/v) (Skierniewice, Poland). During the spawn run in the casing layer, the conditions were maintained as in standard mushroom production, i.e., air temperature was 23–24 °C, carbon dioxide concentration was 3000 ppm, and relative humidity was 95%. After 7 days, when the mycelium reached the casing surface, the temperature was lowered to 18 °C, and the CO2 concentration was reduced to 1000–1200 ppm. This change in environmental parameters induces the reproductive phase of A. bisporus, leading to mushroom production. This stage is referred to as the induction or “shock” phase. These conditions were maintained for a further 6 days until mushroom formation and harvesting began (flushes).
Four replicate pots were prepared for each treatment. Mushrooms were harvested over two flushes, and the yield was calculated as the fresh weight of healthy fruiting bodies (kg m−2).

2.2. Pathogen Inoculation Treatments

An isolate of Zarea fungicola var. fungicola (syn. L. fungicola var. fungicola) CBS 648.80 (1980, Limburg, Horst, The Netherlands) was obtained from the International Culture Collections Centraalbureau voor Schimmelcultures (CBS, Utrecht, The Netherlands) and was used to inoculate casing soil [23]. The isolate was maintained at a concentration of 15% v/w glycerol at a temperature of −75 °C for the longer-term storage. Before cropping experiments, the isolate was grown on PDA medium (Merck, 126 East Lincoln Avenue, Rahway, NJ 07065, USA) at a temperature 23–24 °C.
Spore inoculum was prepared from a seven-day-old pure culture on PDA. The spores were washed with a sterile 0.85% NaCl solution and adjusted to concentrations of 103, 104, and 105 conidia mL−1. The concentration of conidial suspension was determined using a hemocytometer. Once a year, fungal isolates were inoculated on the white button mushroom to enhance their pathogenicity. After symptom development, small pieces of infected A. bisporus tissue were aseptically isolated and placed on PDA. The re-isolated fungi were subcultured and identified based on their morphological characteristics and colony features, confirming their taxonomic identity. Pure cultures were maintained on PDA at 4 °C for further study. Before conducting the infection assays, the isolates were inoculated into the crop to confirm their pathogenicity.
The cultivation of A. bisporus was sprayed with Z. fungicola spores at rates of 1.3 × 10⁷, 1.3 × 10⁶, and 1.3 × 10⁵ spores per m2 of casing surface (5 mL of each suspension m−2). Inoculation was performed at five different times of cultivation: on the first day of casing, three days after casing (4th day), at the beginning of induction phase (7th day), and during primordia formation (12th day). In an additional treatment, 2 L of casing soil was mixed with 5 mL of a spore suspension at three concentrations before being applied onto the mushroom substrate (1st day). The control pots were treated with sterilized water.
The yield of mushrooms was investigated in the first and the second flush to examine the incidence of dry bubble disease. The symptoms of the disease were observed for each treatment. Dry bubble incidence was expressed as “disease points per pot”, corresponding to the total number of disease spots observed on fruiting bodies within a single pot. Each pot was considered as one experimental unit, and all visible lesions characteristic of dry bubble were counted.
At the end of the harvest period, the accumulated data were used to calculate the biological efficiency. The biological efficiency is the ratio of the weight of the fresh fruiting body (g) per dry weight of substrate (g), expressed as a percentage.

2.3. Statistical Analysis

Two independent series of two-factorial experiments (five inoculation times × three spore concentrations + control) were carried out, each with four replications, which resulted in 20 treatments and 80 experimental units per series. Data were subjected to the two-way analysis of variance (ANOVA), using Statistica, version 10.0 software (Statsoft Inc., Tulsa, OK, USA). Means of mushroom yield and biological efficiency were compared by the Newman–Keuls test at a significance level of p = 0.05. To evaluate the impact of two factors (five inoculation times and three spore concentrations) on disease incidence, the two-way analysis of variance was also performed and means were compared by the Newman–Keuls test at a significance level of p = 0.05.
The progress of dry bubble disease was assessed by calculating the area under the disease progress curve (AUDPC), using trapezoidal method, according to the formula [24]:
AUDPC   =   i = 1 n 1 ( y i   + y 1 + 1 2 ) ( t i + 1 + t 1 )
where y i   is the assessment of infection (number of disease points) at ith observation, t i   is the time in days at ith observation and n is the total number of observations.

3. Results

3.1. Symptoms Development

The occurrence of dry bubble disease symptoms varied depending on the timing of inoculation and the concentration of the conidial suspension. Spore inoculation at casing resulted in the development of symptoms after 15–19 days, whereas inoculation three days after casing caused symptoms to develop after 11–14 days. Inoculation during the induction phase or at primordia formation reduced the infection incubation period, with symptoms appearing at 7–12 days, depending on the spore inoculum. The shortest period of symptom disease incubation was seven days, which was recorded when 107 conidia mL−1 were applied at the induction phase. In contrast, the mixing of the spores with the casing layer prior to application resulted in a significant delay in the development of symptoms. In these treatments, the appearance of symptoms occurred after a period of 18–27 days, depending on the spore concentration (Figure 1).
The timing of inoculation and the spore concentration had a significant effect on the dynamics of dry bubble symptom development, as well as on the final crop infection, expressed as the number of disease points per pot (Figure 2). In the experiments, a significant interaction between the studied factors (inoculum concentration and time of inoculation) was observed. At the highest concentration of spores (107 spores m−2), disease severity remained high across all inoculation times, with the exception when inoculum was mixed with casing. At lower concentrations, the development of the disease was significantly influenced by the stage of infection. The application of spores at an early stage, specifically during at casing, 3 days after casing and within the induction phase, was associated with a comparatively lower incidence of disease. However, the inoculation of spores during the formation of primordia, including even low concentrations of conidia, resulted in a significant increase in the severity of the disease.

3.2. Disease Development (AUDPC)

AUDPC values increased in accordance with the inoculum concentration at all variants of infection. The highest disease severity was consistently observed at a concentration of 107 conidia m−2, with a peak exceeding 600 when spores were applied during the induction phase (Figure 3). The progression of dry bubble was significantly slower at a concentration of 106 conidia m−2, and the highest AUDPC value was recorded when spores were inoculated at the time of primordia formation. The lowest AUDPC values were observed at a concentration of 105 conidia m−2 in all treatments, indicating limited disease development. Furthermore, when spores were mixed with casing soil, AUDPC values were significantly reduced at all inoculum concentrations. The phase of pin formation was a particularly sensitive stage in the infection process. It was observed that even low inoculum levels (105 spores m−2) caused a visible increase in disease severity in comparison with other inoculation timings.

3.3. Disease Influence on the Mushroom Yield and Biological Efficiency

The effects of Z. fungicola inoculation timing and conidial concentration on the yield and biological efficiency (BE) of A. bisporus over two flushes in two experiments are presented in Table 1 and Table 2. In the control trials, the range of yield was from 15.9 to 17.2 kg m−2 in the first experiment and from 15.2 to 16.2 kg m−2 in the second. At the highest inoculum level (107 spores m−2), yields decreased to 2.1–11.2 kg m−2 in the first experiment and 2.0–11.3 kg m−2 in the second, depending on the time of inoculation. Mushroom yield at a spore concentration of 105 m−2 exhibited variation between 13.4 and 16.9 kg m−2 in the first experiment, and was significantly lower than in the control, except when inoculation occurred during the induction phase. In the second experiment, at the same spore concentration, the yield of mushrooms was not different from the control. Furthermore, at lower spore concentrations tested, yield was significantly reduced in all trials, and the highest values were recorded when inoculation occurred during the primordia formation stage. The lowest mean of yields was observed in the trails when spores were applied three days after casing (10.8 and 10.1 kg m−2) and at the induction phase (11.0 and 9.7 kg m−2). The inoculation of spores at the formation of pins resulted in the lowest mean reduction in yields (13.7 and 13.3 kg m−2), which remained relatively stable across different inoculum concentrations.
Mushroom yield reduction showed a strong dependence on spore concentration, increasing with higher inoculum levels. As demonstrated in Table 1 and Table 2, the yield loss was the highest at a level of 107 spores per m2, i.e., 63.9% and 59.4%, in experiments 1 and 2, respectively, while the lowest yield loss amounted to 13.5% and 10.4% at 105 spores per m2. Furthermore, the timing of inoculation had a significant impact on yield loss, with the highest levels observed when spore inoculation occurred during the induction phase and three days after casing. The data also revealed a significant interaction between spore concentration and inoculation timing, indicating that the degree of yield loss was influenced by both factors.
The data for BE% was analogous to the results for mushroom yield. The highest BE% values were consistently recorded in the control group, ranging from 94.8% to 99.7% (the first experiment) and from 87.9% to 95.7% (the second experiment). The level of BE% decreased the most at the highest spore concentration, reaching values of 12.1% and 11.8% in the induction phase and 21.3% and 12.8% three days after casing, depending on the experiment. The highest mean BE (79.3% and 77.5%) was obtained when spores were inoculated at the primordia formation stage, while the lowest BE values were recorded when pathogen spores were applied during the induction phase and three days after casing.
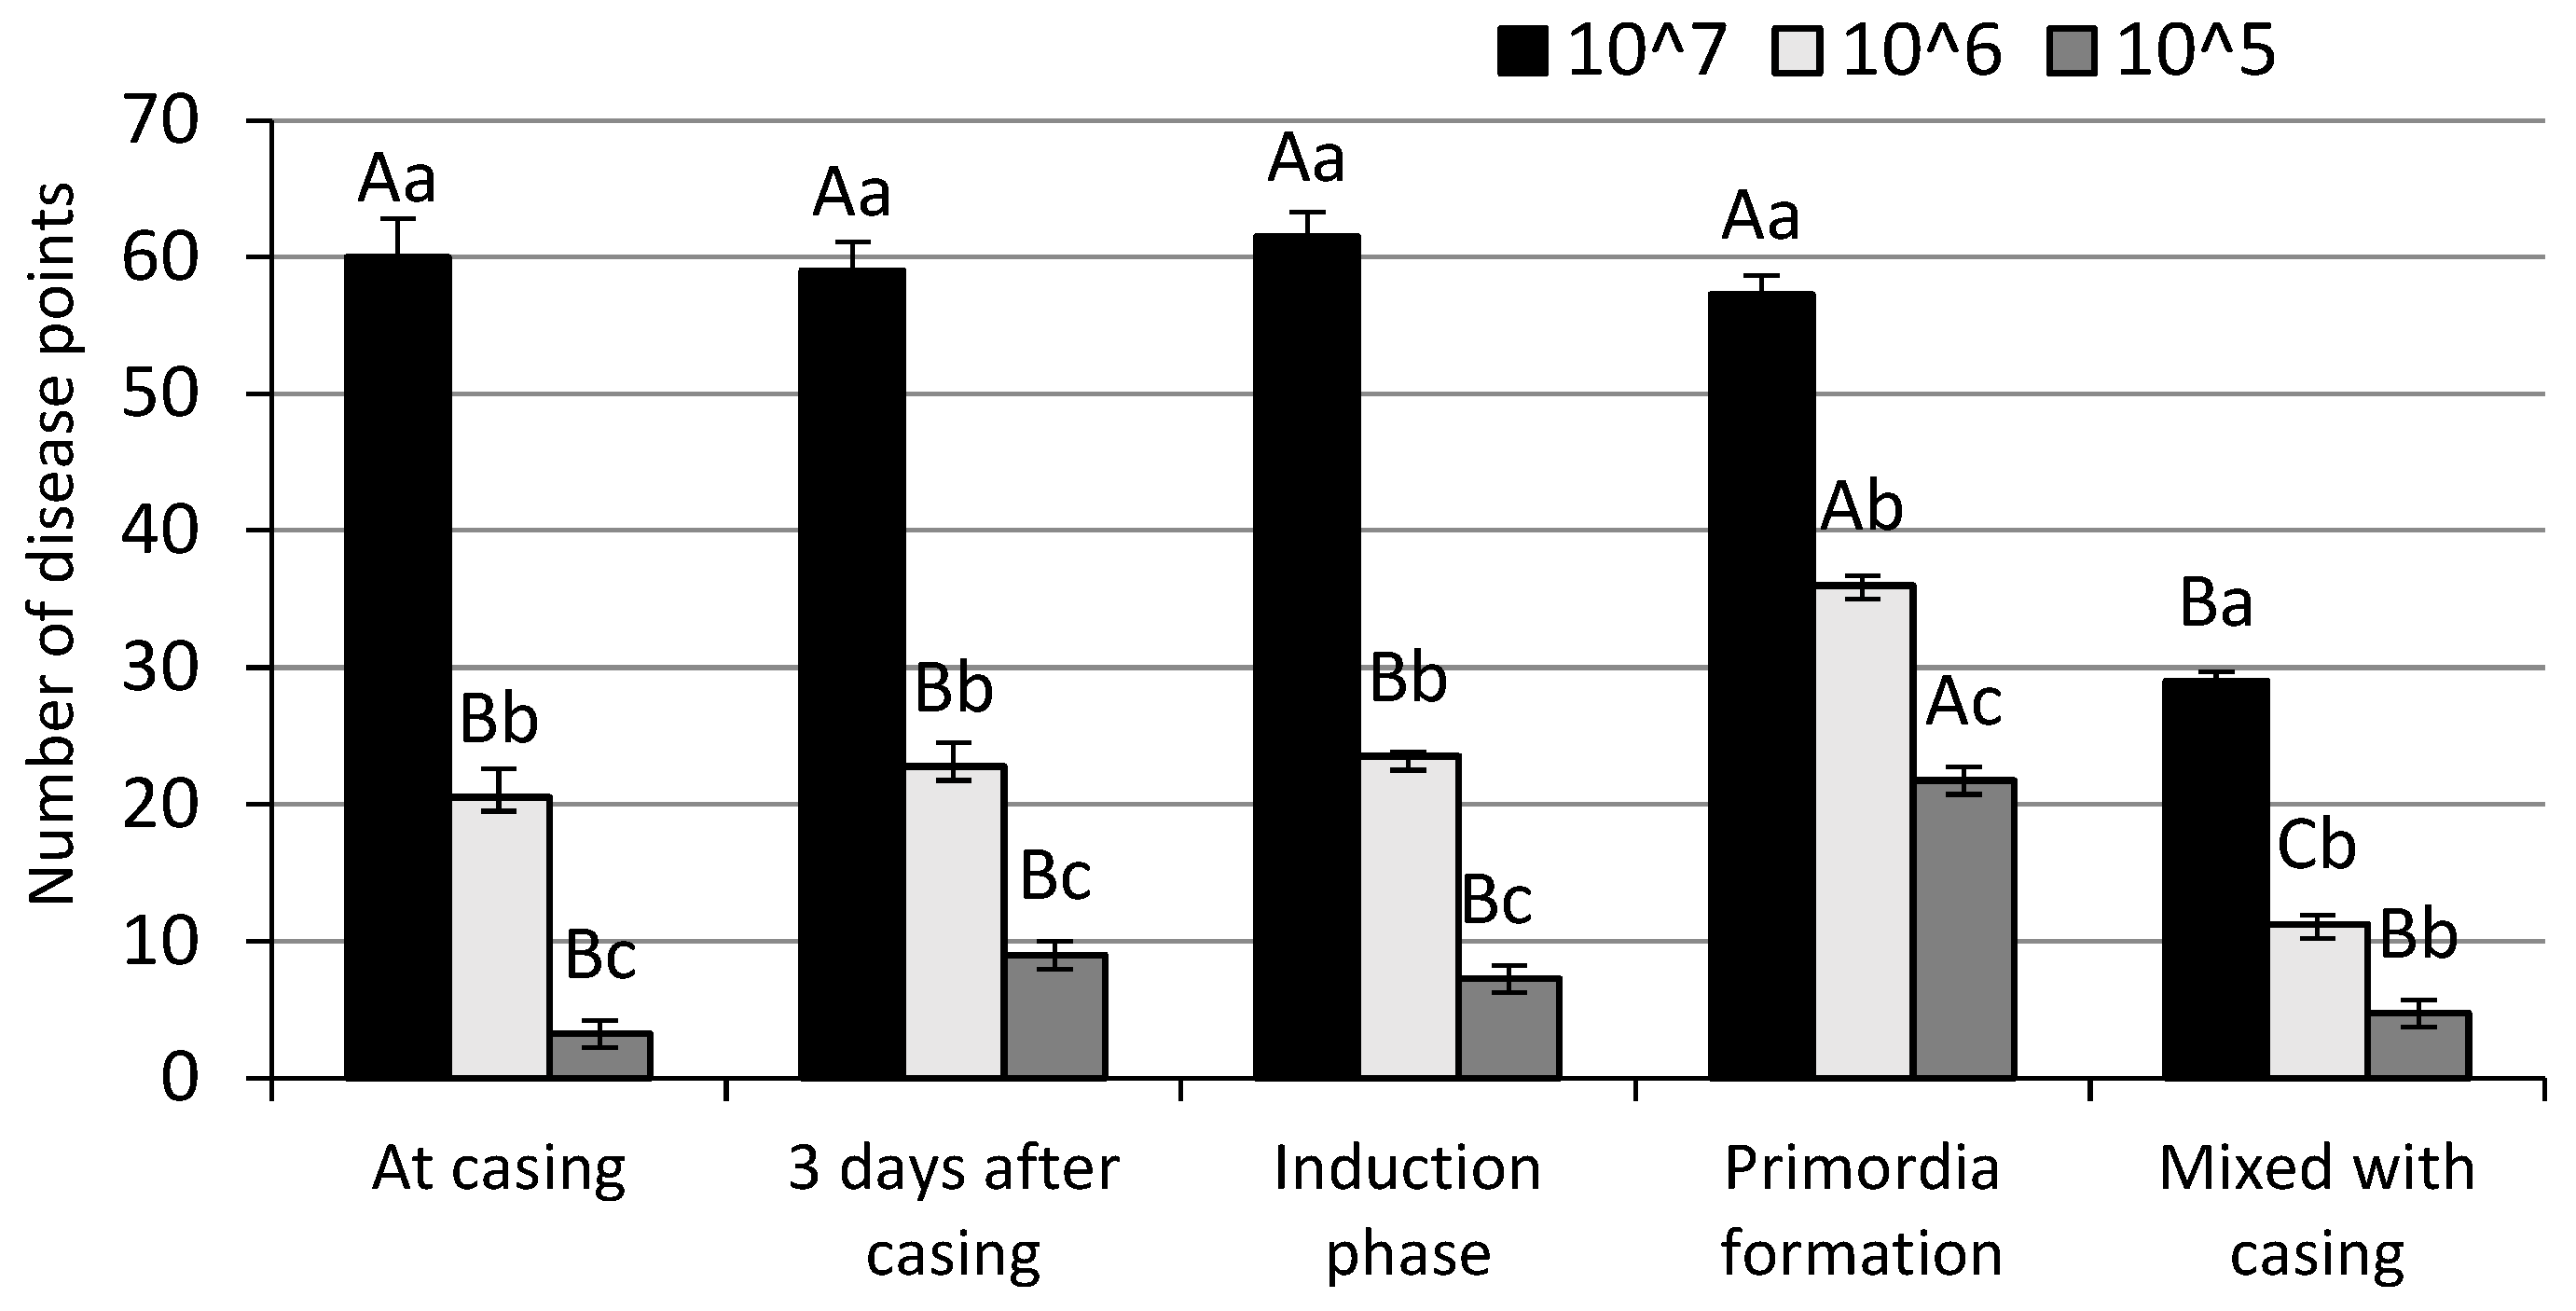
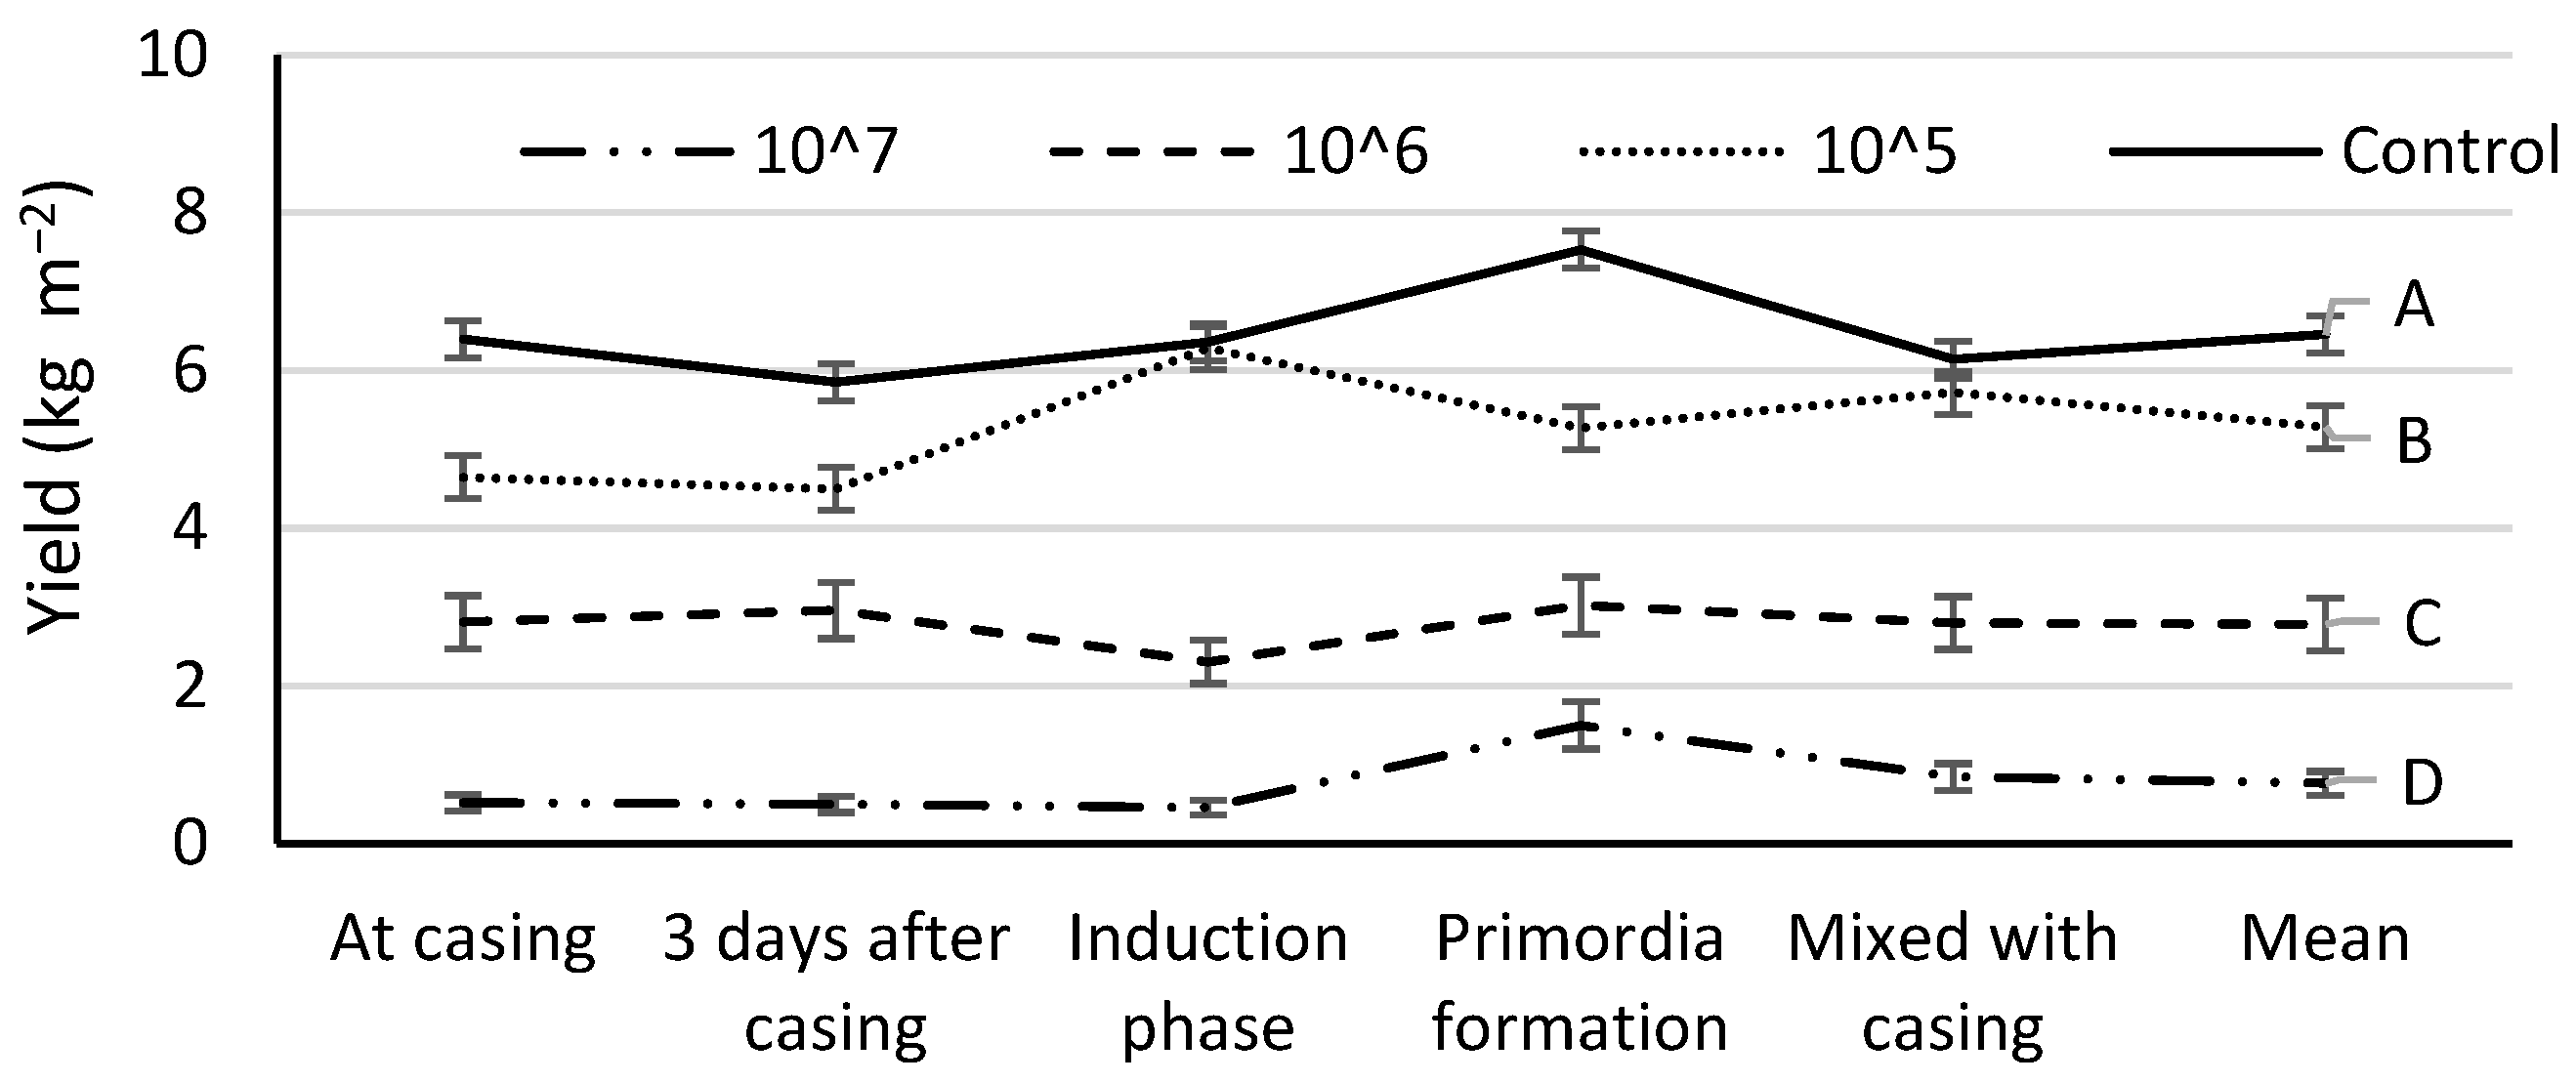
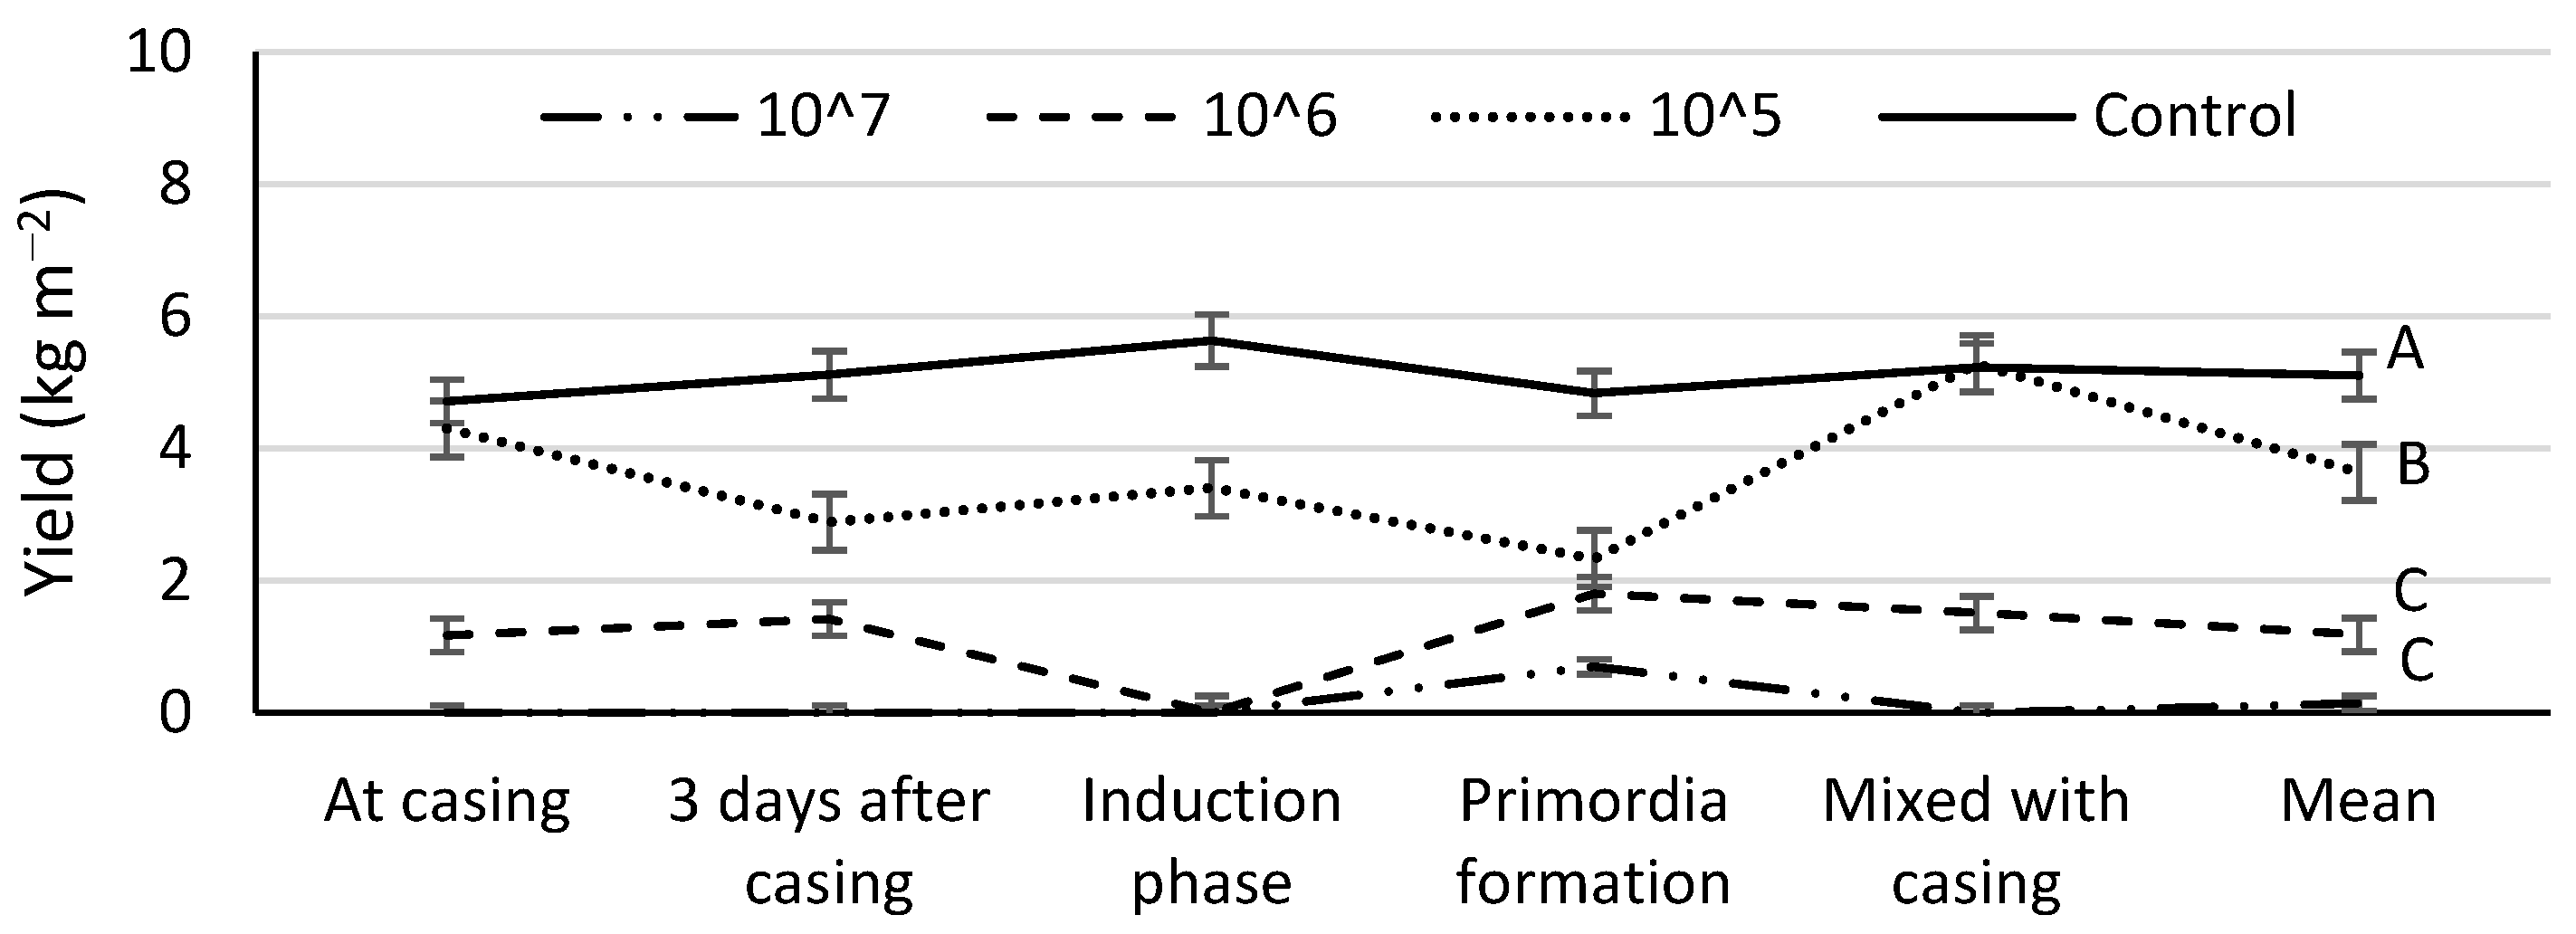
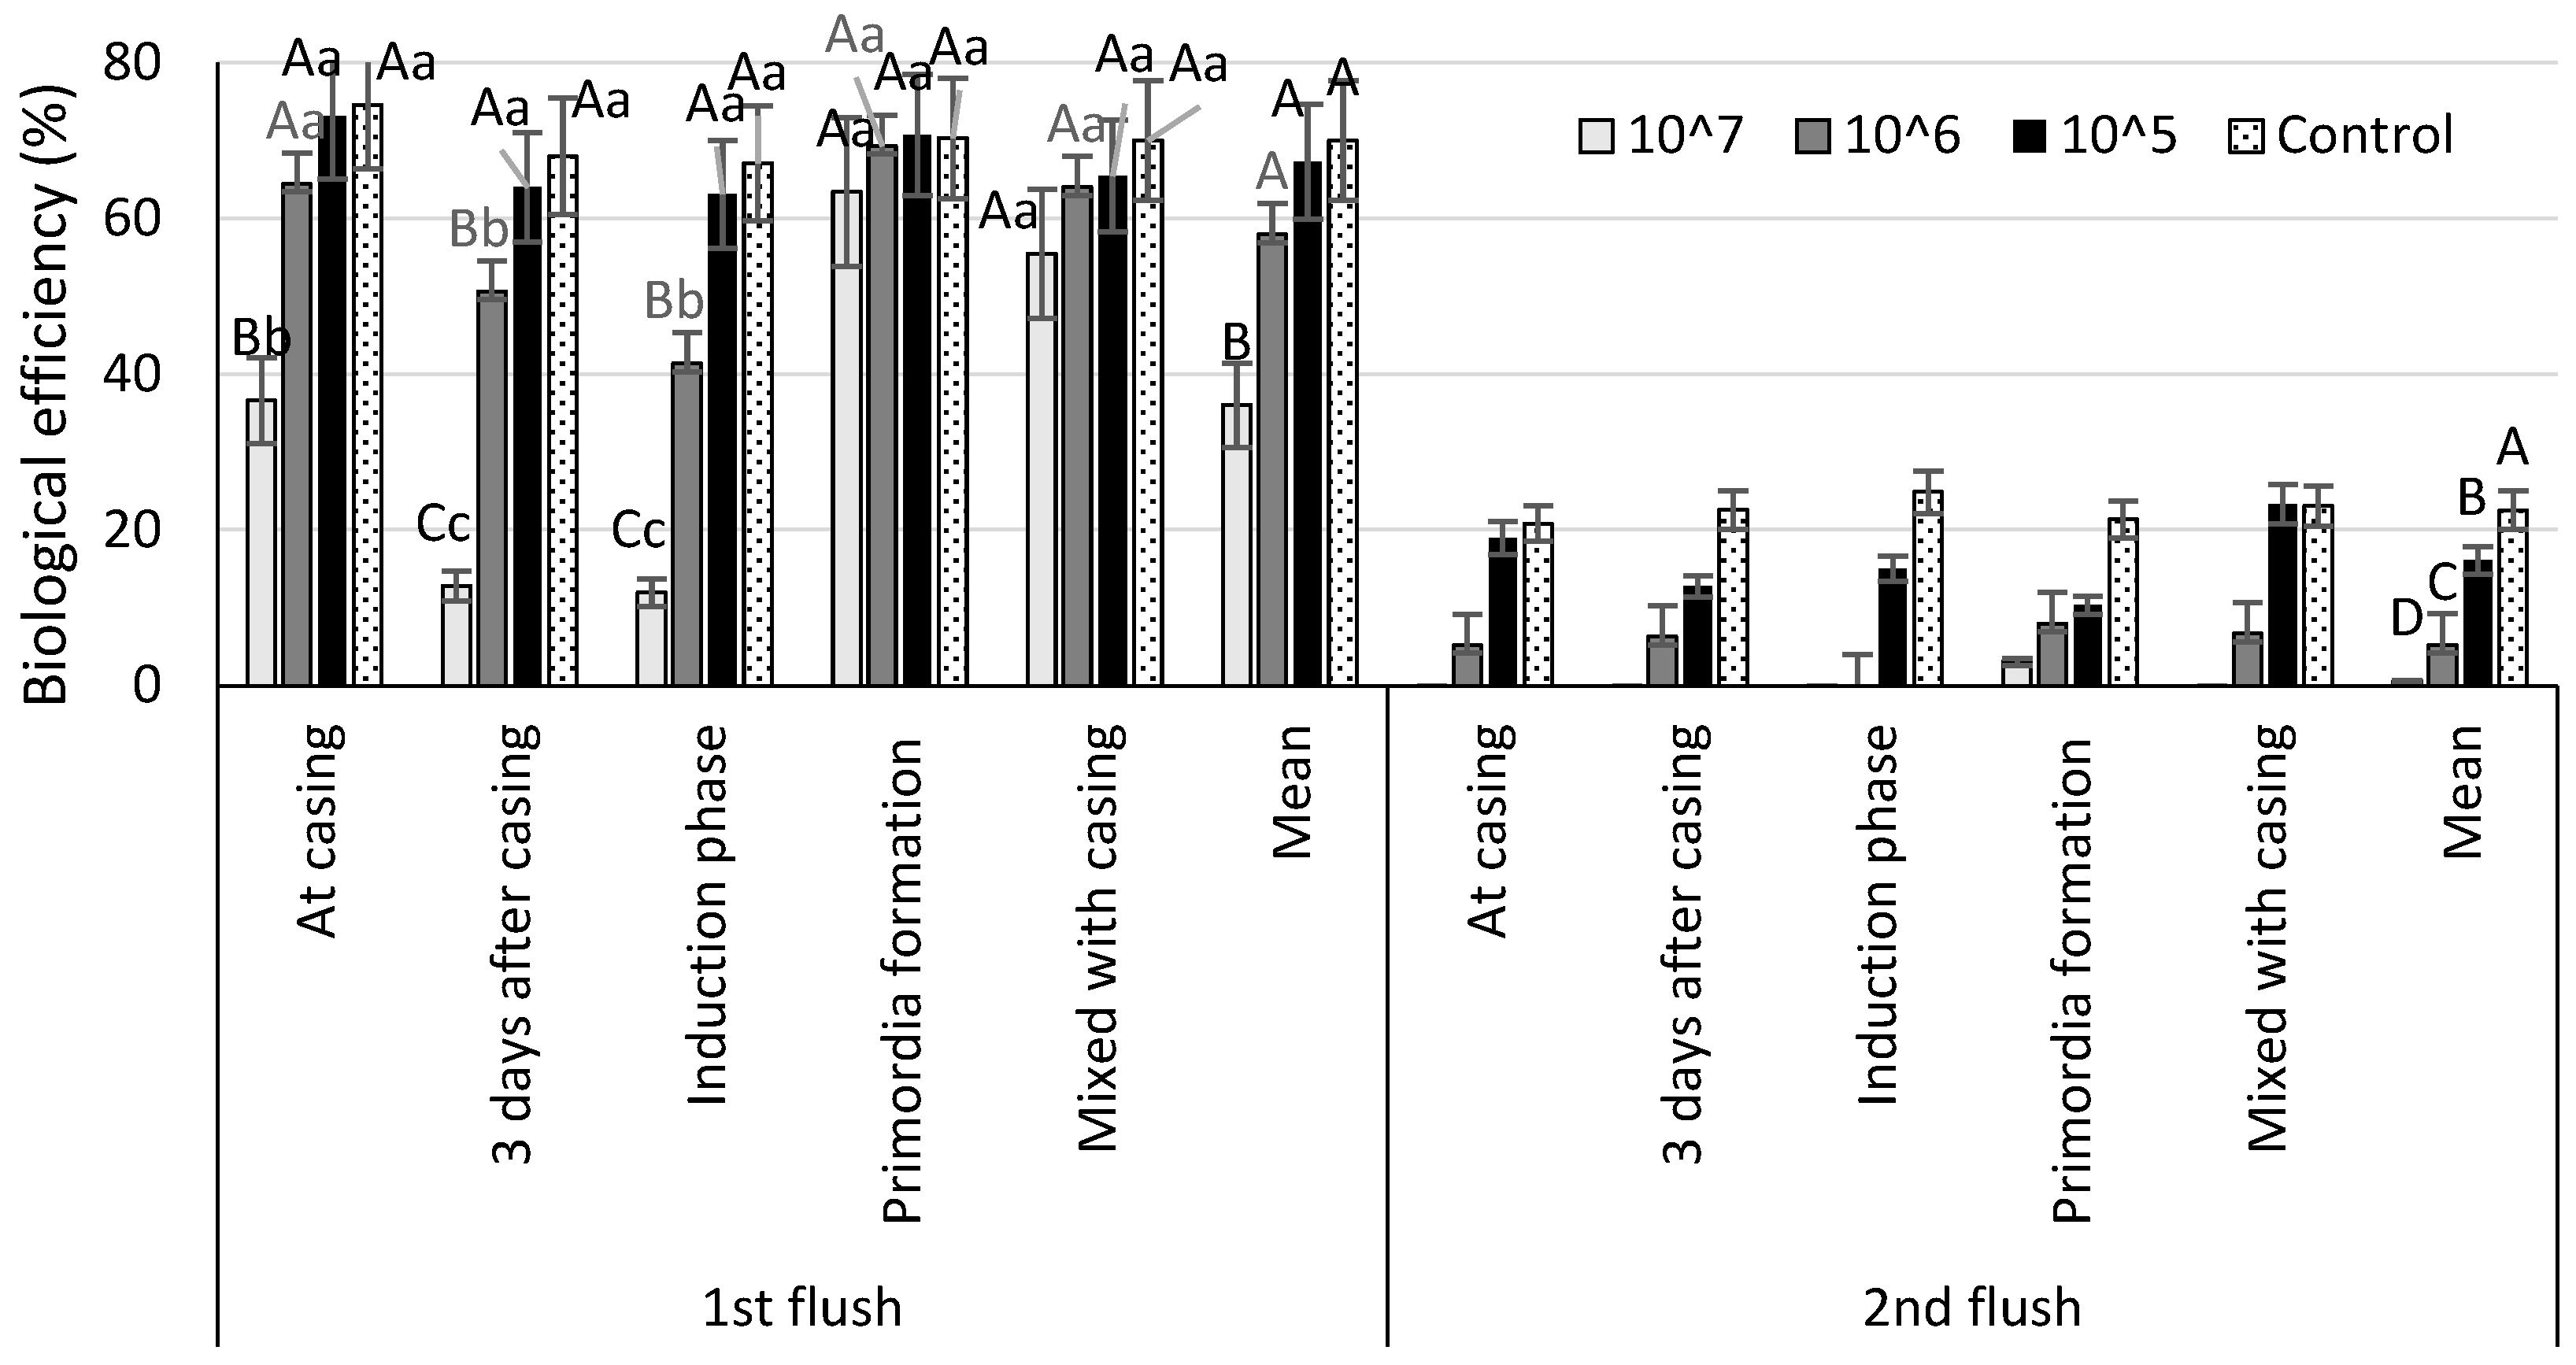
An analysis of the yield of fruiting bodies in the first flush reveals that inoculation of the crop three days after casing and during the induction phase (with a number of spores of 107 spores m−2) caused the most severe yield loss and in the second flush, mushroom yield was almost completely reduced. Furthermore, the infection with a lower inoculum concentration (105 spores m−2) during these stages of cultivation resulted in a significant reduction in yield in the second flush. In contrast, the infection during the primordia formation exhibited no statistically significant impact on the yield, irrespective of the inoculum concentration (Figure 4 and Figure 5). Results revealed a significant interaction between the timing of inoculation and the concentration of inoculum with regard to the yield of fruiting bodies in the first flush. Specifically, when spore inoculation was carried out during the primordia formation stage, no significant effect of inoculum concentration was observed. In contrast, for inoculations during the induction phase and three days after casing, even the lowest inoculum concentration caused a significant reduction in yield compared to the control (Figure 4 and Figure 6). In the second flush, the yield was significantly affected only by inoculum concentration (Figure 6 and Figure 7).
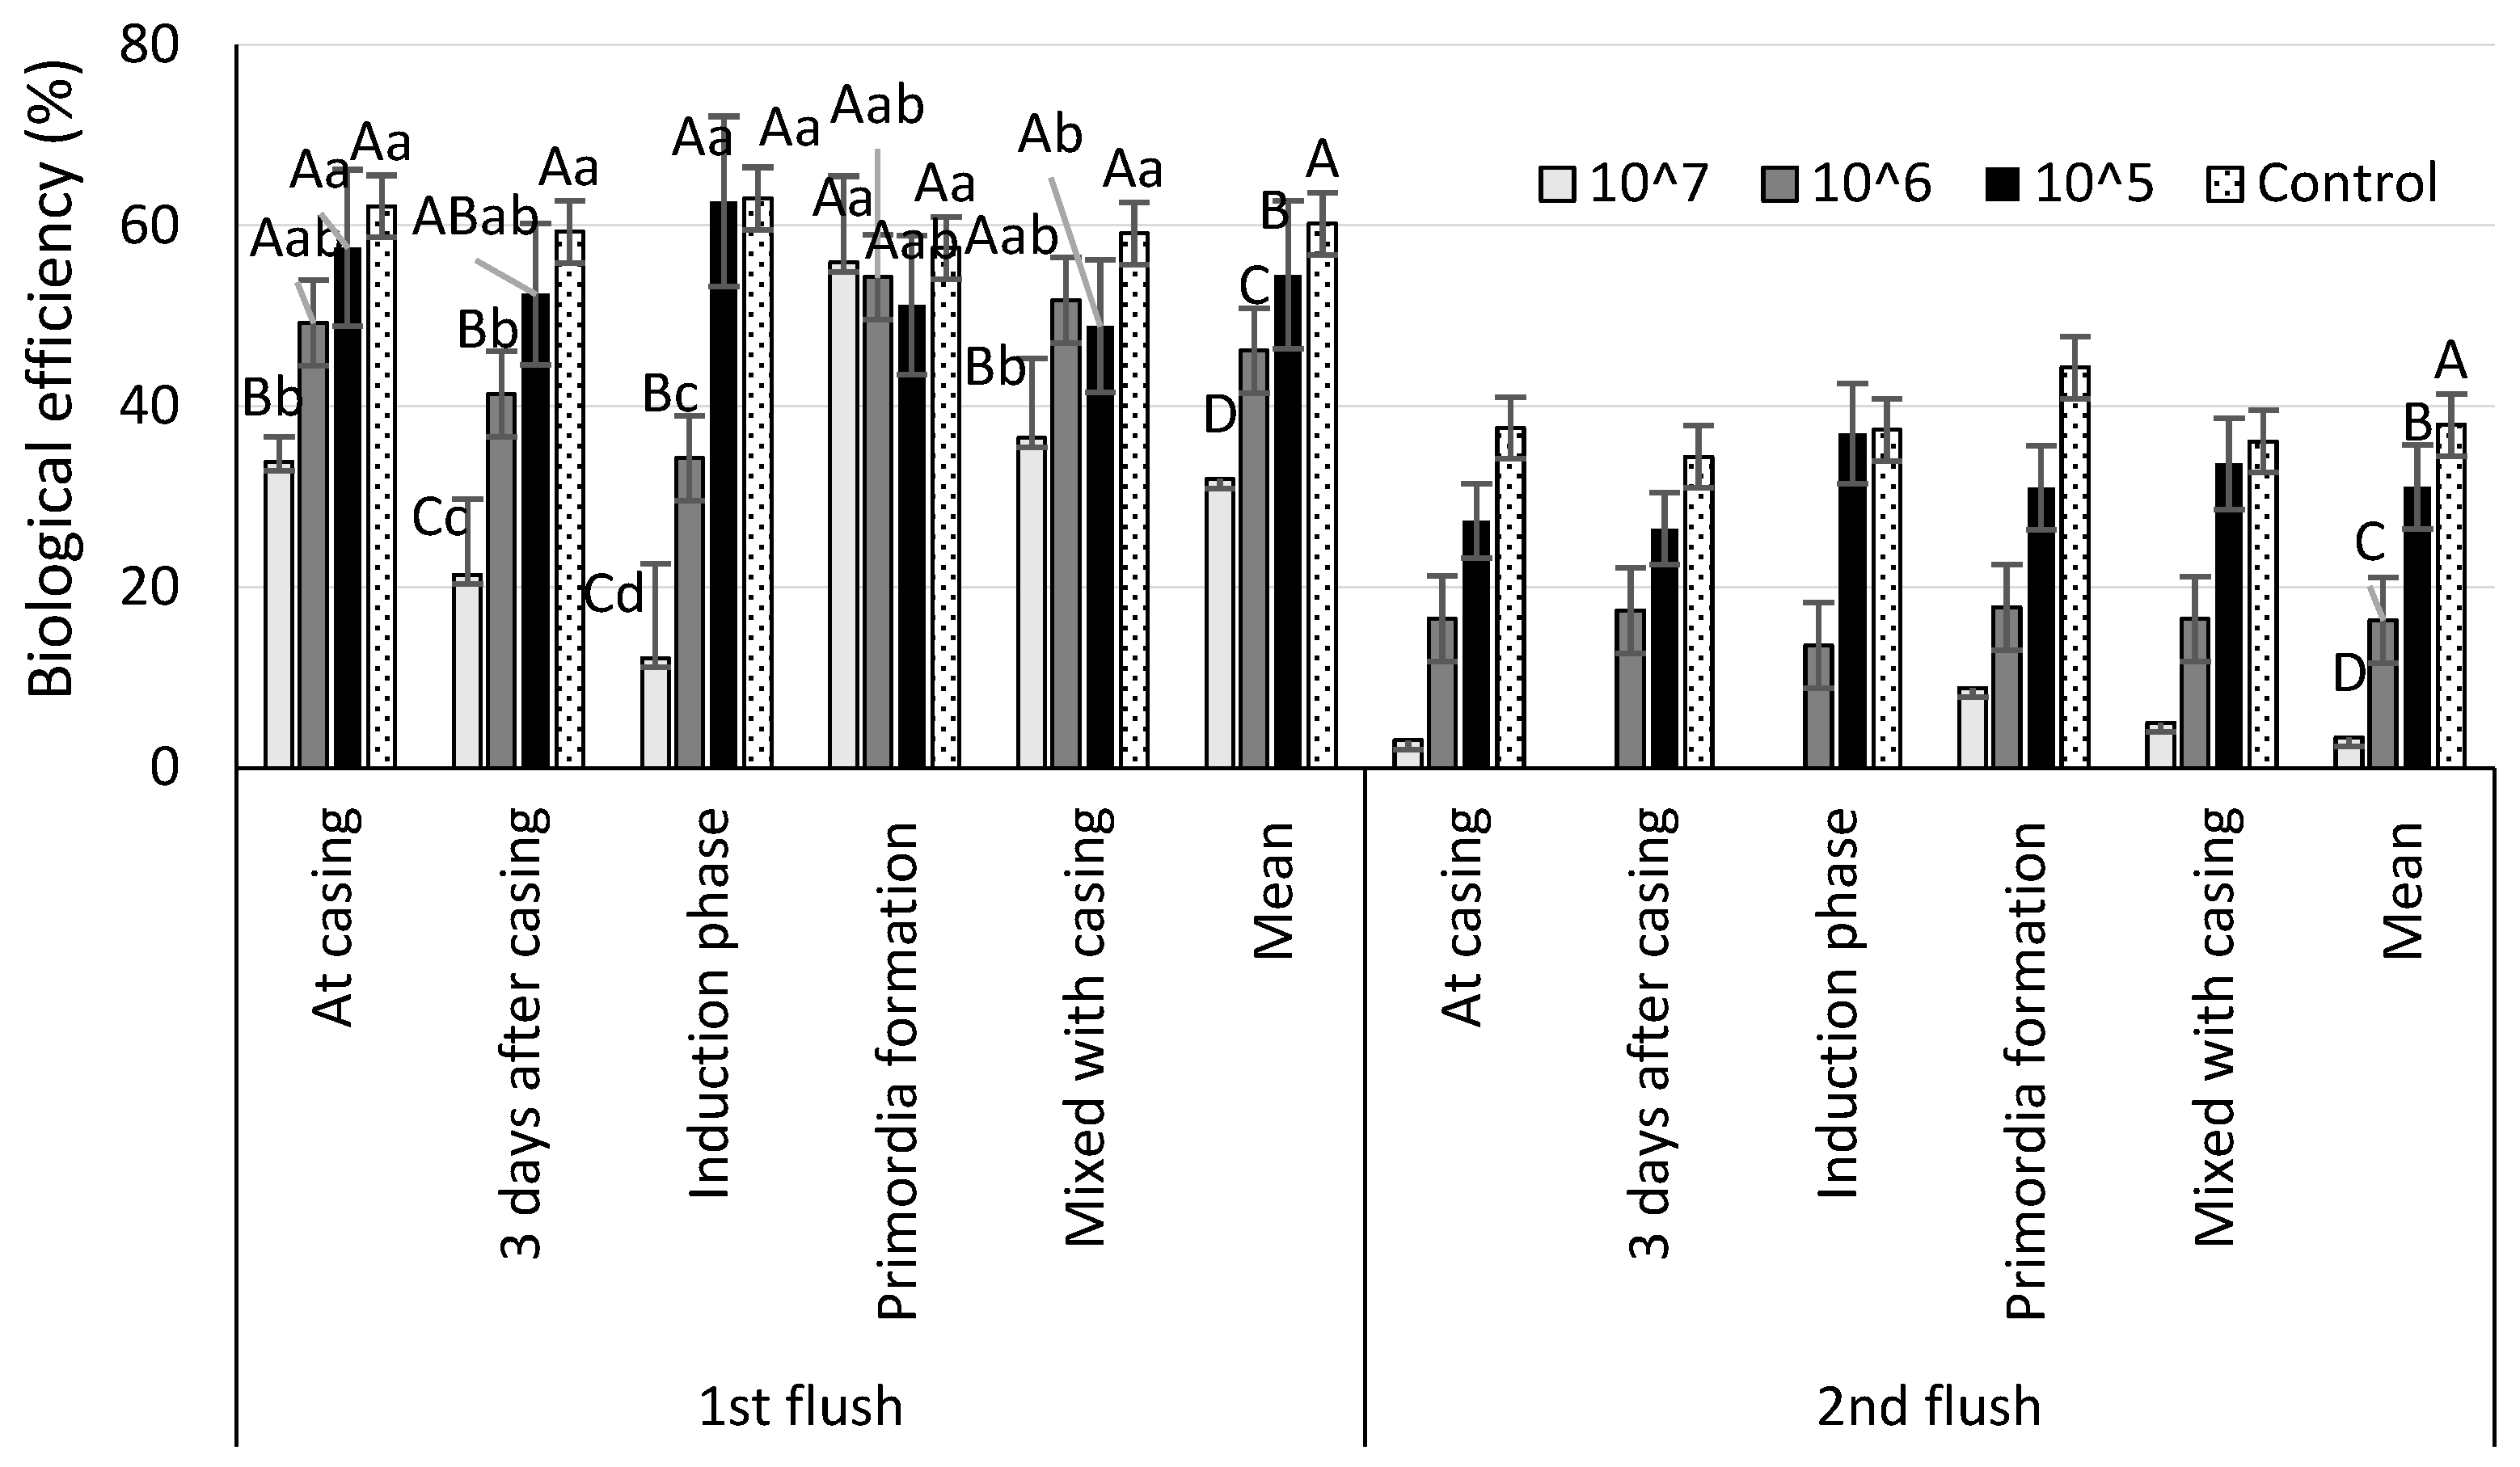
Figure 8 and Figure 9 present the differences in biological efficiency (BE%) between two flushes in relation to Z. fungicola spore concentration and timing of inoculation. In both experiments, the biological efficiency over the first flush was affected by spore concentration and inoculation time. Inoculation with spores during the primordia formation stage did not significantly affect biological efficiency (BE%). In contrast, spore inoculation performed three days after casing or during the induction phase resulted in a reduction in BE%, even at low spore concentrations. In the second flush, the biological efficiency was significantly affected only by spore concentration, as higher spore concentrations resulted in a greater reduction in BE%.

4. Discussion

This study investigated the infection dynamics of Z. fungicola in white button mushroom (A. bisporus) cultivation, with particular emphasis on the role of inoculum density and the timing of inoculation. Results demonstrated that dry bubble development was strongly influenced by both factors, with susceptibility varying markedly across different developmental stages of the cropping cycle.
Disease symptoms appeared earliest when the highest spore concentration was applied at the beginning of the induction phase (7th day), i.e., as soon as 7 days after spore inoculation. Then, the disease symptoms were observed on the 14th day of cultivation. At the same cultivation time, dry bubble lesions were also observed in trials with spore inoculum applied 3 days after casing, as the latent period of disease lasted 11 days. This observation indicates that dry bubble develops primarily on the mushroom primordia rather than on the mycelial hyphae. This finding is consistent with previous reports [3,15]. In contrast, the latest appearance of symptoms (26–28 days) occurred when the lowest inoculum concentration was mixed with the casing soil, which is likely a consequence of this inoculation method rather than reduced pathogenicity of Z. fungicola. Furthermore, the reduced symptom expression observed in these trials was not due to induced resistance in A. bisporus, as this mechanism is thought to be absent in this species [25]. However, Hayes et al. [26] demonstrated that Z. fungicola infection resulted in increased emissions of specific volatile compounds by diseased mushrooms, specifically cis-α-bisabolene and β-barbatene. It can be suggested that the production of these compounds by A. bisporus could play a role in defense against dry bubble. The delay in symptom development observed in trials, where spores were mixed with the casing, can be explained by fungistasis in the casing layer [27,28]. As previously reported by Berendsen et al. [29], the spore germination of Z. fungicola is initially inhibited by antibiotics produced by indigenous Pseudomonas spp., with growth only occurring after colonization of the casing by A. bisporus. This mechanism may provide an explanation for the relatively slower development of symptoms in these trials. However, spore inoculation at the casing stage resulted in the development of symptoms after 15–19 days, which is in accordance with the findings of the study carried out by Gea et al. [30].
The present study demonstrated that the pinning stage was the most susceptible phase to dry bubble expression, as even very low inoculum concentrations noticeably enhanced the number of disease symptoms. This finding suggests that the physiological changes associated with primordia initiation may create conditions favorable to pathogen infection or colonization. Quiroz et al. [31] reached similar conclusions, emphasizing that this developmental stage involves the activation of genes controlling cell division, fruit body morphogenesis, and apoptosis. These processes appear to increase the susceptibility of the tissues to L. fungicola colonization, resulting in more severe disease symptoms.
The effect of spore concentration and inoculation timing on dry bubble development has also been documented in previous studies [32,33,34]. According to Nair and Macauley, the infection of crops with L. fungicola at casing resulted in a relatively high incidence of disease, compared with the lower symptom levels that were observed when infection occurred at spawning or following the second flush [33]. Largetau et al. [34] also demonstrated that the early inoculation of the casing layer with the spore pathogen was associated with the highest incidence of diseased mushrooms. In contrast, Holmes [35] observed the lowest disease severity when inoculum was added during casing application, while spores introduced 14 days after casing caused more severe disease symptoms. Our findings, together with previous research, demonstrate that occurrence of dry bubble are dependent on a complex interaction between mushroom developmental stage, pathogen pressure, pathogen virulence, and environmental conditions [36,37]. In the present study, different types of disease symptoms (i.e., spot symptoms, split stems, and malformed fruiting bodies) were not distinguished and analyzed, because in the experimental variants studied, mainly deformed fruiting body tissues were observed. Importantly, inoculation of mushroom cultivations with Z. fungicola spores at an early developmental stage, particularly at high spore concentrations, leads to the formation of undifferentiated masses of mushroom tissue, irrespective of the aggressiveness of the pathogen [30]. The same findings were obtained and reported in the present study.
The AUDPC data indicated that A. bisporus exhibits differential sensitivity to infection according to the developmental stage, with susceptibility being strongly influenced by inoculation timing and inoculum density. The inoculation of spores at the casing and during the induction phase caused the most significant reductions in yield and biological efficiency, particularly at high spore concentrations. In contrast, inoculation at the pinning formation stage had comparatively insignificant effects on yield, even though the number of disease symptoms was the highest at the end of cultivation. This may be explained by the fact that symptoms appeared after the first flush and therefore did not influence the yield obtained in the first flush. This finding is consistent with the observations of Foulongne-Oriol et al. [38], who reported that the earlier occurrence of dry bubble symptoms was associated with reduced resistance in A. bisporus. However, at high inoculum concentrations, the impact of inoculation timing was less obvious. It can be concluded that higher pathogen pressure appears to be sufficient to overcome differences in host resistance. The consequence of this was the incidence of severe disease during the major stages of cultivation. In accordance with the studies of Quiroz et al. [31] Z. fungicola infection has been evidenced to induce changes in gene expression in A. bisporus. These changes have resulted in disruptions to fruiting body development and a reduction in defense response, thereby increasing the susceptibility of the mushroom to the pathogen [31,35]. Furthermore, naturally established casing microbiota have been shown to be able to suppress disease development at low levels of spore inoculum. However, it is ineffective against high pathogen pressure from artificially introduced fungal inoculum [35,36]. The severity of symptoms disease was also depended on the pathogenicity of Z. fungicola and the conidial concentrations. In general, higher inoculum levels have been demonstrated to produce more severe symptoms and greater yield loss [31,39,40,41,42]. The effect of Z. fungicola infection on the mushroom yield has been previously examined by other researchers. Caitano et al. [39] demonstrated the significant correlation between the reduction in yield and the progression of dry bubbles. Mills et al. [40] reported that inoculation with 103 conidia m−2 did not result in the symptom expressions in the first two flushes. According to Mamoun et al. [41], an increase in concentration to 104 conidia m−2 resulted in the exhibition of symptoms during cropping in approximately 15% of diseased mushrooms. At a conidial density of 106 m−2, disease incidence increased to 11.8% in the first flush and 25% in the second. The highest inoculum density of 108 conidia m−2 caused complete crop loss, whereas Zeid et al. [43] observed yield reductions between 8.7% and 76.5% across different A. bisporus strains at the same spore Z. fungicola concentration. Gea et al. [44] demonstrated that inoculation with 105 spores m−2 resulted in 26–47% of mushrooms with disease symptoms. All previous studies assessing the susceptibility of A. bisporus to dry bubble, and the resulting yield loss, have been conducted when inoculation was applied at casing or three days after casing. In the present study, the yield reduction was ranged approximately from 13.5% to 63.9% in the first experiment and from 10.5 to 59.4% in the second experiment, depending on the spore concentration per m2 casing. Under normal mushroom production conditions, yield loss is generally between 2 and 5% but, in some cases, can reach 20–30% [3,45]. In considering the observed yield reductions in the present experiment, as cited above, it can be hypothesized that the spore concentration in mushroom cultivation may reach approximately 102–104 spores per m2 of casing, with the potential to influence production outcomes. The present study examined spore inoculation at different stages of the cropping cycle. The most significant decreases in the mushroom yield and biological efficiency were observed when spore inoculation was applied at casing, three days after casing, and at induction phase, regardless of spore concentration. In contrast, inoculation at the primordia formation exhibited minimal negative impact on the yield and biological efficiency. It is important to note that the interaction between inoculation timing and spore inoculum revealed that even a low number of spores can significantly reduce yield when infection occurred at sensitive developmental stages. Therefore, the present results emphasize the importance of protecting mushrooms during the early developmental stages, particularly immediately after casing and during the induction phase. Later pathogen inoculations result in only a limited impact on mushroom yield. It is evident that the time of application and the quantity of conidial inoculum are pivotal factors in determining the severity of the disease and the productivity of the crop. It is evident that effective infection control during the crucial stages of cultivation can be an effective strategy for minimizing crop losses. Infections that occurred at a later stage had relatively minor effects, suggesting that protective measures at these stages may be less important. The findings presented herein provide novel insights into the epidemiology of dry bubble disease and enhance our understanding of the impact of pathogens during the cultivation of white button mushrooms.

5. Conclusions

The present study demonstrates that the time of inoculation and the inoculum concentration of Z. fungicola are crucial factors influencing yield and biological efficiency in A. bisporus cultivation. The most significant reductions in productivity and mushroom yield were observed in treatments where spore inoculation occurred at the casing stage and three days after casing. Conversely, inoculation during the formation of primordia resulted in relatively minor impact on disease expression. Furthermore, an increase in conidial concentration generally resulted in intensified disease incidence and yield losses. However, the degree of this effect was found to be significantly influenced by the developmental stage of the crop at the time of infection.
The present findings emphasize a crucial period of susceptibility that occurs during the initial stages of cultivation development, indicating the necessity for the application of preventative management practices aimed at protecting crops during this phase. Moreover, the strong interaction between yield reduction, biological efficiency, and disease progression confirms the close relationship between infection dynamics and productivity. The results obtained provide a scientific basis for the development of cultivation strategies that would reduce the impact of Z. fungicola and economic losses in commercial mushroom production.

Author Contributions

Conceptualization, J.S.-T. and C.Ś.; methodology, J.S.-T., C.Ś. and Z.U.; formal analysis, J.S.-T. and C.Ś.; investigation, J.S.-T., C.Ś. and Z.U.; resources, J.S.-T., C.Ś. and Z.U.; data curation, J.S.-T. and C.Ś.; writing—original draft preparation, J.S.-T.; writing—review and editing, J.S.-T.; visualization, J.S.-T.; supervision, J.S.-T.; project administration, J.S.-T. and C.Ś.; funding acquisition, J.S.-T. and C.Ś. All authors have read and agreed to the published version of the manuscript.

Funding

This research was supported by the Ministry of Agriculture and Rural Development in Poland within the Multiannual Program “Development of sustainable horticultural production methods to ensure high biological and nutritional quality of horticultural products and to preserve environmental biodiversity and protect its resources”.

Data Availability Statement

The original contributions presented in this study are included in the article. Further inquiries can be directed to the corresponding author.

Conflicts of Interest

The authors declare no conflicts of interest.

References

  1. Khonsanit, A.; Thanakitpipattana, D.; Mongkolsamrit, S.; Kobmoo, N.; Phosrithong, N.; Samson, R.A.; Crous, P.W.; Luangsa-Ard, J.J. A phylogenetic assessment of Akanthomyces sensu lato in Cordycipitaceae (Hypocreales, Sordariomycetes): Introduction of new genera, and the resurrection of Lecanicillium. Fungal Syst. Evol. 2024, 14, 271–305. [Google Scholar] [CrossRef]
  2. Zare, R.; Gams, W. A revision of the Verticillium fungicola species complex and its affinity with the genus Lecanicillium. Mycol. Res. 2008, 112, 811–824. [Google Scholar] [CrossRef]
  3. Berendsen, R.L.; Baars, J.J.P.; Kalkhove, S.I.C.; Lugones, L.G.; Wösten, H.A.B.; Bakker, P.A. Lecanicillium fungicola: Causal agent of dry bubble disease in white-button mushroom. Mol. Plant Pathol. 2010, 11, 585–595. [Google Scholar] [CrossRef]
  4. Gams, W.; Van Zaayen, A. Contribution to the taxonomy and pathogenicity of fungicolous Verticillium species. I. Taxonomy. Neth. J. Plant Pathol. 1982, 88, 57–78. [Google Scholar] [CrossRef]
  5. Collopy, P.D.; Largeteau-Mamoun, M.L.; Romaine, C.P.; Royse, D.J. Molecular phylogenetic analyses of Verticillium fungicola and related species causing dry bubble disease of the cultivated button mushroom, Agaricus bisporus. Phytopathology 2001, 91, 905–912. [Google Scholar] [CrossRef]
  6. Calonje, M.; Garcia Mendoza, C.; Perez Cabo, A.; Bernardo, D.; Novaes-Ledieu, M. Interaction between the mycoparasite Verticillium fungicola and the vegetative phase of Agaricus bisporus. Mycol. Res. 2000, 104, 988–992. [Google Scholar] [CrossRef]
  7. Shamshad, A.; Clift, A.D.; Mansfield, A. Hostparasite interaction between cultivated mushroom, Agaricus bisporus hybrid strain Sylvan A15, and the mycoparasite Verticillium fungicola, a causal agent of dry bubble disease. Aus. Plant Pathol. 2009, 38, 74–78. [Google Scholar] [CrossRef]
  8. Largeteau, M.L.; Regnault-Roger, C.; Savoie, J.-M. Verticillium disease of Agaricus bisporus: Variations in host contribution to total fungal DNA in relation to symptom heterogeneity. Eur. J. Plant Pathol. 2007, 118, 155–164. [Google Scholar] [CrossRef]
  9. Fletcher, J.T.; Gaze, R.H. Mushroom Pest and Disease Control: A Color Handbook, 1st ed.; CRC Press: London, UK, 2007; pp. 70–75. [Google Scholar]
  10. Largeteau, M.L.; Savoie, J.-M. Effect of the fungal pathogen Verticillium fungicola on fruiting initiation of its host, Agaricus bisporus. Mycol. Res. 2008, 112, 825–828. [Google Scholar] [CrossRef]
  11. Largeteau, M.L.L.; Mata, G.; Savoie, J.-M. Verticillium fungicola var. fungicola affects Agaricus bisporus cultivation in Mexico. FEMS Microbiol. Lett. 2004, 236, 191–196. [Google Scholar] [CrossRef]
  12. Aminuzzaman, F.M.; Shahi, S.; Thapa, S.; Das, K. Mushroom diseases and their management: A review. In Recent Advances in Mushroom Cultivation Technology and Its Application; Kulshreshtha, S., Ed.; Bright Sky Publications: Delhi, India, 2022; Volume 2, pp. 1–27. [Google Scholar]
  13. Clarke, J.; Grogan, H.; Fitzpatrick, D. Characterising the proteomic response of mushroom pathogen Lecanicillium fungicola to Bacillus velezensis QST 713 and Kos biocontrol agents. Eur. J. Plant Pathol. 2022, 163, 369–379. [Google Scholar] [CrossRef]
  14. Wong, W.C.; Preece, T.F. Sources of Verticillium fungicola on a commercial mushroom farm in England. Plant Pathol. 1987, 36, 577–582. [Google Scholar] [CrossRef]
  15. Bernardo, D.; Cabo, A.P.; Novaes-Ledieu, M.; Mendoza, C.G. Verticillium disease or ‘dry bubble’ of cultivated mushrooms: The Agaricus bisporus lectin recognizes and binds the Verticillium fungicola cell wall glucogalactomannan. Can. J. Microbiol. 2004, 50, 729–735. [Google Scholar] [CrossRef]
  16. Dragt, J.W.; Geels, F.P.; De Bruijnz, W.C.; Van Griensven, L.J.L.D. Intracellular infection of the cultivated mushroom Agaricus bisporus by the mycoparasite Verticillium fungicola var. fungicola. Mycol. Res. 1996, 100, 1082–1086. [Google Scholar] [CrossRef]
  17. Calonje, M.; Garcia Mendoza, C.; Galan, B.; Novaes-Ledieu, M. Enzymic activity of the mycoparasite Verticillium fungicola on Agaricus bisporus fruit body cell walls. Microbiology 1997, 143, 2999–3006. [Google Scholar] [CrossRef]
  18. Santana Nunes, J.; de Brito, M.R.; Zied, D.C.; das Graças Leite, E.A.; Souza Dias, E.; Alves, E. Evaluation of the infection process by Lecanicillium fungicola in Agaricus bisporus by scanning electron microscopy. Rev. Iberoam. Micol. 2017, 34, 36–42. [Google Scholar] [CrossRef]
  19. European Commission. Commission Implementing Regulation (EU) 2021/1450 of 3 September 2021 amending Implementing Regulation (EU) No 540/2011 as regards the approval periods of the active substances acrinathrin and prochloraz. Off. J. 2021, L 313, 25–27. [Google Scholar]
  20. Marčić, D.; Milijašević-Marčić, S.; Drobnjaković, T.; Luković, J.; Šantrić, L.; Grujić, N.; Potočnik, I. Bioprotection of the button mushroom from pests and diseases. Agronomy 2025, 15, 1323. [Google Scholar] [CrossRef]
  21. Gea, F.J.; Navarro, M.J.; Santos, M.; Diánez, F.; Carrasco, J. Control of fungal diseases in mushroom crops while dealing with fungicide resistance: A Review. Microorganisms 2021, 9, 585. [Google Scholar] [CrossRef]
  22. McGee, C.F. Microbial ecology of the Agaricus bisporus mushroom cropping process. Appl. Microbiol. Biotechnol. 2018, 102, 1075–1083. [Google Scholar] [CrossRef]
  23. Largeteau, M.L.; Baars, J.P.P.; Regnault-Roger, C.; Savoie, J.-M. Molecular and physiological diversity among Verticillium fungicola var. fungicola. Mycol. Res. 2006, 110, 431–440. [Google Scholar] [CrossRef]
  24. Jeger, M.; Viljanen-Rollinson, S. The use of the area under the disease-progress curve (AUDPC) to assess quantitative disease resistance in crop cultivars. Theor. Appl. Genet. 2001, 102, 32–40. [Google Scholar] [CrossRef]
  25. Berendsen, R.L.; Schrier, N.; Kalkhove, S.I.C.; Lugones, L.G.; Baars, J.J.P.; Zijlstra, C.; Weerdt, M.; Wösten, H.A.B.; Bakker, P.A.H.M. Absence of induced resistance in Agaricus bisporus against Lecanicillium fungicola. Antonie Van Leeuwenhoek 2013, 103, 539–550. [Google Scholar] [CrossRef]
  26. Hayes, W.; Keenan, C.; Wilson, J.; Onarinde, B.A. Early detection of dry bubble disease in Agaricus bisporus using volatile compounds. Food Chem. 2024, 435, 137518. [Google Scholar] [CrossRef]
  27. Noble, R.; Dobrovin-Pennington, A.; Hobbs, P.J.; Pederby, J.; Rodger, A. Volatile C8 compounds and pseudomonads influence primordium formation of Agaricus bisporus. Mycologia 2009, 101, 583–591. [Google Scholar] [CrossRef]
  28. Berendsen, R.L.; Kalkhove, S.I.C.; Lugones, L.G.; Baars, J.J.P.; Wösten, H.A.B.; Bakker, P.A.H.M. Effects of the mushroom-volatile 1-octen-3-ol on dry bubble disease. Appl. Microbiol. Biotechnol. 2013, 97, 5535–5543. [Google Scholar] [CrossRef]
  29. Berendsen, R.L.; Kalkhove, S.I.C.; Lugones, L.G.; Wösten, H.A.B.; Bakker, P.A.H.M. Germination of Lecanicillium fungicola in the mycosphere of Agaricus bisporus. Environm. Microbiol. Rep. 2012, 4, 227–233. [Google Scholar] [CrossRef]
  30. Gea, F.J.; Carrasco, J.; Santos, M.; Diánez, F.; Navarro, M.J. Incidence of Lecanicillium fungicola in white-button mushroom (Agaricus bisporus) cultivated with two types of casing soil. J. Plant Pathol. 2013, 95, 161–164. [Google Scholar]
  31. Quiroz, L.F.; Ciosek, T.; Grogan, H.; McKeown, P.C.; Spillane, C.; Brychkov, G. Unravelling the Transcriptional response of Agaricus bisporus under Lecanicillium fungicola Infection. Int. J. Mol. Sci. 2024, 25, 1283. [Google Scholar] [CrossRef]
  32. North, L.H.; Wuest, P.J. The infection process and symptom expression of verticillium disease of Agaricus bisporus. Can. J. Plant Pathol. 1993, 15, 74–80. [Google Scholar] [CrossRef]
  33. Nair, N.G.; Macauley, B.J. Dry bubble disease of Agaricus bisporus, and its control by prochloraz-manganese complex. N. Z. J. Agric. Res. 1987, 30, 107–116. [Google Scholar] [CrossRef]
  34. Largeteau, M.L.; Rodier, A.; Rousseau, T.; Juarez del Carmen, S.; Védie, R.; Savoie, J.M. Agaricus susceptibility to Verticillium fungicola. Mush. Sci. 2004, 16, 504–522. [Google Scholar]
  35. Holmes, J. Effect of time of inoculation on incidence and control of Verticillium disease of the commercial mushroom. Plant Dis. Rprt. 1971, 55, 643–645. [Google Scholar]
  36. Largeteau, M.L.; Savoie, J.M. Microbially induced diseases of Agaricus bisporus: Biochemical mechanisms and impact on commercial mushroom production. Appl. Microbiol. Biotechnol. 2010, 86, 63–73. [Google Scholar] [CrossRef]
  37. Carrasco, J.; Tello, M.L.; De Toro, M.; Tkacz, A.; Poole, P.; Pérez-Clavijo, M.; Preston, G. Casing microbiome dynamics during button mushroom cultivation: Implications for dry and wet bubble diseases. Microbiology 2019, 165, 611–624. [Google Scholar] [CrossRef]
  38. Foulongne-Oriol, M.; Rodier, A.; Rousseaau, T.; Largetau, M.; Savoie, J.M. Quantitative genetics to dissect the fungal-fungal interaction between Lecanicillium verticillium and the white button mushroom Agaricus bisporus. Fungal Biol. 2011, 115, 421–431. [Google Scholar] [CrossRef]
  39. Caitano, C.E.C.; Iossi, M.R.; Pardo-Giménez, A.; Vieira Junior, W.G.; Dias, E.S.; Zied, D.C. Design of a useful diagrammatic scale for the quantification of Lecanicillium fungicola disease in Agaricus bisporus cultivation. Curr. Microbiol. 2020, 77, 4037–4044. [Google Scholar] [CrossRef]
  40. Mills, P.R.; Fermor, T.; Muthumeenakshi, S.; Lincoln, S. Cell wall degrading enzymes produced by Verticillium spp. and their relationship to infection in Agaricus bisporus. In Proceedings of the 15th International Congress on the Science and Cultivation of Edible Fungi, Maastricht, The Netherlands, 15–19 May 2000; Volume 15, pp. 601–605. [Google Scholar]
  41. Mamoun, M.; Olivier, J.M.; Vedie, R. Discussions on assessment of artificial infections with Verticillium fungicola for breeding programmes. In Proceedings of the 14th International Congress on the Science and Cultivation of Edible Fungi, Oxford, UK, 17–22 September 1995; Volume 14, pp. 669–677. [Google Scholar]
  42. Van Zaayen, A.; Rutjens, A.A. Thermal death points for two Agaricus species and for the spores of some major pathogens. Mush. Sci. 1981, 11, 393–402. [Google Scholar]
  43. Zied, D.C.; Nunes, J.S.; Nicolini, V.F.; Pardo Gimenez, A.; Rinker, D.L.; Dias, E.S. Tolerance to Lecanicillium fungicola and yield of Agaricus bisporus strains used in Brazil. Sci. Horti. 2015, 190, 117–122. [Google Scholar] [CrossRef]
  44. Gea, F.J.; Tello, J.C.; Navarro, M.J. Occurrence of Verticillium fungicola var. fungicola on Agaricus bitorquis mushroom crops in Spain. J. Phytopathol. 2003, 151, 98–100. [Google Scholar] [CrossRef]
  45. Grogan, H. Detecting Dry Bubble Disease on Mushroom Farms. Teagasc, 2012, Project Number 5695. Available online: https://teagasc.ie/wp-content/uploads/2025/05/5695-Vert-CELUP-Technology-Update.pdf (accessed on 16 October 2025).
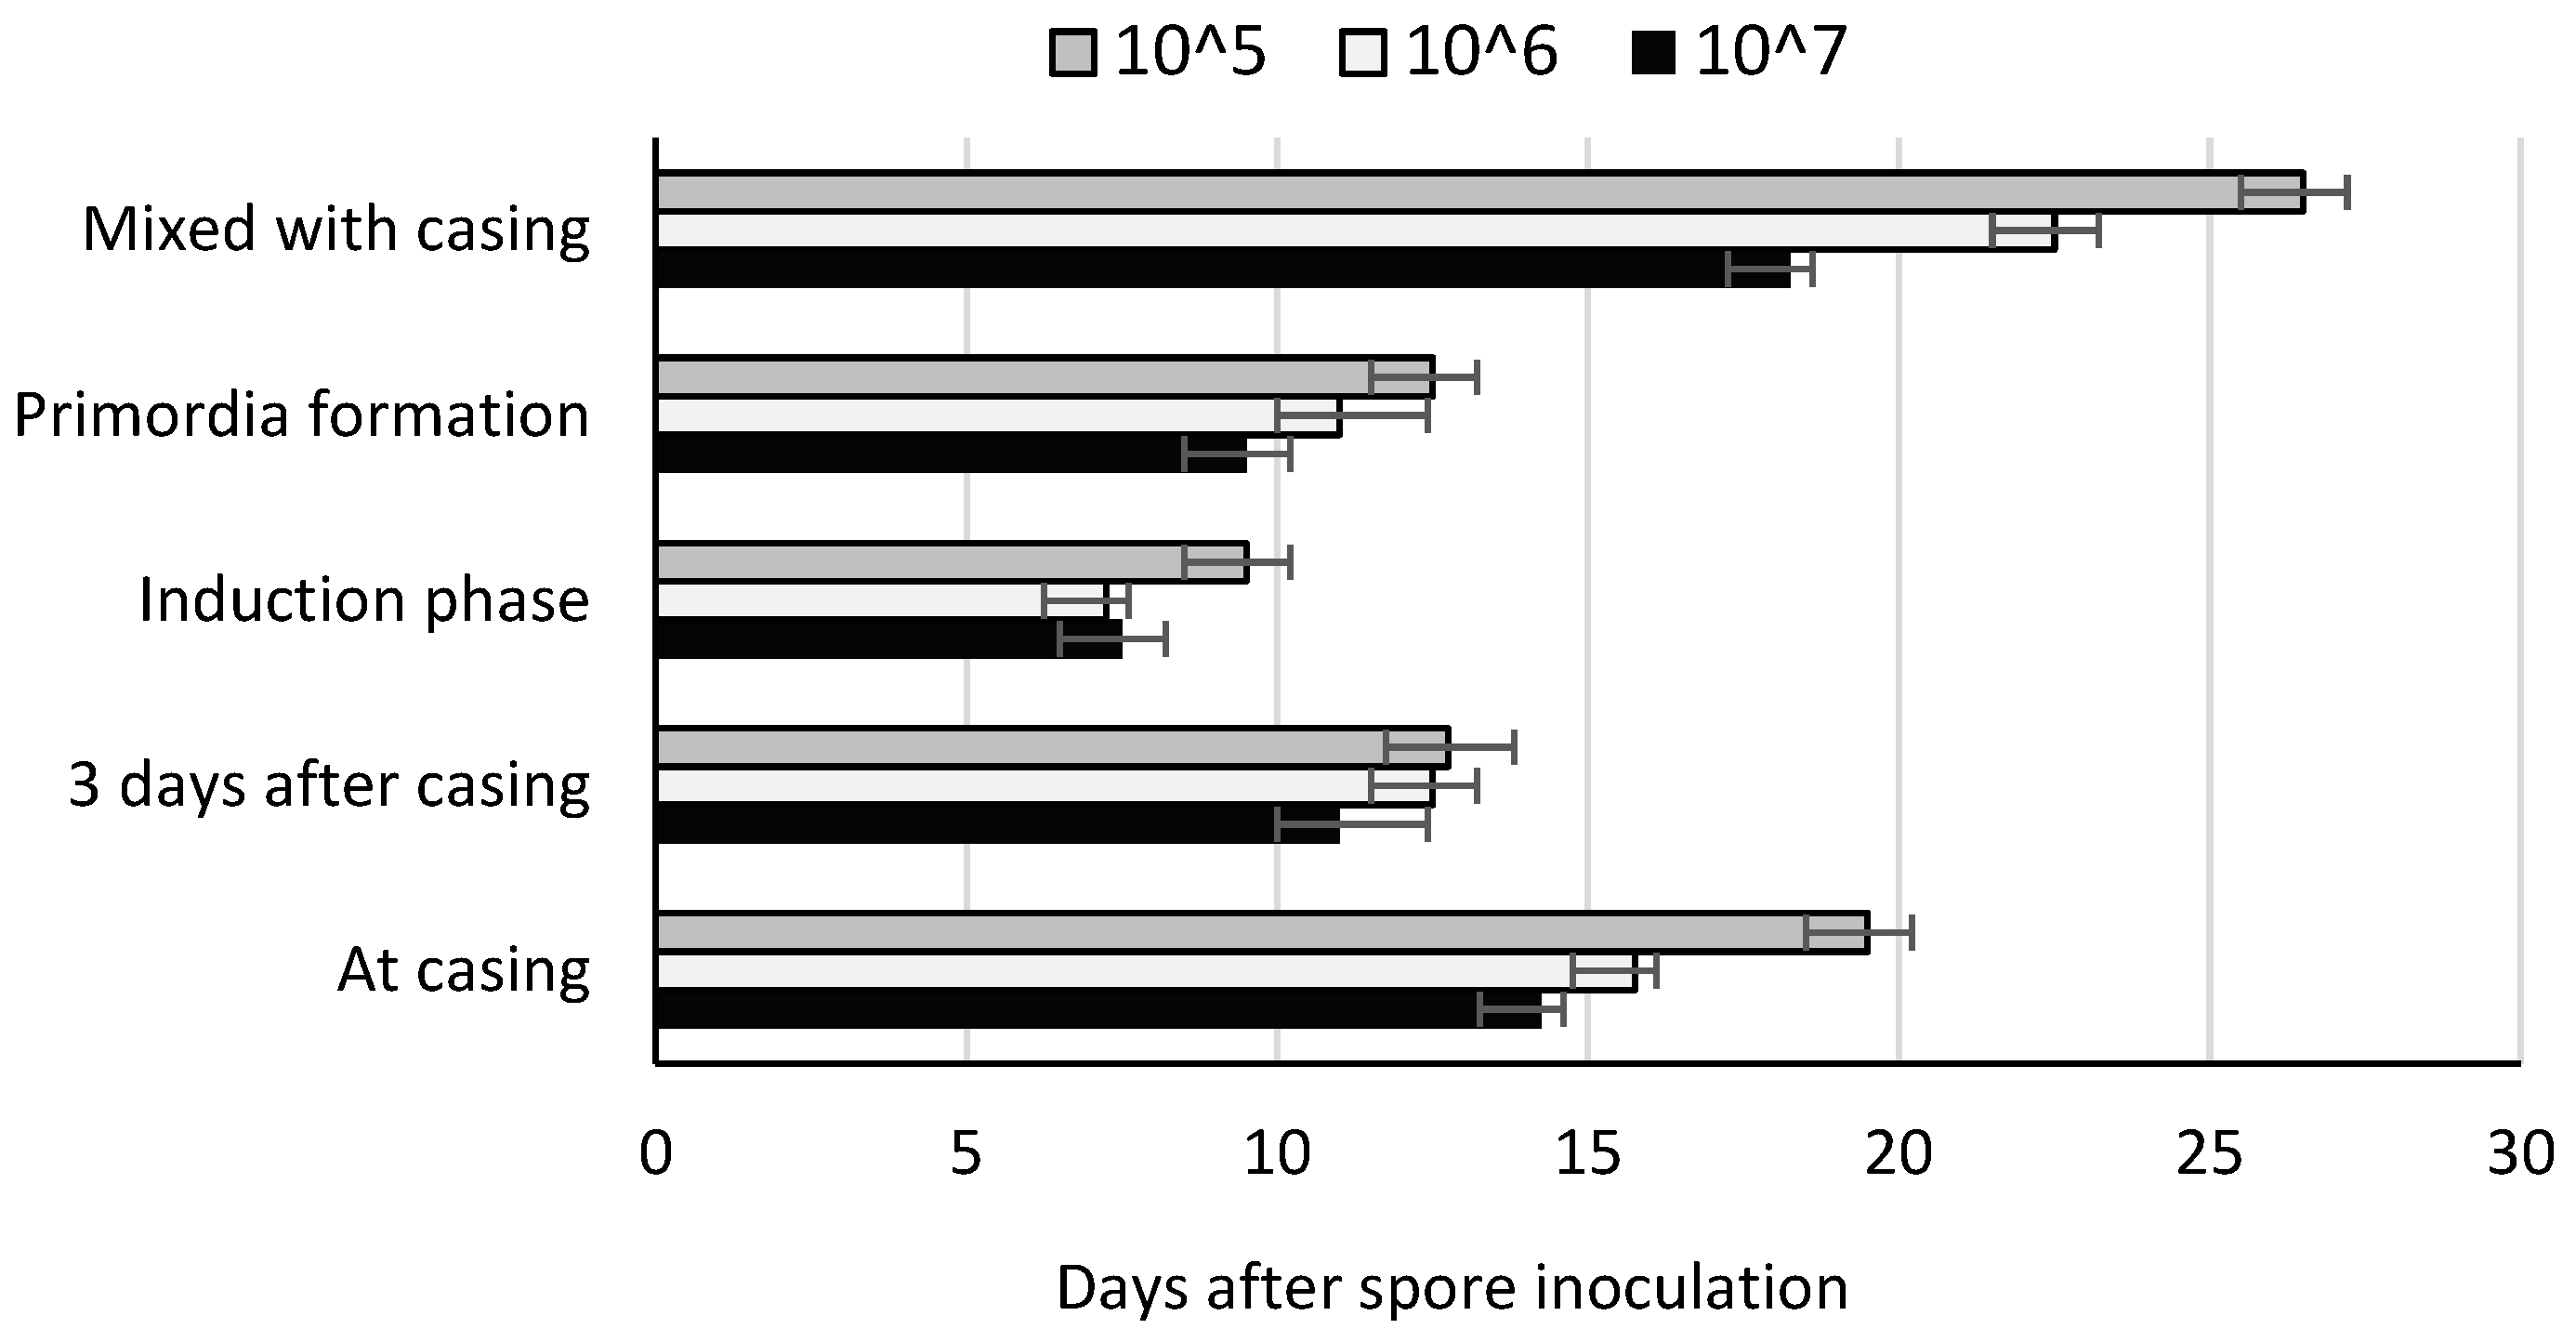
Figure 1. Initial symptoms of dry bubble disease depending on spore concentration (105, 106, and 107 per m2) and time of infection with Zarea fungicola spores. Bars with different shading indicate different spore concentrations. Vertical bars represent ± SE of the means (n = 8; data from two experiments).
Agronomy 15 02464 g001
Figure 2. The number of dry bubble points on the casing soil depending on spore concentration (105, 106, and 107 per m2) and time of infection with Zarea fungicola spores over two flushes. Bars with different shading indicate different spore concentrations. Vertical bars represent ± SE of the means (n = 8; data from two experiments). Means for spore concentration, with the same uppercase letter do not differ statistically (p < 0.05, Newman–Keuls test). Means within time of infection, with the same lowercase letter, do not differ statistically (p < 0.05, Newman–Keuls test).
Agronomy 15 02464 g002
Figure 3. Disease development (AUDPC) over two flushes as affected by spore concentration (105, 106, and 107 per m2) and time of Zarea fungicola infection. Vertical bars represent ± SE of the means (n = 8; data from two experiments).
Agronomy 15 02464 g003
Figure 4. Effect of Zarea fungicola spore concentration (105, 106, and 107 per m2) and time of inoculation on mushroom yield (kg m−2) in the first flush. Vertical bars represent ± SE of the means (n = 4; 1st experiment). Data were analyzed using two-factorial ANOVA. Means for spore concentration, with the same uppercase letter, do not differ statistically (p < 0.05, Newman–Keuls test). Means within time of infection, with the same lowercase letter, do not differ statistically (p < 0.05, Newman–Keuls test).
Agronomy 15 02464 g004
Figure 5. Effect of Zarea fungicola spore concentration (105, 106, and 107 per m2) and time of inoculation on mushroom yield (kg m−2) in the first flush. Vertical bars represent ± SE of the means (n = 4; 2nd experiment). Data were analyzed using two-factorial ANOVA. Means for spore concentration, with the same uppercase letter, do not differ statistically (p < 0.05, Newman–Keuls test). Means within time of infection, with the same lowercase letter, do not differ statistically (p < 0.05, Newman–Keuls test).
Agronomy 15 02464 g005
Figure 6. Effect of Zarea fungicola spore concentration (105, 106, and 107 per m2) and time of inoculation on mushroom yield (kg m−2) in the second flush. Vertical bars represent ± SE of the means (n = 4; 1st experiment). Data were analyzed using two-factorial ANOVA. Means with the same letter do not differ statistically (p < 0.05, Newman–Keuls test). Spore concentration had a significant effect on yield (p < 0.05). Time of inoculation and interaction between factors had no significant effect.
Agronomy 15 02464 g006
Figure 7. Effect of Zarea fungicola spore concentration (105, 106, and 107 per m2) and time of inoculation on mushroom yield (kg m−2) in the second flush. Vertical bars represent ± SE of the means (n = 4; 2nd experiment). Data were analyzed using two-factorial ANOVA. Means with the same letter do not differ statistically (p < 0.05, Newman–Keuls test). Spore concentration had a significant effect on yield (p < 0.05). Time of inoculation and interaction between factors had no significant effect.
Agronomy 15 02464 g007
Figure 8. Biological efficiency (%) in two flushes in relation to Zarea fungicola spore concentration (105, 106, and 107 per m2) and time of inoculation. Bars with different shading indicate different spore concentrations. Vertical bars represent ± SE of the means (n = 4; 1st experiment). Data were analyzed using two-factorial ANOVA. Means for spore concentration, with the same uppercase letter, do not differ statistically (p < 0.05, Newman–Keuls test); Means within time of infection, with the same lowercase letter, do not differ statistically (p < 0.05, Newman–Keuls test).
Agronomy 15 02464 g008
Figure 9. Biological efficiency (%) in two flushes in relation to Zarea fungicola spore concentration (105, 106, and 107 per m2) and time of inoculation. Bars with different shading indicate different spore concentrations. Vertical bars represent ± SE of the means (n = 4; 2nd experiment). Data were analyzed using two-factorial ANOVA. Means for spore concentration, with the same uppercase letter, do not differ statistically (p < 0.05, Newman–Keuls test); Means within time of infection, with the same lowercase letter, do not differ statistically (p < 0.05, Newman–Keuls test).
Agronomy 15 02464 g009
Table 1. Effect of Zarea fungicola inoculation time and spore concentration (105, 106, and 107 per m2) on yield (kg m−2) and biological efficiency (BE%) of white button mushroom over two flushes (1st experiment).
Inoculation TimeMushroom Yield (kg m−2) by Number of Spores per m2 Casing
107 Spores m−2106 Spores m−2105 Spores m−2ControlMean
At casing6.3 ± 0.5 Db11.2 ± 1.7 Cbc14.4 ± 1.5 Bb16.9 ± 0.2 Aa12.2 ± 4.8 b
3 days after casing3.8 ± 1.4 Dc10.1 ± 1.0 Cc13.4 ± 1.0 Bb15.9 ± 0.4 Aa10.8 ± 5.6 c
Induction phase2.1 ± 1.8 Cc8.1 ± 1.7 Bd16.4 ± 1.7 Aa17.1 ± 0.7 Aa11.0 ± 7.2 c
Primordia formation11.2 ± 1.6 Ca12.3 ± 1.0 Ca13.9 ± 0.5 Bb17.2 ± 0.4 Aa13.7 ± 2.8 a
Mixed with casing7.0 ± 1.5 Db11.6 ± 1.6 Cab14.6 ± 2.2 Bb16.7 ± 0.3 Aa12.2 ± 3.9 b
Mean6.1 ± 3.4 D 10.6 ± 1.6 C14.6 ± 1.4 B16.7 ± 0.6 A
Yield loss (%) by number of spores per m2 casing
107 spores m−2106 spores m−2105 spores m−2ControlMean
At casing63.8 ± 3.6 Aab34.1 ± 8.6 Bb14.9 ± 4.9 Cab-37.6 ab
3 days after casing77.3 ± 8.3 Aa36.8 ± 6.9 Bb15.2 ± 6.6 Cab-43.1 ab
Induction phase87.6 ± 12.6 Aa52.4 ± 10.2 Ba3.8 ± 2.7 Cb-47.9 a
Primordia formation33.8 ± 9.8 Ac29.1 ± 3.2 ABb19.1 ± 8.6 Bab-34.0 bc
Mixed with casing56.8 ± 5.6 Ab28.6 ± 9.4 Bb14.3 ± 8.1 Bab-32.8 c
Mean63.9 ± 19.4 A36.2 ± 9.6 B13.5 ± 6.1 C--
Biological efficiency (%) by number of spores per m2 casing
107 spores m−2106 spores m−2105 spores m−2ControlMean
At casing36.0 ± 4.4 Db65.7 ± 9.4 Cbv84.8 ± 8.7 Bb99.7 ± 4.4 Aa71.6 ± 5.8 b
3 days after casing21.3 ± 8.4 Dc59.0 ± 7.6 Cc78.9 ± 10.4 Bb94.8 ± 5.2 Aa63.3 ± 8.0 c
Induction phase12.1 ± 6.5 Cc47.8 ± 13.4 Bd91.7 ± 13.3 Aa96.4 ± 6.4 Aa62.0 ± 11.4 c
Primordia formation64.8 ± 15.4 Ca72.1 ± 4.8 Ca82.2 ± 9.4 Bb98.2 ± 5.9 Aa79.3 ± 8.6 a
Mixed with casing41.6 ± 6.5 Dd68.2 ± 13.1 Cab82.5 ± 22.4 Bb95.2 ± 2.3 Aa71.9 ± 11.2 b
Mean35.2 ± 8.0 D62.6 ± 9.4 C84.0 ± 13.4 B96.9 ± 5.2 A-
Values are presented as mean ± SE (n = 4). Means in the rows, with the same uppercase letter, do not differ statistically (p < 0.05, Newman–Keuls test). Means in the columns, with the same lowercase letter, do not differ statistically, particularly for parameter (p < 0.05, Newman–Keuls test).
Table 2. Effect of Zarea fungicola inoculation time and spore concentration (105, 106, and 107 per m2) on yield (kg m−2) and biological efficiency (BE%) of white button mushroom over two flushes (2nd experiment).
Inoculation TimeMushroom Yield (kg m−2) by Number of Spores per m2 Casing
107 Spores m−2106 Spores m−2105 Spores m−2ControlMean
At casing6.3 ± 0.8 Cb11.8 ± 1.7 Bb15.6 ± 1.8 Aa16.2 ± 0.8 Aa12.5 ± 4.6 a
3 days after casing2.2 ± 0.9 Cc9.6 ± 1.6 Bc13.0 ± 1.4 Aa15.4 ± 0.4 Aa10.1 ± 5.3 b
Induction phase2.0 ± 1.8 Cc7.2 ± 0.7 Bc13.3 ± 0.7 Aa16.1 ± 0.7 Aa9.7 ± 6.3 b
Primordia formation11.3 ± 1.6 Ba13.1 ± 1.6 ABa13.4 ± 1.5 Aba15.2 ± 0.6 Aa13.3 ± 1.5 a
Mixed with casing9.4 ± 1.5 Ba12.0 ± 1.6 Bb15.1 ± 1.1 Aa15.8 ± 0.9 Aa13.1 ± 3.0 a
Mean6.2 ± 3.4 D10.7 ± 2.4 C14.1 ± 1.2 B15.7 ± 0.5 A
Yield loss (%) by number of spores per m2 casing
107 spores m−2106 spores m−2105 spores m−2ControlMean
At casing60.5 ± 13.5 Ab26.2 ± 8.4 Bab3.0 ± 2.4 Ca-29.9 bc
3 days after casing85.8 ± 7.5 Aa37.0 ± 11.7 Ba18.3 ± 8.6 Ba-38.0 b
Induction phase86.1 ± 9.7 Aa54.4 ± 10.8 Ba16.1 ± 9.5 Ca-52.2 a
Primordia formation24.4 ± 5.1 Ac12.1 ± 7.5 Ab10.7 ± 9.4 Aa-15.7 d
Mixed with casing40.4 ± 8.3 Ac24.1 ± 7.1 Aab3.7 ± 3.6 Ca-22.7 cd
Mean59.4 ± 17.7 A30.8 ± 15.4 B10.4 ± 7.1 C--
Biological efficiency (%) by number of spores per m2 casing
107 spores m−2106 spores m−2105 spores m−2ControlMean
At casing36.7 ± 8.2 Cb69.7 ± 7.8 Bb92.0 ± 5.9 Aa95.7 ± 9.2 Aa73.4 ± 8.7 a
3 days after casing12.8 ± 6.4 Cc56.8 ± 13.6 Bc76.7 ± 18.2 Aa90.2 ± 3.3 Aa59.2 ± 10.9 b
Induction phase11.8 ± 5.1 Cc41.4 ± 14.3 Bc78.0 ± 20.6 Aa92.0 ± 12.9 Aa55. 8 ± 12.1 b
Primordia formation66.8 ± 4.9 Ba77.3 ± 9.7 ABa78.5 ± 10.9 Aba87.9 ± 4.5 Aa77.5 ± 7.1 a
Mixed with casing55.5 ± 4.3 Ba70.7 ± 9.6 Bb88.8 ± 11.6 Aa95.2 ± 8.9 Aa77.0 ± 9.2 a
Mean34.4 ± 6.3 D63.2 ± 10.2 C82.6 ± 12.9 B92.2 ± 8.7 A-
Values are presented as mean ± SE (n = 4). Means in the rows, with the same uppercase letter, do not differ statistically (p < 0.05, Newman–Keuls test). Means in the columns, with the same lowercase letter, do not differ statistically, particularly for parameter (p < 0.05, Newman–Keuls test).
Disclaimer/Publisher’s Note: The statements, opinions and data contained in all publications are solely those of the individual author(s) and contributor(s) and not of MDPI and/or the editor(s). MDPI and/or the editor(s) disclaim responsibility for any injury to people or property resulting from any ideas, methods, instructions or products referred to in the content.