Article

Agro-Morphological Traits, Proximate Composition, and Phenotypic Plasticity of Coffea arabica in Contrasting and Very Close Environments in Northern Peru

by
Ligia García
1,2,*,
Jaris Veneros
1,
Carlos Bolaños-Carriel
3,
Grobert A. Guadalupe
1,
Heyton Garcia
1,
Roberto Carlos Mori-Zabarburú
1 and
Segundo G. Chavez
1
1
Instituto de Investigación del Desarrollo Sustentable-Ceja de Selva (INDES-CES), Universidad Nacional Toribio Rodríguez de Mendoza (UNTRM), Amazonas 01001, Peru
2
Facultad de Ingeniería Zootecnista, Agronegocios y Biotecnología, Universidad Nacional Toribio Rodríguez de Mendoza de Amazonas, Chachapoyas 01001, Peru
3
Facultad de Ciencias Agrícolas, Universidad Central del Ecuador, Av. Universitaria, Quito 170129, Ecuador
*
Author to whom correspondence should be addressed.
Agronomy 2025, 15(11), 2465; https://doi.org/10.3390/agronomy15112465
Submission received: 29 September 2025 / Revised: 19 October 2025 / Accepted: 20 October 2025 / Published: 23 October 2025
(This article belongs to the Section Horticultural and Floricultural Crops)

Abstract

Coffee is one of Peru’s most important agricultural commodities, and its productivity is highly influenced by environmental variability. This study aimed to evaluate agro-morphological traits, proximate bean composition, and the phenotypic plasticity index (PPI) of Coffea arabica (Catimor variety) cultivated in three neighboring provinces of Piura: Ayabaca, Huancabamba, and Morropón. Unlike previous studies that broadly compare distant regions, this research focuses on geographically close yet climatically contrasting environments, providing new insight into how microclimatic and edaphic variability shape both morphological and chemical traits. A total of 300 plants were sampled, and 12 morphological descriptors were recorded alongside proximate composition analyses of moisture, crude protein, fiber, ash, fat, and carbohydrates. Multivariate approaches, including cluster analysis, multiple correspondence analysis, and Pearson correlations, were applied to determine groupings and trait associations. Results indicated that 12 morphological variables consistently reflected species-specific descriptors, forming two statistical groups, with Morropón showing the greatest homogeneity. Significant differences (p ≤ 0.05) were observed in the proximate composition of most variables, except for crude fiber and carbohydrates. Morropón beans showed the highest fat and moisture values, while Huancabamba had elevated protein and ash levels. Morphological traits exhibited higher plasticity (PPI = 0.70) compared with proximate traits (PPI = 0.21). These findings reveal that even within short spatial distances, coffee plants exhibit marked phenotypic differentiation driven by local environmental factors, offering a novel, fine-scale perspective on trait variability relevant to breeding and adaptation studies under changing climatic conditions.

1. Introduction

Coffea arabica belongs to the Rubiaceae family [1]. It is cultivated in more than 80 countries around the globe [2] and is an essential commodity. In Peru, the first reports of exports date back to 2007, with sales reaching USD 363,096.9 that year [3]. In 2024, Peruvian coffee was exported to 52 international markets, totaling 101,898 tons [4]. The growing positive performance of this crop was influenced by increases in coffee production in the regions of Pasco (251.7%), Lambayeque (69.3%), Puno (46.2%), Piura (29.3%) and Huánuco (9.7%); even though it was affected in Ayacucho (−90.4%), Ucayali (−64.0%), Junín (−3.3%), Cusco (−2.8%) and La Libertad (−1.8%) [5].
Additionally, this crop currently presents problems due to its susceptibility to pests and diseases, such as rust, which is attributed to its high genetic variability in the field [6]. Additionally, rising minimum growing temperatures and altered rainfall patterns directly impact yields and cup quality, affecting the competitiveness of local production [7]. Additionally, it is essential to consider its possible future uses in the field of biotechnology [8] as a perennial crop with seeds that are difficult to preserve; coffee genetic resources are typically conserved as living plants in the field [9]. Additionally, the high agricultural demands for climate adaptation in crop production make recording the plant’s morphological characteristics and the proximal traits of the beans increasingly important.
The evolution of knowledge on morphological development descriptors helps in planning the stages of genetic improvement and conservation of the species [10]. The diversity of certain agronomic traits (such as coffee yield, canopy size, growth rate, and number of shoots) can be enhanced by adding supplemental water [11], along with various other environmental factors. Furthermore, research indicates that agro-morphological diversity in crops, such as peanuts, is influenced by the geographical origin of the populations [12,13]. Phenotypic plasticity (PP) refers to the ability of a given genotype to produce different phenotypic expressions (such as morphology, physiology, behavior, and other characteristics) based on varying environmental conditions [14]. This concept can even help predict how species will respond to global changes [15]. For example, the shapes of leaves, petals, and entire plants can indicate plant health and even help model climate change [16,17]. Understanding phenotypic plasticity is crucial for predicting species distribution, community composition, and crop productivity under global change conditions [18].
This research aimed to (a) Quantify the agro-morphological and proximal variations in Coffea arabica across three contrasting environments using multivariate analyses (including cluster analysis, multiple correspondence analysis, and correlations) to identify patterns of environmentally induced differentiation. (b) Evaluate the influence of local climatic variables on the expression of morphological and chemical traits in coffee to determine their relative contributions to phenotypic plasticity. (c) Identify the traits with the most significant adaptive capacity, highlighting those whose phenotypic plasticity contributes to stability under varying environmental conditions, and propose functional indicators for future breeding or adaptive management programs. The research questions that arose were: (a) To what extent do environmental differences between geographically close areas modulate the expression of morphological and chemical traits in Coffea arabica? (b) Which agro-morphological and chemical traits exhibit greater plasticity, and how might these serve as functional indicators of adaptation to climate variability in northern Peru? (c) Is there a statistically significant relationship between the plasticity of morphological traits and the proximal composition of the beans, suggesting coordinated adaptive response mechanisms? In this regard, we hypothesize that although Arabica coffee-growing areas are geographically close to one another, the differences in environmental factors lead to significant variations in agro-morphological traits and the proximal composition of the beans, resulting in different levels of phenotypic plasticity between provinces. The findings are expected to serve as a baseline for developing practical management tools and strategies to address genetic, technological, and geographic adaptations in response to changes affecting economically essential crops, such as coffee. Additionally, these results will enhance our understanding of how coffee plants respond to dynamic environmental changes, even when they are located in close proximity to one another.

2. Materials and Methods

2.1. Location of the Study

The Piura region (Latitude: 5°11′40.2″ S; Longitude: 80°37′58.2″ O) is in the northwestern region of Peru. The region comprises 8 provinces and 64 districts, and encompasses 3.1% of the national territory. To the north, it is bordered by Tumbes and the Republic of Ecuador. To the west, it is fronted by the Pacific Ocean. To the east, it is flanked by Cajamarca and Ecuador. To the south, it is adjacent to Lambayeque [19]. The study was conducted in three provinces very close to Peru’s Piura region: Ayabaca, Morropón, and Huancabamba [20] (Figure 1). The three provinces in this region are situated in climates that range from semi-arid to very rainy, with dry winters or high humidity throughout the year. However, the climate can also vary between cold and temperate, depending on the increase in altitude between 1000 and 3500 m above sea level. Furthermore, the provinces of Ayabaca and Morropón also exhibit warm and semi-arid climates, characterized by dry winter and/or spring conditions [21].

2.2. Geographical Proximity and Distinct Climatic Differences in the Study Areas

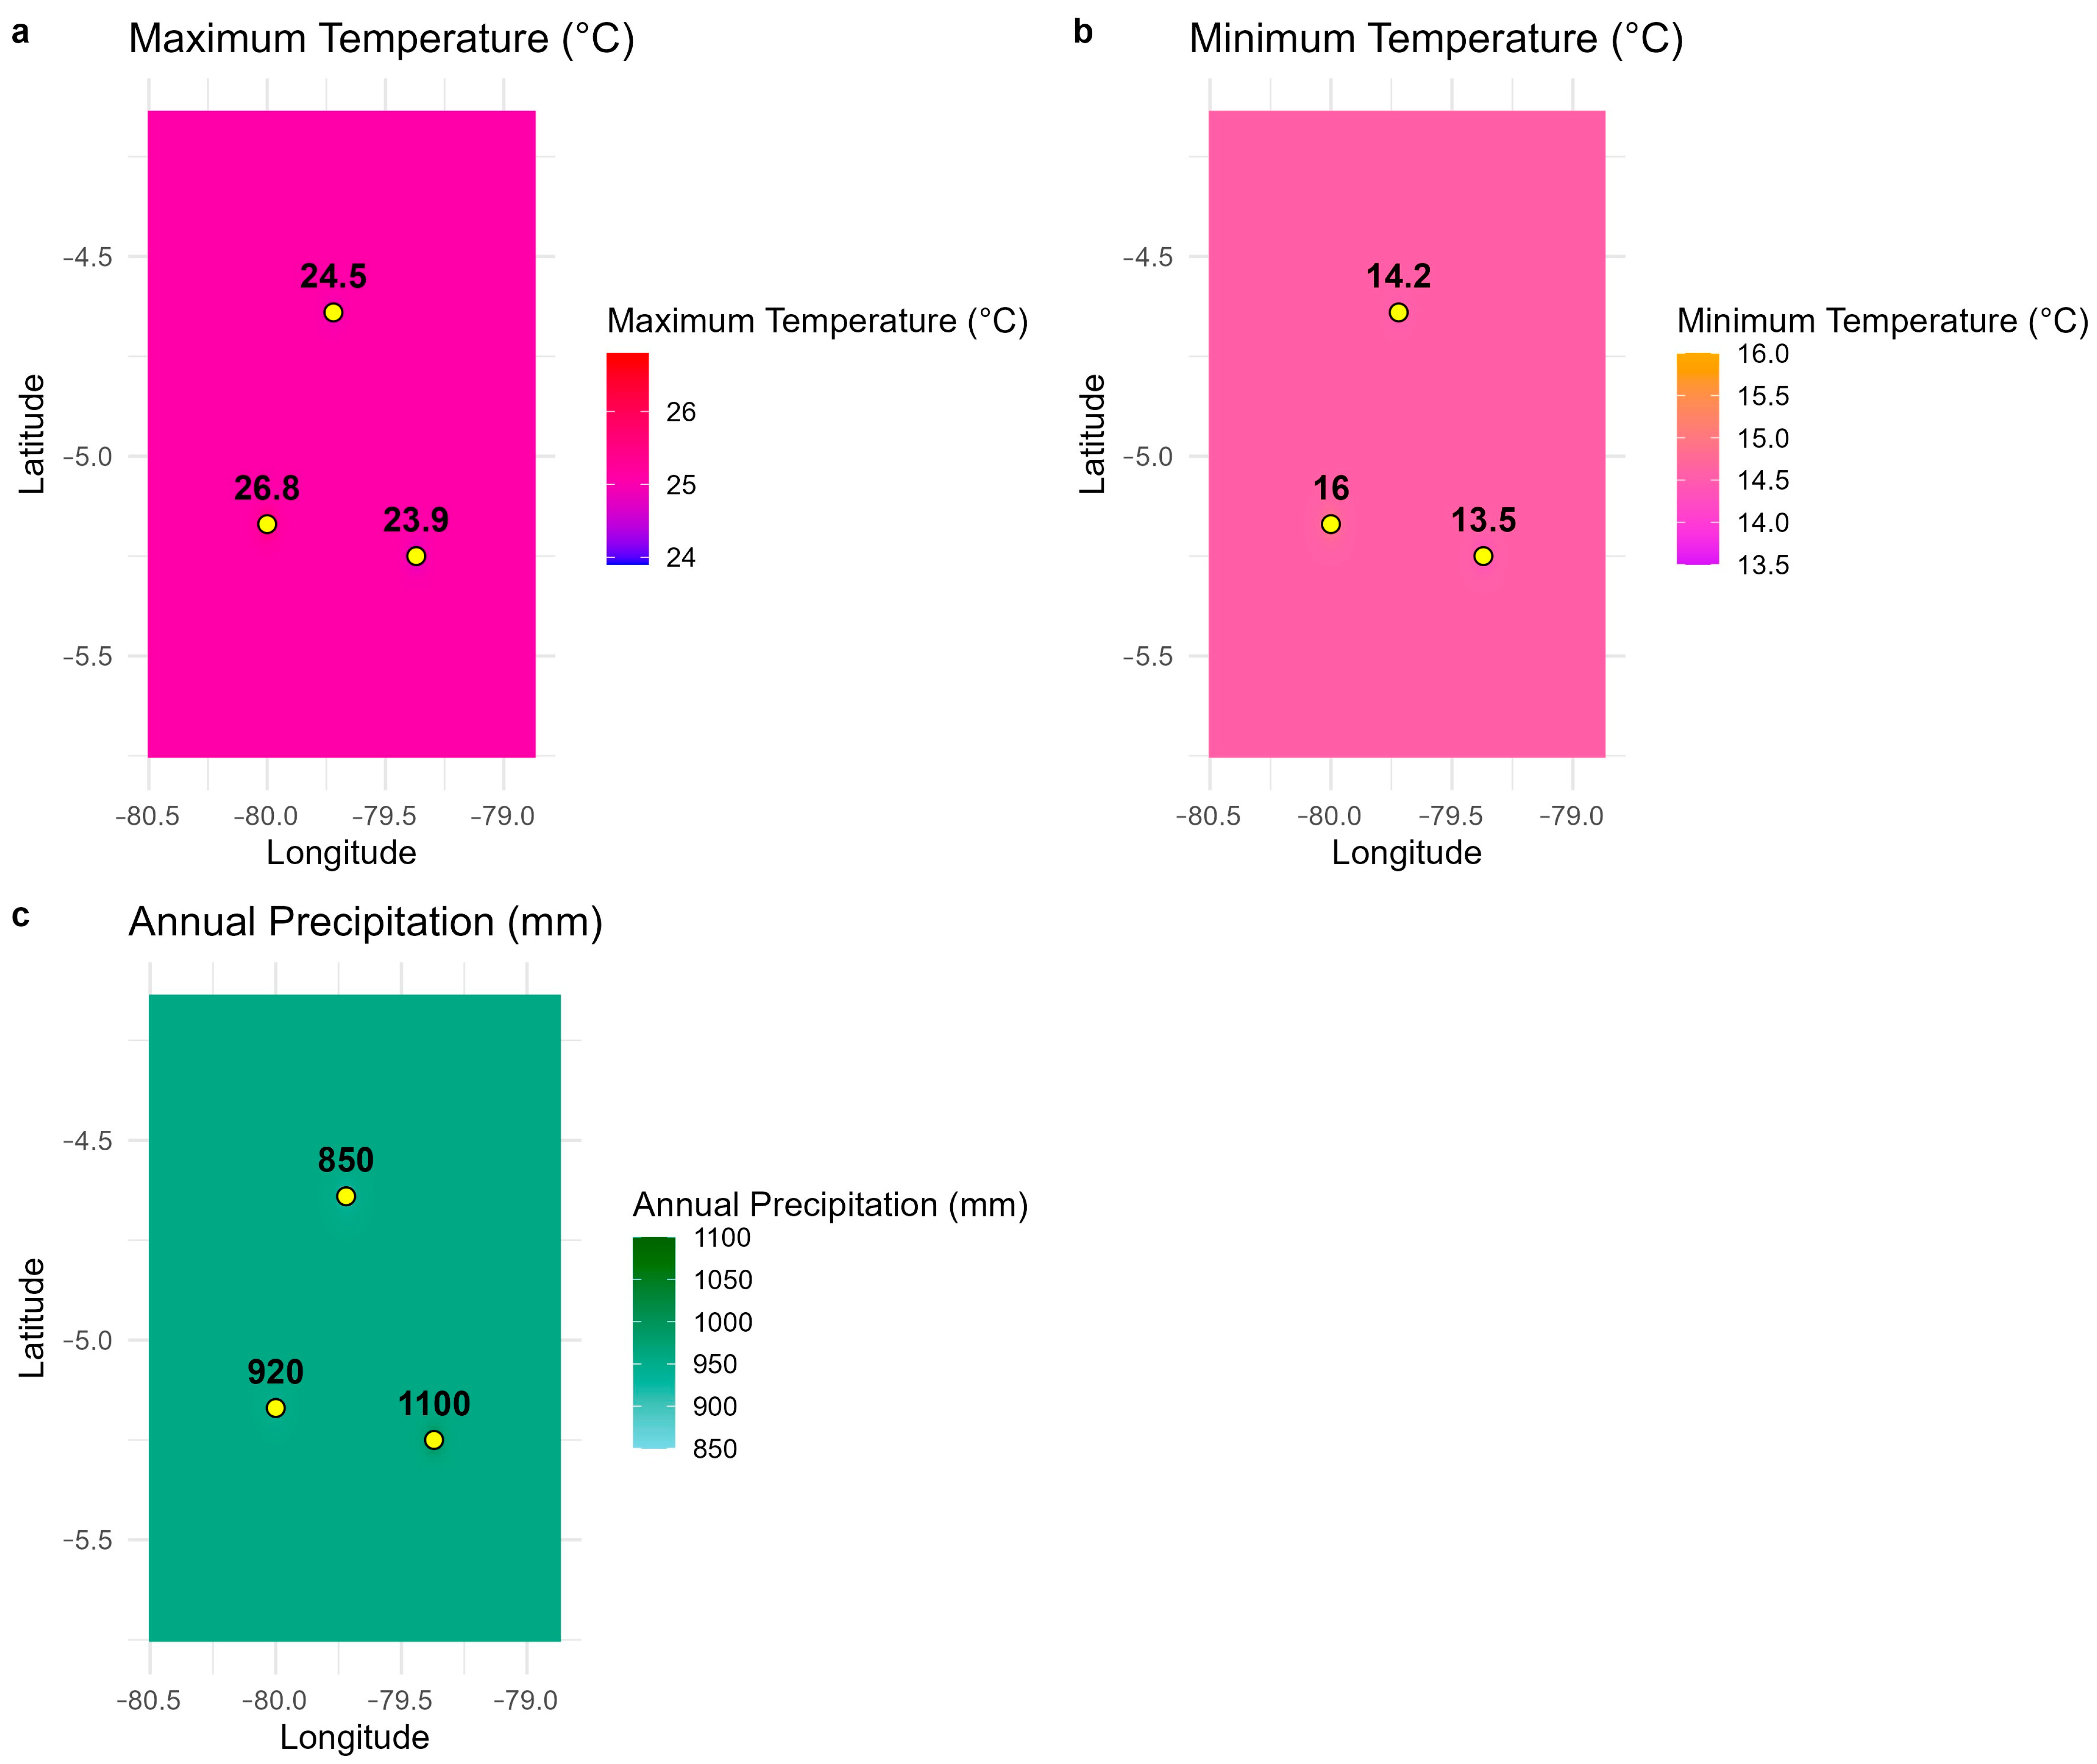
Figure 2 integrates both spatial and statistical information regarding climate variables in the study areas. The upper section presents spatial distribution maps of maximum temperature, minimum temperature, and annual precipitation, along with the locations of coffee-growing provinces and weather stations. This design ensures that the analyzed areas are geographically close and comparable, reducing the likelihood of spatial bias in the evaluation. By including a map of the stations and provinces, the analysis focuses on homogeneous regions in terms of location, thereby reinforcing the validity of the comparisons made. In the lower section, the boxplots illustrate that, despite the geographical proximity of the weather stations, significant differences exist in the climate trends among the different areas. For both minimum and maximum temperatures, as well as annual precipitation, the ranges and medians vary distinctly between provinces. This outcome suggests that local factors—such as altitude, topography, and microclimatic conditions—have a significant impact on climate dynamics. Consequently, the applied methodology merges spatial control (by studying nearby sites) with statistical analysis that highlights significant differences, thereby adding robustness to the study and enhancing the understanding of the climate’s impact on the evaluated production systems.

2.3. Priori Selection and Location of Sampled Plants for Agro-Morphological, Proximal Variables, and Phenotypic Plasticity

The method proposed by Yirga [22] was used to analyze genetic variability, identify plants, and conserve genetic resources. Each coffee-growing zone was assigned a specialist engineer to coordinate the activities of field technicians, ensuring the effective implementation of the organizational structure established for the project. The objective of this coordination was to facilitate the sampling process in the designated zones. A sampled plant per area was selected based on its age, with a maximum of five years. Variety was sourced from seed companies endorsed by the Instituto Nacional de Innovación Agraria (INIA) and the Servicio Nacional de Sanidad Agraria del Perú (SENASA) (Aromas de Montaña, Villa Rica, Peru). The regional government of Piura selected the Company (Aroma de Montaña). A total of 100 representative plants were randomly selected from three coffee-growing areas (from 10 orchards in each zone) belonging to three provinces (Ayabaca, Huancabamba, and Morropon) of the Piura region, in 2024. A total of 300 Catimor plants in full productivity under a shaded agroecosystem were analyzed (without shadow). This variety is representative of the region and its surrounding areas [23]. To minimize potential pseudoreplication, the orchards per zone were selected within homogeneous microclimatic and edaphic conditions, ensuring comparable management practices and elevation ranges. Within each orchard, ten plants were randomly chosen to represent the local population while reducing environmental bias. Although the study design did not treat individual orchards as independent experimental units, the analysis focused on comparing mean responses among the three provinces (Ayabaca, Huancabamba, and Morropón) as representative environmental units. This approach provides a robust assessment of regional patterns while maintaining field representativeness under practical field constraints. A standardized evaluation form was used for data collection, which included general information regarding 12 variables that encompass the morphological descriptors utilized to characterize arabica coffees (Table 1) [22].

2.4. Proximal Characterization

The same individual plants sampled for agro-morphological analysis were randomly chosen, and 0.5 kg of ripe coffee beans were collected from each study area: Huancabamba, Ayabaca, and Morropón. These samples were taken to the Laboratorio de Nutrición (LABNUT) at the Universidad Nacional Toribio Rodríguez de Mendoza de Amazonas (UNTRM).
Proximate composition was determined according to standardized AOAC procedures. Moisture content (%) was quantified by oven-drying at 105 °C to constant weight (AOAC 925.10).
Crude fat. Total carbohydrates (%) were estimated by difference: 100 − (moisture + protein + fat + ash + fiber). All analyses were performed in triplicate.
A bromatological characterization of the samples was performed through a proximal analysis of the coffee beans in their parchment state. The moisture percentage was quantified using the AOAC method (%) [24]. The protein content (%) was determined by estimating the total nitrogen content according to the Kjeldahl method outlined in the AOAC method number 984.13 [25]. For crude fiber analysis, a Tecator fiber analyzer and the Ankom Technology Corporation® ANKOM (AOCS Ba6a-05) procedure were used [26]. The total ash content was measured using the QSAE method by incineration in a muffle furnace at 550 °C (AOAC 923.03) [27,28]. Crude fat (%) was extracted by Soxhlet extraction with petroleum ether (AOAC 920.39) using the high-pressure solvent extraction method [29]. Finally, available carbohydrates were calculated by determining the difference among the five macromolecules analyzed in the proximal analysis [30].

2.5. Phenotypic Plasticity Index (PIR)

In this study, we analyzed various variables, including Moisture, Crude Protein, Crude Fiber, Ash, Crude Fat, Carbohydrate, Growth Habit, Stem Habit, Branching Habit, Angle of Insertion on the Main Stem, Young Leaf Tip Color, Leaf Shape, Leaf Apex Shape, Stipule Shape, Fruit Shape, Fruit Color, Calyx-Limb Persistence, and Fruit Ribs. We considered the difference between the minimum and maximum mean values observed among 300 plants from three closely located provinces within the Piura region. Unlike commonly used methods for quantitatively estimating phenotypic plasticity, we applied the Phenotypic Plasticity Index (PIR) in this research. This index is calculated using the formula: (maximum mean − minimum mean)/mean at which the maximum growth rate is attained. This method has intermediate complexity, assumes normality, and requires knowledge of Relative Growth Rate (RGR) [31] Our research examines a diverse range of environments, considering both the slope of the reaction norm and the coefficient of variation [32]. We focus on three areas that, despite being geographically close, exhibit distinct characteristics. It is important to note that when responses vary across environments—such as when phenotypic values are higher at one end of an environmental gradient [33], specific indices, like the plasticity index of response (PIR), which uses maximum and minimum values, can serve as better estimators of overall plasticity [32]. This mean-based approach offers a comparative measure of how traits respond in different environments. While it does not account for variance among individual plants or their reaction norms, this method is suitable for survey-based datasets where replication is hierarchical rather than strictly experimental. Therefore, the PPI results should be interpreted as indications of relative differences in trait responsiveness among the provinces, rather than as precise estimates of genotypic plasticity.

2.6. Statistical Analysis

The results were analyzed using descriptive statistics in InfoStat software version 2020 (Córdoba, Argentina). Sector diagram plots were created for qualitative data. In contrast, a sector dendrogram was constructed after performing a hierarchical cluster analysis using the nearest neighbor method and squared Euclidean distance for quantitative data. Additionally, a stacked bar chart and a Pearson correlation plot were generated using R software (https://www.r-project.org/). A multiple correspondence analysis was also conducted to determine the relationships between the various locations evaluated within the region and the bromatological characteristics of the coffee bean. All chemical analyses were carried out in triplicate. For qualitative variables, the data were subjected to the Kruskal–Wallis ANOVA (p < 0.05) [34], and means were compared using the Tukey test. Assumptions of normality and homoscedasticity were assessed, and when necessary, transformations were applied to achieve a normal distribution [35].

3. Results

3.1. Agro-Morphological Characteristics in the Coffee Crop

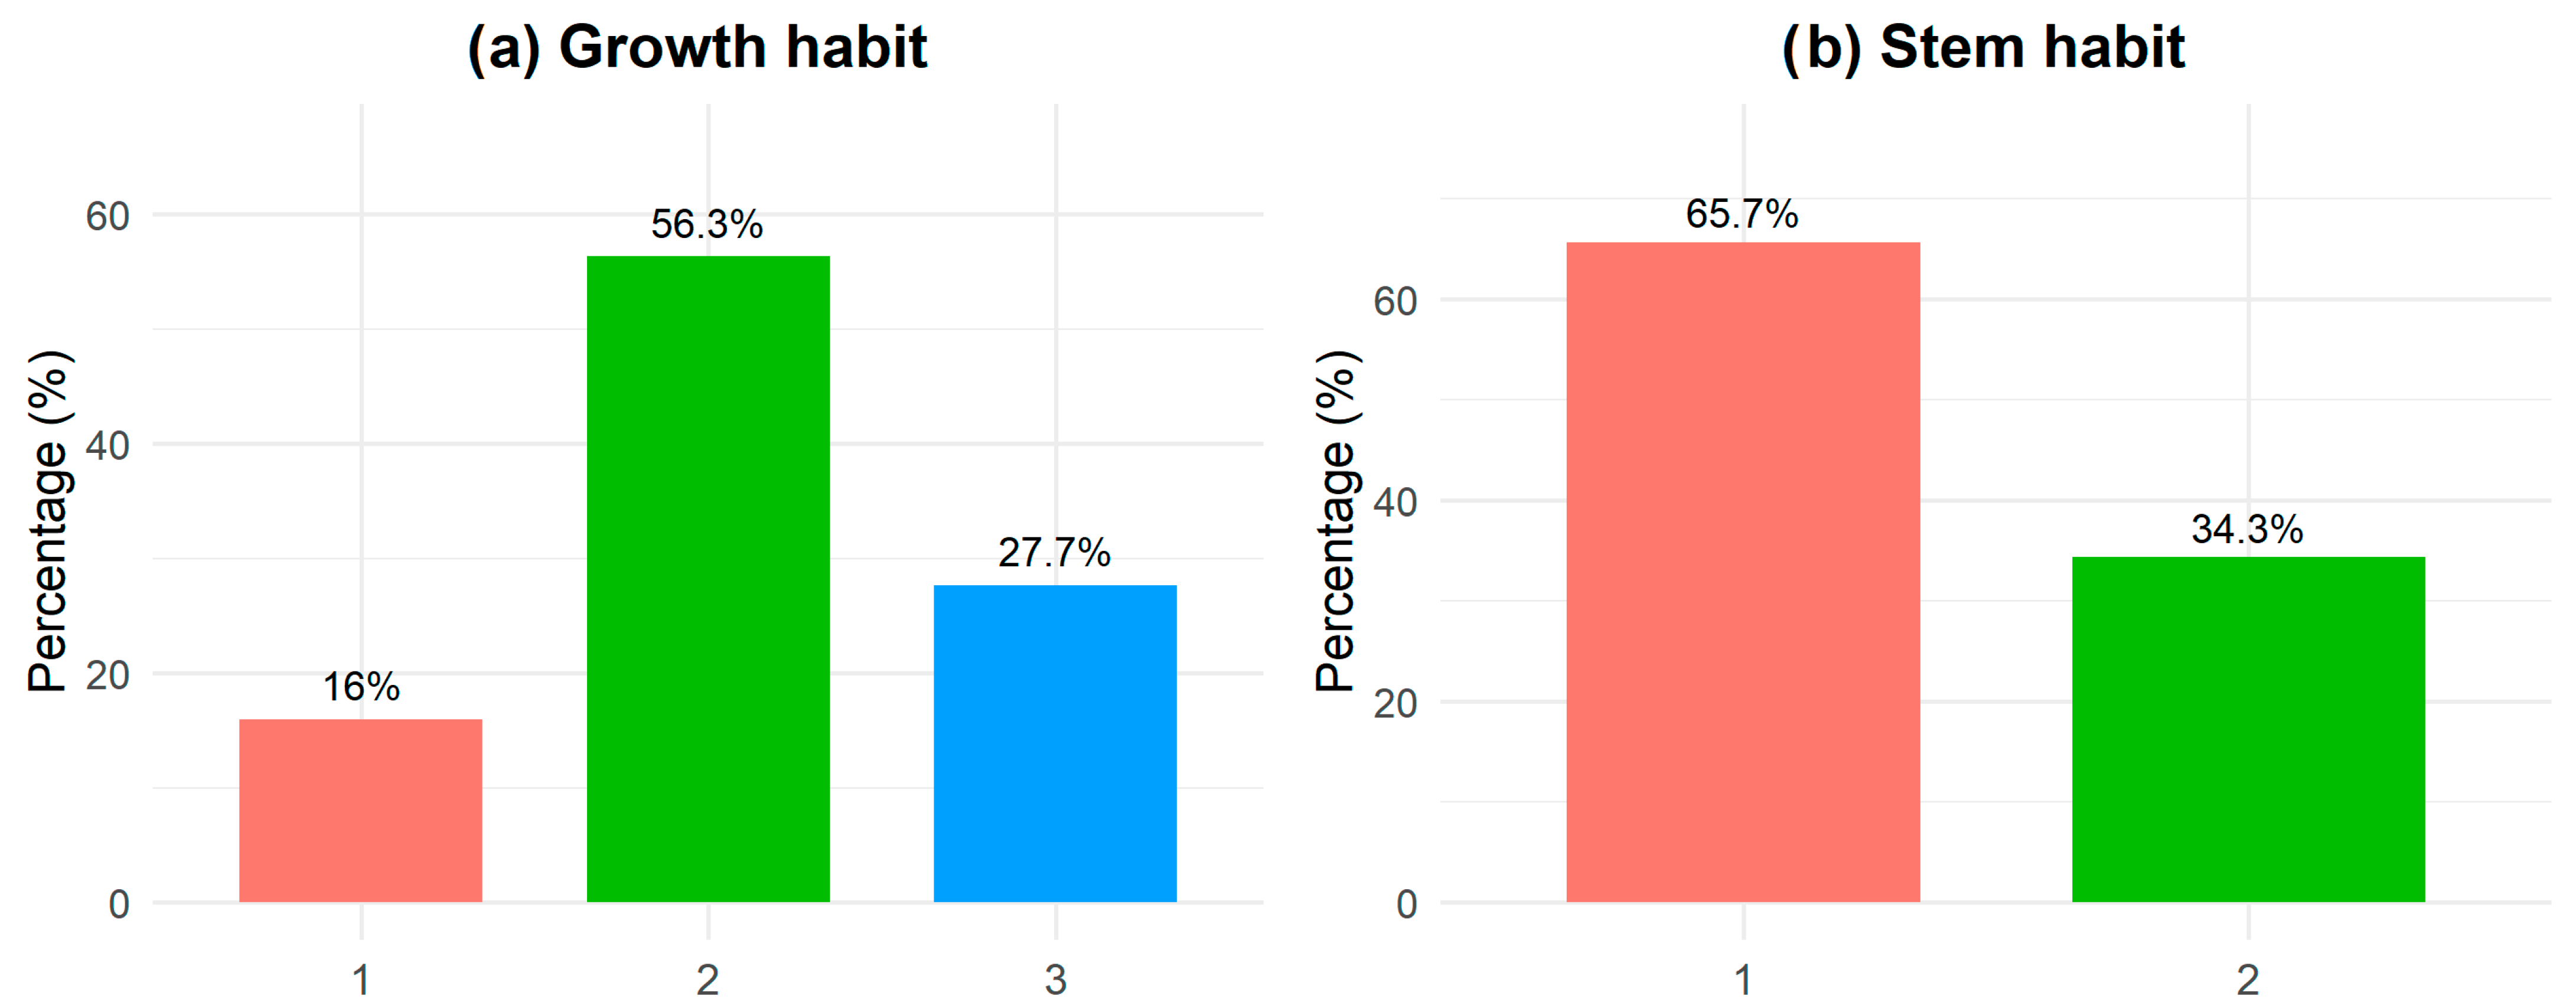
Figure 3 illustrates the morphological characteristics of growth habit (Figure 3a) and stem habit (Figure 3b) for organic coffee cultivation in the Piura region. Regarding growth habit, 56% of the plants exhibited an intermediate growth habit, which is the highest percentage, followed by 28% showing a compact growth habit and 16% with an open growth habit. For stem habit, 66% of the sampled plants had a flexible stem type, while 34% had a complex type. All plants had a semi-erect main stem with a specific insertion angle.
The characteristics of young leaf tip color are as follows: 49.3% are green, 42.7% are brownish, and 8% are greenish (Figure 4a). Regarding leaf shape, 56.3% are elliptic, 23% are ovate, and 20.7% have lanceolate shapes, which represents the lowest percentage (Figure 4b). Four different stipule shapes were identified: the majority (41.3%) are ovate, 29.1% are triangular, 16% exhibit a different triangular shape, and the lowest percentage (14%) is delta-shaped (Figure 4c).
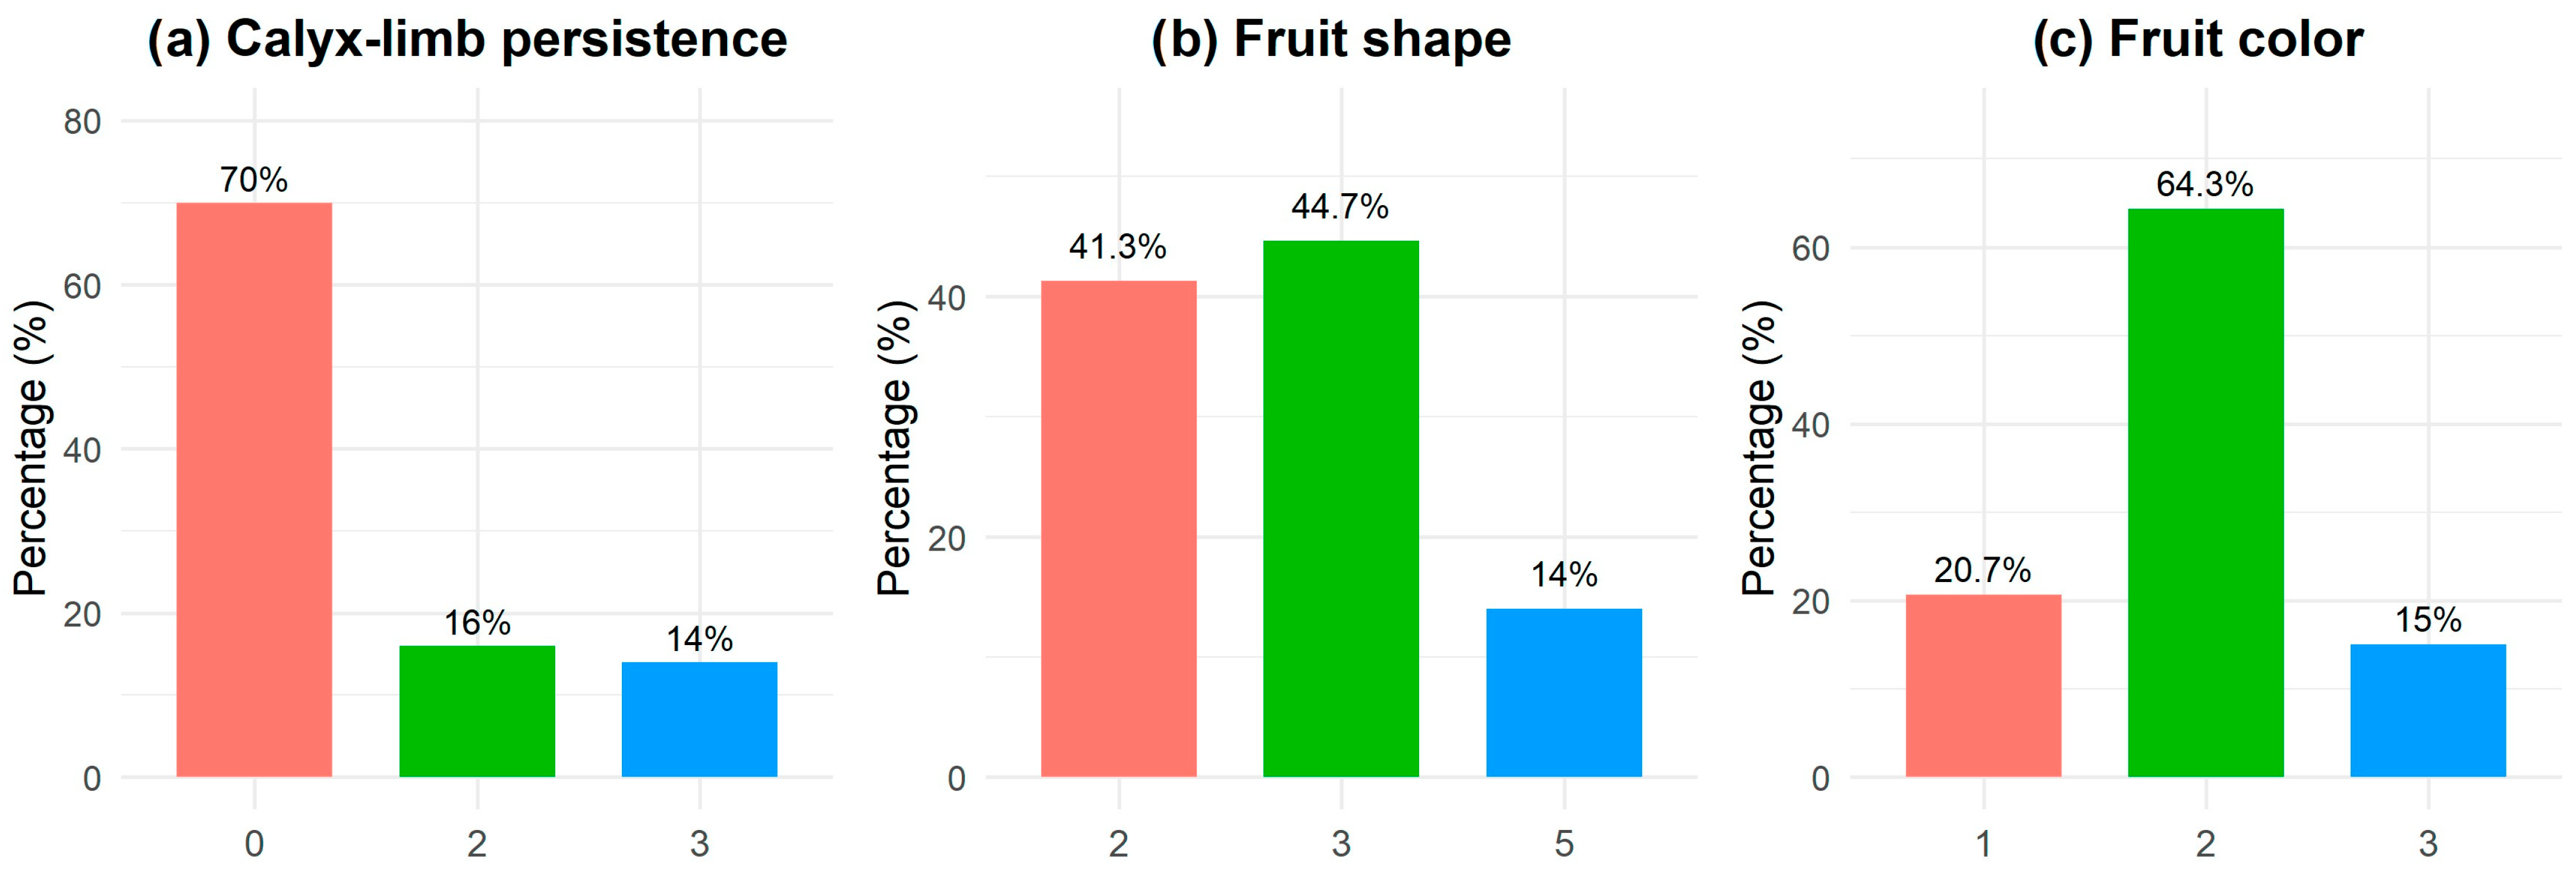
Out of the total number of plants sampled for Calyx-limb persistence, 70% were classified as non-persistent, while 16% exhibited Calyx-limb persistence and 14% undefined (Figure 5a). Additionally, three fruit shapes were identified: the majority, at 44.7%, were elliptical, followed by 41.3% that were round, and 14% that were oblong (Figure 5b). In terms of fruit color, 64.3% were dark red, 20.7% were light red, and only 15% were red.
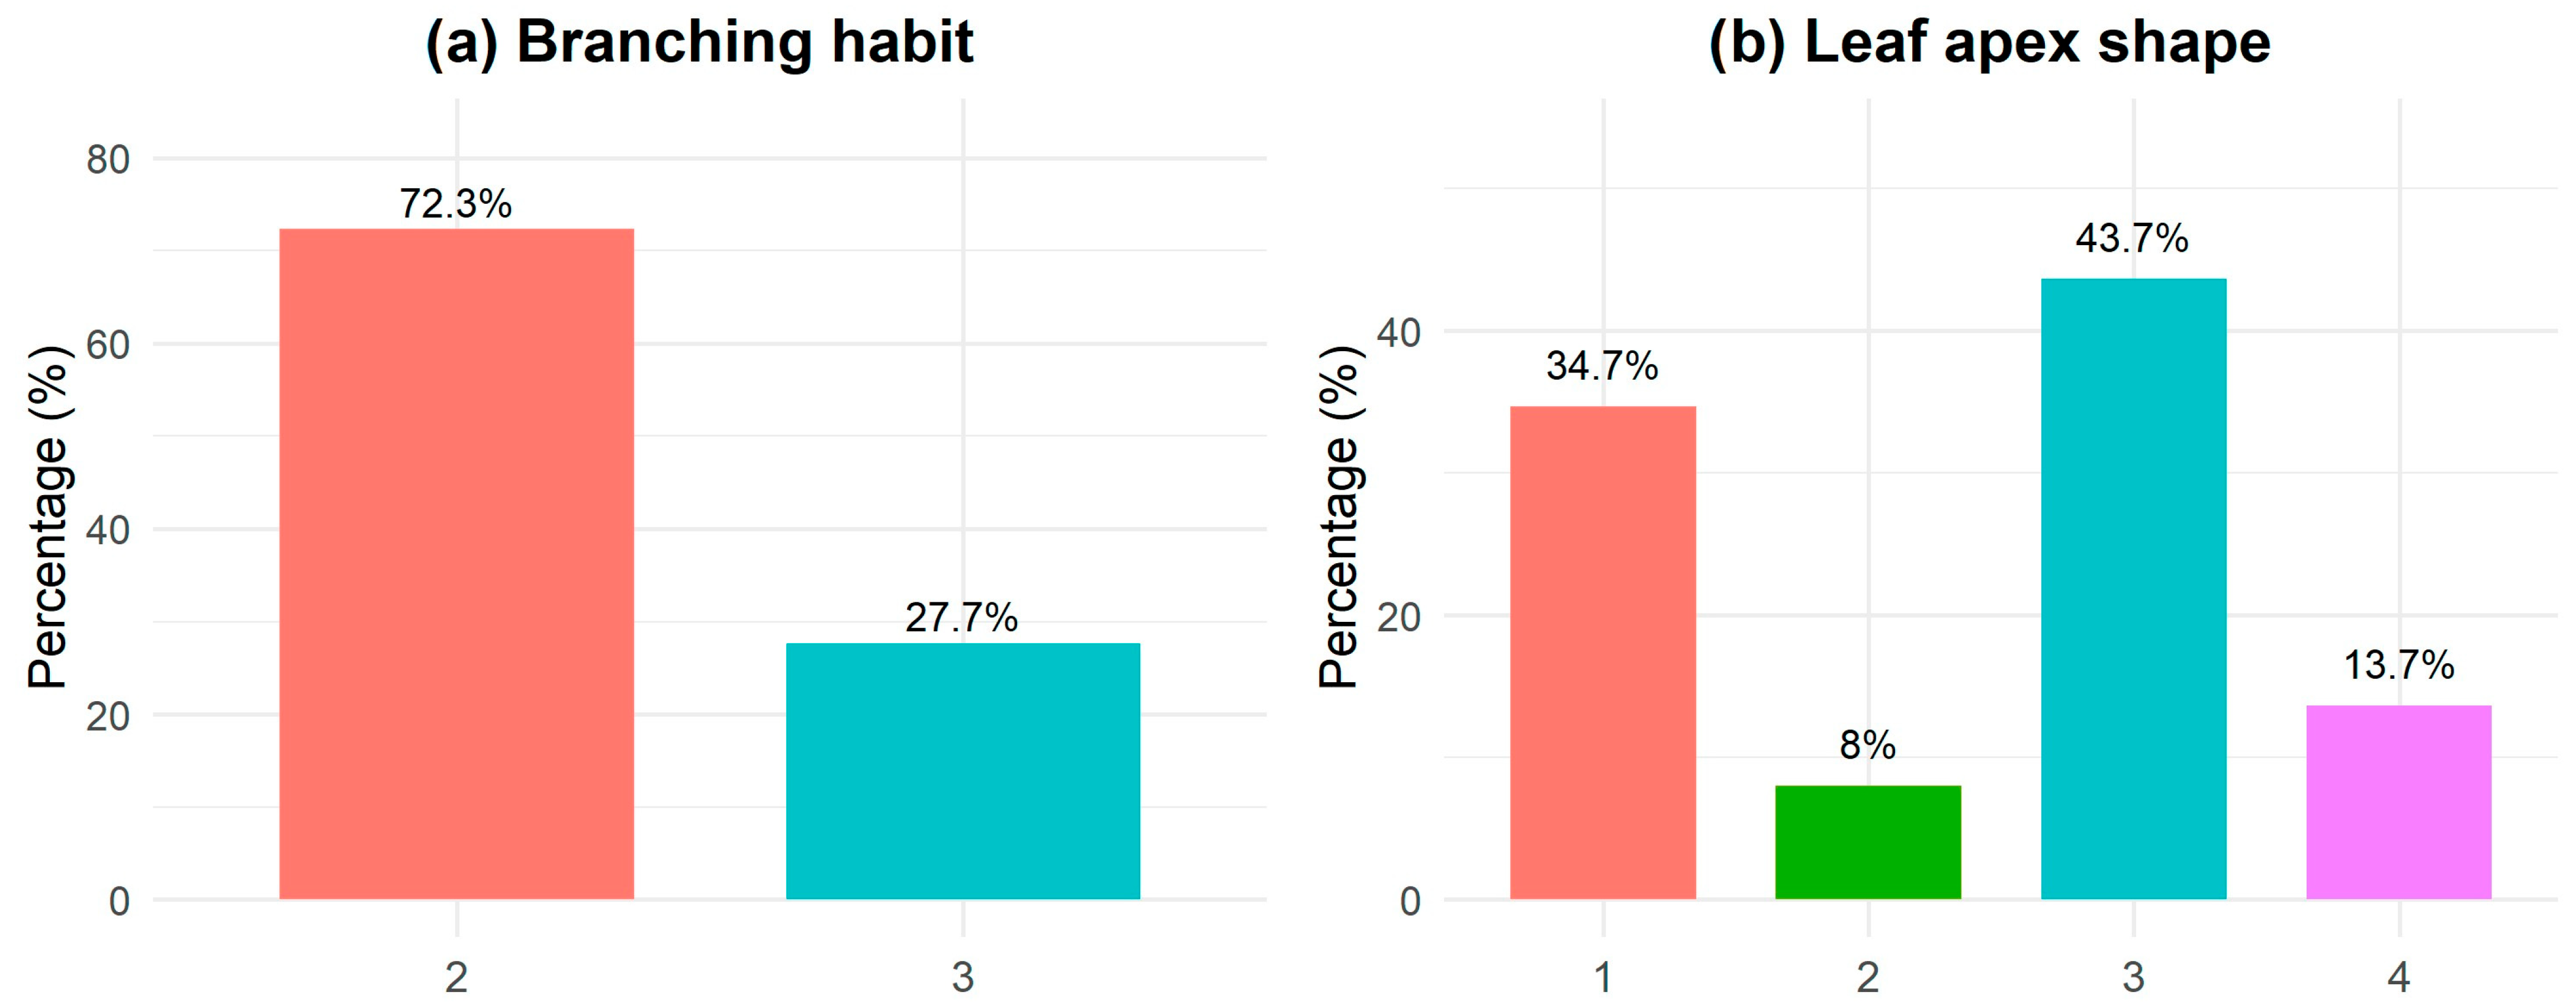
Figure 6 illustrates the characteristics of branching habit (Figure 6a) and leaf apex shape (Figure 6b). In particular, 72.3% of the plants exhibited numerous primary branches with only a few secondary branches, while 27.7% had many primary branches along with many secondary branches. Regarding leaf apex shape, four characteristics were predominant: the acuminate leaf shape had the highest percentage at 44%, followed by the round shape at 35%. The obtuse and acuminate shapes comprised 14% and 8%, respectively. Notably, none of the plants displayed fruit ribs.
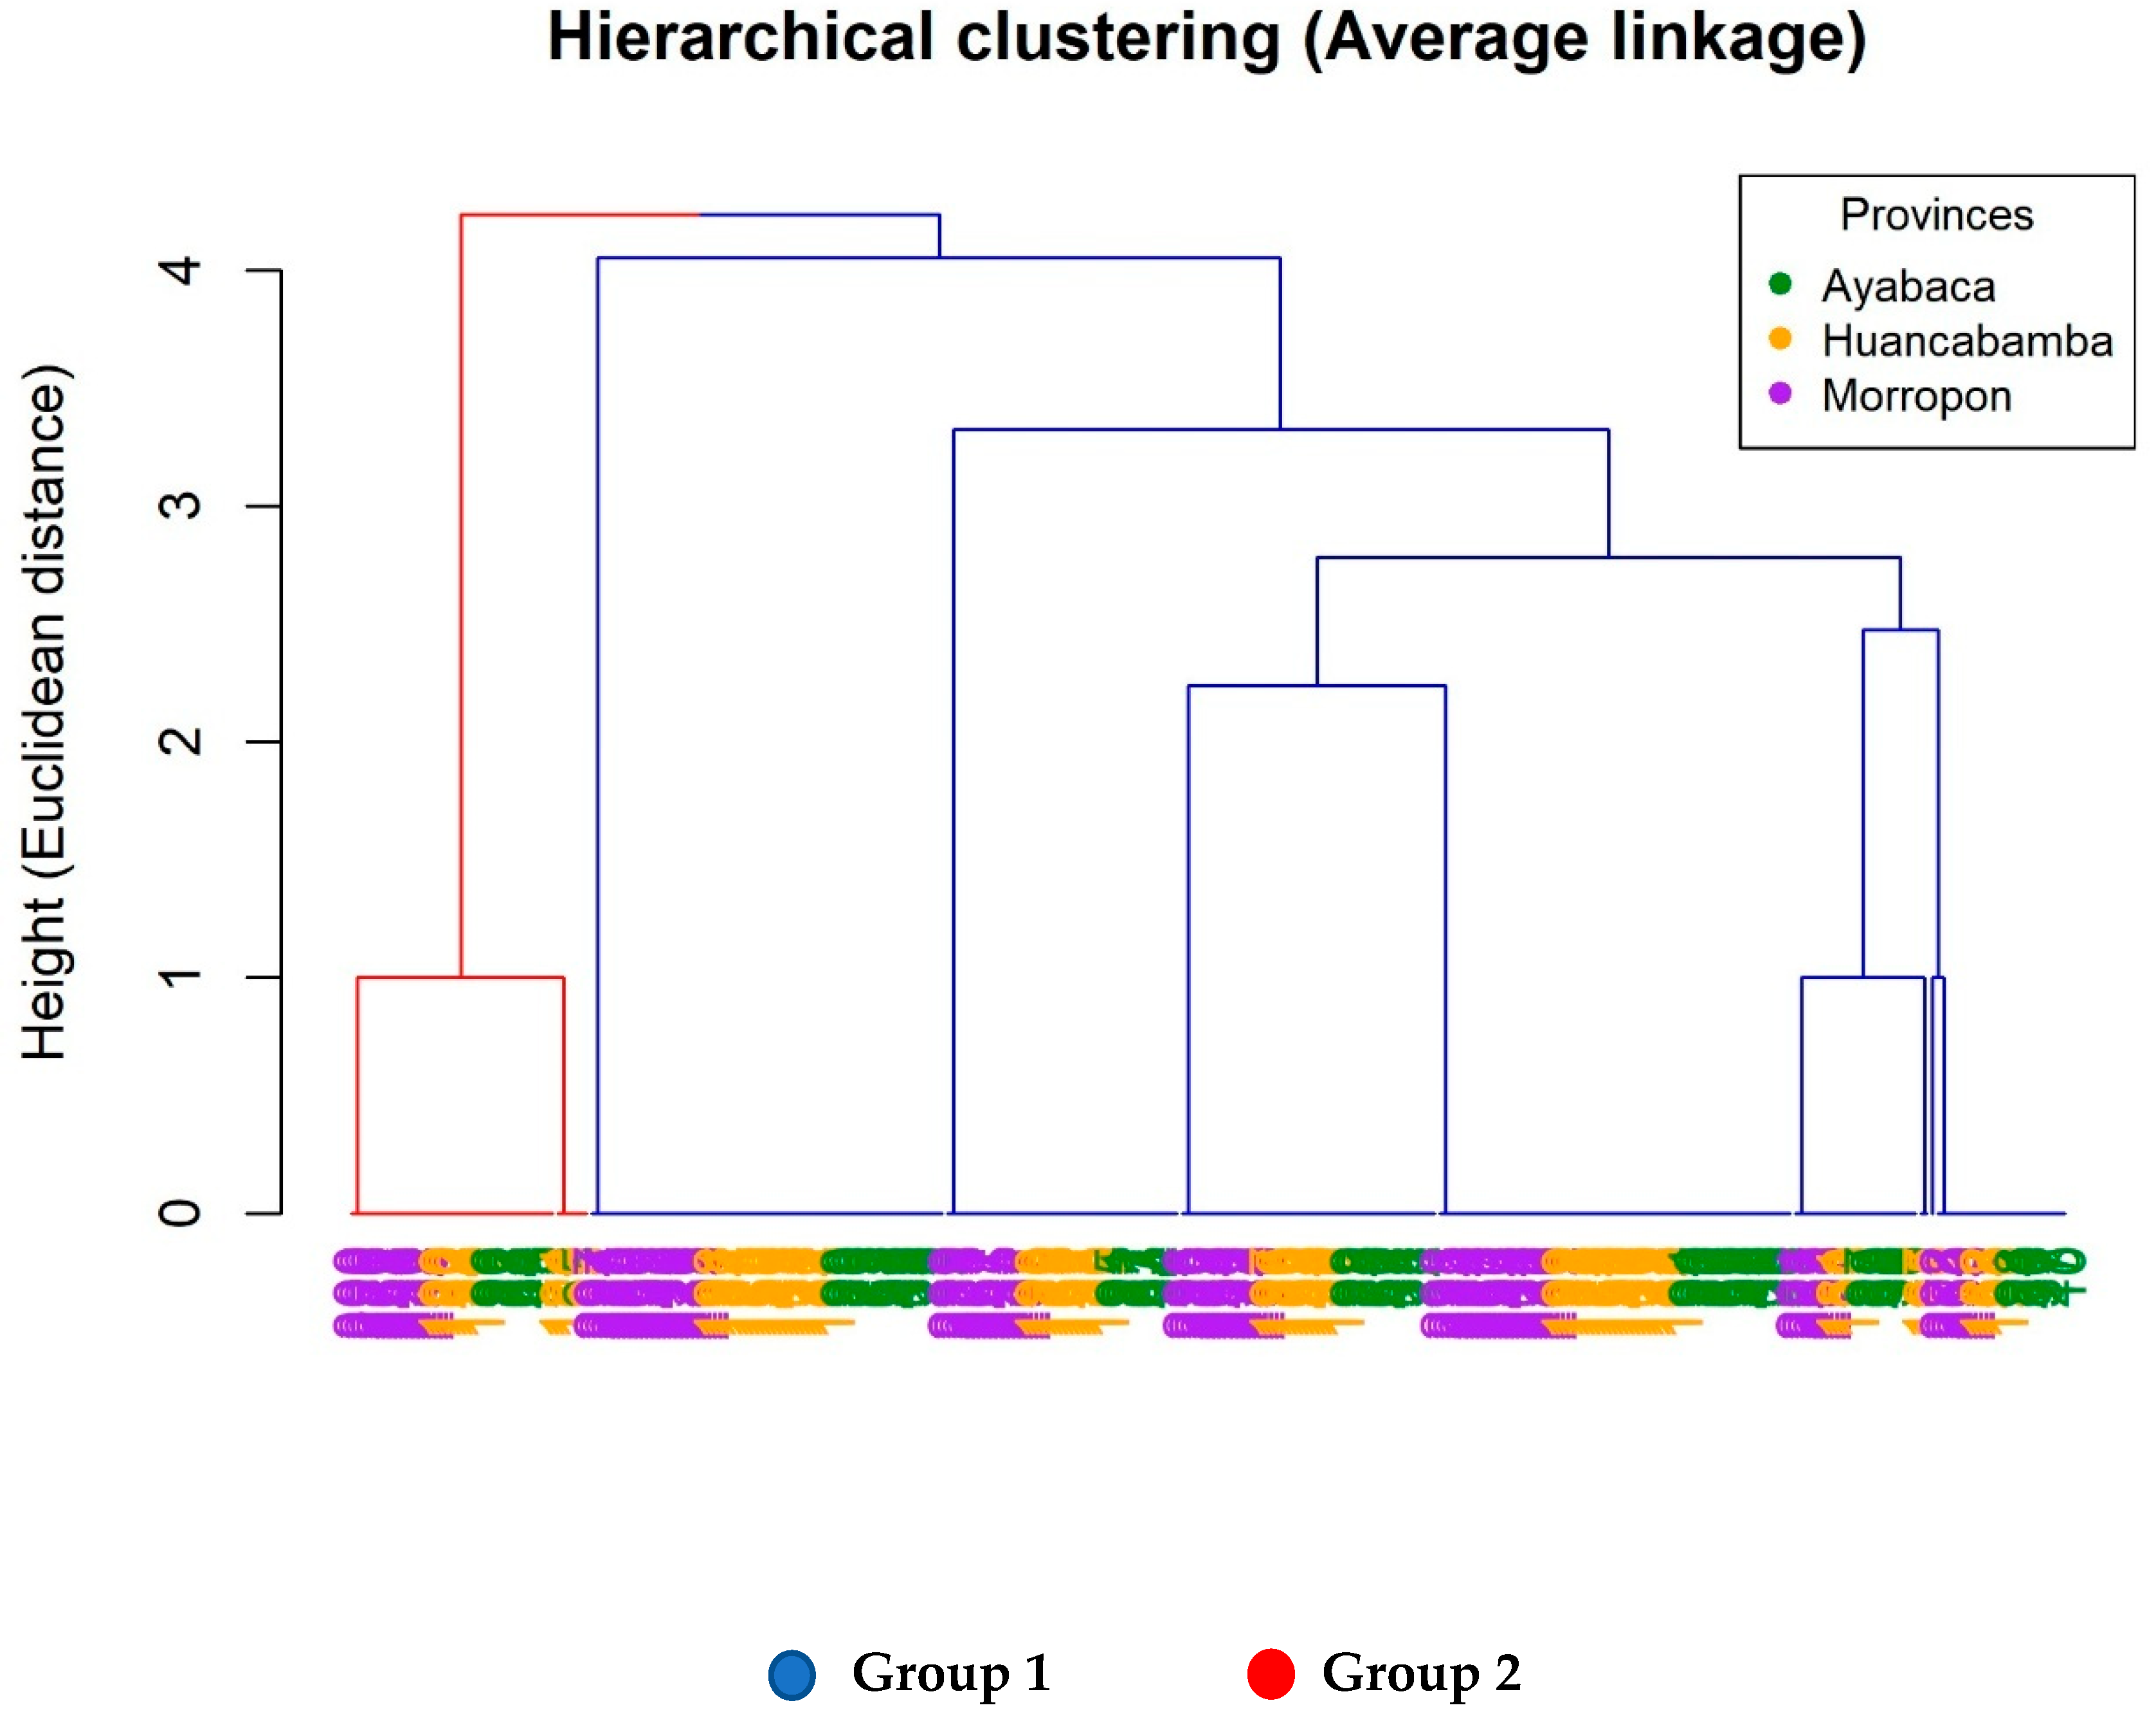
Clusters according to morphological descriptors in three zones with coffee cultivation in Piura. The analysis identified two distinct statistical groups. Most plants in Group 1 were primarily found in the provinces of Ayabaca and Huacabamba, while Group 2 consisted mainly of plants evaluated in Morropón (Figure 7).

3.2. Proximal Characteristics

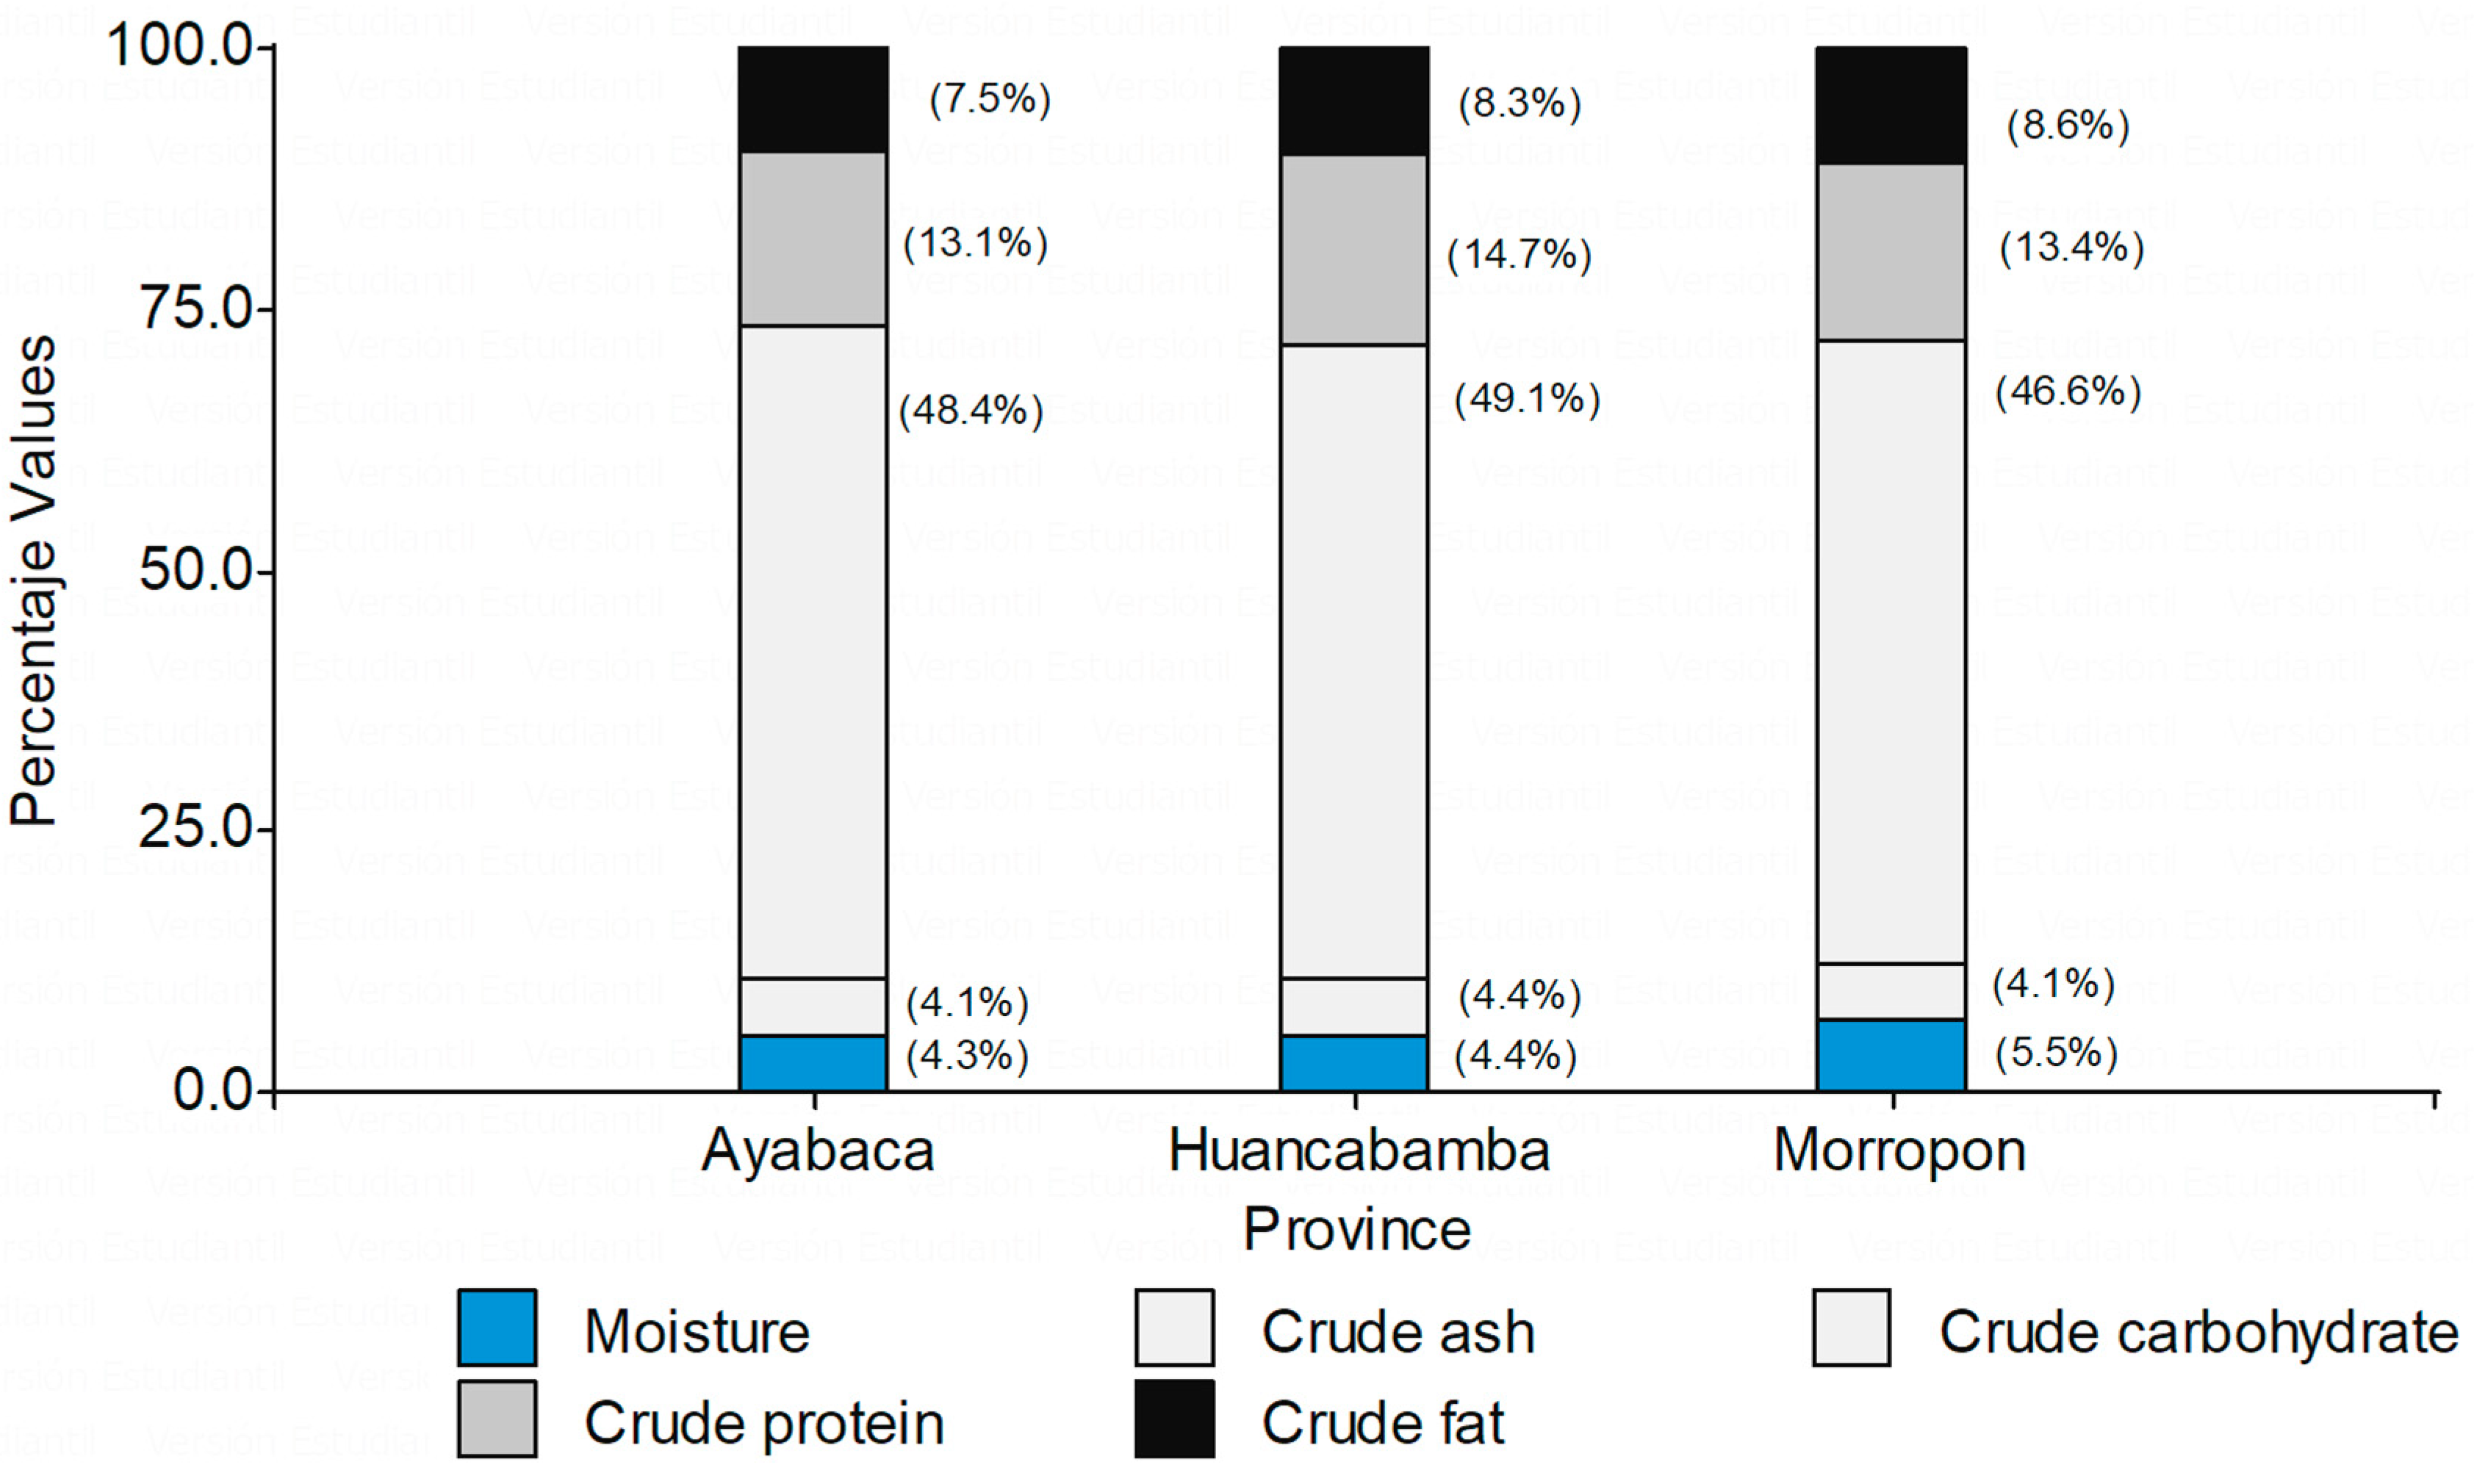
Proximal characteristics exhibit statistical variation depending on the evaluation sites, except for the values of crude fiber and carbohydrates, where we accept the null hypothesis of equality between the study areas. In contrast, statistical significance is observed in moisture, protein, ash, and crude fat, with two distinct statistical groups identified for these variables. Specifically, the moisture content in the grain ranges from 4.31 to 5.43%, with Ayabaca and Huancambamba forming a single statistical group. Additionally, crude protein levels range from 13.09% to 14.43%. Meanwhile, ash content is divided into two statistical groups, with Ayabaca and Morropón showing the lowest values (Table 2, Figure 8).

3.3. Multiple Correspondence Analysis of Proximate Analysis by Zones

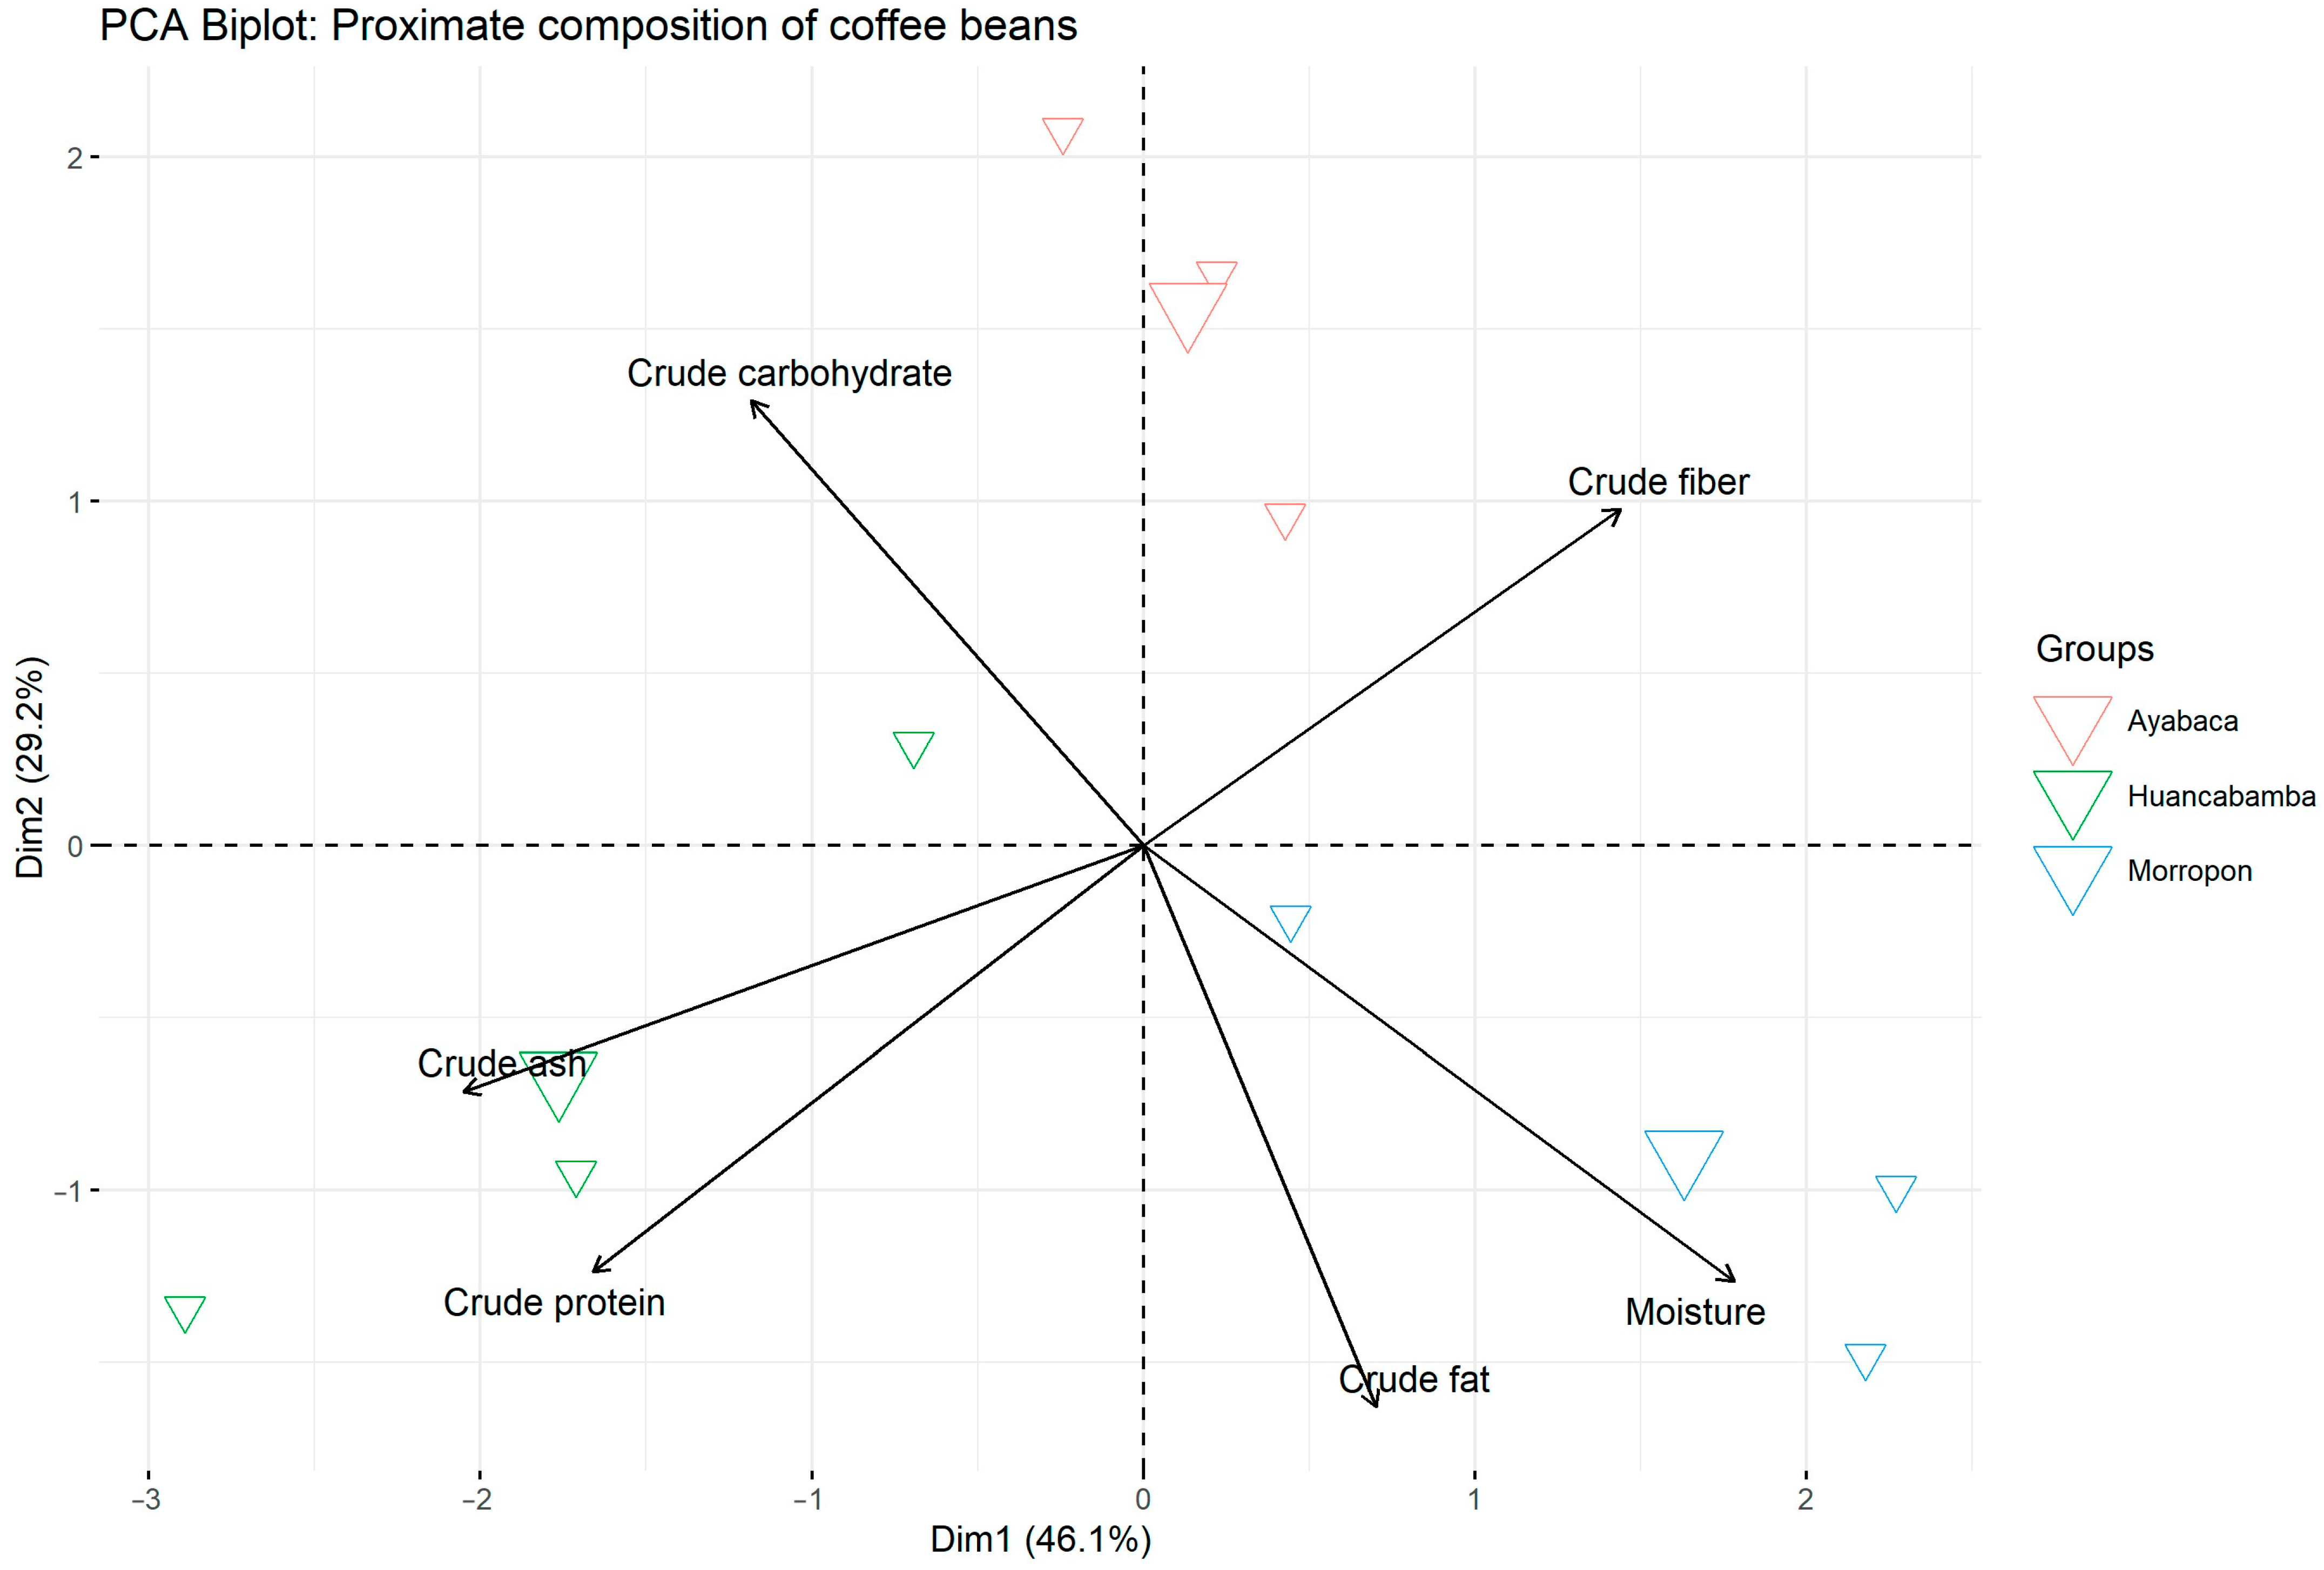
The multiple correspondence analysis, which explains 100% of the variability in the proximate variables of organic coffee beans across different zones in the Piura region, is illustrated in Figure 9. Each zone corresponds to a different axis: Morropón is characterized by coffee beans with significant amounts of crude fat and moisture. Huacabamba is primarily associated with higher quantities of crude protein and crude ash while displaying low levels of crude fiber. In contrast, Ayabaca does not show a clear association with any of the variables, as all quantities are low. Overall, the representation of the variables in Piura reveals that they are positioned far from the midpoint of the variance axis, indicating a high degree of variation among them. Additionally, an inverse relationship is observed between certain variables: moisture and crude carbohydrates, crude fiber, and crude protein, as well as crude fiber and crude ash; these variables do not correlate with one another.

3.4. Proximate Composition Analysis

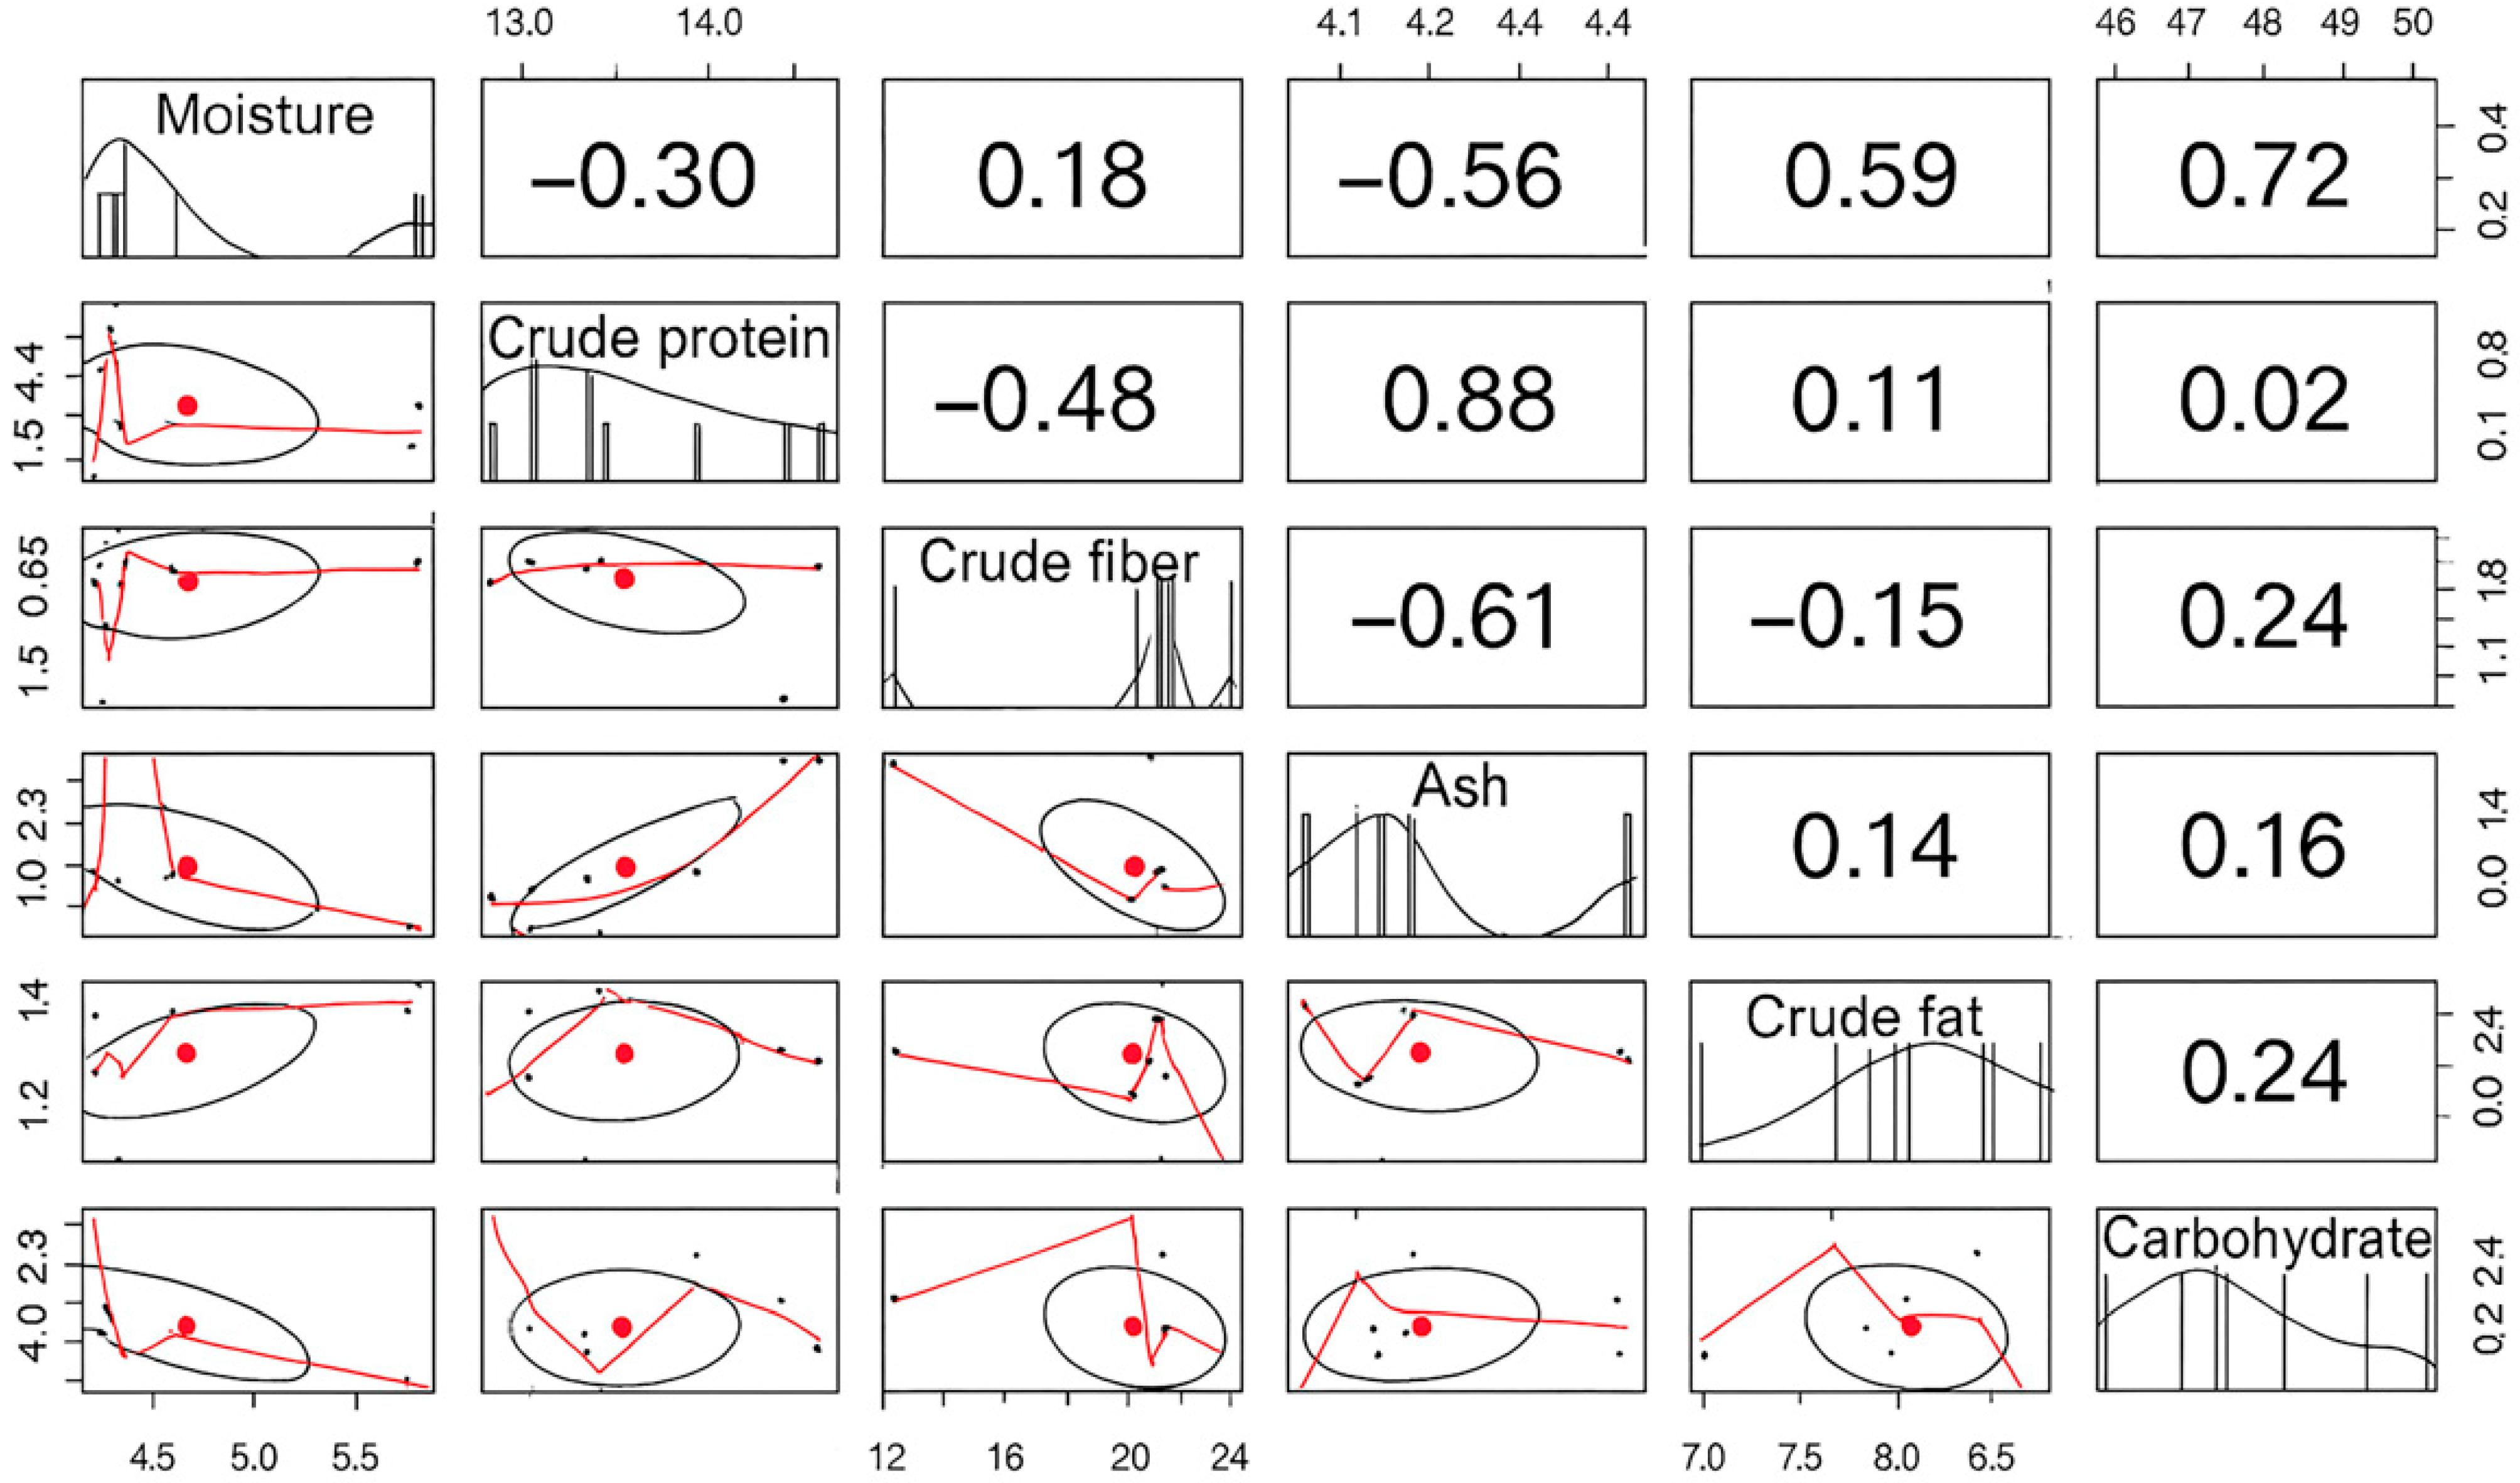
The analysis of the proximate composition of coffee beans reveals several key relationships among its components. As shown in Figure 10, there is a strong positive correlation between crude protein and ash content. Additionally, a moderate positive relationship exists between crude fat and moisture levels. On the other hand, moisture and carbohydrates exhibit a strong negative relationship, while ash and crude fiber have a moderate negative correlation. Furthermore, there is a strong negative relationship between ash and moisture content.

3.5. Plasticity (PPI) Implications for Coffea Arabica in Piura

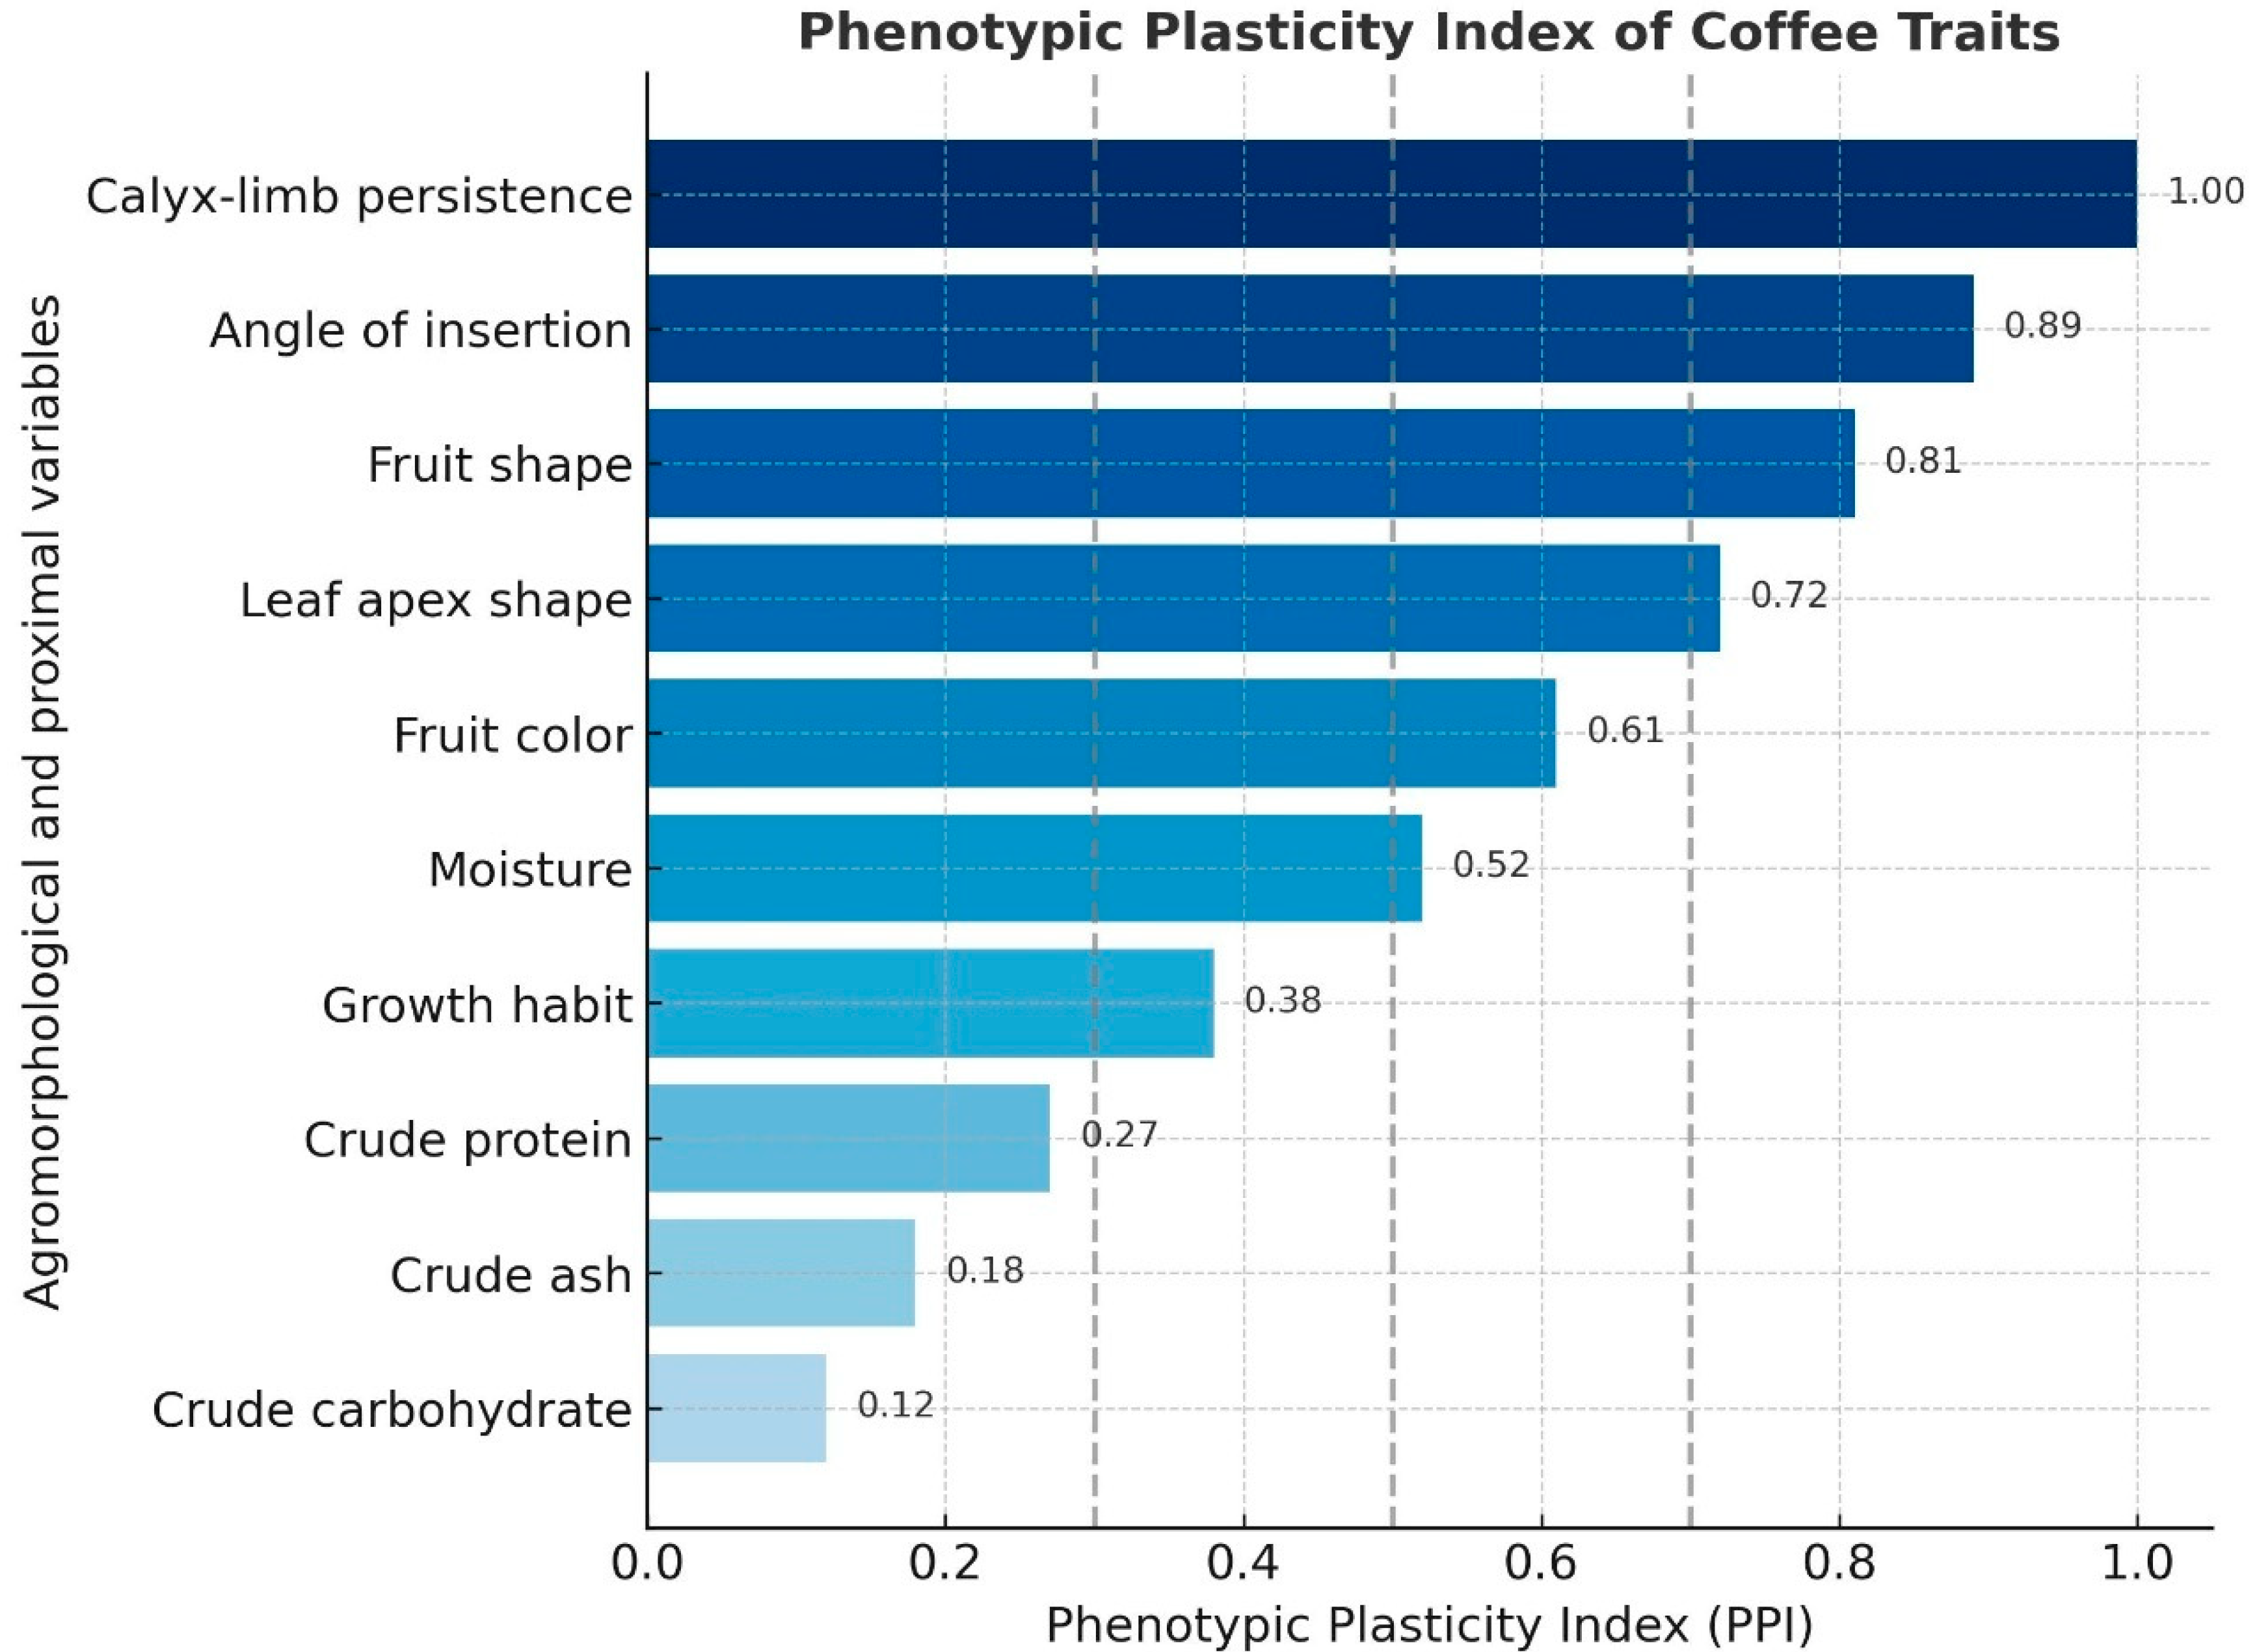
On average, the plasticity of morphological traits was higher than that of proximal characteristics, with a Plasticity Performance Index (PPI) of 0.70 for morphological traits compared to 0.21 for proximal traits. Morphological characteristics, including fruit ribs, the angle of insertion on the main stem, fruit shape, stipule shape, and leaf apex shape, demonstrated significant plasticity in response to the different zones of Piura, where the samples were collected. In contrast, proximal characteristics, such as crude carbohydrates and crude ash, had a PPI of 0.09 for both traits, indicating very low plasticity close to zero (Figure 11).

4. Discussion

4.1. Morphological Variables

The morphological variables of the Coffea arabica crop in Piura typically behaved as expected, complying with the characteristics of this species [22]. It is also possible to record the future new morphological characteristics in coffee plants between varieties [10,36,37,38], to elucidate and expose new changes according to different zones. In particular, the shape of the triangular stipules in 41.3%, is a predominant character also for other varieties such as Típica, Pacara, Caturra amarillo, Pache, Catuai rojo, Caturra rojo, Borbón, Caturra amarillo, Mundo novo rojo and Mundo novo amarillo [10], even though they were planted in places with different climatic characteristics (five provinces of the Amazonas region: Rodríguez de Mendoza, Bagua, Luya, Utcubamba and Bongará) than those presented in our research (three provinces of the Piura region: Ayabaca, Huancabamba and Morropón).
In addition, there is sufficient scientific evidence indicating morphological and anatomical variations between coffee varieties under different conditions [37,38]. Furthermore, varieties such as Catimor show that in certain variables, it may be outside the same statistical group with Catucaí Amarelo 2SL. In contrast, for other variables, it is statistically grouped when evaluating variables such as: SI: stomatal index (%) and SD: stomatal density (number stomata mm-2) [37].

4.2. Proximate Composition in Coffee Beans

When we analyze the values obtained in the proximate composition, we note that, in specific research, the statistical differences for these variables (Moisture, Crude protein, Crude fiber, Ash, Crude fat, Carbohydrate), according to the type of bean (including defects) are significant; they also resulted in higher values for all compounds, concerning the present research [39,40]. Contrarily, in all cases, proximate analyses performed in countries such as Thailand [41] present comparable values to those in this study. Further investigations of the proximal composition in Peruvian coffee are expected to allow new spatio-temporal comparisons within the country. This information will enable the re-evaluation of the natural resources of coffee production systems, intensifying the potential benefits that knowledge about the nutritional composition of fruits can offer in different areas such as the circular economy; for example, the various uses currently given to spent coffee grounds [42]. Adopting a broader comparative perspective would enhance our discussion and increase the global relevance of our findings. Therefore, we have expanded the discussion section to include comparisons with recent studies from major coffee-producing regions such as Brazil, Ethiopia, and Colombia. For instance, we now examine how the observed differences in proximate composition and morphological plasticity correlate with findings from Brazilian and Ethiopian cultivars that have been exposed to varying altitudinal and climatic conditions [43,44,45]. Additionally, we point out that the moderate protein and fat contents found in the Piura region are consistent with results reported for Colombian Arabica under similar agroecological conditions. These additions provide a more comprehensive interpretation of the factors influencing trait variability, particularly highlighting the importance of microclimatic and edaphic diversity in shaping phenotypic responses.

4.3. Plasticity

Phenotypic plasticity in response to environmental stress impacts the entire plant phenotype and can change the relationships between traits that make up the plant’s phenotypic architecture [46]. In response to environmental changes, plants may take one of two paths: (1) they may persist in their local habitat because they are flexible enough to adapt to these changes, or (2) they may remain in their ecological niche but suffer demographic decline, potentially leading to extinction [47]. In this context, agro-morphological characterization of the plant (using specific descriptors) and bromatological characterization of the grain can help reveal mechanisms of photo- and thermo-protection, which are essential for climate change adaptation [35].
Most of the morphological variables evaluated in this research exhibit high values for the phenotypic plasticity index, except moisture, ash, protein, and carbohydrate levels. An adaptive approach suggests that future research will help identify the functional traits of coffee plants where plasticity may play a crucial role in how crops respond to global changes. Understanding the extent to which this plasticity facilitates survival in changing environmental conditions is essential, as the results can sometimes be controversial [48].
Additionally, research shows that despite being geographically close, Peruvian coffee crops demonstrate significant differences in geo-referenced climatic variability [49,50]. This highlights the need for management strategies tailored to individual plants. While it may be complex to grasp the significance of environmentally induced changes in coffee cultivation in the studied areas, the results suggest that the degree of plasticity in a trait can correlate with a fundamental pattern of adaptation to changing climatic conditions. Ongoing research aims to clarify these changing patterns, as theory predicts that climatic variability would select for greater phenotypic plasticity. However, evidence also indicates that stressful conditions may limit this plasticity.

4.4. Limitations and Future Perspectives

We acknowledge that our sampling design, based on ten orchards per zone and ten plants per orchard, may introduce a degree of pseudoreplication because intra-orchard environmental variability was not explicitly modeled. However, this effect was mitigated by selecting orchards under homogeneous conditions and randomly sampling plants to capture average responses within each province. Consequently, our analyses emphasize inter-provincial comparisons rather than intra-orchard variability, which aligns with the study’s objective of evaluating regional-scale agro-morphological and biochemical differences in coffee. This methodological clarification has been noted as a limitation but does not compromise the interpretation of the observed spatial patterns.
Because the design involved multiple plants nested within orchards and orchards nested within provinces, we acknowledge that a hierarchical structure exists in the data. However, given that the objective was to assess regional-level differentiation, the analyses were performed using aggregated mean values per province rather than a mixed-effects framework. Future studies including explicit environmental or soil data and hierarchical modeling are recommended to partition within- and between-orchard variability more precisely.

5. Conclusions

This study revealed that Coffea arabica cultivated in the Piura region shows notable variation in both agro-morphological and proximate traits, even among geographically close provinces. The morphological descriptors exhibited greater phenotypic plasticity compared to the proximate bean traits, indicating that local climatic and soil conditions have a significant impact on plant form and composition. The grouping of populations based on their morphological and chemical characteristics demonstrates that both types of descriptors are helpful in distinguishing regional differences in cultivation environments. While these findings enhance our understanding of how C. arabica responds to local environmental variations, they should be viewed as suggestive rather than definitive regarding adaptive mechanisms. The observed patterns represent correlations between trait expression and site conditions but do not establish causality or indicate adaptive fitness outcomes. Therefore, further research that includes environmental and soil variables, as well as controlled experiments or mixed-effects modeling, will be necessary to confirm the adaptive significance of the traits identified as plastic. The current results serve as a baseline reference for future studies on coffee diversity and management in varying environmental conditions in northern Peru.

Author Contributions

Conceptualization, L.G. and J.V.; methodology, L.G., C.B.-C. and G.A.G.; software, H.G., R.C.M.-Z. and S.G.C.; validation, L.G. and S.G.C.; formal analysis, J.V., C.B.-C., G.A.G., H.G., R.C.M.-Z. and S.G.C.; investigation, J.V., C.B.-C., G.A.G., H.G., R.C.M.-Z. and S.G.C.; resources, L.G. and R.C.M.-Z.; data curation, J.V.; writing—original draft preparation, G.A.G.; writing—review and editing, H.G.; visualization, R.C.M.-Z.; supervision, C.B.-C.; project administration, S.G.C.; funding acquisition, L.G. All authors have read and agreed to the published version of the manuscript.

Funding

This research was funded by PROCIENCIA, grant number CONTRATO N° PE501086357-2024-PROCIENCIA (CoffeSmart). The APC was funded by Universidad Nacional Toribio Rodríguez de Mendoza de Amazonas.

Data Availability Statement

The original contributions presented in this study are included in the article. Further inquiries can be directed to the corresponding author.

Acknowledgments

We are grateful for the support of the Universidad Nacional Toribio Rodríguez de Mendoza.

Conflicts of Interest

The authors declare no conflicts of interest.

References

  1. Mekbib, Y.; Tesfaye, K.; Dong, X.; Saina, J.K.; Hu, G.W.; Wang, Q.F. Whole-Genome Resequencing of Coffea arabica L. (Rubiaceae) Genotypes Identify SNP and Unravels Distinct Groups Showing a Strong Geographical Pattern. BMC Plant Biol. 2022, 22, 69. [Google Scholar] [CrossRef]
  2. Musoli, P.; Cubry, P.; Aluka, P.; Billot, C.; Dufour, M.; De Bellis, F.; Pot, D.; Bieysse, D.; Charrier, A.; Leroy, T. Genetic Differentiation of Wild and Cultivated Populations: Diversity of Coffea Canephora Pierre in Uganda. Genome 2009, 52, 634–646. [Google Scholar] [CrossRef]
  3. Cámara de Café y Cacao Café Peruano—Estadísticas. Available online: https://camcafeperu.com.pe/ES/cafe-peruano-estadisticas.php (accessed on 29 November 2024).
  4. SENASA Café Peruano Llegó a 52 Mercados. Available online: https://www.gob.pe/institucion/senasa/noticias/1008487-midagri-cafe-peruano-llego-a-52-mercados-internacionales-en-el-2024 (accessed on 4 December 2024).
  5. INEI. Tres Departamentos Aportaron El 60,6% de La Producción de Café; INEI: Lima, Peru, 2024. [Google Scholar]
  6. Ramırez-Camejo, L.A.; Eamvijarn, A.; Dıaz-Valderrama, J.R.; Karlsen-Ayala, E.; Koch, R.A.; Johnson, E.; Pruvot-Woehl, S.; Mejıa, L.C.; Montagnon, C.; Maldonado-Fuentes, C.; et al. Global Analysis of Hemileia Vastatrix Populations Shows Clonal Reproduction for the Coffee Leaf Rust Pathogen Throughout Most of Its Range. Phytopathology 2022, 112, 643–652. [Google Scholar] [CrossRef]
  7. Morales, L.V.; Robiglio, V.; Baca, M.; Bunn, C.; Reyes, M. Planning for Adaptation: A System Approach to Understand the Value Chain’s Role in Supporting Smallholder Coffee Farmers’ Adaptive Capacity in Peru. Front. Clim. 2022, 4, 788369. [Google Scholar] [CrossRef]
  8. Guadalupe, G.A.; Grandez-Yoplac, D.E.; García, L.; Doménech, E. A Comprehensive Bibliometric Study in the Context of Chemical Hazards in Coffee. Toxics 2024, 12, 526. [Google Scholar] [CrossRef]
  9. Dulloo, M.E.; Guarino, L.; Engelmann, F.; Maxted, N.; Newbury, J.H.; Attere, F.; Ford-Lloyd, B.V. Complementary Conservation Strategies for the Genus Coffea: A Case Study of Mascarene Coffea Species. Genet. Resour. Crop Evol. 1998, 45, 565–579. [Google Scholar] [CrossRef]
  10. Wigoberto Alvarado, C.; Bobadilla, L.G.; Valqui, L.; Valqui, G.S.; Valqui-Valqui, L.; Vigo, C.N.; Vásquez, H.V. Characterization of Coffea arabica L. Parent Plants and Physicochemical Properties of Associated Soils, Peru. Heliyon 2022, 8, e10895. [Google Scholar] [CrossRef]
  11. Rodrigues, W.N.; Brinate, S.V.B.; Martins, L.D.; Colodetti, T.V.; Tomaz, M.A. Genetic Variability and Expression of Agro-Morphological Traits among Genotypes of Coffea arabica Being Promoted by Supplementary Irrigation. Genet. Mol. Res. 2017, 16, 1–12. [Google Scholar] [CrossRef] [PubMed]
  12. Miranda, F.; Coronel-Chugden, J.W.; Veneros, J.; García, L.; Guadalupe, G.A.; Arellanos, E. Species Diversity of the Family Arecaceae: What Are the Implications of Their Biogeographical Representation? An Analysis in Amazonas, Northeastern Peru. Forests 2025, 16, 76. [Google Scholar] [CrossRef]
  13. Bonny, B.S.; Adjoumani, K.; Seka, D.; Koffi, K.G.; Kouonon, L.C.; Koffi, K.K.; Zoro Bi, I.A. Agromorphological Divergence among Four Agro-Ecological Populations of Bambara Groundnut (Vigna subterranea (L.) Verdc.) in Côte d’Ivoire. Ann. Agric. Sci. 2019, 64, 103–111. [Google Scholar] [CrossRef]
  14. Bradshaw, A.D. Evolutionary Significance of Phenotypic Plasticity in Plants. Adv. Genet. 1965, 13, 115–155. [Google Scholar]
  15. Burton, T.; Ratikainen, I.I.; Einum, S. Environmental Change and the Rate of Phenotypic Plasticity. Glob. Change Biol. 2022, 28, 5337–5345. [Google Scholar] [CrossRef]
  16. Veneros, J.E.; García, L. Application of the Standardized Vegetation Index (SVI) and Google Earth Engine (GEE) for Drought Management in Peru. Trop. Subtrop. Agroecosyst. 2022, 25, 1–13. [Google Scholar] [CrossRef]
  17. Cope, J.S.; Corney, D.; Clark, J.Y.; Remagnino, P.; Wilkin, P. Plant Species Identification Using Digital Morphometrics: A Review. Expert Syst. Appl. 2012, 39, 7562–7573. [Google Scholar] [CrossRef]
  18. Lande, R. Adaptation to an Extraordinary Environment by Evolution of Phenotypic Plasticity and Genetic Assimilation. J. Evol. Biol. 2009, 22, 1435–1446. [Google Scholar] [CrossRef]
  19. López, N. Caracterización Regional Piura. 2020. SINEACE. Available online: https://hdl.handle.net/20.500.12982/6221 (accessed on 27 September 2025).
  20. DRP Dirección Regional de La Producción de Piura. Resolución Directoral Regional N.° 727-2022-DRP; DRP Dirección Regional de La Producción de Piura: Piura, Peru, 2022. [Google Scholar]
  21. SENAMHI. Climas del Perú: Mapa de Clasificación Climática Nacional; SENAMHI: Lima, Peru, 2021. [Google Scholar]
  22. Yirga, M. Phenotypic Characterization of Coffee (Coffea arabica) Germplasm, in Ethiopia. Am. J. Biosci. 2021, 9, 34. [Google Scholar] [CrossRef]
  23. Arellanos, E.; López, G.M.; Guadalupe, G.; García, L. Balancing Tree and Crop Biodiversity and Yield in Coffee Plantations of the Peruvian Amazon: The Role of Shade and Certification as Indicators of Sustainable Management. Environ. Chall. 2025, 20, 101223. [Google Scholar] [CrossRef]
  24. Association of Official Analytical Chemists. Official Methods of Analysis, 14th ed.; AOAC: Rockville, MD, USA, 1984. [Google Scholar]
  25. Bradstreet, R.B. Kjeldahl Method for Organic Nitrogen. Anal. Chem. 1954, 26, 185–187. [Google Scholar] [CrossRef]
  26. Ambavaram, M.M.R.; Krishnan, A.; Trijatmiko, K.R.; Pereira, A. Coordinated Activation of Cellulose and Repression of Lignin Biosynthesis Pathways in Rice. Plant Physiol. 2011, 155, 916–931. [Google Scholar] [CrossRef]
  27. Admassu, A.; Tura, B.; Deresa Kebebe, T.K.; Kasim, R. Physicochemical and Antioxidant Properties of Coffea arabica Honey from Western Oromia, Ethiopia. Int. J. Agric. Sci. Food Technol. 2022, 8, 159–165. [Google Scholar] [CrossRef]
  28. Muchtaridi, M.; Rubiyanti, R.; Moektiwardoyo, M.; Musfiroh, I.; Rubiyanti, R.; Nuruljanah, H.; Laila, A.M.N.; Asih, N.R.; Nurhasanah, A. Determination of Parameters Standardization Crude Drug and Extract Arabica Coffee Beans (Coffea arabica L.). Int. J. Sci. Technol. Res. 2017, 6, 61–70. [Google Scholar]
  29. Wayne, C. Ellefson Food Science Text Series Food Analysis. In Food Analysis; Springer: Berlin/Heidelberg, Germany, 2017; pp. 299–314. [Google Scholar]
  30. Rawdkuen, S.; Murdayanti, D.; Ketnawa, S.; Phongthai, S. Chemical Properties and Nutritional Factors of Pressed-Cake from Tea and Sacha Inchi Seeds. Food Biosci. 2016, 15, 64–71. [Google Scholar] [CrossRef]
  31. Valladares, F.; Sanchez-Gomez, D.; Zavala, M.A. Quantitative Estimation of Phenotypic Plasticity: Bridging the Gap between the Evolutionary Concept and Its Ecological Applications. J. Ecol. 2006, 94, 1103–1116. [Google Scholar] [CrossRef]
  32. Valladares, F.; Wright, S.J.; Lasso, E.; Kitajima, K.; Pearcy, R.W. Plastic Phenotypic Response to Light of 16 Congeneric Shrubs from a Panamanian Rainforest. Ecology 2000, 81, 1925–1936. [Google Scholar] [CrossRef]
  33. Conover, D.O.; Duffy, T.A.; Hice, L.A. The Covariance between Genetic and Environmental Influences across Ecological Gradients: Reassessing the Evolutionary Significance of Countergradient and Cogradient Variation. Ann. N. Y. Acad. Sci. 2009, 1168, 100–129. [Google Scholar] [CrossRef]
  34. Cavalcante, M.C.; Oliveira, F.F.; Maués, M.M.; Freitas, B.M. Pollination Requirements and the Foraging Behavior of Potential Pollinators of Cultivated Brazil Nut (Bertholletia excelsa Bonpl.) Trees in Central Amazon Rainforest. Psyche 2012, 2012, 978019. [Google Scholar] [CrossRef]
  35. Matos, F.S.; Wolfgramm, R.; Gonçalves, F.V.; Cavatte, P.C.; Ventrella, M.C.; DaMatta, F.M. Phenotypic Plasticity in Response to Light in the Coffee Tree. Environ. Exp. Bot. 2009, 67, 421–427. [Google Scholar] [CrossRef]
  36. Gichimu, B.M.; Omondi, C. Gichimu_Early Perfomance of five newly developed lines of Arabica Coffe under varying environment and spacing in Kenya. Agric. Biol. J. N. Am. 2010, 1, 32–39. Available online: https://scihub.org/ABJNA/PDF/2010/1/32-39.pdf (accessed on 27 September 2025).
  37. Alberto, N.J.; Ferreira, A.; Ribeiro-Barros, A.I.; Aoyama, E.M.; Silva, L.O.E.; Rakocevic, M.; Ramalho, J.C.; Partelli, F.L. Plant Morphological and Leaf Anatomical Traits in Coffea arabica L. Cultivars Cropped in Gorongosa Mountain, Mozambique. Horticulturae 2024, 10, 1002. [Google Scholar] [CrossRef]
  38. Vionita, S.; Kardhinata, E.H.; Damanik, R.I. Morphology Identification and Description of Coffee Plants (Coffea sp) in Karo District. IOP Conf. Ser. Earth Environ. Sci. 2021, 782, 042051. [Google Scholar] [CrossRef]
  39. Oliveira, L.S.; Franca, A.S.; Mendonça, J.C.F.; Barros-Júnior, M.C. Proximate Composition and Fatty Acids Profile of Green and Roasted Defective Coffee Beans. LWT 2006, 39, 235–239. [Google Scholar] [CrossRef]
  40. Gichimu, B.M.; Omondi, C.O. Morphological Characterization of Five Newly Developed Lines of Arabica Coffee as Compared to Commercial Cultivars in Kenya. Int. J. Plant Breed. Genet. 2010, 4, 238–246. [Google Scholar] [CrossRef]
  41. Kanitnuntakul, N.; Meeasa, P.; Borompichaichartkul, C. Antioxidant Properties and Proximate Analysis of Green Coffee Beans from Different Plantations and Processing Methods in Thailand. Acta Hortic. 2017, 1179, 255–260. [Google Scholar] [CrossRef]
  42. Bijla, L.; Ibourki, M.; Bouzid, H.A.; Sakar, E.H.; Aissa, R.; Laknifli, A.; Gharby, S. Proximate Composition, Antioxidant Activity, Mineral and Lipid Profiling of Spent Coffee Grounds Collected in Morocco Reveal a Great Potential of Valorization. Waste Biomass Valorization 2022, 13, 4495–4510. [Google Scholar] [CrossRef]
  43. dos Santos, C.S.; de Freitas, A.F.; da Silva, G.H.B.; Pennacchi, J.P.; Figueiredo de Carvalho, M.A.; Santos, M.d.O.; Junqueira de Moraes, T.S.; de Rezende Abrahão, J.C.; Pereira, A.A.; Carvalho, G.R.; et al. Phenotypic Plasticity Index as a Strategy for Selecting Water-Stress-Adapted Coffee Genotypes. Plants 2023, 12, 4029. [Google Scholar] [CrossRef] [PubMed]
  44. Coelho, L.S.; Tassone, G.A.T.; Carvalho, G.R.; Silva, V.A.; Viana, M.T.R.; Pereira, F.A.C.; Nadaleti, D.H.S.; de Oliveira Silveira, H.R.; Botelho, C.E. Morphological, Physiological, and Agronomic Traits of Crossings of “Icatu” x “Catimor” Coffee Tree Subjected to Water Deficit. Pesqui. Agropecu. Bras. 2022, 57, e02788. [Google Scholar] [CrossRef]
  45. Mengesha, D.; Retta, N.; Woldemariam, H.W.; Getachew, P. Changes in Biochemical Composition of Ethiopian Coffee Arabica with Growing Region and Traditional Roasting. Front. Nutr. 2024, 11, 1390515. [Google Scholar] [CrossRef]
  46. Galimberti, A.; De Mattia, F.; Bruni, I.; Scaccabarozzi, D.; Sandionigi, A.; Barbuto, M.; Casiraghi, M.; Labra, M. A DNA Barcoding Approach to Characterize Pollen Collected by Honeybees. PLoS ONE 2014, 9, e109363. [Google Scholar] [CrossRef]
  47. Waldvogel, A.M.; Feldmeyer, B.; Rolshausen, G.; Exposito-Alonso, M.; Rellstab, C.; Kofler, R.; Mock, T.; Schmid, K.; Schmitt, I.; Bataillon, T.; et al. Evolutionary Genomics Can Improve Prediction of Species’ Responses to Climate Change. Evol. Lett. 2020, 4, 4–18. [Google Scholar] [CrossRef]
  48. Gratani, L. Plant Phenotypic Plasticity in Response to Environmental Factors. Adv. Bot. 2014, 2014, 208747. [Google Scholar] [CrossRef]
  49. Morales Rojas, E.; Díaz Ortiz, E.A.; Medina Tafur, C.A.; García, L.; Oliva, M.; Rojas Briceño, N.B. A Rainwater Harvesting and Treatment System for Domestic Use and Human Consumption in Native Communities in Amazonas (NW Peru): Technical and Economic Validation. Scientifica 2021, 2021, 4136379. [Google Scholar] [CrossRef] [PubMed]
  50. García, L.; Veneros, J.; Oliva-Cruz, M.; Olivares, N.; Chavez, S.G.; Rojas-Briceño, N.B. Construction of Linear Models for the Normalized Vegetation Index (NDVI) for Coffee Crops in Peru Based on Historical Atmospheric Variables from the Climate Engine Platform. Atmosphere 2024, 15, 923. [Google Scholar] [CrossRef]
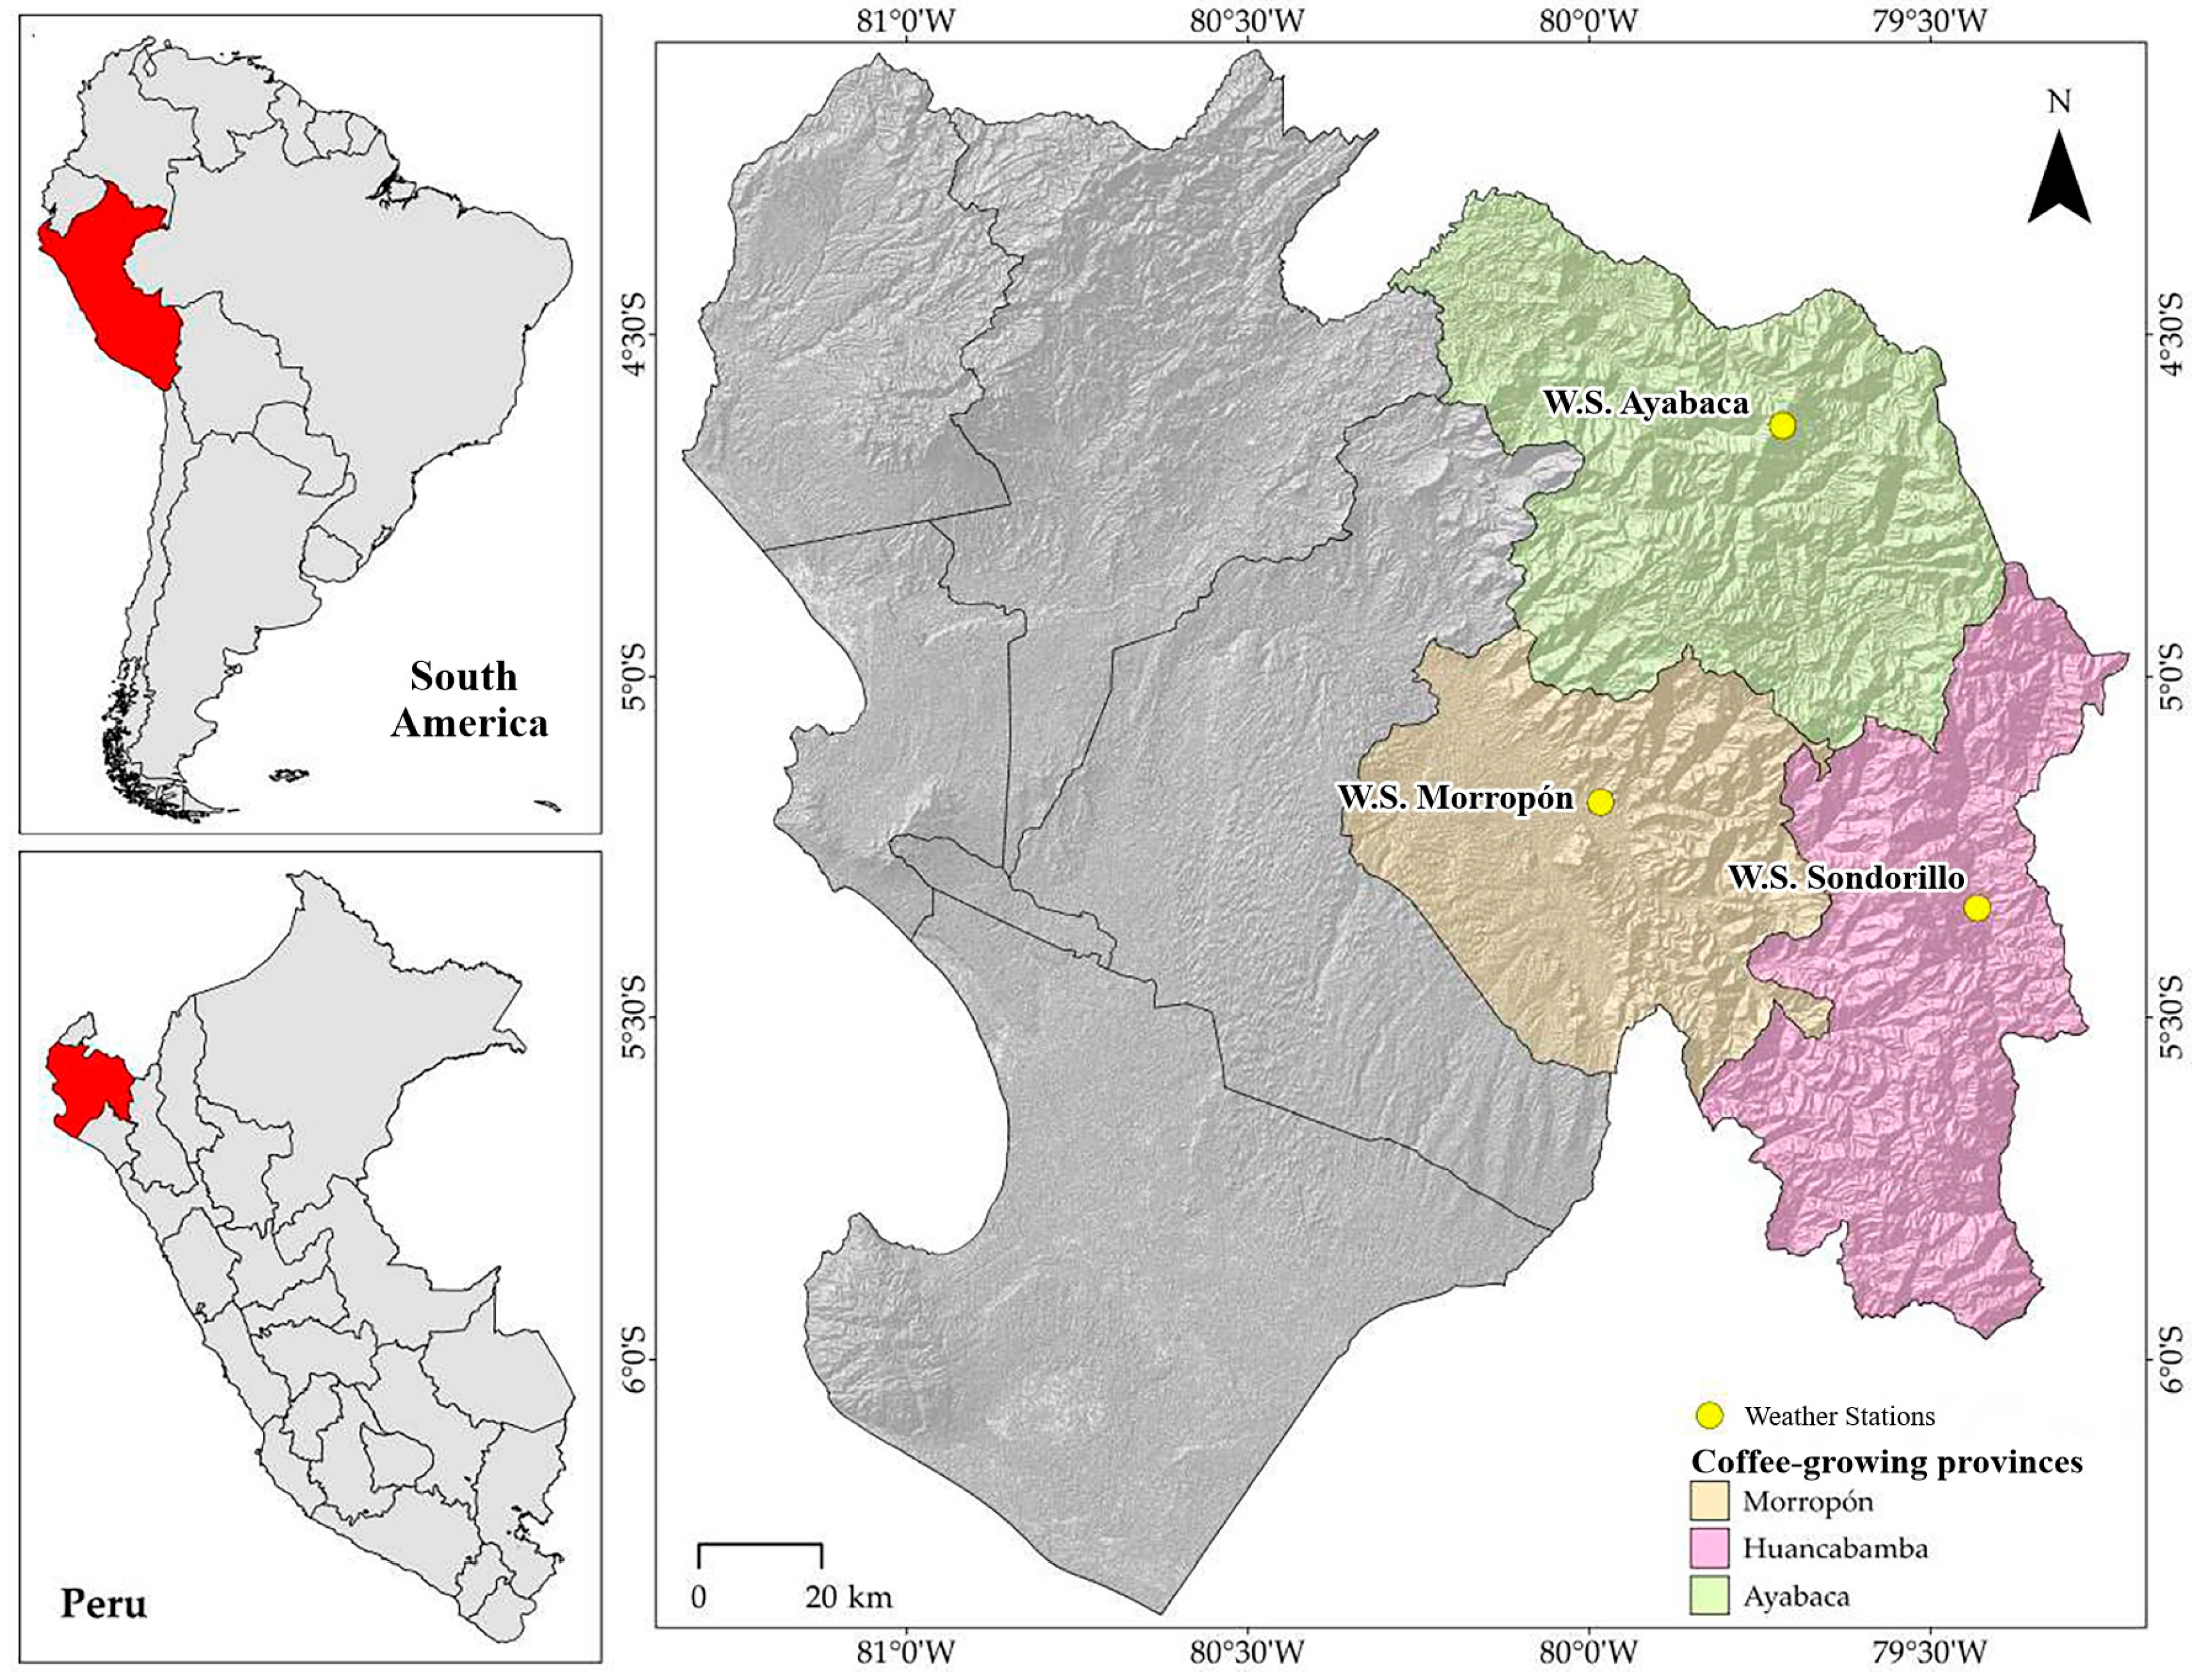
Figure 1. Location map of the 3 provinces of the Piura region (red part in the figure): Ayabaca, Morropón and Huancabamba.
Agronomy 15 02465 g001
Figure 2. Spatial distribution of maximum and minimum temperatures and annual precipitation across study zones.
Agronomy 15 02465 g002aAgronomy 15 02465 g002b
Figure 3. (a) Growth habit (1: Open; 2: Intermediate; 3: Compact); (b) Stem habit (1: Stiff; 2: Flexible).
Agronomy 15 02465 g003
Figure 4. (a) Young leaf tip color (1: Greenish, 2 Green, 3 Brownish); (b) Leaf shape (1 Ovate, 2 Elliptic, 4 Lanceolate); (c) Stipule shape (1 Round, 2 Ovate, 3 Triangle, 4 Delta).
Agronomy 15 02465 g004
Figure 5. (a) Calyx-limb persistence (0: No Persistent; 2: Persistent. 3: Undefined) (b) Fruit shape (2: Round, 3: Elliptic, 5: Oblong); (c) Fruit color (1: Light red, 3: Red, 2: Dark red).
Agronomy 15 02465 g005
Figure 6. (a) Branching habit (2: Many primaries with few secondary branches, 3 Many primaries with many secondary branches) (b) Leaf apex shape (1: Round, 2: Obtuse, 3: Acute, 4: Acuminate).
Agronomy 15 02465 g006
Figure 7. Illustrative dendrogram resulting from cluster analysis for 300 plants of organic coffee to morphological descriptors in tree zones within Piura.
Agronomy 15 02465 g007
Figure 8. Stacked bar chart depicting the proximal composition of organic coffee from three coffee-growing areas in the Piura region of Peru.
Agronomy 15 02465 g008
Figure 9. Multiple correspondence biplot for proximate variables in three zones with organic coffee in Piura.
Agronomy 15 02465 g009
Figure 10. Pearson’s correlation for the association of proximate composition variables in coffee beans. The red line shows the linear trend between two variables, indicating the direction and strength of their correlation. Note: Because proximate composition variables are compositional (their values sum to 100%), the Pearson correlations in Figure 10 should be interpreted as exploratory only. Future studies should apply compositional data analysis (CoDA) methods to avoid potential spurious correlations.
Agronomy 15 02465 g010
Figure 11. Phenotypic plasticity index, according to agro-morphological and proximal variables, for Coffea arabica in three closely spaced areas within Piura.
Agronomy 15 02465 g011
Table 1. Morphological traits in the organic coffee crop (Coffea arabica) evaluated in this study were adapted from Yirga [22].
Growth habit1*: Open; 2*: Intermediate; 3*: Compact
Stem habit1*: Stiff; 2*: Flexible
Branching habit2*: Many primaries with few secondary branches, 1*: Many primaries with many secondary branches.
Angle of insertion on the main stem1*: Semi–Erect
Young leaf tip color1*: Greenish, 2*: Green, 3*: Brownish, 4*: Reddish brown
Leaf shape2*: Ovate, 1*: Elliptic, 3*: Lanceolate
Leaf apex shape1*: Round, 2*: Obtuse, 3*: Acute, 4*: Acuminate
Stipule shape1*: Round, 2*: Ovate, 3*: Triangular, 4*: Deltoid
Fruit shape1*: Round, 2*: Elliptic, 3*: Oblong
Fruit color2*: Light red, 1*: Red, 3*: Dark red
Calyx-limb persistence0*: No Persistent; 2*: Persistent; 3: Undefined
Fruit ribs1*: Absent
* = Numerical codes correspond to the qualitative categories used to describe each morphological trait following [22].
Table 2. Proximal characteristics of coffee (Means ± Standard deviation).
Moisture (%)Crude Protein (%) Crude Fiber (%)Ash (%)Crude Fat (%)Total Carbohydrate (%)
Ayabaca 4.33 ± 0.08b13.09 ± 0.28b22.34 ± 1.67a4.14 ± 0.02b7.52 ± 0.47b48.26 ± 1.77a
Huancabamba 4.31 ± 0.06b14.43 ± 0.36a18.63 ± 5.40a4.35 ± 0.14a8.19 ± 0.24a48.18 ± 1.21a
Morropon 5.43 ± 0.70a13.31 ± 0.22b21.73 ± 0.14a4.10 ± 0.07b8.60 ± 0.14a46.44 ± 0.81a
Note: Different letters signify significant statistical differences, as determined by the LSDFisher test. (p ≤ 0.05).
Disclaimer/Publisher’s Note: The statements, opinions and data contained in all publications are solely those of the individual author(s) and contributor(s) and not of MDPI and/or the editor(s). MDPI and/or the editor(s) disclaim responsibility for any injury to people or property resulting from any ideas, methods, instructions or products referred to in the content.