Article

Effects of Extreme Moisture Events on Greenhouse Gas Emissions and Soil Ecological Functional Stability in Calcaric Cambisols

1
Jiangxi Key Laboratory of Watershed Soil and Water Conservation, Nanchang 330000, China
2
College of Soil and Water Conservation Science and Engineering, Northwest A&F University, Yangling 712100, China
3
Institute of Soil and Water Conservation, Chinese Academy of Sciences and Ministry of Water Resources, Yangling 712100, China
4
Power China Northwest Survey Design & Research Institute Co., Xi’an 710065, China
*
Author to whom correspondence should be addressed.
Agronomy 2025, 15(11), 2461; https://doi.org/10.3390/agronomy15112461
Submission received: 20 September 2025 / Revised: 17 October 2025 / Accepted: 21 October 2025 / Published: 23 October 2025

Abstract

Global warming is expected to increase the frequency and intensity of extreme precipitation, yet its effects on soil greenhouse gas (GHG) emissions and functional stability remain uncertain. This study explored the impact of extreme soil moisture conditions on farmland and forest soil under three scenarios: 60% field water capacity (W1), soil saturation (W2), and 10 cm of standing water (W3). We used a laboratory incubation to evaluate how three extreme soil moisture regimes—60% of field water capacity (W1), soil saturation (W2), and 10 cm of standing water (W3)—affect GHG emissions and the functional stability of farmland and forest soils. Forest soils exhibited significantly higher global warming potential (GWP) than farmland across all regimes (p < 0.05). Relative to W1, farmland GWP increased by 0.14% under W3, whereas forest GWP increased by 13.7% under W2 (p < 0.05). Extreme soil moisture conditions markedly elevated total organic C (TOC) and ammonium N (NH4+–N) contents in soil solutions from both farmland and forest, with increases of 25.0% and 6.0% for TOC and 78.6% and 69.6% for NH4+–N, respectively. Conversely, nitrate N (NO3–N) content in farmland soil decreased by 3.54% and 6.96% under W2 and W3 treatments, while forest soil NO3–N increased by 39.68% under W2 and decreased by 39.13% under W3. Functional stability declined under extreme precipitation and was positively correlated with total CO2 emissions, GWP, and TOC (p < 0.001), as well as with total N2O emissions and soil total C (p < 0.05). Overall, forest soils maintained greater functional stability than farmland under extreme moisture. These findings clarify how extreme soil-moisture events influence soil functional stability in a warming climate and highlight the potential for post-event recovery of soil functions.

1. Introduction

In recent years, the occurrence of numerous extreme weather events worldwide has reignited concerns about global warming [1,2]. The Sixth Assessment Report of the United Nations Intergovernmental Panel on Climate Change (IPCC) for 2023 [3] highlights that climate change is profoundly influencing extreme weather and climate patterns in most regions globally. Changes in rainfall patterns driven by global warming are projected to increase the depth, duration, and frequency of extreme precipitation events [4]. Precipitation fluctuations are often primary drivers of variations in vegetation and soil properties [5,6,7], which, in turn, affect nutrient cycling and ecosystem productivity [8,9]. Furthermore, extreme precipitation events not only exacerbate water runoff losses [10] but also expand the range of soil water availability [11], accelerate the water cycle processes—including evaporation, transport, condensation, precipitation, and infiltration [12]—and alter the frequency and intensity of precipitation [13,14]. These global water cycle dynamics and associated precipitation redistribution are expected to result in increasingly arid regions becoming drier and wet regions becoming wetter [15], with significant implications for food security [12,16].
Changes in precipitation patterns significantly impact soil structure and function [17,18,19], which, in turn, influences GHG emissions from soils. Studies have demonstrated that the contribution of soil carbon release caused by rainfall to total soil respiration can reach as high as 44.5% [20]. Similarly, Cui et al. [21] reported that N2O emission triggered by extreme precipitation events can account for up to 73% of annual emissions. In addition, extreme precipitation events affect soil nutrient cycling. Heavy precipitation may limit the mineralization of soil carbon and nitrogen, promote their leaching, and reduce their retention rates [22,23,24]. Flooding exacerbates soil fertility loss and causes stoichiometric imbalances, particularly of carbon and nitrogen, which are essential for various ecological processes [5,25]. Extreme precipitation also influences soil enzyme activity. As a key indicator of soil microbial function, soil enzymes play a critical role in organic matter decomposition and nutrient cycling [26]. Extreme precipitation events may alter soil enzyme activity by affecting nutrient availability, oxygen concentration, and microbial community composition [27]. During flooding, soil metabolism is disrupted, microbial communities are altered, and soil nutrient dynamics are affected, ultimately hindering plant growth and development, sometimes leading to plant mortality [28]. Consequently, extreme precipitation events significantly reduce ecosystem productivity [29,30,31], thereby impairing soil functional performance.
Ecological stability of soil functions refers to the resistance and resilience of microbial populations, representing an ecosystem’s ability to withstand external environmental changes and disturbances while maintaining systemic balance [32]. Ecological stability of soil functions is primarily governed by internal mechanisms, specifically the soil’s inherent structure and function [33,34]. Soil ecological functions are intimately linked to chemical reactions, all of which involve soil microorganisms. Within the same ecosystem, greater microbial functional redundancy—where multiple microbial species can perform the same ecological role—enhances the stability of soil ecological functions under extreme conditions [35,36]. Furthermore, the stability of soil ecological functions exhibits considerable variation across different land-use types when subjected to extreme climatic conditions [37].
Yang et al. [38] predicted that precipitation intensity in northern China will continue to increase in the future, with extreme precipitation events likely to rise more significantly than average precipitation events [39]. However, the impacts of extreme precipitation on the functional stability of soil ecosystems remain insufficiently understood. To address this gap, this study focused on soils in the semi-humid arid region of northern China to investigate the effects of extreme precipitation conditions on soil GHG emissions and soil functional stability. Additionally, it established the relationships among soil carbon and nitrogen cycling, greenhouse gas emissions, and soil ecosystem functional stability, thereby providing a theoretical foundation for soil functional restoration following extreme precipitation events.
Building on this context, this study aims to examine how varying soil moisture levels (W1–W3) and land-use types (farmland and forest) jointly affect soil properties and GHG emissions. We hypothesize that increasing soil moisture from conventional (W1) to supersaturated (W3) conditions will significantly alter key soil characteristics, particularly organic carbon (TOC) and nitrogen species (NH4+–N and NO3–N). Enhanced moisture (W2 and W3) is expected to increase CO2 and N2O emissions while reducing CH4 uptake due to shifts in microbial processes under waterlogged conditions. Moreover, forest soils are expected to exhibit higher GHG emissions and global warming potential (GWP) than farmland soils under comparable moisture treatments, reflecting differences in nutrient cycling and microbial community dynamics.

2. Materials and Methods

2.1. Overview of the Research Area

The experiment was conducted in July 2021 in Zhouzhi County, Shaanxi Province, characterized by a temperate continental monsoon climate and representing a typical dryland agricultural region. The primary land uses are farmland (wheat–maize rotation systems) and economic orchards (e.g., kiwi and cherry trees). The average annual temperature is 13.2 °C, with an average annual rainfall of 850.5 mm. The experimental soil conditions were as follows: winter wheat was planted in late September each year, and after harvesting, the wheat straw was incorporated into the soil for maize planting in April. Additionally, 25 kg of compound fertilizer (N:P2O5:K2O = 15:15:15) was applied per hectare after corn planting. Three years prior, the forest soil used in the experiment had been converted from wheat–maize fields to cherry orchards, and no fertilization had been applied since the conversion. In July 2021, nine undisturbed soil samples were collected from both farmland and forestland, with surface vegetation removed. These samples were placed outdoors to simulate natural temperature and light conditions, and an awning was erected to regulate precipitation from natural rainfall.
Prior to incubation, the basic physicochemical properties of farmland and forest soils were determined to ensure comparable initial conditions. Both plots were located within the same area, sharing similar topography and climate (inter-plot distance < 2 km; slope < 5°; elevation 420–460 m) on loess parent material. Farmland had been managed under a consistent winter–wheat/summer–maize rotation for the past decade, while the forest site was converted from the same farmland to a cherry orchard in 2018 and has since received no mineral fertilizer. Both soils are silt loam. The key physicochemical parameters (0–10 cm, n = 9, mean ± SD) are summarized in Table 1, showing similar texture and nutrient levels, confirming that treatment effects mainly reflected incubation responses rather than initial heterogeneity. According to the WRB (2022) [40], the soils developed on loess in the study area are classified as Calcaric Cambisols. Diagnostic properties supporting this classification include silt loam texture and an alkaline reaction (pH ≈ 7.8–8.1).

2.2. Experiment Design

Two distinct land-use types were selected: farmland and forest soil. Unfertilized soil from one month prior to the experiment was chosen as the target plot. The target plot was irrigated one day before soil collection. On the following day, a metal frame (25 cm × 25 cm × 35 cm) was pressed 10 cm into the wet soil, and the bottom of the metal frame was sealed after the entire block was excavated [41], ensuring that only the top of the soil block was exposed to air. Nine undisturbed soil samples were collected from adjacent locations within each land-use type (farmland and forestland), each serving as an independent replicate. Sampling frames were inserted directly into the soil to avoid mechanical disturbance and to preserve the natural structure and stratification. Measurements of soil bulk density, water-holding capacity (WHC), and organic matter content were conducted concurrently. After sampling, the soil within the metal frame was transported outdoors, fitted with a stainless-steel bottom, and placed under an awning.
The collected undisturbed soil was pretreated for two weeks following these steps: The metal frame was transferred under an awning to receive natural light, and a 10 cm rhizosphere soil pore water collector (RhizonMOM; Rhizosphere Research Products B.V., Wageningen, The Netherlands) was inserted into the center of each soil block (Figure 1). Distilled water was added every two days using the weighing irrigation method to maintain soil water content at 60% of the field capacity. After pretreatment, three soil moisture levels were established for the two land-use types based on extreme precipitation scenarios: (1) 60% of field capacity (W1), (2) full saturation (W2), and (3) a 10 cm water layer covering the soil surface (W3). These moisture levels were defined based on field capacity, saturation point, and previous studies on soil flooding, respectively. Distilled water was added as needed to maintain these moisture levels, with a maximum variation of 1.5% at three-day intervals. The day of precipitation was designated as day 0, marking the start of soil moisture changes. Samples were collected on days −1, 0, 1, 3, 5, and 7 during the early stage, with subsequent sampling intervals of four days. Distilled water addition ceased on day 63, after which surface water was removed. Final samples of soil GHG and moisture were collected on day 65. Additionally, soil samples were collected before and after extreme precipitation events and stored at −20 °C for soil enzyme activity analysis. In natural field conditions, excessive precipitation usually flows over the surface or infiltrates into adjacent river basins and wetlands. In this experiment, a laboratory microcosm setup was adopted to simulate extreme moisture scenarios by maintaining a fixed water layer above the surface of the soil. This approach intentionally simplified hydrological processes such as surface runoff and lateral flow, allowing us to examine biogeochemical responses under controlled over-moistening conditions. Therefore, the “inundation” treatment (W3) in this study should be regarded as an artificial waterlogging simulation rather than a replication of real field hydrological processes.
Soil GHG emissions were continuously monitored using the static dark chamber–gas chromatography method. The static chamber had a volume of 25 cm × 25 cm × 50 cm. On each sampling day at 9:00 AM, the cover of the static chamber was placed on its base, marking the start time as 0 min. At 0 min, 10 min, 20 min, and 30 min, 40 mL of gas was extracted from the chamber, stored in vacuum-sealed bottles, and transported to the laboratory. A gas chromatograph (Agilent 7890A, Agilent Technologies, Santa Clara, CA, USA) was employed to measure the concentrations of CH4, CO2, and N2O in the samples. The detectors used were an electron capture detector (ECD) and a flame ionization detector (FID), with carrier gases of 5% argon–methane and nitrogen, respectively. The detection temperature was maintained at 300 °C. Surface water (T) from inundated soil was collected and transported to the laboratory for analysis of chemical indices, including total organic carbon (TOC), total inorganic carbon (TIC), total nitrogen, nitrate nitrogen (NO3–N), and ammonium nitrogen (NH4+–N). Samples not analyzed immediately were temporarily stored at 4 °C in a refrigerator.

2.3. Measuring Index and Method

2.3.1. Soil Basic Index Determination

Soil moisture content was determined using the gravimetric drying method (105 °C for 24 h) following the national standard GB/T 7172–1987 [42]. Bulk density was measured by the core (ring-knife) method according to NY/T 1121.4–2006 [43]. Soil pH was measured in a 1:2.5 soil-to-water suspension using a pH meter (PHS-3C, INESA, Shanghai, China), and electrical conductivity (EC) was determined with a conductivity meter (DDS-307A, INESA, Shanghai, China). Soil organic matter (SOM) was analyzed by the dichromate oxidation–external heating method following Walkley and Black (1934) [44]. Total nitrogen (TN) was determined using the Kjeldahl digestion method [45]. Total organic carbon (TOC) in soil solution was analyzed with a TOC analyzer (Shimadzu TOC-L, Kyoto, Japan), and concentrations of NH4+–N and NO3–N were determined using a continuous flow analyzer (AA3, SEAL Analytical, Norderstedt, Germany).
All instruments were calibrated according to manufacturer specifications prior to measurement, and standard reference samples were analyzed concurrently to ensure data accuracy and repeatability.

2.3.2. Determination of Greenhouse Gases in Soils

Soil GHG flux was determined by static dark box–gas chromatography, and the daily emission flux, cumulative emission, and warming potential were calculated using flux and time slope.
The daily emission flux was calculated by the linear regression slope between the four concentrations:
F = M 22.4 · H · d c d t 273 273 + T
where
  • F—daily emission flux, measured in mg·m−2·h−1;
  • M—atomic weight of C or N in CO2-C and N2O-N, which are 12 g·mol−1 and 28 g·mol−1, respectively;
  • H—effective height of the sampling chamber, measured in meters (m);
  • dc/dt—gas emission rate, represented as the slope of the regression equation between gas concentration and time (0, 10, 20, and 30 min);
  • T—average temperature inside the chamber during sampling, measured in degrees Celsius (°C).
The formula for calculating cumulative emissions is as follows:
F ¯ = i = 1 n F i · d i d
G = F ¯ · 24 · d 100
where
  • G—total emission, kg·hm−2;
  • Fi—gas emission flux at the i sampling, mg·m−2·h−1;
  • di—the number of days between the i sampling and the next sampling;
  • D—total number of days.
Calculation of global warming potential (GWP):
G W P = G C O 2 + 298 · G N 2 O + 28 · G C H 4
In the formula, GCO2, GN2O, and GCH4 are the cumulative emissions of CO2, N2O, and CH4 (kg·hm−2).

2.3.3. Calculation of Soil Stability

Soil resistance and soil resilience are calculated as follows:
f ( t ) = G H G s t r e s s e d G H G c o n t r o l
S b = 0 65 f ( t ) d t
where because the changes in soil microorganisms in the soil can be represented by microbial respiration, in this experiment, the CO2 generated by soil respiration used in this test is generated by microbial respiration. In this experiment, plants and roots were excluded; therefore, all CO2 emissions were attributed to microbial respiration. This simplification allows for isolating the microbial response to extreme moisture conditions without interference from plant respiration. Therefore, CO2 emissions were used to calculate the resistance and resilience of soil to extreme moisture. T represents the time of extreme moisture occurrence (days); we will take the day of extreme moisture occurrence as the 0 day, and f(0) represents the resistance of soil microorganisms to extreme moisture, with a higher f(0) indicating stronger resistance. f(65) represents the resilience of soil microorganisms after extreme moisture, with a higher f(65) indicating stronger resilience. Sb is the stability of soil ecological function, and the larger the Sb, the stronger the stability of soil ecological function. Here, a larger Sb indicates that the soil system maintained a higher level of functional activity relative to its initial state after disturbance, rather than a greater deviation from the control.

2.4. Data Processing and Statistical Analysis

Data were analyzed using SPSS 26.0 (IBM Corp., Armonk, NY, USA) and R 4.1.0 (R Core Team, 2021). Means and standard deviations were calculated for all measured variables. The effects of land-use type, precipitation treatment, and their interactions on GHG emissions were evaluated using a linear mixed-effects model with type III sum of squares ANOVA. When the ANOVA indicated significant effects (p < 0.05), Tukey’s honestly significant difference (HSD) post hoc test was applied to compare treatment means. Different lowercase letters denote significant differences among treatments (p < 0.05). Figures were prepared using R 4.1.0 (R Core Team, 2021).
Prior to analysis, data were tested for normality using the Shapiro–Wilk test and for homogeneity of variance using Levene’s test. When necessary, data were log-transformed to meet normality assumptions. To control for type I errors, corrections for multiple comparisons were applied as appropriate. Pearson correlation analysis was performed to examine relationships among soil variables, and simple linear regression models were fitted to visualize trends, with the understanding that correlations do not imply causation.

3. Results

3.1. Effects of Extreme Moisture on Soil Greenhouse Gas Emissions

3.1.1. Dynamic Trends of Soil CH4 Under Different Extreme Water Conditions

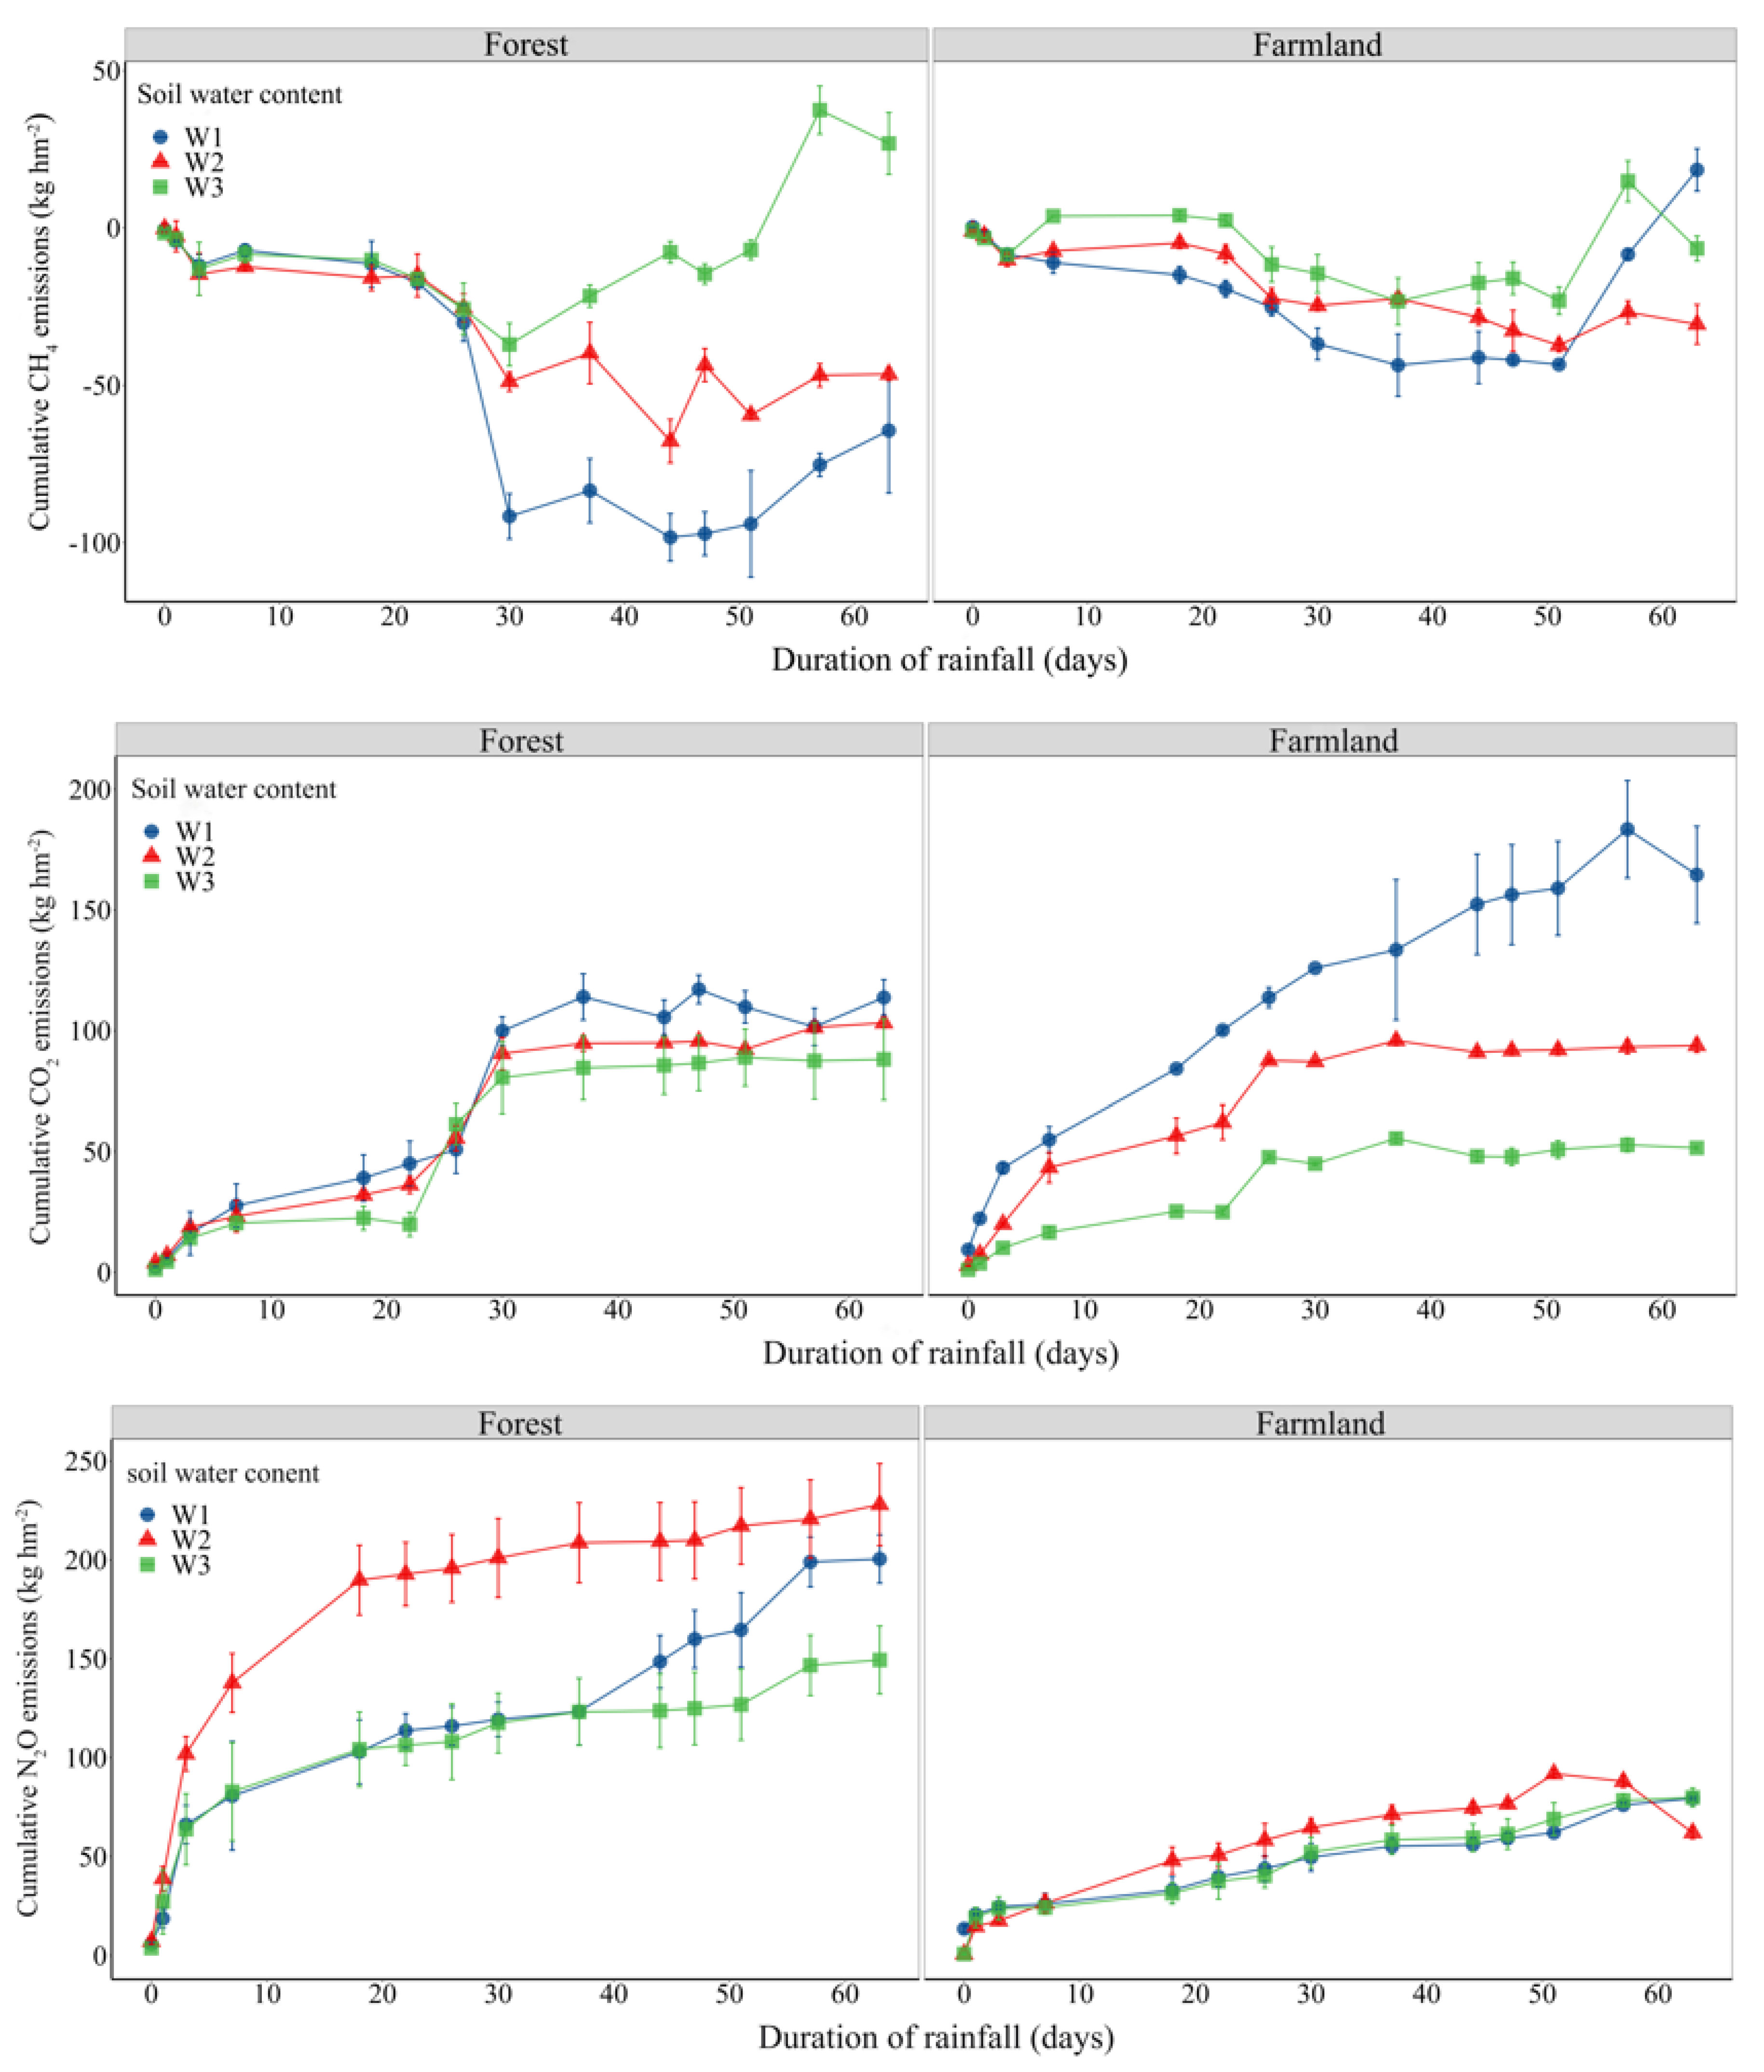
As shown in Figure 2, the CH4 emission trends under different treatments were generally consistent. Before the occurrence of extreme moisture, the soil acted as a CH4 sink. Upon the onset of extreme moisture, CH4 emissions briefly increased, with emissions ranging from −8.73 to 2.32 μg·m−2·h−1 in farmland soil and −6.65 to 2.10 μg·m−2·h−1 in the forest soil. Overall, CH4 emissions from farmland soil were higher than those from forest soil under the same precipitation patterns. Among farmland soils, CH4 emissions were highest under W3 treatment, while changes under W2 and W1 treatments were not significant. For forest soils, daily CH4 emissions followed the order W3 > W2 > W1.

3.1.2. Variation Trend of Soil CO2 Under Different Extreme Moisture Conditions

The study observed that the trends of CO2 emissions remained relatively consistent following extreme moisture conditions (Figure 2). Soil CO2 emissions decreased significantly on the first day of extreme moisture and began to stabilize by the 7th day. Over the subsequent 60 days, two emission pulses were observed, with the magnitude of change diminishing during the second pulse. Prior to extreme moisture, CO2 emissions from farmland soil ranged from 16.87 to 27.35 mg·m−2·h−1, while forest soil emissions ranged from 8.51 to 15.95 mg·m−2·h−1. Following extreme moisture, farmland soil CO2 emissions decreased to 1.09–2.44 mg·m−2·h−1, approximately 6.48–8.92% of pre-precipitation levels. Similarly, forest soil CO2 emissions declined to 1.49–2.29 mg·m−2·h−1, representing about 9.33–26.18% of pre-precipitation levels. CO2 emissions from farmland and forest soils followed the pattern W1 > W2 > W3 during the first stage and W3 > W2 during the second pulse stage.

3.1.3. Variation Trend of Soil N2O Under Different Extreme Moisture Conditions

As shown in Figure 2, soil N2O emissions rapidly increased following extreme moisture treatment and subsequently exhibited a fluctuating decline. N2O emissions peaked three days prior to extreme moisture and followed a cyclical pattern of increase and decrease over ten-day intervals. Overall, soil N2O emissions gradually decreased, with more pronounced changes observed in the forest soil compared to the farmland soil. Prior to extreme moisture, forest soil N2O emissions ranged from 12.85 to 21.14 mg·m−2·h−1, while those from farmland soil ranged from 6.41 to 236.48 mg·m−2·h−1. Following extreme moisture, forest soil N2O emissions decreased to 0.94–4.14 mg·m−2·h−1, approximately 6.27–32.24% of pre-precipitation levels. Farmland soil N2O emissions were approximately 7.31–69.60% of pre-precipitation levels. In the forest soil, the N2O emission reached the maximum one day after the extreme moisture occurred, and the N2O emissions of W1, W2, and W3 were 26.71, 66.00, and 48.82 mg·m−2·h−1, which each treatment increased by 5%, 160%, and 145% compared with that before the pulse rise. That is, compared with before treatment, the N2O emissions after water treatment were W2 > W3 > W1. In farmland soil, N2O emissions peaked on the second day after the extreme precipitation event. Fluxes under W2 and W3 were 29.11 and 38.37 mg·m−2·h−1, representing increases of 881% and 1246% compared with the previous sampling. In other words, compared with before treatment, after water treatment, N2O emission was W3 > W2. The second maximum of N2O emissions occurred on the 22nd day after the occurrence of extreme moisture, and the soil N2O emissions of W2 and W3 increased by 76% and 152% compared with the last sampling. On the 57th day of extreme moisture occurrence, soil N2O emissions reached the third peak of the whole precipitation phase, and the N2O emissions of soil treated with W2 and W3 increased by 270% and 144% compared with the last sampling.

3.1.4. Differences in Global Warming Potential

As shown in Table 2, GWP was primarily attributed to soil CO2 and N2O emissions, with N2O contributing more than 69%. The GWP of forest land was higher than that of farmland, and there was a significant difference between the GWP of farmland and forest land. In the farmland, the cumulative CO2 emissions of soil were significantly different under the two extreme moisture conditions of W2 treatment and W3 treatment. The cumulative CO2 emissions in W2 mode were 43.01% lower than those in W1 mode, and 68.67% lower in W3 mode than those in W1 mode. Soil N2O cumulative emissions under the treatment of W2 mode were reduced by 21.83% compared with W1 mode, and increased by 0.61% compared with W1 mode in W3 mode. The GWP of farmland showed W3 > W1 > W2 mode, which decreased by 21.93% under W2 mode treatment compared with W1 mode, and increased by W3 mode compared with control by 0.14%.
In the forest soil, the cumulative CO2 emissions under W2 treatment decreased by 9.24% and 22.52% under W3 treatment compared with W1 treatment. The cumulative N2O emissions of soil under W2 treatment increased by 13.71% compared with W1 treatment, and decreased by 25.46% under the W3 treatment compared with the W1 treatment. Soil GWP showed W2 > W1 > W3, and there was a significant correlation between W3 and W1. Compared with the W1 treatment, GWP increased by 11.09% under the W2 mode of treatment and decreased by 24.43% in the W3 treatment. That is to say, the GWP caused by forest soil was higher than that of farmland soil in an extreme moisture environment for a long time, and the global warming caused by saturation mode was higher than that caused by inundation mode.

3.2. Soil Carbon and Nitrogen Under Extreme Moisture Conditions

3.2.1. Changes in Soil Carbon Pool Under Different Extreme Moisture Conditions

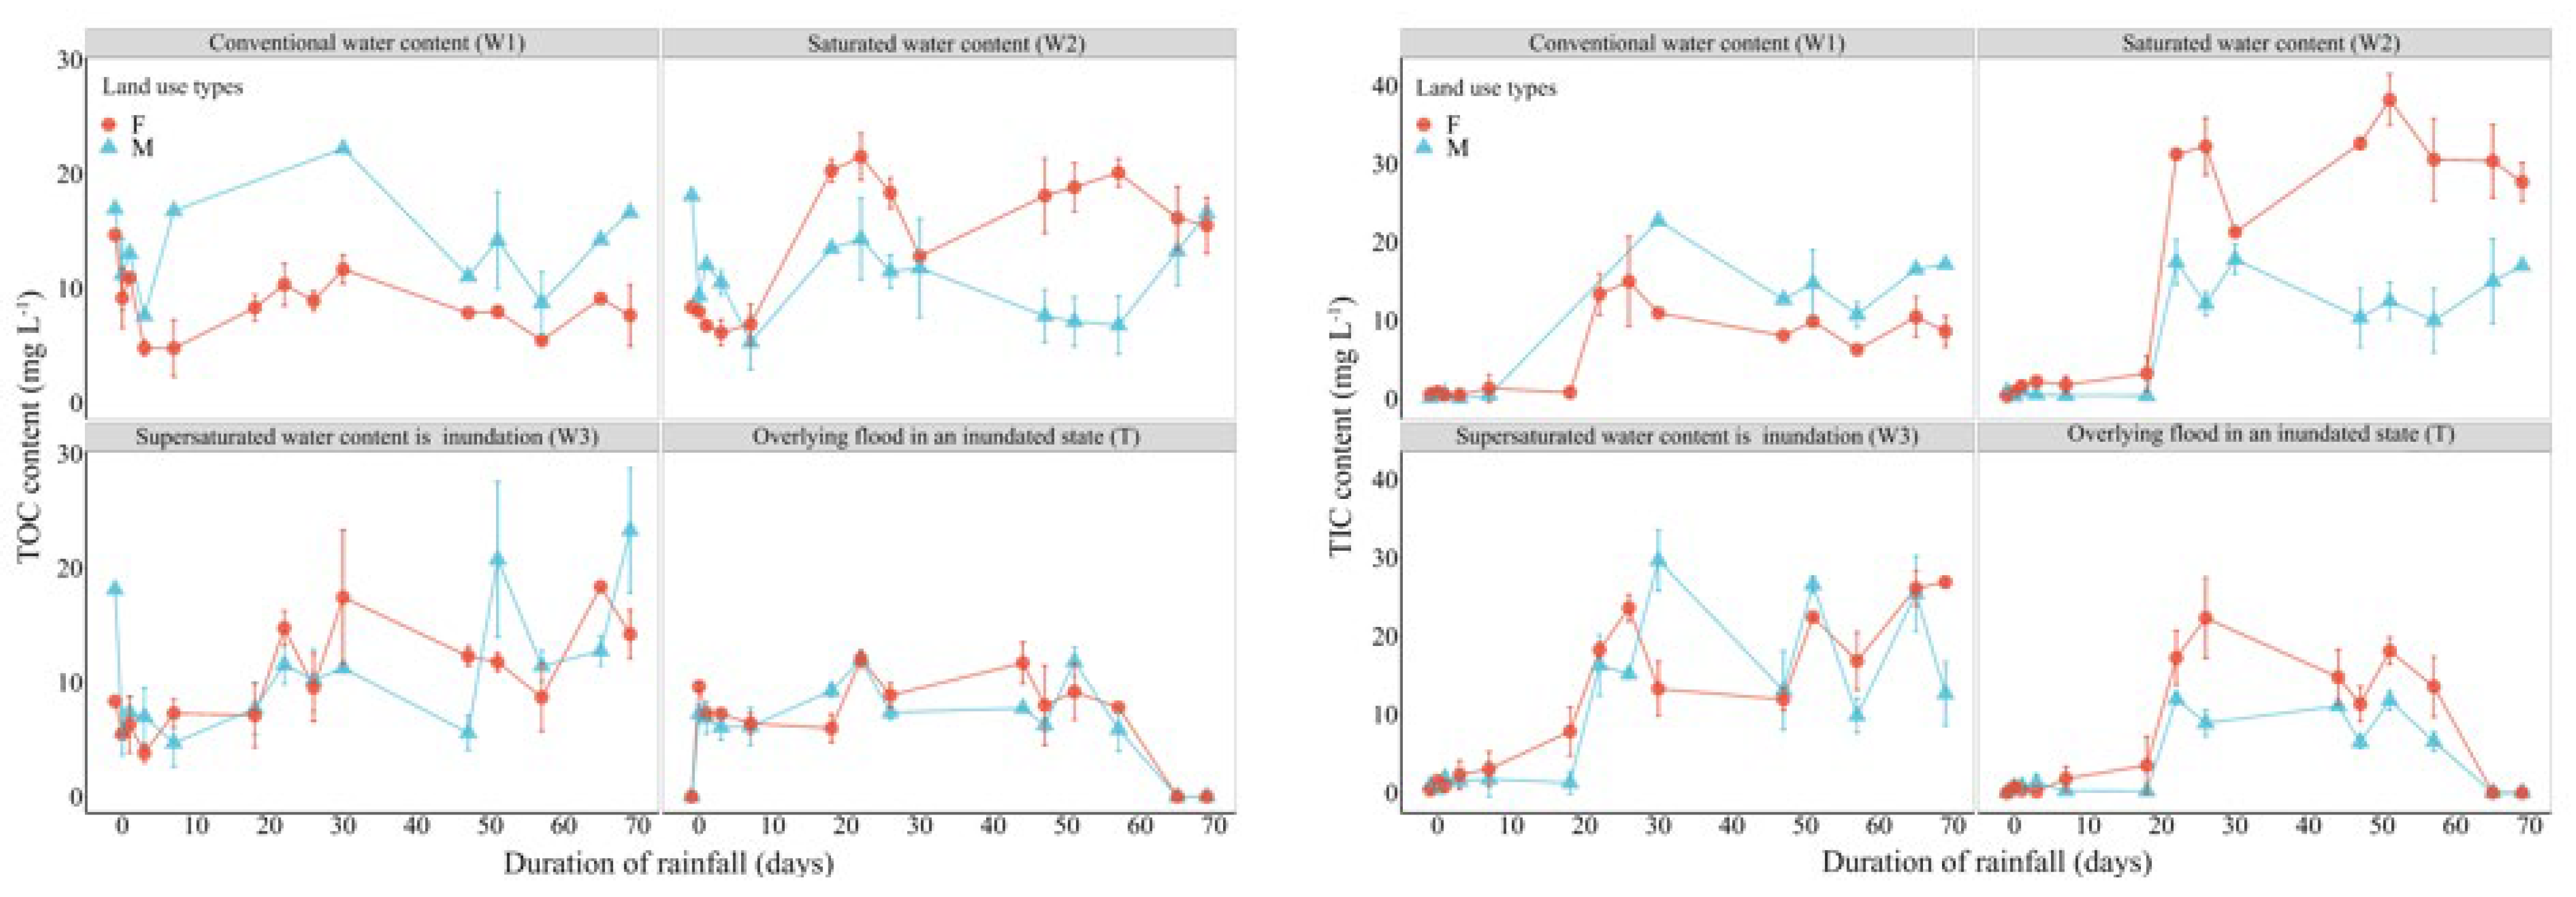
Figure 3 shows the difference in the TOC content in farmland soil and forest soil under the same treatment. Under W1 treatment, the organic carbon content in farmland soil solution was always higher than that in the forest soil; however, the total organic carbon content in soil solution and overlying flood after precipitation was higher than that in the farmland, and the TOC content in W2, W3, and T was lower than that in the control. The possible reason was that soil organic carbon in farmland was converted to GHG after precipitation, which led to a decrease in TOC content in the soil solution. However, due to the inability of leaching and loss of simulated soil aqueous solution, it is still possible that the organic matter in the forest soil exists in soil solution and overlying flood due to a large amount of mineralization after precipitation.
The difference in the TIC content in farmland soil and forest soil under the same treatments is shown in Figure 3. Compared with the two soils under W1 treatment, the inorganic carbon content in the farmland soil solution was always higher than that in the forest soil. However, in the precipitation treatment (W2 and W3), after precipitation occurred, the soil solution and overlying floods both showed total organic carbon content of forest > farmland. Therefore, precipitation may stimulate soil organic matter mineralization in farmland. The increase in the TIC content after precipitation will lead to an increase in soil fertility and promote the absorption of organic carbon by crops, but in actual circumstances, extreme water may also lead to soil erosion and reduce soil inorganic carbon content, affecting soil quality.

3.2.2. Changes in Soil Nitrogen Pool Under Different Extreme Moisture Conditions

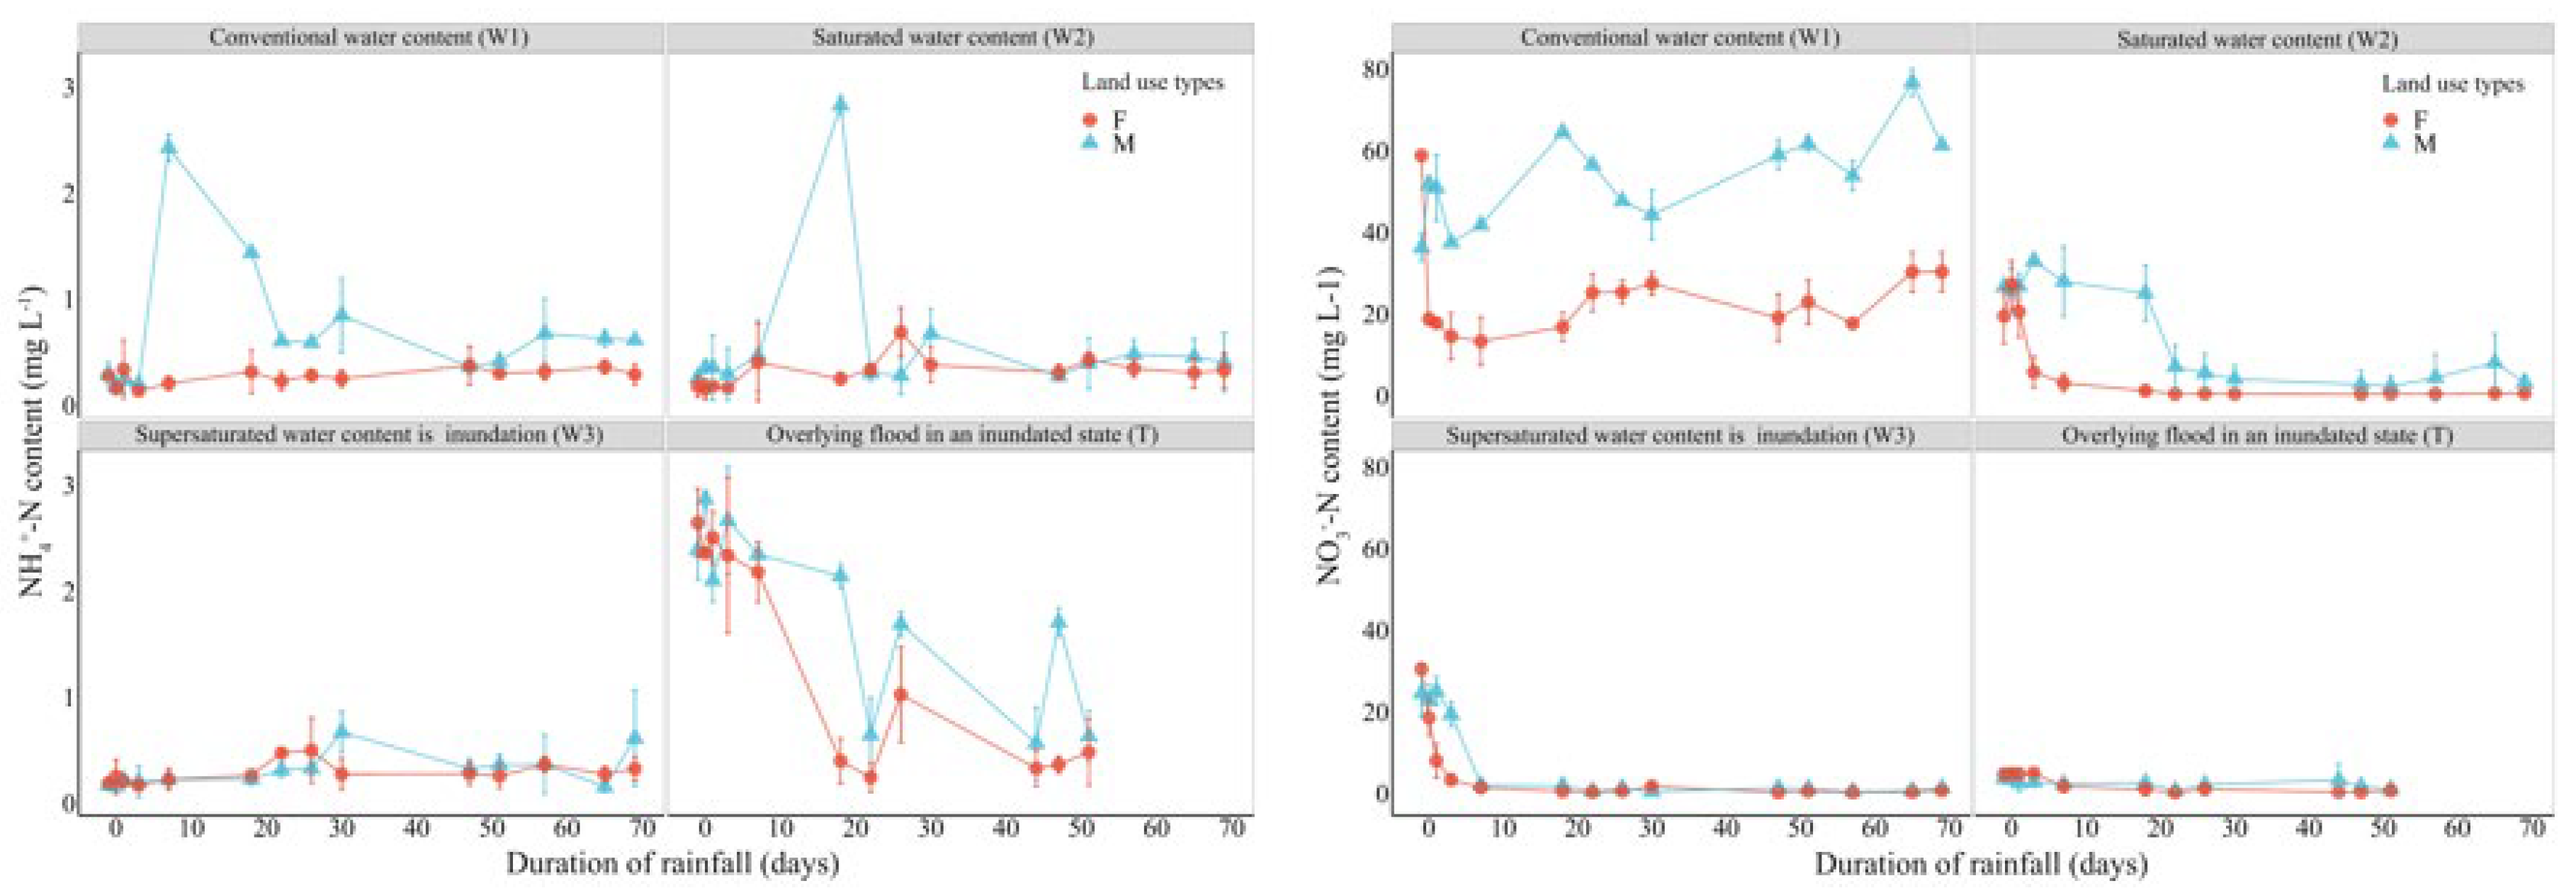
Analysis of soil solution in farmland and forest under different precipitation treatments found NH4+–N (Figure 4). On the day of precipitation, the variation in soil NH4+–N content in farmland under the three extreme moisture conditions was as follows: NH4+–N content decreased by 40% under W1 treatment, NH4+–N content increased by 38.46% under W2 treatment, and W3 had no significant effect on NH4+–N content. As far as forest soil is concerned, the NH4+–N content decreased by 42.86% under the W1 treatment, decreased by 16.67% under W2, and increased by 31.58% under W3. After the end of extreme moisture, the content of NH4+–N in the soil solution of farmland and forest increased by 78.57% and 69.64% on average compared with that before the end of extreme moisture. In addition, under the control condition (W1), the content of NH4+–N in the soil solution of the farmland was always higher than that of the forest for 45 days before precipitation, and reached a peak of 2.43 mg·L−1 around the 10th day. However, after 45 days of precipitation, the content of NH4+–N in the forest soil was slightly higher than that in the farmland soil, and the change of NH4+–N in the two kinds of soil solution tended to be stable. Under W2 treatment, the NH4+–N content in farmland soil was much higher than that in the forest soil during 10 to 25 days of precipitation, and reached the highest peak at 20 days, with a peak value of 3 mg·L−1. After this, the content of NH4+–N in the two soils was similar and remained relatively stable, and the difference in the content of NH4+–N in the soil solution was not obvious. When the soil was in submergence mode, the content of NH4+–N in the forest soil was always higher than that in the farmland soil during the whole precipitation period, and the variation of NH4+–N in the two soil solutions was also very consistent, with two large fluctuations within 20 to 40 days of precipitation. Around the 20th day of precipitation, the NH4+–N content in soil solutions of farmland and forest decreased to 0.65 mg·L−1 and 0.25 mg·L−1, respectively. However, under W3 treatment, the NH4+–N content in the two soils was not significantly different and did not change greatly during the whole process. The variation process of NO3–N content in soil solution was different after three kinds of precipitation treatments; only the NO3–N content increased under the W1 precipitation treatment. During the 65 days of simulated extreme moisture, compared with before the occurrence of extreme moisture, the NO3–N content in soil solution gradually decreased after the occurrence of extreme moisture, and the NO3–N content tended to level off until it coincided with zero on the 10th day of precipitation. The changes of NO3–N content in the soil solution of farmland and forest under different precipitation treatments are shown in Figure 4. On the day when precipitation occurred, the changes in NO3–N content in farmland soil under three extreme moisture conditions were as follows: the NO3–N content increased by 42.87% under W1 treatment, the NO3–N content decreased by 3.45% under W2 treatment, and the NO3–N content decreased by 6.96% under W3 treatment. As far as the forest is concerned, the content of NO3–N decreased by 68.15% under W1 treatment, the content of NO3–N increased by 39.68% under W2 treatment, and NO3–N content decreased by 39.13% under W3 treatment. Under W1 treatment, the farmland soil solution in the content of NO3–N was always higher than that in forest land during precipitation. Under W2 treatment, the content of NO3–N in farmland soil was significantly different from that in the forest soil within 20 days before precipitation, but after that, the difference of NO3–N content in the two soils gradually decreased, and the variation of NO3–N in the two soils tended to be stable. In the W3 model, the NO3–N content in farmland and forest soil showed a sharp decline in the 10 days before precipitation, and the NO3–N content in both the soils completely decreased to zero on the 10th day of precipitation. There was no significant difference in NO3–N content in the two types of soil overlying floods, and NO3–N content did not change significantly with the passage of precipitation time.

3.3. Soil Enzyme Activity

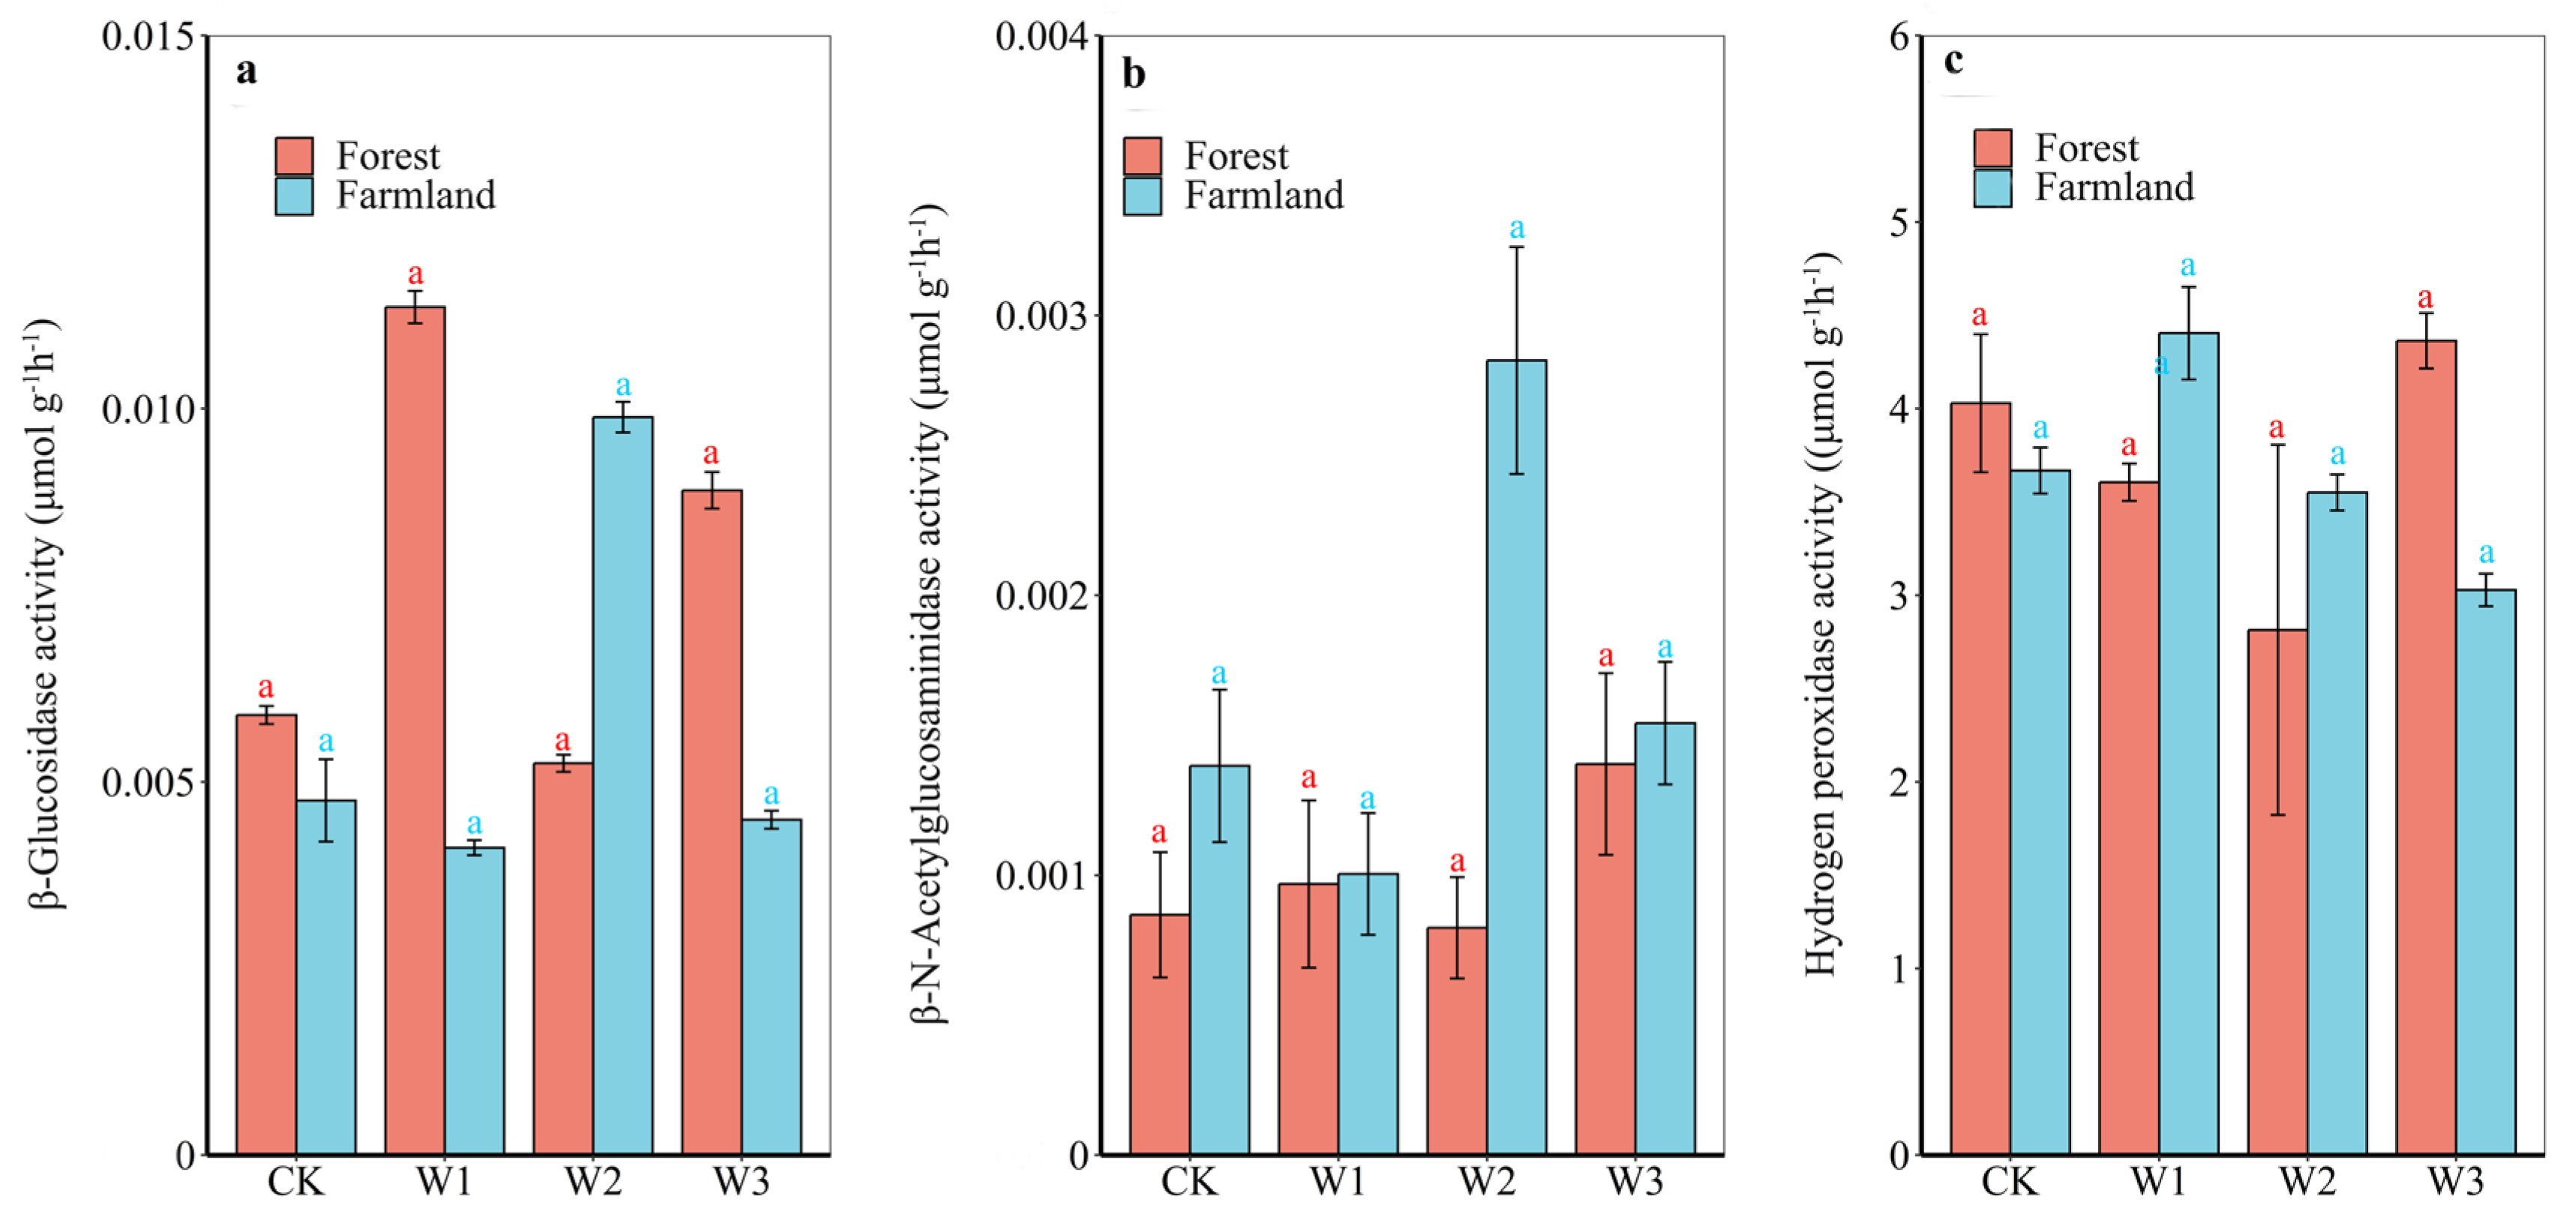
The differences in soil enzyme activities between different precipitation treatments and before precipitation are shown in Figure 5. In the forest soil, when the water content of the soil reached 60% due to precipitation, the soil β-glucosidase activity of the soil was the highest, which increased by 93.22% compared with CK. The β-glucosidase activity also increased under W3 treatment, with an increase of 50.85%. When the soil reached saturation water content due to precipitation, the β-Glucosidase activity of the soil was significantly inhibited, decreasing by 11.86% compared with CK. In farmland soil, under W2 treatment had the best effect on improving soil β-Glucosidase activity, and the activity increased by 110.64% compared with that before precipitation. In addition, other treatments had no significant effect on soil β-Glucosidase activity.
In the forest soil, different precipitation treatments had no significant promoting effect on β-N-Acetylglucosaminidase activity compared with CK. However, in farmland soil, the increase in soil activity was the highest when precipitation reached the saturated water content, which was an increase of 100% compared with that before precipitation. In addition, other conditions did not significantly promote or inhibit the activity of N-Acetylamino-β-Glucosidase.
In farmland soil, the improvement effect of hydrogen peroxidase activity under W1 treatment was the best, and the activity increased by 20.07%, while in the forest soil, the activity of hydrogen peroxidase increased by 8.31% under W3 treatment. All other treatments had inhibitory effects on hydrogen peroxidase activity in farmland and forest soil.

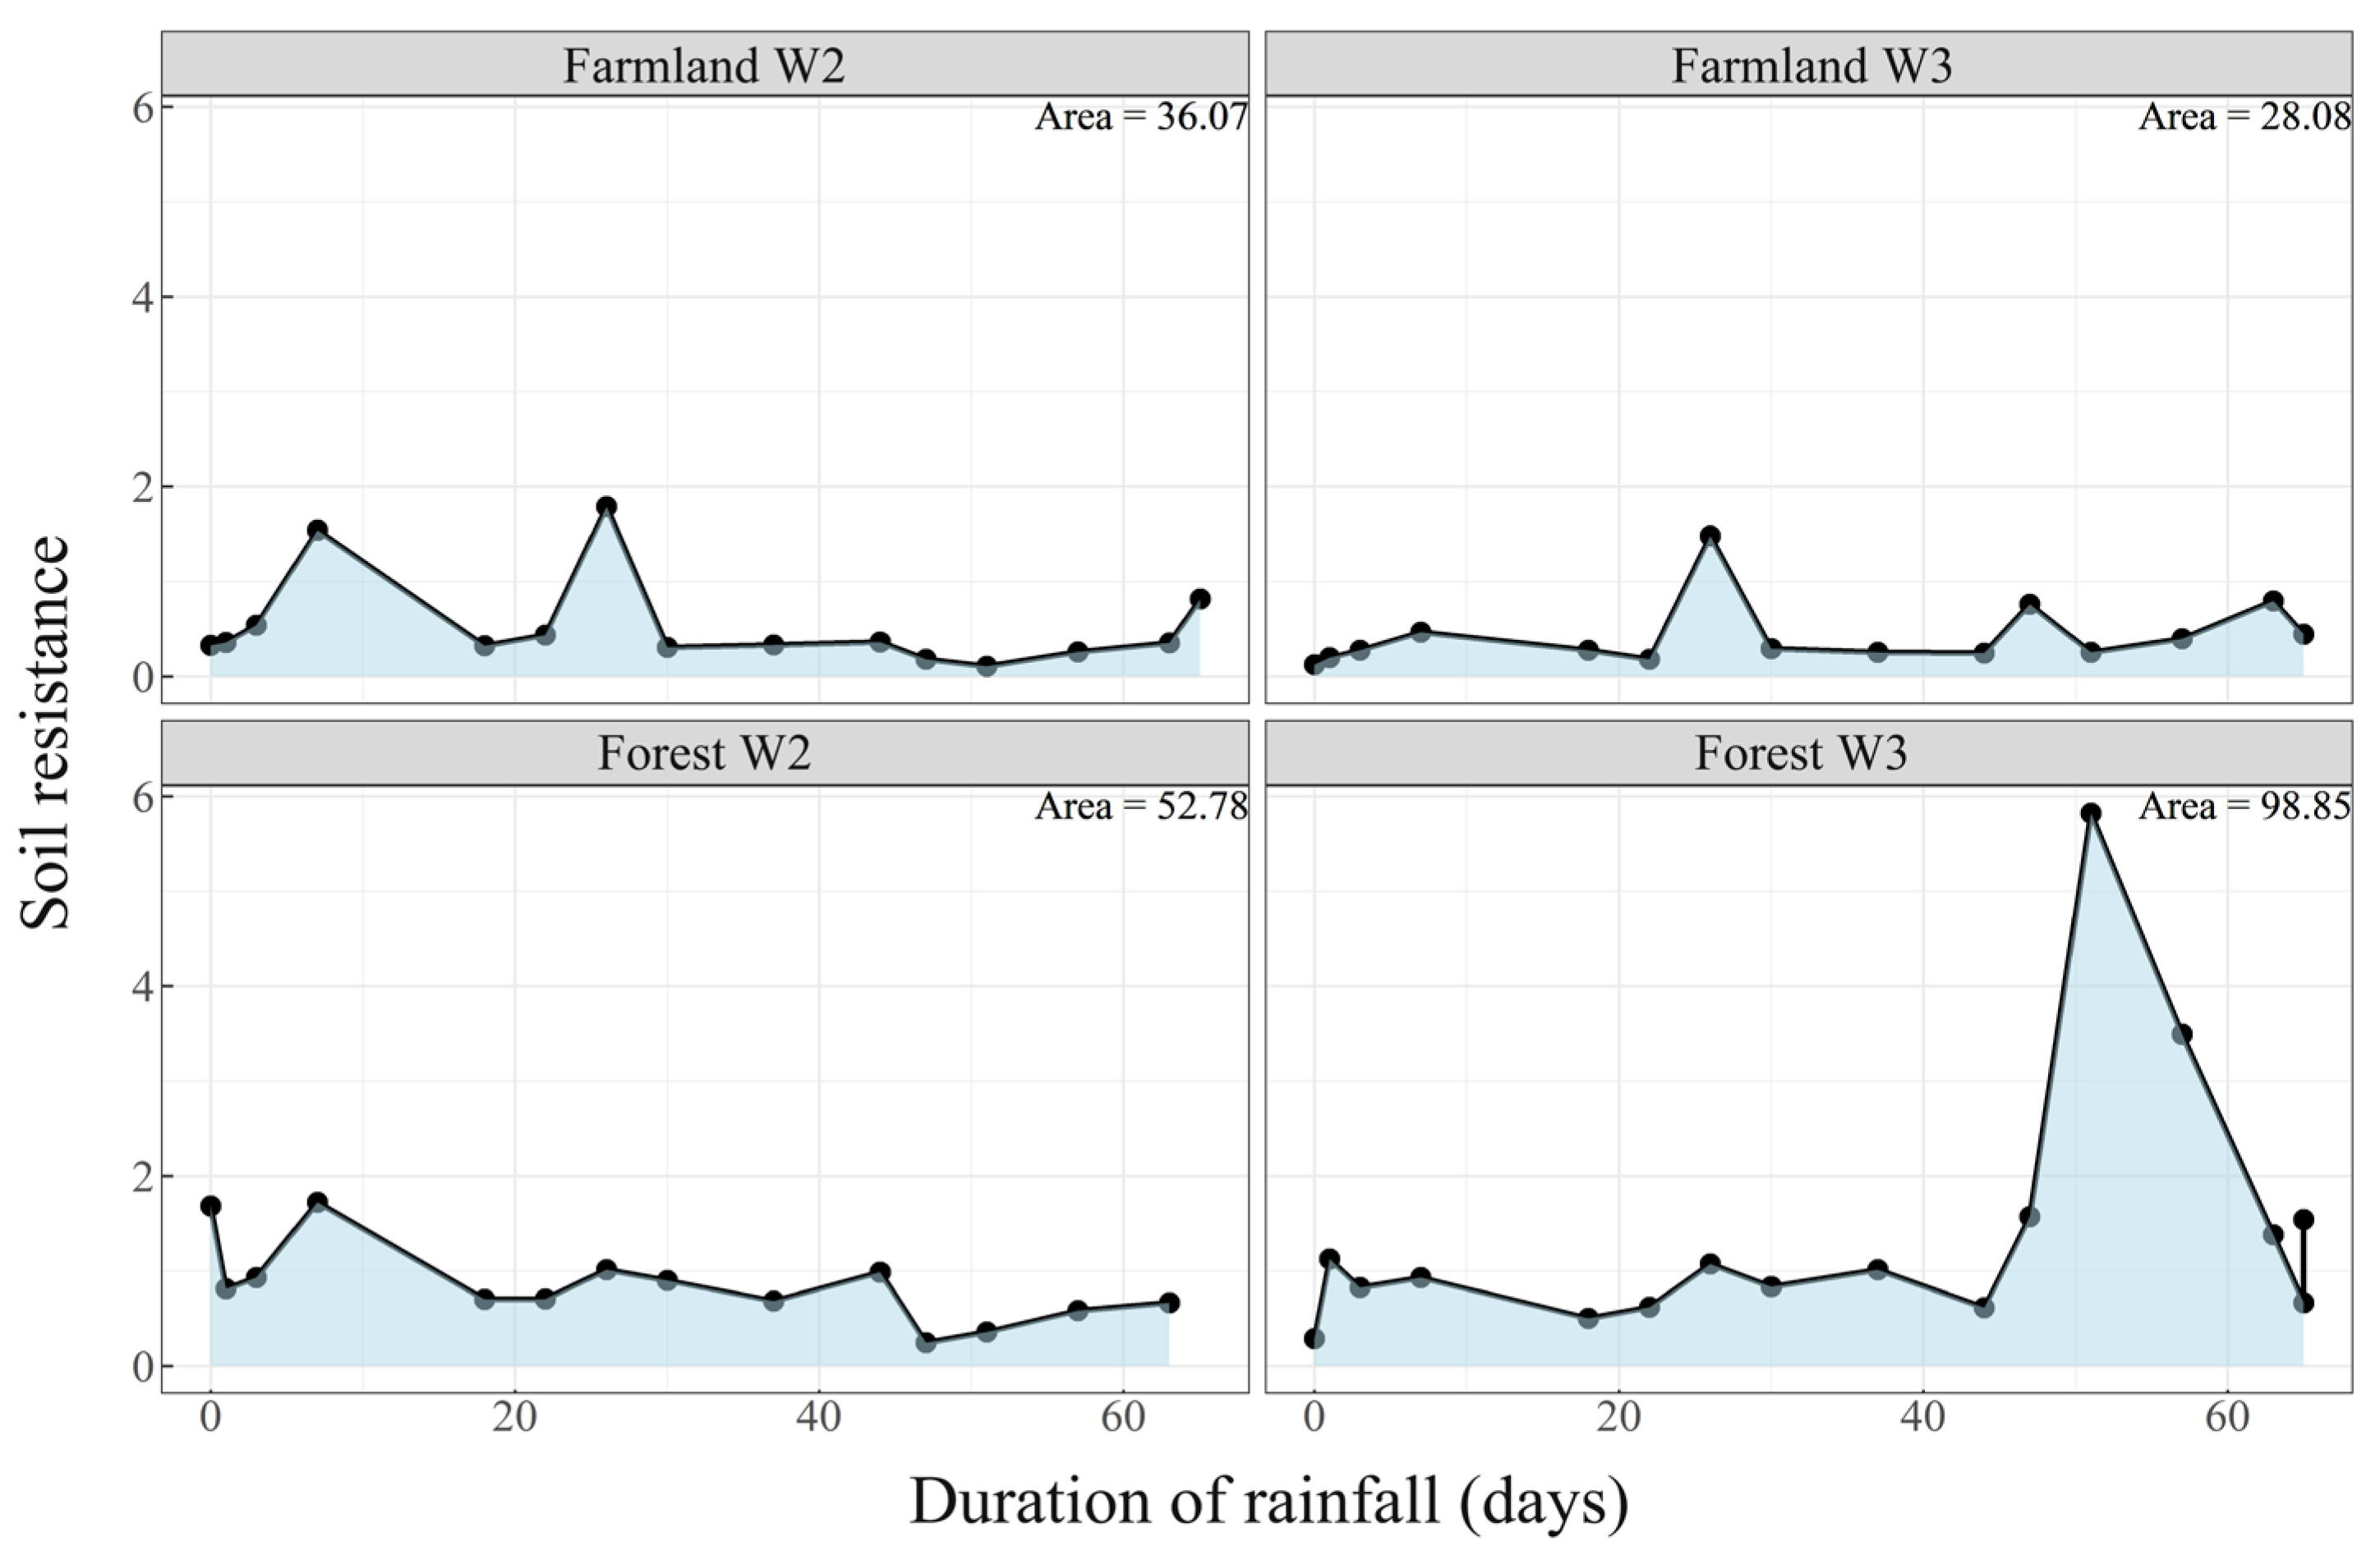
3.4. Soil Resistance

Since the experimental soil has no vegetation or root system, the measured CO2 emissions of soil are regarded as the resistance or resilience of soil microbial activity, in order to study the differences in soil microbial resistance under different extreme moisture and soil types. As shown in Figure 6, under the stress of four different precipitation modes, soil resistance fluctuated 1–2 times during the whole precipitation process, and the resistance of farmland soil under the W2 condition experienced two large fluctuations in the 25 days before precipitation, indicating that the soil could recover itself after suffering the impact of extreme moisture during this period. However, the forest soil W2 treatment showed a gradually decreasing trend after treatment, indicating that the resistance of such soil under flood stress was poor. The soil resistance of farmland soil covered with a 10 cm flood had only one small fluctuation during precipitation periods and showed a steady and unchanged trend at other times. In contrast, the soil resistance of forest soil under W3 conditions increased sharply in the late precipitation period, indicating that the soil recovered the fastest when the precipitation was about to end. The area of the blue block in Figure 6 shows the ecosystem stability of soil under this condition, and the larger the area, the stronger the stability. Figure 6 shows that, during the precipitation period, the order of stability from high to low was forest soil W3 > forest soil W2 > farmland soil W2 > farmland soil W3. Under extreme moisture conditions, the soil stability of forest soil is generally stronger than that of farmland, and farmland soil may be difficult to restore the stability of soil ecological function under long-term flood conditions.

3.5. Evaluation of Soil Functional Stability Under Extreme Moisture Conditions

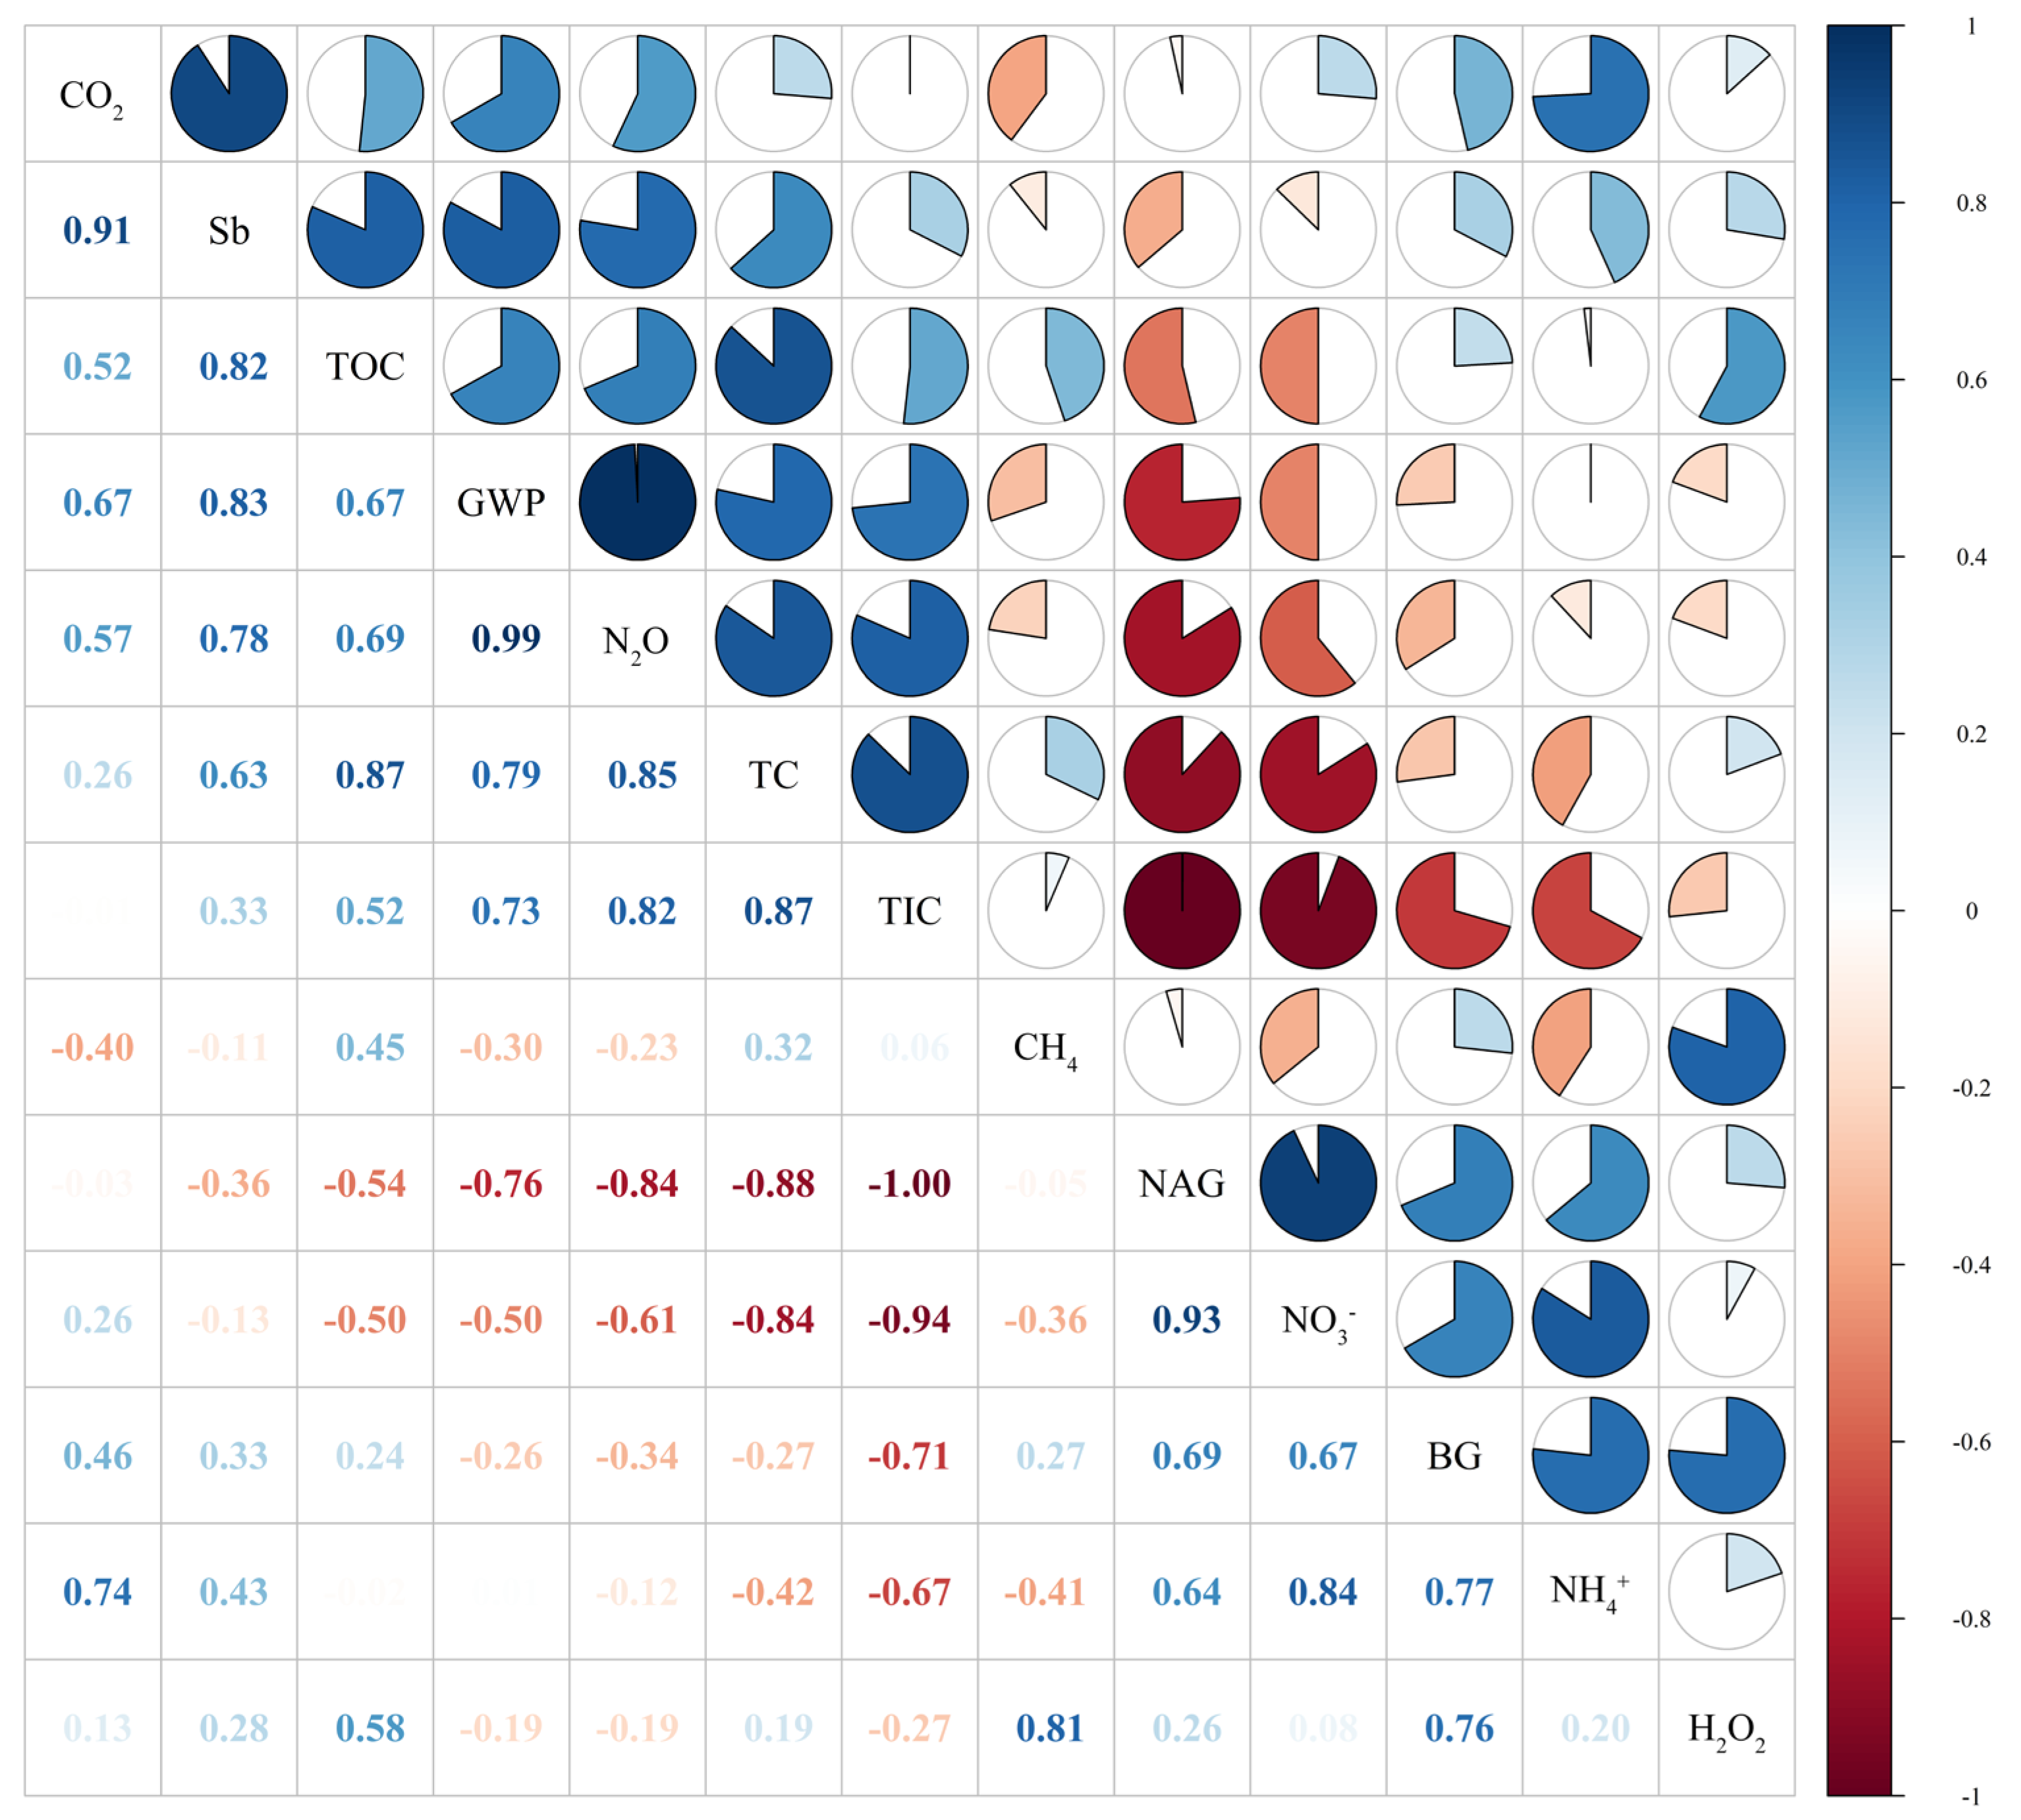
The correlation analysis between soil functional stability and its influencing factors showed (Figure 7) that the ecological stability of soil functions was positively correlated with total CO2 emissions, GWP, and TOC, and was positively correlated with total N2O emissions and soil TOC. There was a significant positive correlation between total emission of CH4 and hydrogen peroxidase (H2O2). The total CO2 emission was positively correlated with the total N2O emission, GWP, TOC, and NH4+–N. The total emission of N2O was positively correlated with GWP, TIC, and TC, and negatively correlated with the activity of N-Acetylamino-β-Glucosidase (NAG). GWP was significantly negatively correlated with NAG activity and NO3–N content, and significantly positively correlated with TIC, TC, and TOC. Soil β-Glucosidase activity (BG) was significantly negatively correlated with inorganic carbon, significantly positively correlated with NAG activity, H2O2 enzyme activity, and NH4+–N, and significantly positively correlated with NO3–N. The activity of NAG was significantly negatively correlated with TIC and TC, significantly correlated with TOC, and significantly positively correlated with NO3–N. H2O2 enzyme was positively correlated with TOC content. TIC was significantly negatively correlated with NO3–N content, significantly negatively correlated with NH4+–N content, and significantly positively correlated with TC and TOC content. Soil TC was significantly positively correlated with TOC and negatively correlated with NO3–N. TOC was significantly negatively correlated with NO3–N. NH4+–N was positively correlated with NO3–N.
That is, the higher the stability of soil ecological function, the more CO2, N2O, and TOC are produced by soil under extreme moisture conditions. Soil CH4 was affected by H2O2 enzyme activity. NAG inhibits the production of N2O and TIC in soil. β-Glucosidase can inhibit the formation of TIC and promote the conversion of soil nitrogen to an inorganic state. Soil inorganic carbon was negatively correlated with inorganic nitrogen.

4. Discussion

4.1. The Effects of Extreme Moisture on Soil Greenhouse Gas Emissions

This study demonstrated that the cumulative CH4 emissions from farmland and forest soils were highest when the soil was submerged under 10 cm of water. These findings are consistent with those reported by Ge [46]. Under conditions of extreme moisture, soil flooding reduces aeration porosity, leading to a decline in oxygen levels and the formation of an anaerobic environment [47]. In this state, methanogens—microorganisms responsible for CH4 production—become highly active, resulting in the highest CH4 emissions. Conversely, under moderate precipitation, soil remains in an aerobic state. In such conditions, methanotrophic bacteria, which decompose CH4 into CO2, are more active. Furthermore, precipitation promotes the mineralization of soil organic matter, generating CO2. The CO2 produced during this process competitively inhibits CH4 within the soil, thereby reducing CH4 emissions. As a result, CH4 emissions decrease and the soil transitions into a CH4 sink, while CO2 emissions increase in the aerobic state.
Following precipitation events, soil CO2 emissions declined sharply, consistent with findings reported by Morell et al. [48]. This can be attributed to reduced soil porosity following extreme moisture, which transforms the aerobic environment into an anaerobic one, thereby decreasing microbial activity associated with soil CO2 emissions [49]. Additionally, soil mineralization is weakened under flooding conditions, reducing the availability of CO2 substrates and resulting in a sharp decline in CO2 emissions. Under identical precipitation conditions, CO2 emissions from farmland exceeded those from forest soils. This is likely due to the year-round application of organic fertilizers in farmland, which promotes the accumulation of organic carbon and consequently leads to higher CO2 emissions compared to forest soils.
This study demonstrated that under extreme water conditions, soil N2O emissions initially exhibited a pulse increase, followed by a gradual decline, aligning with findings from Molodovskaya et al. [50] and López-Ballesteros et al. [51]. This phenomenon may result from precipitation disrupting soil aggregates that encapsulate organic nitrogen, thereby increasing nitrogen substrates and enhancing soil nitrogen mineralization [52]. Consequently, N2O fluxes surged briefly. Under extreme moisture conditions, anaerobic environments activate a variety of anaerobic microorganisms [53], which facilitate N2O production through heterotrophic denitrification [54].
As the duration of extreme moisture extends, the nitrogen content available for reduction to N2O diminishes. Simultaneously, nitrifying bacteria are inhibited, indirectly limiting nitrate production and reducing N2O emissions [55]. When the soil becomes saturated, evaporation causes surface conditions to alternate between aerobic and anaerobic states. In aerobic conditions, nitrogen mineralization provides substrates for nitrification and denitrification, sustaining these processes. However, due to the short duration of aerobic conditions, nitrogen substrates are insufficient to support sustained nitrogen oxidation, leading to nitrogen loss predominantly in the form of N2O [52].
Moreover, our results indicate that N2O emissions from farmland soil under W3 treatment exceeded those under W2 treatment, whereas forest soil exhibited the opposite trend (W2 > W3). Typically, nitrification is the primary source of N2O emissions when the soil water-filled pore space (WFPS) is between 30% and 60%, while denitrification becomes dominant at WFPS levels exceeding 70% [56]. Zhu et al. [57] observed that in environments dominated by nitrification, total N2O emissions were significantly lower compared to denitrification-dominated conditions. Farmland soils, influenced by plowing and other anthropogenic factors, are loose and highly absorptive, resulting in elevated water content after extreme precipitation [58]. Therefore, under W3 precipitation, the denitrification process dominates in farmland soils, consistent with the observed reduction in NO3–N levels. In forest ecosystems, root systems play a crucial role during extreme precipitation events. Yuan and Chen [59] found that fine root productivity in boreal forests increased with higher annual precipitation and atmospheric temperatures. Specifically, a 100 mm increase in annual precipitation significantly boosted fine root biomass by 0.43 mg hm−2. However, under W3 conditions, soil water use efficiency declines, which may limit the forest’s adaptive capacity.

4.2. Effects of Extreme Moisture on Soil Carbon, Nitrogen, and Enzyme Activities

This study revealed that extreme moisture conditions could increase soil TOC content, but significant differences were observed in soil TOC between forest and farmland under W2 treatment. Compared with the control treatment, TOC content in farmland showed a decreasing trend, while forest soil exhibited an increasing trend. The decline in farmland soil TOC aligns with findings from Zhang [60], which reported a slower organic carbon mineralization rate under flooded conditions in paddy fields. This was attributed to the formation of an anaerobic environment that inhibited soil microbial activity. Additionally, a potential mechanism for this result could be the enhanced leaching effect following precipitation pulses, leading to TOC loss, as noted by Sánchez-García et al. [61].
In this study, the inorganic carbon content of soil followed the trend W1 > W3 > W2 in both farmland and forest soils, indicating that organic carbon mineralization was weaker in flooded environments compared to aerobic environments, regardless of whether the soil was saturated or submerged. Changes in nitrogen transformation in soil were largely driven by alterations in the structure and activity of related microbial communities. The results also demonstrated that the NH4+–N content in soil increased significantly under extreme moisture conditions, particularly in the W3 treatment. These findings are consistent with prior studies on the impact of flooding on soil nitrogen cycling, which have provided substantial evidence for enhanced denitrification under such conditions [62,63,64]. Prolonged extreme precipitation events were shown to promote anaerobic reactions, creating favorable conditions for nutrient cycling processes such as ammonification [65,66,67]. A study by Zhang [68] found that nitrogen fixation rates in flooding treatments were 1.85 times higher than those in control treatments. This was attributed to the use of complex organic carbon substrates by microorganisms involved in nitrogen mineralization, coupled with the inhibition of nitrification due to flooding. As a result, NO3–N content decreased significantly, consistent with findings from [69].
Soil enzyme activity reflects the ability of microorganisms to absorb and utilize soil nutrients to a certain extent. Therefore, understanding the effects of different precipitation treatments on soil enzyme activity is a prerequisite for evaluating the metabolic capacity of soil microorganisms. Under extreme precipitation conditions, soil β-Glucosidase is related to soil water content, and soil β-Glucosidase will increase with the increase in soil moisture [70], promoting the conversion of soil carbon to TOC and loss with water, and increasing TIC content will inhibit the activity of this enzyme, leading to a decrease in the TIC content in soil. N-acetylamino-β-glucosidase can promote the conversion of soil nitrogen to the dissolved state, especially conducive to the increase in soil NO3–N content, but the increase in dissolved nitrogen content will also inhibit the activity of this enzyme. Hydrogen peroxidase activity also showed an increasing trend with the increase in moisture content, which would lead to the conversion of soil carbon to an organic state and CO2, and contribute to the increase in soil TOC content.

4.3. Effects of Extreme Moisture on Soil Functional Stability

Soil ecosystem stability is evaluated based on the diversity and abundance of soil microorganisms involved in CO2 production. While CO2 emissions provide insight into microbial activity and ecosystem process rates, functional stability refers to the soil system’s ability to maintain key ecological functions (e.g., C–N cycling and enzyme-mediated decomposition) through resistance and resilience under extreme moisture conditions. This distinction clarifies that CO2 is used as a process indicator, whereas stability is a system-level property. Greater microbial diversity and abundance buffer soils against environmental change. In this study, both farmland and forest soils demonstrated a greater capacity for resistance than resilience following extreme moisture treatments, with forest soil exhibiting higher resistance than farmland. This indicates that both land-use modes retain their restoration ability under the extreme moisture conditions simulated in this study. The greater microbial diversity and abundance in the forest soil, compared to farmland, align with findings reported by Yao et al. [71]. Furthermore, the higher resistance of W3 compared to W2 in the forest soil suggests a rich community of anaerobic microorganisms, consistent with the results of Du et al. [72].
In contrast, the monoculture cropping system in farmland leads to lower microbial diversity and abundance, making its soil microorganisms more vulnerable to structural disruptions. This study also found that greater soil ecological stability under extreme moisture conditions correlates with higher CO2, N2O, and TOC production. Such correlations likely reflect stronger process rates in functionally redundant communities—i.e., a larger, more diverse pool of microorganisms capable of performing similar functions—which can increase carbon and nitrogen losses during extreme-moisture events [73]. CH4 emissions are influenced by hydrogen peroxidase activity, while N-acetyl-amino-β-glucosidase inhibits the formation of N2O and TIC. Additionally, β-glucosidase promotes the conversion of soil nitrogen to inorganic forms and inhibits TIC formation, consistent with findings by Liu et al. [74]. These findings suggest that changes in soil enzyme activity play a key role in regulating the carbon and nitrogen cycle.
Although this study effectively isolated the effects of over-moistening on soil processes under controlled conditions, several methodological limitations should be acknowledged. The laboratory design did not incorporate hydrological processes such as surface runoff or wetland buffering, which are important for water and nutrient redistribution in natural environments. Therefore, the “inundation” treatment (W3) should be regarded as an artificial simulation of waterlogging rather than a true field condition.
In addition, the 65-day incubation period and the limited number of replicates (nine soil samples per land-use type) may constrain the ability to fully capture long-term biogeochemical feedback and reduce statistical robustness. However, the sampling frequency and replication used in this study were sufficient to capture the main temporal patterns of GHG emissions and soil property changes, providing a reliable basis for meaningful comparison within the experimental timeframe. Moreover, examining only two land-use types (farmland and forest) restricts the generalizability of the findings.
Overall, our findings are representative of Calcaric Cambisols developed on loess in a semi-humid monsoon climate (Zhouzhi, Shaanxi), and extrapolation to other WRB Reference Soil Groups should be made with caution.
Future studies should extend the observation period, increase replication, and include a wider range of ecosystems—such as grasslands and wetlands—combined with field-based investigations that consider hydrological connectivity, to enhance the ecological representativeness and applicability of the results.
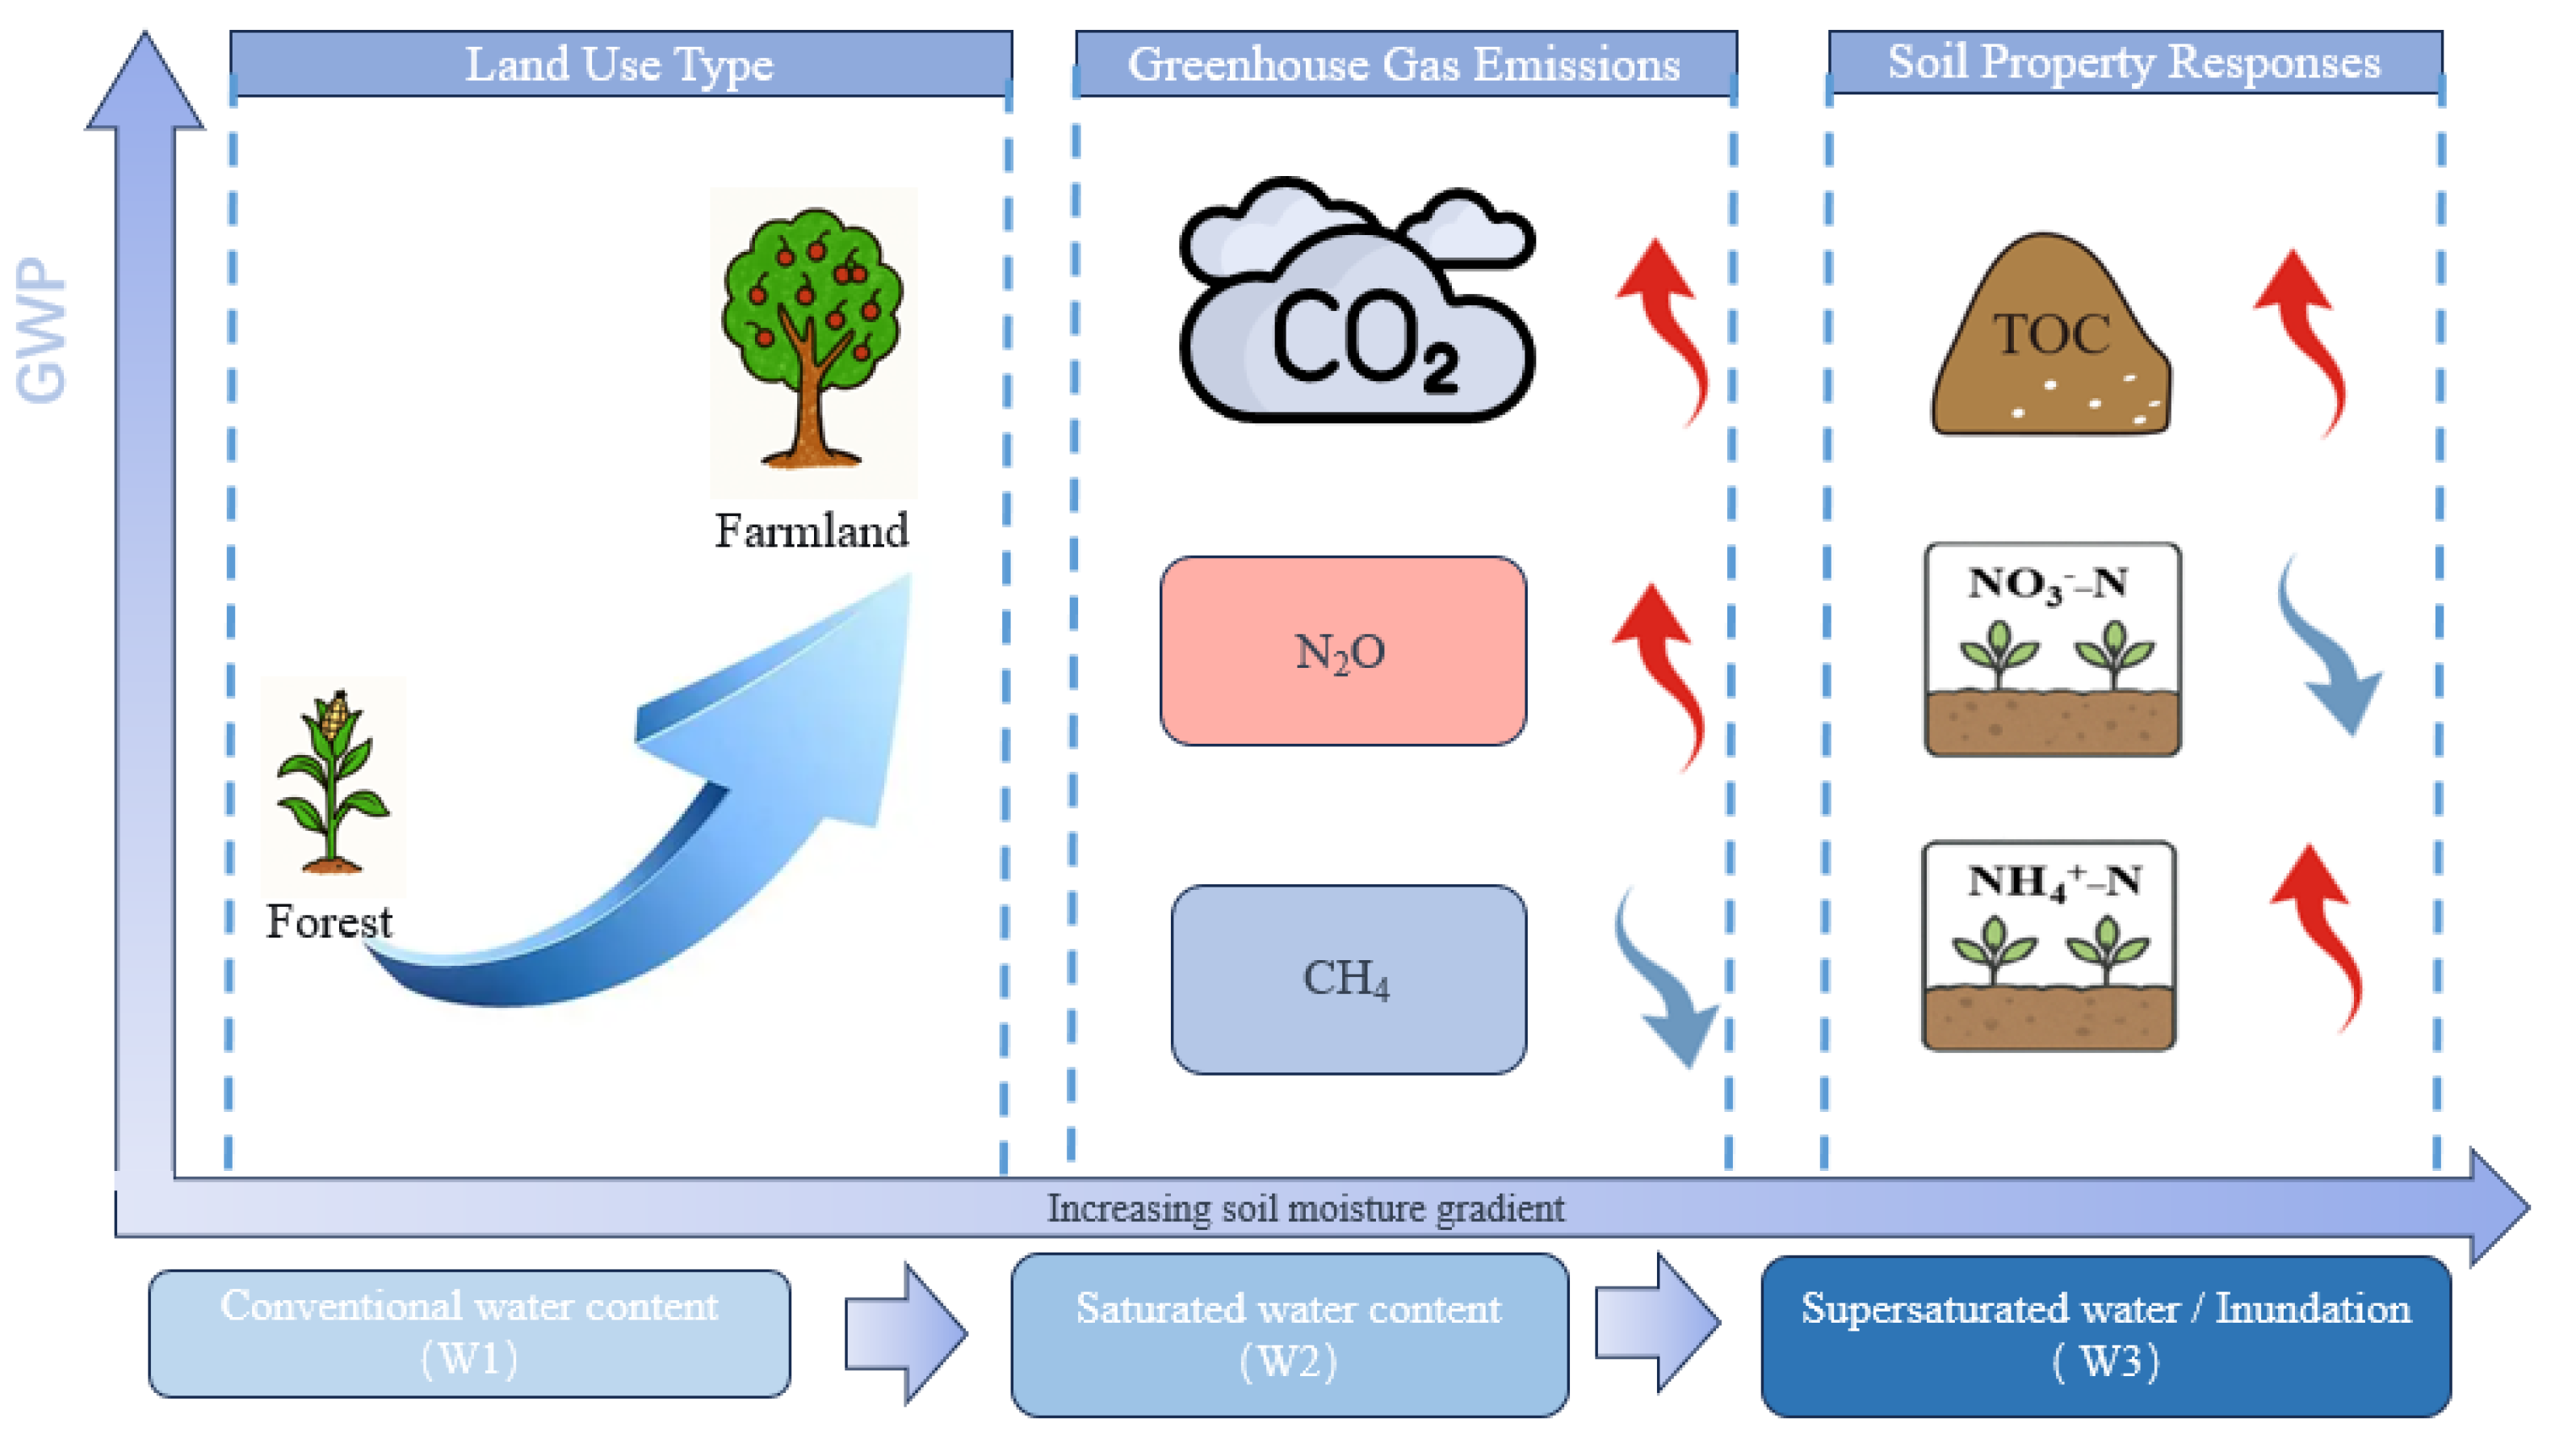
To synthesize the key mechanisms, a conceptual model was developed (Figure 8) to illustrate how soil moisture gradients and land-use types interact to shape soil physicochemical properties and greenhouse gas emissions.

5. Conclusions

Extreme moisture caused the soil to transition from a CH4 sink to a CH4 source. Under identical precipitation conditions, the farmland exhibited higher CH4 emissions compared to the forest soil. In contrast, CO2 emissions showed no significant differences among the treatments. Following extreme moisture, soil N2O emissions sharply increased, then fluctuated before declining. The GWP of farmland and forest soils differed significantly. Farmland soil had the highest GWP under W3 treatment, whereas forest soil exhibited the highest GWP under W2 treatment. Soil water significantly influenced soil organic and inorganic carbon contents, affecting extracellular enzyme activity and substrate availability to regulate carbon mineralization. Furthermore, NH4+–N concentrations in the soil solution increased substantially after extreme moisture. Soil ecological stability exhibited a significant positive correlation with total CO2 emissions, organic carbon, total carbon, N2O emissions, and soil content (referring to soil organic matter and mineral composition). Under W2 treatment, soil ecological stability was less affected by extreme moisture, with forest soil demonstrating stronger resistance than farmland soil. However, soil ecological stability was lowest under W3 precipitation conditions. Therefore, in practical agricultural settings, surface flooding should be promptly removed during extreme precipitation events to minimize soil quality loss and optimize recovery. Fertilization should be applied only after soil water content has returned to normal levels, thereby improving resilience and maintaining soil health.
Although this laboratory microcosm experiment provided clear evidence of soil GHG responses to extreme moisture, its controlled conditions simplified natural processes by excluding vegetation and large-scale hydrological effects. Future field investigations integrating plant–soil interactions, water dynamics, and hydrological connectivity are essential to validate and expand these findings under real-world conditions.

Author Contributions

Conceptualization, W.W., M.Q., J.Z., J.H. and M.Z.; Methodology, W.W., M.Q., J.Z., K.W. and J.H.; Validation, K.W.; Formal analysis, M.Z.; Investigation, W.W., J.Z., K.W. and X.T.; Resources, X.T.; Writing—original draft, W.W.; Writing—review & editing, M.Z.; Supervision, M.Q., K.W., J.H. and X.T.; Project administration, W.W., K.W. and X.T. All authors have read and agreed to the published version of the manuscript.

Funding

This work was supported by the Open Foundation of Key Laboratory in Jiangxi Academy of Water Science and Engineering (grant numbers 2022SKTR02, 2021SKTR02); the Platform Support Project of Northwest Engineering Corporation Limited, Power China (grant numbers 2023-JC-QN-0356); the Natural Science Foundation of Shaanxi Province (grant numbers 2022JM-154); and the National Natural Science Foundation of China (grant numbers 41601321, 42177327, 42007063).

Data Availability Statement

The datasets generated and/or analyzed during the current study are available from the corresponding author on reasonable request. Public sharing is restricted due to privacy considerations.

Conflicts of Interest

Author Minmin Qiang was employed by the company Power China Northwest Survey Design & Research Institute Co. The remaining authors declare that the research was conducted in the absence of any commercial or financial relationships that could be construed as a potential conflict of interest.

References

  1. Lu, R.; Xu, K.; Chen, R.; Chen, W.; Li, F.; Lv, C. Heat waves in summer 2022 and increasing concern regarding heat waves in general. Atmos. Ocean. Sci. Lett. 2022, 16, 100290. [Google Scholar] [CrossRef]
  2. He, C.; Zhou, T.; Zhang, L.; Chen, X.; Zhang, W. Extremely hot East Asia and flooding western South Asia in the summer of 2022 tied to reversed flow over Tibetan Plateau. Clim. Dyn. 2023, 61, 2103–2119. [Google Scholar] [CrossRef]
  3. Allan, R.P.; Arias, P.A.; Berger, S.; Canadell, J.G.; Cassou, C.; Chen, D.; Cherchi, A.; Connors, S.L.; Coppola, E.; Cruz, F.A.; et al. Contribution of Working Groups I, II and III to the Sixth Assessment Report of the Intergovernmental Panel on Climate Change. In Climate Change 2023: Synthesis Report; Lee, H., Romero, J., Eds.; Intergovernmental Panel on Climate Change (IPCC): Geneva, Switzerland, 2023. [Google Scholar]
  4. Liao, Z.; Chen, Y.; Li, W.; Zhai, P. Growing Threats from Unprecedented Sequential Flood-Hot Extremes Across China. Geophys. Res. Lett. 2021, 48, e2021GL094505. [Google Scholar] [CrossRef]
  5. Sánchez-Rodríguez, A.R.; Chadwick, D.R.; Tatton, G.S.; Hill, P.W.; Jones, D.L. Comparative effects of prolonged freshwater and saline flooding on nitrogen cycling in an agricultural soil. Appl. Soil Ecol. 2018, 125, 56–70. [Google Scholar] [CrossRef]
  6. Wang, T.; Wei, H.; Ma, W.; Zhou, C.; Chen, H.; Li, R.; Li, S. Response of Taxodium distichum to winter submergence in the water-level-fluctuating zone of the Three Gorges Reservoir region. J. Freshw. Ecol. 2019, 34, 1–17. [Google Scholar] [CrossRef]
  7. Shen, R.; Lan, Z.; Huang, X.; Chen, Y.; Hu, Q.; Fang, C.; Jin, B.; Chen, J. Soil and plant characteristics during two hydrologically contrasting years at the lakeshore wetland of Poyang Lake, China. J. Soils Sediments 2020, 20, 3368–3379. [Google Scholar] [CrossRef]
  8. Hafeez, F.; Zafar, N.; Nazir, R.; Javeed, H.M.R.; Rizwan, M.; Faridullah; Asad, S.A.; Iqbal, A. Assessment of flood-induced changes in soil heavy metal and nutrient status in Rajanpur, Pakistan. Environ. Monit. Assess. 2019, 191, 234. [Google Scholar] [CrossRef]
  9. Olivera Viciedo, D.; de Mello Prado, R.; Martínez, C.A.; Habermann, E.; de Cássia Piccolo, M. Short-term warming and water stress affect Panicum maximum Jacq. stoichiometric homeostasis and biomass production. Sci. Total Environ. 2019, 681, 267–274. [Google Scholar] [CrossRef] [PubMed]
  10. Fay, P.A.; Carlisle, J.D.; Knapp, A.K.; Blair, J.M.; Collins, S.L. Productivity responses to altered rainfall patterns in a C 4-dominated grassland. Oecologia 2003, 137, 245–251. [Google Scholar] [CrossRef]
  11. Knapp, A.K.; Beier, C.; Briske, D.D.; Classen, A.T.; Luo, Y.; Reichstein, M.; Smith, M.D.; Smith, S.D.; Bell, J.E.; Fay, P.A.; et al. Consequences of More Extreme Precipitation Regimes for Terrestrial Ecosystems. BioScience 2008, 58, 811–821. [Google Scholar] [CrossRef]
  12. Durack, P.J.; Wijffels, S.E.; Matear, R.J. Ocean salinities reveal strong global water cycle intensification during 1950 to 2000. Science 2012, 336, 455–458. [Google Scholar] [CrossRef] [PubMed]
  13. Donat, M.G.; Lowry, A.L.; Alexander, L.V.; O’Gorman, P.A.; Maher, N. More extreme precipitation in the world’s dry and wet regions. Nature Clim. Change 2016, 6, 508–513. [Google Scholar] [CrossRef]
  14. Pendergrass, A.G.; Knutti, R.; Lehner, F.; Deser, C.; Sanderson, B.M. Precipitation variability increases in a warmer climate. Sci. Rep. 2017, 7, 17966. [Google Scholar] [CrossRef] [PubMed]
  15. Sun, Y.; Solomon, S.; Dai, A.; Portmann, R.W. How Often Will It Rain? J. Climate 2007, 20, 4801–4818. [Google Scholar] [CrossRef]
  16. Fishman, R. More uneven distributions overturn benefits of higher precipitation for crop yields. Environ. Res. Lett. 2016, 11, 024004. [Google Scholar] [CrossRef]
  17. Grimm, N.B.; Chapin, I.I.I.F.S.; Bierwagen, B.; Gonzalez, P.; Groffman, P.M.; Luo, Y.; Melton, F.; Nadelhoffer, K.; Pairis, A.; Raymond, P.A.; et al. The impacts of climate change on ecosystem structure and function. Front. Ecol. Environ. 2013, 11, 474–482. [Google Scholar] [CrossRef]
  18. Norris, J.; Chen, G.; Neelin, J.D. Thermodynamic versus Dynamic Controls on Extreme Precipitation in a Warming Climate from the Community Earth System Model Large Ensemble. J. Clim. 2019, 32, 1025–1045. [Google Scholar] [CrossRef]
  19. Wing, O.E.J.; Lehman, W.; Bates, P.D.; Sampson, C.C.; Quinn, N.; Smith, A.M.; Neal, J.C.; Porter, J.R.; Kousky, C. Inequitable patterns of US flood risk in the Anthropocene. Nat. Clim. Chang. 2022, 12, 156–162. [Google Scholar] [CrossRef]
  20. Yan, L.; Chen, S.; Xia, J.; Luo, Y. Precipitation Regime Shift Enhanced the Rain Pulse Effect on Soil Respiration in a Semi-Arid Steppe. PLoS ONE 2014, 9, e104217. [Google Scholar] [CrossRef]
  21. Cui, F.; Yan, G.; Zhou, Z.; Zheng, X.; Deng, J. Annual emissions of nitrous oxide and nitric oxide from a wheat–maize cropping system on a silt loam calcareous soil in the North China Plain. Soil Biol. Biochem. 2012, 48, 10–19. [Google Scholar] [CrossRef]
  22. Nearing, M.A.; Jetten, V.; Baffaut, C.; Cerdan, O.; Couturier, A.; Hernandez, M.; Le Bissonnais, Y.; Nichols, M.H.; Nunes, J.P.; Renschler, C.S.; et al. Modeling response of soil erosion and runoff to changes in precipitation and cover. Catena 2005, 61, 131–154. [Google Scholar] [CrossRef]
  23. Jarvis, P.; Rey, A.; Petsikos, C.; Wingate, L.; Rayment, M.; Pereira, J.; Banza, J.; David, J.; Miglietta, F.; Borghetti, M.; et al. Drying and wetting of Mediterranean soils stimulates decomposition and carbon dioxide emission: The “Birch effect”. Tree Physiol. 2007, 27, 929–940. [Google Scholar] [CrossRef]
  24. Lado-Monserrat, L.; Lull, C.; Bautista, I.; Lidón, A.; Herrera, R. Soil moisture increment as a controlling variable of the “Birch effect”. Interactions with the pre-wetting soil moisture and litter addition. Plant Soil 2014, 379, 21–34. [Google Scholar] [CrossRef]
  25. Bünemann, E.K.; Bongiorno, G.; Bai, Z.; Creamer, R.E.; De Deyn, G.; de Goede, R.; Fleskens, L.; Geissen, V.; Kuyper, T.W.; Mäder, P.; et al. Soil quality—A critical review. Soil Biol. Biochem. 2018, 120, 105–125. [Google Scholar] [CrossRef]
  26. Dick, R.P.; Breakwell, D.P.; Turco, R.F. Soil Enzyme Activities and Biodiversity Measurements as Integrative Microbiological Indicators. In Methods for Assessing Soil Quality; John Wiley & Sons, Ltd.: Hoboken, NJ, USA, 1997; pp. 247–271. [Google Scholar]
  27. Burns, A.; Ryder, D.S. Response of bacterial extracellular enzymes to inundation of floodplain sediments. Freshw. Biol. 2001, 46, 1299–1307. [Google Scholar] [CrossRef]
  28. Gardner, C.M.; Robinson, D.; Blyth, K.; Cooper, J.D. Soil Water Content. In Soil and Environmental Analysis, 2nd ed.; CRC Press: Boca Raton, FL, USA, 2000. [Google Scholar]
  29. Weltzin, J.F.; Loik, M.E.; Schwinning, S.; Williams, D.G.; Fay, P.A.; Haddad, B.M.; Harte, J.; Huxman, T.E.; Knapp, A.K.; Lin, G.; et al. Assessing the Response of Terrestrial Ecosystems to Potential Changes in Precipitation. BioScience 2003, 53, 941–952. [Google Scholar] [CrossRef]
  30. Ciais, P.; Reichstein, M.; Viovy, N.; Granier, A.; Ogée, J.; Allard, V.; Aubinet, M.; Buchmann, N.; Bernhofer, C.; Carrara, A.; et al. Europe-wide reduction in primary productivity caused by the heat and drought in 2003. Nature 2005, 437, 529–533. [Google Scholar] [CrossRef] [PubMed]
  31. Anderson-Teixeira, K.J.; Delong, J.P.; Fox, A.M.; Brese, D.A.; Litvak, M.E. Differential responses of production and respiration to temperature and moisture drive the carbon balance across a climatic gradient in New Mexico. Glob. Change Biol. 2011, 17, 410–424. [Google Scholar] [CrossRef]
  32. McCann, K.S. The diversity–stability debate. Nature 2000, 405, 228–233. [Google Scholar] [CrossRef]
  33. Seybold, C.A.; Herrick, J.E.; Brejda, J.J. Soil resilience: The fundamental component of soil quality. Soil Sci. 1999, 164, 224–234. [Google Scholar] [CrossRef]
  34. Holt, R.D. Ecology: Asymmetry and stability. Nature 2006, 442, 252–253. [Google Scholar] [CrossRef] [PubMed]
  35. He, J.-Z.; Hu, H.-W.; Zhang, L.-M. Current insights into the autotrophic thaumarchaeal ammonia oxidation in acidic soils. Soil Biol. Biochem. 2012, 55, 146–154. [Google Scholar] [CrossRef]
  36. Griffiths, B.S.; Philippot, L. Insights into the resistance and resilience of the soil microbial community. FEMS Microbiol. Rev. 2013, 37, 112–129. [Google Scholar] [CrossRef]
  37. Li, M.; Zhu, L.-C.; Zhang, Q.-F.; Cheng, X.-L. Impacts of different land use types on soil nitrogen mineralization in Danjiangkou Reservoir Area, China. Chin. J. Plant Ecol. 2012, 36, 530–538. [Google Scholar] [CrossRef]
  38. Yang, X.; Zhou, B.; Xu, Y.; Han, Z. CMIP6 Evaluation and Projection of Precipitation over Northern China: Further Investigation. Adv. Atmos. Sci. 2023, 40, 587–600. [Google Scholar] [CrossRef]
  39. Wu, S.-Y.; Wu, Y.; Wen, J. Future changes in precipitation characteristics in China. Int. J. Climatol. 2019, 39, 3558–3573. [Google Scholar] [CrossRef]
  40. IUSS Working Group WRB. World Reference Base for Soil Resources: International Soil Classification System for Naming Soils and Creating Legends for Soil Maps, 4th ed.; IUSS: Vienna, Austria, 2022. [Google Scholar]
  41. Oram, N.J.; De Deyn, G.B.; Bodelier, P.L.E.; Cornelissen, J.H.C.; van Groenigen, J.W.; Abalos, D. Plant community flood resilience in intensively managed grasslands and the role of the plant economic spectrum. J. Appl. Ecol. 2020, 57, 1524–1534. [Google Scholar] [CrossRef]
  42. GB/T 7172–1987; Standardization Administration of China. Method for the Determination of Soil Water Content. Standards Press of China: Beijing, China, 1987. (In Chinese)
  43. NY/T 1121.4–2006; Ministry of Agriculture of the People’s Republic of China. Soil Testing—Part 4: Method for Determination of Soil Bulk Density. China Agriculture Press: Beijing, China, 2006. (In Chinese)
  44. Walkley, A.; Black, I.A. An Examination of the Degtjareff Method for Determining Soil Organic Matter, and a Proposed Modification of the Chromic Acid Titration Method. Soil Sci. 1934, 37, 29–38. [Google Scholar] [CrossRef]
  45. Bremner, J.M. Nitrogen—Total. In Methods of Soil Analysis. Part 3—Chemical Methods; Sparks, D.L., Ed.; SSSA Book Series 5; Soil Science Society of America & American Society of Agronomy: Madison, WI, USA, 1996; pp. 1085–1121. [Google Scholar] [CrossRef]
  46. Ge, X. Effect of Cover Cropping on Greenhouse Gasemissions in a Winter Wheat Farmland Underdifferent Rainfall Patteren. Master’s thesis, Northwest University, Maryville, MO, USA, 2019. [Google Scholar]
  47. Wu, X.; Yao, Z.; Brüggemann, N.; Shen, Z.; Wolf, B.; Dannenmann, M.; Zheng, X.; Butterbach-Bahl, K. Effects of soil moisture and temperature on CO2 and CH4 soil–atmosphere exchange of various land use/cover types in a semi-arid grassland in Inner Mongolia, China. Soil Biol. Biochem. 2010, 42, 773–787. [Google Scholar] [CrossRef]
  48. Morell, F.J.; Álvaro-Fuentes, J.; Lampurlanés, J.; Cantero-Martínez, C. Soil CO2 fluxes following tillage and rainfall events in a semiarid Mediterranean agroecosystem: Effects of tillage systems and nitrogen fertilization. Agric. Ecosyst. Environ. 2010, 139, 167–173. [Google Scholar] [CrossRef]
  49. Chen, J.; Nie, Y.; Liu, W.; Wang, Z.; Shen, W. Ammonia-Oxidizing Archaea Are More Resistant Than Denitrifiers to Seasonal Precipitation Changes in an Acidic Subtropical Forest Soil. Front. Microbiol. 2017, 8, 1384. [Google Scholar] [CrossRef]
  50. Molodovskaya, M.; Singurindy, O.; Richards, B.K.; Warland, J.; Johnson, M.S.; Steenhuis, T.S. Temporal Variability of Nitrous Oxide from Fertilized Croplands: Hot Moment Analysis. Soil Sci. Soc. Am. J. 2012, 76, 1728–1740. [Google Scholar] [CrossRef]
  51. López-Ballesteros, A.; Serrano-Ortiz, P.; Sánchez-Cañete, E.P.; Oyonarte, C.; Kowalski, A.S.; Pérez-Priego, Ó.; Domingo, F. Enhancement of the net CO2 release of a semiarid grassland in SE Spain by rain pulses. J. Geophys. Res. Biogeosciences 2016, 121, 52–66. [Google Scholar] [CrossRef]
  52. Zhu, M.; De Boeck, H.J.; Xu, H.; Chen, Z.; Lv, J.; Zhang, Z. Seasonal variations in the response of soil respiration to rainfall events in a riparian poplar plantation. Sci. Total Environ. 2020, 747, 141222. [Google Scholar] [CrossRef]
  53. Chapuis-Lardy, L.; Wrage, N.; Metay, A.; Chotte, J.-L.; Bernoux, M. Soils, a sink for N2O? A review. Glob. Change Biol. 2007, 13, 1–17. [Google Scholar] [CrossRef]
  54. Krichels, A.; DeLucia, E.H.; Sanford, R.; Chee-Sanford, J.; Yang, W.H. Historical soil drainage mediates the response of soil greenhouse gas emissions to intense precipitation events. Biogeochemistry 2019, 142, 425–442. [Google Scholar] [CrossRef]
  55. Van Straaten, O.; Veldkamp, E.; Köhler, M.; Anas, I. Spatial and temporal effects of drought on soil CO2 efflux in a cacao agroforestry system in Sulawesi, Indonesia. Biogeosciences Discuss. 2010, 7, 1223–1235. [Google Scholar] [CrossRef]
  56. Li, W.; Sun, Y.; Li, G.; Liu, Z.; Wang, H.; Zhang, D. Contributions of nitrification and denitrification to N2O emissions from aged refuse bioreactor at different feeding loads of ammonia substrates. Waste Manag. 2017, 68, 319–328. [Google Scholar] [CrossRef]
  57. Zhu, X.; Burger, M.; Doane, T.A.; Horwath, W.R. Ammonia oxidation pathways and nitrifier denitrification are significant sources of N2O and NO under low oxygen availability. Proc. Natl. Acad. Sci. USA 2013, 110, 6328–6333. [Google Scholar] [CrossRef]
  58. Munson, S.M.; Benton, T.J.; Lauenroth, W.K. Soil carbon flux following pulse precipitation events in the shortgrass steppe. Ecol. Res. 2009, 25, 205–211. [Google Scholar] [CrossRef]
  59. Yuan, Z.Y.; Chen, H.Y.H. Fine Root Biomass, Production, Turnover Rates, and Nutrient Contents in Boreal Forest Ecosystems in Relation to Species, Climate, Fertility, and Stand Age: Literature Review and Meta-Analyses. Crit. Rev. Plant Sci. 2010, 29, 204–221. [Google Scholar] [CrossRef]
  60. Zhang, W. Studies on Main Factors that Influence Organic Carbon in Purple Paddy Soils. Master’s Thesis, Southwest University, El Paso, TX, USA, 2007. [Google Scholar]
  61. Sánchez-García, C.; Oliveira, B.R.F.; Keizer, J.J.; Doerr, S.H.; Urbanek, E. Water repellency reduces soil CO2 efflux upon rewetting. Sci. Total Environ. 2020, 708, 135014. [Google Scholar] [CrossRef]
  62. Song, K.; Lee, S.-H.; Mitsch, W.J.; Kang, H. Different responses of denitrification rates and denitrifying bacterial communities to hydrologic pulsing in created wetlands. Soil Biol. Biochem. 2010, 42, 1721–1727. [Google Scholar] [CrossRef]
  63. Mchergui, C.; Besaury, L.; Langlois, E.; Aubert, M.; Akpa-Vinceslas, M.; Buatois, B.; Quillet, L.; Bureau, F. A comparison of permanent and fluctuating flooding on microbial properties in an ex-situ estuarine riparian system. Appl. Soil Ecol. 2014, 78, 1–10. [Google Scholar] [CrossRef]
  64. Vourlitis, G.L.; Hentz, C.S.; Pinto, O.B.; Carneiro, E.; de Souza Nogueira, J. Soil N, P, and C dynamics of upland and seasonally flooded forests of the Brazilian Pantanal. Glob. Ecol. Conserv. 2017, 12, 227–240. [Google Scholar] [CrossRef]
  65. Reddy, K.R.; Patrick, W.H. Effect of alternate aerobic and anaerobic conditions on redox potential, organic matter decomposition and nitrogen loss in a flooded soil. Soil Biol. Biochem. 1975, 7, 87–94. [Google Scholar] [CrossRef]
  66. Tanner, C.C.; D’Eugenio, J.; McBride, G.B.; Sukias, J.P.S.; Thompson, K. Effect of water level fluctuation on nitrogen removal from constructed wetland mesocosms. Ecol. Eng. 1999, 12, 67–92. [Google Scholar] [CrossRef]
  67. Ye, C.; Cheng, X.; Zhang, Q. Recovery approach affects soil quality in the water level fluctuation zone of the Three Gorges Reservoir, China: Implications for revegetation. Environ. Sci. Pollut. Res. 2014, 21, 2018–2031. [Google Scholar] [CrossRef]
  68. Zhang, Y. Ecological Effects of Farmland Landscape Pattern on Aphid and Ladybug Populations. Ph.D. Dissertation, Hunan Agricultural University, Changsha, China, 2019. (In Chinese). [Google Scholar]
  69. Zhang, Y. Ecological Effects of Agricultural Landscape Patterns Onaphids and Ladybeetles. Ph.D. Thesis, Hunan Agricultural University, Changsha, China, 2019. [Google Scholar]
  70. Zhang, J.; Wang, L.; Liao, Y.; Tang, L.; Liu, Q. Effects of irrigation amount on soil enzyme activity, yield and nutrient utilization offacilities pepper. Southwest. J. Agric. Sci. 2023, 36, 1216–1221. [Google Scholar]
  71. Yao, Y.; Liu, X.; Zhu, H.; Tang, D. Effects of Vegetation Restoration Patterns on the Physical and Chemical Properties of Soil. Shaanxi For. Sci. Technol. 2020, 48, 74–79. [Google Scholar]
  72. Du, X.; Li, Y.B.; Liu, F.; Su, X.L.; Li, Q. Structure and ecological functions of soil micro-food web. Chin. J. Appl. Ecol. 2018, 29, 403–411. [Google Scholar]
  73. Hueso, S.; García, C.; Hernández, T. Severe drought conditions modify the microbial community structure, size and activity in amended and unamended soils. Soil Biol. Biochem. 2012, 50, 167–173. [Google Scholar] [CrossRef]
  74. Liu, C.; Holst, J.; Brüggemann, N.; Butterbach-Bahl, K.; Yao, Z.; Han, S.; Han, X.; Zheng, X. Effects of irrigation on nitrous oxide, methane and carbon dioxide fluxes in an Inner Mongolian steppe. Adv. Atmos. Sci. 2008, 25, 748–756. [Google Scholar] [CrossRef]
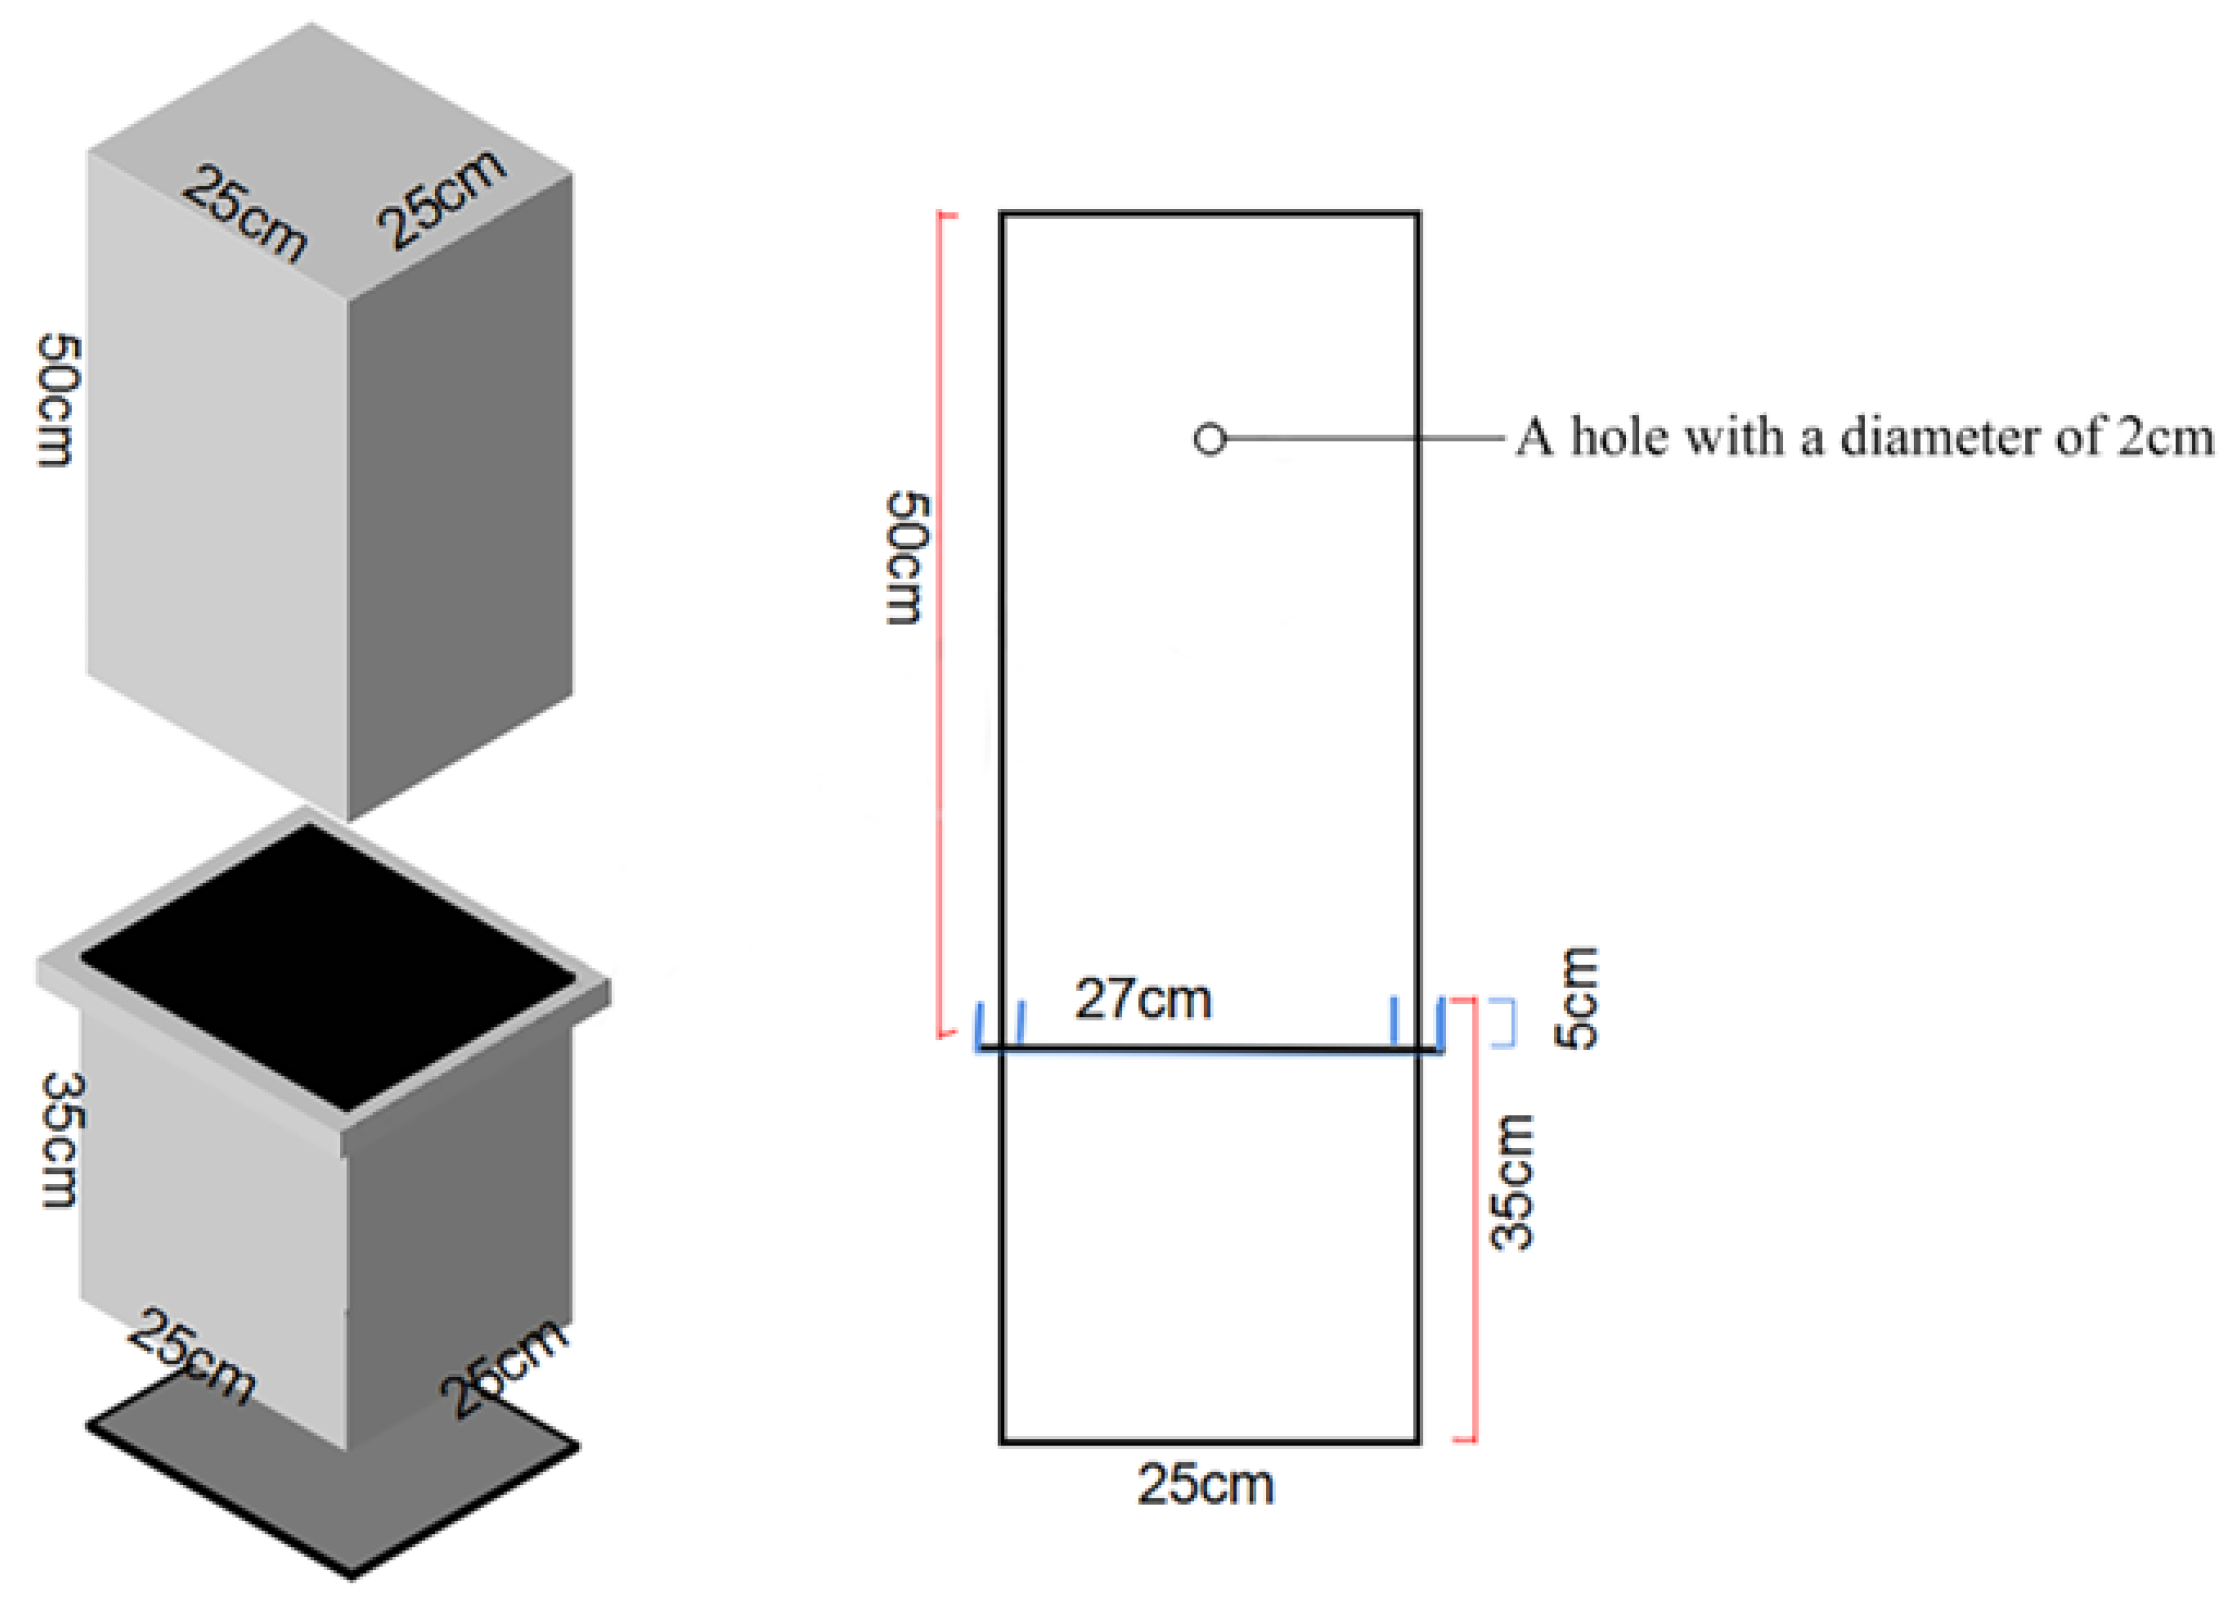
Figure 1. Schematic diagram of the sampling box and the soil rhizosphere solution sampler.
Agronomy 15 02461 g001
Figure 2. Variation trends of cumulative soil GHG emissions with precipitation time under different treatments. W1: conventional water content; W2: saturated water content; W3: supersaturated state.
Agronomy 15 02461 g002
Figure 3. Temporal variation in soil carbon components under different moisture treatments.
Agronomy 15 02461 g003
Figure 4. Temporal variation in soil nitrogen components under different moisture treatments.
Agronomy 15 02461 g004
Figure 5. Variation trend of soil enzyme activity with precipitation time under different precipitation conditions. Panels (ac) show β-glucosidase, β-N-acetylglucosaminidase, and hydrogen peroxidase, respectively. Bars represent means ± SD (n = 3), and legends are placed within each panel. Within each land-use type (forest and farmland analyzed separately), different lowercase letters above bars indicate significant differences among treatments (Tukey’s HSD, p < 0.05). W1 denotes the conventional water content, W2 the saturated water content, and W3 the supersaturated state.
Agronomy 15 02461 g005
Figure 6. Variation trend of soil recovery curves and soil stability under different precipitation conditions. W2: the saturated water content, and W3: the supersaturated state.
Agronomy 15 02461 g006
Figure 7. Heat map of correlation between soil functional stability and soil carbon, nitrogen, microorganisms, and soil functional indexes. Sb: stability of soil ecological function; CH4: cumulative methane emissions; CO2: cumulative emissions of carbon dioxide; N2O: cumulative carbon dioxide emissions; GWP: greenhouse gas warming potential; BG: β-glucosidase activity; NAG: N-acetylamino-β-glucosidase activity; H2O2: catalase activity; TIC: total inorganic carbon content; TC: total carbon content; TOC: total organic carbon content; NH4+–N: ammonium nitrogen content; NO3–N: nitrate nitrogen content.
Agronomy 15 02461 g007
Figure 8. Proposed conceptual model illustrating the effects of soil moisture and land-use type on soil properties and greenhouse gas emissions.
Agronomy 15 02461 g008
Table 1. Basic physicochemical properties of farmland and forest soils before the experiment.
PropertyFarmland SoilForest Soil
Soil textureSilt loamSilt loam
pH (1:2.5 H2O)7.8 ± 0.18.1 ± 0.1
EC (μS·cm−1)95.3 ± 8.668.4 ± 7.2
SOM (g kg−1)18.5 ± 1.512.2 ± 1.1
TN (g kg−1)1.2 ± 0.10.8 ± 0.1
NH4+–N (mg kg−1)5.8 ± 0.54.1 ± 0.4
NO3–N (mg kg−1)12.5 ± 1.37.3 ± 0.9
Available P (mg kg−1)25.6 ± 2.88.5 ± 1.2
Available K (mg kg−1)145.6 ± 12.498.7 ± 10.5
Bulk density (g cm−3)1.32 ± 0.051.45 ± 0.06
Field capacity (%, mass)24.5 ± 1.022.8 ± 1.2
Note: Data are presented as mean ± standard deviation (n = 9). EC, electrical conductivity; SOM, soil organic matter; TN, total nitrogen. Taxonomic classification (WRB 2022) [40]: Calcaric Cambisols.
Table 2. Changes in cumulative GHG emissions and global warming potential of soil under different treatments.
TreatmentCumulative CH4 Emissions
(kg·hm−2)
Cumulative CO2 Emissions
(kg·hm−2)
Cumulative N2O Emissions
(kg·hm−2)
GWP
(kg·hm−2)
farmland W10.019 ± 0.012 abA164.62 ± 20.09 aA79.43 ± 0.59 cA23,834.26 ± 197.12 cA
farmland W2−0.031 ± 0.016 abA93.82 ± 2.83 abA62.08 ± 2.99 bcA18,595.01 ± 895.04 bcA
farmland W3−0.007 ± 0.004 abA51.59 ± 0.75 cA79.92 ± 4.79 bcA23,866.57 ± 1428.78 bcA
forest W1−0.064 ± 0.020 bA113.72 ± 7.42 bA200.45 ± 22.21 abB59,848.45 ± 6626.46 abB
forest W2−0.046 ± 0.020 abA103.20 ± 8.34 bA227.94 ± 72.70 abB68,030.37 ± 21,672.80 aB
forest l W30.027 ± 0.050 aA88.1 ± 16.81 bA149.41 ± 47.17 abcB44,613.41 ± 14,072.66 abcB
Lower-case letters indicate differences between different precipitation treatments (p < 0.05); capital letters indicate the difference between different land-use types (p < 0.05).
Disclaimer/Publisher’s Note: The statements, opinions and data contained in all publications are solely those of the individual author(s) and contributor(s) and not of MDPI and/or the editor(s). MDPI and/or the editor(s) disclaim responsibility for any injury to people or property resulting from any ideas, methods, instructions or products referred to in the content.