Article

The Contrasting Ecological Effects of Farmland and Alfalfa Grassland Across Different Planting Scales in the North China Plain

1
Agro-Environmental Protection Institute, Ministry of Agriculture and Rural Affairs, Tianjin 300191, China
2
State Key Laboratory of Efficient Utilization of Arable Land in China, National Hulunber Grassland Ecosystem Observation and Research Station, Institute of Agricultural Resources and Regional Planning, Chinese Academy of Agricultural Sciences, Beijing 100081, China
3
Institute of Agricultural Resources and Environment, Hebei Academy of Agricultural and Forestry Sciences, Shijiazhuang 050051, China
*
Author to whom correspondence should be addressed.
Agronomy 2025, 15(10), 2432; https://doi.org/10.3390/agronomy15102432
Submission received: 10 August 2025 / Revised: 19 September 2025 / Accepted: 22 September 2025 / Published: 20 October 2025
(This article belongs to the Section Grassland and Pasture Science)

Abstract

Purpose: Comparing farmland and alfalfa grassland systems under different planting scales in influencing grain yield and environmental security is crucial to achieving sustainable food development. This study aims to evaluate the environmental impacts of farmland and alfalfa grassland systems under different planting scales in the North China Plain. Methods: The environmental impacts, including energy depletion, land utilization, water consumption, global warming, acidification, and eutrophication, were evaluated using robust regression and life cycle assessment (LCA) based on the functional unit of CNY 1000 of grain (crops and alfalfa) production. Robust regression was applied to improve the accuracy of the data, and the LCA method was effectively used to compare the environmental impacts under different planting scales. Results: The comprehensive environmental impact of alfalfa production was 9% lower than that of the crop system in the North China Plain. Compared to large-scale cultivation, smallholder farming resulted in 26%, 34%, and 22% higher environmental impact indicators for alfalfa, maize, and wheat, respectively. Conclusions: The experimental results demonstrate that the robust regression model achieves high prediction accuracy and generalization ability in estimating input–output quantity. The results can provide insights into the optimization of policy initiatives oriented towards the goal of resource-conserving, cost-effective, and environmentally friendly development to facilitate regional planning and sustainable development.

Graphical Abstract

1. Introduction

The production mode of a grassland system not only relates to food security, but also causes environmental problems that need to be paid close attention. In recent decades our agricultural environment has been suffering from the double pressures of exogenous pollution and endogenous pollution. Most agricultural and pratacultural paradigms in China have focused on increasing grain yield at the cost of significant nonrenewable resource consumption and environmental degradation [1], and it has become the constraint restricting the healthy development of agriculture. The excessive use of agricultural inputs such as fertilizers and pesticides, and the unreasonable disposal of agricultural wastes including livestock and poultry manure, crop straw, and farmland residue films has caused concerns in greenhouse gas emissions, acidification, and eutrophication [2,3]. It is of great practical significance to study the differences in environmental impact between representative grain crops and pasture production processes under different planting scales, clarifying the comparative advantage of grassland agriculture and exploring the environmental impact of agricultural structure reform in China.
Under the current circumstances food security is the top priority, and feed security is vital in China. Farmland and cultivated grassland are the most important agroecosystems, delivering ecosystem services ranging from feed supply for ruminants and soil carbon storage to habitats of biodiversity [4]. Studies have shown that alfalfa has a series of advantages over traditional crop production. As a suitable substitute for feed, alfalfa can provide the high protein and minerals required for animal growth: these aspects effectively improve feed quality and animal digestion characteristics [5]. In view of the ecological effects of alfalfa-cultivated grassland, Chen et al. [6] believed that different seeding types of alfalfa-cultivated grassland showed differences in biomass distribution patterns, and different planting methods also affected the accumulation and allocation of aboveground and underground biomass. Therefore, considering the food-economy comparative advantage of alfalfa, the most convenient and economical measure is to change the planting of wheat or maize to alfalfa. This can not only meet the demand of the food structure but also reduce the consumption of resources and environmental pollution in agricultural production. In addition, the North China Plain is one of the major grain producing areas in China [7], and its farmland area accounts for 18.6% of total farmland area in China [8]. Agricultural production is generally accompanied by the usage of large amounts of fertilizers and pesticides, and more than 60% of the farmland in the North China Plain contains the problem of excessive nitrogen fertilizer input [9]. Different scale production modes may lead to soil pollution and water resource consumption, agricultural planning and land management with manual intervention may improve soil structure and soil fertility and reduce reliance on chemical pesticides.
Assessing the environmental impacts of grain production under different operation scales between farmland and cultivated grassland systems is highlighted, besides technical applicability and innovation [10,11]. In the early stages of forecasting or judging crop yield and production consumption by detrending, linear regression correlation models, such as ordinary least squares (OLS) or weighted least squares (WLS), are usually adopted. Finger [12] believed that robust regression could replace traditional regression methods in data processing for relevant studies. The crop simulation model is an important tool for predicting crop growth and yield, and the linear regression method is generally used to establish and evaluate the model. Time-series prediction methods based on weighted average, including the exponential smoothing method and auto-regressive moving average (ARIMA) model [13], are suitable for data with autoregressive, differential, and moving average components or with trend and seasonality. Maimaitijiang et al. [14] proposed the application of multiple regression methods, including multiple linear regression (MLR), partial least squares regression (PLSR), artificial neural networks (ANNs), random forest regression (RFR) and support vector regression (SVR), and deep learning (DL) in crop yield prediction, as these are more able of capturing nonlinear relationships and complex patterns in data. There are limitations in dealing with nonlinear relationships and outliers in agriculture and animal husbandry, with large randomness in the traditional linear regression method. Therefore, it is necessary to combine the bias statistics to improve the reliability of the evaluation model, especially the assumptions of data normality and homoscedasticity.
Life cycle assessment (LCA) is a methodology for assessing the environmental impacts [15] related to a product, process, or activity by identifying and quantifying all resources consumed and emissions during raw material extraction and transportation, chemical production and transportation, and arable farming in the field [16,17]. In agriculture and grassland systems, LCA is focused on cropping systems of energy plant [18,19] bio-energy made from agricultural and grassland materials [19,20]. Using the LCA and considering the resources required to produce 1 ton of yield [21] provides policy-relevant information about the environmental effects of farmland and cultivated grassland systems among different operation scales [22,23]. Resource consumption and environmental emissions are an example of a multi-functional system in LCA, fulfilling more than one function [24], providing both the function of resource management and the function of environmental production. Na et al. [25] showed that improving the efficiency of agricultural operations can significantly reduce pesticide inputs and lower production costs, particularly for small-scale farms and cooperative participants. These efficiency-enhancing practices are key to promoting sustainable agricultural production and environmental benefits. Gao et al. [26] studied interventions throughout the life cycle of fertilizers and found that about two-thirds of fertilizer emissions occurred in farmland and increasing nitrogen use efficiency was the most effective strategy for reducing emissions. As such, they suggested that this strategy should be combined with related studies such as decarbonizing fertilizer production.
In this study, farmers and enterprises were selected as the specific research objects of wheat, maize, and alfalfa, and the potential environmental impacts of farmland and cultivated grassland systems in the North China Plain were evaluated using LCA. Unlike previous studies focusing on single crops or regional assessments, this study integrates robust regression and economic value-based comparisons to quantify environmental impacts across different crops and alfalfa systems at varying scales. The objectives of this study are as follows: (1) to comprehensively and quantitatively evaluate the resource consumption and environmental burden generated in the whole life cycle of crops and alfalfa grassland systems with different planting scales in the North China Plain; (2) to elucidate the major environmental impacts of crop systems and alfalfa production in the North China Plain; (3) to present a discussion about options to improve farmland and cultivated grassland systems. This study provides a scientific basis for promoting the sustainable development of agricultural production and has a positive impact on global food security.

2. Materials and Methods

2.1. Study Area and Data Collection

2.1.1. Study Area

The North China Plain is considered one of most significant agricultural and livestock-intensive regions, with wheat, corn, and forage grass as the dominant crops which represents the production situation of crops and alfalfa in China. The study area (33°00′–40°77′ N, 112°53′–120° E) is located within the large alluvial plain of northern China (Figure 1), which is one of the most densely populated areas in the world. The research sites are mainly located in Hebei Province, including Shijiazhuang (38°05′ N, 114°52′ E), Tangshan (39°64′ N, 118°19′ E), Xingtai (37°08′ N, 114°51′ E), Baoding (38°88′ N, 115°47′ E), Handan (36°63′ N, 114°55′ E), Zhangjiakou (40°77′ N, 114°89′ E), Cangzhou (38°31′ N, 116°85′ E); Shandong Province including Binzhou (37°39′ N, 117°98′ E), Liaocheng (36°46′ N, 115°99′ E), Wenshang (35°73′ N, 116°50′ E), Dongying (37°44′ N, 118°68′ E); Henan Province including Zhengzhou (34°75′ N, 113°63′ E), Nanyang (33°00′ N, 112°53′ E), Luoyang (34°62′ N, 112°46′ E), Shangqiu (34°42′ N, 115°66′ E), and Xinxiang (35°22′ N,·113°54′ E). The North China Plain has a temperate monsoon climate and a subtropical monsoon climate, with obvious changes in the four seasons, a cold and dry winter, and two crops a year in most areas. It is characterized by a temperate monsoon climate and a subtropical monsoon climate, with mean annual temperature ranges from 11 °C to 15 °C and mean precipitation ranges from 500 mm to 900 mm, which meet the needs of two crops a year in most areas.
In this study, enterprise-scale (large-scale) operations are defined as intensive agricultural systems characterized by concentrated management, larger production areas, higher standardization, and greater market integration, often functioning as contracted farming units or agribusiness entities integrating production, processing, and marketing (“production–processing–sales integration”). According to regional agricultural statistics, the size of enterprise farms for grain crops usually range from 1000 to 8000 mu (≈67–535 ha), while alfalfa is commonly cultivated on 3000~10,000 mu (≈200–670 ha). These ranges reflect the thresholds for intensive and technology-driven agricultural operations in the North China Plain. In contrast, smallholder farming refers to household-based agricultural production at a relatively modest scale, with non-standardized practices and limited access to modern technologies and markets. Representative smallholder farmers selected in this study cultivate no more than 1000 mu (≈67 ha) of wheat and maize or 3000 mu (≈200 ha) of alfalfa, reflecting typical production boundaries in the North China Plain.

2.1.2. Data Collection and Processing

Interviews with farmers and enterprises were conducted across 16 locations in the North China Plain (Figure 1) to collect agricultural input and output data (Table 1) for typical crops and alfalfa production during 2019 to 2023. Since alfalfa is perennial and can be planted for more than 8 years, the average data of field turning, base fertilizer, agricultural film and yield can be surmised during field investigations of the production cycle. It is important to note that this is a retrospective study based on observational field data, not a controlled experiment. Respondents (smallholders and enterprises) were selected based on official records, their production scale (conforming to the definitions above), and for being representative of primary producers of the target crops in the region. The initial raw dataset comprised 315 records obtained from official records and face-to-face questionnaires. After preliminary screening, which excluded records due to abnormal values, missing items, and inconsistent planting times, 246 valid questionnaires remained for analysis. Among them, 37 smallholders and 24 enterprise farms produced; 63 smallholders and 22 enterprise farms produced wheat; and 82 smallholders and 18 enterprise farms produced maize.
In this study a substantial amount of field farm information was collected in the form of raw data, and detailed records of various aspects of crop production were required when the relevant questionnaires were completed. This included surveyed units (individuals or companies), crop types (wheat, maize, alfalfa), area (unit: mu), and hay yield (total for the year and per rotation, unit: kg·mu−1), as well as types and application amounts (unit: kg·mu−1) of fertilizers, pesticides, and insecticides used during different seasons or growth periods. The energy consumption (unit: CNY·mu−1) of farm machinery and the consumption of irrigation water resources (unit: CNY·mu−1) were also recorded. The economic value is referenced from the China Statistical Yearbook 2024 and the Compilation of National Agricultural Product Cost and Benefit Data 2024.
In this process we emphasize considering the production, transportation, application, and potential disposal of different agricultural inputs to comprehensively understand their environmental impacts. Furthermore, we integrate on-site surveys and relevant database information to obtain accurate and trustworthy data to ensure the reliability of the inventory analysis results. In our study, the amount of fossil energy used in direct forms (e.g., diesel) was were calculated from the consumption of primary energy factors in China [17], while indirect forms (e.g., fertilizers, pesticides) were inferred from local experts and farmer interviews. Specifically, it covers nitrogen fertilizer (calculated as urea and based on nitrogen content), phosphorus fertilizer (including diammonium phosphate, calcium superphosphate, and ammonium dihydrogen phosphate, calculated as P2O5), potassium fertilizer (including potassium chloride, potassium sulfate, and Lobato potassium, calculated as K2O), organic fertilizer, and compound fertilizer, with each contributing one-third of nitrogen, phosphorus, and potassium. It is worth noting that this study does not include trace elements (such as manganese, iron, zinc, boron, copper, and molybdenum) and water-soluble silicon fertilizer used.

2.2. Robust Regression

Robust M-estimation regression is insensitive to the influence of outliers and can better adapts to the heterogeneity and randomness of the data. The M-estimation method uses the Huber ρ function and has moderate efficiency and a lower breakdown point (about 15%) compared to MM-estimators, meaning that even with half the observed outliers in the data it can still give a reasonable estimate. In the case of large samples, the model parameters can be estimated with high efficiency. The iterative method in robust regression is implemented by the internal reweighted least squares (IRWLS) algorithm, which approximates the optimal solution by iteratively optimizing the Huber loss function. Each iteration reweighs the sample based on the current estimate and updates the parameter estimates until they converge.
The goal of robust regression is to minimize a Huber loss function to obtain an estimate of the regression coefficient. The objective function is expressed as follows:
β ^ M = a r g m i n β i = 1 n ρ y i X i β
where β ^ M is the dependent variable, X is the independent matrix, and β is the regression coefficient vector. In this objective function, ρ is the Huber loss function, namely the Huber function.
The regression coefficient β ^ M obtained by the Huber function shows strong robustness through minimizing the objective function, which can effectively reduce the influence of outliers on the estimation results. The Huber ρ function is defined as follows:
ρ ( u ) = 1 2 u 2                                 i f   | u | k k ( | u | 1 2 k )         i f   | u | > k
where k is a parameter, usually with a value of 1.345, which controls the smooth transition of the loss function between the linear and quadratic parts.
To further validate the robustness of the regression results, we conducted diagnostic checks focusing on observation weights and residual patterns. The weight distribution confirmed that the robust fitting procedure effectively down-weighted a small number of extreme observations, while the majority of data points retained full weights close to 1. This indicates that the model relied primarily on the bulk of the data rather than being unduly influenced by outliers. The residual–fitted value analysis showed no systematic patterns, suggesting that the robust regression successfully captured the main yield–factor relationships without leaving a strong structure in the residuals. Together, these diagnostics provide confidence in the fact that the robust regression model yields reliable and stable predictions, which serve as the basis for linking yield estimation with the LCA.

2.3. Life Cycle Assessment (LCA)

Life cycle assessment (LCA) is a method to analyze the environmental performance of products, for instance via product comparisons [27,28]. Agricultural LCA is defined as the relationship between the input and output of all substances and energy associated with agricultural production activities and the measurable environmental load, and it evaluates the resource consumption, energy consumption, and the comprehensive impact on the environment of agricultural production activities [29,30]. Agricultural LCA is accomplished in four phases to ISO compliance: (i) goal and scope definition; (ii) life cycle inventory analysis; (iii) life cycle impact assessment; (iv) life cycle interpretation. The study was carried out according to the International Organization for Standardization (ISO 14040) and the Society for Environmental Toxicology and Chemistry (SETAC) guidelines [31,32].

2.3.1. Goal and Scope Definition

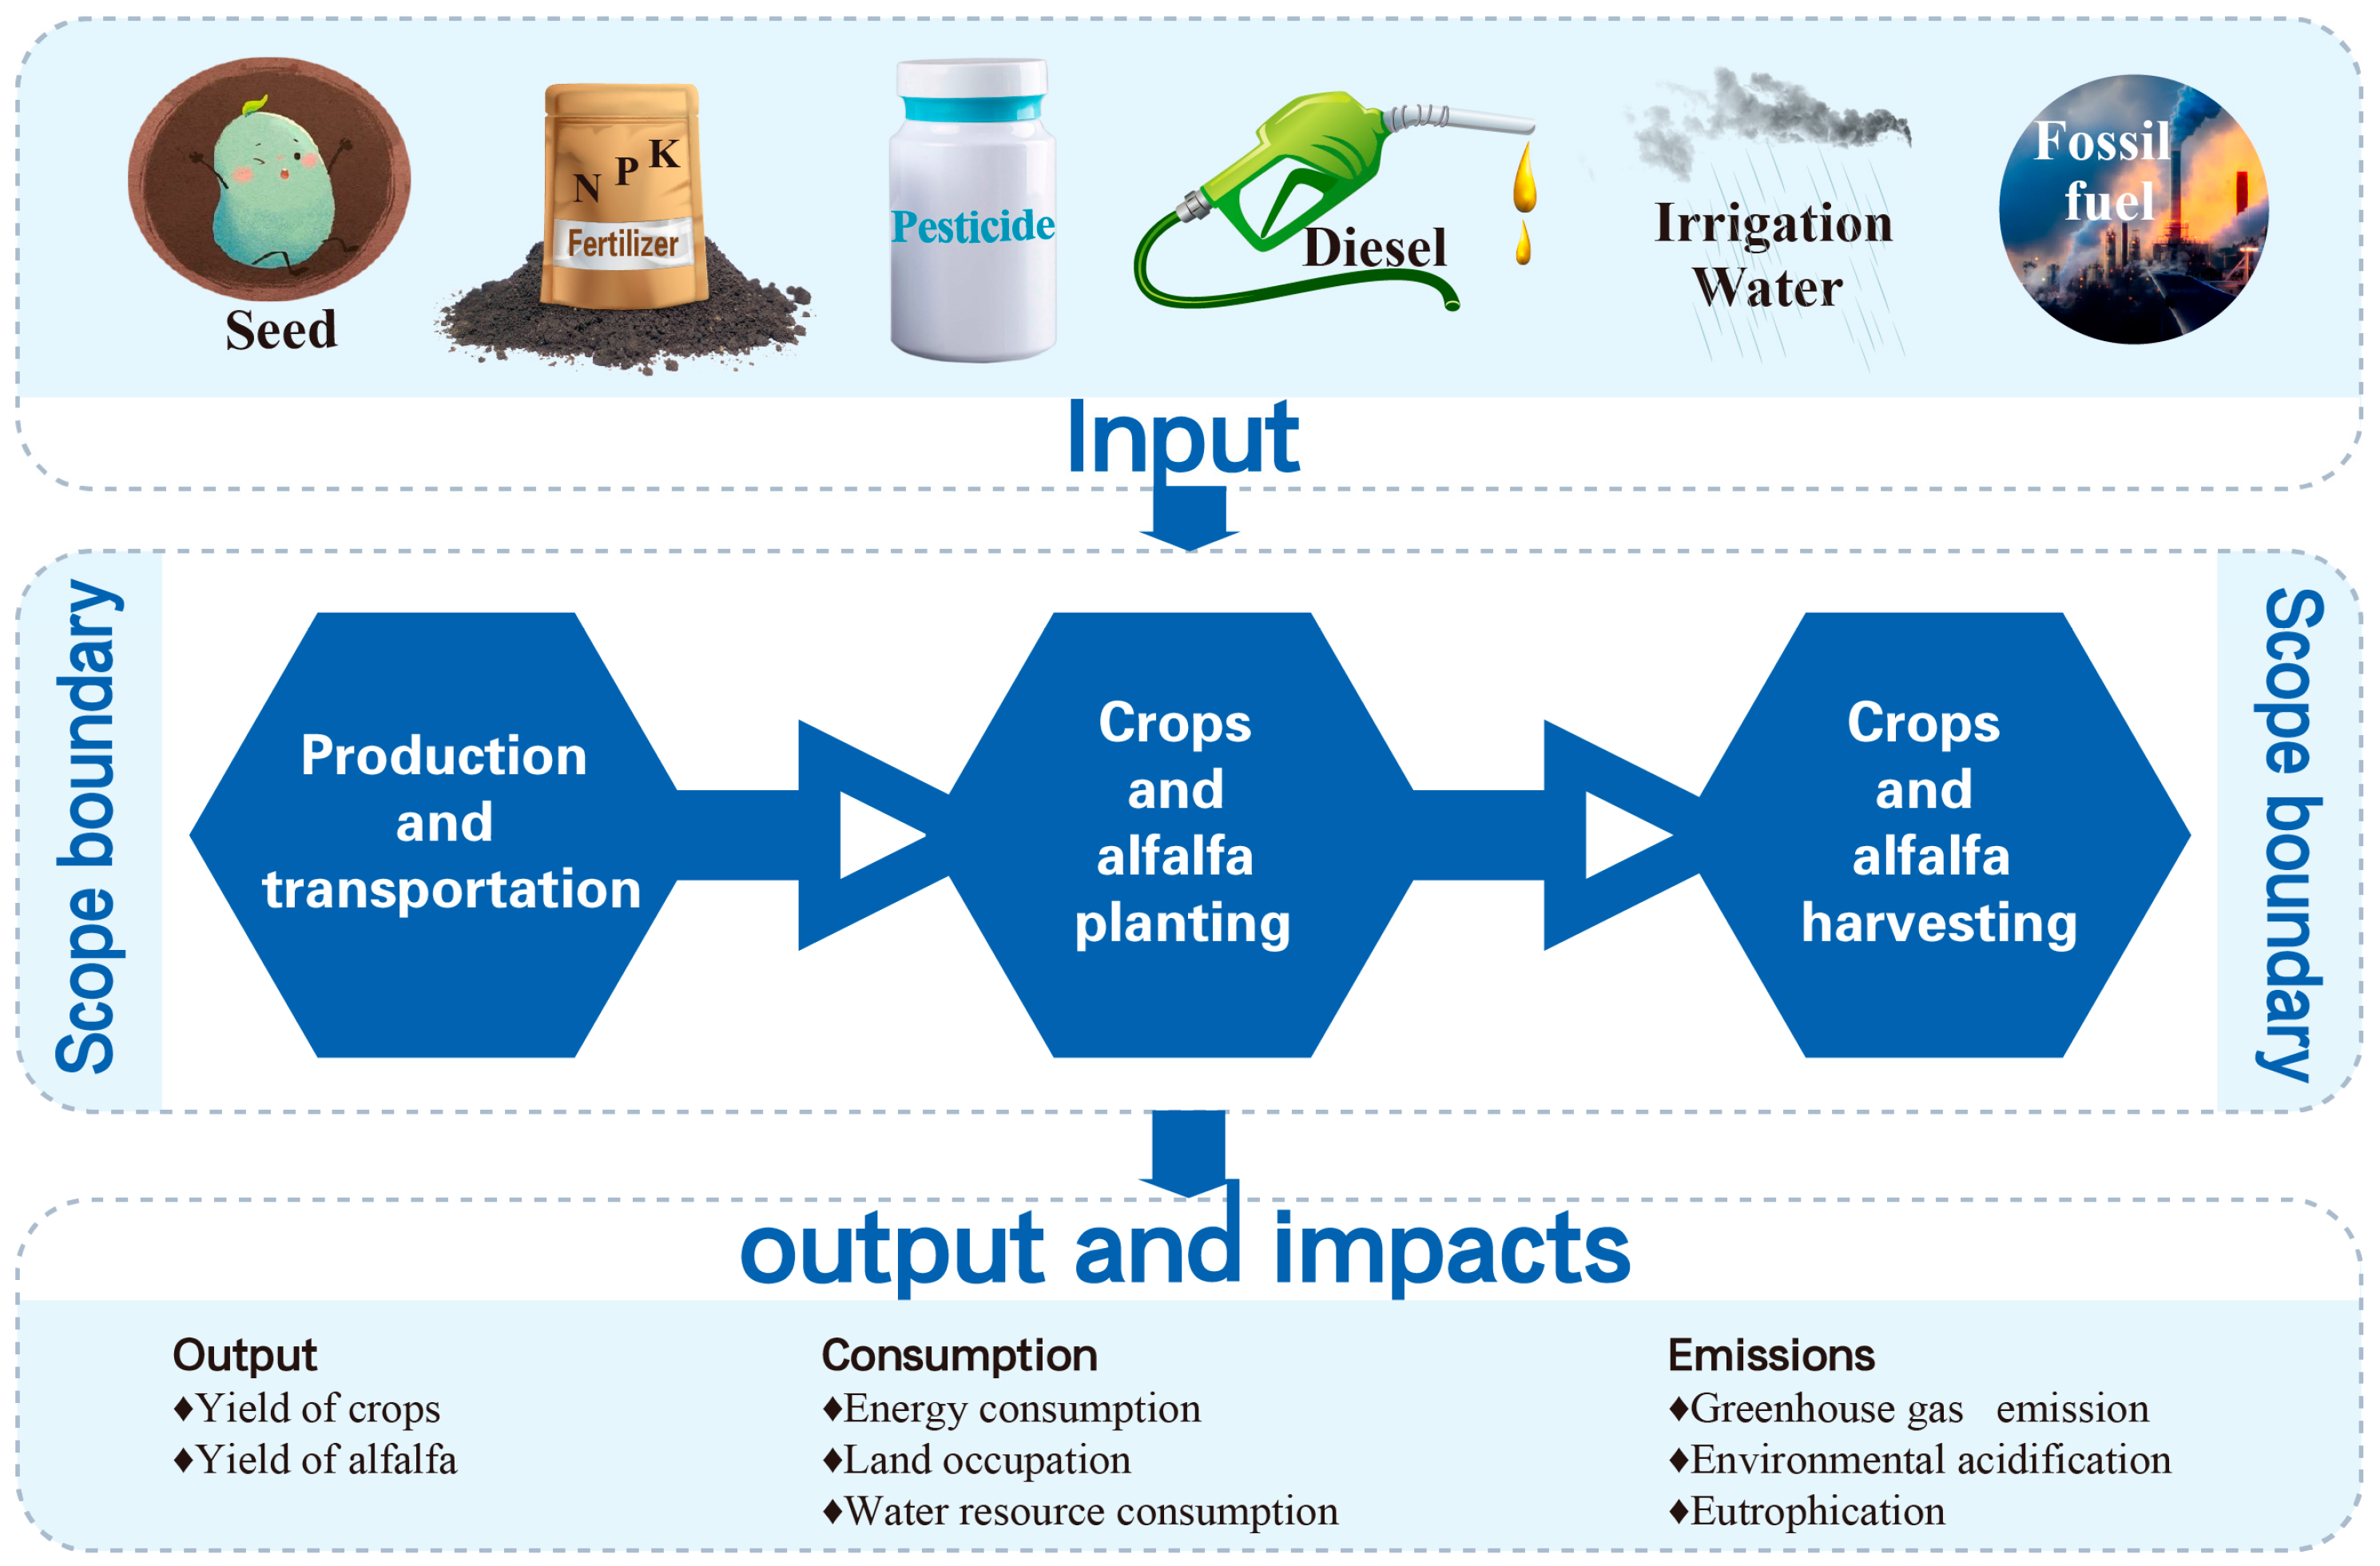
The goal and scope definition of an LCA provides a description of the product system in terms of the system boundaries and a functional unit. The system boundary for the LCA was from cradle to farm gate and included the following two main subsystems: the agricultural materials stage (MS), including raw materials exploration, processing and transportation of fossil fuels, farming-inputs production, packaging and transportation of seeds, fertilizers, and pesticides, and the arable farming stage; and (FS), including fertilizer application, pesticides application, and machinery (tillage, sowing, irrigation, harvesting) (Figure 2). Co-products such as straw were excluded from the system boundary, as the functional unit was based on the economic value of the primary products and the inclusion of co-products would introduce allocation uncertainties without contributing to the study’s goal.

2.3.2. Inventory Analysis

The agricultural inputs directly impact the resource consumption and waste emissions of the agricultural production system, making them a crucial factor for conducting inventory analysis. In this study, the functional unit (FU) used to analyze the environmental impact of the production of CNY 1000 of grains, including both crops and alfalfa, is based on the economic value of natural food production in farmland. Specifically, the standard unit represents the economic value of the annual natural food yield of 1 ha of farmland. The data of irrigation water consumption came from surveys conducted among farmers and herdsmen. The average input quantities of fertilizer, pesticide, and other materials were calculated according to the production cycle of field investigation, given that alfalfa is a perennial forage crop. For energy analysis and evaluating the potential environmental impact, including emissions such as CO, NOx, SO2, CH4, N2O, and CO2. All impacts were quantitated in a functional unit and summarized into environmental effects or aggregated into a comprehensive environmental index. The resource inputs and outputs for producing CNY 1000 of crops and hay alfalfa are shown in Table 2.

2.3.3. Life Cycle Impact Assessment

The life cycle impact assessment (LCIA) was sought to evaluate the amount and effect of the potential environmental impacts of a product system [30] to further interpret the LCI data. Characterization, normalization, and weighting are used in the assessment [33]. Demand for energy resources was determined according to Rebitzer et al. [16]. The impact categories include: energy depletion (ED); land utilization (LU) and water consumption (WD), which were based on the methodology developed by Wang et al. [17]; global warming (GW), which was computed according to the CO2 equivalent factors from the Intergovernmental Panel on Climate Change (IPCC, 2001) (CO2: 1, N2O: 310, CH4: 21, and CO: 2) [34]; and acidification (AC), namely the impact of acidifying substances released into ecosystems including ammonia and NOX. To calculate AC of the different trace gases, we used SO2 equivalent factors (SO2: 1, NOx: 0.7, and NH3: 1.89). In addition, we considered eutrophication (EP), namely the impacts of the losses of N and P to aquatic and terrestrial ecosystems [30]. We used PO4 equivalent factors (NOx: 0.1, NO3-N: 0.42, and NH3: 0.35) for calculating the EP. All these impact categories can affect ecosystem quality, human health, climate change, and resources as damage categories. In this study, the world per capita environmental impact potentials in 1995 were used to normalize the environmental impacts (Table 3) [35] and to calculate the environmental indices of the wheat–maize and pasture production systems under different planting scales. In our study, an expert panel was used for weight determination.
For energy analysis and to evaluate the potential environmental impact, the EP was calculated as follows:
E P j = E P j i = [ Q i × E F j i ]
where EP(j) refers to the potential impact on jth environment; EP(j)i refers to the potential impact of the i stress factor on the j environment; Qi refers to the emission of the i stress factor; and EF(j)i refers to the equivalent coefficient of the i stress factor on the j potential environmental impacts.

3. Results

3.1. Predicted Yield Values from Robust Regression

During the data processing phase, the agricultural product yields of different scales into the value per hectare of land under unit value terms were converted. Nitrogen, phosphorus, potassium, and precipitation were selected as independent variables, and then a logarithmic transformation (log (x + 1)) was applied to reduce the impact of skewed distributions on the model. Then, the transformed data were standardized through subtracting the mean and dividing by the standard deviation for each variable, thereby eliminating differences in scale between the variables, making them suitable for regression analysis.
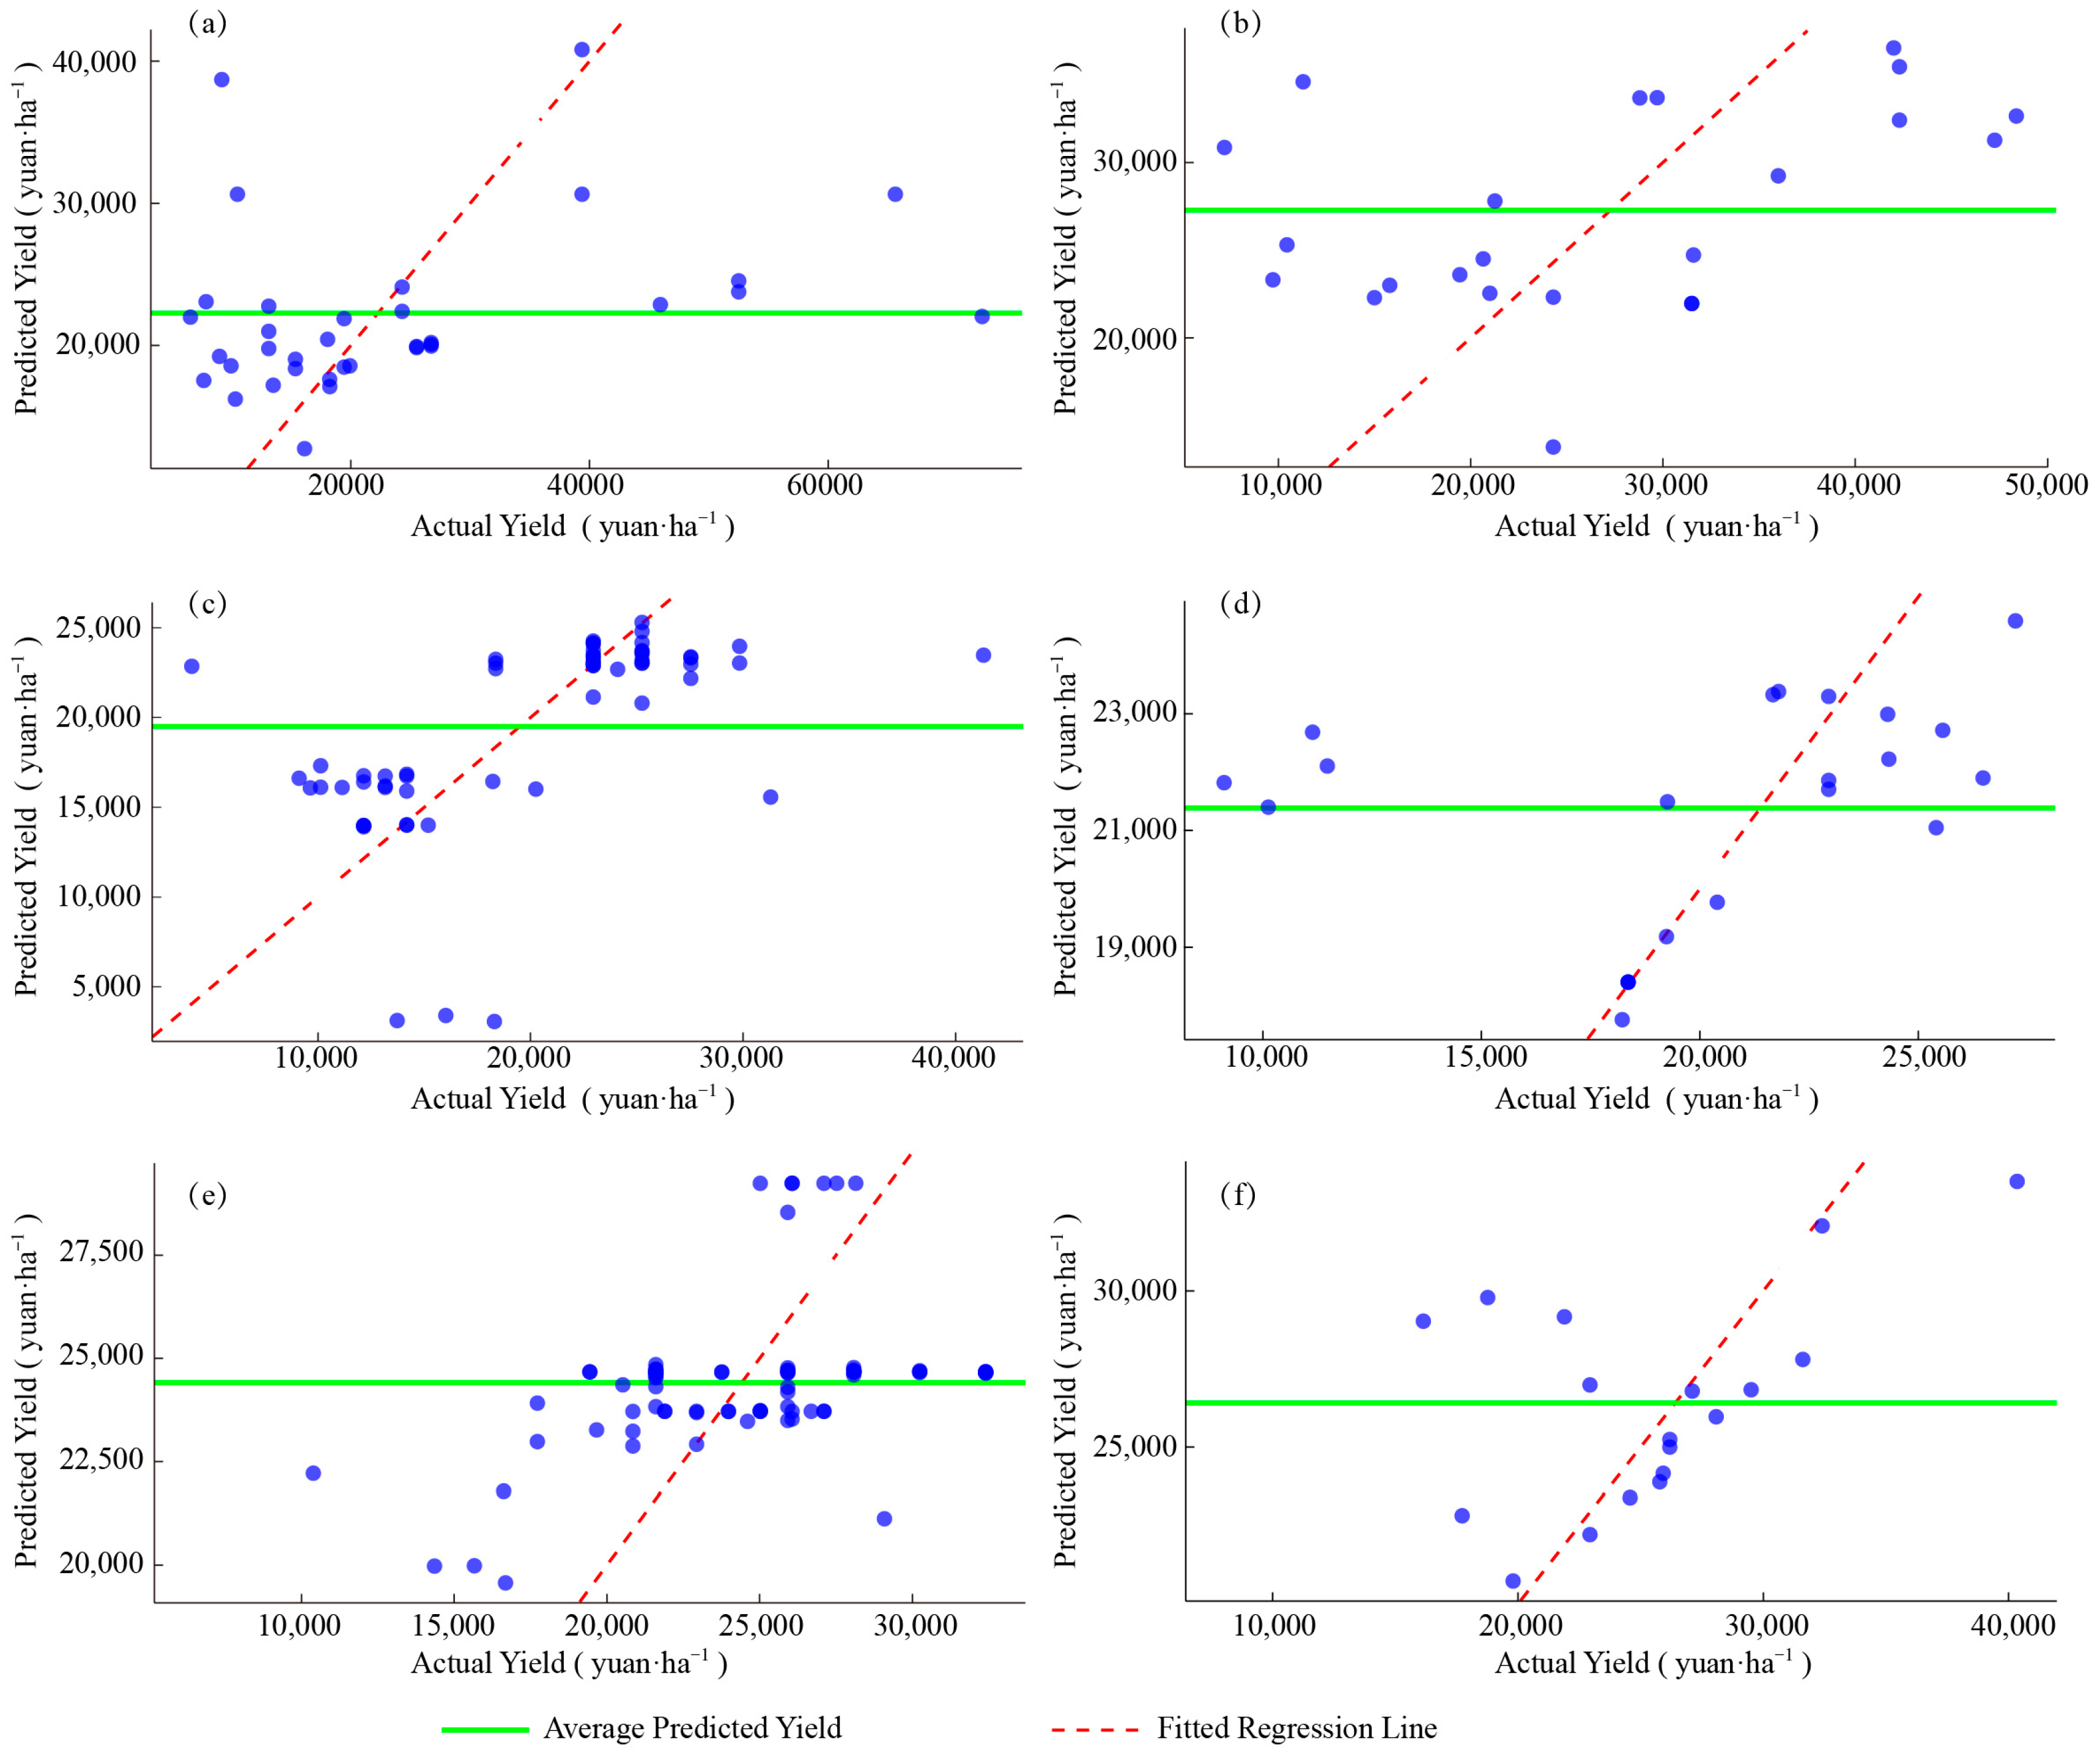
To construct the regression model we initially fitted a robust regression model, calculated the residuals, and identified and removed extreme outliers by setting a threshold of three times the standard deviation of the residuals. After excluding these outliers, we obtained a new dataset without extreme values in order to perform robust regression again on the processed data to obtain the predicted values. After performing the robust regression, the average predicted values were obtained. The average yields of wheat, maize, and alfalfa for smallholder farmers were 19,497 CNY·ha−1, 24,407 CNY·ha−1, and 22,267 CNY·ha−1, respectively (Figure 3a,c,e). For enterprises, the corresponding values were 21,385 CNY·ha−1, 26,412 CNY·ha−1, and 27,281 CNY·ha−1 (Figure 3b,d,f).

3.2. Resource Consumption

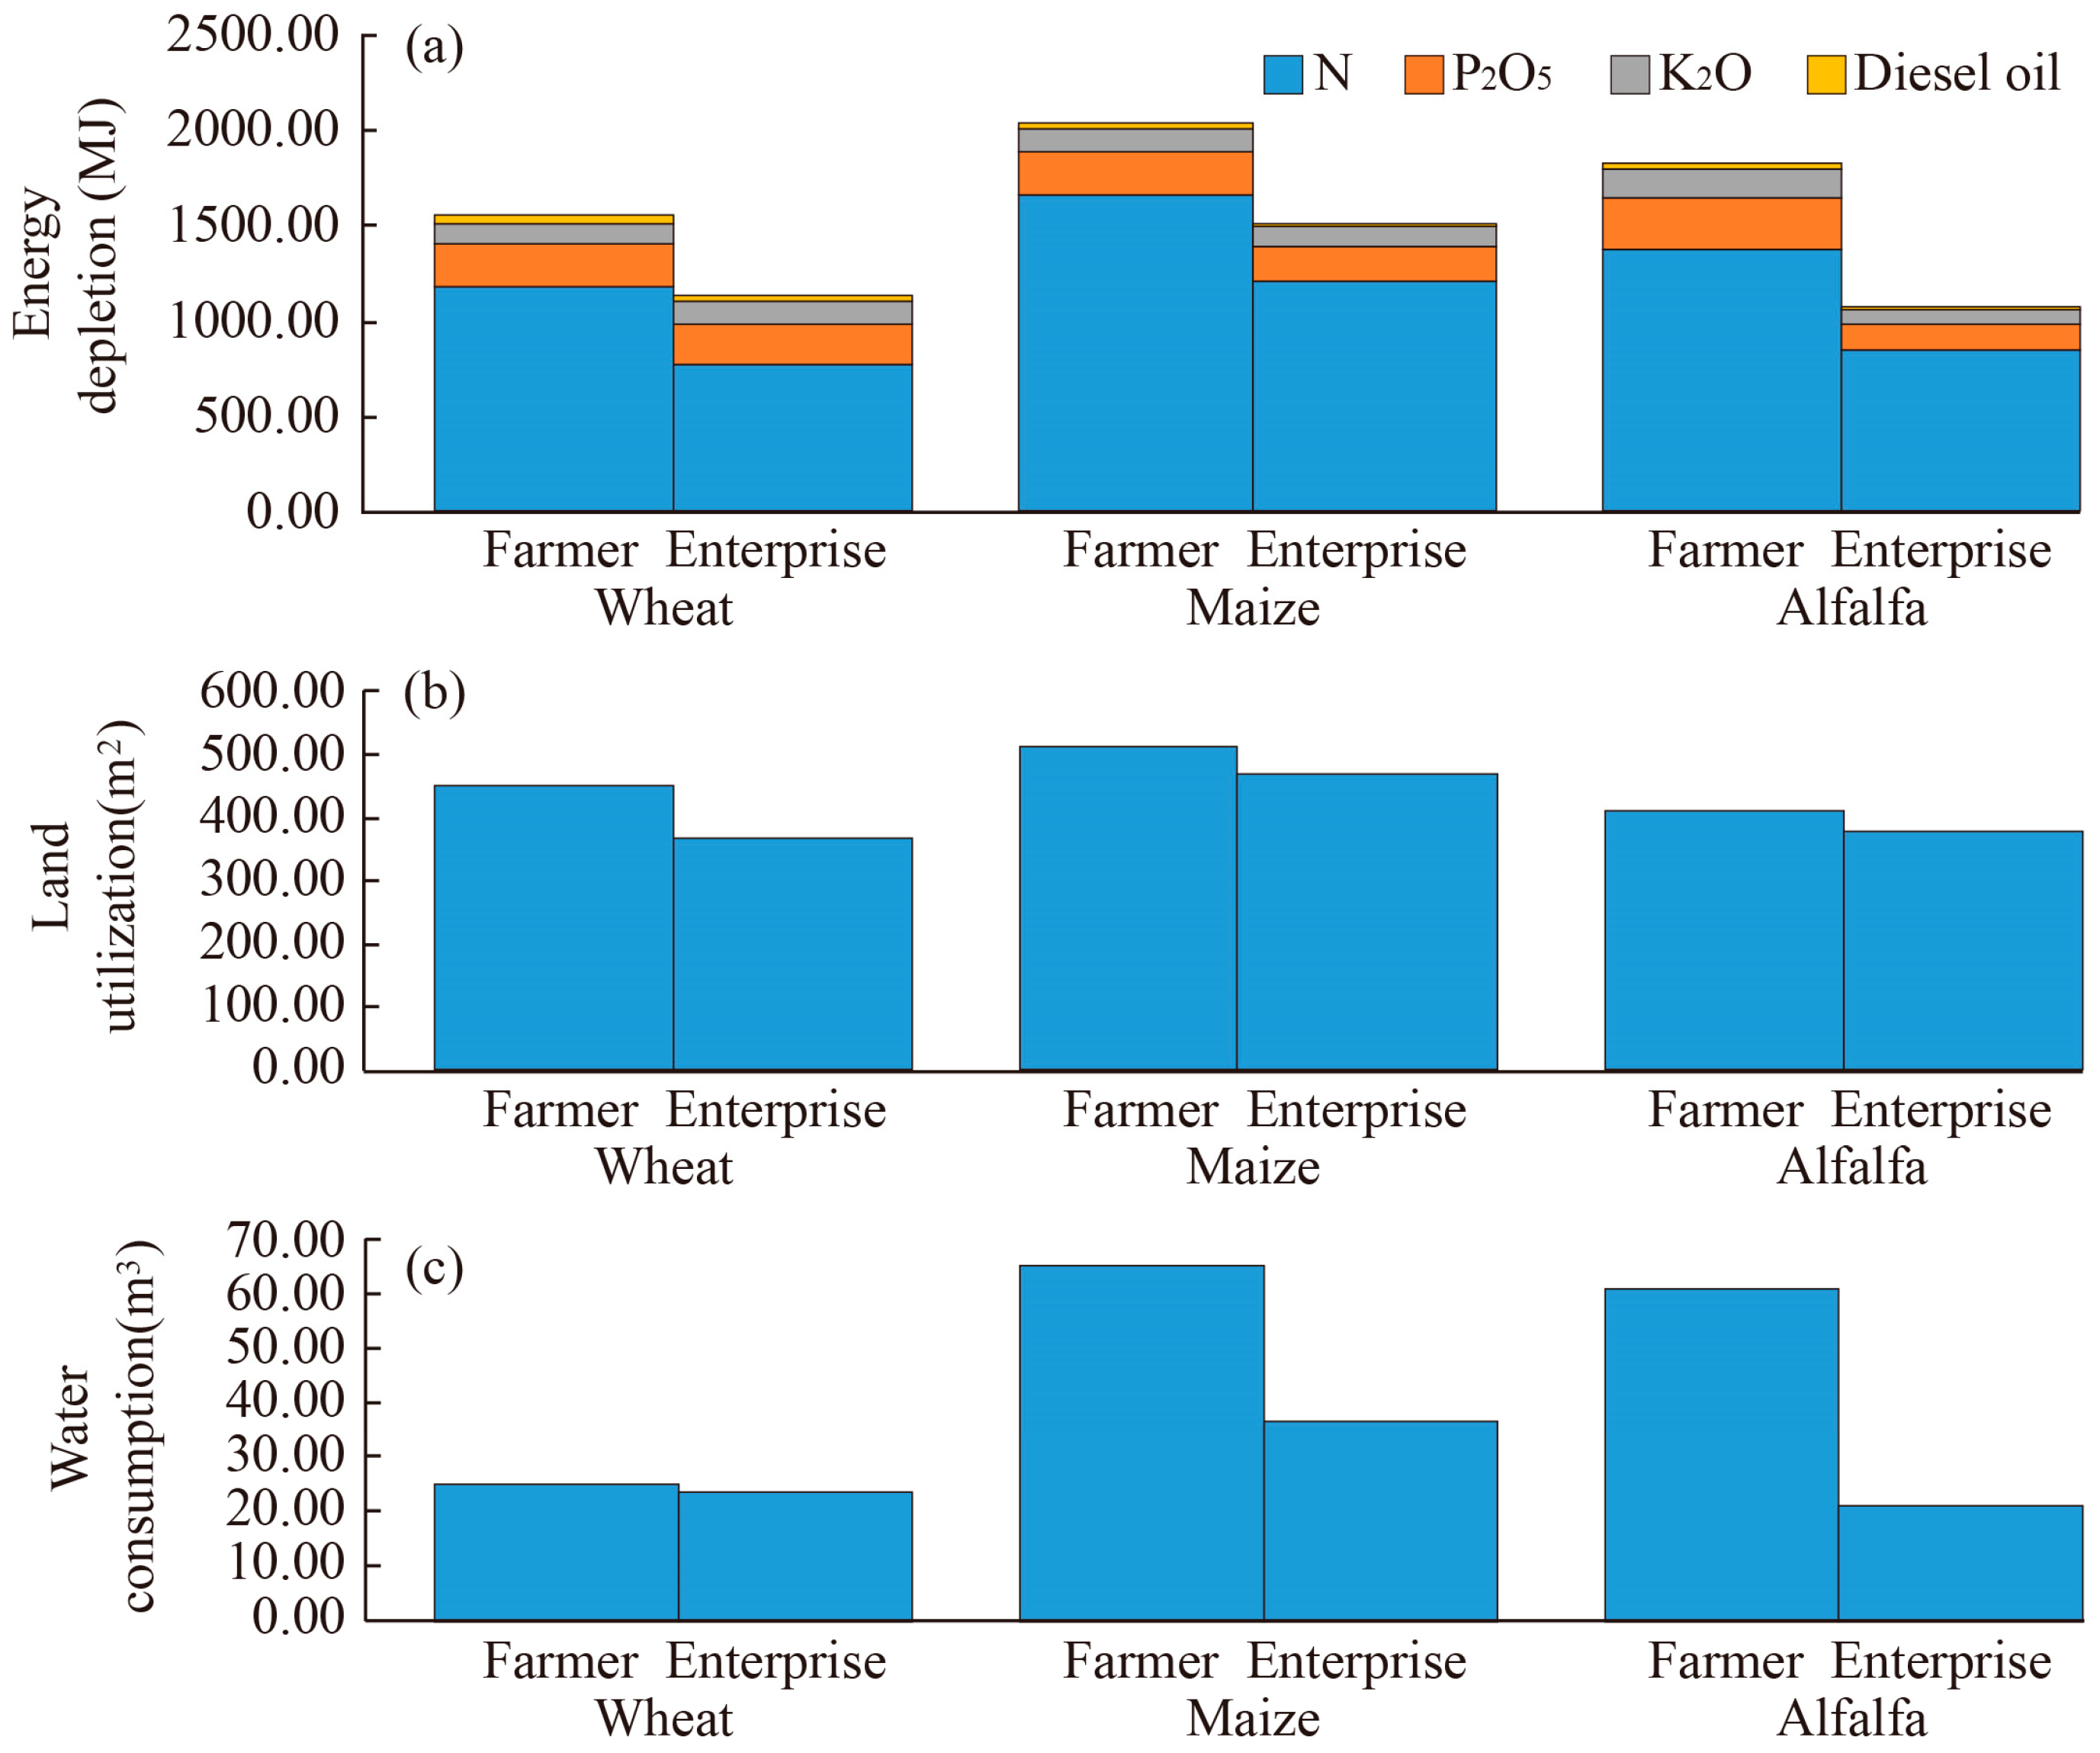
The energy depletion in the process of crop production and alfalfa production was closely related to producing N, P2O5, K2O, and diesel, which mainly occurred in the stage of raw material mining and agricultural materials production. Shown as Figure 4a, energy depletion of farmers producing CNY 1000 of wheat, maize, and alfalfa was 2037.93, 1833.93, and 1552.71 MJ, respectively, while that of enterprises producing CNY 1000 of wheat, maize, and alfalfa was 1517.22, 1083.15, and 1135.91 MJ, respectively. The energy depletion of enterprises was 33% (wheat, maize) and 27% (alfalfa) lower than that of farmers.
The land occupation area of different planting scales showed certain differences (Figure 4b). The land use area of farmers producing CNY 1000 wheat, maize, and alfalfa was 512.90, 409.72, and 449.10 m2, respectively, and that of enterprises was 467.62, 378.62, and 366.56 m2. Enterprises used 8% less land to produce wheat and maize and 18% less land to produce alfalfa, which demonstrated higher land use efficiency than farmers.
The water consumption of enterprises producing CNY 1000 of wheat and maize was 36.41 and 20.95 m3, which was 28.51 and 39.90 m3 more than that of farmers, respectively (Figure 4c). Enterprises contained sufficient water sources and complete irrigation facilities for crop irrigation, while only a small number of farmers irrigated due to the generally high irrigation cost. The water consumption of enterprises and farmers producing CNY 1000 of alfalfa was similar, 23.40 and 24.98 m3, respectively.

3.3. Environmental Emissions

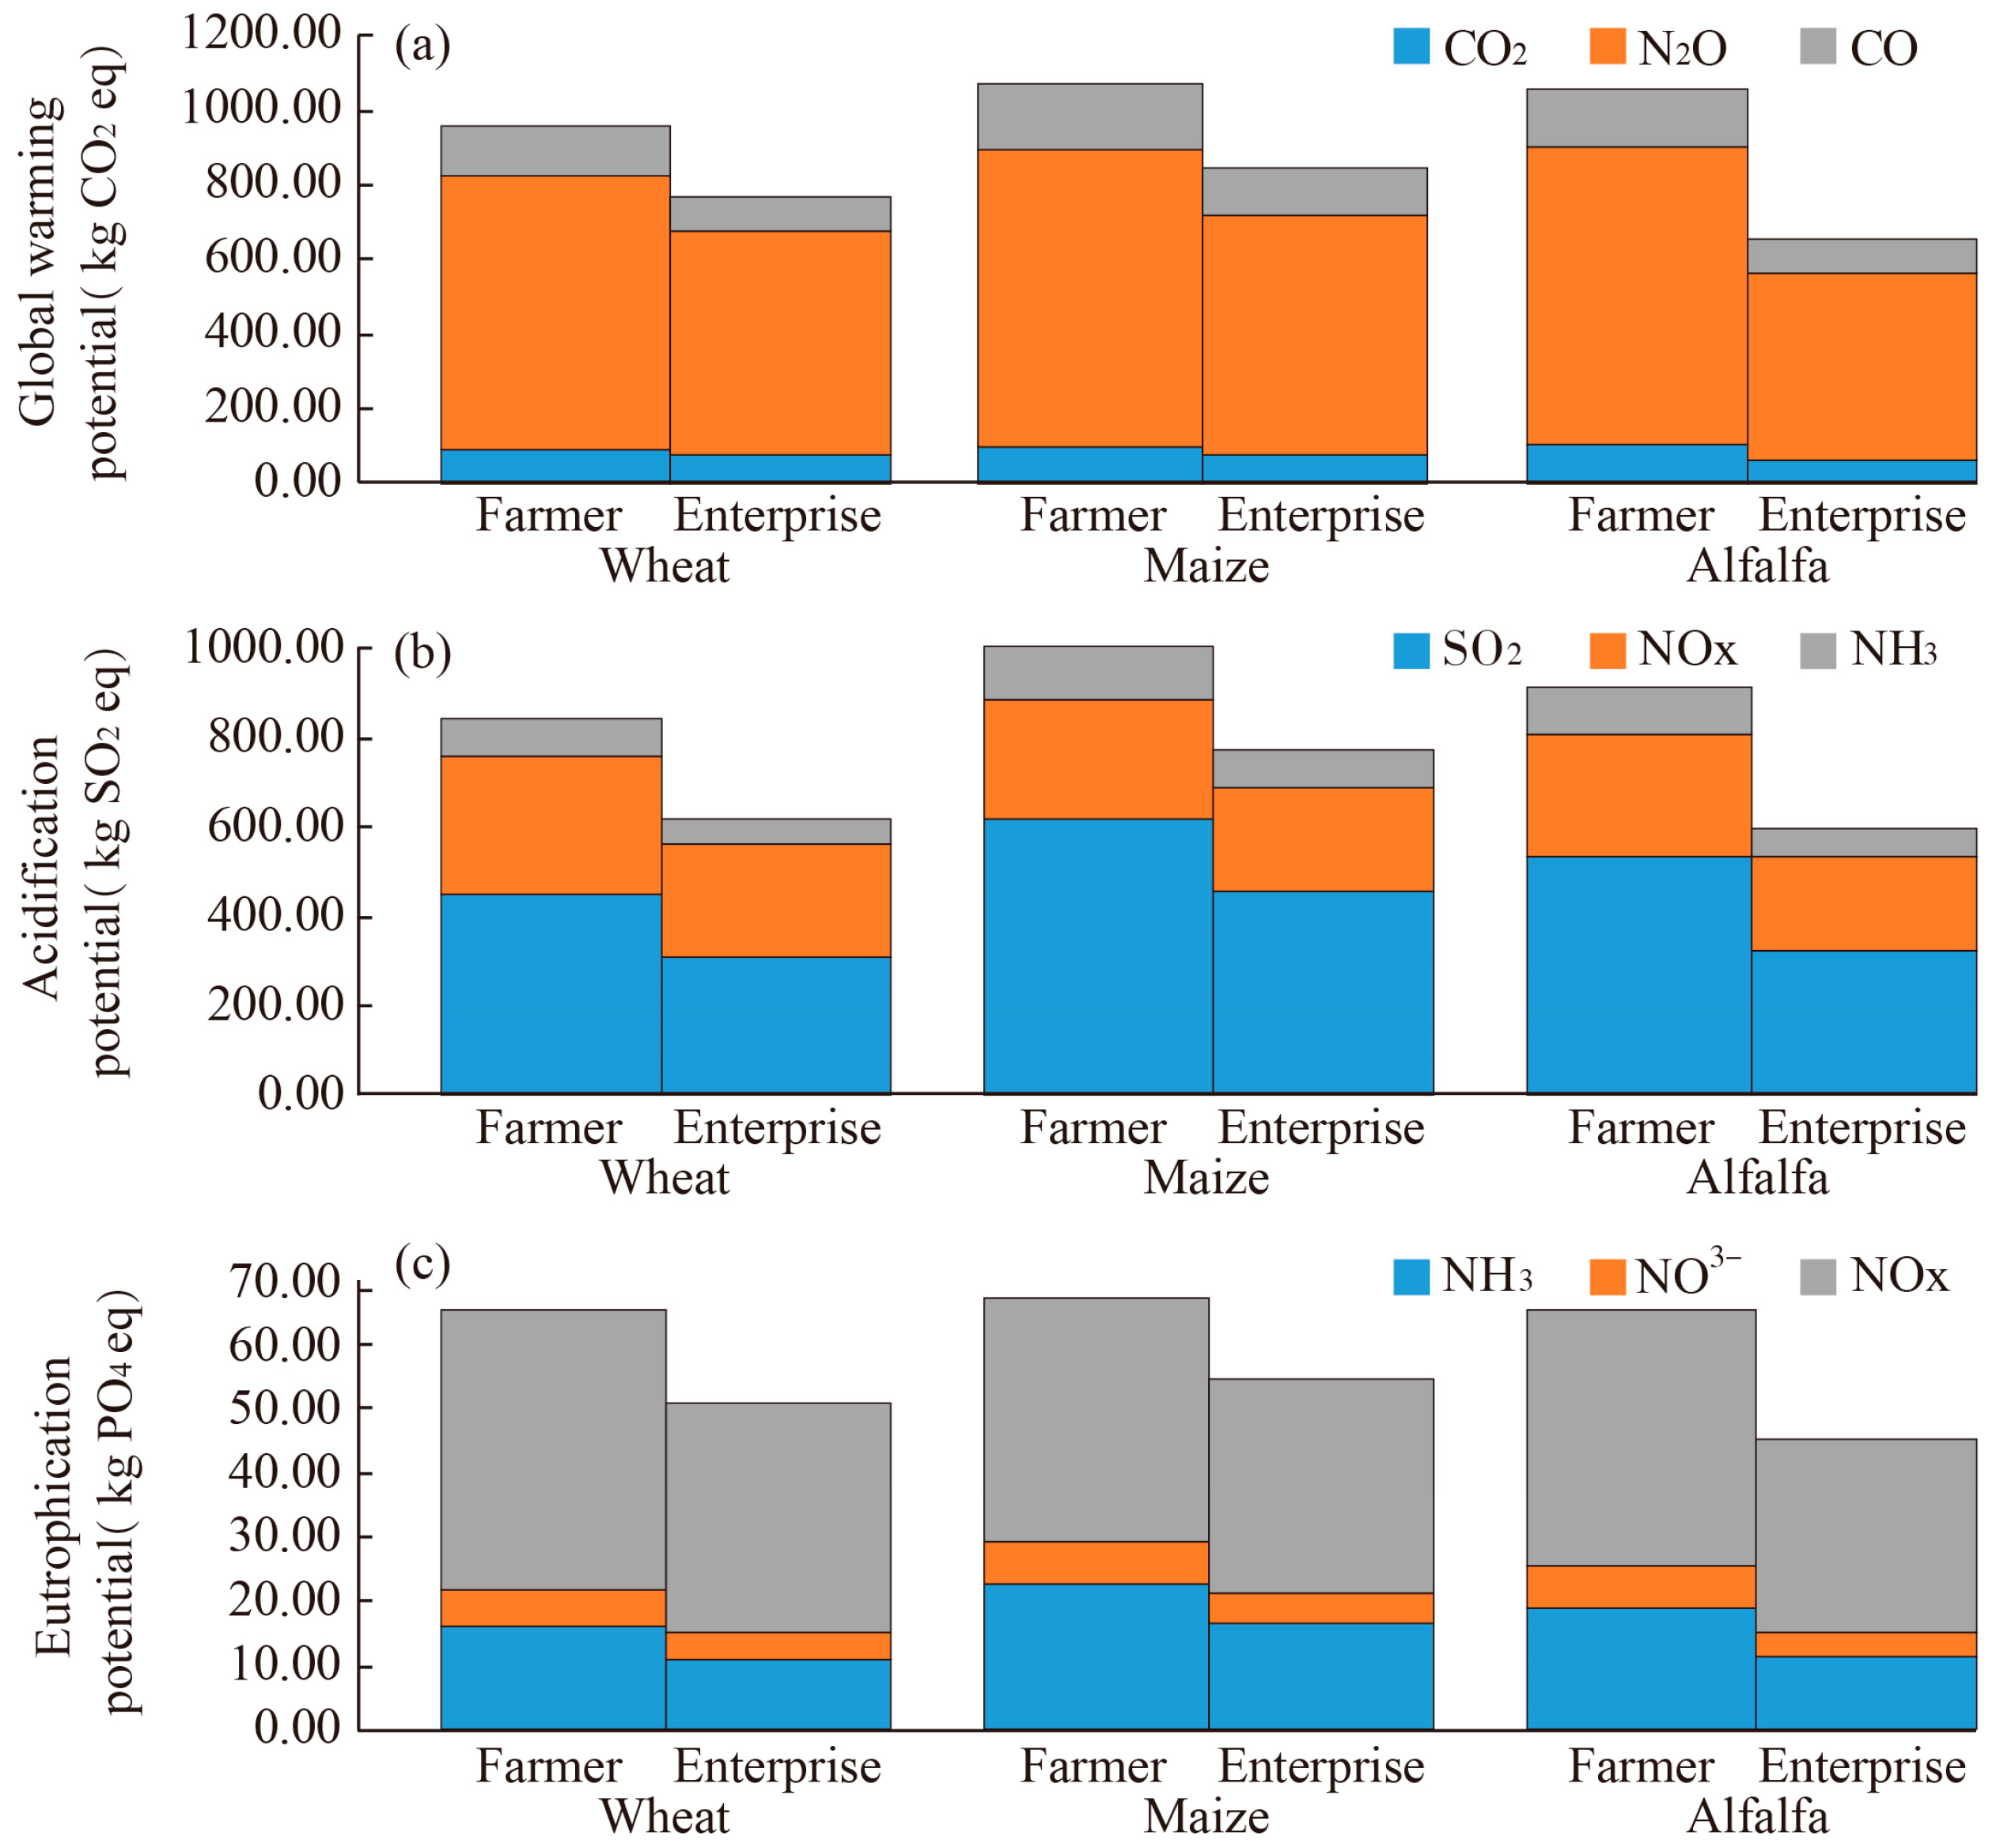
The equivalent coefficient method was used to calculate the global warming potential. The greenhouse gas emissions generated by farmers producing CNY 1000 of wheat, maize, and alfalfa were 1072.61, 1056.81, and 958.27 kg CO2 eq, respectively. The greenhouse gas emissions of CNY 1000 wheat, maize, and alfalfa produced by enterprises were 847.17, 655.93, and 767.82 kg CO2 eq, respectively, and the total greenhouse gas emissions produced by enterprises were 26% lower than that of farmers (Figure 5a).
The main pollutants leading to acidification were SO2, NH3, and NOx, which mainly came from raw material mining, agricultural material production, and crop planting processes. Shown as Figure 5b, the acidification potential of CNY 1000 of wheat, maize, and alfalfa produced by farmers were 1009.15, 914.65, and 847.05 kg SO2 eq, and the acidification potential of CNY 1000 of wheat, maize, and alfalfa produced by enterprises were 776.94, 596.16, and 617.90 kg SO2 eq, respectively. The total acidification potential produced by enterprises was 28% lower than that of farmers.
The main pollutants leading to acidification were PO4, Pto, NH3, NO3, and NOx. The eutrophication potentials of CNY 1000 of wheat, maize, and alfalfa produced by farmers were 67.11, 65.63, and 65.42 kg PO4 eq, respectively, while those of CNY 1000 of wheat, maize, and alfalfa produced by enterprises were 54.77, 45.48, and 51.07 kg PO4 eq, respectively (Figure 5c). The total eutrophication potential produced by enterprises was 24% lower than that of enterprises.

3.4. Characterization of Environmental Indices

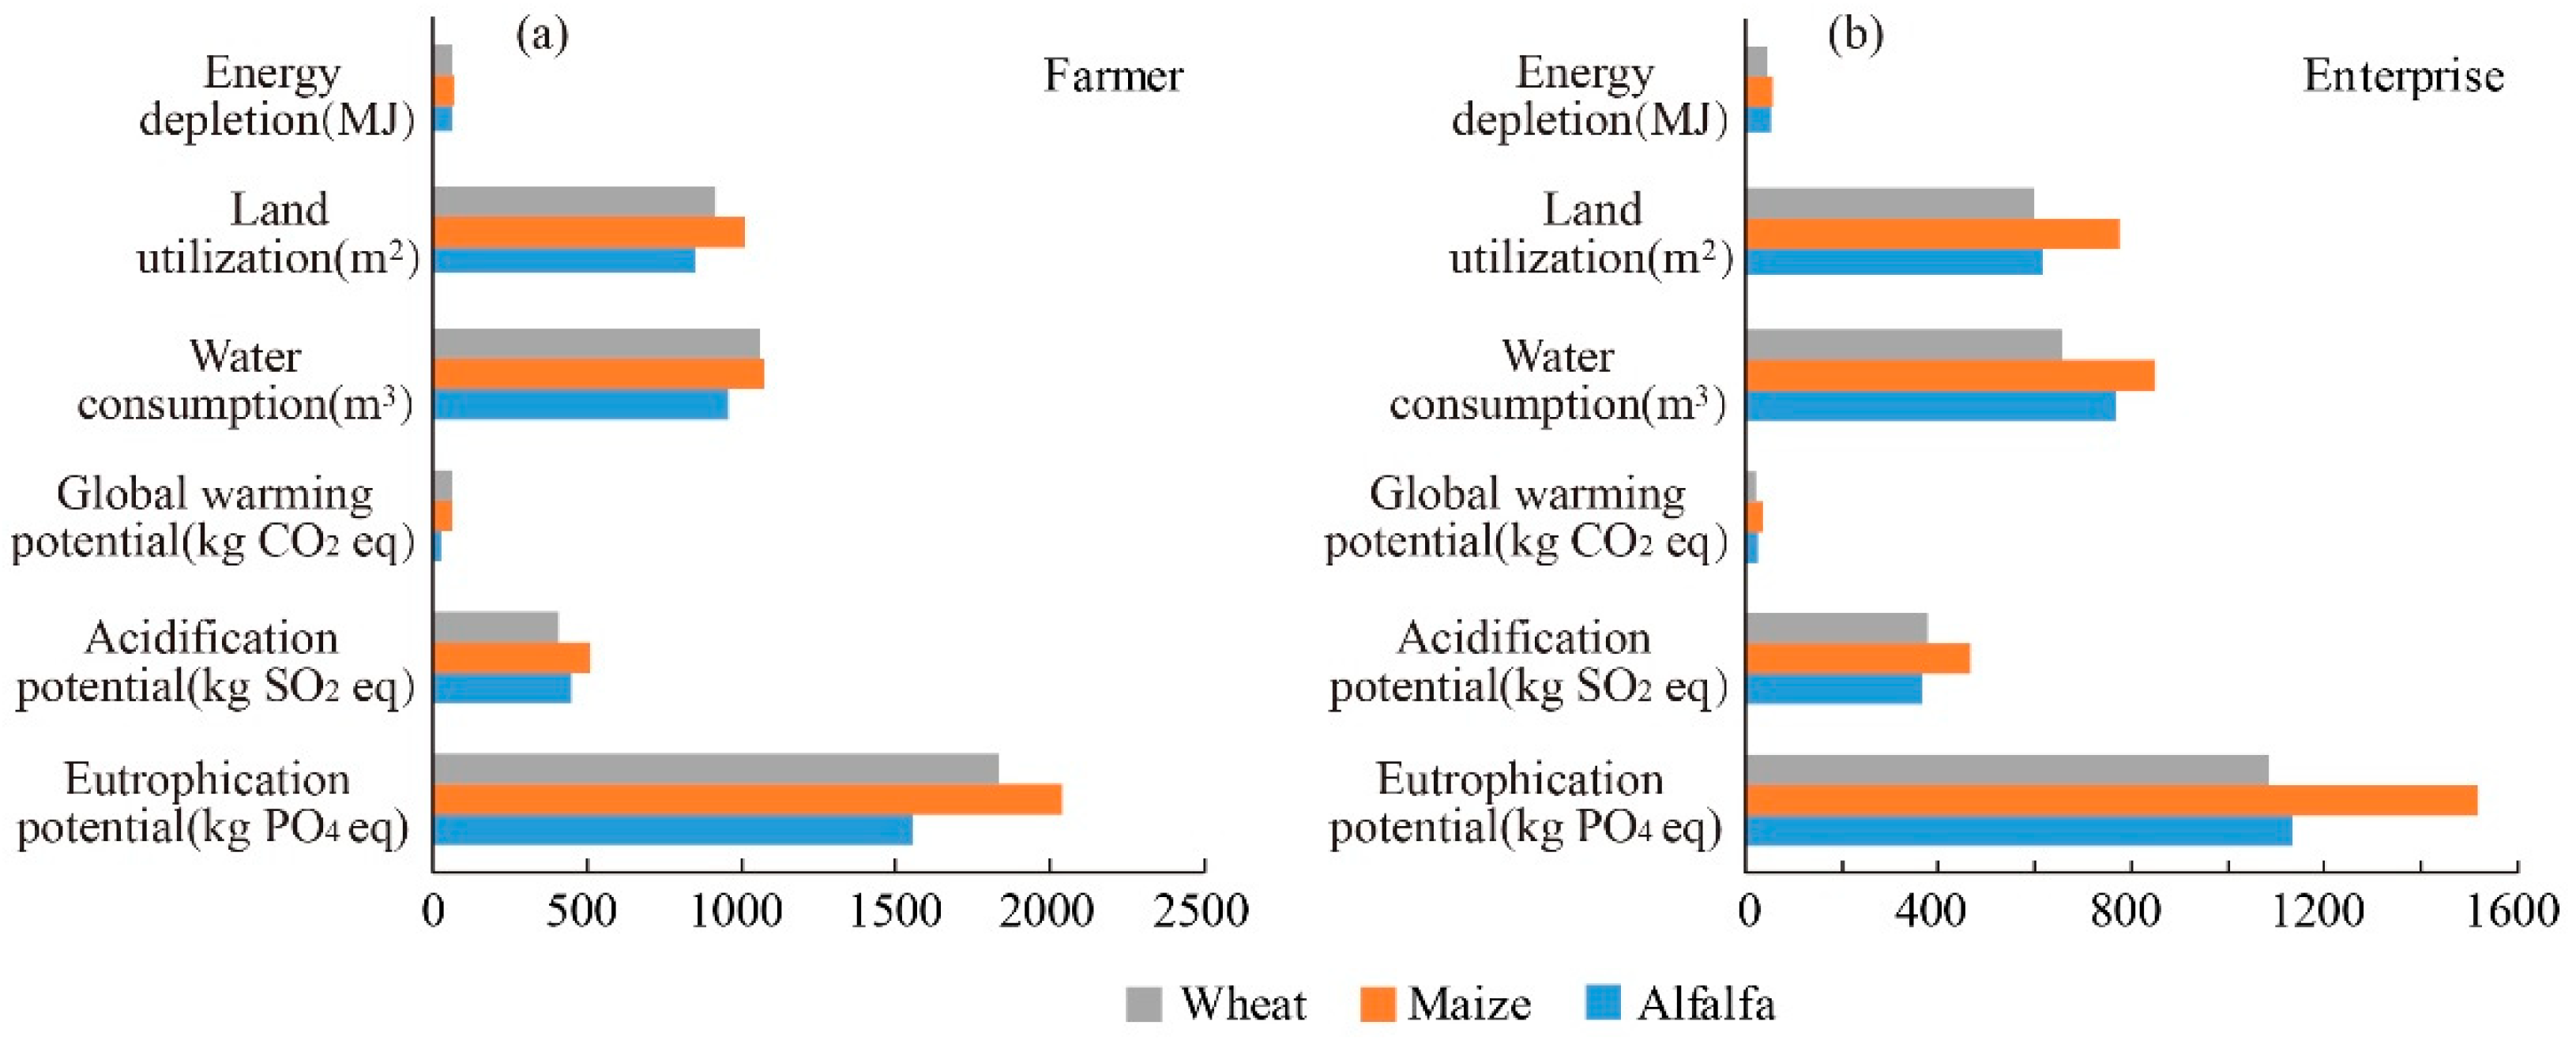
The comprehensive environmental impact index of farmland and artificial grassland systems after standardization is shown in Figure 6. The environmental impact index of farmers and enterprises producing CNY 1000 of crops and alfalfa was 2.88 and 2.14, respectively. The overall environmental impact was wheat > maize > alfalfa, and the environmental impacts of farmland systems were 9% higher than that of artificial grassland systems. The environmental effects of large-scale operation increased by 26% for alfalfa, 34% for maize, and 22% for wheat. In addition, the main environmental factors of both agricultural systems and artificial grassland systems were eutrophication and acidification under different planting scales.

4. Discussion

4.1. Reasons for Differences in Resource Consumption and Environmental Effects

This study compares the environmental impacts of the two systems across different planting scales by evaluating their resource consumption, emission of pollutants, and contribution to external environmental effects. Agricultural nitrogen emissions are one of the important sources of acidification and eutrophication, which have caused a significant impact on the environment [36]. The use of chemical fertilizers in agricultural production is also one of the main causes of soil acidification.
The amount of nitrogen deposited on the global land area exceeds 50 kg·ha−1 [37], and nitrogen-induced soil acidification poses a serious threat to species diversity and the function of ecosystems. Tian et al. [38] found that different nitrogen treatment methods and forms led to differences in acidification degrees, and site conditions and environmental factors such as soil organic matter content, nitrogen saturation, precipitation, and temperature might also affect the response of soil acidification to nitrogen addition. In traditional intensive agricultural production areas such as the North China Plain, the amount of fertilizer applied has far exceeded the actual nitrogen fertilizer demand level of crops [39]. Huang et al. [40] showed that most planting systems in the North China Plain applied more nitrogen than other elements, and overapplication of nitrogen fertilizer not only failed to improve crop yield but also led to a large amount of nitrogen and phosphorus entering the freshwater system. It leads to the eutrophication of groundwater, rivers, lakes, and coastal and marine ecosystems, which poses a serious threat to aquatic organisms, disrupts the ecological balance of waters, and affects human health [40]. Large-scale agricultural irrigation will aggravate the exploitation pressure of groundwater resources, and groundwater is the main source of agricultural irrigation in the North China Plain, with it taking up more than 60% of the total amount of groundwater exploitation.
Furthermore, the composition of greenhouse gas (GHG) emissions varied significantly between farming scales, explaining the lower global warming potential (GWP) observed in large-scale operations. As shown in Figure 5a, enterprise production reduced GWP per FU by 26% compared to smallholder farming. This advantage primarily stems from reduced nitrous oxide N2O emissions, which is a potent GHG generated from nitrogen fertilizer application. Enterprise systems used 27.4–38.2% less nitrogen input per FU for wheat and maize (Table 2), thereby minimizing nitrogen losses through denitrification. This efficiency is not solely a matter of scale, but also reflects differences in managerial and technological capacity: enterprises generally have better access to credit and information, higher levels of mechanization, and the ability to adopt precision agriculture and professional training, all of which enable more rational input use. In contrast, carbon dioxide emissions from diesel consumption differed minimally between scales, and methane emissions remained negligible in these upland cropping systems. These findings highlight that improved nitrogen management is key to GHG mitigation, and large-scale systems offer a more effective framework for implementing such practices.

4.2. Similarities and Differences in Environmental Effects at Different Scales

A digital revolution in agriculture is underway, with digitization, automation, and artificial intelligence providing new means of responding to social and environmental crises [41]. In the study, we found that the production processes of different scales (farmers and enterprises) have different impacts on the environmental effects. On the whole, the negative effect of farmers on the environment in production is significantly higher than that of enterprises, while the crop yield is lower than that of enterprises. The fertilizer zero-growth action in 2015 spurred agricultural green innovation, significantly increasing agricultural green patents via market expansion and resource reallocation [42]. Entrepreneurial and large-scale agricultural systems, due to their intensive production methods, are able to use resources more efficiently and use advanced management strategies, significantly reducing the environmental burden per unit of production while increasing production efficiency [43].
The overuse of pesticides has outpaced the growth of agricultural yields and has had a significant negative impact on the environment [44]. In terms of the use of fertilizers and pesticides, results reflect that farmers have a certain amount of waste in the use of resources or fail to make full use of technical measures to improve the efficiency of resource use, which indicates some limitations in the production management of smallholder farmers. Farmers generally face the problems of limited resources, backward information, and technology conditions, so there is a phenomenon that farmers overuse agricultural resources to ensure relatively high yields. In contrast, enterprises often have more information and technical support and can use agricultural resources more economically and efficiently to achieve higher yields. Our results support the effectiveness of these practices: enterprise systems that combine mechanization, precision management, and training achieved lower nitrogen inputs and GHG emissions per unit of output, demonstrating that the policy-driven adoption of the best practices can translate into measurable environmental benefits.
Beyond the biophysical findings, recent policy initiatives in China provide a practical framework for reducing fertilizer dependency while maintaining productivity. For instance, the green agriculture subsidy pilot program promoting organic fertilizer substitution for chemical fertilizers has been shown to reduce fertilizer application intensity by approximately 7.5% at the county level, mainly through increased mechanization and crop structure adjustments [45]. Comprehensive expansion of intensive agriculture and effective reduction in pesticide use can be achieved through multi-level socio-political interventions and broad stakeholder participation [46]. Through the assistance of the government and scientific research institutions, the innovative use of scientific research and model simulation methods can help select appropriate production systems and modes in intensive agriculture, achieving a win–win situation between environmental protection and food production. However, smallholder farmers often lack access to technical support and information to implement these practices fully. Therefore, policymakers and agricultural extension services should not only provide financial incentives but should also strengthen capacity building, promote mechanization and precision agriculture training, and improve information dissemination to help smallholders achieve similar efficiency gains.

4.3. Optimizing Management and Planting Mode

Reasonable crop rotation meets people’s demand for a diversified and balanced diet and market demand, and farmers use land resources to ensure production and income. The traditional winter wheat–summer maize rotation in the North China Plain accounts for 70% of the region’s arable land and supplies about 23% of China’s total grain food [47]. The rotation system effectively reduces the occurrence of soil diseases and pests caused by continuous cropping of a single crop, is conducive to soil health and productivity maintenance, and increases the goal of planting and harvesting throughout the year through rotation, reducing agricultural production risks. Yang et al. [47] showed that diversified crop rotation could increase equivalent yield by 38%, reduce N2O emission by 39%, increase greenhouse gas balance of the system by 88%, add alfalfa and other legumes to stimulate soil microbial activity, increase soil organic carbon storage by 8%, and enhance soil health by 45%. Large-scale diversification of cropping systems in the North China Plain could increase cereal yields by 32% and farmers’ incomes by 20%. Rational design and management of the intercropping system between alfalfa and corn is expected to achieve more efficient use of resources, reduce the dependence on chemical fertilizers and pesticides, and improve the comprehensive benefit of agricultural production.
Different fertilization measures affect the yield and quality of crops. Nitrogen is one of the key necessary nutrients for plant growth. Field management measures such as controlling nitrogen application amount and fertilization ratio and selecting nitrogen application time and method reasonably can reduce nitrogen loss. Alfalfa and rhizosphere microorganisms are symbiotic for nitrogen fixation, providing sufficient nitrogen sources for the soil and thus reducing the demand for chemical fertilizers. Alfalfa plants also have disease-resistant and pest-resistant properties, reducing the dependence on pesticides [48]. Alfalfa is less dependent on external nitrogen additions than wheat and corn, thus reducing the risk of soil acidification [49]. However, large-scale adoption of alfalfa involves trade-offs that warrant careful consideration. As a perennial crop, alfalfa has significant water demands, which could strain regional water resources in the North China Plain. Market volatility for forage crops may affect economic stability for farmers if prices fluctuate. Therefore, while alfalfa contributes to lower input use and soil health, its expansion should be balanced with water resource management, market considerations, and food security priorities.
In addition, institutional measures have reinforced the importance of scaling up sustainable practices. The implementation of high-standard farmland construction (HSFC) policy has reduced fertilizer use per unit area by nearly 9%, largely by improving mechanization and encouraging large-scale operations [50]. These outcomes align with our findings that enterprise-based systems achieve lower GHG emissions per functional unit. Policy-driven improvements in farmland infrastructure and management can amplify environmental benefits, but strategic planning is necessary when integrating perennial forage crops like alfalfa into regional cropping systems.

4.4. The Limitations and Uncertainties of the Research Methods

The bias statistics are conducive to understanding the degree of deviation of simulated data from observed data and evaluating the fit degree and prediction ability of the model [51]. The agricultural production data in this study involves a vast area and complex environment, and the information availability is limited by the respondents’ cognition level. Therefore, the robust regression M-estimation method was chosen, which provides a simpler model structure, easier to explain the parameter estimation process, and scientifically fits the observed data to ensure the accuracy and reliability of the model. Based on the available data and selected methods, the robust regression model reduces the influence of extreme values but does not remove all uncertainties in the analysis. Residual variability remains due to the natural fluctuations in the data and complex relationships between variables. Factors such as the choice of outlier removal threshold and unmeasured external influences contribute to these limitations. Therefore, although robust regression offers more stable predictions, the results still reflect some degree of variability that cannot be fully resolved by the model.
In practical application, particularly at a regional scale, it is challenging to fully eliminate human interference to accurately measure the economic value of food yield that can be provided by farmland systems under natural conditions. Therefore, this study uses the net profit from food production per unit area of farmland system ecosystems as the FU to indicate their ecological service potential. Furthermore, the economic value accounting in this study largely focused on independent resources, such as crop yields, but it may have overlooked the critical ecological processes that support these economic activities. The contributions of both biotic and abiotic ecosystem services to economic activities, as well as the reciprocal effects of economic growth on service provision, are often difficult to quantify accurately. Moreover, when applying the economic functional unit (CNY 1000 of production), potential temporal inconsistencies in monetary value should be acknowledged. In this study, all monetary data were based on 2023 price levels, without further inflation adjustment across years. While this approach ensures internal consistency for the current assessment, it may limit comparability with datasets from other time periods. Future research is encouraged to normalize all monetary data to a constant price level (e.g., a specific base year) to enhance the validity of cross-year comparisons and reduce uncertainty associated with changes in purchasing power. To date, there have been few comprehensive attempts, from either a theoretical or practical standpoint, to incorporate these ecological contributions into economic value accounting in a holistic way. The existing frameworks tend to separate economic activities from their ecological underpinnings, ignoring the interconnection between ecosystem functions and economic outcomes. Future research should therefore incorporate regional and temporal effects and employ advanced methods such as cluster analysis or mixed-effects models to better capture the complete distribution characteristics among farms. At the same time, efforts should be made to develop integrated valuation frameworks that incorporate both ecological processes and economic outputs, so as to provide a more comprehensive reflection of the true environmental performance of agricultural systems.

5. Conclusions

In this study, the planting scales of farmland and alfalfa grassland systems represented by wheat, maize, and alfalfa were analyzed in the whole life cycle, and the differences in the environmental impacts of the two ecosystems were compared to determine the main influencing factors in the production process. In conclusion, the overall environmental impact was wheat > maize > alfalfa, and the environmental impact of farmland systems was 9% higher than that of alfalfa grassland systems. Compared to large-scale cultivation, smallholder farming resulted in 26%, 34%, and 22% higher environmental impact indicators for alfalfa, maize, and wheat, respectively. In addition, for the two ecosystems with a high degree of artificial intervention, the main factors causing their environmental impacts were acidification and eutrophication, but production by enterprises was less environmentally stressful than production by farmers. In industrial restructuring, the economic and environmental benefits of different planting scales should be dynamically balanced, while a life cycle assessment method and database suitable for Chinese agricultural production should be established to provide a scientific basis for industrial optimization and policy-making.

Author Contributions

X.Z.: Conceptualization, Data processing, and Writing—original draft. X.X.: Writing—review and editing. C.S.: Data analysis and Writing—editing. Y.L.: Software and Validation. Z.L. and L.W.: Data collection and processing. All authors have read and agreed to the published version of the manuscript.

Funding

This research was funded by the National Natural Science Foundation of China, grant numbers 32130070 and 32101446; the National Key Research and Development Program of China, grant number 2021YFD1300500; the Special Funding for the Modern Agricultural Technology System from the Chinese Ministry of Agriculture, grant number CARS-34; and the open project of State Key Laboratory of Efficient Utilization of Arable Land in China, grant number EUAL-2025-12.

Data Availability Statement

The data presented in this study are available on request from the corresponding author.

Conflicts of Interest

The authors declare that they have no known competing financial interests or personal relationships that could have appeared to influence the work reported in this paper.

Nomenclature

LCALife Cycle Assessment
LCILife Cycle Inventory
LCIALife Cycle Impact Assessment
FUFunctional Unit
GYGrain Yield
MSMaterial Stage
FSFarming Stage
EDEnergy Depletion
LULand Utilization
WCWater Consumption
GWGlobal Warming (kg CO2 eq)
ACAcidification (kg SO2 eq)
EPEutrophication (kg PO4 eq)

References

  1. Wu, H.; Wang, S.; Gao, L.; Zhang, L.; Yuan, Z.; Fan, T.; Wei, K.; Huang, L. Nutrient-derived environmental impacts in Chinese agriculture during 1978–2015. J. Environ. Manag. 2018, 217, 762–774. [Google Scholar] [CrossRef]
  2. Fan, J.L.; Liu, C.Y.; Xie, J.N.; Han, L.; Zhang, C.H.; Guo, D.W.; Niu, J.Z.; Jin, H.; McConkey, B.G. Life cycle assessment on agricultural production: A mini review on methodology, application, and challenges. Int. J. Environ. Res. Public Health 2022, 19, 9817. [Google Scholar] [CrossRef]
  3. Yang, X.; Xiong, J.; Du, T.; Ju, X.; Gan, Y.; Li, S.; Xia, L.; Shen, Y.; Pacenka, S.; Steenhuis, T.S.; et al. Diversifying crop rotation increases food production, reduces net greenhouse gas emissions and improves soil health. Nat. Commun. 2024, 15, 198. [Google Scholar] [CrossRef] [PubMed]
  4. Si, S.; Wu, Y.; Li, Y.; Tu, C.; Fu, C.; Luo, Y. The Current Research Progress and Prospects of Cultivated and Grassland Soil Health-A Review. Acta Pedol. Sin. 2022, 59, 625–642. [Google Scholar]
  5. Köninger, M.; von Velsen-Zerweck, A.; Eiberger, C.; Löffler, C.; Töpper, A.; Visscher, C.; Reckels, B.; Vervuert, I. Nutrient Composition and Feed Hygiene of Alfalfa, Comparison of Feed Intake and Selected Metabolic Parameters in Horses Fed Alfalfa Haylage, Alfalfa Hay or Meadow Hay. Animals 2024, 14, 889. [Google Scholar] [CrossRef]
  6. Chen, F.; Xia, H.; Qin, X.J. Effect of mixture sowing on biomass allocation in the artificially-planted pastures, Southeastern Tibetan. J. Mt. Sci. 2019, 16, 54–63. [Google Scholar] [CrossRef]
  7. Shao, Y.; Ma, Y.; Hou, M.; Yang, J.; Ma, G. Effects of Different Previous Crops on Soil Nutrients and Wheat Yield under Phosphorus Scarcity in the North China Plain. Acta Agric. Boreali-Sin. 2022, 37, 150–158. [Google Scholar]
  8. Piao, S.; Ciais, P.; Huang, Y.; Shen, Z.; Peng, S.; Li, J.; Zhou, L.; Liu, H.; Ma, Y.; Ding, Y.; et al. The impacts of climate change on water resources and agriculture in China. Nature 2010, 467, 43–51. [Google Scholar] [CrossRef] [PubMed]
  9. Zhang, J.T.; Tian, H.Q.; Shi, H.; Zhang, J.F.; Wang, X.K.; Pan, S.F.; Yang, J. Increased greenhouse gas emissions intensity of major croplands in China: Implications for food security and climate change mitigation. Glob. Change Biol. 2020, 26, 6116–6133. [Google Scholar] [CrossRef]
  10. Alhashim, R.; Deepa, R.; Anandhi, A. Environmental Impact Assessment of Agricultural Production Using LCA: A Review. Climate 2021, 9, 164. [Google Scholar] [CrossRef]
  11. Brentrup, F.; Küsters, J.; Lammel, J.; Barraclough, P.; Kuhlmann, H. Environmental impact assessment of agricultural production systems using the life cycle assessment (LCA) methodology II. The application to N fertilizer use in winter wheat production systems. Eur. J. Agron. 2004, 20, 265–279. [Google Scholar] [CrossRef]
  12. Finger, R. Revisiting the evaluation of robust regression techniques for crop yield data detrending. Am. J. Agric. Econ. 2010, 92, 205–211. [Google Scholar] [CrossRef]
  13. Zhao, D.; Wang, Y.; Ren, C.; Ma, X.; Xu, Y.; Chen, W. Comparative analysis of three fitting methods of rice trend yield. Chin. J. Eco-Agric. 2017, 25, 345–355. [Google Scholar]
  14. Maimaitijiang, M.; Sagan, V.; Sidike, P.; Hartling, S.; Esposito, F.; Fritschi, F.B. Soybean yield prediction from UAV using multimodal data fusion and deep learning. Remote Sens. Environ. 2020, 237, 111599. [Google Scholar] [CrossRef]
  15. van der Werf, H.M.G.; Knudsen, M.T.; Cederberg, C. Towards better representation of organic agriculture in life cycle assessment. Nat. Sustain. 2020, 3, 419–425. [Google Scholar] [CrossRef]
  16. Rebitzer, G.; Ekvall, T.; Frischknecht, R.; Hunkeler, D.; Norris, G.; Rydberg, T.; Schmidt, W.P.; Suh, S.; Weidema, B.P.; Pennington, D.W. Life cycle assessment: Part 1: Framework, goal and scope definition, inventory analysis, and applications. Environ. Int. 2004, 30, 701–720. [Google Scholar] [CrossRef]
  17. Wang, M.; Wu, W.; Liu, W.; Bao, Y. Life cycle assessment of the winter wheat-summer maize production system on the North China Plain. Int. J. Sustain. Dev. World Ecol. 2007, 14, 400–407. [Google Scholar] [CrossRef]
  18. Kim, S.; Dale, B.E.; Jenkins, R. Life cycle assessment of corn grain and corn stover in the United States. Int. J. Life Cycle Assess. 2009, 14, 160–174. [Google Scholar] [CrossRef]
  19. Su, X.; Shao, X.; Tian, S.; Li, H.; Huang, Y. Life cycle assessment comparison of three typical energy utilization ways for corn stover in China. Biomass Bioenergy 2021, 152, 106199. [Google Scholar] [CrossRef]
  20. González-García, S.; Moreira, M.T.; Feijoo, G. Comparative environmental performance of lignocellulosic ethanol from different feedstocks. Renew. Sustain. Energy Rev. 2010, 14, 2077–2085. [Google Scholar] [CrossRef]
  21. van Zelm, R.; Seroa da Motta, R.d.P.; Lam, W.Y.; Menkveld, W.; Broeders, E. Life cycle assessment of side stream removal and recovery of nitrogen from wastewater treatment plants. J. Ind. Ecol. 2020, 24, 913–922. [Google Scholar] [CrossRef]
  22. Ghasemi-Mobtaker, H.; Kaab, A.; Rafiee, S.; Nabavi-Pelesaraei, A. A comparative of modeling techniques and life cycle assessment for prediction of output energy, economic profit, and global warming potential for wheat farms. Energy Rep. 2022, 8, 4922–4934. [Google Scholar] [CrossRef]
  23. Xu, G.; Luo, Y.T.; Zhang, Y.; Wang, H.T.; Shen, Y.Y.; Liu, Y.C.; Shang, S.P. Comparison on environmental impacts of cereal and forage production in the Loess Plateau of China: Using life cycle assessment with uncertainty and variability analysis. J. Clean. Prod. 2022, 380, 135094. [Google Scholar] [CrossRef]
  24. Ekvall, T.; Finnveden, G. Allocation in ISO 14041—A critical review. J. Clean. Prod. 2001, 9, 197–208. [Google Scholar] [CrossRef]
  25. Na, H.; Yan, X.M.; Xing, R.; Jiang, A.Y. The empirical effect of agricultural social services on pesticide inputs. Sci. Rep. 2024, 14, 15907. [Google Scholar] [CrossRef]
  26. Gao, Y.H.; Serrenho, A.C. Greenhouse gas emissions from nitrogen fertilizers could be reduced by up to one-fifth of current levels by 2050 with combined interventions. Nat. Food 2023, 4, 170–178. [Google Scholar] [CrossRef]
  27. Gabathuler, H. LCA History: Centrum voor Milieukunde Leiden (CML): The CML story how environmental sciences entered the debate on LCA. Int. J. Life Cycle Assess. 1997, 2, 187–194. [Google Scholar] [CrossRef]
  28. Weidema, B.P.; Wesnæs, M.S. Data quality management for life cycle inventories—An example of using data quality indicators. J. Clean. Prod. 1996, 4, 167–174. [Google Scholar] [CrossRef]
  29. Sleeswijk, A.W.; van Oers, L.F.C.M.; Guinée, J.B.; Struijs, J.; Huijbregts, M.A.J. Normalisation in product life cycle assessment: An LCA of the global and European economic systems in the year 2000. Sci. Total Environ. 2008, 390, 227–240. [Google Scholar] [CrossRef] [PubMed]
  30. Taki, M.; Soheili-Fard, F.; Rohani, A.; Chen, G.; Yildizhan, H. Life cycle assessment to compare the environmental impacts of different wheat production systems. J. Clean. Prod. 2018, 197, 195–207. [Google Scholar] [CrossRef]
  31. Gerhard, B. Modeling Crop Rotations and Co-Products in Agricultural Life Cycle Assessments; Springer: Wiesbaden, Germany, 2018. [Google Scholar]
  32. Notarnicola, B. Life Cycle Assessment in the Agri-Food Sector: Case Studies, Methodological Issues and Best Practices; Springer: Cham, Switzerland, 2015. [Google Scholar]
  33. Herrmann, I.T.; Moltesen, A. Does it matter which Life Cycle Assessment (LCA) tool you choose?—A comparative assessment of SimaPro and GaBi. J. Clean. Prod. 2015, 86, 163–169. [Google Scholar] [CrossRef]
  34. Guinée, J. Handbook on life cycle assessment—Operational guide to the ISO standards. Int. J. Life Cycle Assess. 2001, 6, 255. [Google Scholar] [CrossRef]
  35. Huijbregts, M.A.J.; Breedveld, L.; Huppes, G.; de Koning, A.; van Oers, L.; Suh, S. Normalisation figures for environmental life-cycle assessment: The Netherlands (1997/1998), Western Europe (1995) and the world (1990 and 1995). J. Clean. Prod. 2003, 11, 737–748. [Google Scholar] [CrossRef]
  36. Campbell, B.M.; Beare, D.J.; Bennett, E.M.; Hall-Spencer, J.M.; Ingram, J.S.I.; Jaramillo, F.; Ortiz, R.; Ramankutty, N.; Sayer, J.A.; Shindell, D. Agriculture production as a major driver of the Earth system exceeding planetary boundaries. Ecol. Soc. 2017, 22, 8. [Google Scholar] [CrossRef]
  37. Peñuelas, J.; Poulter, B.; Sardans, J.; Ciais, P.; van der Velde, M.; Bopp, L.; Boucher, O.; Godderis, Y.; Hinsinger, P.; Llusia, J.; et al. Human-induced nitrogen-phosphorus imbalances alter natural and managed ecosystems across the globe. Nat. Commun. 2013, 4, 2934. [Google Scholar] [CrossRef]
  38. Tian, D.S.; Niu, S.L. A global analysis of soil acidification caused by nitrogen addition. Environ. Res. Lett. 2015, 10, 024019. [Google Scholar] [CrossRef]
  39. Ren, H.; Li, Z.H.; Cheng, Y.; Zhang, J.B.; Liu, P.; Li, R.F.; Yang, Q.L.; Dong, S.T.; Zhang, J.W.; Zhao, B. Narrowing Yield Gaps and Enhancing Nitrogen Utilization for Summer Maize (Zea mays L) by Combining the Effects of Varying Nitrogen Fertilizer Input and Planting Density in DSSAT Simulations. Front. Plant. Sci. 2020, 11, 560466. [Google Scholar] [CrossRef] [PubMed]
  40. Huang, J.; Xu, C.C.; Ridoutt, B.G.; Wang, X.C.; Ren, P.A. Nitrogen and phosphorus losses and eutrophication potential associated with fertilizer application to cropland in China. J. Clean. Prod. 2017, 159, 171–179. [Google Scholar] [CrossRef]
  41. Rotz, S.; Gravely, E.; Mosby, I.; Duncan, E.; Finnis, E.; Horgan, M.; LeBlanc, J.; Martin, R.; Neufeld, H.T.; Nixon, A.; et al. Automated pastures and the digital divide: How agricultural technologies are shaping labour and rural communities. J. Rural. Stud. 2019, 68, 112–122. [Google Scholar] [CrossRef]
  42. Yang, F.; Gan, W. Effect of biased reduction targets on agricultural green innovation: An empirical study on the strategy of zero growth in synthetic fertilizer use. China Popul. Resour. Environ. 2024, 34, 186–196. [Google Scholar]
  43. German, L.A.; Hepinstall-Cymerman, J.; Biggs, T.; Parker, L.; Salinas, M. The environmental effects of sugarcane expansion: A case study of changes in land and water use in southern Africa. Appl. Geogr. 2020, 121, 102240. [Google Scholar] [CrossRef]
  44. Wagner, M.; Lin, K.Y.A.; Oh, W.D.; Lisak, G. Metal-organic frameworks for pesticidal persistent organic pollutants detection and adsorption—A mini review. J. Hazard. Mater. 2021, 413, 125325. [Google Scholar] [CrossRef]
  45. Fan, D.; Yang, F.; Zheng, X.; Zhang, Q. The impact of green agricultural subsidies on fertilizer reduction and its mechanism: Evidence from pilot policies for organic fertilizer subsidies. Resour. Sci. 2023, 45, 1515–1530. [Google Scholar] [CrossRef]
  46. Wyckhuys, K.A.G.; Zou, Y.; Wanger, T.C.; Zhou, W.W.; Gc, Y.D.; Lu, Y.H. Agro-ecology science relates to economic development but not global pesticide pollution. J. Environ. Manag. 2022, 307, 114529. [Google Scholar] [CrossRef]
  47. Yang, X.; Steenhuis, T.S.; Davis, K.F.; van der Werf, W.; Ritsema, C.J.; Pacenka, S.; Zhang, F.; Siddique, K.H.; Du, T. Diversified crop rotations enhance groundwater and economic sustainability of food production. Food Energy Secur. 2021, 10, e311. [Google Scholar] [CrossRef]
  48. Yang, Z.; Xu, Y.X.; Li, H.; Li, S.S.; Wang, X.L.; Chai, H. Difference of Bacterial Community Structure in the Meadow, Maize, and Continuous Cropped Alfalfa in Northeast China. Front. Microbiol. 2022, 13, 794848. [Google Scholar] [CrossRef]
  49. del Portillo, D.G.; Arroyo, B.; Morales, M.B. The adequacy of alfalfa crops as an agri-environmental scheme: A review of agronomic benefits and effects on biodiversity. J. Nat. Conserv. 2022, 69, 126253. [Google Scholar] [CrossRef]
  50. Liu, Y.; Liao, W.M.; Zhang, X.; Qiu, H.L. Impact of high standard farmland construction policy on chemical fertilizer reduction: A case study of China. Front. Environ. Sci. 2023, 11, 1256028. [Google Scholar] [CrossRef]
  51. Yang, J.M.; Yang, J.Y.; Liu, S.; Hoogenboom, G. An evaluation of the statistical methods for testing the performance of crop models with observed data. Agric. Syst. 2014, 127, 81–89. [Google Scholar] [CrossRef]
Figure 1. Location of the research sites in the North China Plain. The red dots indicate the specific research sites.
Agronomy 15 02432 g001
Figure 2. A conceptual model showing the inputs, outputs, and system boundaries included in the study.
Agronomy 15 02432 g002
Figure 3. Robust regression results of output under different scales. Scatter plots of predicted vs. actual yields for smallholder farmers (a,c,e) and enterprises (b,d,f). The blue dots represent the production forecast points.
Agronomy 15 02432 g003
Figure 4. Energy depletion (a), land utilization (b), and water consumption (c).
Agronomy 15 02432 g004
Figure 5. Global warming potential (a), acidification potential (b), and eutrophication potential (c).
Agronomy 15 02432 g005
Figure 6. Life cycle environmental impact of wheat, maize, and alfalfa under farmers (a) and enterprises (b) planting scales.
Agronomy 15 02432 g006
Table 1. Agricultural input and output data sources.
InventoryData Source
Raw materials producing
Species, manufacturers, and dosages of fertilizersField investigation
Species, manufacturers, and dosages of farm chemicalsField investigation
Agricultural filmLiterature
SeedLiterature
Transportation of raw materialsField investigation
Cultivating
Fuel consumption and emission of field-turning machineField investigation and the literature
Water and electricity consumption of irrigationField investigation
Emissions of field greenhouse gasLiterature
Harvesting
Fuel consumption and emission of harvesting machineField investigation and the literature
Transportation of productsField investigation
Table 2. Inputs–outputs for a CNY 1000 crop system and alfalfa hay production system under different scales.
ScaleCrop TypeLand Use
(ha)
N
(kg/ha/FU)
P2O5
(kg/ha/FU)
K2O
(kg/ha/FU)
Pesticide
(kg/ha/FU)
Irrigation
Water
(m3/ha/FU)
Diesel Fuel
(kg/ha/FU)
FarmerWheat12.8017.9710.459.560.0464.926.67
Enterprise255.3513.058.477.990.0236.416.22
FarmerMaize12.8714.8812.9711.620.0460.857.36
Enterprise240.249.206.125.920.0320.956.08
FarmerAlfalfa40.9212.7910.388.780.0324.988.76
Enterprise486.238.339.949.690.0323.407.27
Table 3. Normalization values and weights for different impact categories.
Environmental Impact CategoryUnitReference ValueWeightEmission and Equivalent Coefficient
Energy depletionMJ/a2,590,4570.15
Land usem254230.12
Water depletionm388000.13
CO2 (1)
Global warmingkg CO2 eq68690.12CO (2)
CH4 (21)
N2O (310)
SO2 (1)
Acidificationkg SO2 eq56.260.14NOx (0.7)
NH3 (1.88)
NH3 (0.35)
Eutrophicationkg PO4 eq1.880.12NO3-N (0.42)
NOx (0.1)
Disclaimer/Publisher’s Note: The statements, opinions and data contained in all publications are solely those of the individual author(s) and contributor(s) and not of MDPI and/or the editor(s). MDPI and/or the editor(s) disclaim responsibility for any injury to people or property resulting from any ideas, methods, instructions or products referred to in the content.