Article

Transport of Phosphorus from Three Fertilizers Through High- and Low-Phosphorus Soils

1
Biological and Environmental Engineering Department, Cornell University, Ithaca, NY 14850, USA
2
Crop and Soil Sciences Department, North Carolina State University, Raleigh, NC 27695, USA
*
Author to whom correspondence should be addressed.
Agronomy 2025, 15(10), 2395; https://doi.org/10.3390/agronomy15102395
Submission received: 17 September 2025 / Revised: 7 October 2025 / Accepted: 10 October 2025 / Published: 15 October 2025
(This article belongs to the Special Issue Conventional and Alternative Fertilization of Crops)

Abstract

Chemical fertilizers are commonly used to supply phosphorus and other nutrients to crops, but due to high affinity of soils for P fixation, over-application of P fertilizer is common, which may result in groundwater and surface water pollution. To increase P use efficiency, different strategies, including different fertilizer formulations and types, have been developed. Two struvite-based fertilizers, Crystal Green® (CG) and Crystal Green Pearl® (CGP), are touted as environmentally safe, because they are insoluble in water but soluble in organic acids exuded from crop roots. The objective of this study was to assess fate and transport of P from diammonium phosphate (DAP), CG, and CGP through two loam soils with a significant difference in their initial P content. Two loamy soils, one collected from an experimental field receiving fertilizer continuously since 1985 and one from an adjacent area receiving no fertilizer, and a pure sand control were packed in 5 cm diameter and 5 cm long columns. Several grains equivalent to approximately 80 mg P from each fertilizer were imbedded at the bottom of the column. Distilled water was passed through the soil columns from the bottom at a relatively constant rate, and the outflow was collected every two hours using a fraction collector. Outflow samples from each treatment combination were analyzed for P by the colorimetric method, and the amount of P retained by the soils along the column at the end of the water application was determined by the nitric acid digestion method. Approximately 91% of P in DAP, 34% in CG, and only 3.8% in CGP was transported through the sand column. In contrast, the amounts of P transported were approximately 42.2% for DAP, 6.4% for CG, and 0.4% for CGP through the high-P soil and 22.4% for DAP, 0.6% for CG, and almost zero for CGP through the low-P soil. Overall, the results show a high solubility and transport for DAP, very low transport for CGP, and somewhat low to medium transport for CG fertilizers. In addition, the results show that even the high-P soil that has received fertilizer for about 40 years has the capacity to fix significant amounts of P.

1. Introduction

Phosphorus (P) is a critical nutrient in plants and animals that lends DNA and other cellular components their structures and functions [1,2,3]. Animals generally obtain P through food, while plants take up P from soil. The only natural source of P in soils is from their parent materials, but slow weathering of minerals [4] prevents adequate releases of soluble P for crop production. Although some plants have developed adaptive strategies, such as release of organic acids to speed up phosphate rock weathering [5], P is considered a limiting nutrient [6] and must be supplied to agricultural crops through fertilization. Before commercial fertilizers, crop residue, manure, human waste, bones, and burnt vegetation were the main sources of agricultural P [7].
During the 20th century, rapid advancements in fertilizer chemistry resulted in a boom in agricultural productivity. Development of manmade nitrogen (N) fertilizers and the discovery of plentiful phosphate rock reserves enabled much more effective fertilizers, while direct recycling of human waste fell out of practice due to sanitation concerns [7]. Phosphate rock is a non-renewable resource, and the current lack of P recycling, coupled with the toleration of large agricultural losses, has dispersed a tremendous amount of P irretrievably across soil profiles and water bodies [8]. Furthermore, the majority of phosphate mines reside in only a few countries, and the true quantity of reserves is uncertain, with the evaluation in 2011 determining global phosphate rock reserves four times greater than previously estimated [9,10]. The threat of a national phosphate monopoly has spurred interest in recapture methods and is considered a national security concern in the US [10].
Municipal biosolids (i.e., treated sewage sludge) have been used as a source of P and other nutrients for crop production [11,12]. Biosolids, however, may contain undesirable chemicals, such as heavy metals and organic compounds (e.g., perfluoroalkyl and polyfluoroalkyl substances or PFASs), that may cause major soil and water contamination [13,14,15]. Urine is also being investigated as a P source through direct field application or chemical recovery [16,17,18,19,20]. Although P recovery from urine seems to be relatively clean, it is not universally practical, as most existing infrastructures do not separate urine from other waste streams [21]. Removal of P from wastewater in wastewater treatment plants not only minimizes potential environmental damage but is also a viable source of this valuable nutrient [22]. The precipitating product, typically struvite (NH4 MgPO4∙H2O) [23], can be used directly as fertilizer [24]. Although recovery of struvite in wastewater treatment plants is economically feasible, there are technological, environmental, and political issues that must be addressed for large-scale operations [25,26,27].
Conventional ammonium-phosphate products, such as monoammonium and diammonium phosphate (MAP and DAP, respectively), supply both N and P, while in P-starved soils triple superphosphate (TSP) provides high concentrations of plant-available P without N. High-solubility fertilizers are perfect for plant uptake but susceptible to nutrient losses via runoff, soil adsorption, and leaching [28]. Due to strong affinity of soil for adsorbing P, referred to as P fixation, only a fraction of the P applied through chemical fertilization is available for plant uptake, leading to low crop productivity per unit of P application, known as low P use efficiency [29,30]. As a result, farmers generally overapply P fertilizers [31]. One of the oldest methods for mitigating P fixation is banding application of fertilizer [1,32,33,34]. Another approach to increase P uptake efficiency is the use of fertilizer products that minimize P fixation and reduce field losses through leaching. Coating of highly soluble P fertilizers, such as MAP and DAP, is used to slow P movement out of fertilizer grains and prevent P fixation by soil particles [35,36]. Some slow-release fertilizers, such as struvite, are minimally soluble in water but respond well to the organic acids released by plant roots, releasing P in response to crop growth [37]. These fertilizers may provide a constant supply of P during the season without reapplication and are suitable for late-uptake crops [38,39]. However, these fertilizers perform poorly when applied alone on alkaline soils or to low acid-producing crops [40]. Smart fertilizers are another option, utilizing material engineering to control nutrient delivery in response to environmental factors such as soil pH [41], but cost and unfamiliarity have thus far hindered their use in conventional agriculture.
The retention of P in soils or P fixation complicates the evaluation of farm-level management practices. Continuous application of P fertilizer saturates much of the soil profile’s sorption sites, and according to some studies, highly treated soils have enough stored P, referred to as ‘legacy P’, to serve future crops for years [42,43,44]. Phosphorus’s movement via erosion or runoff, known as facilitated transport [45,46,47,48], redistributes the nutrient to sinks such as lakes and streams, where it can remain unnoticed until remobilized or overloaded. Even in P-limited water bodies, aquatic microorganisms readily take up P, multiply, and decay, resulting in the depletion of oxygen in surface water resources. This oxygen-depleted water has a heightened ability to dissolve iron–phosphorus complexes in sediments, which further increases the aqueous phosphate load [49]. Relocation and remobilization of P in sediments can obscure the effects of conservation strategies.
Field studies are the most direct method for evaluating the efficacy of fertilizers [50,51,52]. Lyons et al. [53] have offered guidelines for conducting field experiments to assess enhanced-efficiency fertilizers, which can also be used for evaluating other fertilizers. Field experiments, however, focus on large-scale crop effects but often take years to complete and are complicated by confounding variables such as weather or hydrology. Pot or greenhouse studies recreate field conditions artificially to reduce external factors while still focusing on plant performance [54,55,56]. Fate and transport of P from fertilizers in soils, however, require evaluations under more controlled conditions. Laboratory column and Petri dish investigations focus on nutrient movement with minimal biotic interference. Although laboratory studies do not capture true field dynamics, they are relatively fast and low-resource experiments that uncover fate and transport characteristics of nutrients and pollutants. A Petri dish study using small samples [57,58,59], however, is a stationary method that ignores convective transport of P under saturated or unsaturated water flow conditions. Column studies [60], on the other hand, can be conducted using different-size intact or repacked samples [61,62,63].
According to Randall and Hoeft [34], there are four general goals for proper fertilizer placement: efficient use by plants, reduction/minimization of environmental damage, prevention of injury to plants, and economical and operational convenience. These goals are directly related to the fate and transport of nutrients in fertilizers in the soil. One of the most widely used P fertilizers is DAP, which is highly soluble in water, posing potential risks for leaching losses and water resource contamination, despite high affinity of soil for fixing P. Two commercially available struvite-based fertilizers, Crystal Green® (CG) and Crystal Green Pearl® (CGP), are touted as environmentally safe while maintaining crop productivity, because, according to their manufacturer, they are insoluble in water but soluble in organic acids exuded from crop roots.
Since CG and CGP are relatively new fertilizers, their behavior in soil is not well understood. This soil column study was conducted to assess movement of P from DAP, CG, and CGP, two slow-release struvite-based P fertilizers, through two loam soils with a significant difference in their initial P content.

2. Materials and Methods

A column study was conducted to determine the transport of P from three granular fertilizers through a high- and a low-P loam soil. Pure sand was used as control.

2.1. Fertilizer

Three different fertilizers were used in the study. Two struvite-based fertilizers, CG and CGP, were supplied by their manufacturer, Ostara (St. Louis, MO, USA), and DAP was obtained from a commercial source. Of these, CGP is made from struvite extracted from wastewater at municipal wastewater treatment plants, CG is manufactured from undisclosed sources, and DAP is manufactured from mined phosphate. According to their labels, the P2O5 content of the three fertilizers was 46% (20.08% P content) for DAP and 28% P2O5 (12.23% P) for both CG and CGP.
To determine solubility of P from fertilizer grains, three grains of each fertilizer, weighing approximately 6 mg, were placed inside small mesh bags and inserted into twelve 50 mL centrifuge tubes containing 40 mL distilled (DI) water. The tubes were randomly assigned into four groups, each containing three replicates for each fertilizer. The tubes were then shaken on an orbital shaker continuously (approximately 50 rounds per minute, RPM, at 20 °C) for 1.5, 6, 24, and 72 h. At the termination of each period, the solutions from the tubes were removed and analyzed for P concentration by the Murphy and Riley [64] method.

2.2. Soil

Soil materials were collected from the upper 20 cm of a long-term P study experimental plot receiving P fertilizer continuously since 1985 and at a nearby location that had not received fertilizer, at the North Carolina State University Piedmont Research Station in Salisbury, Rowan County, North Carolina [65]. The soils at the site have been classified as Lloyd series (fine, kaolinitic, thermic Rhodic Kanhapludults). Hereafter, the soil material from the high-P experimental plot is referred to as high-P soil, and the other soil material is referred to as low-P soil. Both soils were air-dried, crushed by hand using a polycarbonate roller, and passed through a 0.5 mm sieve. Pure sand with a narrow particle size distribution, obtained commercially from Thermo Fisher Scientific (Waltham, MA, USA), was used as a control treatment.
Table 1 presents selected properties of the two soils used in the study. The particle size distributions (i.e., percent of sand-, silt-, and clay-sized particles) of the two soils were determined by the pipette method [66], and their particle densities were determined by the gas pycnometer method [67] using helium (He) in an Accupyc 1340 gas pycnometer (Micromeritics Instrument Corp., Norcross, GA, USA). Duplicate samples of each soil material were analyzed for selected chemical properties by the Agronomic Services of the North Carolina Department of Agriculture and Consumer Services, and total P was determined using nitric acid digestion by Midwest Laboratories (Omaha, NE, USA) using four replications. Considering that clayey soils typically have a bulk density of 1.25–1.4 g/cm3, an average of 1.3 g/cm3 was used as a baseline for packing soil columns. For three replications for each treatment combination, 130 g of each soil material was weighed out and packed into the column to obtain a uniformly packed soil core with a bulk density of approximately 1.30 g/cm3. Using this bulk density and particle density of the soil, the calculated porosity was 0.5 cm3/cm3 for both soil types. Porosity was used to determine an approximate flow rate.

2.3. Column Preparation

A series of soil columns were constructed using 8.5 cm long sections of a 5.05–5.1 cm inside diameter polycarbonate tube. A round disk made from 7.5 mm thick polycarbonate sheet and equipped with an L-shaped barbed fitting was tightly attached to one end of the column using clear polyvinyl chloride (PVC) cement. A series of marks were made on the outside, every one cm, from the inner bottom level of the column for packing the column uniformly. Two round pieces of glasswool cloth were placed at the bottom to cover the hole. Pure sand was packed at the bottom to the 1 cm mark. Then, 26 g of each soil was placed over the sand and packed with a plastic rod to the second marking on the column. This process was repeated until 130 g of soil was packed to a height of 5 cm. For each column, several fertilizer grains from each fertilizer, containing approximately 85 mg of P, were placed radially in a symmetrical fashion on the surface of the soil on the open end of the column and very gently pushed into the soil as shown in Figure 1. The amount of fertilizer for 85 mg P were 424 mg of DAP and 695 mg of CG and CGP. Fertilizer granules of intermediate size and regular shape were selected to improve the application’s uniformity. Pure sand was then added to the top of the soil in the column to a depth of approximately 1 cm. After placing two round pieces of glasswool cloth over the sand, the end of the column was closed using a tightly fitted round polycarbonate lid equipped with an L-shaped barbed pipe fitting and sealed. The joints between the polycarbonate cylinder and the plate at each end were sealed completely using Flex Shot® caulking. All columns were then inverted and placed on a rack, so the fertilizer grains were at the bottom. Triplicate columns were used for both soil types. In addition, three columns were prepared similarly with only pure sand as a control to test transport under conditions with relatively limited binding.

2.4. Experimental Procedures

The bottoms of the columns with fertilizer grains were connected to a large carboy containing distilled water (DI) through a multichannel peristaltic pump. A fraction collector with a tray holding 162 centrifuge tubes (15 mL capacity) in nine rows was used for collecting outflow from each of nine columns. The top outlet of each column was connected to small-diameter Tygon® tubing carrying the outflow directly over the respective sample collection on the fraction collector (Figure 1). The fraction collector was set to move every 2 h, and the peristaltic pump was set to deliver approximately 6 mL/h DI water to each column. This set up allowed us to collect one set of 12 outflow samples from each column every 24 h.

2.4.1. Water Application

The columns were first saturated over the course of one day by slowly applying distilled water to their bottom (where fertilizer grains were located) to allow air to escape from the top. Once water reached the top of the columns, the water application was stopped to allow the fertilizer grains to wet up. Then, DI water was applied to each column from the bottom, and the outflow was collected using the fraction collector. For the first set of samples during the first 24 h, the water outflow rate was monitored, and the peristaltic pump speed was adjusted so as to deliver approximately 6 mL/h of DI water to each column. The sample collection was continuous, and the experiment ran for 5 days for DAP, 7 days for CGP, and 11 days for CG fertilizer. These time periods were selected based on the outflow concentrations from the columns and constraints related to sample collection and analysis. Each day, all outflow samples were collected and stored in a refrigerator after recording their individual volumes.

2.4.2. Phosphorus Retention in Soil

At the termination of water applications, each column was dissected into five one cm layers, and the samples were allowed to air dry. Then, the samples were ground by hand and passed through a 0.5 mm sieve. After recording the mass of the air-dried samples, approximately 5 g of soil from each section was sent to Midwest Laboratories for total P analysis by nitric acid digestion. The initial mass (i.e., before experiment) and the final mass of P (i.e., after completion of the experiment) in each sample were determined using their respective mass of the soil sample. Then, the amount of P from the fertilizer grains in each sample was determined by subtracting the initial mass from the final mass.

2.4.3. Outflow Phosphorus Concentration Analysis

Approximately every 48 h a selected number of outflow samples collected during the previous two days were analyzed for P concentration by the Murphy and Riley [64] method using a spectrophotometer. For analysis, starting from the first set, every fourth sample from each column was analyzed. Briefly, samples were removed from the refrigerator and allowed to warm to room temperature. The first set of samples were centrifuged but did not contain any solids; therefore, the subsequent samples were not centrifuged before analysis. Six standard samples between 0 and 2.5 mg P/L were used in the analysis, and the samples were diluted if necessary. A maximum of fifty samples were analyzed at a time, and an adequate time was allowed for the spectrophotometer to cool down before the next batches of analysis. Based on the results, additional samples from each replication/treatment were selected for analysis to fill in gaps where the trend of concentration was not clear.
The outflow concentrations were evaluated for P transport as a function of the amount of water passing through the soil. To further analyze the cumulative P transport for each fertilizer–soil treatment, the cumulative amount of P detected in the outflow vs. pore volume (PV) was normalized by the total amount of P in the outflow samples and the amount retained by the soil in the respective columns as described above.

2.4.4. Statistical Analysis

Despite water being applied to the columns using a multi-channel peristaltic pump at a constant rate of rotation, the volumes of outflow samples from the columns were not all the same. To allow comparison between different treatments, the outflow concentrations at one PV intervals was determined by linear interpolation (or extrapolation for the end). Then, the cumulative amount of P transported was determined for each whole PV value.
One way analysis of variance (ANOVA) and Tukey’s test [68] were performed in Excel (Microsoft, Redmond, WA, USA) to compare cumulative amounts of P transported at 1, 5, 10, and 15 PV from the three fertilizers through the two soils and sand.

3. Results and Discussion

3.1. Solubility of P from Fertilizer Grains

As stated before, according to their manufacturer, both CG and CGP are insoluble in water, but DAP is highly soluble, releasing plant-available P in soil easily. There were significant differences (p < 0.05) between the solubility of P from the three fertilizers. Approximately 85% of P from DAP, 24% from CG, and less than 0.5% from CGP fertilizer grains was dissolved in 1.5 h. The maximum amounts of P removal from the fertilizer grains were approximately 90% from DAP in 24 and 72 h and 45% for CG and 16% for CGP in 72 h. Similar to findings of Talboys et al. [38], these results confirm high solubility of P from DAP but medium solubility for CG and low solubility from CGP fertilizers, which could impact P’s dissolution and transport in soil following land application of fertilizer for crop production. A lower initial water solubilization of a P fertilizer may be advantageous, as it may better synchronize P’s release with plant uptake. In contrast, highly soluble fertilizers can cause an immediate spike in soil solution P concentration, which often leads to rapid adsorption onto soil particles and increased P leaching into groundwater.

3.2. Phosphorus Retention

On average, approximately 9% of the total P detected in the outflow and in the sand columns at the termination of the experiment was detected in only the first layer where DAP fertilizer grains were applied (Table 2). In contrast, of all the P detected in the sand columns and outflow, approximately 66.4% of P from CG and 96.2% from CGP remained in the first layer where fertilizer grains were applied. For the high-P soil, approximately 57.8% of P from DAP, 93.6% from CG, and 99.6% from CGP fertilizers remained in the columns (see Table 2). Of the total amount of P detected for the low-P soil, approximately 77.6% of P from DAP, 99.4% from CG, and almost 100% from CGP was retained in the columns.

3.3. Phosphorus Transport

According to Luo et al.’s [69] analysis of the results of 987 field studies, only 9–16% of the P applied with fertilizers to agricultural crops is taken up by plants, 63–72% is retained by the soil, and 0.2–10% is lost through erosion or leaching. The two main mechanisms for P transport through soil are preferential flow through macropores and matrix flow [70,71,72]. Since in preferential flow the soil solution has little contact with soil particles, P retention by soil is minimized. Matrix flow, on the other hand, provides the opportunity for P retention by soil particles. In our study, where the soil materials were crushed, passed through a 0.5 mm sieve, and packed in columns, P’s contact with soil particles is maximized, while the relatively rapid saturated flow conditions allow leaching. Gatiboni et al. [73] evaluated the P adsorption in columns of intact (i.e., with structure preserved) and repacked soil and observed the disturbed repacked soil had a 1.4 to 14 times higher P sorption in a 24 h test under continuous flow.
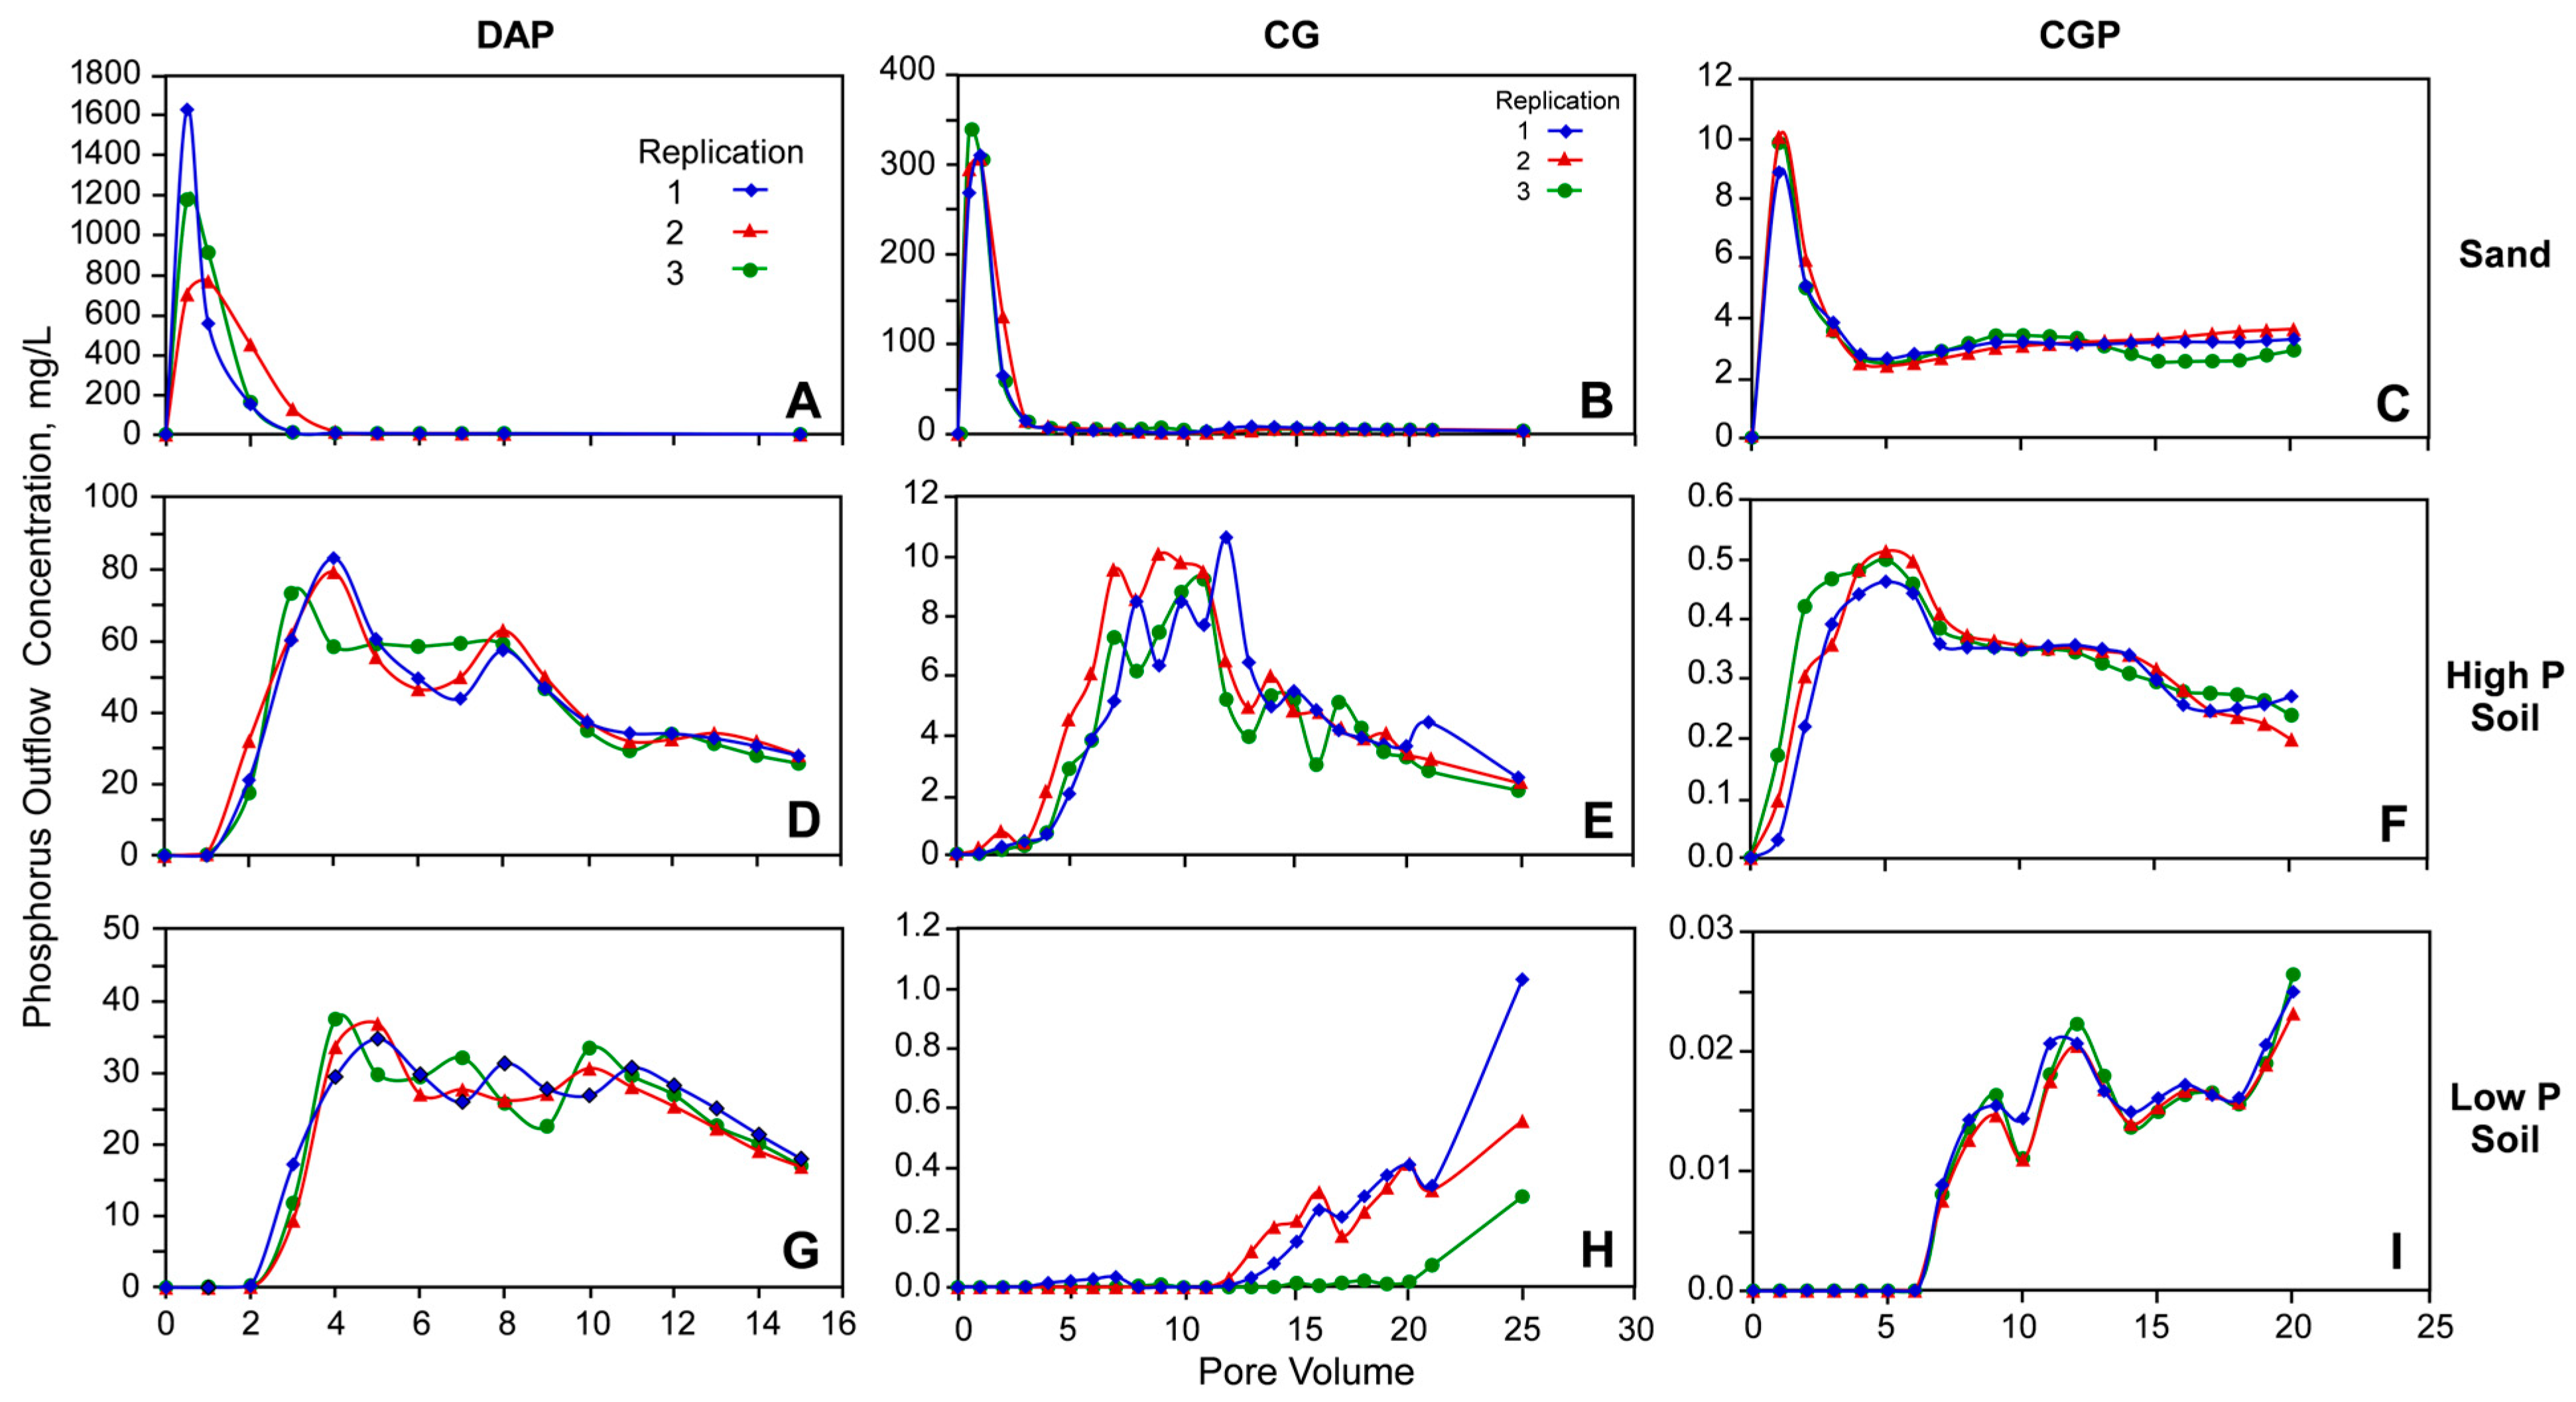
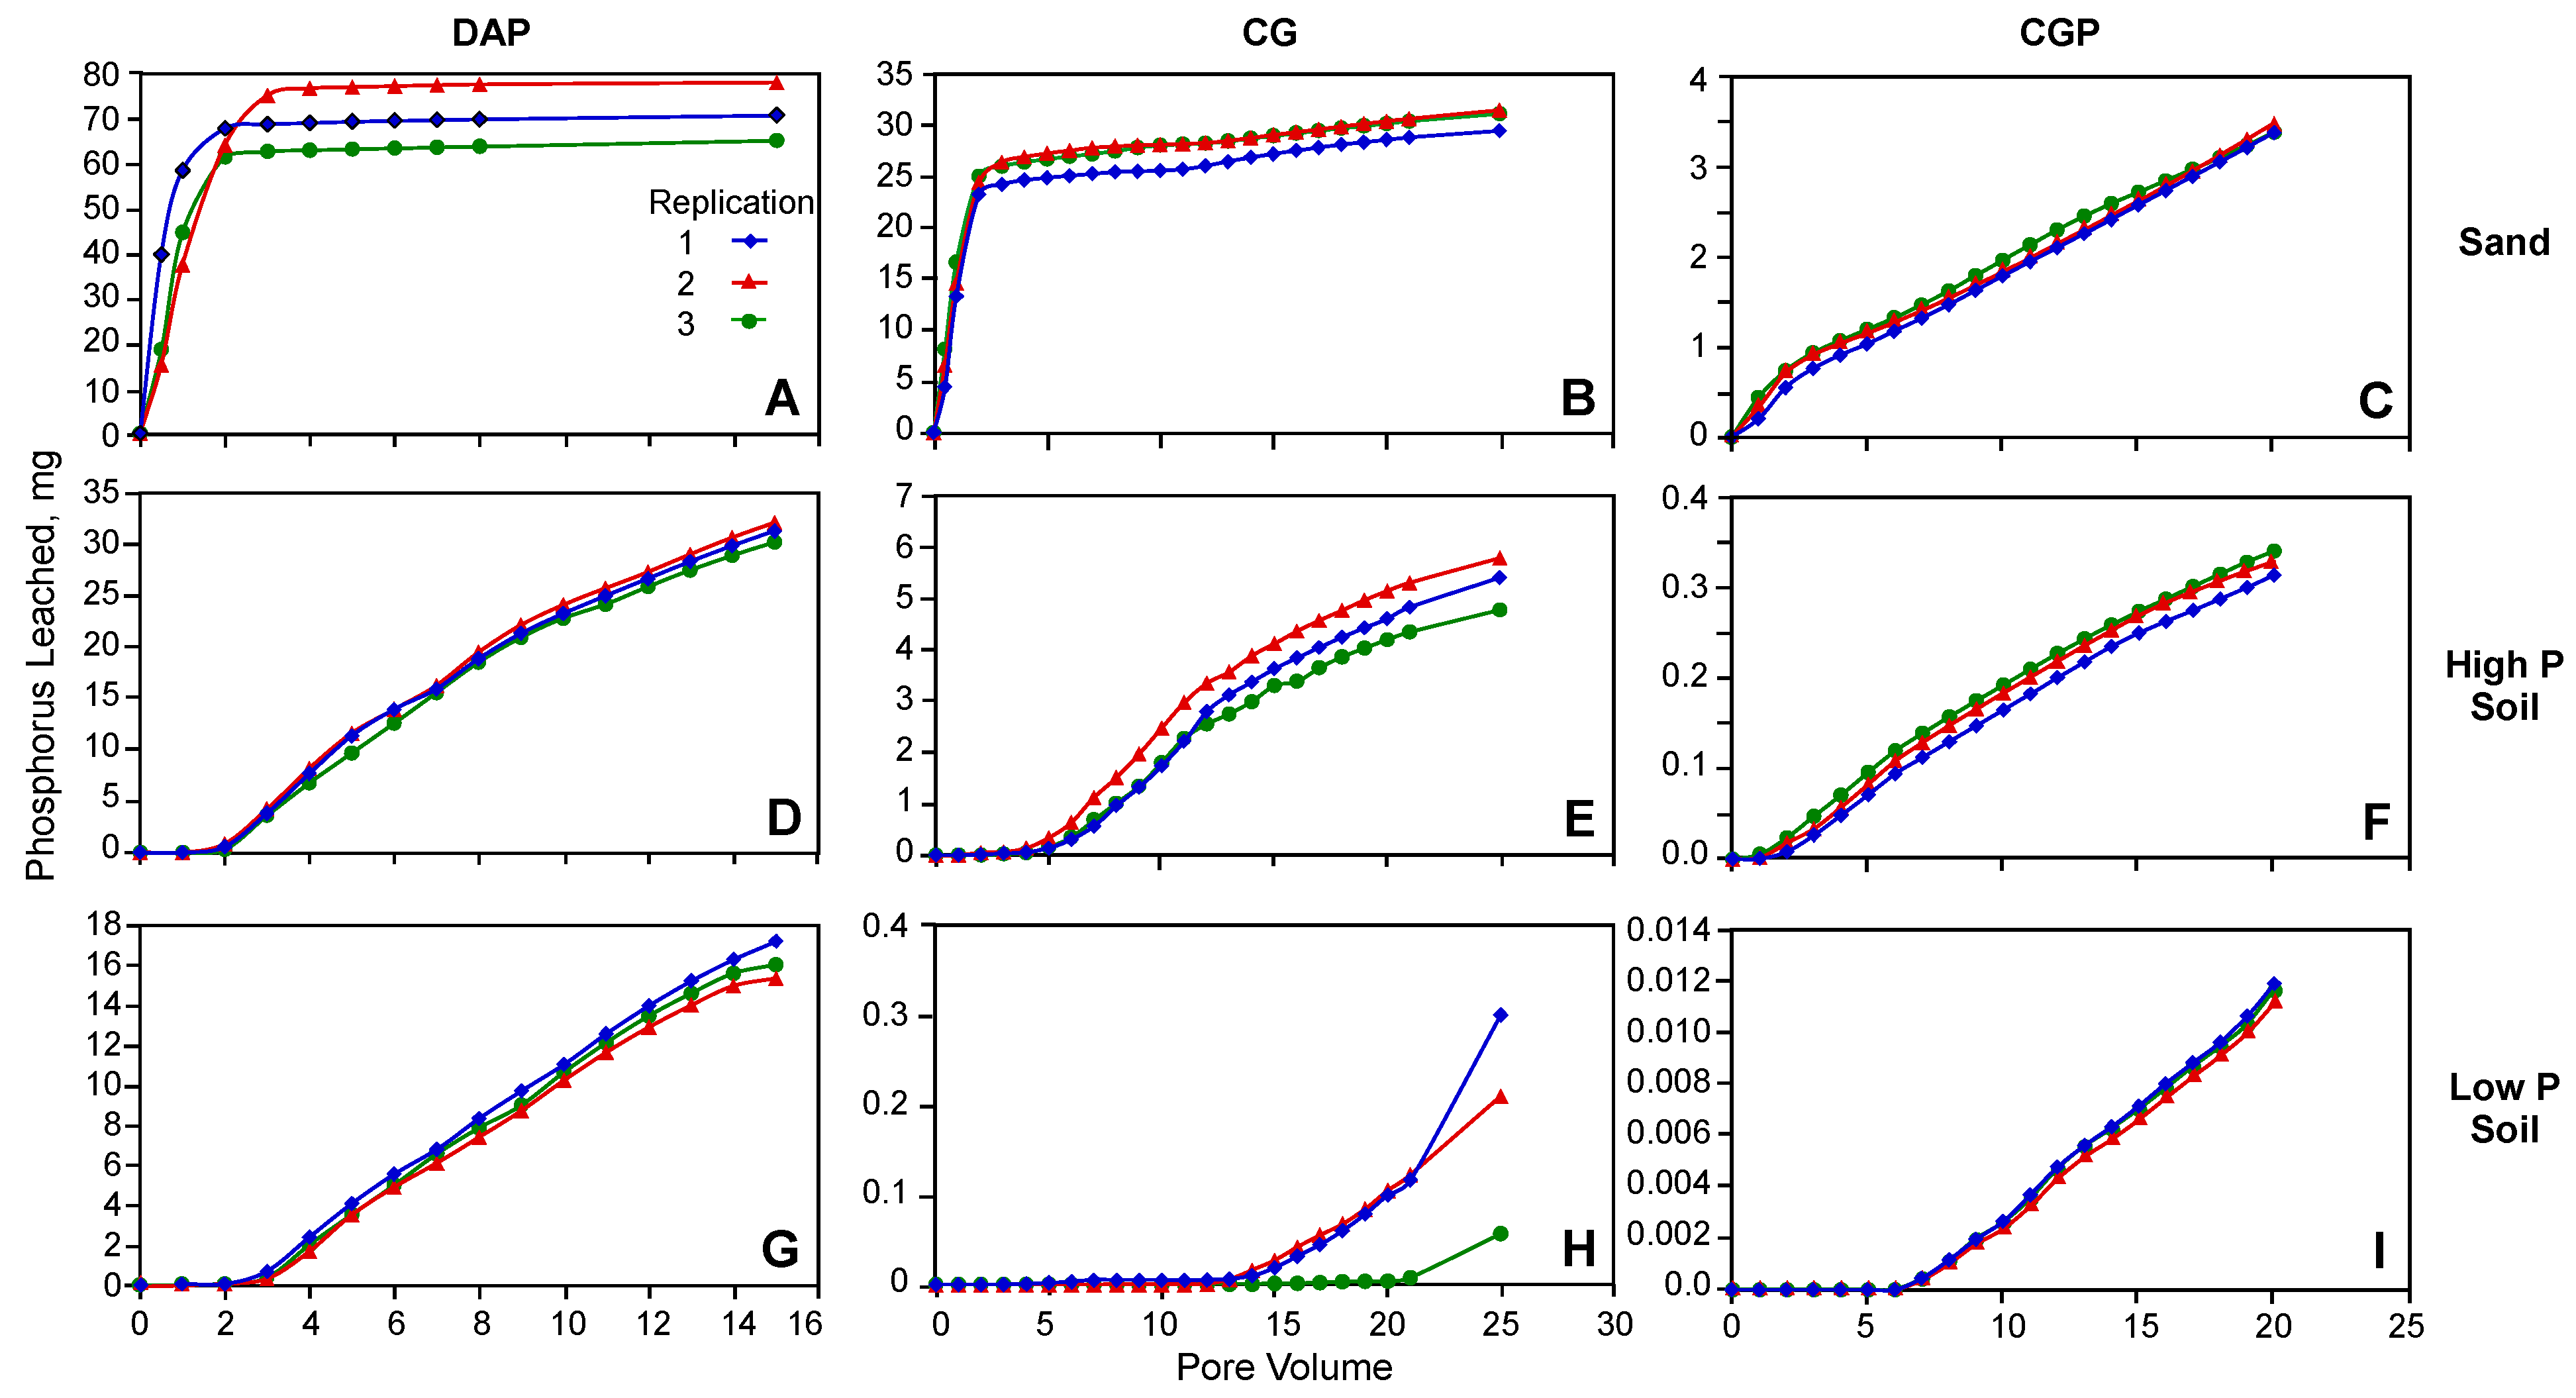
Figure 2 presents the breakthrough curves (outflow concentration vs. pore volume) for the P detected in the outflow solutions, and Figure 3 shows the cumulative amount of P that was transported through the soil columns for all three replications of each soil–fertilizer treatment combination. In agreement with the P dissolution results, there were significant differences in the transport of P from the three fertilizers through the two soils with different P levels and sand.
Since sand adsorbs little to no P, consistent with the dissolution results, almost 91% of the P from the DAP fertilizer grains applied to the sand columns was dissolved and moved through the columns during the first 3–4 PVs (Figure 2A and Figure 3A). Most of the soluble P from CG fertilizer grains was released and transported during the first three PVs, but the amount was significantly less than the P released from DAP (Figure 2B and Figure 3B). Overall, little P was released from the CGP fertilizer grains, but small amounts of P were released with time as water was perfused through the columns continuously for 20 PVs (Figure 2C and Figure 3C). On average for sand columns, 70.2 mg of P was transported from DAP in 8 PVs, approximately 32 mg was transported from CG in 25 PVs, and around 3.4 mg of P from CGP was transported after 20 PVs (Figure 3A–C).
Concentrations of P for DAP treatment in the outflow for the high-P soil started to increase with the second PV and reached the highest value (80–90 mg/L) between 4 and 5 PVs (Figure 2D). Then, the concentration declined and reached about 27 mg/L by around 14–15 PVs. For the low-P soil, on the other hand, the outflow P concentration started to increase around the third PV and reached a maximum concentration of approximately 40 mg/L at around 4 PV before declining gradually to around 20 mg/L at 14–15 PVs (Figure 2G). The initial rapid increase followed by a reduction in P concentration in the outflow, similar to the Li et al. [74] results, were due to the high solubility of P in DAP fertilizer where significant amount of P is available for transport shortly after the soil environment around the fertilizer grains becomes saturated (see [75]).
The total amount of P transported from DAP through the high-P soil after 15 PVs (≈ 32 mg) was approximately twice as much as the amount transported through the low-P soil (≈16.2 mg) (Figure 3D,G). The significantly different results clearly indicate that the soil from the field that had not received P fertilizer retained more of the P released from the fertilizer than the high-P soil (also see Table 2). These results are consistent with the finding of other studies that P leaching (opposite of P retention) through soil depends on the antecedent P content of the soil [69,73,76,77]. Based on our results, we should also note that the high-P soil, which has received P fertilizer for about 40 years, has an appreciable capacity to retain P, which indicates potential low-P fertilizer efficiency even in soil with significant amounts of legacy P.
Similar results, but at much lower transport, were observed for CG fertilizer. The average concentration of P in the outflow for the high-P soil peaked at approximately 9 mg/L between 7 and 12 PVs and gradually declined and reached 2 mg/L around 25 PVs, as shown in Figure 2E. The cumulative amount of P transported through the high-P soil increased continuously starting at 5 PVs and reached an average of 5.9 mg at 25 PV. The low-P soil, on the other hand, retained almost all the P that was released from the fertilizer grains during the first 12 PVs (Figure 2H). The concentration of P in the outflow started to gradually increase after 15 PVs but reached only an average of 0.6 mg/L at 25 PV. The average cumulative amount of P detected in the outflow for the low-P soil was <0.5 mg after 25 PVs of water perfused through the columns (Figure 3H).
Very little P from the CGP fertilizer grains was transported through both high- and low-P soils. The concentration of P in the outflow for high-P soil reached a peak of 0.5 mg/L around the fifth PV and declined to approximately 0.3 mg/L at 20 PV (Figure 2F). The highest outflow concentration of P for the low-P soil was < 0.03 mg/L (Figure 2I) during 20 PVs of water passing through the low-P soil columns (Figure 2I). The total amount of P transported through the high- and low-P soils were <0.4 and <0.03 mg, respectively (Figure 3F,I).
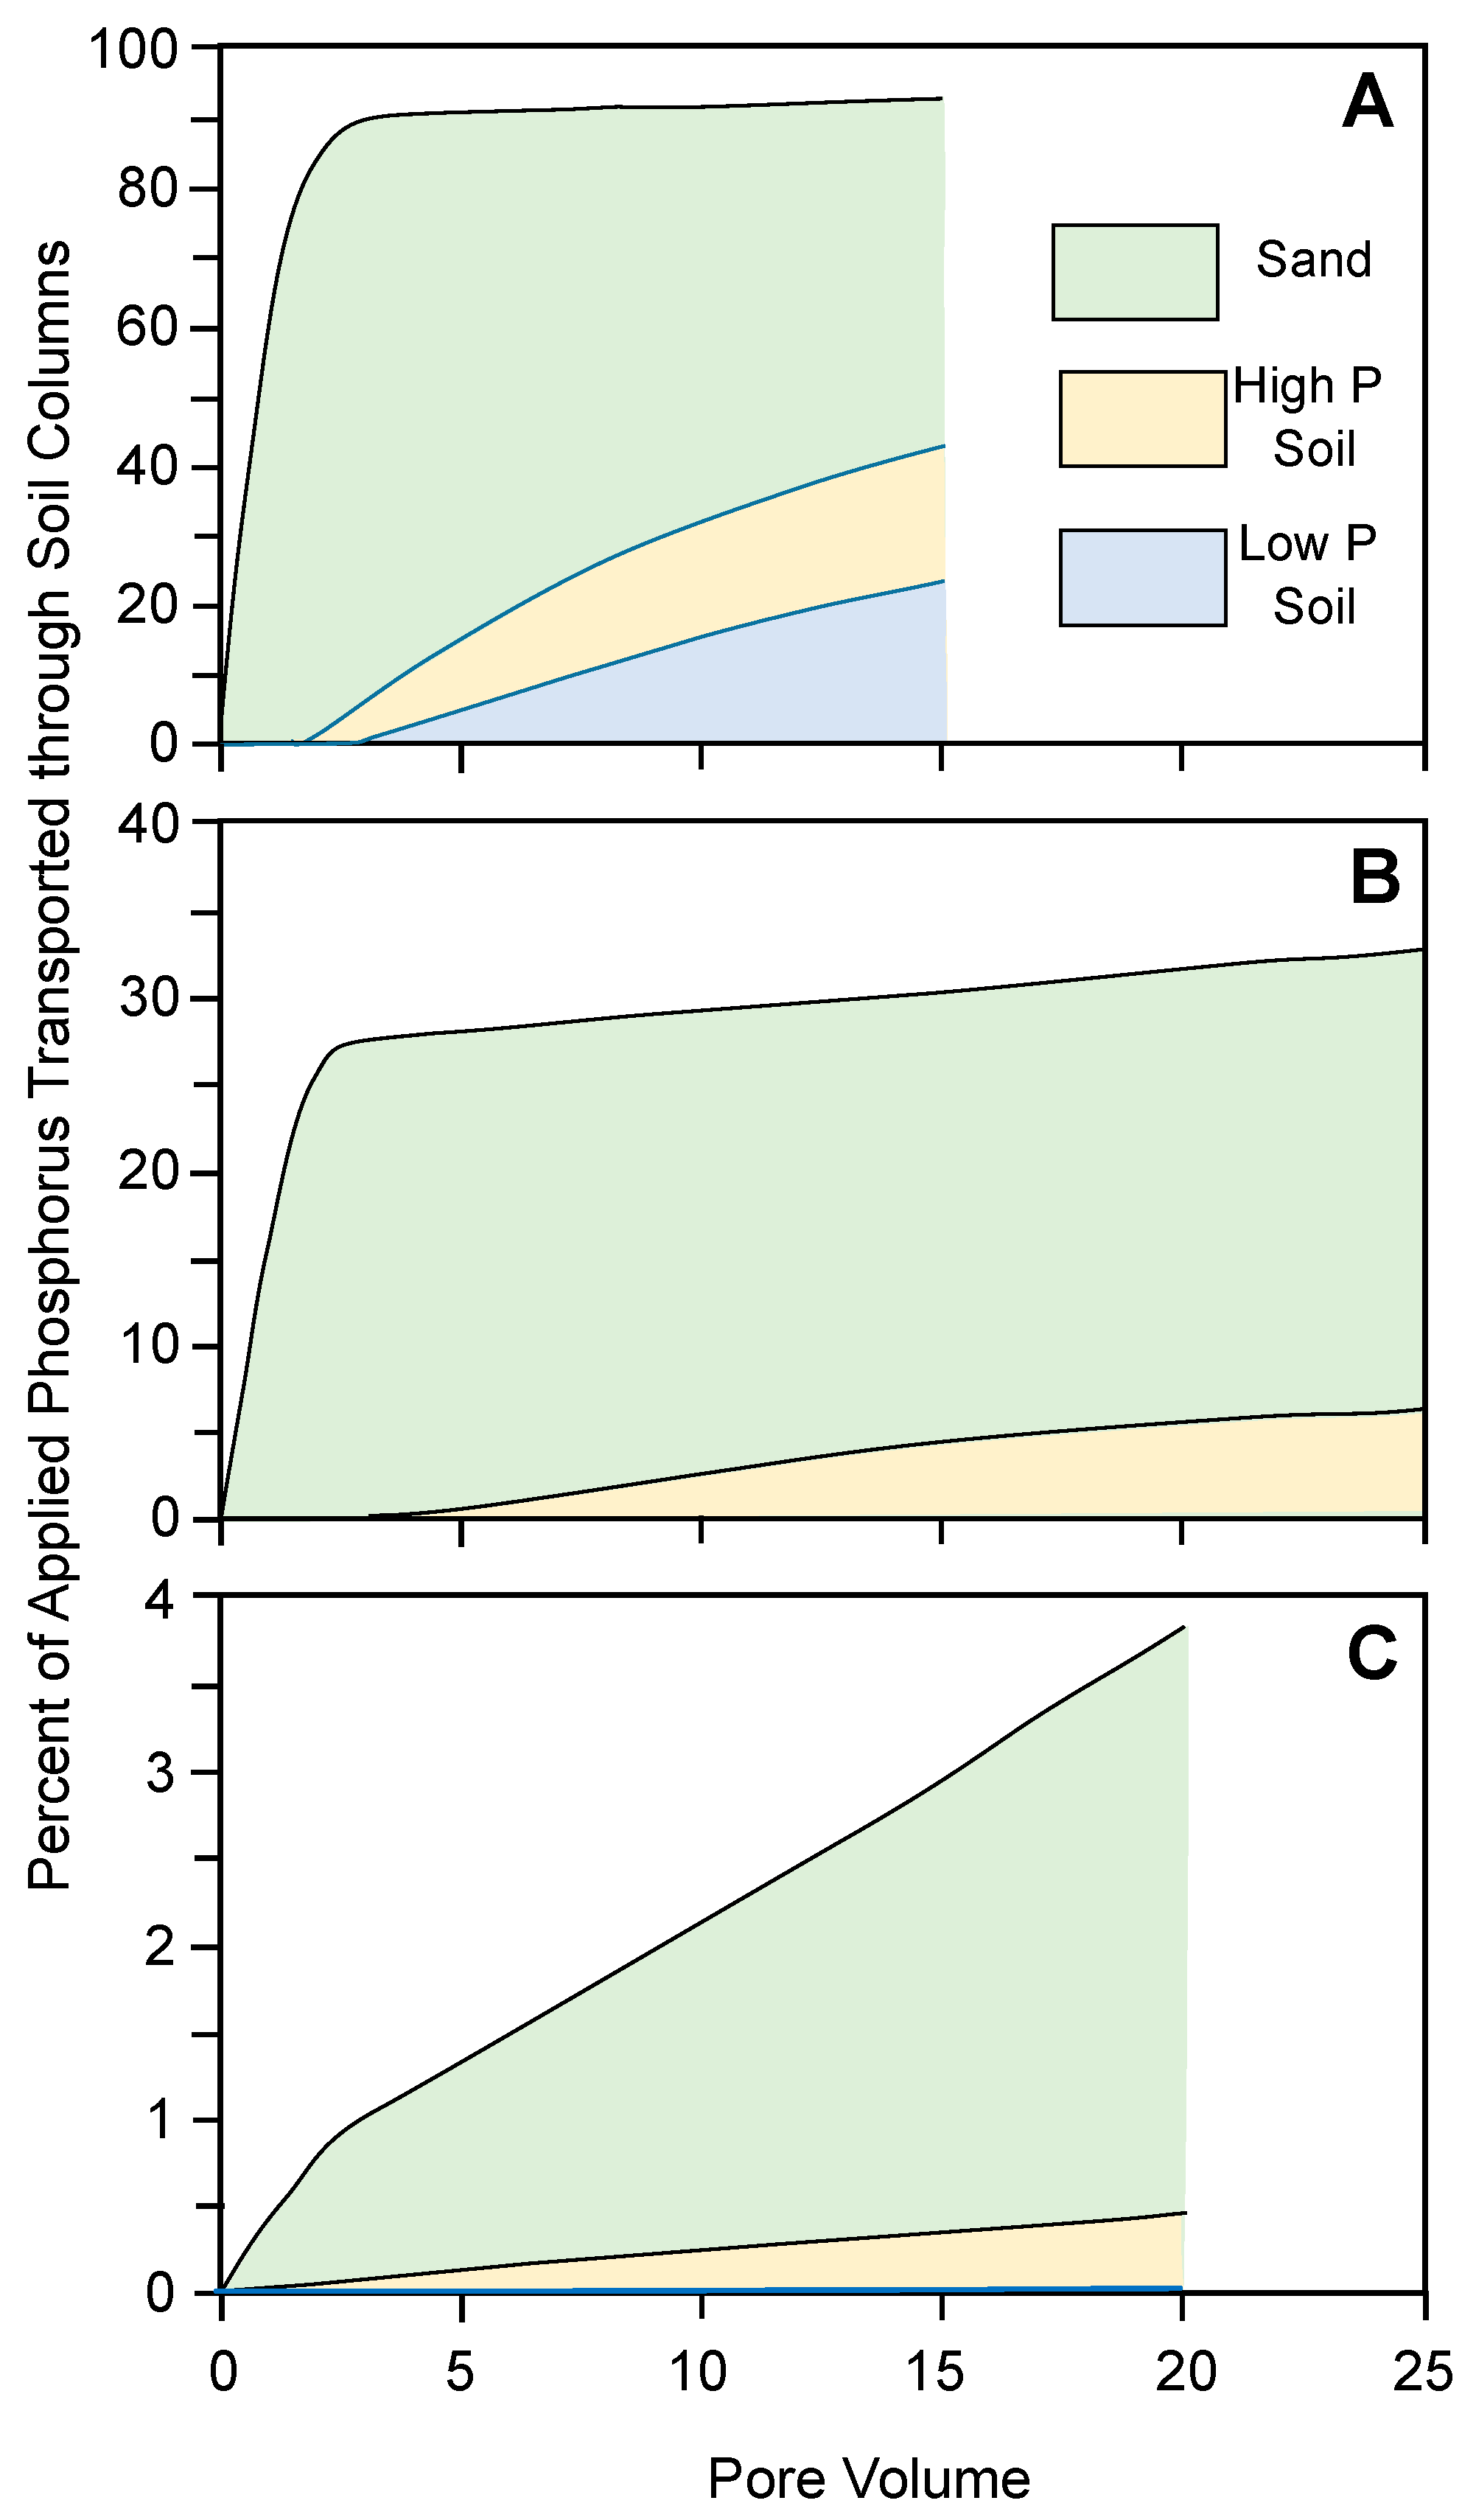
The cumulative amount of P, expressed as percent of the total P detected for each column, transported through the two soils and sand from the three fertilizers are shown in Figure 4. The percentages of P transported from the three fertilizers through sand were significantly different from each other at each of 5, 10, and 15 PVs (p < 0.05). There were significant differences (p < 0.05) in total P transported from DAP compared to the other two fertilizers through either the high- or low-P soils. Overall, very little P from CGP was transported out of the soil columns. In general, the total amount of P transported through each of the two soils and sand was significantly higher for DAP. The total amount of P transported from CG was also significantly higher than the amount transported from CGP for each of the soils and the sand.

4. Summary and Conclusions

A column study was conducted to evaluate transport of P from three different fertilizers, DAP, CG, and CGP, through two similar loamy soils with a relatively high and low P content and pure sand as control. Soil materials were packed uniformly to a depth of 5 cm in 5 cm diameter columns. Grains of fertilizer containing approximately 85 mg P from each of the three fertilizers were distributed uniformly at one end of the column. Using a multi-channel peristaltic pump, distilled water was applied at a constant rate to the bottom end of the columns with fertilizer grains, and the outflow was collected from the top end every two hours using a fraction collector. At the termination of the water application, each column was dissected into 1 cm sections and analyzed for total P by nitric acid digestion. Selected outflow samples were analyzed to develop breakthrough curves for each fertilizer–soil combination. The solubility of P from each fertilizer with time was determined in a dissolution study.
More than 90% of P in DAP was dissolved in water in 24 h. The average amount of P dissolved in 72 h was approximately 44.9% for CG and 15.9% for CGP. Overall, the results show the following:
On average, more than 90% of P in DAP was transported through the sand in 8 pore volumes (PVs), while the comparative amounts transported were ≈34% from CG in 25 PVs and ≈3.8% from CGP in 20 PVs.
The amount of P transported from DAP through high-P soil was significantly higher than from the CG and CGP fertilizers. Similar results were obtained for low-P soil.
The amount of P from DAP transported through the high-P soil was significantly higher than the amount transported through low-P soil. Similar results were obtained for both CG and CGP, although the transported amounts were relatively small.
Despite the high-P soil receiving P fertilizer for about 40 years, the results showed a significant capacity of the soil to retain P released from highly soluble DAP and less soluble CG and CGP fertilizers.

Author Contributions

Conceptualization, L.D., J.H., and A.A.; Methodology, L.D., J.H., L.G., and A.A.; Validation, L.D. and A.A.; Formal analysis, L.D., J.H., and A.A.; Investigation, L.D., J.H., and A.A.; Resources, L.G. and A.A.; Data curation, L.D., L.G., and A.A.; Writing—original draft, L.D. and A.A.; Writing—review and editing, L.D., J.H., L.G., and A.A.; Supervision, A.A.; Project administration, J.H. and A.A.; Funding acquisition, J.H. and A.A. All authors have read and agreed to the published version of the manuscript.

Funding

This research was funded by the NSF EAR Award No. 1757699 and North Carolina Agricultural Research Service (NCARS), NC State University. The use of trade names in this publication does not imply endorsement by the NCARS and NSF of the products named or criticism of similar ones not mentioned.

Data Availability Statement

Data are available by request from the corresponding author.

Acknowledgments

This research was supported by the NSF EAR Award No. 1757699 and North Carolina Agricultural Research Service (NCARS), NC State University. The use of trade names in this publication does not imply endorsement by the NCARS and NSF of the products named or criticism of similar ones not mentioned.

Conflicts of Interest

The authors declare no conflicts of interest.

References

  1. Havlin, J.L.; Tisdale, S.L.; Nelson, W.L.; Beaton, J.D. Soil Fertility and Fertilizers—An Introduction to Nutrient Management, 8th ed.; Pearson: Boston, MA, USA, 2014. [Google Scholar]
  2. Soares, J.H., Jr. Phosphorus bioavailability. In Bioavailability of Nutrients for Animals: Amino Acids, Minerals; Ammerman, C.B., Baker, D.H., Lewis, A.J., Eds.; Academic Press: Cambridge, MA, USA, 1995; pp. 257–294. [Google Scholar] [CrossRef]
  3. Veum, T.L. Phosphorus and calcium nutrition and metabolism. In Phosphorus and Calcium Utilization and Requirements in Farm Animals; Vitti, D.M.S.S., Kebreab, E., Eds.; CAB International: Wallingford, UK, 2010; pp. 94–111. [Google Scholar] [CrossRef]
  4. Buol, S.W.; Suthard, R.J.; Graham, R.C.; McDaniel, P.A. Soil Genesis and Classification, 6th ed.; Wiley-Blackwall: Ames, IA, USA, 2011. [Google Scholar]
  5. Paz-Ares, J.; Puga, M.I.; Rojas-Triana, M.; Martinez-Hevia, I.; Diaz, S.; Poza-Carrión, C.; Miñambres, M.; Leyva, A. Plant adaptation to low phosphorus availability: Core signaling, crosstalks, and applied implications. Mol. Plant 2022, 15, 104–124. [Google Scholar] [CrossRef]
  6. Pierzynski, G.M.; McDowell, R.W.; Sims, J.T. Chemistry, cycling, and potential movement of inorganic phosphorus in soils. In Phosphorus: Agriculture and the Environment; Sims, J.T., Sharpley, A.N., Eds.; Agronomy Series No. 46; American Society of Agronomy: Madison, WI, USA, 2005; pp. 51–86. [Google Scholar] [CrossRef]
  7. Ashley, K.; Cordell, D.; Mavinic, D. A brief history of phosphorus: From the philosopher’s stone to nutrient recovery and reuse. Chemosphere 2011, 84, 737–746. [Google Scholar] [CrossRef]
  8. Filippelli, G.M. Phosphate rock formation and marine phosphorus geochemistry: The deep time perspective. Chemosphere 2011, 84, 759–766. [Google Scholar] [CrossRef]
  9. Edixhoven, J.D.; Gupta, J.; Savenije, H.H.G. Recent revisions of phosphate rock reserves and resources: A critique. Earth Syst. Dynam. 2014, 5, 491–507. [Google Scholar] [CrossRef]
  10. Elser, J.; Bennett, E. A broken biogeochemical cycle. Nature 2011, 478, 29–31. [Google Scholar] [CrossRef]
  11. Kumar, V.; Chopra, A.K.; Kumar, A. A review on sewage sludge (biosolids) a resource for sustainable agriculture. Arch. Agric. Environ. Sci. 2017, 2, 340–347. [Google Scholar] [CrossRef]
  12. Lu, Q.; He, Z.L.; Stoffella, P.J. Land application of biosolids in the USA: A review. Appl. Environ. Soil Sci. 2012, 2012, 201462. [Google Scholar] [CrossRef]
  13. Clarke, B.O.; Smith, S.R. Review of ‘emerging’ organic contaminants in biosolids and assessment of international research priorities for the agricultural use of biosolids. Environ. Int. 2011, 37, 226–247. [Google Scholar] [CrossRef]
  14. Pepper, I.L.; Brusseau, M.L.; Prevatt, F.J.; Escobar, B.A. Incidence of Pfas in soil following long-term application of class B biosolids. Sci. Total Environ. 2021, 793, 148449. [Google Scholar] [CrossRef] [PubMed]
  15. Pozzebon, E.A.; Seifert, L. Emerging environmental health risks associated with the land application of biosolids: A scoping review. Environ. Health 2017, 22, 57. [Google Scholar] [CrossRef]
  16. Cordell, D.; Drangert, J.; White, S. The story of phosphorus: Global food security and food for thought. Glob. Environ. Change 2009, 19, 292–305. [Google Scholar] [CrossRef]
  17. Rich Earth Institute. Fertilizer from Urine, Clean Rivers, Sustainable Farms. 2024. Available online: https://richearthinstitute.org/ (accessed on 7 October 2025).
  18. Maurer, M.; Pronk, W.; Larsen, T.A. Treatment processes for source-separated urine. Water Res. 2006, 40, 3151–3166. [Google Scholar] [CrossRef]
  19. O’Neal, J.A.; Boyer, T.H. Phosphate recovery using hybrid anion exchange: Applications to source-separated urine and combined wastewater streams. Water Res. 2013, 47, 5003–5017. [Google Scholar] [CrossRef] [PubMed]
  20. Sendrowski, A.; Boyer, T.H. Phosphate removal from urine using hybrid anion exchange resin. Desalination 2013, 322, 104–112. [Google Scholar] [CrossRef]
  21. Boyer, T.H.; Saetta, D. Opportunities for building-scale urine diversion and challenges for implementation. Acc. Chem. Res. 2019, 52, 886–895. [Google Scholar] [CrossRef] [PubMed]
  22. Egle, L.; Rechberger, H.; Zessner, M. Overview and description of technologies for recovering phosphorus from municipal wastewater. Resour. Conserv. Recycl. 2015, 105, 325–346. [Google Scholar] [CrossRef]
  23. Forrest, A.L.; Fattah, K.P.; Mavinicm, D.S.; Koch, F.A. Optimizing Struvite Production for Phosphate Recovery in WWTP. J. Environ. Eng. 2008, 134, 395–402. [Google Scholar] [CrossRef]
  24. Pérez-Piqueres, A.; Ribó, M.; Rodríguez-Carretero, I.; Quiñones, A.; Canet, R. Struvite as a Sustainable Fertilizer in Mediterranean Soils. Agronomy 2023, 13, 1391. [Google Scholar] [CrossRef]
  25. Achilleos, P.; Roberts, K.R.; Williams, I.D. Struvite precipitation within wastewater treatment: A problem or a circular economy opportunity? Heliyon 2022, 8, e09862. [Google Scholar] [CrossRef]
  26. Carrillo, V.; Castillo, R.; Magrí, A.; Holzapfel, E.; Vidal, G. Phosphorus recovery from domestic wastewater: A review of the institutional framework. J. Environ. Manage. 2024, 351, 119812. [Google Scholar] [CrossRef]
  27. de Boer, M.A.; Romeo-Hall, A.G.; Rooimans, T.M.; Slootweg, J.C. An assessment of the drivers and barriers for the deployment of urban phosphorus recovery technologies: A case study of the Netherlands. Sustainability 2018, 10, 1790. [Google Scholar] [CrossRef]
  28. Smil, V. Phosphorus in the environment: Natural flows and human interferences. Ann. Rev. Energy Environ. 2000, 25, 53–88. [Google Scholar] [CrossRef]
  29. Barrow, N.J.; Debnath, A.; Sen, A. Investigating the dissolution of soil phosphate. Plant Soil 2023, 490, 591–599. [Google Scholar] [CrossRef]
  30. Syers, J.K.; Johnston, A.E.; Curtin, D. Efficiency of Soil Fertilizer Phosphorus Use: Reconciling Changing Concepts of Soil Phosphorus Behavior with Agronomic Information. FAO Fertilizer and Plant Nutrition Bulletin No. 18. 2008. Food and Agriculture Organization of the United Nations, Rome. Available online: http://www.fao.org/docrep/010/a1595e/a1595e00.htm (accessed on 7 October 2025).
  31. Kile, L.K.; Gatiboni, L.; Osmond, D.L.; Marshall, A.; Johnson, A.; Duckworth, O.W. Why does overapplication of phosphorus fertilizers occur: Insights from North Carolina farmers. Agriculture 2025, 15, 606. [Google Scholar] [CrossRef]
  32. Liu, P.; Yan, H.; Xu, S.; Lin, X.; Wang, W.; Wang, D. Moderately deep banding of phosphorus enhanced winter wheat yield by improving phosphorus availability, root spatial distribution, and growth. Soil Till. Res. 2022, 220, 105388. [Google Scholar] [CrossRef]
  33. Meyer, G.; Bell, M.J.; Kopittke, P.M.; Lombi, E.; Doolette, C.L.; Brunetti, G.; Klysubun, W.; Janke, C.K. Mobility and lability of phosphorus from highly concentrated fertiliser bands. Geoderma 2023, 429, 116248. [Google Scholar] [CrossRef]
  34. Randall, G.W.; Hoeft, R.G. Placement methods for improved efficiency of P and K fertilizers: A review. J. Prod. Agric. 1988, 1, 70–79. [Google Scholar] [CrossRef]
  35. Fertahi, S.; Bertrand, I.; Ilsouk, M.; Oukarroum, A.; Amjoud, M.B.; Zeroual, Y.; Barakat, A. New generation of controlled release phosphorus fertilizers based on biological macromolecules: Effect of formulation properties on phosphorus release. Int. J. Bio. Macromol. 2020, 143, 153–162. [Google Scholar] [CrossRef] [PubMed]
  36. Weeks, J.J.; Hettiarachchi, G.M. A review of the latest in phosphorus fertilizer technology: Possibilities and pragmatism. J. Environ. Qual. 2019, 48, 1300–1313. [Google Scholar] [CrossRef] [PubMed]
  37. Sharma, M.; Pang, J.; Mickan, B.S.; Ryan, M.H.; Jenkins, S.N.; Siddique, K.H.M. Wastewater-derived struvite has the potential to substitute for soluble phosphorus fertiliser for growth of chickpea and wheat. J. Soil Sci. Plant Nutr. 2024, 24, 3011–3025. [Google Scholar] [CrossRef]
  38. Talboys, P.J.; Heppell, J.; Roose, T.; Healey, J.R.; Jones, D.L.; Withers, P.J.A. Struvite: A slow-release fertiliser for sustainable phosphorus management? Plant Soil 2016, 401, 109–123. [Google Scholar] [CrossRef]
  39. Wang, C.; Lv, J.; Xie, J.; Yu, J.; Li, J.; Zhang, J.; Tang, C.; Niu, T.; Patience, B.E. Effect of slow-release fertilizer on soil fertility and growth and quality of wintering Chinese chives (Allium tuberm Rottler ex Spreng.) in greenhouses. Sci. Rep. 2021, 11, 8070. [Google Scholar] [CrossRef] [PubMed]
  40. Ackerman, J.N.; Zvomuya, F.; Cicek, N.; Flaten, D. Evaluation of manure-derived struvite as a phosphorus source for canola. Can. J. Plant Sci. 2013, 933, 419–424. [Google Scholar] [CrossRef]
  41. Shanmugavel, D.; Rusyn, I.; Solorza-Feria, O.; Kamaraj, S.-K. Sustainable SMART fertilizers in agriculture systems: A review on fundamentals to in-field applications. Sci. Total Environ. 2023, 904, 166729. [Google Scholar] [CrossRef]
  42. Liu, J.; Hu, Y.; Yang, J.; Abdi, D.; Cade-Menun, B.J. Investigation of soil legacy phosphorus transformation in long-term agricultural fields using sequential fractionation, P K-edge XANES and solution P NMR spectroscopy. Environ. Sci. Tech. 2015, 49, 168–176. [Google Scholar] [CrossRef]
  43. Sharpley, A.; Jarvie, H.P.; Buda, A.; May, L.; Spears, B.; Kleinman, P. Phosphorus legacy: Overcoming the effects of past management practices to mitigate future water quality impairment. J. Environ. Qual. 2013, 42, 1308–1326. [Google Scholar] [CrossRef]
  44. Zhang, T.Q.; MacKenzie, A.F.; Liang, B.C.; Drury, C.F. Soil test phosphorus and phosphorus fractions with long-term phosphorus addition and depletion. Soil Sci. Soc. Am. J. 2004, 68, 519–528. [Google Scholar] [CrossRef]
  45. Carpenter, S.R.; Caraco, N.F.; Correll, D.L.; Howarth, R.W.; Sharpley, A.N.; Smith, V.H. Nonpoint pollution of surface waters with phosphorus and nitrogen. Ecol. Appl. 1998, 8, 559–568. [Google Scholar] [CrossRef]
  46. Motoshit, M.; Komats, T.; Moldrup, P.; De Jonge, L.W.; Ozak, N.; Fukushima, T. Soil constituent facilitated transport of phosphorus from a high-P surface soil. Soils Found. 2003, 43, 105–114. [Google Scholar] [CrossRef] [PubMed]
  47. Sharpley, A.N.; Chapra, S.C.; Wedepohl, R.; Sims, J.T.; Daniel, T.C.; Reddy, K.R. Managing Agricultural Phosphorus for Protection of Surface Waters: Issues and Options. J. Environ. Qual. 1994, 23, 437–451. [Google Scholar] [CrossRef]
  48. VandeVoort, A.R.; Livi, K.J.; Arai, Y. Reaction conditions control soil colloid facilitated phosphorus release in agricultural Ultisols. Geoderma 2013, 206, 101–111. [Google Scholar] [CrossRef]
  49. Dugener, N.M.; Stone, I.P.; Weinke, A.D.; Biddanda, B.A. Out of oxygen: Stratification and loading drove hypoxia during a warm, wet, and productive year in a Great Lakes estuary. J. Great Lakes Res. 2023, 49, 1015–1028. [Google Scholar] [CrossRef]
  50. Kamprath, E.J. Changes in phosphate availability of ultisols with long-term cropping. Commun. Soil Sci. Plant Anal. 1999, 30, 909–919. [Google Scholar] [CrossRef]
  51. Pennock, D.J. Designing field studies in soil science. Can. J. Soil Sci. 2004, 84, 1–10. [Google Scholar] [CrossRef]
  52. Selles, F.; Campbell, C.A.; Zentner, R.P.; Curtin, D.; James, D.C.; Basnyat, P. Phosphorus use efficiency and long-term trends in soil available phosphorus in wheat production systems with and without nitrogen fertilizer. Can. J. Soil Sci. 2011, 91, 39–52. [Google Scholar] [CrossRef]
  53. Lyons, S.E.; Arnall, D.B.; Ashford-Kornburger, D.; Brouder, S.M.; Christian, E.; Dobermann, A.; Haefele, S.M.; Haegele, J.; Helmers, M.J.; Jin, V.L.; et al. Field trial guidelines for evaluating enhanced efficiency fertilizers. Soil Sci. Soc. Am. J. 2025, 89, e20787. [Google Scholar] [CrossRef]
  54. Fageria, N.K.; da Costa, J.G.C. Evaluation of common bean genotypes for phosphorus use efficiency. J. Plant Nutr. 2000, 23, 1145–1152. [Google Scholar] [CrossRef]
  55. Kiani, M.; Ylivainio, K. Methods for testing short- and long-term phosphorus fertilizing efficiency of products with varying solubility. Sci Total Environ. 2024, 922, 170965. [Google Scholar] [CrossRef] [PubMed]
  56. Pauly, D.G.; Nyborg, M.; Malhi, S.S. Controlled-release P fertilizer concept evaluation using growth and P uptake of barley from three soils in a greenhouse. Can. J. Soil Sci. 2002, 82, 201–210. [Google Scholar] [CrossRef]
  57. Lombi, E.; McLaughlin, M.J.; Johnston, C.; Armstrong, R.D.; Holloway, R.E. Mobility, solubility and lability of fluid and granular forms of P fertiliser in calcareous and non-calcareous soils under laboratory conditions. Plant Soil 2005, 269, 25–34. [Google Scholar] [CrossRef]
  58. Lombi, E.; McLaughlin, M.J.; Johnston, C.; Armstrong, R.D.; Holloway, R.E. Mobility and lability of phosphorus from granular and fluid monoammonium phosphate differs in a calcareous soil. Soil Sci. Soc. Am. J. 2004, 68, 682–689. [Google Scholar] [CrossRef]
  59. Pierzynski, J.; Hettiarachchi, G.M. Reactions of phosphorus fertilizers with and without a fertilizer enhancer in three acidic soils with high phosphorus-fixing capacity. Soil Sci. Soc. Am. J. 2018, 82, 1124–1139. [Google Scholar] [CrossRef]
  60. Skaggs, T.D.; Wilson, G.V.; Shouse, P.J.; Leij, F.J. Solute transport: Experimental methods. In Methods of Soil Analysis: Part 4. Physical Methods; Dane, J.H., Topp, G.C., Eds.; SSSA Book Series No. 5; Soil Science Society of America: Madison, WI, USA, 2002; pp. 1381–1402. [Google Scholar]
  61. Abit, S.M.; Vepraskas, M.J.; Duckworth, O.W.; Amoozegar, A. Dissolution of phosphorus into pore-water flowing through an organic soil. Geoderma 2013, 197–198, 51–58. [Google Scholar] [CrossRef]
  62. Kretzschmar, R.; Robarge, W.P.; Amoozegar, A. Influence of natural organic matter on colloid transport through saprolite. Water Resour. Res. 1995, 31, 435–445. [Google Scholar] [CrossRef]
  63. Stall, C.; Amoozegar, A.; Lindbo, D.; Graves, A.; Rashash, D. Transport of E. coli in a sandy soil as impacted by depth to water table. J. Environ. Health 2014, 76, 92–100. [Google Scholar] [PubMed]
  64. Murphy, J.; Riley, J.P. A modified single solution method for the determination of phosphate in natural waters. Anal. Chim. Acta 1962, 27, 31–36. [Google Scholar] [CrossRef]
  65. Morales, N.A.; Gatiboni, L.; Osmond, D.; Vann, R.; Kuleasza, S.; Crozier, C.; Hardy, D. Critical soil test values of phosphorus and potassium for soybean and corn in three long-term trials in North Carolina. Soil Sci. Soc. Am. J. 2023, 87, 278–290. [Google Scholar] [CrossRef]
  66. Gee, G.W.; Or, D. Particle-size analysis. In Methods of Soil Analysis: Part 4. Physical Methods; Dane, J.H., Topp, G.C., Eds.; SSSA Book Series No. 5; Soil Science Society of America: Madison, WI, USA, 2002; pp. 255–293. [Google Scholar]
  67. Flint, A.L.; Flint, L.E. Particle density. In Methods of Soil Analysis, Part 4. Physical Methods; Dane, J.H., Topp, G.C., Eds.; SSSA Book Series No. 5; Soil Science Society of America: Madison, WI, USA, 2002; pp. 229–240. [Google Scholar]
  68. Steel, R.G.D.; Torrie, J.H. Principles and Procedures of Statistics; McGraw-Hill Book Company: New York, NY, USA, 1960. [Google Scholar]
  69. Luo, X.; Elrys, A.H.; Zhang, L.; Ibrahim, M.M.; Liu, Y.; Fu, S.; Yan, J.; Ye, Q.; Wen, D.; Hou, E. The global fate of inorganic phosphorus fertilizers added to terrestrial ecosystems. One Earth 2024, 7, 1402–1413. [Google Scholar] [CrossRef]
  70. King, K.W.; Williams, M.R.; Macrae, M.L.; Fausey, N.R.; Frankenberger, J.; Smith, D.R.; Kleinman, P.J.A.; Brown, L.C. Phosphorus transport in agricultural subsurface drainage: A review. J. Environ. Qual. 2015, 44, 467–485. [Google Scholar] [CrossRef]
  71. Koch, S.; Lederer, H.; Kahle, P.; Lennartz, B. Linking transport pathways and phosphorus distribution in a loamy soil: A case study from a North-Eastern German Stagnosol. Environ. Monit. Assess. 2023, 195, 933. [Google Scholar] [CrossRef]
  72. Reid, D.K.; Ball, B.; Zhang, T.Q. Accounting for the risks of phosphorus losses through tile drains in a phosphorus index. J. Environ. Qual. 2012, 41, 1720–1729. [Google Scholar] [CrossRef] [PubMed]
  73. Gatiboni, L.C.; Schmitt, D.E.; Cassol, P.C.; Comin, J.J.; Heidemann, J.C.; Brunetto, G.; Nicoloso, R.D. Samples disturbance overestimates phosphorus adsorption capacity in soils under long-term application of pig slurry. Arch. Agron. Soil Sci. 2019, 65, 1262–1272. [Google Scholar] [CrossRef]
  74. Li, Y.; Guo, R.; Yang, R.; Wei, H.; Li, Y.; Xiao, H.; Wu, J. Using a simple soil column method to evaluate soil phosphorus leaching risk. Clean Soil Air Water 2013, 41, 1100–1107. [Google Scholar] [CrossRef]
  75. Hedley, M.; McLaughlin, M. Reactions of phosphate fertilizers and by-products in soils. In Phosphorus: Agriculture and the Environment; Sims, J.T., Sharpley, A.N., Eds.; Agronomy Series No. 46; American Society of Agronomy: Madison, WI, USA, 2005; pp. 181–252. [Google Scholar] [CrossRef]
  76. Nigon, L.M.L.; Kaiser, D.E.; Feyereisen, G.W. Influence of soil test phosphorus level and leaching volume on phosphorus leaching. Soil Sci. Soc. Am. J. 2022, 86, 1280–1295. [Google Scholar] [CrossRef]
  77. Toor, G.S.; Sims, J.T. Managing phosphorus leaching in Mid-Atlantic soils: Importance of legacy sources. Vadose Zone J. 2015, 14, 1–12. [Google Scholar] [CrossRef]
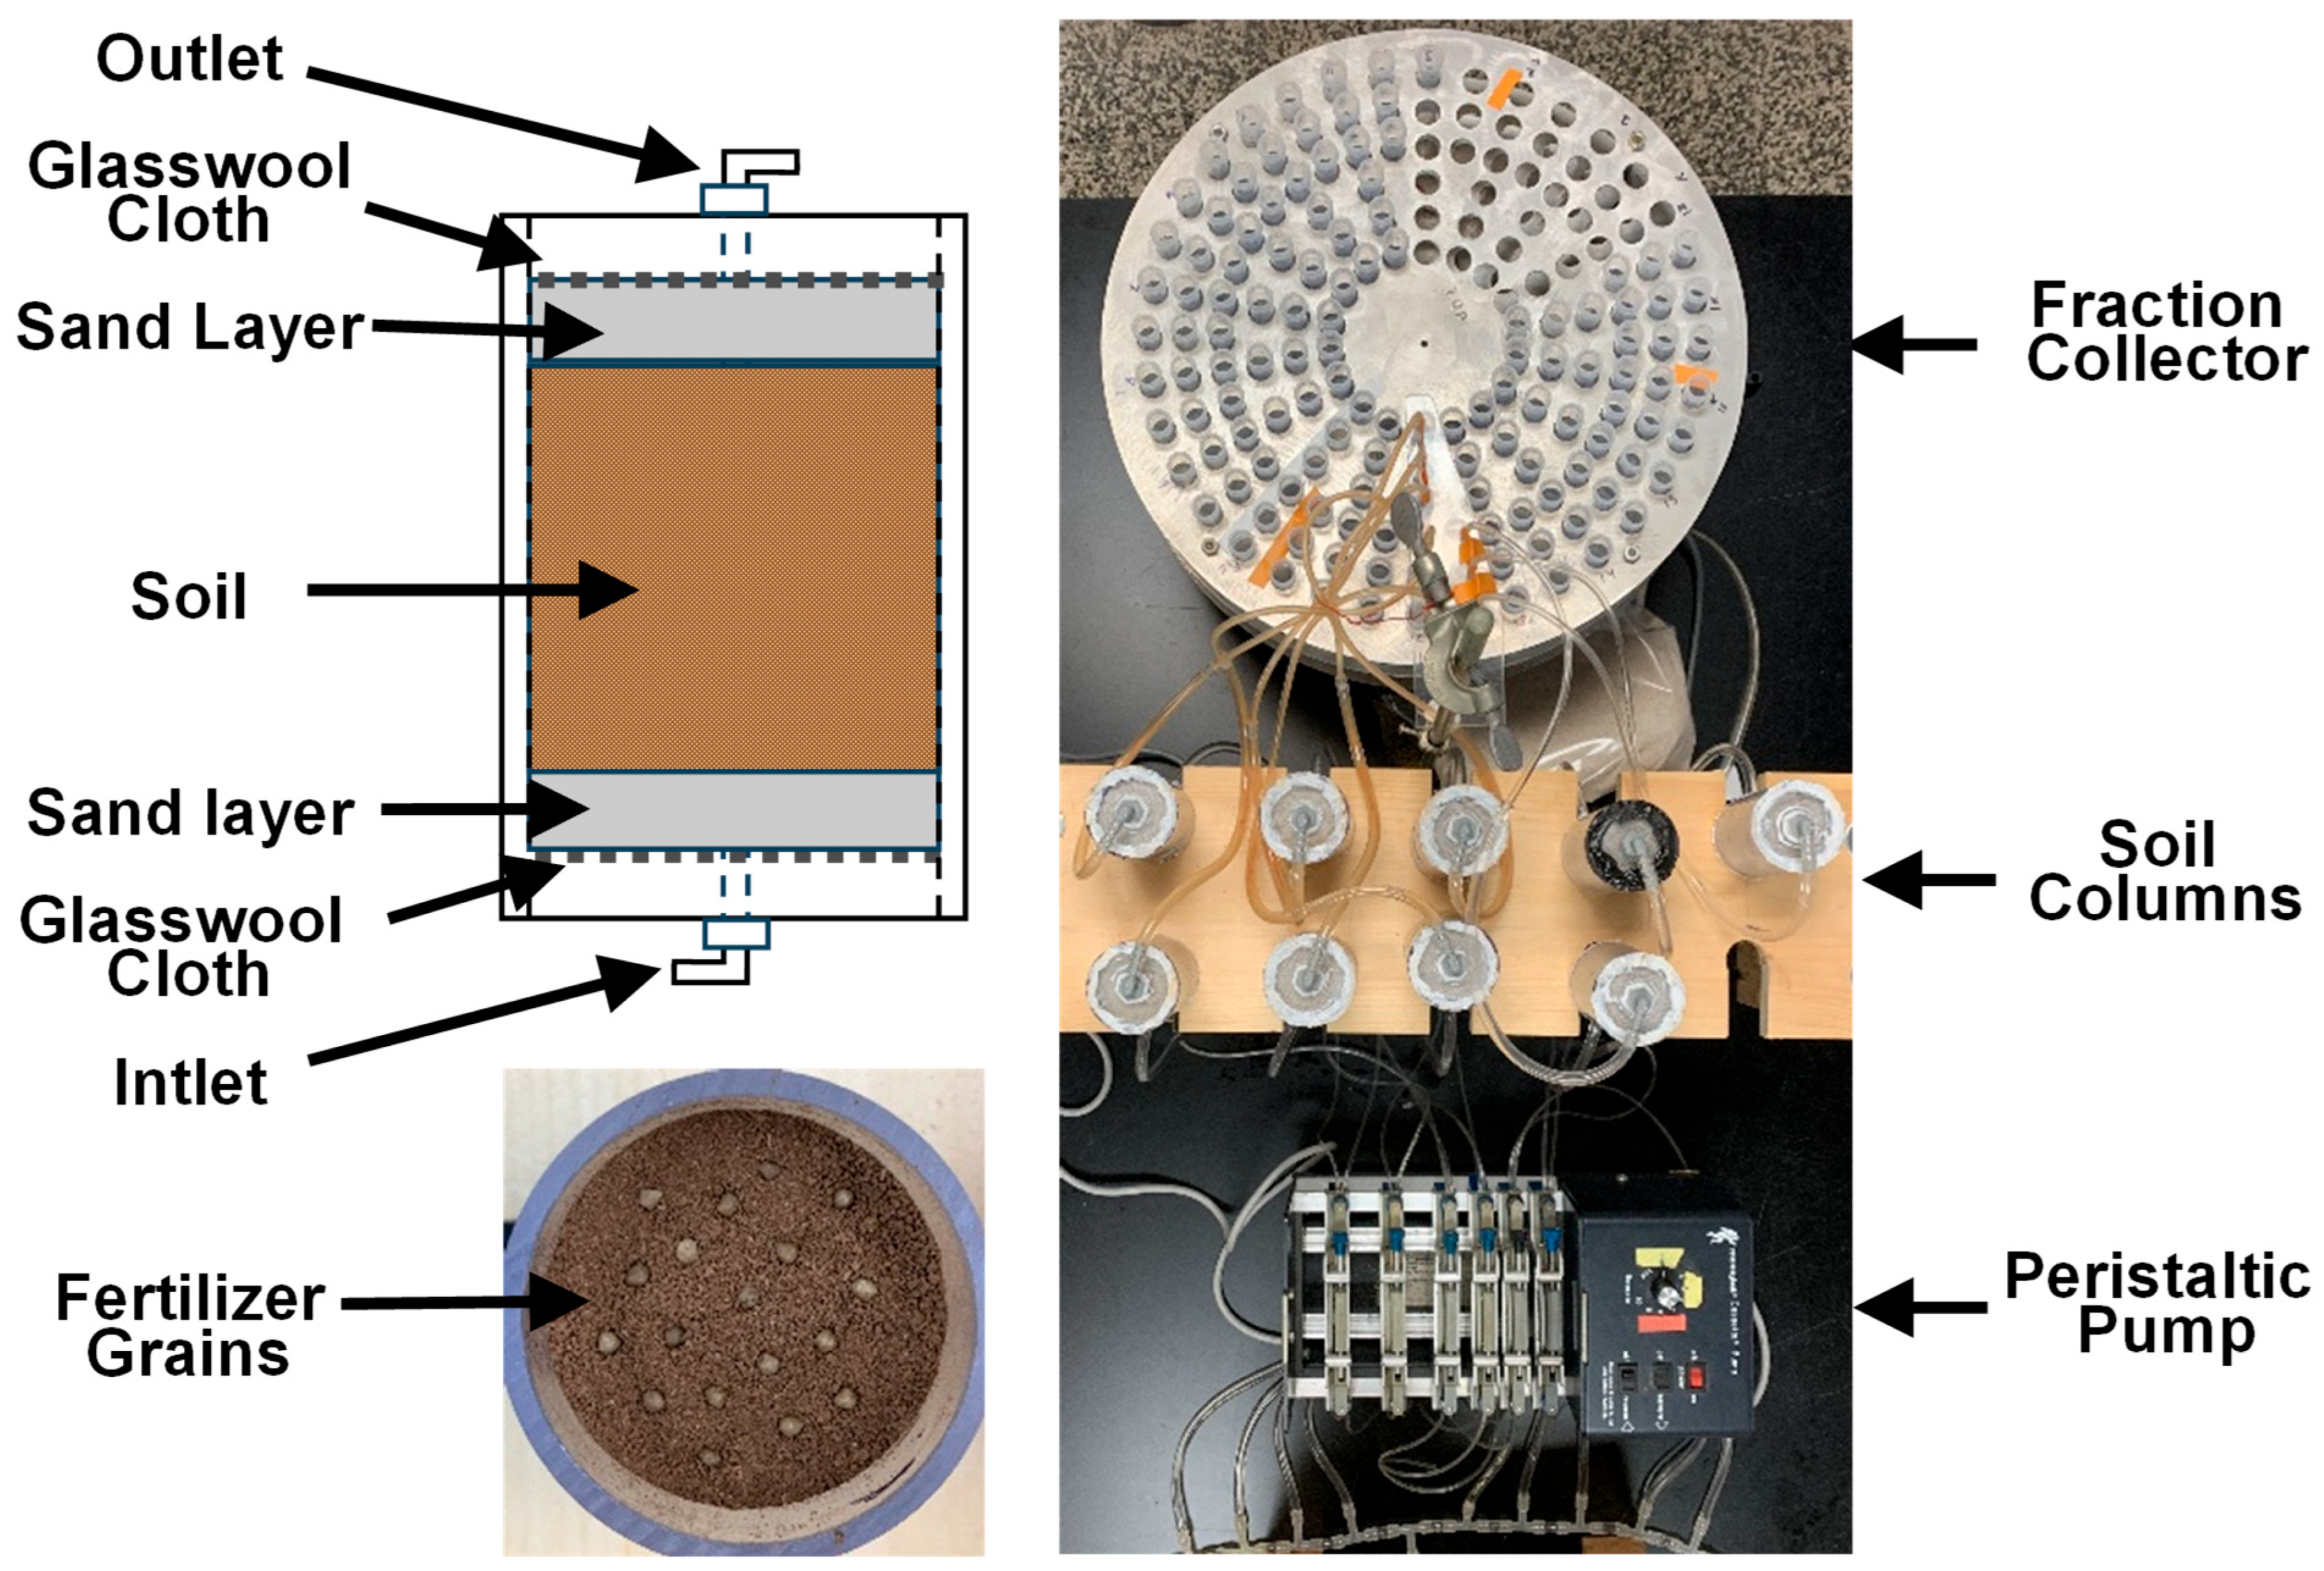
Figure 1. Photograph of the top view of the column experiment, schematic diagram of a vertical cross-sectional area of the columns, and a photograph of the fertilizer grains applied to the bottom of a column.
Agronomy 15 02395 g001
Figure 2. Breakthrough for transport of P from diammonium phosphate (DAP), Crystal Green (CG), and Crystal Green Pearl (CGP) through pure sand (A, B, and C, respectively), high-P loam soil (D, E, and F, respectively), and low-P loam soil (G, H, and I, respectively). The concentrations of P at 15 PV for DAP in the sand columns were determined by extrapolation. Note that y-axes are scaled separately for each panel, and that x-axis scales differ in each column of panels.
Agronomy 15 02395 g002
Figure 3. Cumulative P transport from diammonium phosphate (DAP), Crystal Green (CG), and Crystal Green Pearl (CGP) through pure sand (A, B, and C, respectively), high-P loam soil (D, E, and F, respectively), and low-P loam soil (G, H, and I, respectively). The total amounts of P at 15 PV for DAP in the sand columns were determined by extrapolation. Note that y-axes are scaled differently for each panel, and that x-axis scales differ in each column of panels.
Agronomy 15 02395 g003
Figure 4. The average total amounts of P transported from DAP (A), CG (B), and CGP (C) in sand and two soils as a function of pore volume (PV). The average amount of P at 15 PV for DAP in the sand columns was determined by extrapolation.
Agronomy 15 02395 g004
Table 1. Selected physical and chemical properties of the high- and low-P soils used in the study .
P Content
TexturalParticle BaseHumicWater
SoilSandSiltClayClassDensitypHCECSaturationMatterExtractableMehlich IIITotal
% g/cm3cmol+/kg%%mg/kg
High P40.635.923.5loam2.616.29.5850.410.0150.01133
Low P43.734.621.7loam2.596.210.1860.270.012.6665
Particle size analysis by pipette method; pH, CEC, Base Saturation, Humic Matter, and Mehlich III P analyses by Agronomic Division, NC Department of Agriculture and Consumer Services; total P analysis by Midwestern Laboratories, Inc. (Omaha, NE, USA).
Table 2. Mean and standard deviation (StdDev) for the amount of phosphorus (P) retained in the columns as a percentage of measured total P from fertilizers detected in outflow and in the soil.
DAPCGCGP
SoilMeanStdDevMeanStdDevMeanStdDev
Sand9.021.6966.453.0096.170.50
High P57.795.0693.620.3799.600.16
Low P77.622.3099.410.2999.970.01
DAP—diammonium phosphate. CG—Crystal Green. CGP—Crystal Green Pearl.
Disclaimer/Publisher’s Note: The statements, opinions and data contained in all publications are solely those of the individual author(s) and contributor(s) and not of MDPI and/or the editor(s). MDPI and/or the editor(s) disclaim responsibility for any injury to people or property resulting from any ideas, methods, instructions or products referred to in the content.