Article

Discrete Meta-Modeling and Parameter Calibration of Harvested Alfalfa Stalks

1
College of Intelligent Manufacturing, Longdong University, Qingyang 745000, China
2
College of Mechanical and Electrical Engineering, Gansu Agricultural University, Lanzhou 730070, China
3
Gansu Provincial Agricultural Mechanization Technology Extension Station, Lanzhou 730070, China
*
Author to whom correspondence should be addressed.
Agronomy 2025, 15(10), 2390; https://doi.org/10.3390/agronomy15102390
Submission received: 15 August 2025 / Revised: 30 September 2025 / Accepted: 9 October 2025 / Published: 15 October 2025
(This article belongs to the Section Precision and Digital Agriculture)

Abstract

Addressing the problem of lacking accurate and reliable contact parameters and bonding parameters in the simulation of the mashing process during the harvesting of alfalfa, this study takes the stems of alfalfa at the harvesting stage as the research object. The geometric dimensions and related intrinsic parameters of the stems were measured. Using the Enhanced Discrete Element Method (EDEM) software, a multi-scale discrete element flexible bonding model of alfalfa stems was established based on region-specific parameters. The entire alfalfa stem was divided into three parts: the top, middle, and root sections. A multi-scale particle aggregation model of hollow stems was created using the Hertz-Mindlin with bonding model. The contact parameters between alfalfa stems at the harvesting stage and PU rubber were determined using a mathematical model based on quadratic polynomial fitting curves. The results showed that the shear modulus of the top, middle, and root sections of the alfalfa stems were 24.96 MPa, 29.60 MPa, and 10.48 MPa, respectively. The coefficients of restitution between the top, middle, and root sections of the alfalfa stems and PU rubber were 0.426, 0.375, and 0.386, respectively; the static friction coefficients were 0.613, 0.667, and 0.422, respectively; and the rolling friction coefficients were 0.213, 0.226, and 0.292, respectively. The relative error between the simulated and measured values of the angle of repose was less than 3%, effectively representing the mechanical characteristics of alfalfa stems at the harvesting stage bending and breaking under impact. This study aims to establish a discrete element flexible model of alfalfa stems at the harvesting stage and accurately calibrate the contact parameters with typical rubber materials, thereby addressing the lack of reliable bonding and contact parameters in existing simulations of the mashing process.

1. Introduction

Alfalfa (Medicago sativa L.) is a perennial leguminous plant [1], primarily cultivated in northwestern, northern, and northeastern regions of China. This species thrives in deep, well-drained, neutral or slightly alkaline soils rich in calcium [2]. To obtain high-quality hay or silage, alfalfa is typically harvested from the bud stage to the early flowering stage. This period represents the optimal harvest window, characterized by peak nutritional value (protein content) and relatively low fiber content [3,4]. The stem constitutes the primary structural component of the alfalfa plant. During harvesting, mower-conditioners cut the majority of stems above ground level for field drying. This process effectively suppresses microbial activity that causes spoilage, reduces nutrient loss, and ultimately enables long-term storage of the forage.
Regarding discrete element analysis (DEM) of alfalfa, researchers both domestically and internationally have conducted DEM studies for various application scenarios, including seeding, harvesting, and forage harvesting. Ma et al. [5] employed DEM to investigate the influence of cutter structure and rotational speed on the crushing performance of a forage crusher, aiming to optimize crushing effectiveness. Lei et al. [6] performed a theoretical analysis of pressure variation during alfalfa compaction to study mold wear caused by friction. Using the Archard friction and wear model, they calibrated the wear constants for alfalfa briquettes at different moisture contents and investigated the impact of moisture content on mold wear, revealing the relationship between energy accumulation and wear. Zhang et al. [7] combined physical experiments with simulations, using the angle of repose of alfalfa seeds as the response value, to calibrate the contact parameters and eatablish an accurate DEM model of alfalfa seeds. Contact parameters (static friction coefficient, rolling friction coefficient) were obtained through physical experiments, and a spherical particle model was established. Ma et al. [8] conducted optimization experiments, establishing a second-order regression model between the angle of repose and significant parameters, to calibrate DEM simulation parameters for alfalfa stems, thereby improving parameter accuracy for simulations of the stem compression process. Wang [9] established a DEM particle model of alfalfa stems suitable for computer simulation of vibratory compression processes through the determination of physical property parameters and calibration of DEM parameters. Additionally, a vibratory compression test system capable of measuring temperature and pressure within the die was developed to determine the laws governing stress and heat transfer during compression.
Alfalfa stems exhibit characteristics such as varying morphological dimensions, a hollow structure, and mechanical properties that change gradient along the longitudinal direction. These features directly affect their bending and fracturing behaviors during interaction with the conditioning rollers of mower-conditioners. Existing DEM models for alfalfa often simplify the stems as uniform rigid rods or basic flexible bodies, making it difficult to accurately simulate the local plastic deformation, bending, and fracturing processes of hollow stems under the compression of conditioning rollers. For flexible bodies like alfalfa stems, which possess significant gradient characteristics and a hollow structure, high-fidelity modeling remains challenging. In particular, there is a lack of systematic calibration and validation of contact parameters between the stems and key working components such as conditioning rollers, resulting in simulations that fail to accurately reflect the dynamic mechanical responses during the conditioning process. Therefore, it is necessary to employ discrete element simulation technology to create a multi-scale particle aggregation model of hollow stems. Discrete element bonding models should be established separately for the top, middle, and root sections of alfalfa stems at the harvesting stage, and the contact parameters between the material and PU rubber components should be calibrated. This will lay a foundation for the design and improvement of harvesting equipment for alfalfa at the harvesting stage. Angle of repose tests will be conducted and compared with actual experiments to validate the accuracy of the calibration results, thereby providing a basis for the design and optimization of alfalfa conditioning machinery.

2. Materials and Methods

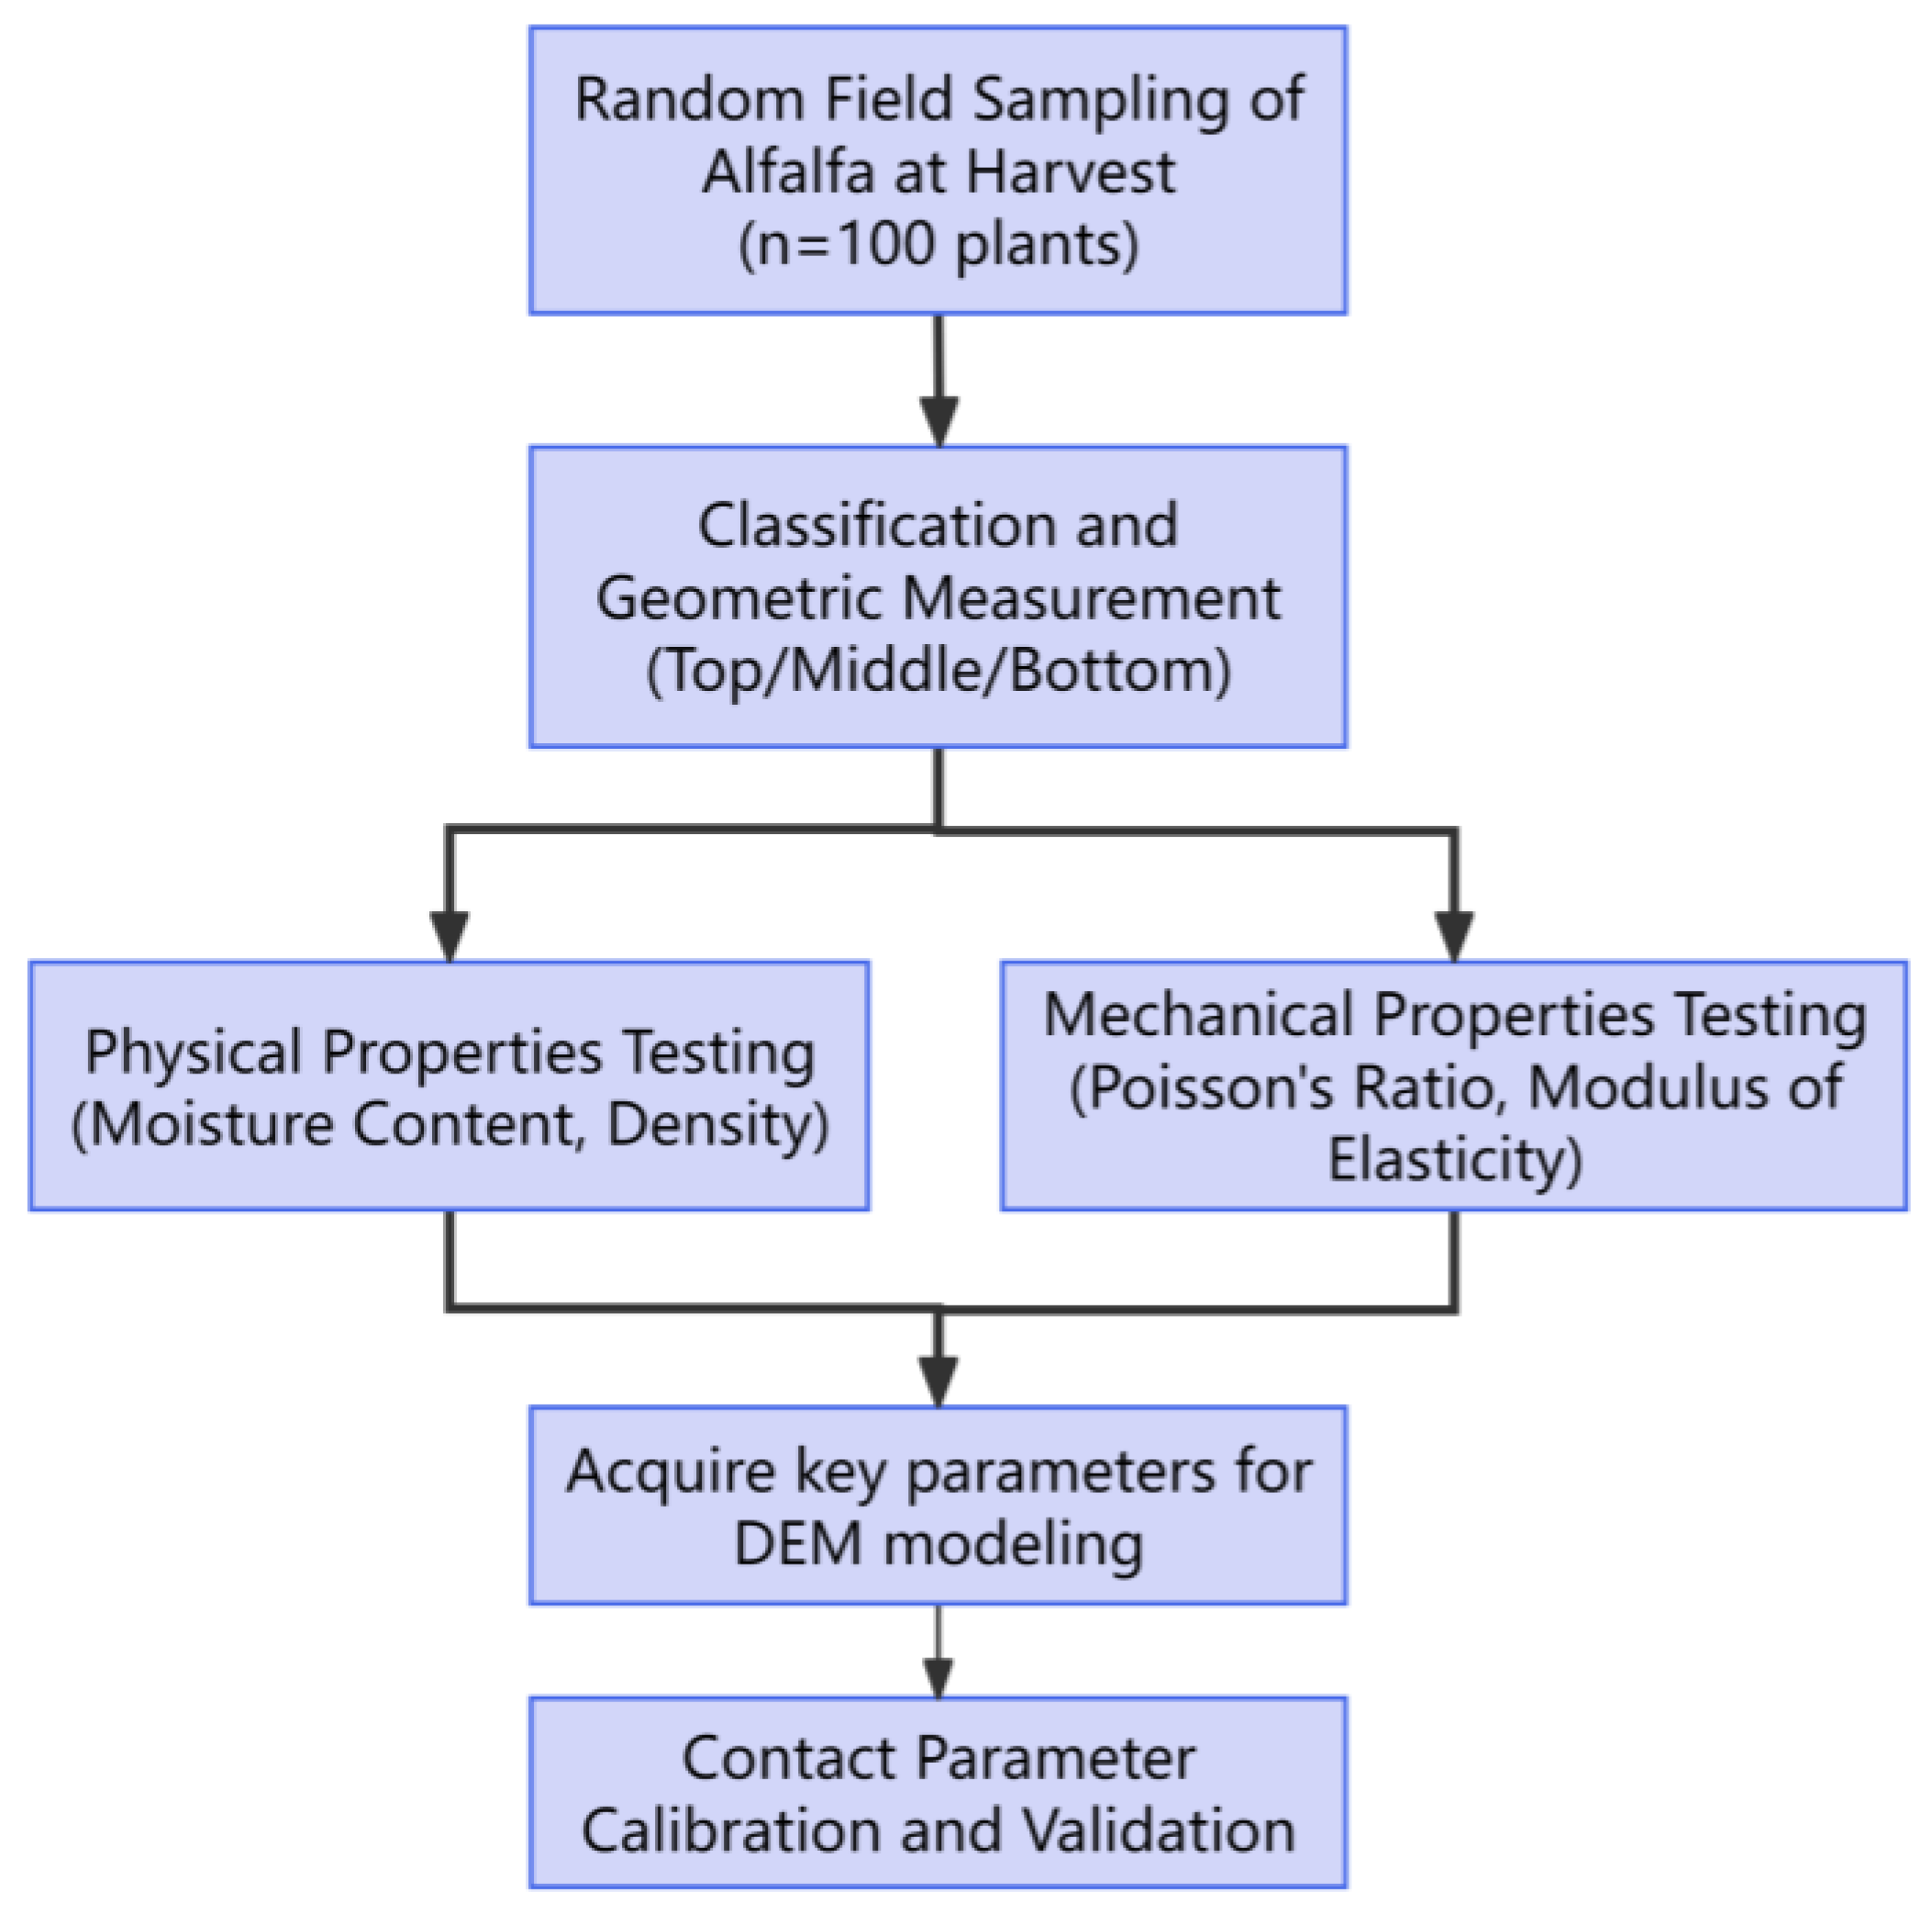
To systematically establish and validate the discrete element model of alfalfa stems at the harvesting stage, this study followed the overall research framework illustrated in Figure 1. This framework clearly outlines the complete logical progression, from field sampling and geometric dimension measurement to physical-mechanical testing, and finally to the construction of the DEM model and parameter calibration. This structured approach ensures the repeatability and logical rigor of the entire process from experimentation to simulation.

2.1. Geometric Dimensions and Distribution Patterns of Alfalfa Stems

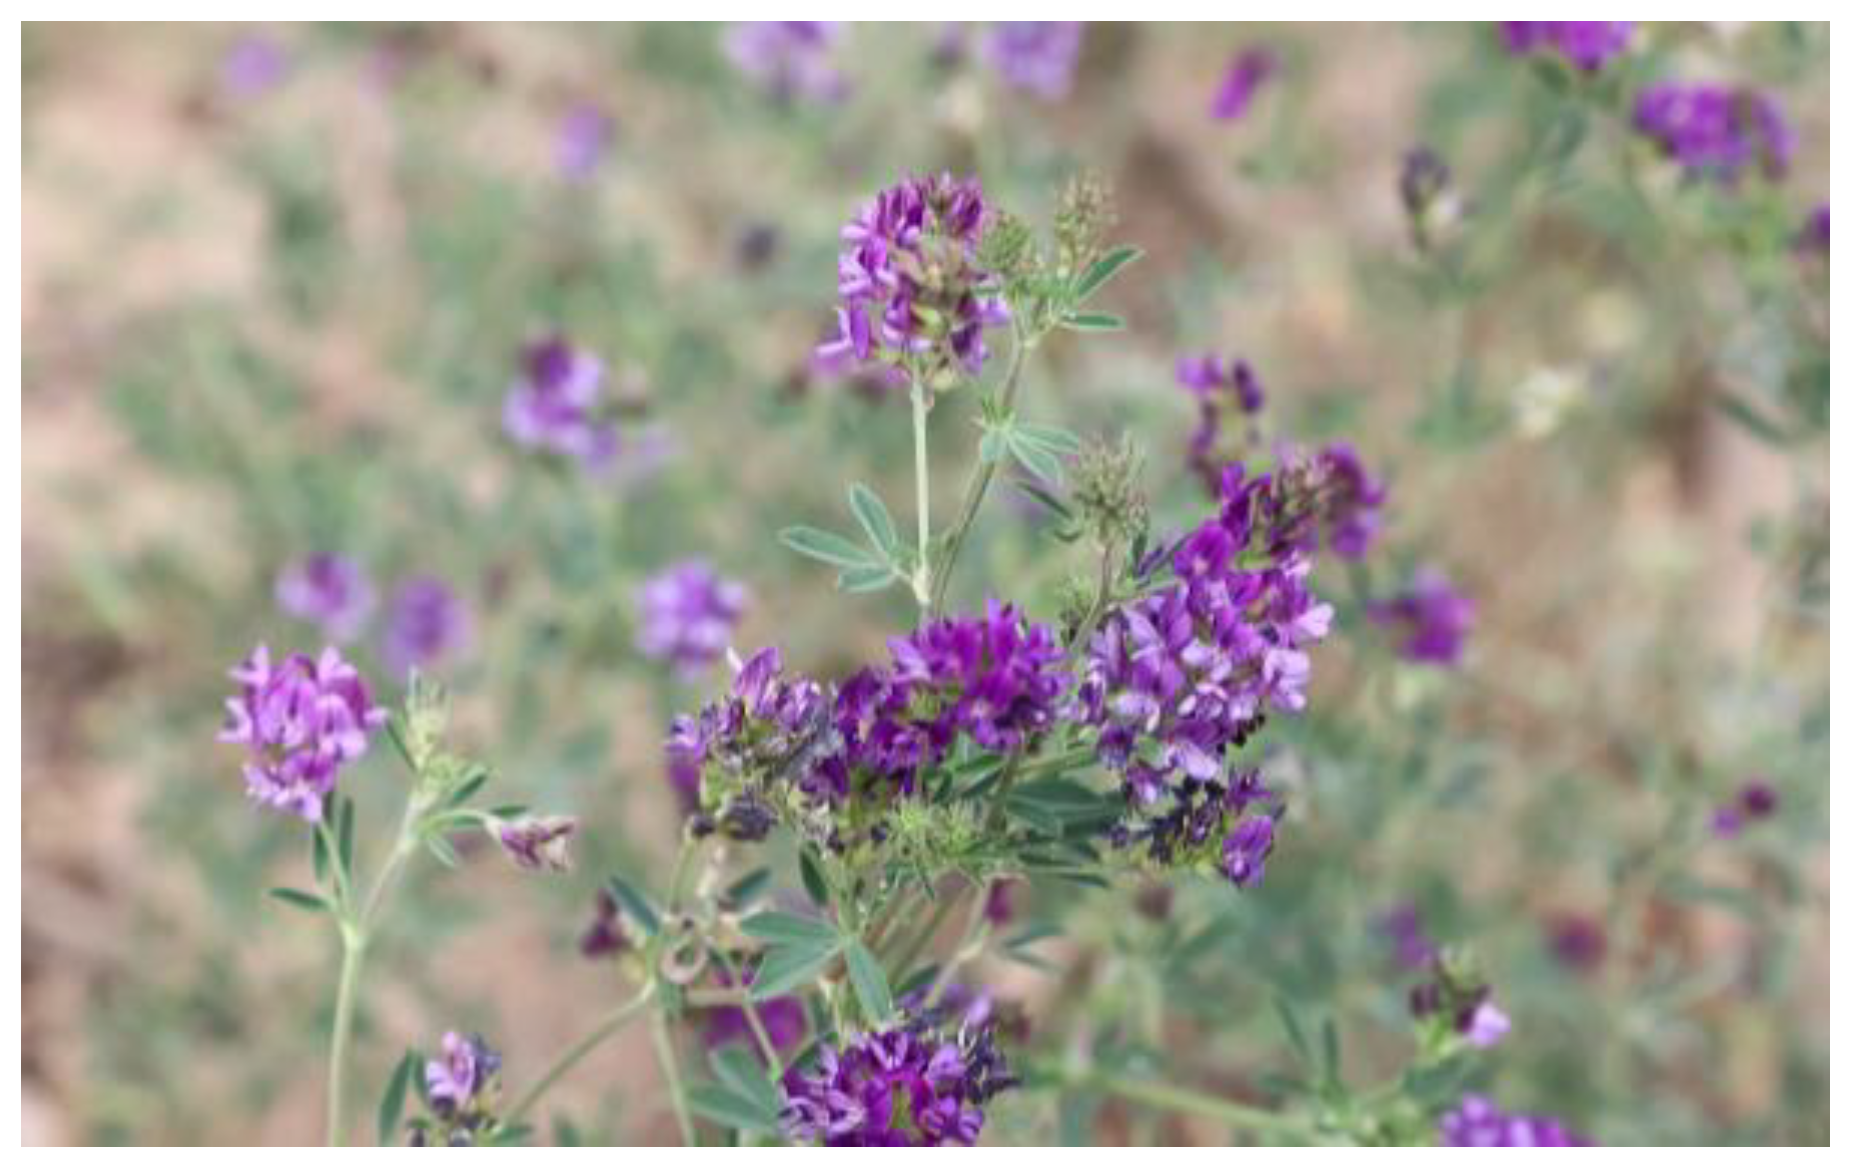
The alfalfa cultivar used in this study was ‘Zhongtian No. 1’ (Medicago sativa L.). This cultivar is well-suited for cultivation in the Northwest Inland and Loess Plateau regions of China, exhibiting advantages such as high forage yield, strong regrowth capacity, and high nutritional value. Stems were harvested from an alfalfa forage field in Yongdeng County, Lanzhou City, Gansu Province, China. Sampling occurred at the optimal harvest stage, as illustrated in Figure 2.
Preliminary simulation trials revealed that when modeling the conditioning of flexible alfalfa stems of uniform specification, the model exhibited insufficient buffering force between stems, excessive bond fracture, and inadequate representation of real-world operational conditions. To reduce simulation errors and enhance the realism of the simulation, 100 healthy alfalfa plant samples free from pests and diseases were randomly selected. These stems were classified based on stem diameter [10]: stems with d > 3 mm were categorized as the root section, those with 3 mm ≥ d ≥ 2 mm as the middle section, and those with d < 2 mm as the top section. The basic dimensions of the alfalfa stems were measured using a digital vernier caliper (accuracy: 0.01 mm), and the statistical results are presented in Table 1.

2.2. Determination of Moisture Content and Density of Alfalfa Stems

Previous studies have indicated that moisture content varies across different sections of alfalfa stems and significantly influences their physical and mechanical properties. Consequently, determining the moisture content in each stem section is essential. To prevent measurement errors caused by moisture evaporation, which occurs readily under ambient conditions, harvested alfalfa stems were immediately wrapped in plastic sealing film following collection.
Moisture content determination: Current methods for moisture content determination include oven-drying, titration, instrumental analysis, mass loss, infrared hygrometry, and electrical conductivity [11,12]. Based on equipment availability within the research group and established methodologies, the oven-drying method was employed. Stem samples were weighed and placed in a drying oven at 75–85 °C for 2 h. After removal and cooling in a desiccator, samples were reweighed. This process was repeated until a constant mass was achieved. Moisture content (MC, wet basis) was calculated as follows:
ω = M 1 M 2 M 1 × 100 %
where ω is the moisture content, %; M1 is the total mass of alfalfa stems before drying, g; M2 is thetotal mass of alfalfa stems after drying, g.
Density Determination: The true density of the solid stem material is defined as the ratio of its mass to its volume. Mass was determined gravimetrically using an electronic balance (Model: ME204E, manufactured by Mettler-Toledo, Küsnacht, Switzerland, Precision: 0.0001 g). Volume was measured employing the liquid displacement method with a 500 mL graduated cylinder. Determination of the moisture content and density of alfalfa during the harvest period are summarized in Table 2.

2.3. Determination of Mechanical Properties of Alfalfa Stems

Poisson’s ratio of alfalfa stems was measured using a texture analyzer (Model: TA.XT plus; Manufacturer: Stable Micro Systems Ltd., Godalming, UK). Following the measurement of the initial transverse length of a stem specimen, the specimen was positioned horizontally at the center of the compression plate. A rigid plate was then used to apply compressive load at a rate of 20 mm/min until deformation ceased. The transverse and longitudinal lengths of the deformed stem specimen were measured using a digital vernier caliper. This procedure was repeated for five replications per sample group, and the results were averaged. Poisson’s ratio was calculated according to the following formula [13]:
μ = ε 1 ε 2 = Δ d × H Δ H × d
where μ is the Poisson’s ratio of alfalfa stems; ε1 is the longitudinal strain of the alfalfa stem, mm; ε2 is the transverse strain of the alfalfa stem, mm; d is the initial diameter of the alfalfa stem in the direction of compression before the test, mm; Δd are the change in diameter of the alfalfa stem in the direction of compression after the test, mm; H is the initial diameter of the alfalfa stem in the direction perpendicular to the compression before the test, mm; ΔH is the change in diameter of the alfalfa stem in the direction perpendicular to the compression after the test, mm.
After averaging over 10 trials, the Poisson’s ratios calculated using Equation (2) were 0.446 for the top, 0.440 for the middle, and 0.437 for the root, with an average of 0.441.
Radial uniaxial flat-plate compression tests were performed on the top, middle, and root sections of alfalfa stems using the texture analyzer to determine the compressive elastic modulus. Before testing, stems were positioned horizontally at the center of the compression plate. A flat-plate probe compressed the stems at 4.8 mm/min. Length and diameter were measured before and after compression. The compressive elastic modulus was formulated as:
E = σ ε σ = F d 1 d 2 × l ε = Δ μ Δ s
where E is the elastic modulus of alfalfa stems, MPa; σ is the maximum compressive stress, Pa; ε is the linear strain; Fmax is the maximum load, N; d1 and d2 are the outer and inner diameters of the stem, mm; l is the contact length of the alfalfa stem, mm; Δμ is the change in diameter of the alfalfa stem, mm; Δs is the diameter of the alfalfa stem before compression, mm.
The average of 10 trials yielded compressive elastic moduli calculated by Equation (3) as follows: 85.24 MPa for the top, 72.18 MPa for the middle, and 30.13 MPa for the root, with a mean value of 62.52 MPa.
The shear modulus of alfalfa stems satisfies the following relationship with Poisson’s ratio and the elastic modulus:
G = E 2 1 + μ
where G is the shear modulus of alfalfa stems, MPa.
Calculated values showed shear moduli of 24.96 MPa for the top section, 29.60 MPa for the middle section, and 10.48 MPa for the root section, with a mean value of 21.68 MPa.

2.4. Construction of the Discrete Element Flexible Model for Alfalfa Stems

The discrete element flexible model of alfalfa stems was constructed using the Hertz-Mindlin with bonding contact model [14]. Within this model, adjacent particles are bonded, generating bonding bonds. During alfalfa stem conditioning, cutting, and crushing processes [15], bonding bond breakage and deformation occur. Therefore, the effect of bonding bonds reflects the internal forces within alfalfa stems. To simulate realistic conditions, a multi-scale particle aggregation modeling approach [16] was employed. Coarse particles occupy the external contour of the hollow stem, while fine particles fill the voids between coarse particles, reducing these voids and enhancing the consistency of the constructed alfalfa discrete element flexible model with actual conditions.
The physical radius and contact radius of coarse particles were Rp = 0.1 mm and Rc = 0.12 mm, respectively; for fine particles, they were Rp = 0.05 mm and Rc = 0.051 mm. Key bonding bond parameters [17] include the normal stiffness Kn, tangential stiffness Ks, normal critical stress σ, tangential critical stress γ, and bonding radius Rj. These parameters were calculated as:
K n = 4 3 1 μ a 2 E a + 1 μ b 2 E b 1 r a + r b r a r b 1 2 K s = 1 2 ~ 2 3 K n σ = F π R 2 γ = c + σ tan φ
where μa and μb are the Poisson’s ratios of alfalfa flexible stem particles; Ea and Eb are the elastic moduli of the flexible stem particles, MPa; ra and rb are the radii of the flexible stem particles, mm; F is the critical pressure value, N; R is the radius of the compression surface, mm; c is the cohesive strength of the alfalfa stem, MPa; φ is the internal friction angle of the alfalfa stem, (°).
Based on physical parameter calibration tests and related research findings, with c = 6 MPa and φ = 31°, the average values of the determined parameters for each section were substituted into Equation (5). The calculation results are shown in Table 3.
The discrete element model of harvest-stage alfalfa stems, constructed using this bonding contact model, is presented in Table 4.

3. Results

3.1. Calibration of the Restitution Coefficient for Alfalfa Stems

Simulating alfalfa conditioning operations requires determining the dynamic friction coefficient, static friction coefficient, and restitution coefficient between alfalfa stems and the conditioning roller, and between alfalfa stems themselves [18]. The static friction coefficient between stems and the conditioning roller was measured using the inclined plane sliding method. The dynamic friction coefficient was determined by combining the inclined plane rolling method with the law of energy conservation. The cylinder lift test validated the measured contact parameters. Contact parameters between alfalfa stems were adopted from existing research and not recalibrated. To enhance DEM simulation reliability, contact parameters were calibrated using a combined bench test and simulation approach for interactions between alfalfa stems and both PU (polyurethane) rubber and standard rubber, and between alfalfa stems themselves. Simulation tests were conducted within the EDEM2021 software [19]; parameters are listed in Table 5.

3.2. Calibration of Impact Recovery Coefficient for Alfalfa Stems

The coefficient of restitution determines the energy loss after a collision, directly influencing the simulated bouncing height of the stems and their separation behavior after impact with the roller teeth. An inaccurate coefficient of restitution will lead to distortion in the simulated material flow trajectory. Restitution coefficients can be classified into three types based on physical principles: kinematic restitution coefficient, dynamic collision restitution coefficient, and energy restitution coefficient [20]. This study employs the kinematic restitution coefficient for collisions between alfalfa stems and PU rubber/standard rubber. It is defined as the ratio of the normal component of the center-of-mass velocity after collision to that before collision between the alfalfa stem and the target plate. The experimental setup is shown in Figure 3. The rubber impact plate was clamped at a 45° inclination. Alfalfa stems were released from height 2h, colliding with the rubber plate positioned at height h. The stems subsequently landed at horizontal distance L. Neglecting air resistance, the restitution coefficient eN is formulated according to kinematic principles as [21]:
e N = V N V N = v sin 45 v sin 45 = L 2 h
where V N is the normal component velocity of the stem after collision, m/s; VN is the normal component velocity of the stem before collision, m/s; v is the vertical component velocity of the stem before reaching the rubber plate, m/s; v’ is the horizontal component velocity of the stem at the moment of collision with the rubber plate, m/s; L is the horizontal distance traveled by the stem after collision, m; h is the vertical height between the stem’s landing position and the rubber plate, m.
Straight main stems free of nodes, pests/diseases, and mechanical damage were selected for testing. The average maximum horizontal distances for alfalfa stems were L1 = 162.8, 153.2, 159.7 mm and L2 = 140.4, 147.3, 139.5 mm.
Since the friction coefficient and rolling friction coefficient between alfalfa stems and PU rubber/standard rubber do not directly affect the horizontal distance in this test, these coefficients were set to 0. Bench tests determined the restitution coefficient ranges between alfalfa stems and PU rubber/standard rubber as 0.325~0.475, 0.3~0.45, and 0.36~0.42, respectively. Each simulation was repeated 10 times and averaged, with 7 simulation groups conducted [22]. The restitution coefficient x1 and horizontal distance results y1 are presented in Table 6 and Table 7.
The experimental data from Table 6 and Table 7 were fitted to a quadratic polynomial curve [23], yielding the curve equation shown in Figure 4:
y 1 D P = 549.98 x 1 D P 2 49.065 x 1 D P + 83.96 y 1 Z P = 71.81 x 1 Z P 2 + 468.81 x 1 Z P 12.299 y 1 G P = 844.05 x 1 G P 2 + 1051.4 x 1 G P 120.4
y 1 D R = 192.19 x 1 D R 2 + 260.12 x 1 D R + 27.593 y 1 Z R = 512.5 x 1 Z R 2 85.482 x 1 Z R + 104.1 y 1 G R = 1713.4 x 1 G R 2 + 1554.2 x 1 G R 194.41
The coefficient of determination R2 for both PU rubber and alfalfa stems in Equation (7) is close to 1, indicating that the equation provides a reliable fit. Substituting the bench-tested average horizontal distances (162.8 mm, 153.2 mm, and 159.7 mm) into Equation (7) yielded x1P = 0.426, 0.375, and 0.386.
Figure 4. Simulation test restitution coefficient and horizontal distance fitting curve.
Agronomy 15 02390 g004
Seven repeated verification tests were conducted in the EDEM software and averaged, yielding simulated horizontal distances of 156.37 mm, 148.16 mm, and 152.03 mm. The relative errors compared to bench tests were 3.95%, 3.29%, and 4.8%, respectively. The bench test and simulation results were fundamentally consistent. Therefore, in the EDEM simulation tests, the restitution coefficients (x1P) between alfalfa stems and PU rubber for the top, middle, and root stem sections were 0.426, 0.375, and 0.386, respectively.
The coefficient of determination R2 for both ordinary rubber and alfalfa stems in Equation (8) is close to 1, indicating that the equation provides reliable fitting results. Substituting the bench-tested average horizontal distances (140.4 mm, 147.3 mm, and 139.5 mm) into Equation (8) yielded x1R = 0.345, 0.385, 0.350. Seven repeated verification tests in the EDEM software and averaging yielded simulated horizontal distances of 144.82 mm, 155.84 mm, and 145.53 mm. The relative errors compared to bench tests were 3.15%, 5.8%, and 4.32%, respectively. The bench test and simulation results were fundamentally consistent. Therefore, in the EDEM simulation tests, the restitution coefficients x1R between alfalfa stems and standard rubber for the top, middle, and root stem sections were 0.345, 0.385, and 0.350, respectively.

3.3. Calibration of the Static Friction Coefficient for Alfalfa Stems

The static friction coefficient primarily influences the difficulty of stem slippage and the initial motion state on the roller tooth surface, making it a key simulation parameter that determines the feeding efficiency and clogging risk of the mower-conditioner. The static friction coefficient is primarily influenced by rubber type and surface roughness. Therefore, the static friction coefficient between alfalfa stems and both PU rubber and standard rubber was calibrated using the inclined plane sliding test. Alfalfa stems were placed on the rubber plate, which was then rotated slowly and uniformly about one edge. Rotation ceased when stem slippage initiated. The inclination angle was recorded using a digital inclinometer (precision: 0.1°) [24]; the setup is shown in Figure 5. The bench test was repeated 10 times and averaged to determine the static friction coefficient fs between alfalfa stems and the rubber materials. The static friction coefficient is expressed as:
f s = tan α
where α is the static friction critical angle, (°).
Straight primary stems free of nodes, pests/diseases, and mechanical damage were selected. Average inclination angles obtained were α1 = 23.88°, 16.4°, 13.46° and α2 = 32.5°, 34.42°, 32.7°.
The restitution coefficients between alfalfa stems and PU rubber/standard rubber were set to calibrated values. The rolling friction coefficient does not directly affect inclination angles in this test; thus, it was set to 0. Bench tests determined static friction coefficient ranges between alfalfa stems and PU rubber/standard rubber as 0.4~0.478, 0.26~0.35, and 0.178~0.292, respectively. Each simulation was repeated 10 times and averaged across 7 simulation groups. Static friction coefficients x2 and inclination angles y2 are presented in Table 8 and Table 9.
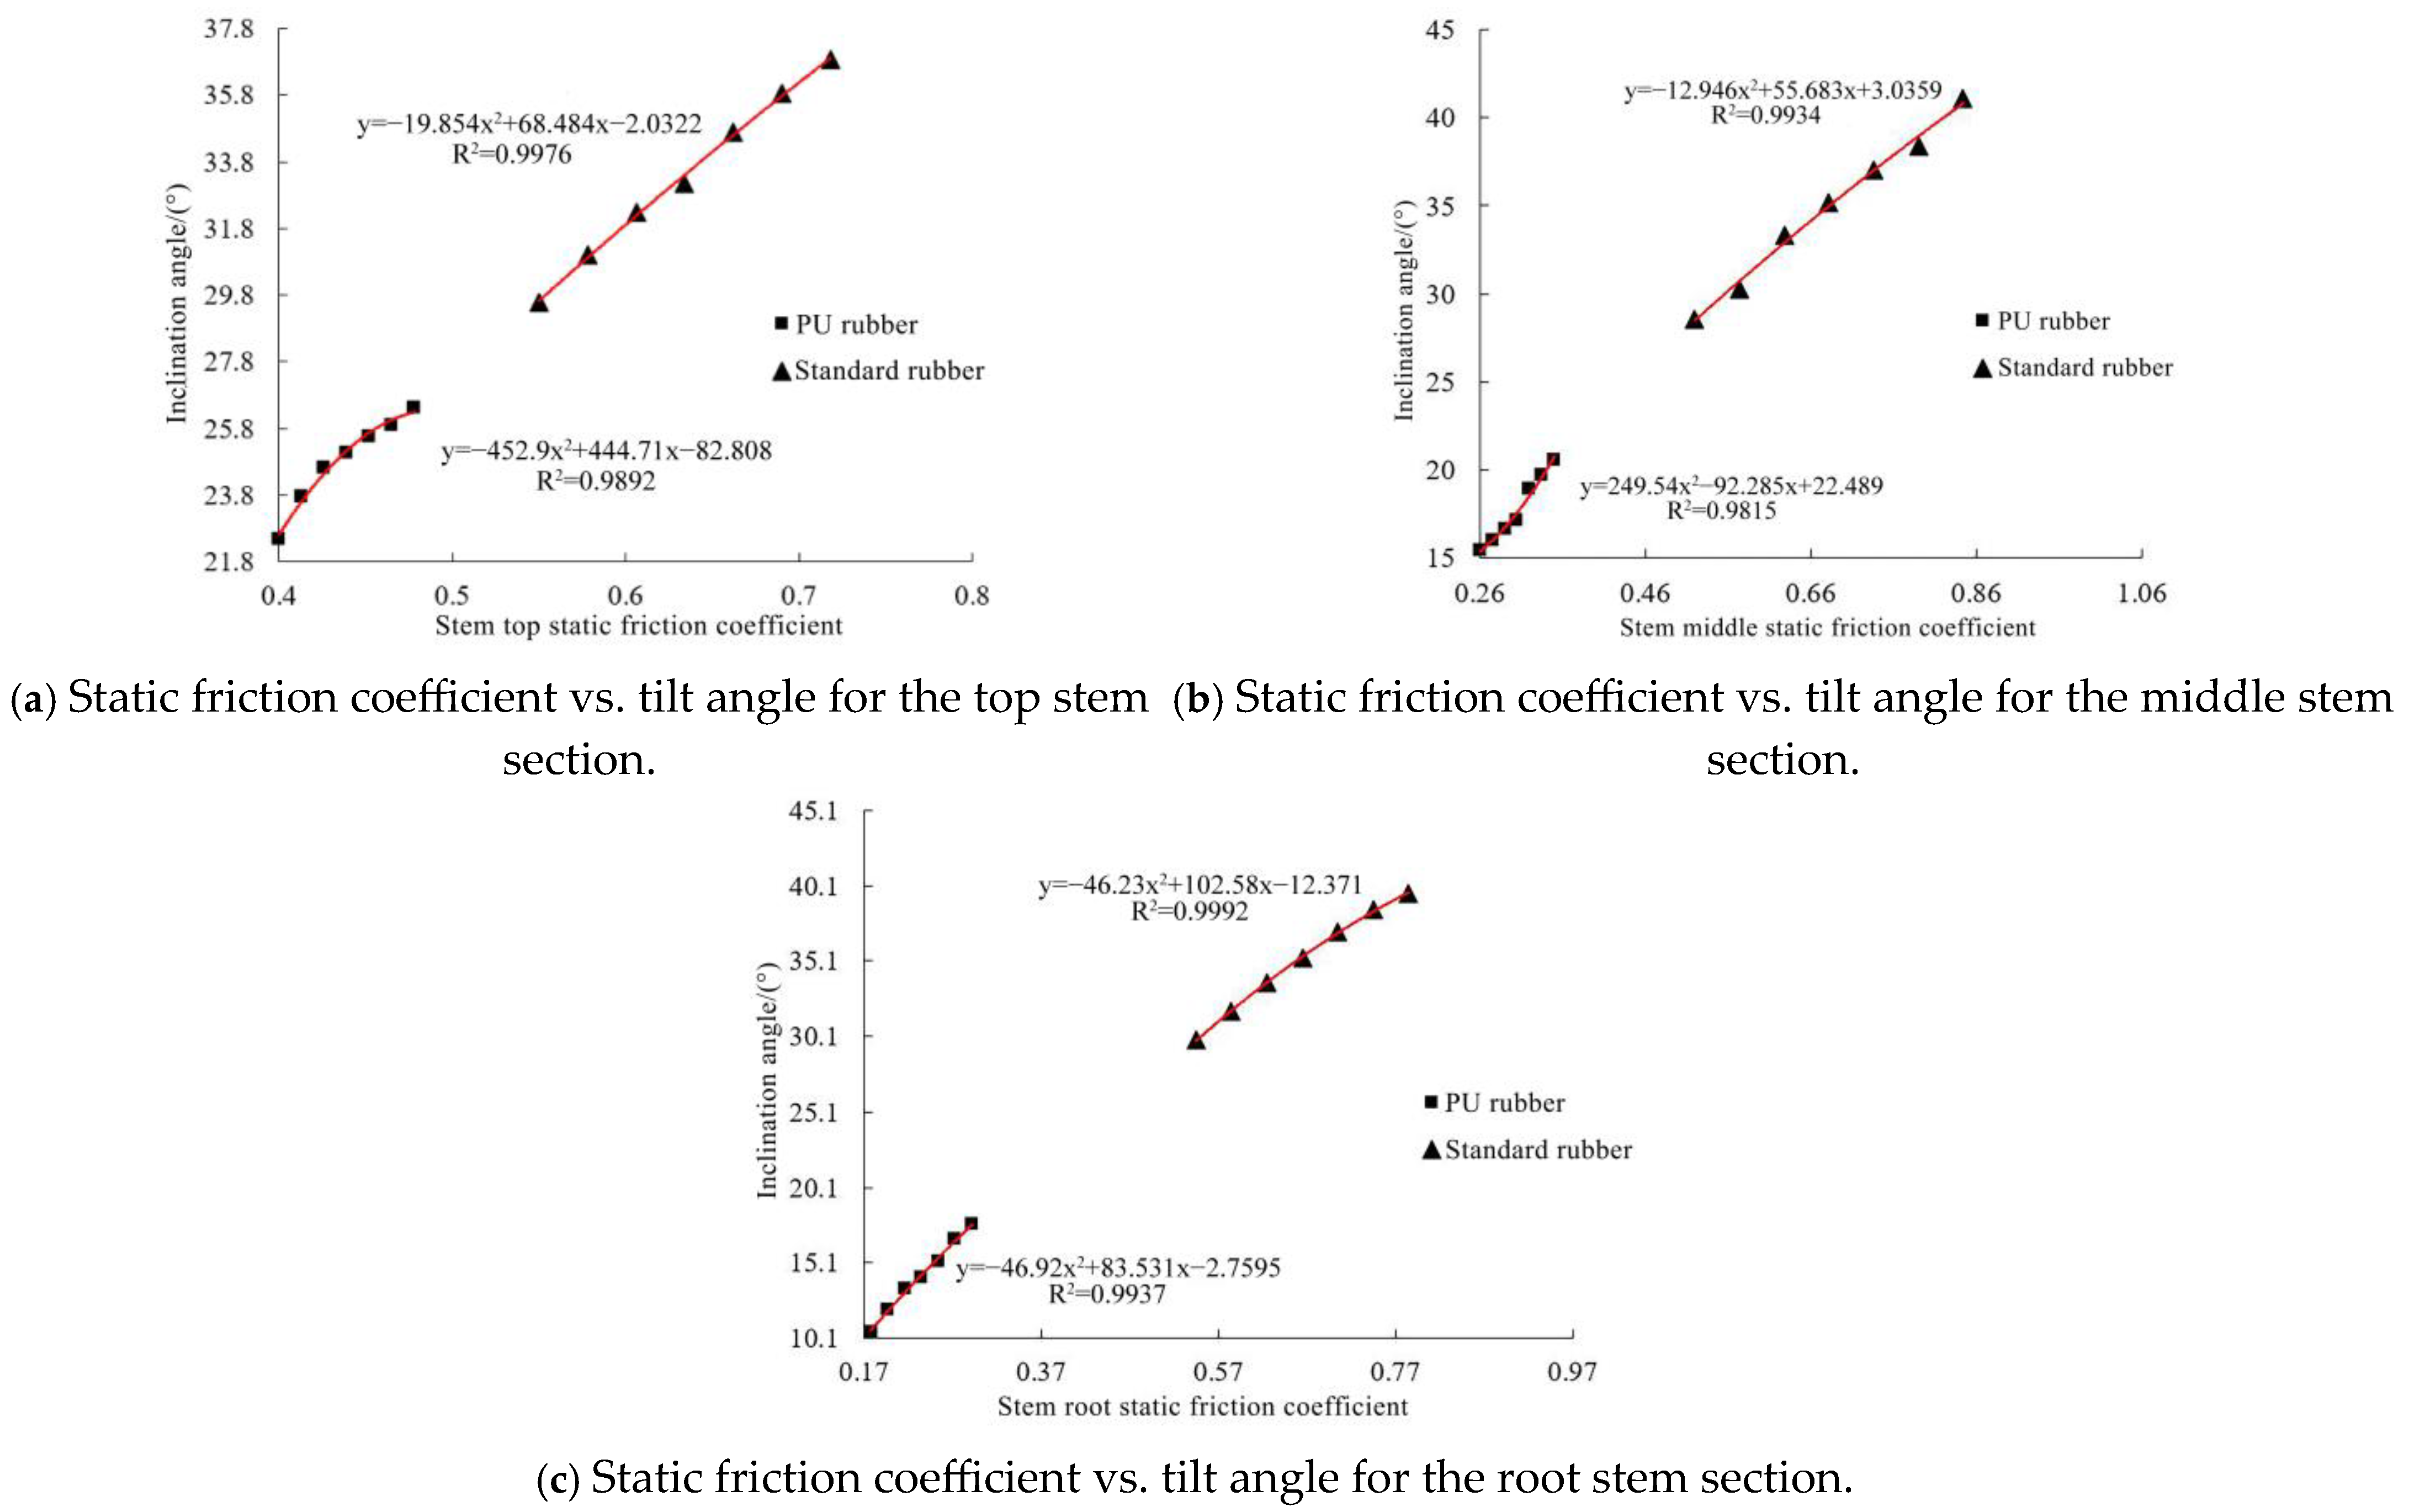
The experimental data from Table 8 and Table 9 were fitted to a quadratic polynomial fitting curve, as shown in Figure 6, yielding the curve equation:
y 2 D P = 452.9 x 2 D P 2 + 444.71 x 2 D P 82.808 y 2 Z P = 249.54 x 2 Z P 2 92.285 x 2 Z P + 22.489 y 2 G P = 46.92 x 2 G P 2 + 83.531 x 2 G P 2.7595
y 2 D R = 19.854 x 2 D R 2 + 68.484 x 2 D R 2.0322 y 2 Z R = 12.946 x 2 Z R 2 + 55.683 x 2 Z R + 3.0359 y 2 G R = 46.23 x 2 G R 2 + 102.58 x 2 G R 2.371
The coefficient of determination R2 for both PU rubber and alfalfa stems in Equation (10) is close to 1, indicating that the equation provides a reliable fit. Substitution of the bench-tested average inclination angles (23.88°, 16.4°, and 13.46°) into Equation (10) yielded x2P = 0.417, 0.284, and 0.222.
Seven repeated EDEM validation trials yielded average simulated inclination angles of 23.75°, 16.11°, and 14.02°. Relative errors compared to bench tests were 3.35%, 1.77%, and 4.16%, respectively. Bench and simulation results were broadly consistent. Thus, the static friction coefficients x2P between alfalfa stems and PU rubber were 0.417 (top), 0.284 (middle), and 0.222 (root).
The coefficient of determination R2 for both ordinary rubber and alfalfa stems in Equation (11) is close to 1. Substituting bench-tested averages (32.5°, 34.42°, 32.7°) into Equation (11) gave x2R = 0.613, 0.667, 0.422. Seven repeated EDEM trials yielded simulated angles of 32.12°, 34.7°, 32.5°, with relative errors of 1.16%, 0.84%, 0.60%. Bench and simulation results were broadly consistent. Thus, the static friction coefficients between alfalfa stems and standard rubber were 0.613 (top), 0.667 (middle), and 0.422 (root).

3.4. Calibration of the Rolling Friction Coefficient for Alfalfa Stems

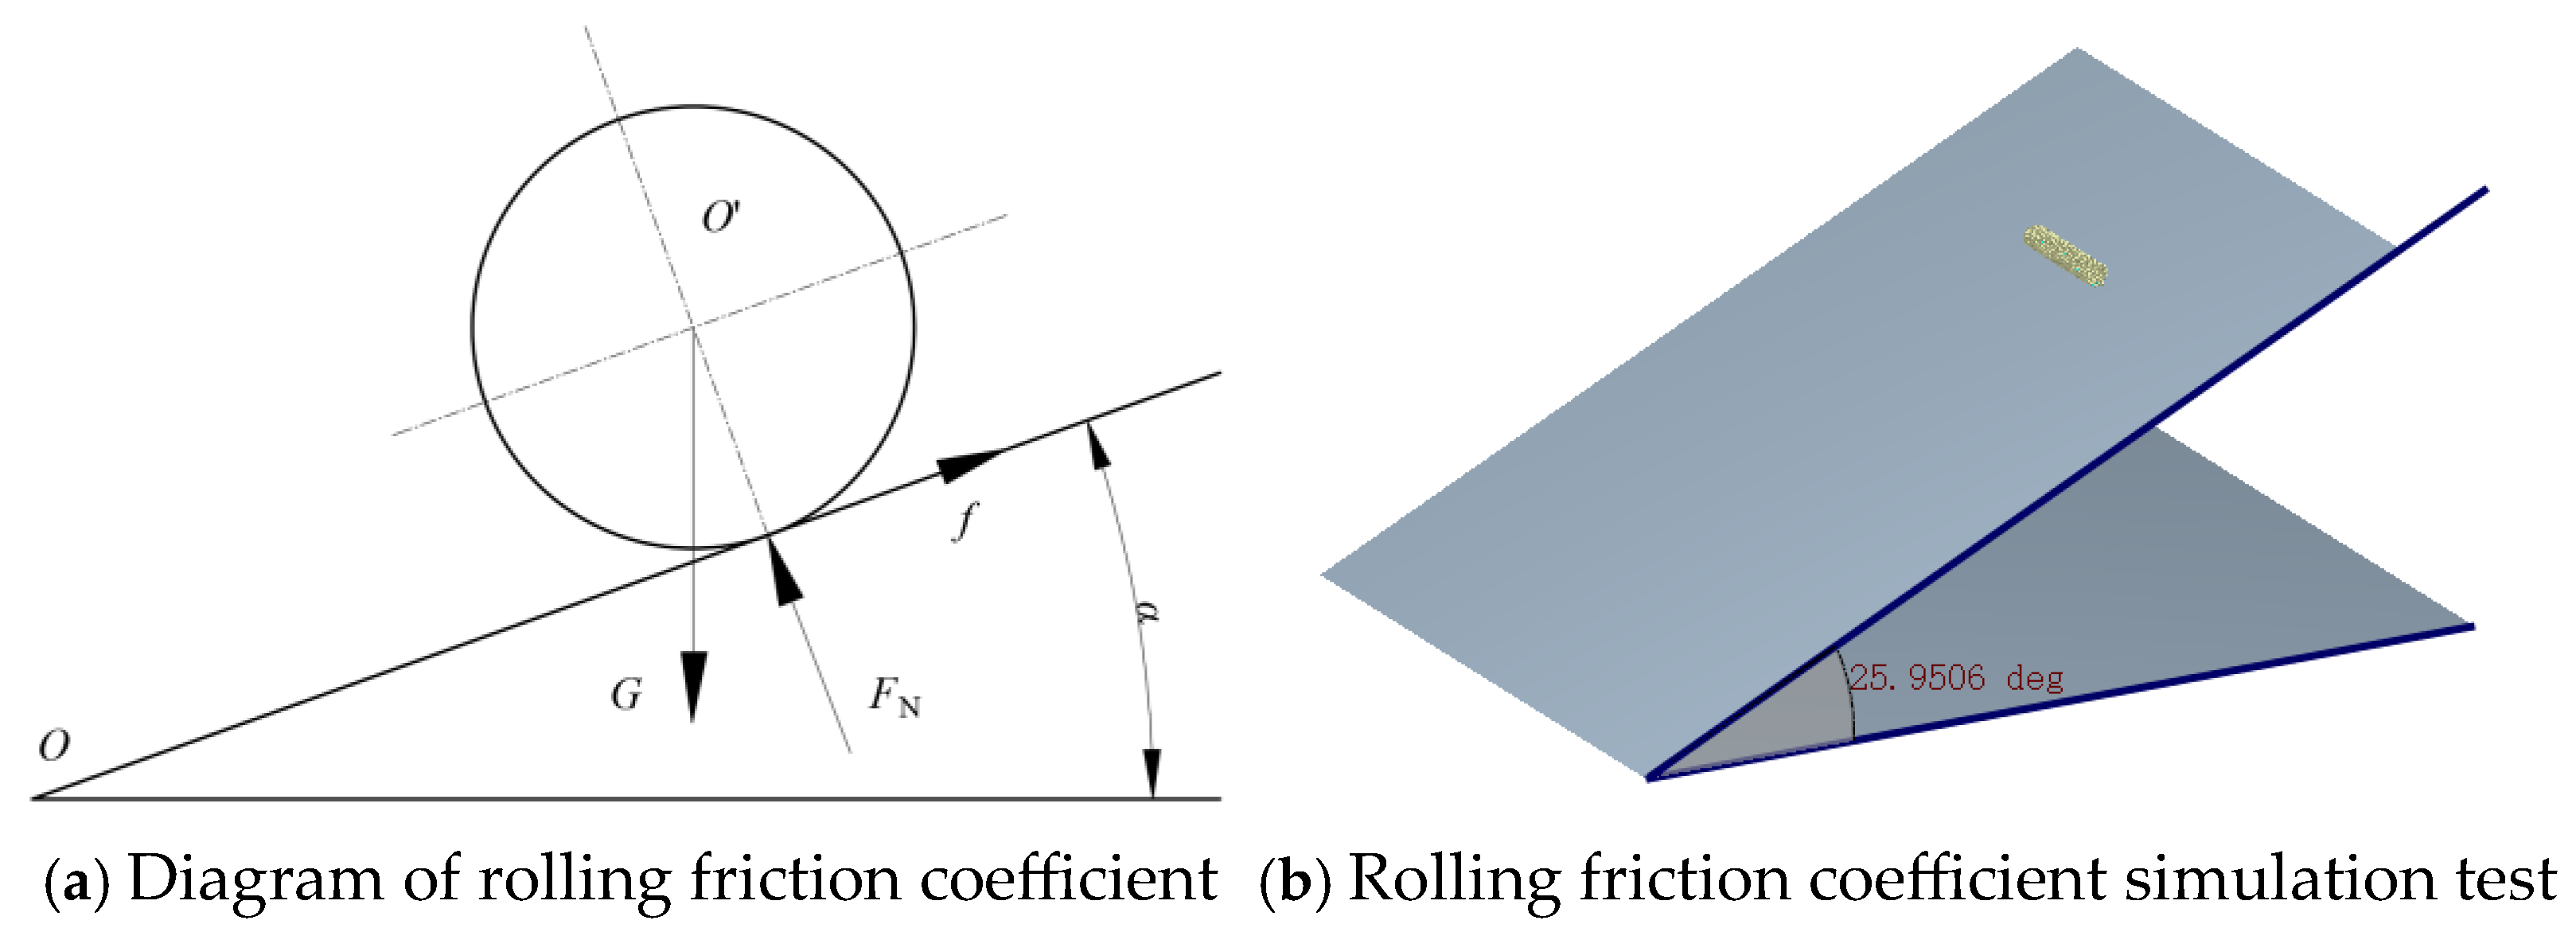
The rolling friction coefficient influences the tendency of stems to roll and serves as a key parameter for simulating the rolling behavior of alfalfa stems during the simulation process. Rolling friction refers to the resistance to rolling caused by deformation at the contact interface when an object rolls or tends to roll without slipping on another surface. In this test, based on the law of conservation of energy, alfalfa stems were placed parallel to the axis of rotation on a rubber plate. Measurement followed the inclined plane rolling principle: the rubber plate was rotated slowly and uniformly about one edge; rotation ceased when the stems began rolling. The inclination angle was recorded using a digital inclinometer (precision: 0.1°); the setup is shown in Figure 7. The bench test was repeated 10 times and averaged to determine the rolling friction coefficient f between alfalfa stems and PU rubber/standard rubber, as per established methodology. The coefficient is formulated as:
M = f F N F N G cos α = 0 G r sin α M = 0 f = M F N = r tan α
where M is the rolling friction torque, N; FN is the normal force exerted by the alfalfa stem on the rubber plate, N; G is the gravitational force of the alfalfa stem, N; α is the rolling friction angle, (°); r is the radius of the alfalfa stem, mm.
Straight primary stems free of nodes, pests/diseases, and mechanical damage were selected. Average inclination angles obtained were α1 = 12.46°, 14.28°, 16.6° and α2 = 11.94°, 11.36°, 8.59°.
The restitution coefficients and static friction coefficients between alfalfa stems and PU rubber/standard rubber were set to calibrated values. Bench tests determined rolling friction coefficient ranges between alfalfa stems and PU rubber/standard rubber as 0.173~0.236, 0.21~0.277, and 0.262~0.344, respectively. Each simulation was repeated 10 times and averaged across 7 simulation groups. Rolling friction coefficients x3 and inclination angles y3 are presented in Table 10 and Table 11.
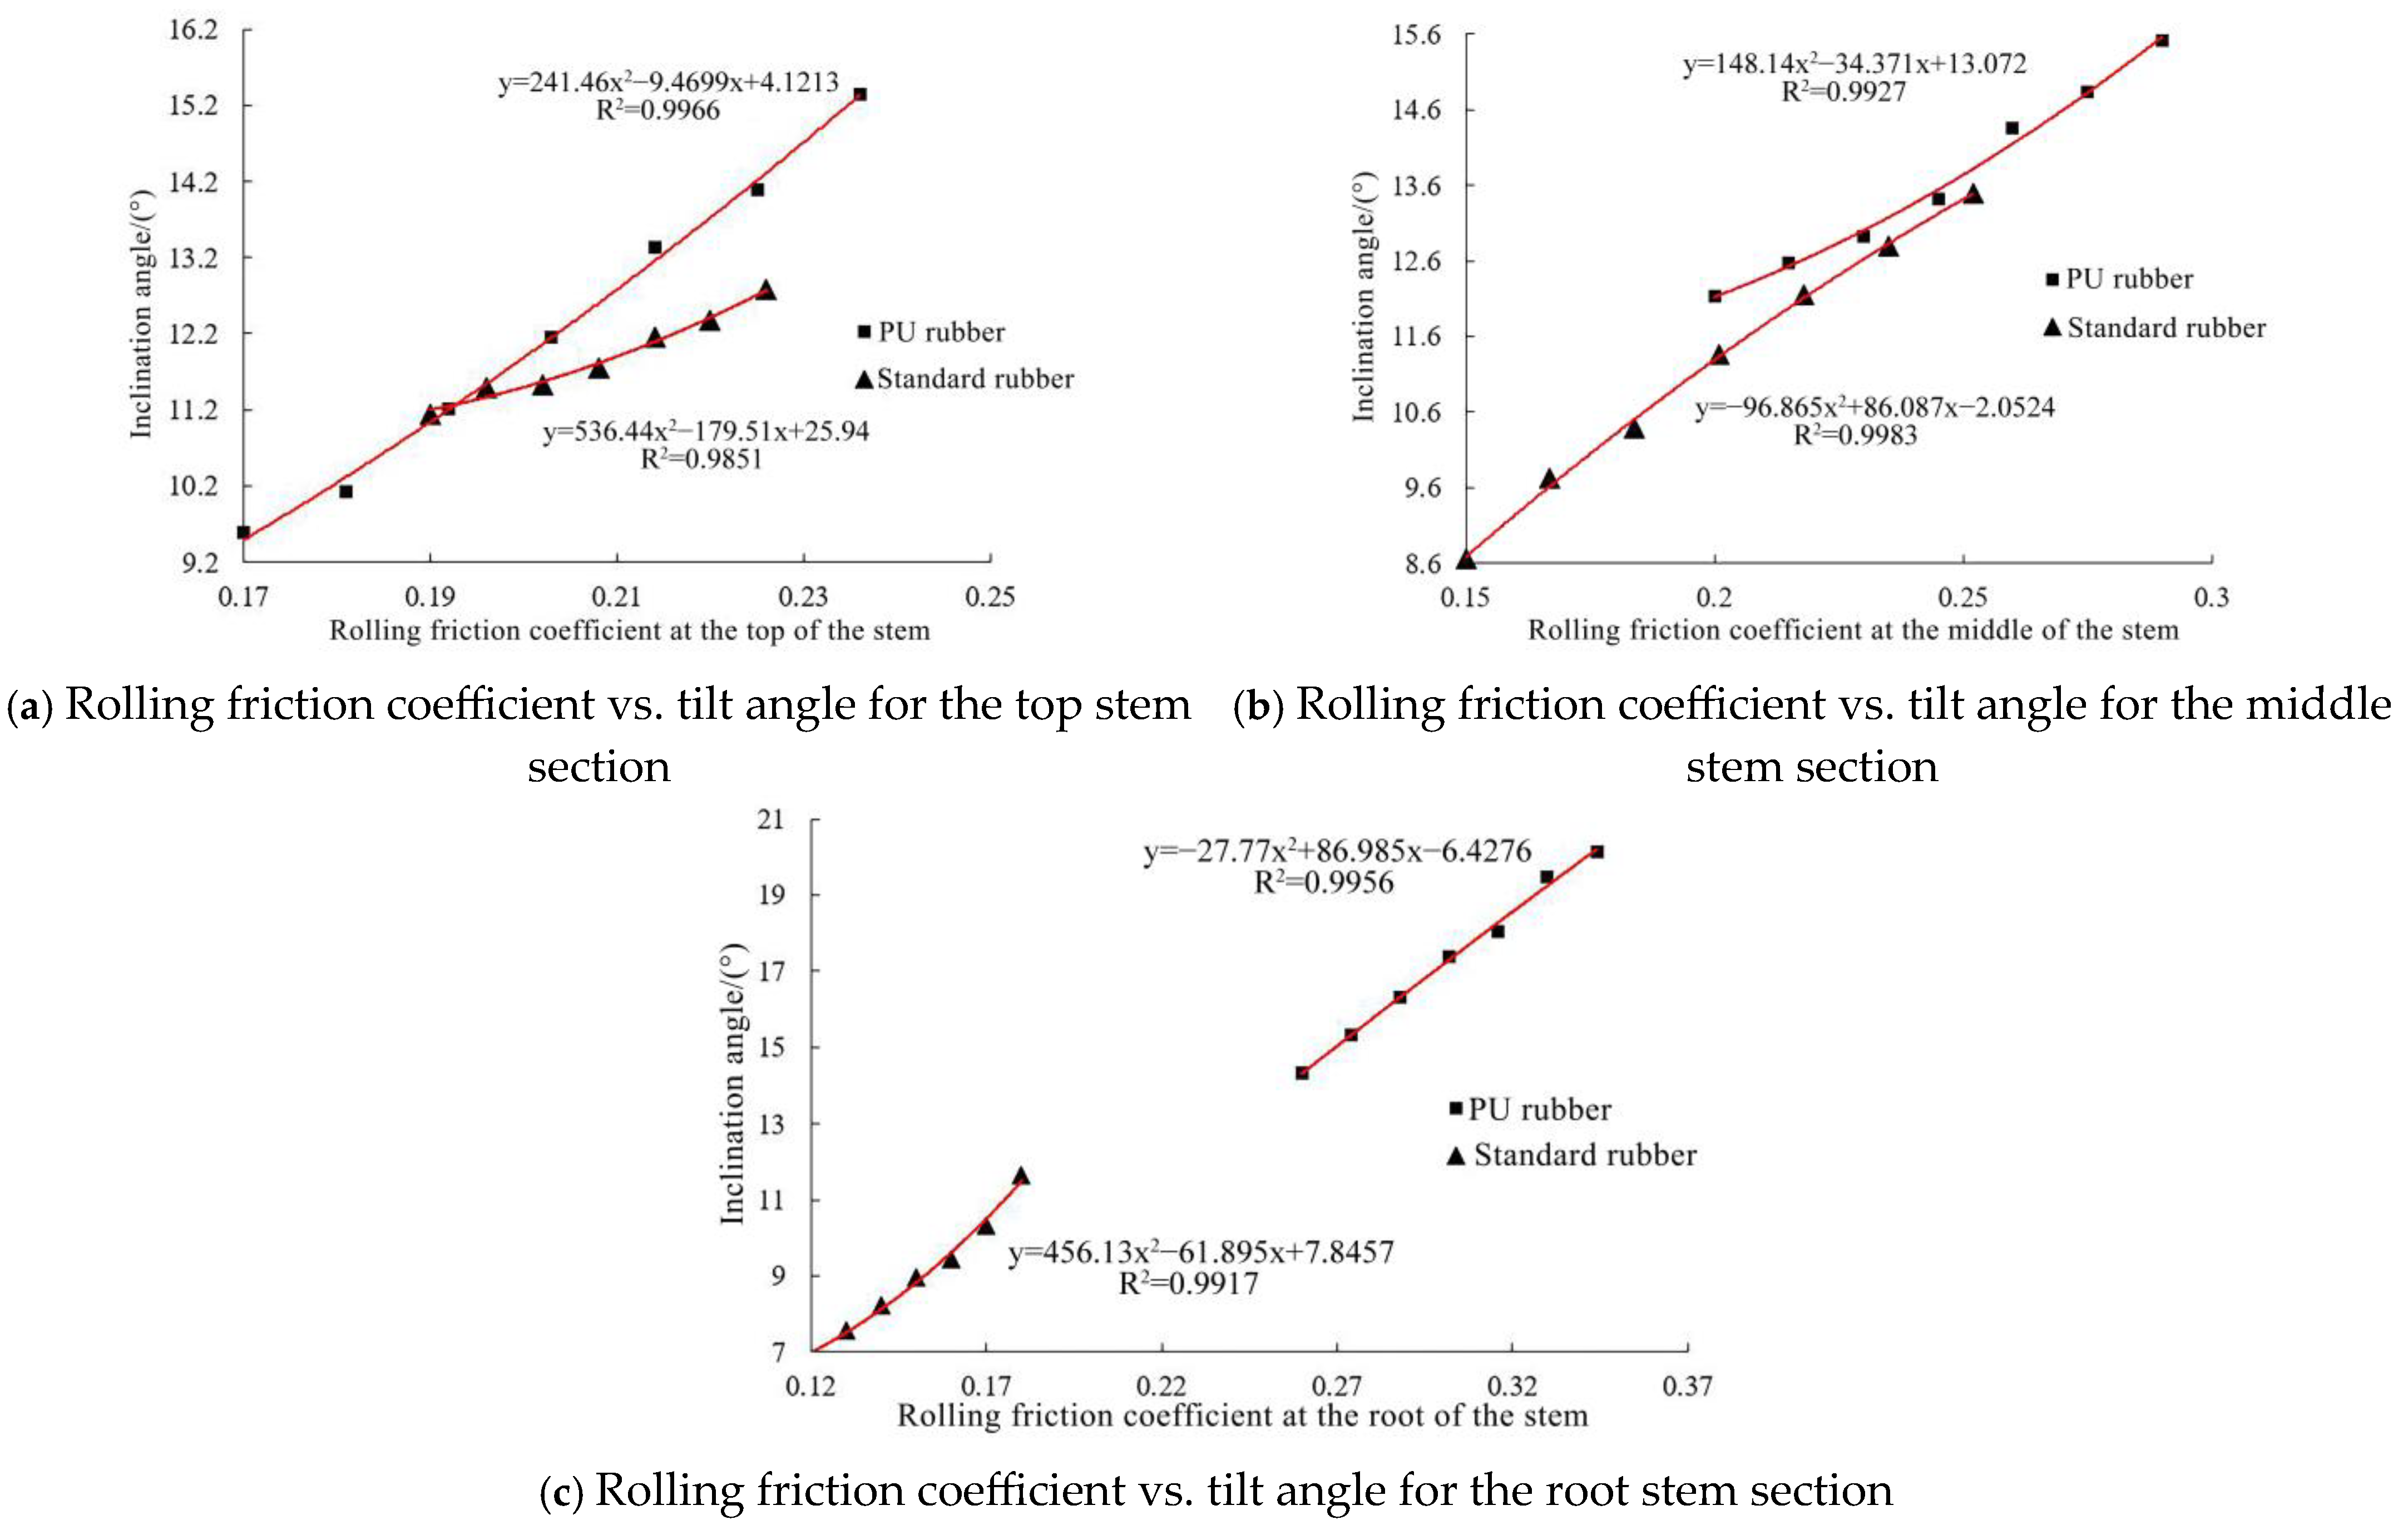
The experimental data from Table 10 and Table 11 were fitted to a quadratic polynomial fitting curve, as shown in Figure 8, yielding the curve equation:
y 3 D P = 148.14 x 3 D P 2 34.371 x 3 D P + 13.072 y 3 Z P = 241.46 x 3 Z P 2 9.4699 x 3 Z P + 4.1213 y 3 G P = 27.77 x 3 G P 2 + 86.985 x 3 G P 6.4276
y 3 D R = 96.865 x 3 D R 2 + 86.087 x 3 D R 2.0524 y 3 Z R = 536.44 x 3 Z R 2 179.51 x 3 Z R + 25.94 y 3 G R = 456.13 x 3 G R 2 61.895 x 3 G R + 7.8457
The coefficient of determination R2 for both PU rubber and alfalfa stems in Equation (13) is close to 1, indicating that the equation provides reliable fitting results. Substitution of the bench-tested average inclination angles (12.46°, 14.28°, and 16.6°) into Equation (13) yielded x3P = 0.213, 0.226, and 0.292.
For PU rubber: Seven repeated EDEM validation trials yielded average simulated inclination angles of 13.27°, 12.87°, and 17.01°. Relative errors compared to bench tests were 6.5%, 9.7%, and 2.4%, respectively. Bench and simulation results were broadly consistent. Thus, the rolling friction coefficients x3P between alfalfa stems and PU rubber were 0.213 (top), 0.226 (middle), and 0.292 (root).
The coefficient of determination R2 for both ordinary rubber and alfalfa stems in Equation (14) is close to 1, indicating that the equation provides reliable fitting results. Substituting bench-tested averages (11.94°, 11.36°, 8.59°) into Equation (14) gave x3R = 0.214, 0.196, 0.147. Seven repeated EDEM trials yielded simulated angles of 12.16°, 11.34°, 8.61°, with relative errors of 1.84%, 0.17%, 0.23%. Bench and simulation results were broadly consistent. Thus, the rolling friction coefficients x3R between alfalfa stems and standard rubber were 0.214 (top), 0.196 (middle), and 0.147 (root).

4. Discussion

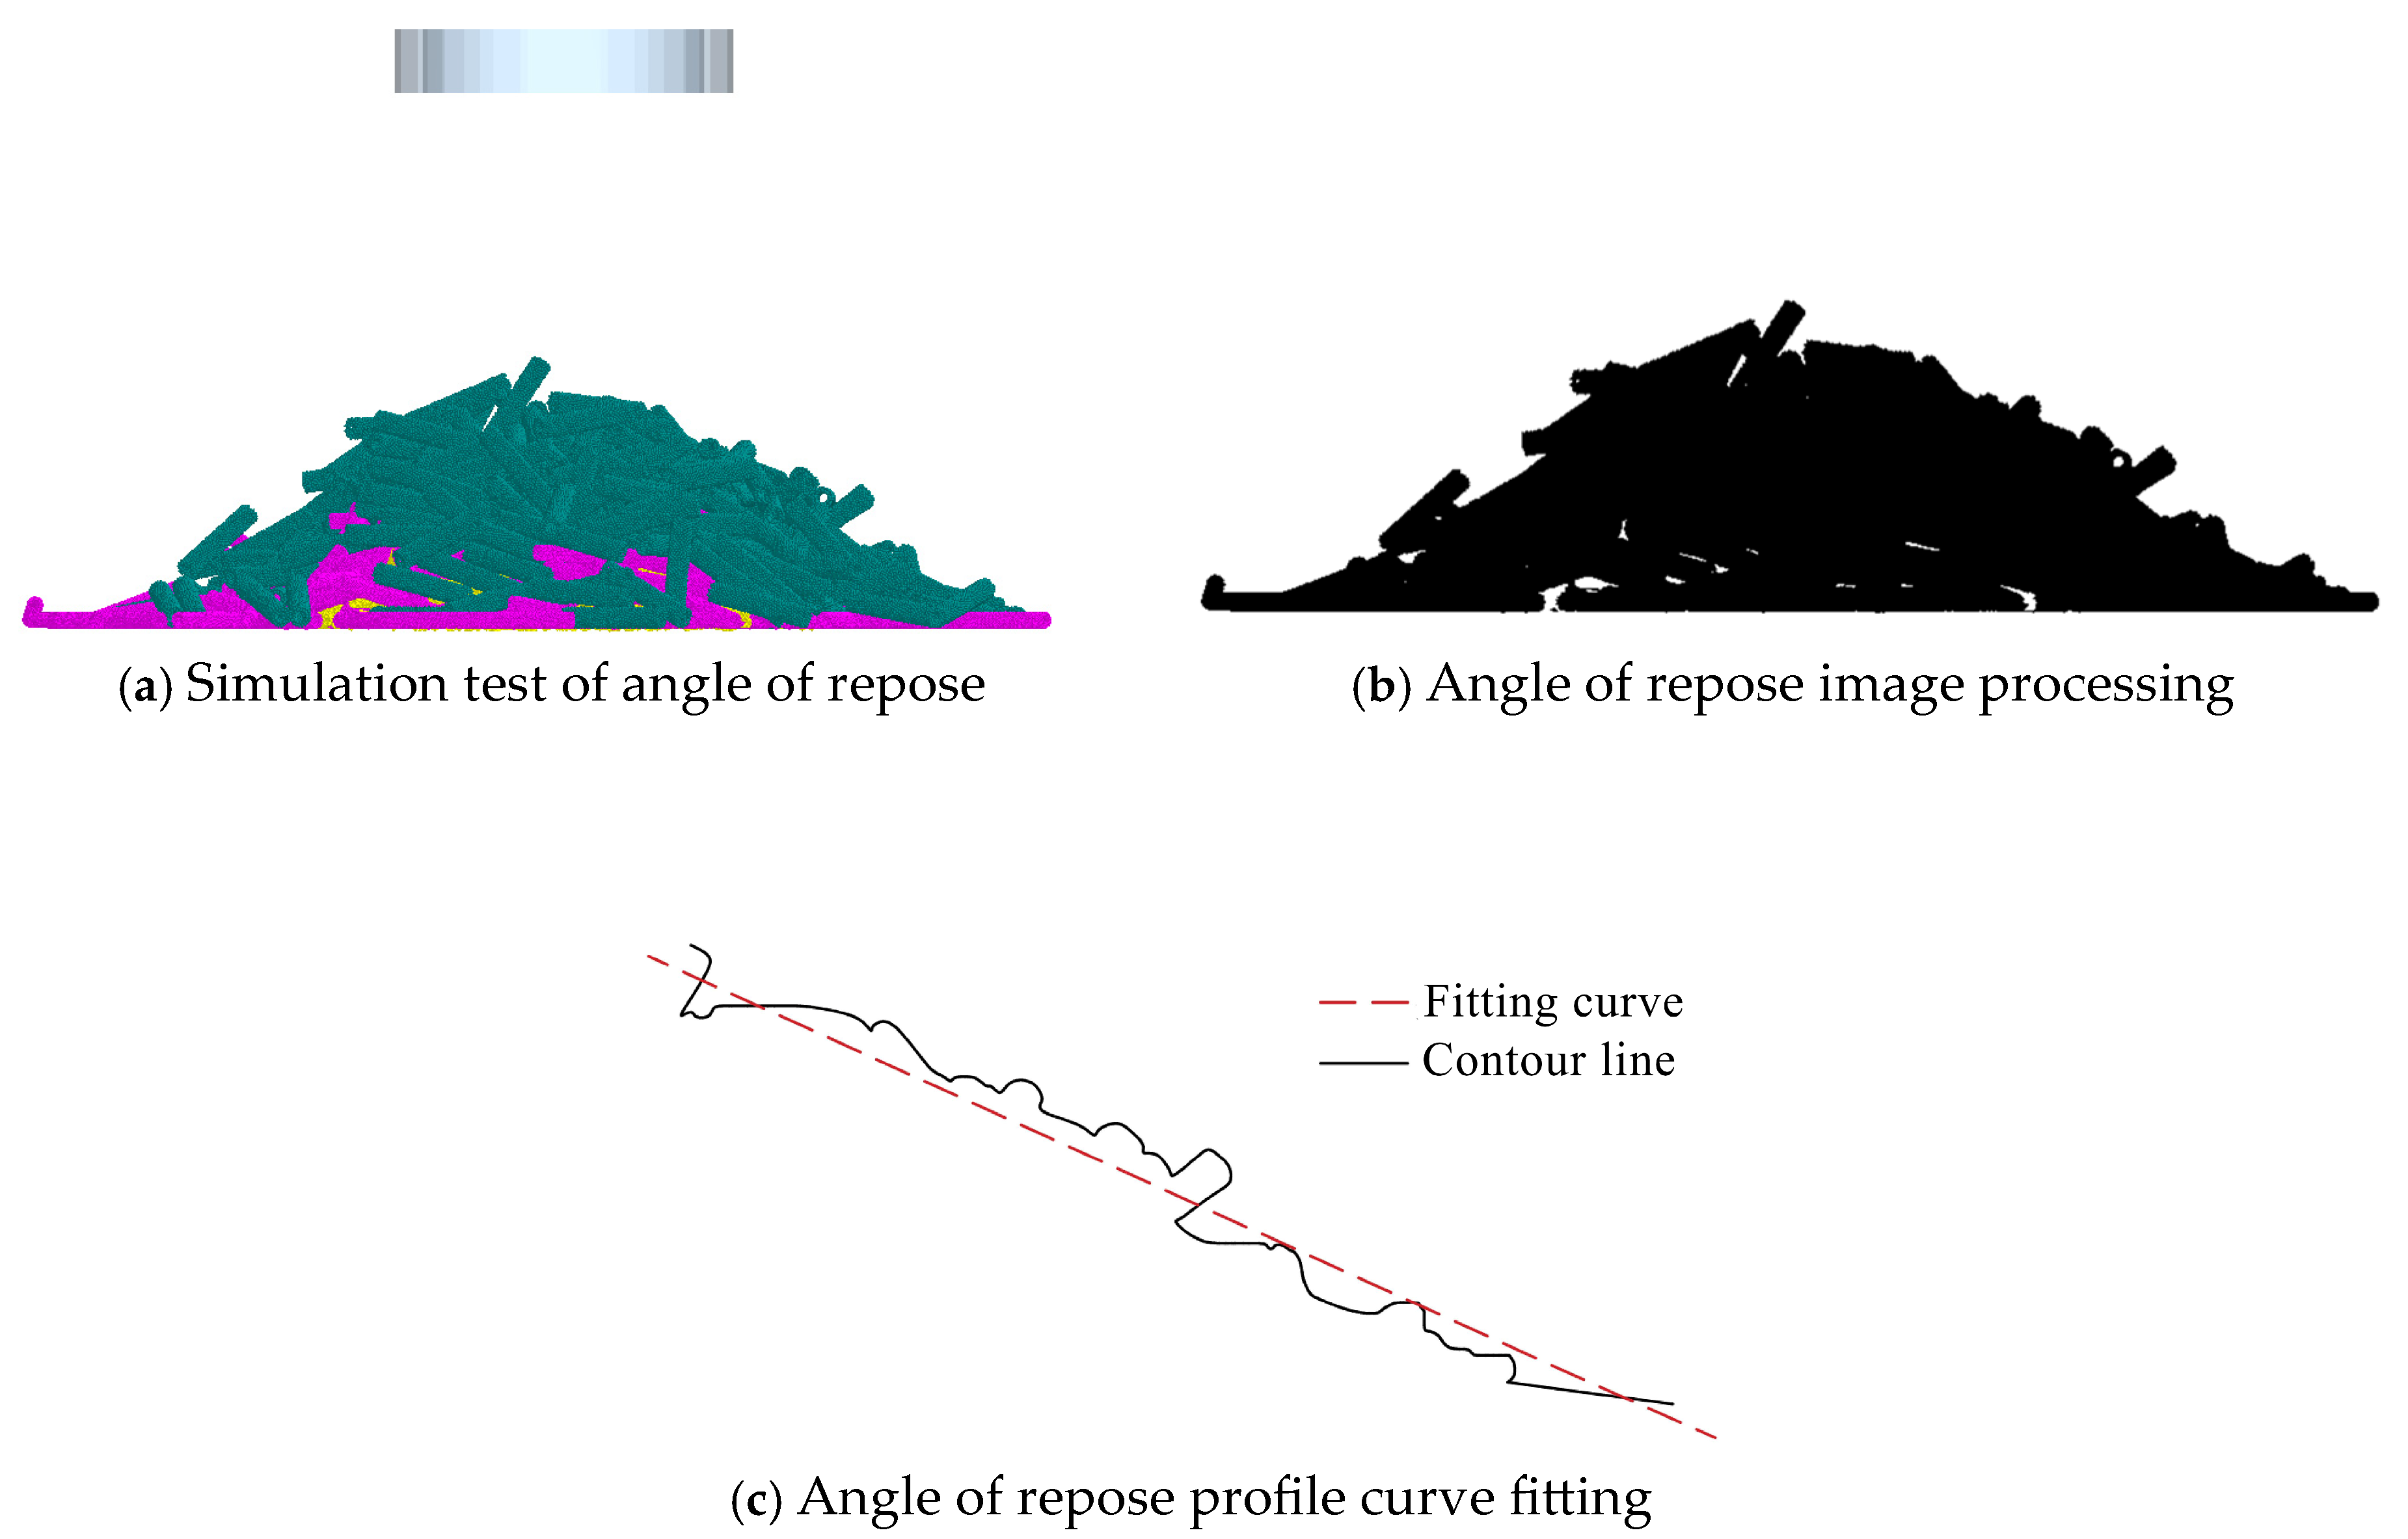
The angle of repose is a macroscopic parameter characterizing the flow and friction properties of granular materials, related to contact parameters and the physical properties of the material itself [25]. A cylinder lift test using rubber cylinders was conducted to verify the reliability of the contact parameters between alfalfa stems and both PU rubber and standard rubber plates.
Bench test method: PU rubber and standard rubber cylinders were placed on a rubber plate. Prepared stem specimens from the top, middle, and root sections were placed inside the rubber cylinders. A universal testing machine slowly lifted the rubber cylinders at a speed of 20 mm/min. As the material flowed, it formed a pile on the rubber plate. Photographs of the pile were captured and processed. The pile contour line was fitted using Origin data processing software. Five test groups were conducted and averaged, yielding average angles of repose of alfalfa stems on the rubber plates of 26.5° and 31.6°, respectively.
Simulation tests were performed in the discrete element software EDEM, with the simulation environment consistent with the above test method. The constructed Hertz-Mindlin with bonding contact model was utilized. The restitution coefficient, static friction coefficient, and rolling friction coefficient between alfalfa stems and PU rubber/standard rubber plates were set according to the calibrated contact parameter results. The test results are shown in Figure 9.
The repose angle was measured using the aforementioned image processing and data fitting method. After five repeated trials, the average repose angles between alfalfa stems and PU rubber/standard rubber plates were 28.5° and 30.9°, respectively. The relative errors compared to actual measured values (29.3° and 29.8°) were below 3%, validating the reliability of the calibrated contact parameters and their capability to simulate real-world conditions. This demonstrates that the established discrete element model and parameter set can accurately replicate the macroscopic flow characteristics of alfalfa stem assemblies. The final calibrated contact parameters with PU rubber are presented in Table 12.
To validate the reliability of the developed flexible DEM model for alfalfa stems in real-world operating scenarios, a numerical simulation method coupling Multi-Body Dynamics (MBD) and the Discrete Element Method (DEM) was employed to construct a “rigid-flexible coupled” model of the mower-conditioner and stem interaction. In this model, the conditioning mechanism is treated as a rigid multi-body system, while the alfalfa stems are simulated using the Hertz-Mindlin with Bonding flexible model to represent the dynamic bending and fracturing behaviors of the stems during the conditioning process. The coupled simulation model is shown in Figure 10.
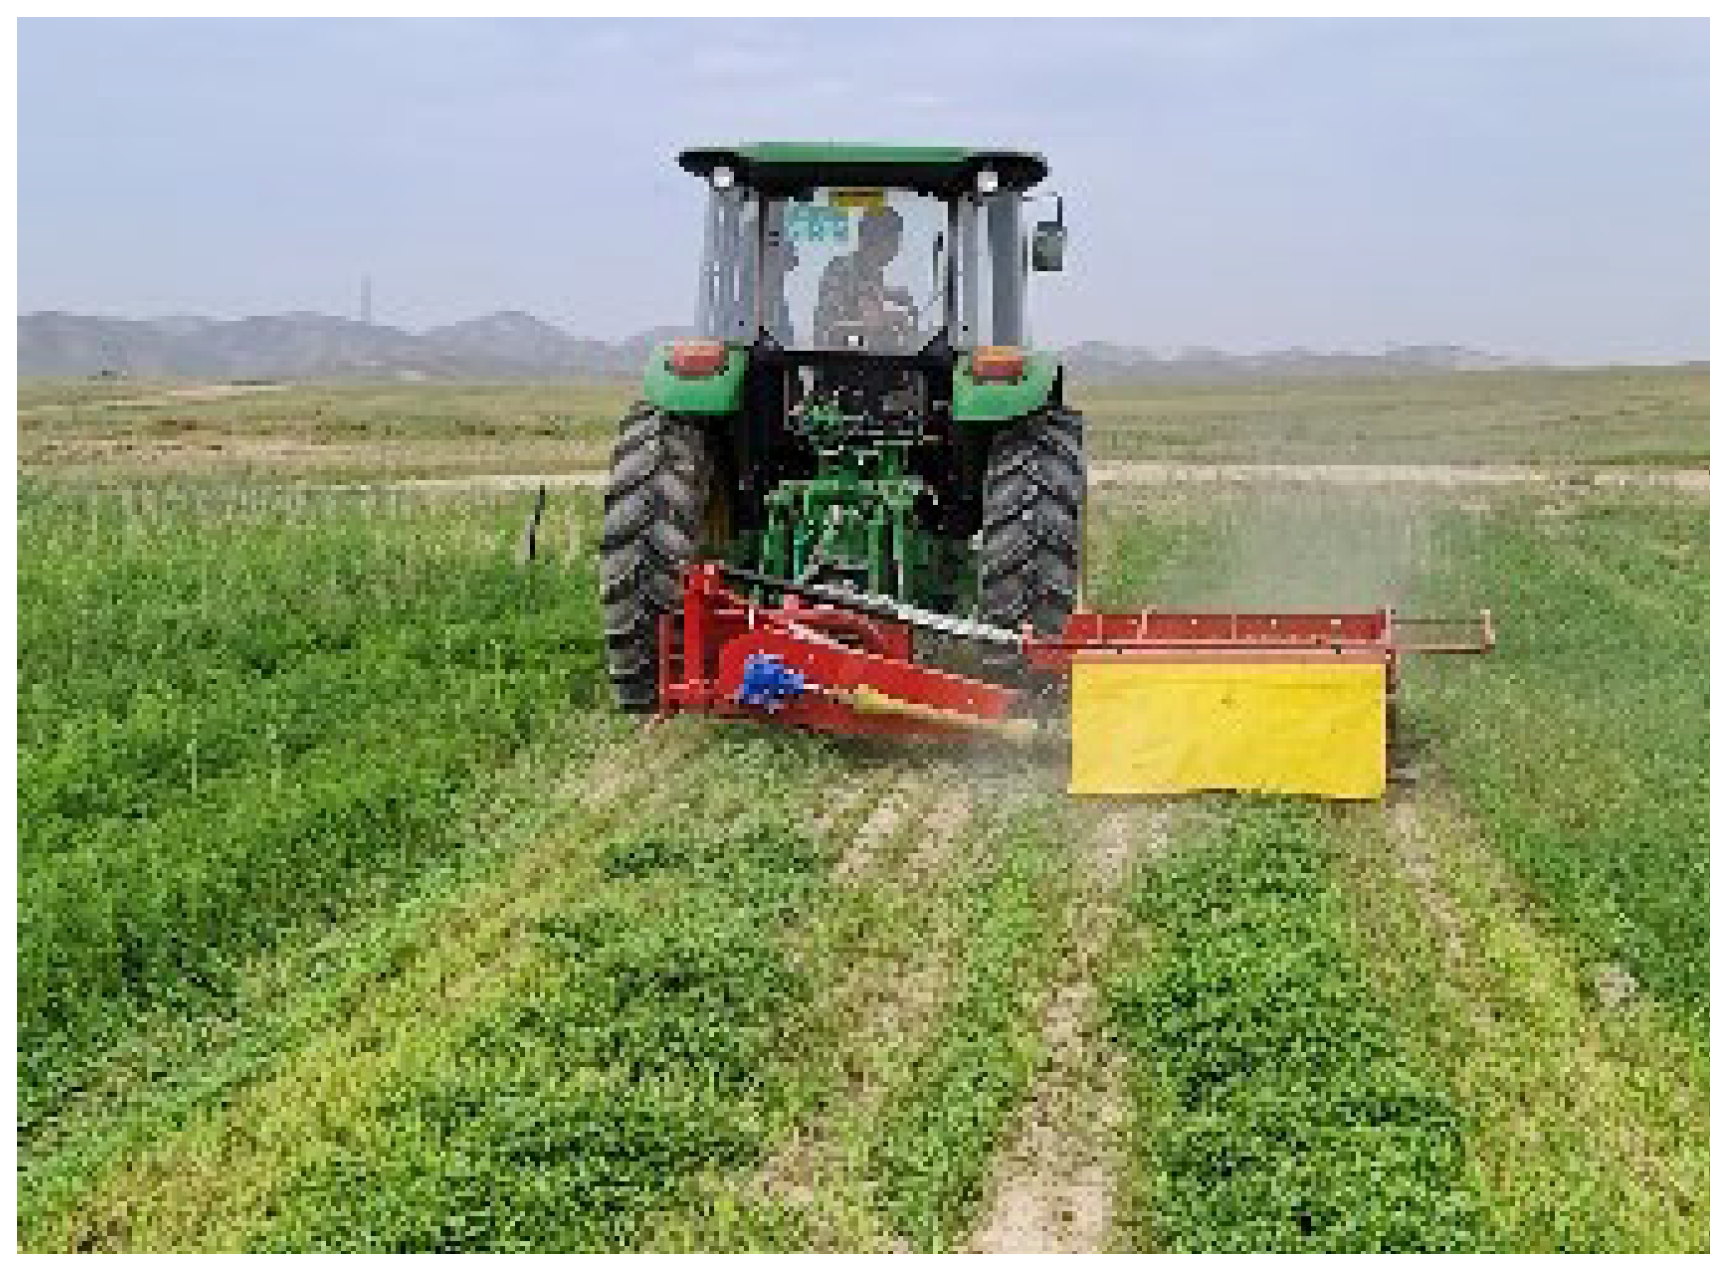
The simulation results indicate that within this rigid-flexible coupled model, the alfalfa stems exhibit dynamic responses—including bending, crushing, and partial fracturing under the action of the conditioning rollers—which are consistent with practical agricultural observations. The simulated conditioning rate was calculated to be 95.81%. To evaluate the consistency between the simulation results and actual operational performance, a field experiment was conducted in Zhangjiagou, Xicha Town, Gaolan County, Lanzhou City, Gansu Province. The key working component of the mower-conditioner, the conditioning roller, was made of PU rubber, consistent with the simulation model settings, to ensure controllability and comparability of the comparison conditions. The test crop was the third harvest of alfalfa at the harvesting stage, with a plant height of 500–700 mm, row spacing of 100 mm from drill seeding, and a moisture content of 78.4%. The field experiment of the mower-conditioner was conducted, as shown in Figure 11.
The conditioning rate was selected as the performance evaluation indicator for the mower-conditioner. During the field test, following the machine’s passage through a 20 m stable section, alfalfa that had been cut and conditioned within a 1 m range in the direction of travel was collected. The mass of the conditioned alfalfa was measured, and the conditioning rate (Y1) was calculated using the following formula:
Y 1 = M 1 M × 100 %
where Y1 is the conditioning rate, %; M1 is the mass of conditioned alfalfa, g/m2; and M is the total mass of actually harvested alfalfa, g/m2.
The test results for the conditioning rate and the shatter rate are presented in Table 13.
The simulation results indicate that within this rigid-flexible coupled model, the alfalfa stems exhibit dynamic responses—including bending, crushing, and partial fracturing under the action of the conditioning rollers—which are consistent with practical agricultural observations. The simulated conditioning rate was calculated to be 95.81%. To evaluate the consistency between the simulation results and actual operational performance, a field experiment was conducted in Zhangjiagou, Xicha Town, Gaolan County, Lanzhou City, Gansu Province. The key working component of the mower-conditioner, the conditioning roller, was made of PU rubber, consistent with the simulation model settings, to ensure controllability and comparability of the comparison conditions. The test crop was the third harvest of alfalfa at the harvesting stage, with a plant height of 500–700 mm, row spacing of 100 mm from drill seeding, and a moisture content of 78.4%.

5. Conclusions

This study performed measurements of the basic characteristic parameters of harvest-stage alfalfa stems and conducted mechanical property testing; this study also performed calibration work on the contact parameters of the discrete element model for harvest-stage alfalfa stems. The main conclusions are as follows:
(1) The moisture content of the top alfalfa stems was 79.6%, the moisture content of the middle section was 78.0%, and the moisture content of the root section was 74.1%. The Poisson ratio of the stems was 0.446 for the top, 0.440 for the middle, and 0.437 for the root, with an average value of 0.441. The elastic modulus of the alfalfa stems was 85.24 MPa for the top, 72.18 MPa for the middle, and 30.13 MPa for the root, with an average value of 62.52 MPa. The shear modulus of the alfalfa stems was 24.96 MPa for the top, 29.60 MPa for the middle, and 10.48 MPa for the root, with an average value of 21.68 MPa.
(2) The restitution coefficients between alfalfa stems and PU rubber were 0.426 for the top, 0.375 for the middle, and 0.386 for the root. The restitution coefficients between alfalfa stems and standard rubber were 0.345 for the top, 0.385 for the middle, and 0.350 for the root. The static friction coefficients between alfalfa stems and PU rubber were 0.417 for the top, 0.284 for the middle, and 0.222 for the root. The static friction coefficients between alfalfa stems and standard rubber were 0.613 for the top, 0.667 for the middle, and 0.422 for the root. The rolling friction coefficients between alfalfa stems and PU rubber were 0.213 for the top, 0.226 for the middle, and 0.292 for the root. The rolling friction coefficients between alfalfa stems and standard rubber were 0.214 for the top, 0.196 for the middle, and 0.147 for the root.
(3) The accuracy of the calibrated parameters was validated through angle of repose tests, which combined physical experiments and simulations. The simulated average angle of repose values were 28.5° and 30.9°, showing a relative error of less than 3% compared to the measured values. Furthermore, the reliability of the developed alfalfa stem discrete element flexible model under real operating conditions was verified using a coupled MBD-DEM simulation to replicate the stem conditioning behavior. The field test yielded an average conditioning rate of 95.71%, which was in close agreement with the simulation result of 95.81%. This study successfully calibrated the key contact parameters between alfalfa stems and PU rubber through an integrated experimental-simulation approach, thereby enhancing the reliability and predictive accuracy of the discrete element model for the mower-conditioning process.

Author Contributions

J.W.: Conceptualization, Methodology, Software, Investigation, Formal Analysis, Writing—Original Draft; B.G.: Data Curation, Writing—Original Draft; Z.Y.: Visualization, Investigation; J.Y.: Resources, Supervision; K.Z.: Software, Validation. Y.M.: Visualization, Writing—Review and Editing. All authors have read and agreed to the published version of the manuscript.

Funding

This study was supported by the Construction Project of the Northwest Forage Comprehensive Mechanization Scientific Research and Experiment Base of the Ministry of Agriculture and Rural Affairs Grant No. 2024-620000-020902 and the Science and Technology Projects of Gansu Province, Grant No. 25CXNA028.

Data Availability Statement

The datasets presented in this article are not readily available because they are currently being used to extend the present findings to additional varieties of alfalfa and different harvest conditions. Access will be provided once this extended analysis is complete. Requests to access the datasets should be directed to the corresponding author.

Conflicts of Interest

The authors declare no confilicts of interest.

References

  1. Yang, Z.; Zhang, K.; Yang, J.; Yao, Y. Parameter optimization and experimental study on alfalfa stem flattening process based on DEM–MBD. Agriculture 2025, 15, 922. [Google Scholar] [CrossRef]
  2. Wang, K.; Nan, L.; Xia, J.; Yao, Y.; Cheng, J.; Chen, J. Transcriptome analysis reveals candidate genes for different root types of alfalfa (Medicago sativa) after water stress induced by PEG-6000. Chem. Biol. Technol. Agric. 2024, 11, 107. [Google Scholar] [CrossRef]
  3. Bacenetti, J.; Lovarelli, D.; Tedesco, D.; Pretolani, R.; Ferrante, V. Environmental impact assessment of alfalfa (Medicago sativa L.) hay production. Sci. Total Environ. 2018, 635, 551–558. [Google Scholar] [CrossRef]
  4. Li, R.; Zeng, X.; Jiang, X.; Long, R.; He, F.; Wang, X.; Chen, L.; Yu, Q.; Kang, J.; Yang, Q.; et al. MsFtsH8 enhances the tolerance of PEG-simulated drought stress by boosting antioxidant capacity in Medicago sativa L. Plants 2024, 13, 3025. Plants 2024, 13, 3025. [Google Scholar] [CrossRef]
  5. Ma, X.; You, Y.; Yang, D.; Wang, D.; Hui, Y.; Li, D.; Wu, H.; Feng, B. Alfalfa stalk crushing simulation test and parameter optimization method. Appl. Sci. 2024, 14, 1323. [Google Scholar] [CrossRef]
  6. Lei, T.; Li, Y.; Ma, Y.; Du, H.; Du, X. Tribological and wear behavior of alfalfa briquettes during densification: Impact of moisture content. Biomass Bioenergy 2025, 196, 107737. [Google Scholar] [CrossRef]
  7. Zhang, X.; Wang, H.; Wang, F.; Lian, Z. Parameter calibration of discrete element model for alfalfa seeds based on EDEM simulation experiments. Int. J. Agric. Biol. Eng. 2024, 17, 33–38. [Google Scholar] [CrossRef]
  8. Ma, Y.; Song, C.; Xuan, C.; Wang, H.; Yang, S.; Wu, P. Parameters calibration of discrete element model for alfalfa straw compression simulation. Trans. CSAE 2020, 36, 22–30. (In Chinese) [Google Scholar]
  9. Wang, H. Analysis of Heat and Stress Transfer of Compression with Assisted Vibration for Alfalfa Straw Based on Discrete Element Method. Ph.D. Thesis, Inner Mongolia Agricultural University, Huhehaote, China, 2021. [Google Scholar]
  10. Zhao, T.; Nepf, H.M. Turbulence Dictates Bedload Transport in Vegetated Channels Without Dependence on Stem Diameter and Arrangement. Geophys. Res. Lett. 2021, 48, e2021GL095316. [Google Scholar] [CrossRef]
  11. Azmi, C.; Saadah, I.R.; Karjadi, A.K.; Soedomo, P.; Rahayu, A.; Waluyo, N.; Hermanto, C. Validation of Grain Moisture Meter for Moisture Content Determination of Tropical Vegetable Seeds. Food Anal. Methods 2025, 18, 508–516. [Google Scholar] [CrossRef]
  12. Lewis, M.A.; Trabelsi, S. Integrating Microwave Sensors Within a Distributed Network to Monitor Peanut Drying Parameters in Real-Time. Appl. Eng. Agric. 2025, 41, 249–256. [Google Scholar]
  13. Chen, T.; Yi, S.; Li, Y.; Tao, G.; Mao, X. Calibration and test of contact parameters for alfalfa stalk at primary florescence based on discrete element method. PLoS ONE 2024, 19, e0303064. [Google Scholar] [CrossRef] [PubMed]
  14. Ahmad, F.; Qiu, B.; Ding, Q.; Ding, W.; Khan, Z.; Shoaib, M.; Khaliq, A. Discrete element method simulation of disc type furrow openers in paddy soil. Int. J. Agric. Biol. Eng. 2020, 13, 103–110. [Google Scholar] [CrossRef]
  15. Liu, W.; Su, Q.; Fang, M.; Zhang, J.; Zhang, W.; Yu, Z. Parameters calibration of discrete element model for corn straw cutting based on hertz-mindlin with bonding. Appl. Sci. 2023, 13, 1156. [Google Scholar] [CrossRef]
  16. Chai, Y.; Wang, R.; Zhang, B.; Tang, Y.; Li, C.; Guo, B.; Li, M. The importance of molecular structure for textural and physicochemical properties of extruded wheat flour. Foods 2025, 14, 1829. [Google Scholar] [CrossRef]
  17. Martin, S.; Cooper, M.A. The role of randomly packed particles on macroscopic elastic bonded grain properties. Comput. Part. Mech. 2024, 11, 1463–1485. [Google Scholar] [CrossRef]
  18. Zhou, H.; Dai, F.; Shi, R.; Zhao, C.; Deng, H.; Pan, H.; Zhao, Q. Simulation and optimization of a pendulum-lever-type hole-seeding device. Agriculture 2024, 14, 750. [Google Scholar] [CrossRef]
  19. Deng, H.; Dai, F.; Shi, R.; Song, X.; Zhao, W.; Pan, H. Simulation of full-film double-row furrow roller hole fertiliser application based on DEM-MBD coupling and research on its water and fertiliser transport law. Biosyst. Eng. 2024, 239, 190–206. [Google Scholar] [CrossRef]
  20. Wang, J.; Xu, Y.; Wang, C.; Xiang, Y.; Tang, H. Design and simulation of a trenching device for rice straw burial and trenching based on MBD-DEM. Comput. Electron. Agric. 2023, 207, 107722. [Google Scholar] [CrossRef]
  21. Chen, T.; Yi, S.; Li, Y.; Tao, G.; Qu, S.; Li, R. Establishment of discrete element model and parameter calibration of alfalfa stem in budding stage. Trans. Chin. Soc. Agric. Mach. 2023, 54, 91–100. [Google Scholar]
  22. Liang, W.Q.; Meng, W.J.; Zhang, B.; Zhang, H.Z.; Jin, Y.F.; Zhang, J. Calibration method and experimental verification of corn discrete element parameters. Meas. Sci. Technol. 2025, 36, 055003. [Google Scholar] [CrossRef]
  23. Xiang, G.J.; Bacharoudis, K.C.; Vassilopoulos, A.P. Probabilistic fatigue model for composites based on the statistical characteristics of the cycles to failure. Int. J. Fatigue 2022, 163, 107085. [Google Scholar] [CrossRef]
  24. Wei, S.Y.; Wei, H.; Saxen, H.; Yu, Y.W. Numerical Analysis of the Relationship between Friction Coefficient and Repose Angle of Blast Furnace Raw Materials by Discrete Element Method. Materials 2022, 15, 903. [Google Scholar] [CrossRef] [PubMed]
  25. Liu, M.; Wang, J.; You, Z.; Wu, Y.; Wang, N.; Xie, H. Experimental calibration of parameters of discrete element model for ginkgo nut. BioResources 2024, 19, 8154–8172. [Google Scholar] [CrossRef]
Figure 1. Overall research approach.
Agronomy 15 02390 g001
Figure 2. Harvest-stage alfalfa.
Agronomy 15 02390 g002
Figure 3. Restitution coefficient tests for alfalfa stems.
Agronomy 15 02390 g003
Figure 5. Static friction coefficient calibration tests.
Agronomy 15 02390 g005
Figure 6. Simulation test static friction coefficient and tilt angle fitting curve.
Agronomy 15 02390 g006
Figure 7. Rolling friction calibration tests.
Agronomy 15 02390 g007
Figure 8. Simulation test rolling friction coefficient and tilt angle fitting curve.
Agronomy 15 02390 g008
Figure 9. Angle of repose measurement process for alfalfa stems.
Agronomy 15 02390 g009
Figure 10. Coupling simulation model.
Agronomy 15 02390 g010
Figure 11. Field trial of grass cutting and flattening machine.
Agronomy 15 02390 g011
Table 1. Alfalfa stem geometry.
Project TitleMaximum Value/mmMinimum Value/mmMean Value/mmStandard Deviation/mmContent/%
stem Height655.3443.2560.720.15
Top sectionDiameter211.821.2360
Wall Thickness0.70.40.550.25
Middle sectionDiameter322.850.1129
Wall Thickness1.10.91.011.06
Root sectionDiameter433.770.1611
Wall Thickness1.51.11.351.33
Number of branches4130.06
Table 2. Moisture content and density measurements of alfalfa at harvest.
PartRoot SectionMiddle SectionTop Section
Moisture content (%)74.1 ± 1.578.0 ± 1.879.6 ± 2.1
Density (kg/m3)932 ± 26950 ± 221021 ± 32
Table 3. Intergranular bonding parameters of alfalfa grains at harvest.
ParametersRoot SectionMiddle SectionTop Section
Normal stiffness Kn (N/m3)(3.35 ± 0.14) × 109(3.42 ± 0.16) × 109(3.50 ± 0.21) × 109
Tangential stiffness Ks (N/m3)(1.68 ± 0.07) × 108(1.71 ± 0.08) × 108(1.75 ± 0.09) × 108
Normal critical stress σ (MPa)2.11 ± 0.153.42 ± 0.1110.13 ± 0.55
Tangential critical stress γ (MPa)7.26 ± 0.258.05 ± 0.4212.08 ± 0.64
Bond radius Rj (mm)0.10.10.1
Table 4. Discrete element flexible model of harvest-stage alfalfa.
PartsRootMiddleTopBonding Model
Front viewAgronomy 15 02390 i001Agronomy 15 02390 i002Agronomy 15 02390 i003Agronomy 15 02390 i004
Top viewAgronomy 15 02390 i005Agronomy 15 02390 i006Agronomy 15 02390 i007Agronomy 15 02390 i008
Table 5. Simulation test parameters.
ParameterValue
Alfalfa stem Poisson’s ratio0.446/0.440/0.437
Alfalfa stem shear modulus/Pa2.50/2.96/1.05 × 107
Alfalfa stem density/(kg·m−3)1021/950/932
PU rubber Poisson’s ratio0.4
PU rubber density/(kg·m−3)1200
Ordinary rubber Poisson’s ratio0.48
Ordinary rubber shear modulus/Pa1 × 109
Ordinary rubber density/(kg·m−3)1380
Table 6. Simulation design and results: Restitution coefficient (PU rubber).
Serial Numberx1P Collision Recovery Coefficienty1P Horizontal Distance (mm)
10.325/0.3/0.36132.84/122.95/149.32
20.35/0.325/0.37141.65/131.72/151.86
30.375/0.35/0.38152.33/141.6/157.53
40.4/0.375/0.39161.96/153.46/161.72
50.425/0.4/0.4172.31/163.51/164.94
60.45/0.425/0.41185.48/177.23/168.98
70.475/0.45/0.42193.53/182.13/172.12
Table 7. Simulation design and results: Restitution coefficient (Standard rubber).
Serial Numberx1R Collision Recovery Coefficienty1R Horizontal Distance (mm)
10.287/0.315/0.312115.66/128.54/122.63
20.309/0.335/0.326121.75/131.48/131.25
30.331/0.355/0.34125.69/139.82/137.46
40.353/0.375/0.354135.37/143.65/139.47
50.375/0.395/0.368144.43/150.24/145.85
60.397/0.415/0.382151.58/156.98/147.91
70.419/0.435/0.396159.18/163.86/153.29
Table 8. Simulation design and results: Static friction coefficient (PU rubber).
Serial Numberx2P Static Friction Coefficienty2P Inclination Angle (°)
10.4/0.26/0.17822.4675/15.4214/10.4902
20.413/0.275/0.19723.7495/16.0299/11.9483
30.426/0.29/0.21624.6108/16.6302/13.4258
40.439/0.305/0.23525.0766/17.1349/14.1232
50.452/0.32/0.25425.571/18.9318/15.1612
60.465/0.335/0.27325.9108/19.7476/16.6553
70.478/0.35/0.29226.417/20.567/17.676
Table 9. Simulation design and results: Static friction coefficient (Standard rubber).
Serial Numberx2R Static Friction Coefficienty2R Inclination Angle (°)
10.55/0.52/0.54529.5854/28.585/29.8642
20.578/0.574/0.58530.9909/30.2867/31.7722
30.606/0.628/0.62532.277/33.3211/33.6303
40.634/0.682/0.66533.1536/35.1582/35.3133
50.662/0.736/0.70534.6932/37.007/37.0469
60.69/0.79/0.74535.8511/38.4113/38.5769
70.718/0.844/0.78536.8581/41.1042/39.5501
Table 10. Simulation design and results: Rolling friction coefficient (PU rubber).
Serial Numberx3P Coefficient of Rolling Frictiony3P Inclination Angle (°)
10.17/0.2/0.269.59741/12.1394/14.3148
20.181/0.215/0.27410.1312/12.5764/15.3119
30.192/0.23/0.28811.2151/12.9196/16.336
40.203/0.245/0.30212.1544/13.4132/17.3693
50.214/0.26/0.31613.3258/14.3485/18.0595
60.225/0.275/0.3314.0987/14.8291/19.4942
70.236/0.29/0.34415.3415/15.512/20.1265
Table 11. Simulation design and results: Rolling friction coefficient (Standard rubber).
Serial Numberx3R Coefficient of Rolling Frictiony3R Inclination Angle (°)
10.19/0.15/0.1211.1456/8.6532/6.8952
20.196/0.167/0.1311.4854/9.7241/7.5498
30.202/0.184/0.1411.5248/10.3858/8.2458
40.208/0.201/0.1511.7458/11.3694/8.9487
50.214/0.218/0.1612.1584/12.1565/9.4471
60.22/0.235/0.1712.3759/12.7935/10.3154
70.226/0.252/0.1812.7854/13.4974/11.6458
Table 12. The contact parameters between harvest-stage alfalfa stems and PU rubber.
PartCollision Recovery Coefficient Static Friction CoefficientRolling Friction Coefficient
Top Section0.426 ± 0.0120.417 ± 0.0210.213 ± 0.014
Middle Section0.375 ± 0.0140.284 ± 0.0190.226 ± 0.011
Root Section0.386 ± 0.0170.222 ± 0.0190.292 ± 0.018
Table 13. Flattening rate and loss rate of alfalfa stalks.
No.Forward Speed (m/s)Flattening Ratio (%)
11.495.23%
295.31%
395.15%
42.895.86%
595.95%
695.77%
73.296.11%
896.08%
995.93%
Disclaimer/Publisher’s Note: The statements, opinions and data contained in all publications are solely those of the individual author(s) and contributor(s) and not of MDPI and/or the editor(s). MDPI and/or the editor(s) disclaim responsibility for any injury to people or property resulting from any ideas, methods, instructions or products referred to in the content.